Embed Size (px)
Citation preview
1
Hedonic Prices for College Tuition: Best Value Colleges in the U.S.
Kazuhisa Matsuda
Dickie College of Business Administration
Ohio Northern University 525 South Main Street, Ada, OH 45810
Telephone: (419) 772-3929 Fax: (419) 772-3125
Email: [email protected] Web : http://www.maxmatsuda.com/
August 2007
© 2007 Kazuhisa Matsuda All rights reserved.
2
Hedonic Prices for College Tuition: Best Value Colleges in the U.S.
ABSTRACT This article presents a comprehensive study of the determinants of college tuition of Carnegie-classified undergraduate degree-granting institutions in the United States. We decompose the published college tuition and fees into implicit prices of various college qualities due to institutional and enrollment characteristics by estimating hedonic price functions. A list of most-underpriced (best-valued) colleges is provided after computing quality-adjusted tuitions. Keywords: College tuition, hedonic price model.

3
I. Introduction Hedonic price method originally developed by Waugh (1928) decomposes the
market price of a commodity into the numerous implicit prices for various characteristics
of a commodity. Rosen (1974) shows that there are two sources of the estimated implicit
prices. One is the consumers’ valuation for the characteristics of a product in the market
and the other is the cost of producing that particular character. There are numerous
applications of hedonic price analysis. Schamel and Anderson (2003) apply hedonic price
method for premium wine from Australia and New Zealand and find the importance of
the regional reputations after controlling for wine varieties. McConnell and Strand (2000)
estimate hedonic price functions for tuna prices in Hawaii and provide implicit prices of
the type, size, fat content, handling method, and condition of the market of tuna.
The United States has by far the largest college industry in the world and often the
variable of our interest is the tuition. This paper applies hedonic method to estimate the
implicit component prices of the college characteristics and tries to shed some light on
the current pricing system of the colleges in the U.S. Schwartz and Scafidi (2001) use
hedonic method to annual tuition plus fees adjusted for financial aid for 4-year colleges
employing 5-year panel data starting 1990 from the College Board’s Annual Survey of
Colleges (ASC) and Integrated Postsecondary Education Data System (IPEDS) by the
National Center for Education Statistics in order to better estimate a Consumer Price
Index. Dimkpah, Eseonu, and Akpom (2004) uses hedonic price theory to annual tuition
plus fees employing cross sectional data of private four-year institutions for the 1999-
2000 academic year from Barron’s Profiles of American Colleges and Peterson’s Guide
to Four-Year Colleges to estimate the implicit prices of college characteristics. Our study

4
is designed for calculating the implicit prices of college characteristics and is more
comprehensive than previous researches. Our research deals with not only public and
private nonprofit institutions, but also the growing private for profit sector for both two-
year and four-year institutions employing 3-year panel data starting 2003 from the IPEDS.
We also control for more variables in the hedonic equation.
The next section presents hedonic price model and section III describes our data set.
Section IV shows the results and section V gives the concluding remarks.
II. Hedonic Price Model
Let itP be the published in-state tuition and fees of the college i at time t and let itY
be a vector of k quality characteristics of a college i at time t which determine the tuition
and fees:
( )1 2, ,...,it i t i t iktY y y y= (1).
Note that many of the college characteristics we employ are time-invariant such as the
geographic location and religious affiliation of the college, but some are time-varying
such as the college’s acceptance ratio of the applicants and the percentage of minority
students enrolled. We assume that the tuition and fees depends on the various quality
characteristics of the college, then:
( )it itP P Y= (2).
Taking the partial derivative of the price function with respect to the college
characteristic j yields the implicit marginal price of the component j:
( )i ij i ijP Y P Y Y∂ ∂ = ∂ ∂ (3).

5
We choose to employ linear hedonic price function because of the intuitiveness of the
interpretation of the estimation result.1 Thus, our hedonic price function can be expressed
as:
0it it itP Yβ β ε= + + (4),
where β is the vector of k implicit prices to be estimated and itε is a disturbance term:
( )1 2, ,....., kβ β β β= (5).
Unlike Schwartz and Scafidi (2001) we do not include a college fixed effect term
in the hedonic price function of the equation (4). This is because we employ significantly
more time-invariant characteristics variables itY , thus the college “brand” effect will be
picked up by one of our quality variables.2 Another point is that Schwartz and Scafidi
adjust the published tuition and fees by the grants that a student receive at the institution
to better reflect the true price that a student pays for. This is relevant for their purpose of
constructing more accurate Consumer Price Index.3 But since our goal is to compute
implicit market prices for various college characteristics and not to compute implicit
characteristic prices a consumer (i.e. student) pays, it is relevant to use the published
tuition and fees.
III. Data
The data on college tuitions and college characteristics are collected from the
Integrated Postsecondary Education Data System (IPEDS) by the National Center for
Education Statistics for the academic year 2003-2004, 2004-2005, and 2005-2006.
Various filters have been applied to the original data in order to construct a balanced 1 Using log-linear model does not yield any significant difference in the estimation results. 2 Use of fixed effect regression model with many time-invariant dichotomous regressors will often result in severe multicollinearity problems. 3 CPI used the unadjusted published tuition and fees at the time.

6
panel. Following Winston (1999), our sample consists of Carnegie-classified
undergraduate degree offering institutions located in the 50 U.S. sates or Washington D.C.
excluding special focus institutions. Our sample includes 2-year and 4-year colleges with
public, private nonprofit, and private for profit control. Our dependent variable is the
published in-state tuition and fees for full-time, first-time undergraduate students for the
full academic year according to IPEDS. We adjust these prices for the inflation and the
inflation adjusted tuition and fees are measured in June 2007 price level. Detailed
definitions of the college characteristics variables used are provided by Table 1. After
eliminating colleges with missing observations, our sample results in a panel of the total
observation of 3,927. In other words, we use data on 1,324 colleges for three-year period.
Table 2 gives the descriptive statistics for the whole sample. The mean tuition and
fees are $14,895 in June 2007 prices. In terms of the type of control, the sample consists
of 36% of public institutions, 59% of private nonprofit institutions, and 5% of private
forprofit institutions. On geographic location, 26% of the sample is in the South East
Region, 21% in the Mid East, and 9% in the New England region. Historically black
colleges and universities account for 3.8% of the sample and 39% of the institutions have
religious affiliation. Most colleges offer student services such as counseling activities,
on-campus part-time employment opportunities, placement services for completers and
own their libraries while less than one third of the sample offer weekend college and on-
campus day care service for students’ children. 84% of the sample follows semester
calendar system, 7% follows quarter system, and 7.5% follows four-one-four plan
calendar system. Full-time and first-time students are required to live on campus at 35%
of the sample colleges. In terms of the racial composition at the sample institutions, 69%

7
are white, 12% are black, 5% are Hispanic, and 3.5% are Asian. 58.5% of the enrollment
are females and international students account for 3.2%. Average acceptance rate and
graduation rate are 70% and 53%, respectively. There are three men’s colleges and six
women’s colleges in our sample.
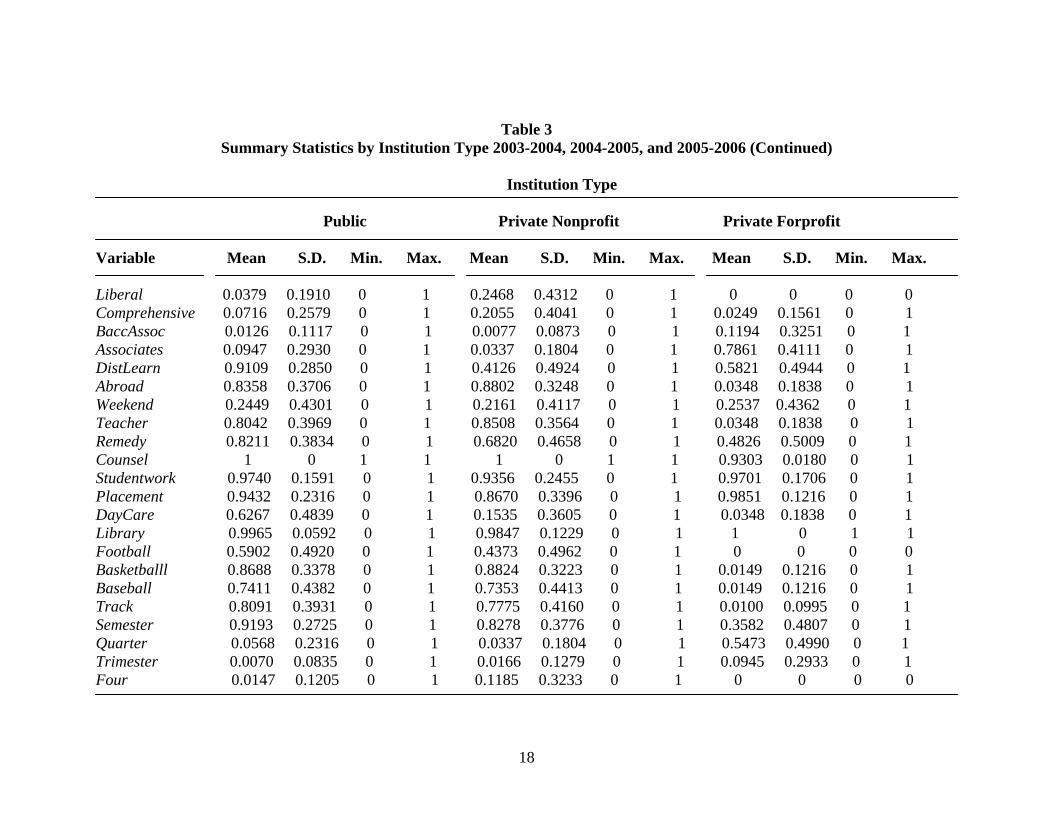
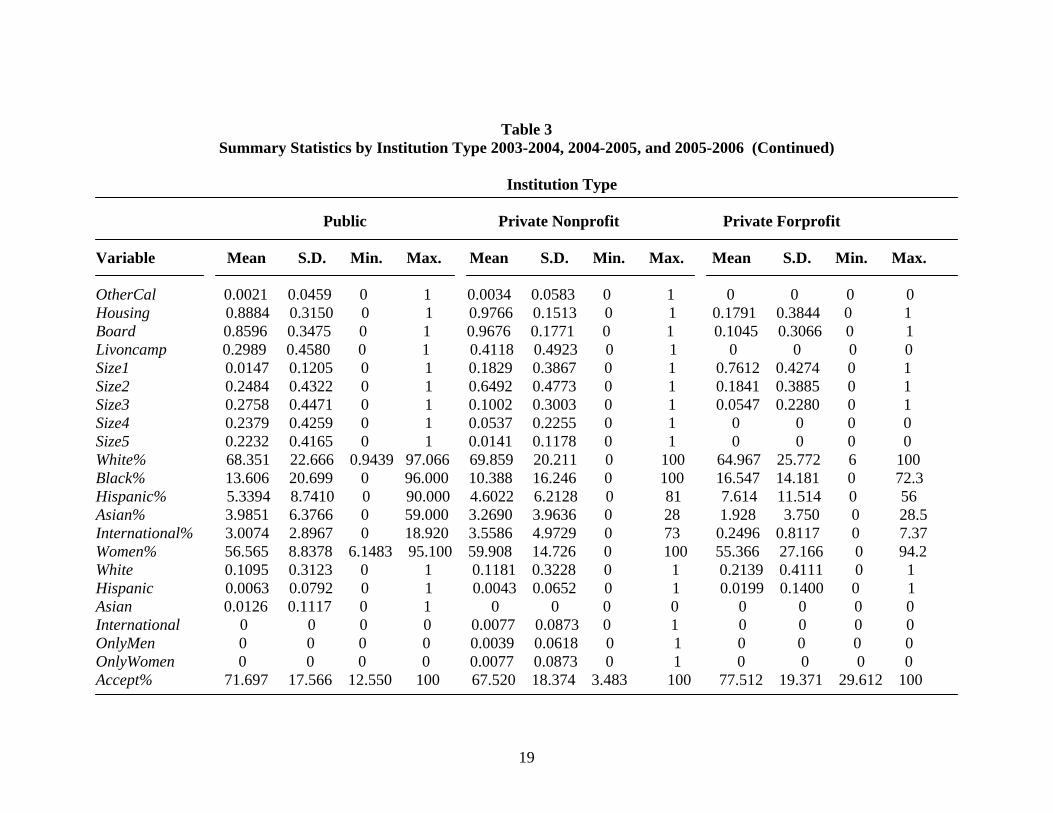
Table 3 provides the summary statistics for three different control types. Public
institutions charge the lowest tuition of $5,211 and private nonprofit institutions charge
$20,980 while private forprofit institutions charge $12,529 but this is because 79% of
private forprofit institutions are 2-year colleges and 46% of which are located in the mid
East which comes as no surprise. We notice 66% of the private nonprofit institutions
have religious affiliation while public and private forprofit institutions have no religious
affiliation. 78.3% of public institutions are research, doctoral/research, or masters
colleges and universities while 45% of private nonprofit institutions are liberal and
comprehensive colleges according to the Carnegie classification. We observe public
institutions are most advanced in offering distance learning opportunities. Since more
than three fourth of the private forprofit institutions are 2-year colleges in the
metropolitan area which target students with careers, 64% offers quarter or trimester
calendar system. It can be seen that 46% of public institutions are large with over 10,000
students while 83% of private nonprofit institutions are small with less than 5,000
students. Notice that racial and gender composition are very similar regardless of the
control type, but the percent of total enrollment that are black and Hispanic are slightly
higher at private forprofit institutions.
IV. Results

8
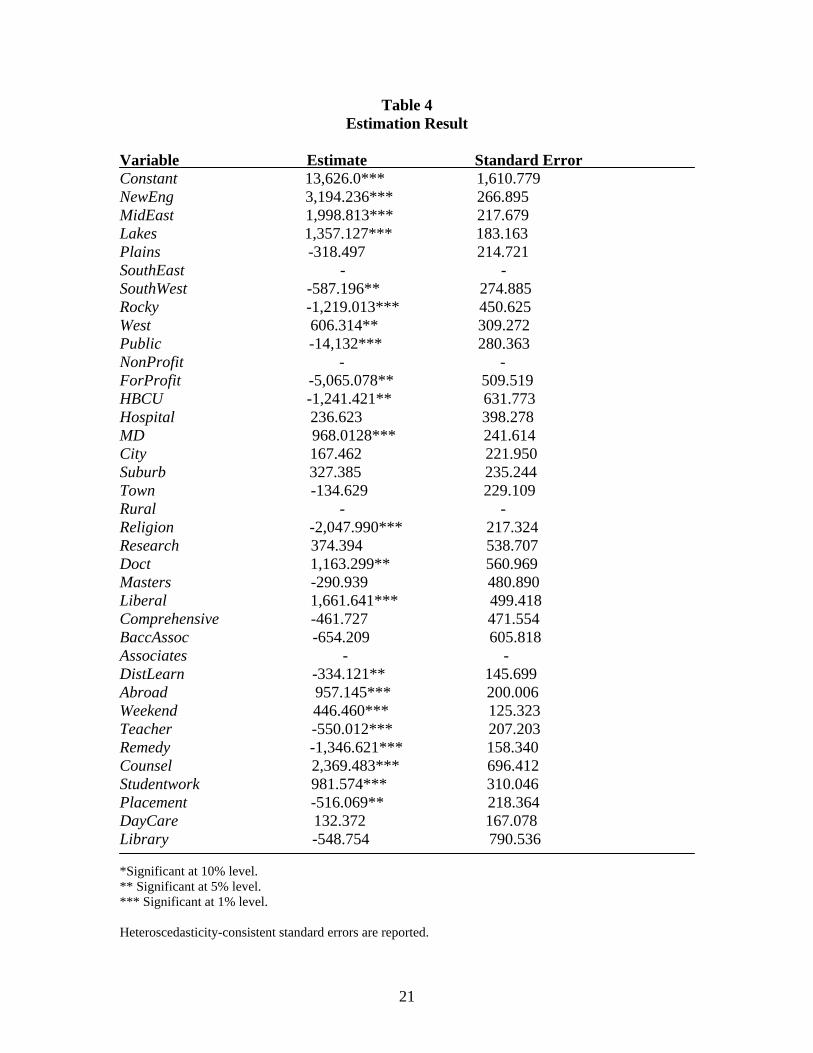
Table 4 reports the estimated implicit characteristic prices from the linear hedonic
price model of the equation (4). According to the adjusted R2, This model explains 86%
of the variations in the published tuition and fees and estimated coefficients are jointly
significantly different from zero. Note that we adjust the tuition and fees for the inflation
and all coefficients are measured in June 2007 dollars. We report heteroscedasticity-
consistent standard errors.
All but one geographic location coefficients are significant at above 5% level. The
implicit price for an institution in New England is $3,194 while using institutions in
South East as the base. Mid East, Lakes, and West institutions have location premiums
worth $1,999, $1,357, and $606, while colleges in South West and Rocky maintain
negative premiums of -$587 and -$1,219. Compared to private nonprofit institutions,
public institutions charge $14,132 less and private forprofit institutions charge $5,065
less which are both significant at 5% level. It is interesting that having a hospital does not
yield significant premium but granting a medical degree results in a premium of $968.
Also notice that the college’s degree of urbanization plays no role in the tuition and fees
and religious affiliation is correlated with $2,047 less tuition and fees. Liberal arts
colleges which are mostly private nonprofit institutions and doctoral/research universities
are valued significantly higher ($1,661 and $1,163, respectively) than 2-year colleges.
While all four program coefficients are significant at or above 5% level, distance learning
program and teacher certification program are associated with less tuition but study
abroad program and weekend college program are associated with higher tuition. Among
the implicit prices for student service variables, counseling activities and on-campus part-
time employment services are highly valued with $2,369 and $982. Being a

9
NCAA/NAIA member for football yields a positive premium of $823. Institutions with
trimester calendar system (most of which are private forprofit institutions) is valued
$1,293 less than those with semester system. Market expects tuition and fees to be $2,018
less if the college provides on-campus housing. Institutions with board or meal plan and
institutions which require full-time, first-time students to live on-campus are valued
highly at $2,639 and $956, respectively. Since most large-sized institutions with equal to
or greater than 20,000 total students are publicly controlled, their tuition and fees are
significantly lower. We observe that race plays a role in tuition and fees. First,
historically black colleges and universities charge $1,241 less. Second, 1% increase in
total enrollment that are black is associated with $60 less tuition, 1% increase in total
enrollment that are Hispanic is associated with $48 less tuition, 1% increase in total
enrollment that are white is associated with $44 less tuition, and 1% increase in total
enrollment that are Asian (which is the smallest racial group here) is associated with $147
more tuition. This can be interpreted that market values the racial diversity at college
which can be confirmed by the fact that the predominantly Caucasian institution has a
negative premium of $917. Institutions with relatively high Hispanic population and
Asian population are associated with negative premiums of $559 and $8,700 which can
be interpreted that Asian students are very price-conscious. Single gender colleges have
negative implicit prices but they are not statistically significant. It is observed that
acceptance rate (being a highly selective college or a non-selective college) of the
institutions produce no premium at all. But the graduation rate of the institution is highly
valued with the 1% increase in the graduation rate priced at $86.
10
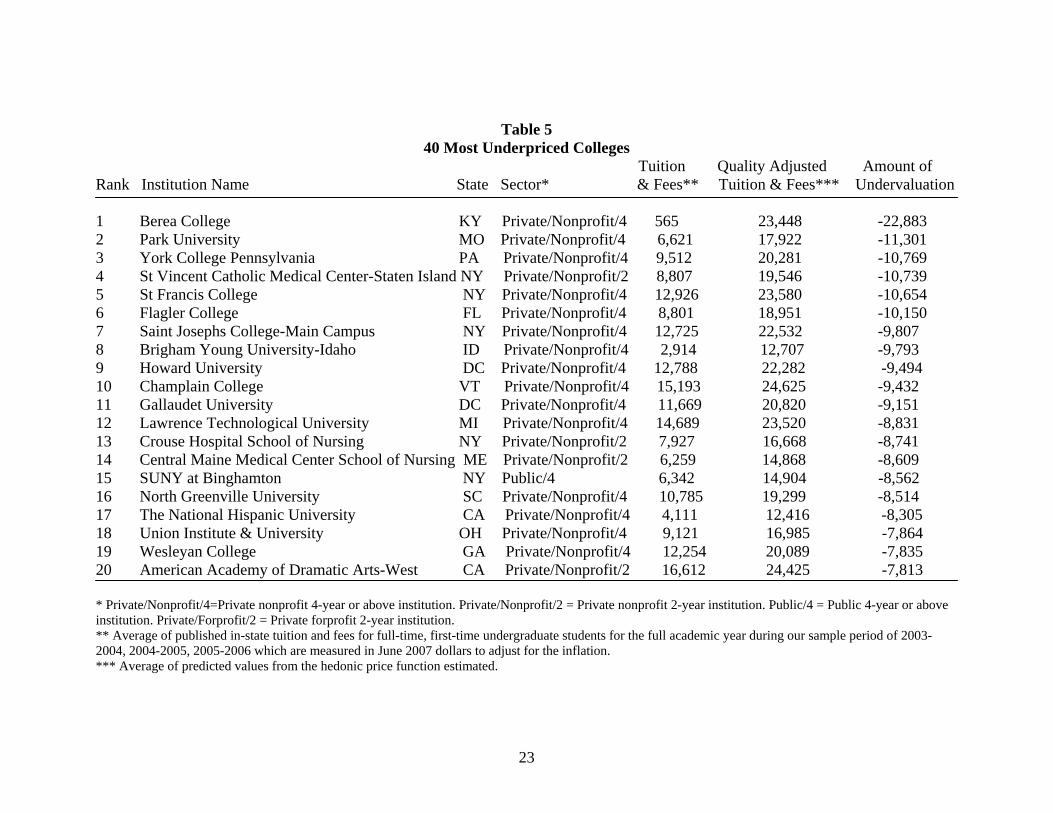
After estimating the hedonic price equation, predicted values and the residuals for
each institution and each year are obtained resulting in the average quality adjusted
tuition and fees and average amount of undervaluation. Table 5 reports the 40 most
underpriced institutions.4
V. Conclusion
This paper has employed hedonic price method to estimate implicit prices for
college characteristics. A linear hedonic price equation is used to estimate implicit prices
for college characteristics using the Integrated Postsecondary Education Data System
(IPEDS) by the National Center for Education Statistics for the academic year 2003-2004,
2004-2005, and 2005-2006.
The results show that market attaches a distinct implicit valuation to the various
college characteristics. The estimated hedonic price equation is used to obtain quality
adjusted tuition and fees for the sample institutions and the top 40 most underpriced
colleges are listed. These results provide more useful information for both college
administrators and students in making decisions regarding how to set the tuition and
which college to choose.
References College Board. (2006) Trends in College Pricing. Trends in Higher Education Series. Dimkpah, Y. O., Eseonu, M. O., and Akpom, U. N. (2004) “The Impact of College Quality on Tuition: A Hedonic Analysis.” Journal for Economic Educators, Volume 4, Number 2, Winter. McConnell, K. E., and Strand, I. E. (2000) “ Hedonic Prices for Fish: Tuna Prices in Hawaii.” American Journal of Agricultural Economics, 82, February, 133-144. Rosen, S. (1974) “Hedonic Prices and Implicit Markets: Product Differentiation in Pure Competition.” Journal of Political Economy, 82, 34-55. 4 The list of 40 most overpriced institutions are available by the request to the author.
11
Schamel G., and Anderson, K. (2003) “Wine Quality and Varietal, Regional and Winery Reputations: Hedonic Prices for Australia and New Zealand.” The Economic Record, Vol. 79, No. 246, September, 357-369. Schwartz, A. E., and Scafidi, B. P. (2001) “Quality Adjusted Indices for Four Year Colleges.” Working Paper 337, Bureau of Labor Statistics Working Papers. Waugh, F.V. (1928) “Quality Factors Influencing Vegetable Prices.” Journal of Farm Economics, 10, 185-96. Winston, G. C. (1999) “Subsidies, Hierarchy and Peers: The Awkward Economics of Higher Education.” Journal of Economic Perspectives, Winter, 13-36.

12
Table 1 Definition of Variables
Variable Definition Tuition & Fees Published in-state tuition and fees for full-time, first-time undergraduate students for the full academic year. NewEng =1 if a college is located in CT, ME, MA, NH, RI, VT; 0 otherwise. MidEast =1 if a college is located in DE, DC, MD, NJ, NY, PA; 0 otherwise. Lakes =1 if a college is located in IL, IN, MI, OH, WI; 0 otherwise. Plains =1 if a college is located in IA, KS, MN, MO, NE, ND, SD; 0 otherwise. SouthEast =1 if a college is located in AL, AR, FL, GA, KY, LA, MS, NC, SC, TN, VA, WV; 0 otherwise. SouthWest =1 if a college is located in AZ, NM, OK, TX; 0 otherwise. Rocky =1 if a college is located in CO, ID, MT, UT, WY; 0 otherwise. West =1 if a college is located in AK, CA, HI, NV, OR, WA; 0 otherwise. Public =1 if a college is publicly owned; 0 otherwise. NonProfit =1 if a college is private nonprofit institution; 0 otherwise. ForProfit =1 if a college is private for profit institution; 0 otherwise. HBCU =1 if a college is a historically black college or university; 0 otherwise. Hospital =1 if the institution has a hospital; 0 otherwise. MD =1 if the institution grants a medical degree; 0 otherwise. City =1 if the institution’s degree of urbanization is labeled ‘City Large’ or ‘City Midsize’ or ‘City Small’ by IPEDS; 0 otherwise. Suburb =1 if the institution’s degree of urbanization is labeled ‘Suburb Large’ or ‘Suburb Midsize’ or ‘Suburb Small’ by IPEDS; 0 otherwise. Town =1 if the institution’s degree of urbanization is labeled ‘Town Fringe’ or ‘Town Distant’ or ‘Town Remote’ by IPEDS; 0 otherwise. Rural =1 if the institution’s degree of urbanization is labeled ‘Rural Fringe’ or ‘Rural Distant’ or ‘Rural Remote’ by IPEDS; 0 otherwise. Religion = if the institution has a religious affiliation; 0 otherwise. Research =1 if the Carnegie classification of the institution is ‘research universities with very high research activity’ or ‘research universities with high research activity’; 0 otherwise. Doct =1 if the Carnegie classification of the institution is ‘doctoral/research universities’; 0 otherwise. Masters =1 if the Carnegie classification of the institution is ‘masters colleges and universities (larger programs)’, ‘masters colleges and universities (medium programs)’, ‘masters colleges and universities (smaller programs)’; 0 otherwise. Liberal =1 if the Carnegie classification of the institution is ‘Baccalaureate Colleges – Arts & Sciences’; 0 otherwise. Comprehensive =1 if the Carnegie classification of the institution is ‘Baccalaureate Colleges – Diverse fields’; 0 otherwise. BaccAssoc =1 if the Carnegie classification of the institution is ‘Baccalaureate / Associates’; 0 otherwise.

13
Table 1 (Continued) Definition of Variables
Variable Definition Associates =1 if the Carnegie classification of the institution is ‘Associates – public rural – serving small’ or ‘Associates – public rural – serving medium’ or ‘Associates – public rural – serving large’ or ‘Associates – public suburban – serving single campus’ or ‘Associates – public suburban – serving multicampus’ or ‘Associates – public urban – serving single campus’ or ‘Associates – public urban – serving multicampus’ or ‘Associates – public special use’ or ‘Associates – Private for-profit’ or ‘Associates – public 2-year colleges under 4-year universities’ or ‘Associates – Public – 4-year primarily associates’ or ‘Associates – private not-for-profit 4-year primarily associates’ or ‘Associates – private for-profit 4-year primarily associates’; 0 otherwise. DistLearn =1 if the institution offers distance learning opportunities; 0 otherwise. Abroad =1 if the institution offers study abroad opportunities; 0 otherwise. Weekend =1 if the institution offers weekend college; 0 otherwise. Teacher =1 if the institution offers teacher certification; 0 otherwise. Remedy =1 if the institution offers instructional activities for students who lack the general competencies necessary for a college education; 0 otherwise. Counsel =1 if the institution offers counseling activities to help students in college, professional, personal life; 0 otherwise. Studentwork =1 if the institution offers part-time employment opportunities for current students as a method of relieving part of the education cost; 0 otherwise. Placement =1 if the institution offers placement services for program completers to obtain full-time employment upon graduation; 0 otherwise. DayCare =1 if the institution offers on-campus day care service for students’ children; 0 otherwise. Library =1 if the institution has own library or shared financial support for library; 0 otherwise. Football =1 if the institution is a NCAA/NAIA member for football; 0 otherwise. Basketballl =1 if the institution is a NCAA/NAIA member for basketball; 0 otherwise. Baseball =1 if the institution is a NCAA/NAIA member for baseball; 0 otherwise. Track =1 if the institution is a NCAA/NAIA member for cross country/track; 0 otherwise. Semester =1 if the institution follows semester calendar system; 0 otherwise. Quarter =1 if the institution follows quarter calendar system; 0 otherwise. Trimester =1 if the institution follows trimester calendar system; 0 otherwise. Four =1 if the institution follows four-one-four plan calendar system; 0 otherwise.

14
Table 1 (Continued) Definition of Variables
Variable Definition OtherCal =1 if the institution follows other calendar system; 0 otherwise. Housing =1 if the institution provides on-campus housing; 0 otherwise. Board =1 if the institution provides board or meal plan; 0 otherwise. Livoncamp =1 if the institution requires full-time and first-time students to live on campus; 0 otherwise. Size1 =1 if the institution size is less than 1,000 total stduents; 0 otherwise. Size2 =1 if the institution size between 1,000 and 4,999 total stduents; 0 otherwise. Size3 =1 if the institution size between 5,000 and 9,999 total stduents; 0 otherwise. Size4 =1 if the institution size between 10,000 and 19,999 total stduents; 0 otherwise. Size5 =1 if the institution size is equal to or greater than 20,000 total stduents; 0 otherwise. White% = Percent of total enrollment that are White, non-Hispanic. Black% = Percent of total enrollment that are Black, non-Hispanic. Hispanic% = Percent of total enrollment that are Hispanic. Asian% = Percent of total enrollment that are Asian or Pacific Islander. International% = Percent of total enrollment that are non-resident alien. Women% = Percent of total enrollment that are women. White =1 if the percent of total enrollment that are White, non-Hispanic is above 90%; 0 otherwise. Hispanic =1 if the percent of total enrollment that are Hispanic is above 50%; 0 otherwise. Asian =1 if the percent of total enrollment that are Asian or Pacific Islander is above 33.3%; 0 otherwise. International =1 if the percent of total enrollment that are non-resident alien is above 25%; 0 otherwise. OnlyMen =1 if the institution is a men’s college; 0 otherwise. OnlyWomen =1 if the institution is a women’s college; 0 otherwise. Accept% = Percent of total applicants that are admitted. Selective =1 if the percent of total applicants that are admitted is equal to or less than 20%; 0 otherwise. NonSelective =1 if the percent of total applicants that are admitted is equal to or greater than 90%; 0 otherwise. Graduation% = Graduation rate of first-time, full-time students.

15
Table 2 Summary Statistics for Whole Sample 2003-2004, 2004-2005, and 2005-2006
Variable Mean Standard Deviation Minimum Maximum Tuition & Fees* 14,895.34 9,128.00 552.75 40,547.55 NewEng 0.0891 0.2850 0 1 MidEast 0.2130 0.4095 0 1 Lakes 0.1579 0.3647 0 1 Plains 0.1073 0.3095 0 1 SouthEast 0.2606 0.4390 0 1 SouthWest 0.0612 0.2397 0 1 Rocky 0.0227 0.1488 0 1 West 0.0884 0.2839 0 1 Public 0.3588 0.4797 0 1 NonProfit 0.5906 0.4918 0 1 ForProfit 0.0506 0.2192 0 1 HBCU 0.0378 0.1907 0 1 Hospital 0.0320 0.1760 0 1 MD 0.0768 0.2663 0 1 City 0.4494 0.4975 0 1 Suburb 0.2236 0.4167 0 1 Town 0.2432 0.4291 0 1 Rural 0.0838 0.2772 0 1 Religion 0.3885 0.4875 0 1 Research 0.1397 0.3467 0 1 Doct 0.0431 0.2030 0 1 Masters 0.4008 0.4901 0 1 Liberal 0.1594 0.3661 0 1 Comprehensive 0.1483 0.3554 0 1 BaccAssoc 0.0151 0.1220 0 1 Associates 0.0937 0.2914 0 1 DistLearn 0.6000 0.4900 0 1 Abroad 0.8215 0.3830 0 1 Weekend 0.2283 0.4198 0 1 Teacher 0.7928 0.4054 0 1 Remedy 0.7218 0.4482 0 1 Counsel 0.9965 0.0593 0 1 Studentwork 0.9512 0.2156 0 1 Placement 0.9003 0.2996 0 1 DayCare 0.3172 0.4655 0 1 Library 0.9897 0.1011 0 1 Football 0.4700 0.4992 0 1 Basketballl 0.8336 0.3725 0 1 Baseball 0.7010 0.4579 0 1 *Measured in June 2007 dollars.

16
Table 2 Summary Statistics for Whole (Continued)
Variable Mean Standard Deviation Minimum Maximum Track 0.7500 0.4331 0 1 Semester 0.8369 0.3695 0 1 Quarter 0.0680 0.2517 0 1 Trimester 0.0171 0.1297 0 1 Four 0.0753 0.2639 0 1 OtherCal 0.0028 0.0526 0 1 Housing 0.9046 0.2938 0 1 Board 0.8852 0.3188 0 1 Livoncamp 0.3505 0.4772 0 1 Size1 0.1518 0.3589 0 1 Size2 0.4819 0.4997 0 1 Size3 0.1609 0.3675 0 1 Size4 0.1171 0.3215 0 1 Size5 0.0884 0.2839 0 1 White% 69.070 21.455 0 100 Black% 11.854 17.975 0 100 Hispanic% 5.019 7.573 0 90 Asian% 3.458 4.981 0 59 International% 3.193 4.263 0 73 Women% 58.478 14.090 0 100 White 0.1198 0.3248 0 1 Hispanic 0.0058 0.0759 0 1 Asian 0.0045 0.0672 0 1 International 0.0045 0.0672 0 1 OnlyMen 0.0023 0.0476 0 1 OnlyWomen 0.0045 0.0672 0 1 Accept% 69.524 18.336 3.483 100 Selective 0.0144 0.1189 0 1 NonSelective 0.1032 0.3043 0 1 Graduation% 52.868 18.257 0 100 Observations N = 3,972 Source: Integrated Postsecondary Education Data System (IPEDS) for the academic year 2003-2004, 2004-2005, and 2005-2006 with author’s data filter.

17
Table 3 Summary Statistics by Institution Type 2003-2004, 2004-2005, and 2005-2006
Institution Type Public Private Nonprofit Private Forprofit Variable Mean S.D. Min. Max. Mean S.D. Min. Max. Mean S.D. Min. Max. Tuition & Fees* 5,211.46 2,048.0 1,585.6 23,017 20,980.2 6,540.1 552.75 40,547.5 12,529.0 3,853.5 5,319.4 39,528.0 NewEng 0.0716 0.2579 0 1 0.1061 0.3081 0 1 0.0150 0.1216 0 1 MidEast 0.1621 0.3687 0 1 0.2225 0.4160 0 1 0.4627 0.4999 0 1 Lakes 0.1263 0.3323 0 1 0.1777 0.3824 0 1 0.1493 0.3572 0 1 Plains 0.0842 0.2778 0 1 0.1223 0.3277 0 1 0.0945 0.2933 0 1 SouthEast 0.3326 0.4713 0 1 0.2238 0.4169 0 1 0.1791 0.3844 0 1 SouthWest 0.0884 0.2840 0 1 0.0477 0.2133 0 1 0.0249 0.1561 0 1 Rocky 0.0442 0.2056 0 1 0.0102 0.1006 0 1 0.0149 0.1216 0 1 West 0.0905 0.2870 0 1 0.0895 0.2855 0 1 0.0597 0.2375 0 1 HBCU 0.0589 0.2356 0 1 0.0281 0.1654 0 1 0 0 0 0 Hospital 0.0561 0.2303 0 1 0.0200 0.1401 0 1 0 0 0 0 MD 0.1326 0.3393 0 1 0.0494 0.2168 0 1 0 0 0 0 City 0.4589 0.4985 0 1 0.4395 0.4964 0 1 0.4975 0.5012 0 1 Suburb 0.1474 0.3546 0 1 0.2579 0.4376 0 1 0.3632 0.4821 0 1 Town 0.3095 0.4624 0 1 0.2221 0.4157 0 1 0.0199 0.1400 0 1 Rural 0.0842 0.2778 0 1 0.0806 0.2722 0 1 0.1194 0.3251 0 1 Religion 0 0 0 0 0.6577 0.4746 0 1 0 0 0 0 Research 0.2737 0.4460 0 1 0.0703 0.2558 0 1 0 0 0 0 Doct 0.0463 0.2102 0 1 0.0448 0.2068 0 1 0 0 0 0 Masters 0.4632 0.4988 0 1 0.3913 0.4881 0 1 0.0697 0.2552 0 0 *Measured in June 2007 dollars.
18
Table 3 Summary Statistics by Institution Type 2003-2004, 2004-2005, and 2005-2006 (Continued)
Institution Type Public Private Nonprofit Private Forprofit Variable Mean S.D. Min. Max. Mean S.D. Min. Max. Mean S.D. Min. Max. Liberal 0.0379 0.1910 0 1 0.2468 0.4312 0 1 0 0 0 0 Comprehensive 0.0716 0.2579 0 1 0.2055 0.4041 0 1 0.0249 0.1561 0 1 BaccAssoc 0.0126 0.1117 0 1 0.0077 0.0873 0 1 0.1194 0.3251 0 1 Associates 0.0947 0.2930 0 1 0.0337 0.1804 0 1 0.7861 0.4111 0 1 DistLearn 0.9109 0.2850 0 1 0.4126 0.4924 0 1 0.5821 0.4944 0 1 Abroad 0.8358 0.3706 0 1 0.8802 0.3248 0 1 0.0348 0.1838 0 1 Weekend 0.2449 0.4301 0 1 0.2161 0.4117 0 1 0.2537 0.4362 0 1 Teacher 0.8042 0.3969 0 1 0.8508 0.3564 0 1 0.0348 0.1838 0 1 Remedy 0.8211 0.3834 0 1 0.6820 0.4658 0 1 0.4826 0.5009 0 1 Counsel 1 0 1 1 1 0 1 1 0.9303 0.0180 0 1 Studentwork 0.9740 0.1591 0 1 0.9356 0.2455 0 1 0.9701 0.1706 0 1 Placement 0.9432 0.2316 0 1 0.8670 0.3396 0 1 0.9851 0.1216 0 1 DayCare 0.6267 0.4839 0 1 0.1535 0.3605 0 1 0.0348 0.1838 0 1 Library 0.9965 0.0592 0 1 0.9847 0.1229 0 1 1 0 1 1 Football 0.5902 0.4920 0 1 0.4373 0.4962 0 1 0 0 0 0 Basketballl 0.8688 0.3378 0 1 0.8824 0.3223 0 1 0.0149 0.1216 0 1 Baseball 0.7411 0.4382 0 1 0.7353 0.4413 0 1 0.0149 0.1216 0 1 Track 0.8091 0.3931 0 1 0.7775 0.4160 0 1 0.0100 0.0995 0 1 Semester 0.9193 0.2725 0 1 0.8278 0.3776 0 1 0.3582 0.4807 0 1 Quarter 0.0568 0.2316 0 1 0.0337 0.1804 0 1 0.5473 0.4990 0 1 Trimester 0.0070 0.0835 0 1 0.0166 0.1279 0 1 0.0945 0.2933 0 1 Four 0.0147 0.1205 0 1 0.1185 0.3233 0 1 0 0 0 0
19
Table 3 Summary Statistics by Institution Type 2003-2004, 2004-2005, and 2005-2006 (Continued)
Institution Type Public Private Nonprofit Private Forprofit Variable Mean S.D. Min. Max. Mean S.D. Min. Max. Mean S.D. Min. Max. OtherCal 0.0021 0.0459 0 1 0.0034 0.0583 0 1 0 0 0 0 Housing 0.8884 0.3150 0 1 0.9766 0.1513 0 1 0.1791 0.3844 0 1 Board 0.8596 0.3475 0 1 0.9676 0.1771 0 1 0.1045 0.3066 0 1 Livoncamp 0.2989 0.4580 0 1 0.4118 0.4923 0 1 0 0 0 0 Size1 0.0147 0.1205 0 1 0.1829 0.3867 0 1 0.7612 0.4274 0 1 Size2 0.2484 0.4322 0 1 0.6492 0.4773 0 1 0.1841 0.3885 0 1 Size3 0.2758 0.4471 0 1 0.1002 0.3003 0 1 0.0547 0.2280 0 1 Size4 0.2379 0.4259 0 1 0.0537 0.2255 0 1 0 0 0 0 Size5 0.2232 0.4165 0 1 0.0141 0.1178 0 1 0 0 0 0 White% 68.351 22.666 0.9439 97.066 69.859 20.211 0 100 64.967 25.772 6 100 Black% 13.606 20.699 0 96.000 10.388 16.246 0 100 16.547 14.181 0 72.3 Hispanic% 5.3394 8.7410 0 90.000 4.6022 6.2128 0 81 7.614 11.514 0 56 Asian% 3.9851 6.3766 0 59.000 3.2690 3.9636 0 28 1.928 3.750 0 28.5 International% 3.0074 2.8967 0 18.920 3.5586 4.9729 0 73 0.2496 0.8117 0 7.37 Women% 56.565 8.8378 6.1483 95.100 59.908 14.726 0 100 55.366 27.166 0 94.2 White 0.1095 0.3123 0 1 0.1181 0.3228 0 1 0.2139 0.4111 0 1 Hispanic 0.0063 0.0792 0 1 0.0043 0.0652 0 1 0.0199 0.1400 0 1 Asian 0.0126 0.1117 0 1 0 0 0 0 0 0 0 0 International 0 0 0 0 0.0077 0.0873 0 1 0 0 0 0 OnlyMen 0 0 0 0 0.0039 0.0618 0 1 0 0 0 0 OnlyWomen 0 0 0 0 0.0077 0.0873 0 1 0 0 0 0 Accept% 71.697 17.566 12.550 100 67.520 18.374 3.483 100 77.512 19.371 29.612 100

20
Table 3
Summary Statistics by Institution Type 2003-2004, 2004-2005, and 2005-2006 (Continued) Institution Type Public Private Nonprofit Private Forprofit Variable Mean S.D. Min. Max. Mean S.D. Min. Max. Mean S.D. Min. Max. Selective 0.0063 0.0792 0 1 0.0205 0.1416 0 1 0 0 0 0 NonSelective 0.1411 0.3482 0 1 0.0614 0.2401 0 1 0.3234 0.4689 0 1 Graduation% 44.548 16.524 0 93 58.043 17.239 0 100 51.453 19.500 0 100 Observations N = 1,425 N = 2,346 N = 201 Source: Integrated Postsecondary Education Data System (IPEDS) for the academic year 2003-2004, 2004-2005, and 2005-2006 with author’s data filter.
21
Table 4 Estimation Result
Variable Estimate Standard Error Constant 13,626.0*** 1,610.779 NewEng 3,194.236*** 266.895 MidEast 1,998.813*** 217.679 Lakes 1,357.127*** 183.163 Plains -318.497 214.721 SouthEast - - SouthWest -587.196** 274.885 Rocky -1,219.013*** 450.625 West 606.314** 309.272 Public -14,132*** 280.363 NonProfit - - ForProfit -5,065.078** 509.519 HBCU -1,241.421** 631.773 Hospital 236.623 398.278 MD 968.0128*** 241.614 City 167.462 221.950 Suburb 327.385 235.244 Town -134.629 229.109 Rural - - Religion -2,047.990*** 217.324 Research 374.394 538.707 Doct 1,163.299** 560.969 Masters -290.939 480.890 Liberal 1,661.641*** 499.418 Comprehensive -461.727 471.554 BaccAssoc -654.209 605.818 Associates - - DistLearn -334.121** 145.699 Abroad 957.145*** 200.006 Weekend 446.460*** 125.323 Teacher -550.012*** 207.203 Remedy -1,346.621*** 158.340 Counsel 2,369.483*** 696.412 Studentwork 981.574*** 310.046 Placement -516.069** 218.364 DayCare 132.372 167.078 Library -548.754 790.536 *Significant at 10% level. ** Significant at 5% level. *** Significant at 1% level. Heteroscedasticity-consistent standard errors are reported.

22
Table 4 Estimation Result (Continued)
Variable Estimate Standard Error Football 823.390*** 142.564 Basketballl 466.750 359.847 Baseball -304.827* 166.192 Track 275.399 182.223 Semester - - Quarter -175.813 285.668 Trimester -1,293.413*** 436.136 Four 1.066 236.378 OtherCal 1,538.013 961.049 Housing -2,017.513*** 496.628 Board 2,639.260*** 456.676 Livoncamp 956.097*** 124.117 Size1 1,819.721*** 419.120 Size2 3,603.428*** 313.816 Size3 3,191.534*** 262.338 Size4 2,480.653*** 238.611 Size5 - - White% -43.553*** 9.173 Black% -59.611*** 10.968 Hispanic% -48.220*** 14.337 Asian% 146.511*** 25.182 International% 59.415** 23.492 Women% -13.154** 5.366 White -916.873*** 199.737 Hispanic -559.163 986.001 Asian -8,700.185*** 841.405 International -2,003.626** 821.352 OnlyMen -943.291 620.838 OnlyWomen -1,159.804 992.439 Accept% -2.427 4.928 Selective -373.295 501.365 NonSelective 0.199 214.650 Graduation% 86.051*** 6.114 F statistic 401.20 Adjusted R2 0.8639 Number of Observations 3,972 *Significant at 10% level. ** Significant at 5% level. *** Significant at 1% level. Heteroscedasticity-consistent standard errors are reported.
23
Table 5 40 Most Underpriced Colleges
Tuition Quality Adjusted Amount of Rank Institution Name State Sector* & Fees** Tuition & Fees*** Undervaluation 1 Berea College KY Private/Nonprofit/4 565 23,448 -22,883 2 Park University MO Private/Nonprofit/4 6,621 17,922 -11,301 3 York College Pennsylvania PA Private/Nonprofit/4 9,512 20,281 -10,769 4 St Vincent Catholic Medical Center-Staten Island NY Private/Nonprofit/2 8,807 19,546 -10,739 5 St Francis College NY Private/Nonprofit/4 12,926 23,580 -10,654 6 Flagler College FL Private/Nonprofit/4 8,801 18,951 -10,150 7 Saint Josephs College-Main Campus NY Private/Nonprofit/4 12,725 22,532 -9,807 8 Brigham Young University-Idaho ID Private/Nonprofit/4 2,914 12,707 -9,793 9 Howard University DC Private/Nonprofit/4 12,788 22,282 -9,494 10 Champlain College VT Private/Nonprofit/4 15,193 24,625 -9,432 11 Gallaudet University DC Private/Nonprofit/4 11,669 20,820 -9,151 12 Lawrence Technological University MI Private/Nonprofit/4 14,689 23,520 -8,831 13 Crouse Hospital School of Nursing NY Private/Nonprofit/2 7,927 16,668 -8,741 14 Central Maine Medical Center School of Nursing ME Private/Nonprofit/2 6,259 14,868 -8,609 15 SUNY at Binghamton NY Public/4 6,342 14,904 -8,562 16 North Greenville University SC Private/Nonprofit/4 10,785 19,299 -8,514 17 The National Hispanic University CA Private/Nonprofit/4 4,111 12,416 -8,305 18 Union Institute & University OH Private/Nonprofit/4 9,121 16,985 -7,864 19 Wesleyan College GA Private/Nonprofit/4 12,254 20,089 -7,835 20 American Academy of Dramatic Arts-West CA Private/Nonprofit/2 16,612 24,425 -7,813 * Private/Nonprofit/4=Private nonprofit 4-year or above institution. Private/Nonprofit/2 = Private nonprofit 2-year institution. Public/4 = Public 4-year or above institution. Private/Forprofit/2 = Private forprofit 2-year institution. ** Average of published in-state tuition and fees for full-time, first-time undergraduate students for the full academic year during our sample period of 2003-2004, 2004-2005, 2005-2006 which are measured in June 2007 dollars to adjust for the inflation. *** Average of predicted values from the hedonic price function estimated.

24
Table 5 40 Most Underpriced Colleges (Continued)
Tuition Quality Adjusted Amount of Rank Institution Name State Sector* & Fees** Tuition & Fees*** Undervaluation 21 University of California-Los Angeles CA Public/4 6,934 14,713 -7,779 22 Wells College NY Private/Nonprofit/4 16,497 23,944 -7,447 23 Jamestown College ND Private/Nonprofit/4 10,320 17,721 -7,401 24 Dunwoody College of Technology MN Private/Nonprofit/2 11,788 19,151 -7,363 25 Madonna University MI Private/Nonprofit/4 10,612 17,965 -7,353 26 Evangel University MO Private/Nonprofit/4 13,201 20,399 -7,198 27 Robert Morris University PA Private/Nonprofit/4 15,717 22,838 -7,121 28 Lindenwood University MO Private/Nonprofit/4 12,620 19,738 -7,118 29 Lane College TN Private/Nonprofit/4 7,765 14,770 -7,005 30 Mississippi College MS Private/Nonprofit/4 12,984 19,765 -6,781 31 Heald College-Salinas CA Private/Nonprofit/2 11,252 18,011 -6,759 32 Samford University AL Private/Nonprofit/4 15,306 22,061 -6,755 33 Marian Court College MA Private/Nonprofit/2 12,653 19,379 -6,726 34 New York Institute of Technology-Old Westbury NY Private/Nonprofit/4 19,799 26,373 -6,574 35 Harding University AR Private/Nonprofit/4 11,331 17,741 -6,410 36 University of Mary ND Private/Nonprofit/4 11,378 17,766 -6,388 37 Cambria Rowe Business College PA Private/Forprofit/2 7,589 13,970 -6,381 38 Louisiana College LA Private/Nonprofit/4 11,103 17,240 -6,137 39 Georgia Institute of Technology-Main Campus GA Public/4 4,767 10,781 -6,014 40 University of Florida FL Public/4 3,238 9,199 -5,961 * Private/Nonprofit/4=Private nonprofit 4-year or above institution. Private/Nonprofit/2 = Private nonprofit 2-year institution. Public/4 = Public 4-year or above institution. Private/Forprofit/2 = Private forprofit 2-year institution. ** Average of published in-state tuition and fees for full-time, first-time undergraduate students for the full academic year during our sample period of 2003-2004, 2004-2005, 2005-2006 which are measured in June 2007 dollars to adjust for the inflation. *** Average of predicted values from the hedonic price function estimated.