Embed Size (px)
Citation preview
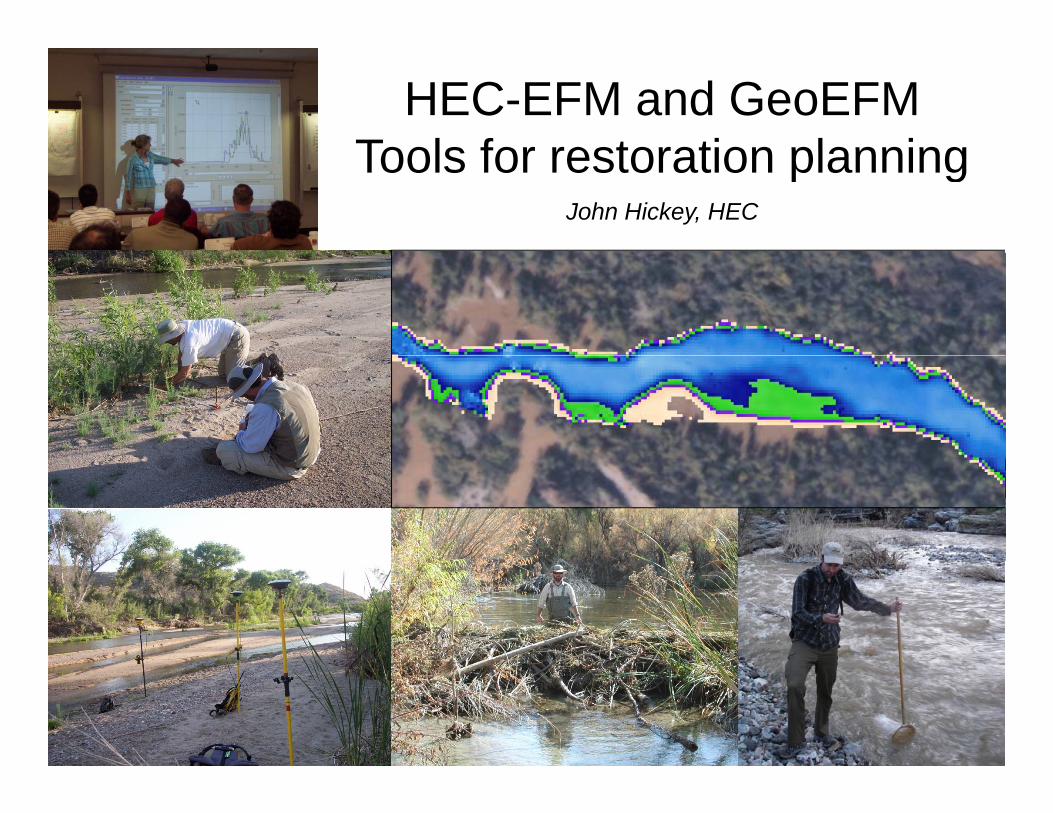
HEC-EFM and GeoEFMTools for restoration planningTools for restoration planning
John Hickey, HEC

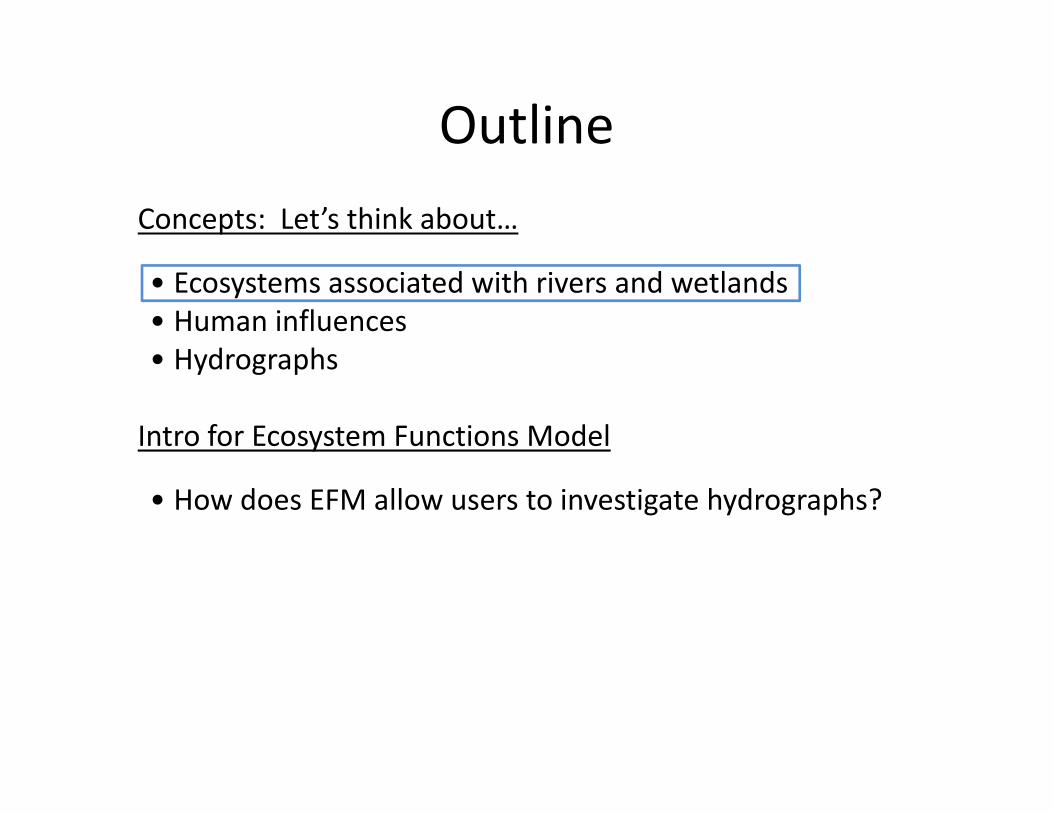
Outline
Concepts: Let’s think about…
• Ecosystems associated with rivers and wetlands• Human influences• Hydrographs• Hydrographs
Intro for Ecosystem Functions Model
• How does EFM allow users to investigate hydrographs?
Outline
Concepts: Let’s think about…
• Ecosystems associated with rivers and wetlands• Human influences• Hydrographs• Hydrographs
Intro for Ecosystem Functions Model
• How does EFM allow users to investigate hydrographs?

Hydrology and Ecology
Chinook Salmon
hatch young rearing and out to ocean spawning eggs in gravel
seed
eggs
Northern
CottonwoodTrees
northern migration breeding hatching southern migration
dormant germination seedling development dormantseed
dispersal
Pintail feeding/fattening
OW
l
FLO Natural
Regulated
Jan Feb Mar Apr May Jun Jul Aug Sep Oct Nov Dec


Model for a Southwestern River Ecosystem

Outline
Concepts: Let’s think about…
• Ecosystems associated with rivers and wetlands• Human influences• Hydrographs• Hydrographs
Intro for Ecosystem Functions Model
• How does EFM allow users to investigate hydrographs?

Water Quality2 mussels
4 mussels

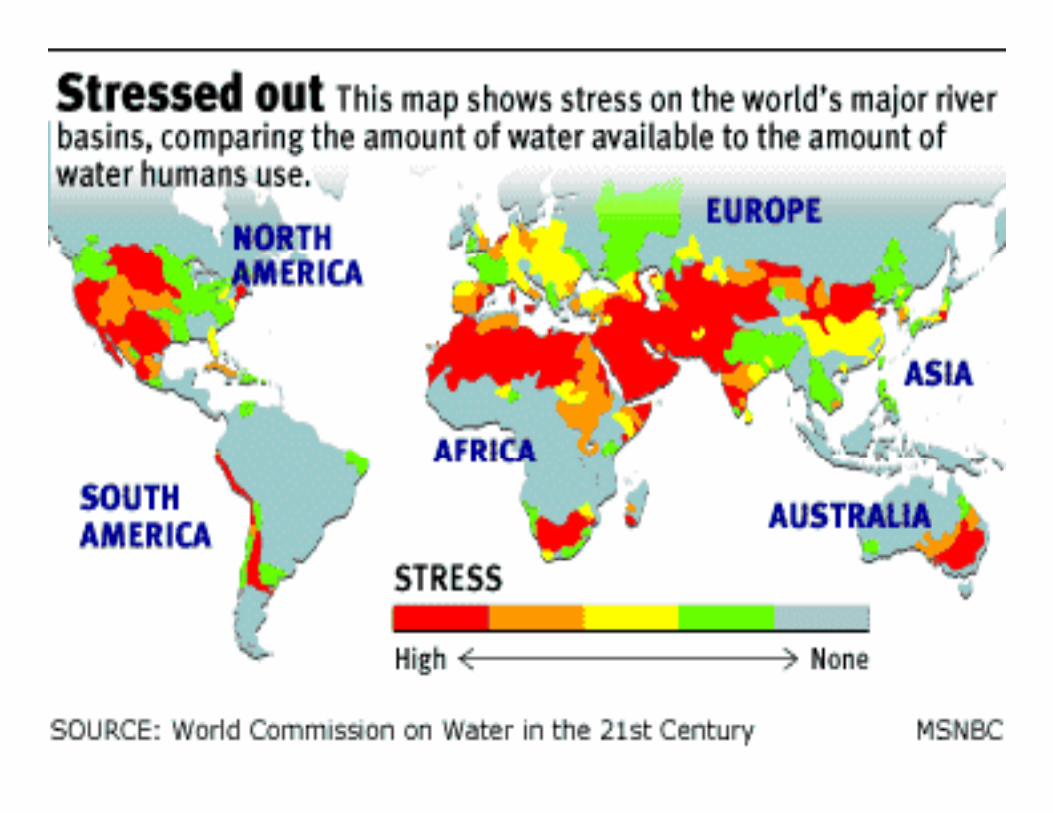
Water Development in United States
Ratio of water consumed relative to annual average surface flow

Global Water Consumption
Shiklomanov 1996

The History of Global Dam Development

Proportion of U.S. Species at Risk
Source: Precious Heritage (TNC 2000)

Outline
Concepts: Let’s think about…
• Ecosystems associated with rivers and wetlands• Human influences• Hydrographs• Hydrographs
Intro for Ecosystem Functions Model
• How does EFM allow users to investigate hydrographs?

Connections between Flow and Ecology
Postel and Richter, 2003.

Getting into EFM…
Key points so far
g
• Ecosystems evolve in concert with hydrologic patterns• Humans alter natural hydrologic patterns• If understood connections between ecology and hydrology can be• If understood, connections between ecology and hydrology can be used to help guide water and ecosystem management
f d lIntro for Ecosystem Functions Model
• How does EFM allow users to look at hydrographs?

Ecosystem Functions Model (EFM) Process
EcologyHydrology
Statistics
Statistical Results: Eco‐performance measures for each
ater scenariowater scenario
Hydraulics
SpatialSpatial Results:
Maps and areas for each water scenario

HEC‐EFM
• Analyze up to ~37,000 flow regimes at once
• User‐defined stats link hydro and ecology
• Geo queries add spatial aspects to p prelationships
Helps determine ecoHelps determine eco‐responses to changes in river and wetland
flow regimes…

EFM Math: Splittail Spawning
Beginning of Season End of
SeasonSeasonDuration Interval
Duration IntervalDuration Interval
The maximum of the minimums is the highest flow in the season
Advance 1 Day
Minimums define the flow levels that support egg incubation…
Advance 1 Day
that supports egg incubation.
Minimum Value in Interval
Minimum Value in Interval
Flow
gg
IntervalMinimum Value in Interval
Feature has been used for fish spawning and
Datevegetation drowning…
1997

HEC‐EFM• Uses daily time series of flow and stage
• Computes statistics that• Computes statistics that are eco‐relevant (as defined by users)
• Compare management• Compare management scenarios for multiple eco‐relationships
Statistical results investigated spatially with hydraulic models and GIS…

HEC‐EFM ‐ from Statistical to Spatial…• Statistical results are input to hydraulic models to develop:
• Water surface profiles
• Depth and velocity grids• Depth and velocity grids
• Inundation boundary maps
• Shear stress…
Splittail Spawning:Gaged ConditionsNatural ConditionsChannel Habitat
(not suitable)(not suitable)
25
EFM SJ River Rch 9(2d) 3rd River = San Joaquin Reach = 2d Index Cross Sect
Legend
WS 10yr
WS IIC1
WS 5
5
10
15
20
Ele
vatio
n (ft
)
WS 5yr
WS 3yr
WS IIB1
WS IIC3
WS 1.5yr
WS IIE1
WS IA3a
WS IA3b
WS AvgAug
WS IA5
Ground
Levee
500 1000 1500 2000
0
Station (ft)
Levee
Bank Sta

EFM Applications and Relationships…
• Farmington River, CT…………..Floodplain forest, shrubs, buttonbush
• Sandy River Delta, OR…………….Chinook salmon
• Bill Williams River AZ Cottonwood willow saltcedar• Bill Williams River, AZ...............Cottonwood, willow, saltcedar
• Mississippi River, MO...............Waterfowl, bluegill, plants
• Truckee River, NV…………………..Mayflies and cottonwood
• Ashuelot Rivers, NH……………….Mussels, host fish
• Savannah River, GA/SC.............Shad, bass, shoals lily
• Sacramento/San Joaquin CA Splittail geomorph LWD• Sacramento/San Joaquin, CA...Splittail, geomorph, LWD

EFM Application – Cottonwood Bill Willi Ri AZ
VeVe
Colorado R
.C
olorado R. VeVe
Colorado R
.C
olorado R.
Bill Williams River, AZ
PhoenixPhoenixGila R.Gila R.
Salt R.Salt R.
erde R.
erde R.
PhoenixPhoenixGila R.Gila R.
Salt R.Salt R.
erde R.
erde R.
YumaYuma TucsonTucsonYumaYuma TucsonTucson
DA = 5200 sq. mi.
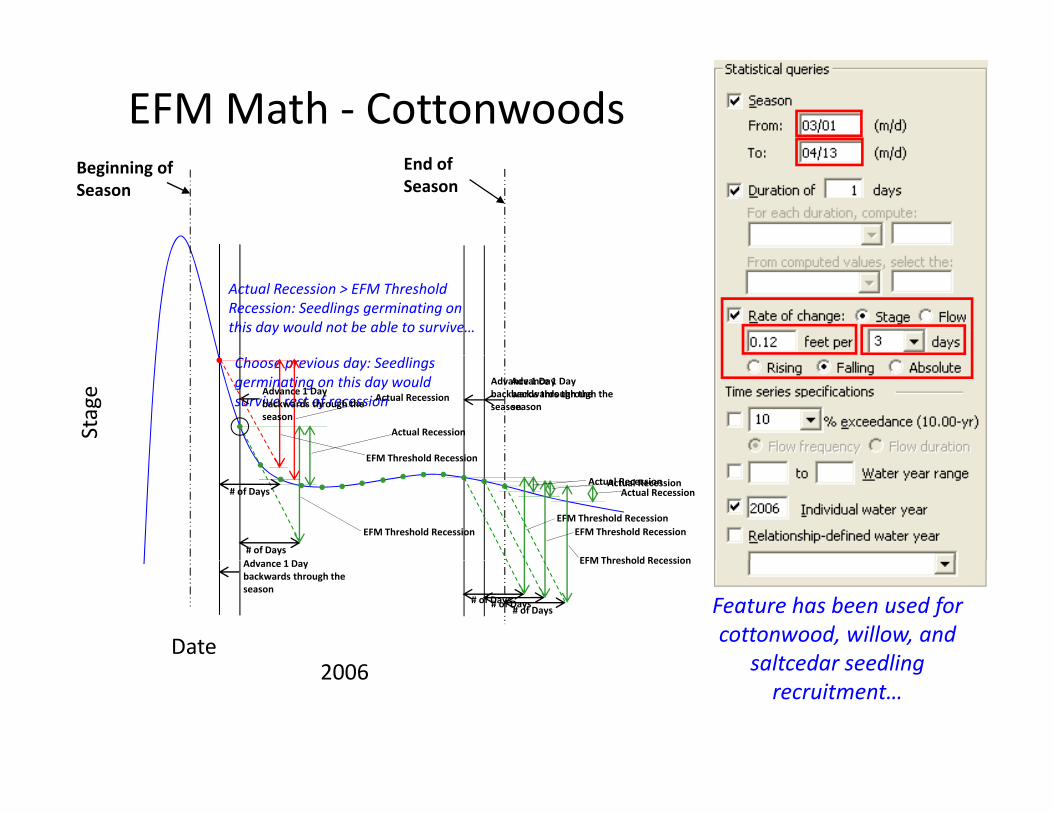
EFM Math ‐ CottonwoodsBeginning of Season
End of Season
Actual Recession > EFM Threshold Recession: Seedlings germinating on this day would not be able to survive…
Choose previous day: Seedlings germinating on this day would survive rest of recessionActual Recession
Advance 1 Day backwards through the season
Advance 1 Day backwards through the season
Stage
Actual Recession
Advance 1 Day backwards through the season
EFM Threshold Recession
Ad 1 D EFM Threshold Recession
Actual RecessionActual Recession
EFM Threshold Recession
Actual Recession
EFM Threshold Recession
# of Days
EFM Threshold Recession
# of Days
EFM Threshold Recession
Advance 1 Day backwards through the season
Date
# of Days
EFM Threshold Recession
# of Days# of Days Feature has been used for cottonwood, willow, and
saltcedar seedlingsaltcedar seedling recruitment…
2006

Bill Williams River: Mixed Riparian SpeciesRiparian Species

Spatial Analysis of HEC EFM ResultsHEC‐EFM Results
Cottonwood

Correlating to Field Data
Preliminary Patch Correlations
Si l t d Species CorrelationSimulated v.
ObservedPatches
pCottonwood 0.77Willow 0.81Tamarisk 0.82Tamarisk 0.82

Floodplain Vegetation Farmington River, CTg ,
Field Work: Vegetation Survey
• Survey vegetation and elevation data along floodplain transectsalong floodplain transects
• Monitor channel water levels with pressure transducer
h fl d d d f h l h• How much flooding is needed for healthy floodplain ecosystem?

Tree results: Duration of flooding
20
50
vv

Floodplain Vegetation
Floodplain Forest Mixed Shrubs Buttonbush Open Water ( )
Inundated 20 days per year
(no veg)
Inundated 50 days per year
Inundated 200
Inundated 300 days per year
days per year

ButtonbushMixed ShrubSilver MapleSilver MapleEFM Math: Floodplain Vegetation
Beginning of Season
End of Season
1 Day DurationAdvance 1 Day User Defined %Silver Maple‐Driest (20‐day inundation)
low
Silver Maple‐Median (50‐day inundation)
F
Mixed Shrub‐Driest (200‐day inundation)
= 365 days
Buttonbush Driest (300‐day inundation)
199901/01 12/31… …

Each year is considered and then ranked…Season Season Season Season Season
Flow
Time
… …
199919981997 2000 2001Time
Seasonal ResultsButtonbush XML Output
DSS Output
Flow Silver Maple‐driest (20‐d inundation)
Silver Maple‐median (50‐d inundation)Mixed Shrub‐driest (200‐d inundation)Buttonbush driest (300 inundation)
50%100% 0%
Buttonbush‐driest (300‐ inundation)
Statistical results reported in EFM interface and used i i h d li d l50%
Percent Equaled or Exceeded
100% 0% in river hydraulic models for mapping…

HEC‐EFM – From Statistical to Spatial…
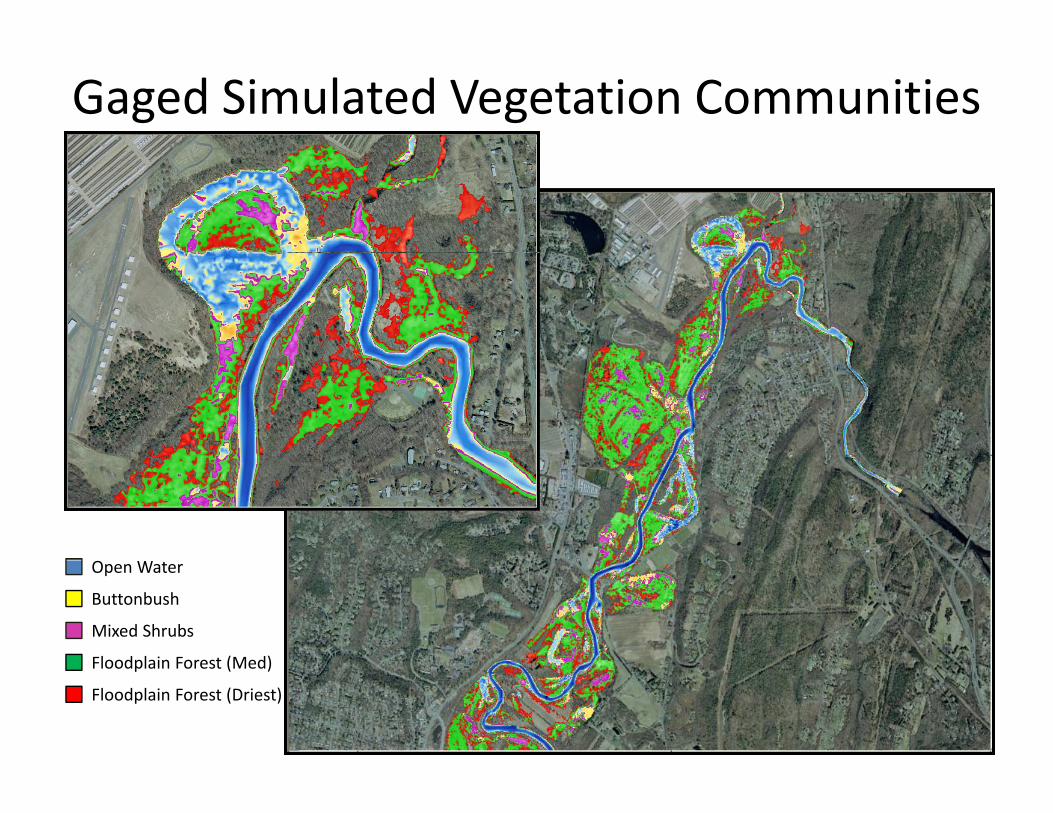
Gaged Simulated Vegetation Communities
Open Water
Buttonbush
Mixed Shrubs
Floodplain Forest (Med)Floodplain Forest (Med)
Floodplain Forest (Driest)
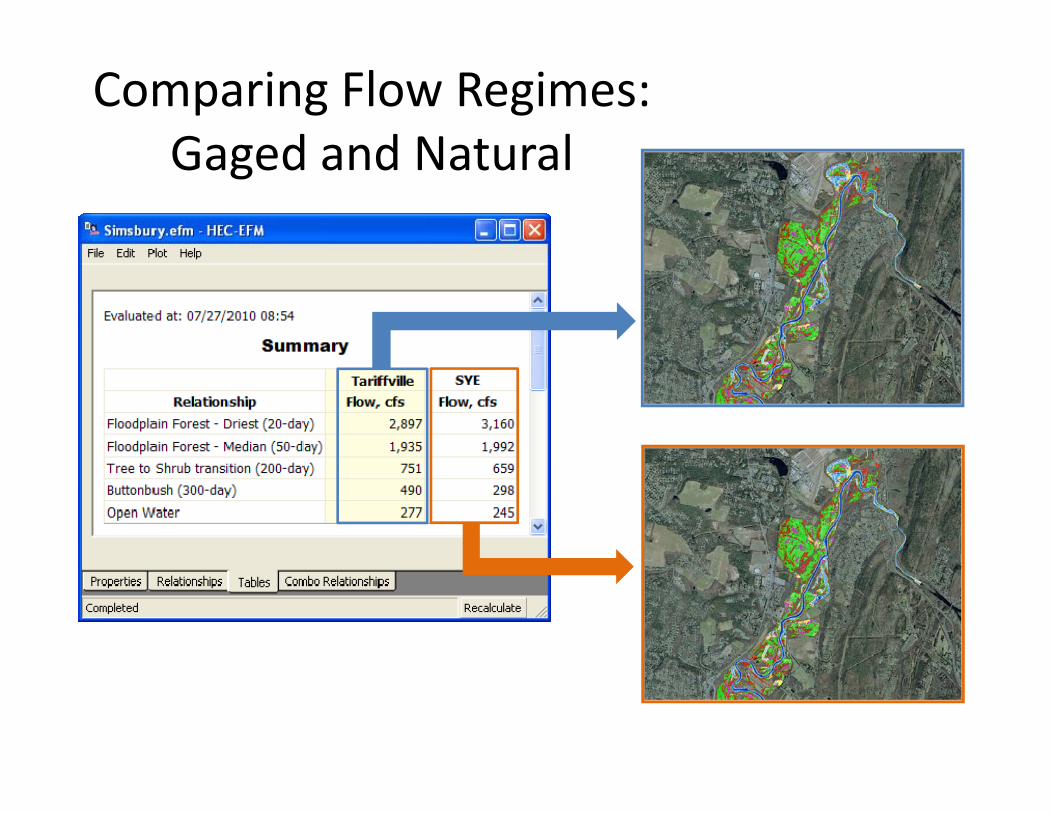
Comparing Flow Regimes: Gaged and NaturalGaged and Natural
Gaged Natural
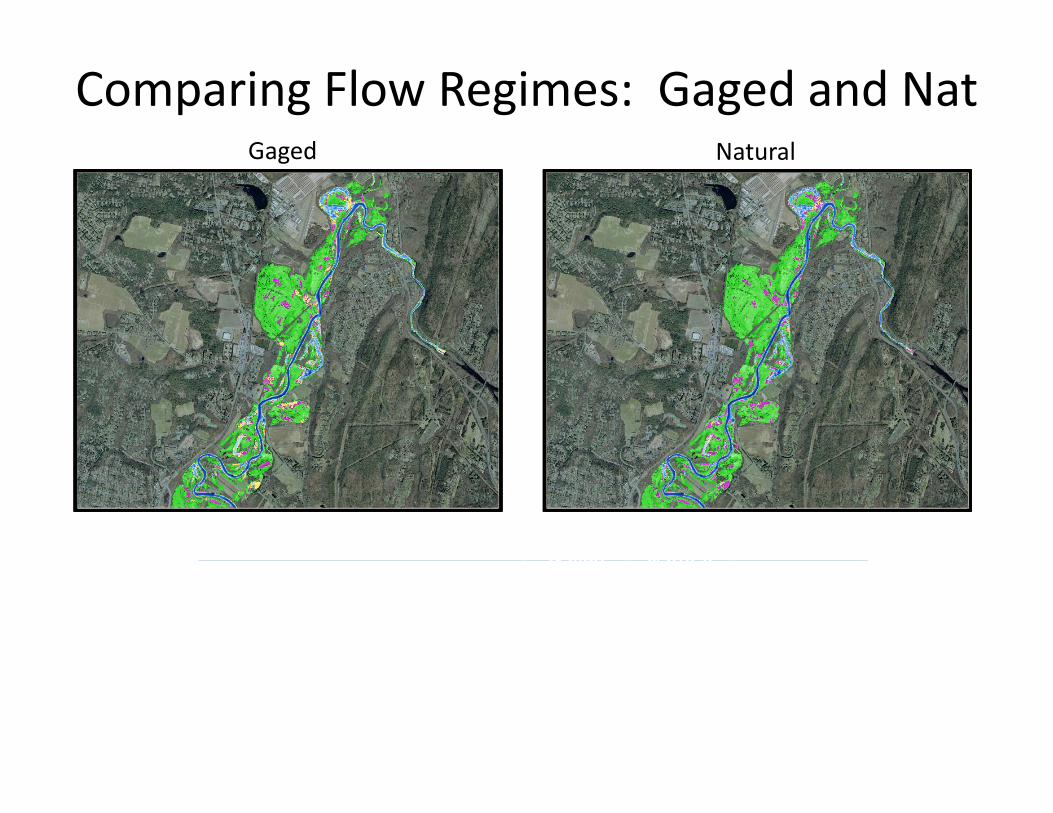
Comparing Flow Regimes: Gaged and NatGaged Natural
Gaged NaturalRelationships in EFM
Gaged(acres)
Natural (acres) ∆ acreage
Open Water 196 184 ‐12
Buttonbush 79 20 ‐59
Mixed Shrubs 113 147 33
Floodplain Forest 762 842 80

GeoEFM – Partnering HEC‐ESRIToolbar for Arc 9 3Toolbar for Arc 9.3
…set up and manage project

GeoEFM – Habitat Area
…compute/tabulate habitat areas for different management or
restoration scenarios

…corridors, distribution, interaction
GeoEFM – Habitat Connectivity
2
125
6
7
10
1
3
9
4
1411
13
8

Ecosystem Functions Model (EFM) Process
EcologyHydrology
Statistics
Statistical Results: Eco‐performance measures for each
ater scenario
EFM
water scenario
Hydraulics
SpatialSpatial Results:
Maps and areas for each water scenario Relationships
Gaged(acres)
SYE (acres)
Open Water 196 184
Geo
EFM
Open Water 196 184
Buttonbush 79 20
Mixed Shrubs 113 147
Floodplain Forest 762 842

HEC‐EFMReservoir Operations
SummaryHydrology Economics
River HydraulicsSediment
Ecosystem Function
Water Quality
• “Flow Regimes” = water management and/or ecosystem restoration scenarios
• “Relationships” = connections between hydrology and ecology
• EFM is generic…can be used to test many different types of Relationships
• EFM is powerful…can be used to test many different Flow Regimes
• Statistical output (direction of eco‐change and magnitude of eco‐change)
• Spatial output via hydraulic models (habitat areas and habitat connectivity)

For more information…
• www.hec.usace.army.mil/software/hec‐efm/
/ / /• www.hec.usace.army.mil/software/hec‐efm‐plotter/
• www.hec.usace.army.mil/software/hec‐geoefm/ (…coming soon)
EFM references
Shafroth et al. 2010. Ecosystem effects of environmental flows: modelling and experimental floods in a dryland river. Freshwater Biology ‐ January 2010.
USACE. 2009. HEC‐EFM ‐ Ecosystem Functions Model ‐ Quick Start Guide ‐ Version 2.0. Hydrologic Engineering Center, Davis, CA.
Hautzinger, Hickey, and Walker. 2008. How Much Water Do Stream‐Dependent Species Need? Southwest Hydrology ‐ July/August 2008.
Hickey. 2007. Models and Software for Supporting Ecologically Sustainable Water Management. Water Resources IMPACT ‐ July 2007.
USACE. 2006. Environmental Assessment update for the Savannah River Drought Contingency Plan. Savannah District.
USACE. 2004. The Ecosystem Functions Model: A Tool for Restoration Planning. ERDC/TN SMART‐04‐4.
USACE and Reclamation Board, State of California. 2002. Ecosystem FunctionsModel ‐ Technical Studies Documentation, Appendix G. Sacramento and San Joaquin Rivers Basin Comprehensive Study, Sacramento, CA. http://www.compstudy.net/reports.htmlq p y, , p // p y / p
Jones and Stokes. 2000. Final functional relationships for the Ecosystem Functions Model, Sacramento and San Joaquin River Basins Comprehensive Study, Sacramento, CA.