Embed Size (px)
Citation preview
Heavy Metal in Fertilizers:Considerations for Setting Regulations
In Oregon
Prepared forOregon Department of Agriculture
Salem, Oregon
Lawrence R. CurtisAnd
Brian W. Smith
Department of Environmental and Molecular ToxicologyOregon State University
Corvallis, Oregon
August 2, 2002
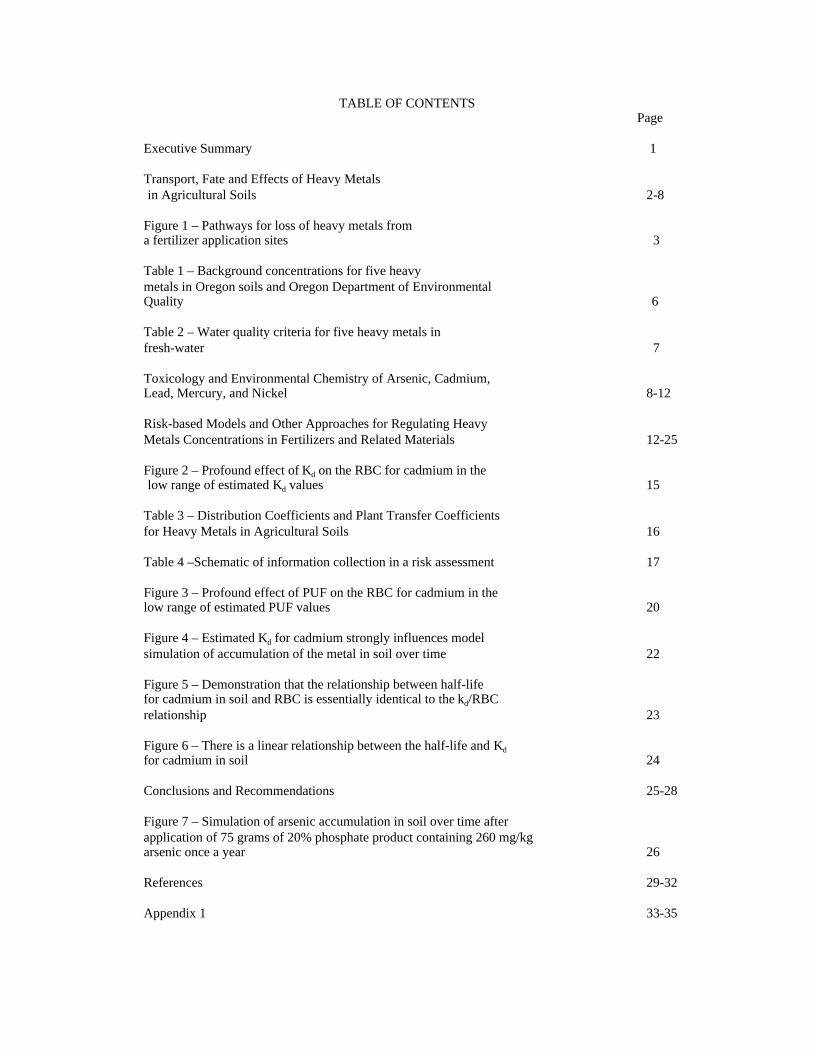
TABLE OF CONTENTS Page
Executive Summary 1
Transport, Fate and Effects of Heavy Metalsin Agricultural Soils 2-8
Figure 1 – Pathways for loss of heavy metals froma fertilizer application sites 3
Table 1 – Background concentrations for five heavymetals in Oregon soils and Oregon Department of EnvironmentalQuality 6
Table 2 – Water quality criteria for five heavy metals infresh-water 7
Toxicology and Environmental Chemistry of Arsenic, Cadmium,Lead, Mercury, and Nickel 8-12
Risk-based Models and Other Approaches for Regulating HeavyMetals Concentrations in Fertilizers and Related Materials 12-25
Figure 2 – Profound effect of Kd on the RBC for cadmium in thelow range of estimated Kd values 15
Table 3 – Distribution Coefficients and Plant Transfer Coefficientsfor Heavy Metals in Agricultural Soils 16
Table 4 –Schematic of information collection in a risk assessment 17
Figure 3 – Profound effect of PUF on the RBC for cadmium in thelow range of estimated PUF values 20
Figure 4 – Estimated Kd for cadmium strongly influences modelsimulation of accumulation of the metal in soil over time 22
Figure 5 – Demonstration that the relationship between half-life for cadmium in soil and RBC is essentially identical to the kd/RBCrelationship 23
Figure 6 – There is a linear relationship between the half-life and Kd
for cadmium in soil 24
Conclusions and Recommendations 25-28
Figure 7 – Simulation of arsenic accumulation in soil over time afterapplication of 75 grams of 20% phosphate product containing 260 mg/kgarsenic once a year 26
References 29-32
Appendix 1 33-35
1
Heavy Metals in Fertilizers: Considerations for Setting Regulations in Oregon
Executive Summary
Concentrations of heavy metals in fertilizers, agricultural minerals, agricultural
amendments, and lime products are subject to regulation by state governments. Oregon
Department of Agriculture must adopt standards for arsenic, cadmium, lead, mercury,
and nickel concentrations in these products during 2002. The objective of this regulation
is to protect human health and natural resources from toxicity of these heavy metals.
Since use of fertilizers and related products is a repetitive practice, it is necessary to
consider cumulative changes over decades of applications. There is a significant body of
scientific literature on transport, fate and effects of arsenic, cadmium, lead, mercury, and
nickel. Integration of this information into models that represent behavior of these heavy
metals in agricultural systems provides a rational approach to establishing unacceptable
concentrations in fertilizers and related products. This involves screening available
information, and identification of areas in which data limitations create uncertainty.
Human health risk assessment integrates information on environmental chemistry
and toxicology of the metals of interest with estimates of product application rates and
human exposures. Evaluation of the structure and results of existing risk assessments for
fertilizers and related products yields several conclusions. Existing risk assessments are
of common structure and follow the United States Environmental Protection Agency
guidelines. Farm families are the human population at most risk. Estimates of soil metal
concentrations after 50 years (200 years for lead) of product application largely
determines human health risk. Estimates of distribution coefficients (soil-to-water
concentration ratios) for each metal largely determine projections of soil metal
accumulation over time, and there is high uncertainty in these estimates. Addressing
uncertainty will likely require new research and re-evaluation of standards when the data
is available. Since heavy metal concentrations in the United States food supply are on a
declining trajectory, a compromise within the range of existing risk assessment results is
rational for setting standards in 2002.
2
Transport, Fate and Effects of Heavy Metals in Agricultural Soils
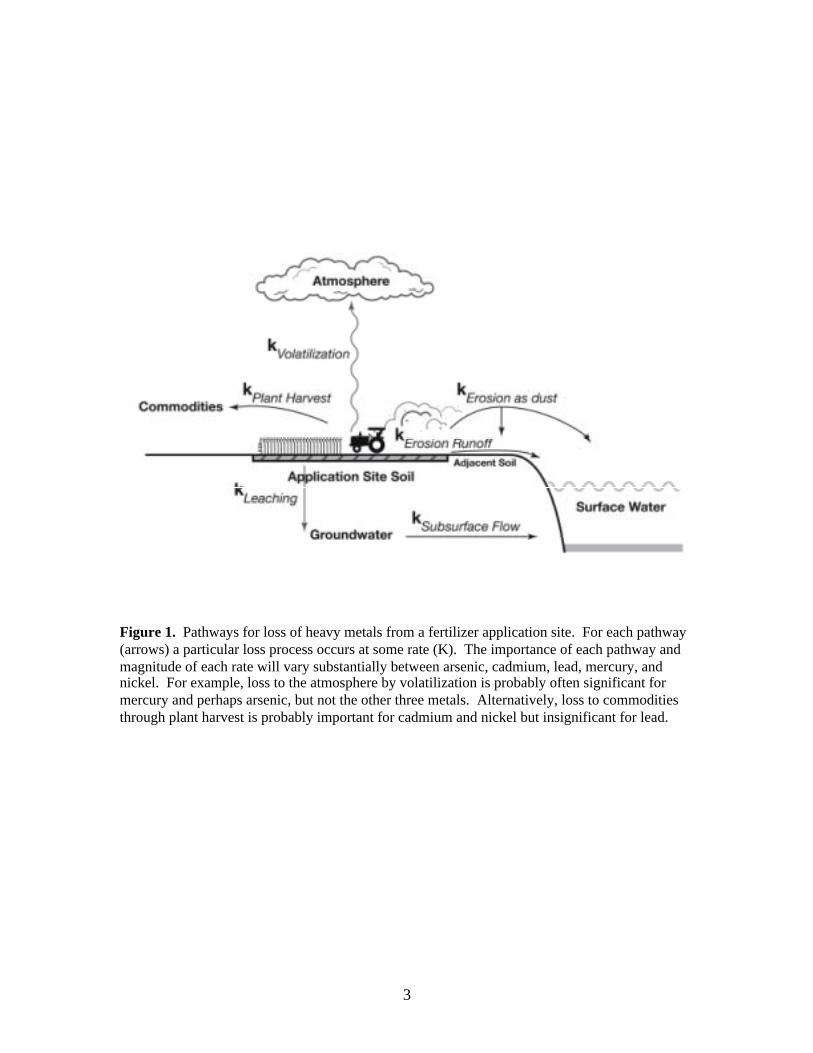
Physical processes are primary determinants of transport and fate of heavy metals
applied to soil in fertilizers and related products (Fig.1). Erosion, leaching, export in
harvested plants, and volatilization are major potential pathways for loss from soil at an
application site. Since they are elements, heavy metals are not subject to chemical
degradation that is critically important in fate of organic compounds. Chemical
conditions in soil are important secondary determinants of heavy metal transport and fate,
however. The importance of interactions between metals and solid phases of soils, soil
water, and air within and above soil depends on a variety of chemical factors. Absorption
of metals from soil water to soil particles is the most important chemical determinant that
limits mobility in soils (Alloway, 1995a). There are four general classes of these
interactions: specific adsorption, co-precipitation, cation exchange, and organic
complexation. Specific adsorption involves partly covalent bonds of the heavy metal
with lattice ions on soil particle surfaces. Co-precipitation involves formation of water
insoluble precipitates from metal ions (cations) and anions such as carbonate, sulfide, or
phosphate. Cation exchange is non-specific interaction of metals with negative surface
charges on soils minerals, such as clay. Finally, soil organic matter (e.g., humus) adsorbs
metals by forming chelate complexes, with carboxyl groups playing a predominant role.
Given the chemical basis for each of the four general classes of metal absorption, it is
clear that soil type is a fundamental determinant of heavy metal transport and fate.
3
Figure 1. Pathways for loss of heavy metals from a fertilizer application site. For each pathway(arrows) a particular loss process occurs at some rate (K). The importance of each pathway andmagnitude of each rate will vary substantially between arsenic, cadmium, lead, mercury, andnickel. For example, loss to the atmosphere by volatilization is probably often significant formercury and perhaps arsenic, but not the other three metals. Alternatively, loss to commoditiesthrough plant harvest is probably important for cadmium and nickel but insignificant for lead.
4
Soil pH is another chemical factor that influences heavy metal transport and fate,
especially mobility in soil water (Alloway, 1995a). First, ionization of metals increases
at low pH thereby increasing water solubility and mobility. Second, hydronium ions
displace most other cations on negative surface charges. This reduces metal absorption
by cation exchange and organic complexation.
The rates of metal absorption to (also called sorption) and desorption from (which
leads to mobilization) soil particle surfaces differ, sometimes greatly (Strawn and Sparks,
2000; Ford et al., 2001). In fact, sorption includes initial fast reactions, followed by slow
reactions. The four general classes of absorption interactions described above constitute
fast reactions. The mechanistic basis for slow reactions involves at least two processes:
(1) while sorption to soil particle surfaces is fast, diffusion into pores and subsequent
sorption at these sites is time-dependent; (2) sorbed complexes may undergo subsequent
reactions to form more stable structures. Desorption of metals deep in pores or
complexed in stable “aged” structures is much slower than initial sorption. This at least
partially explains the “irreversible” sorption that is often reported. For example,
desorption of lead from three soils with different organic matter content in stirred-flow
reactors varied from 32 to 76% (Strawn and Sparks, 2000). These data do not reflect
truly irreversible sorption, however. Slow desorption is not resolved in the design of
most experiments due to the short times of typical experiments. Lead continues to desorb
from these soils as more water volume washes through it. There is a progressive decline
in the percentage desorbed with cumulative washes. The slow reactions for desorption
are much slower than the slow reactions for sorption. Classical chemical descriptions for
chemical sorption/desorption assume equilibrium conditions. Distribution coefficient

5
(Kd) for partitioning of a metal between the solid phase of soil and soil water is an
example. Heavy metal sorption and especially desorption reactions are usually, if not
always, dynamic within the time frame of experiments that estimate Kd. This violates the
assumption of equilibrium conditions. This is one major contribution to problems with
application of Kd values to estimates of heavy metal transport and fate in soil.
Understanding transport and fate of arsenic, cadmium, lead, mercury, and nickel
provides a basis for explaining their capacity to accumulate in agricultural soils and
plants that grow on these soils. It is also useful for assessing the potential for these
metals to move into groundwater and surface water. It is clearly necessary to avoid
heavy metal concentrations in soils, plants, groundwater, and surface water that can
produce adverse effects on human or ecological health. Results from human health risk
assessments are available for application of arsenic, cadmium, lead, mercury, and nickel
found in fertilizers applied to agricultural soils. These risk assessments draw two general
conclusions: (1) farm family members are at highest potential risk; (2) consumption of
soil itself and crops grown on soils with high metal concentrations is the dominant
pathway contributing to risk. The final section of this report provides an in-depth
evaluation of these risk assessments.
Ecological risk assessments for soil applications of heavy metals in fertilizers and
related products are not available. Despite this, sensitivities of several sub-systems
within agricultural systems and boundary ecosystems to arsenic, cadmium, lead, mercury,
and nickel remain important considerations. If one assumes direct phytotoxicity to crops
and soil quality are within the domain of production management, then regulatory
concerns focus on terrestrial/wetland systems, and surface water quality (assuming
6
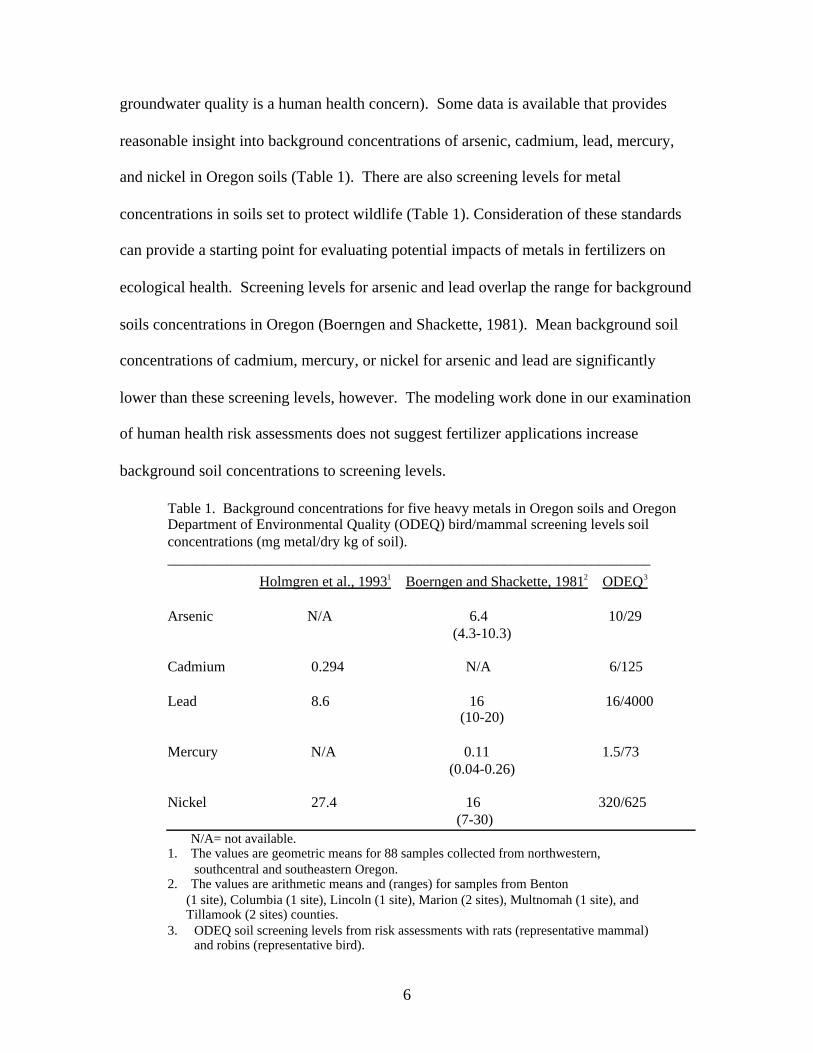
groundwater quality is a human health concern). Some data is available that provides
reasonable insight into background concentrations of arsenic, cadmium, lead, mercury,
and nickel in Oregon soils (Table 1). There are also screening levels for metal
concentrations in soils set to protect wildlife (Table 1). Consideration of these standards
can provide a starting point for evaluating potential impacts of metals in fertilizers on
ecological health. Screening levels for arsenic and lead overlap the range for background
soils concentrations in Oregon (Boerngen and Shackette, 1981). Mean background soil
concentrations of cadmium, mercury, or nickel for arsenic and lead are significantly
lower than these screening levels, however. The modeling work done in our examination
of human health risk assessments does not suggest fertilizer applications increase
background soil concentrations to screening levels.
Table 1. Background concentrations for five heavy metals in Oregon soils and OregonDepartment of Environmental Quality (ODEQ) bird/mammal screening levels soilconcentrations (mg metal/dry kg of soil).__________________________________________________________________
Holmgren et al., 19931 Boerngen and Shackette, 19812 ODEQ3
Arsenic N/A 6.4 10/29 (4.3-10.3)
Cadmium 0.294 N/A 6/125
Lead 8.6 16 16/4000 (10-20)
Mercury N/A 0.11 1.5/73 (0.04-0.26)
Nickel 27.4 16 320/625 (7-30) N/A= not available.1. The values are geometric means for 88 samples collected from northwestern,
southcentral and southeastern Oregon.2. The values are arithmetic means and (ranges) for samples from Benton
(1 site), Columbia (1 site), Lincoln (1 site), Marion (2 sites), Multnomah (1 site), andTillamook (2 sites) counties.
3. ODEQ soil screening levels from risk assessments with rats (representative mammal)and robins (representative bird).
7
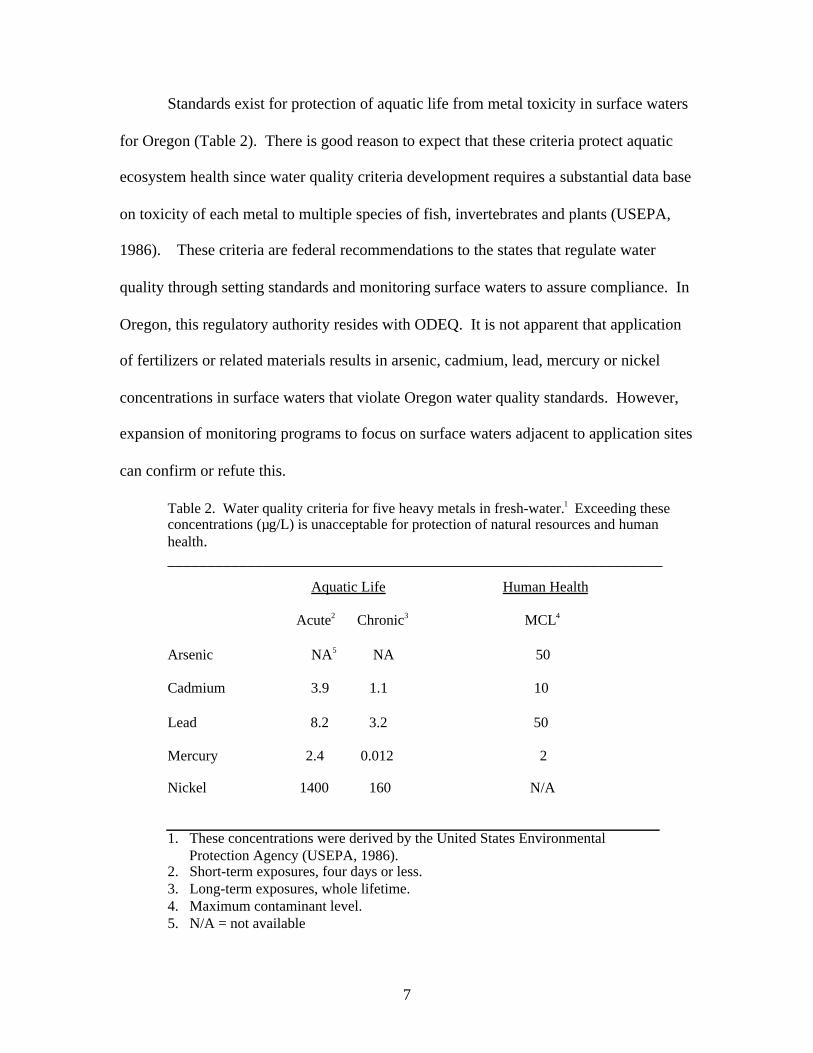
Standards exist for protection of aquatic life from metal toxicity in surface waters
for Oregon (Table 2). There is good reason to expect that these criteria protect aquatic
ecosystem health since water quality criteria development requires a substantial data base
on toxicity of each metal to multiple species of fish, invertebrates and plants (USEPA,
1986). These criteria are federal recommendations to the states that regulate water
quality through setting standards and monitoring surface waters to assure compliance. In
Oregon, this regulatory authority resides with ODEQ. It is not apparent that application
of fertilizers or related materials results in arsenic, cadmium, lead, mercury or nickel
concentrations in surface waters that violate Oregon water quality standards. However,
expansion of monitoring programs to focus on surface waters adjacent to application sites
can confirm or refute this.
Table 2. Water quality criteria for five heavy metals in fresh-water.1 Exceeding theseconcentrations (µg/L) is unacceptable for protection of natural resources and humanhealth.______________________________________________________________
Aquatic Life Human Health
Acute2 Chronic3 MCL4
Arsenic NA5 NA 50
Cadmium 3.9 1.1 10
Lead 8.2 3.2 50
Mercury 2.4 0.012 2
Nickel 1400 160 N/A
1. These concentrations were derived by the United States Environmental Protection Agency (USEPA, 1986).
2. Short-term exposures, four days or less.3. Long-term exposures, whole lifetime.4. Maximum contaminant level.5. N/A = not available
8
There are two general approaches to setting standards for concentrations of heavy
metals in fertilizers and related products. They consider the same parameters but differ in
the structure of formulas for calculations. The first approach considers the total mass of a
metal applied to an area of soil per unit time. Canadian and State of Washington
standards follow this approach. Canadian standards limit cumulative metal additions to
soils over 45 years. The State of Washington divides the Canadian standards by 45 and
expresses maximum pounds of metal added to soil per acre per year (Washington State
Department of Agriculture, 2000). The standards are: arsenic, 0.297; cadmium, 0.079;
lead, 1.981; mercury, 0.019; and nickel, 0.713. In order to determine metal additions one
multiples the pounds of product applied per acre times the concentration of metal in the
product. The second approach is to base standards on the maximum concentration of a
metal in the product. Since application rates vary substantially between types of products
(i.e., micronutrient and phosphate fertilizers) it is necessary to set different standards for
different products. Development of these standards requires estimating (modeling) soil
concentration over time with cumulative product application. The advantage of this
approach is that there is no need to calculate metal loading to soil for each product
application.
Toxicology and Environmental Chemistry of Arsenic, Cadmium, Lead, Mercury, andNickel
There are several potential pathways that determine transport and fate of heavy
metals in soils (Fig.1). The relative importance of each pathway varies substantially
between arsenic, cadmium, lead, mercury, and nickel. The potency and mode of toxic
action also differs greatly between these heavy metals. This section briefly summarizes
9
the environmental chemistry and toxicology of arsenic, cadmium, lead, mercury, and
nickel. Short term responses to large doses (acute toxicity) are not relevant to the risk
assessments of interest here, so discussion focuses on long-term exposure to low
concentrations (chronic toxicity).
The environmental chemistry of arsenic is similar to that of phosphorus, but more
diverse (O’Neill, 1995). The natural forms of arsenic in soils are oxysalts and sulfur
containing minerals. Arsenate (As V) composes about 90% of total oxysalts in aerobic
soils. Arsenite (As III) is 60-85% of the total oxysalts in water-saturated anaerobic soils.
Arsenate is more water soluble and mobile than arsenite. Microbial activity methylates
arsenic to volatile compounds but the quantitative importance of loss via the atmospheric
pathway remains unclear. Plant uptake of arsenic is usually low (plant uptake factors of
0.01-0.10) and phytotoxicity occurs at 40-200 mg/kg soil, depending on soil chemistry.
The complex chemistry of arsenic leads to multiple chemical species that differ in
toxicity (Goyer and Clarkson, 2001). Neurotoxicity, liver injury, cardiovascular disease,
and skin cancer result from chronic exposure to inorganic arsenic. Arsenic in drinking
water leading to exposures around 0.4 mg/kg/day can produce signs of toxicity in humans
within six months to 3 years. Human health effects due to consumption of arsenic in
crops is not evident.
Cadmium tends to be more mobile in soil systems and therefore more available to
plants than many other heavy metals (Alloway, 1995b). Cd2+ is the principal species in
soil solution. Accumulation of cadmium in food crops at soil concentrations that are not
phytotoxic is a significant concern. Plant species differ widely in their tendency to
accumulate cadmium. Lettuce, spinach, celery and cabbage avidly accumulate cadmium
10
while potato tubers, maize, french beans, and peas accumulate much less. Many studies
show linear relationships between soil cadmium concentrations and wheat and barley
grain, cabbage, and lettuce cadmium contents. Soil chemistry also influences cadmium
mobility and uptake by plants. As with other metals, low pH increases mobility.
Absorption/desorption of cadmium is about 10-fold more rapid than for lead. Chronic
cadmium exposures result in kidney damage, bone deformities, and cardiovascular
problems (Goyer and Clarkson, 2001). A major human poisoning occurred in Japan
during World War II due to industrial contamination of rice paddies. Since phosphate
fertilizers can contain significant cadmium concentrations, cadmium can accumulate in
crops, and human health problems can result from crop cadmium contamination; this
metal received special scrutiny in our review of human health risk assessments.
Lead is especially prone to accumulation in surface horizons of soil because its
low water solubility within an environmentally relevant pH range results in very low
mobility (Davies, 1995). Soil water contains only about 0.05-0.13% of the total soil lead
concentration. Lead speciation is rather simple and Pb2+ is the dominant soluble form. It
forms a number of highly insoluble precipitates including Pb (OH)2, Pb3 (PO2)2, and
Pb CO3. Plant uptake factors for lead are low (0.01-0.1) due to very low water solubility.
Due to past uses of lead in industrial processes and consumer products (e.g., paint,
gasoline), urban soils often contain high lead concentrations, up to 1840 mg/kg.
Neurologic problems, especially in children, are the principal concern for chronic lead
exposure (Goyer and Clarkson, 2001). Past uses of lead solder in food and beverage cans
lead to significant human exposures. Dietary intakes of 400 to 500 µg/day dropped to
11
20 µg/day with elimination of this practice. Consumption of lead contaminated soil
itself, rather than crop contamination, is a more likely exposure hazard.
Mercury solubility in soil water and hence mobility in soil systems is quite low
(Steinnes, 1995). Plant accumulation (plant uptake factors of 0.01-0.1) and phytotoxicity
are quite low. The most common chemical species in soils are Hg0 and Hg2+. Long-
range atmospheric transport of mercury, in large part from coal combustion, can
contribute up to 50% of total loading to humus-rich soils. Humic matter forms strong
complexes with Hg2+. In fact, transport of mercury in soil water is largely due to
association with soluble humic matter. Chronic exposure due to consumption of methyl
mercury in fish and other seafood with subsequent neurotoxicity is a human health
concern (Goyer and Clarkson, 2001). Methyl mercury forms in anerobic sediments of
aquatic ecosystems and biomagnifies through trophic transfer to fish. There is no
evidence that this is a significant process in production of agricultural crops.
Nickel is moderately soluble in soil water and as is typically true for metals,
increases at low pH (McGrath, 1995). The predominant soluble species in most
agricultural soils is Ni2+. Nickel sulfides likely control the Ni2+ concentration in soil
solution. The nickel concentrations in plants generally reflect that of their soils and plant
transfer coefficients range from 0.1 to 1.0. Inhalation of nickel during refining of ore
produces respiratory tract cancer, and allergic contact dermatitis to nickel alloys is
common (Goyer and Clarkson, 2001). Aside from these problems, nickel toxicity
appears quite low. It is a nutritionally essential metal for some plants, microbes, and
invertebrates. There is no known biochemical function for nickel in humans. Crop
12
contamination with nickel in fertilizers and related products seems an unlikely human
health problem.
Risk-based Models and Other Approaches for Regulating Heavy Metal Concentrations in
Fertilizers and Related Materials.
Application of risk assessment to setting standards for concentrations of
potentially toxic chemicals in food and other sources of environmental exposure emerged
over 20 yeas ago (Calkins et al., 1980; NRC, 1983). Faustman and Omenn (2001)
summarized the current process of human health risk assessment. The probability of an
adverse health effect was termed risk. A hazard was defined as a substance with intrinsic
toxic properties, which presented risk. Risk assessment was defined as “the systematic
scientific characterization of potential adverse health effects resulting from human
exposures to hazardous agents or situations.” The conduct of a risk assessment included
four steps: (1) Hazard identification indicated whether an agent caused adverse effects.
(2) Dose-response assessment determined the relationship between dose and an adverse
effect. (3) Exposure assessment estimated concentrations and durations of exposure to the
agent. (4) Risk characterization estimated incidence of the adverse effect in a population,
evaluated strength of evidence used underlying the analysis, and defined the degree of
certainty for the analysis. Risk management involved development of regulatory options
based on the outcome of the risk assessment. Stakeholder engagement was viewed as a
critical element for selection of specific options in policy decisions and actions.
Risk assessments that focused on protection of human health were conducted by
two groups of consultants (Foster Wheeler, 1998; Weinberg Group, 2000). Recent
13
analyses adopted procedures developed in a USEPA (1999) risk assessment for heavy
metals in fertilizers (Weinberg, 2001). Final calculations for concentrations of heavy
metals in fertilizers that presented a particular risk were not included in the USEPA
(1999) work. Both the Foster Wheeler (1998) and Weinberg Group (2000) risk
assessments generated maximum concentrations of metals in fertilizers that should not be
exceeded (risk-based concentrations). Foster Wheeler conducted the risk assessment for
arsenic, cadmium, and lead. The Weinberg Group expanded the risk assessment to 12
metals, including arsenic, cadmium, lead, mercury, and nickel. Estimates for the two
critical parameters, plant uptake factors for each metal and metal concentrations in soil
after 50 years of applications (200 years for lead), were necessary to conduct these risk
assessments. Several limitations in modeling transport and fate of heavy metals in
agricultural soils forced application of simplifying assumptions: (1) For any site, fertilizer
application rates and schedules may vary within and between years. (2) Rainfall and
irrigation rates can greatly influence metal mobility and these vary over time within site
and often to an even greater extent between sites. (3) Soil type and management practices
influence metal mobility and vary within and between sites. (4) Uptake of each of the
metals differs between species of plants.
All of the human health risk assessments assume leaching of the metal from soil is
the predominant pathway of loss from the application site. In order for metal uptake
across the plant root to occur the metal must be in soil water solution (Alloway, 1995a).
Therefore, metal solubility in soil water is a key determinant of metal accumulation in
soil (concentration in soil after some series of applications) and plant uptake factor (for
any particular plant and metal). In the human health risk assessments, the ratio of metal
14
concentration in soil-to-metal concentration in soil water (Kd) estimates solubility.
Application of this estimate is an attempt to compensate for the capacity of soils to
absorb metals. Under equilibrium conditions, the Kd remains constant for a given soil
unless absorption sites saturate. Functions like Langmuir absorption isotherms consider
concentration-dependent changes (Alloway, 1995a). The human health risk assessments
assume estimates of Kd as constants.
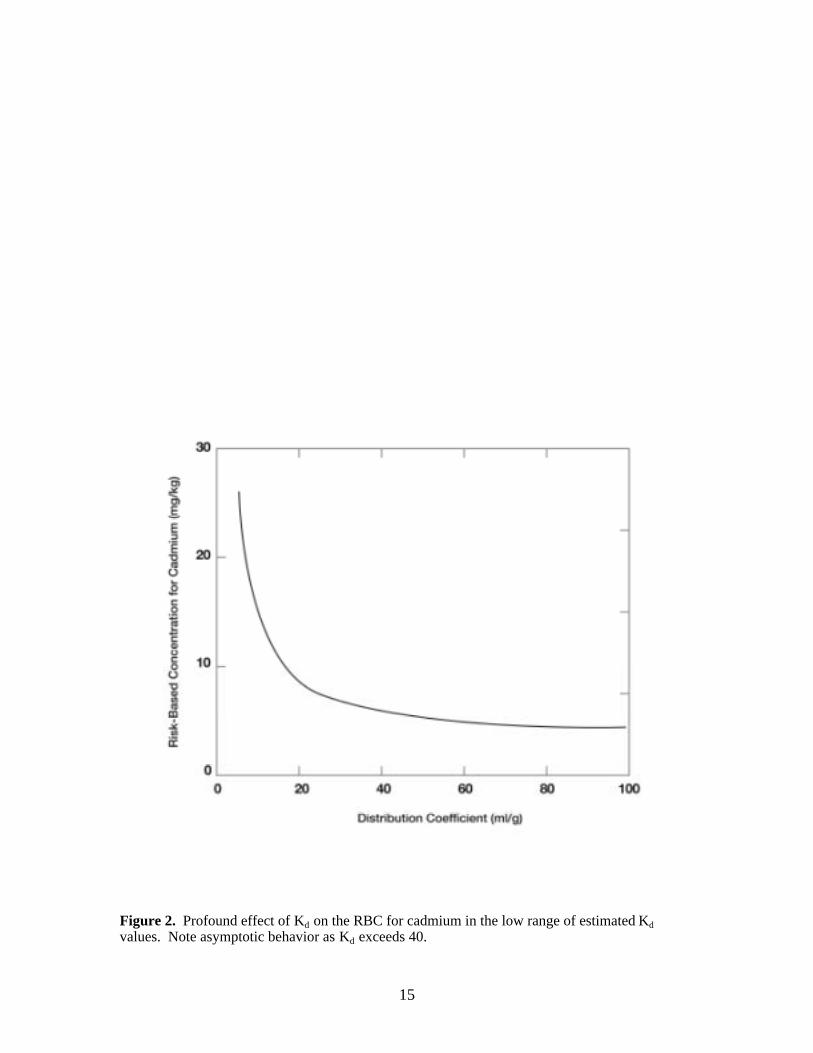
The risk assessment model for heavy metals in fertilizers is extremely sensitive to
Kd. The relationship between risk-based concentrations (RBC) for cadmium in soil and a
range of theoretical Kd values for cadmium clearly illustrates this (Figure 2). The RBC is
extremely sensitive to slight changes in Kd at low to moderate values, while RBCs
become asymptotic at high Kd values. The short duration of laboratory studies that
estimate Kd are typically inadequate for establishing equilibrium conditions because
sorption/desorption kinetics involve fast and slow reactions (Ford et al., 2001; Strawn and
Sparks, 2000). Please refer the first section of this report for a more complete
explanation. Risk assessments use two sets of estimates for Kd values that are derived
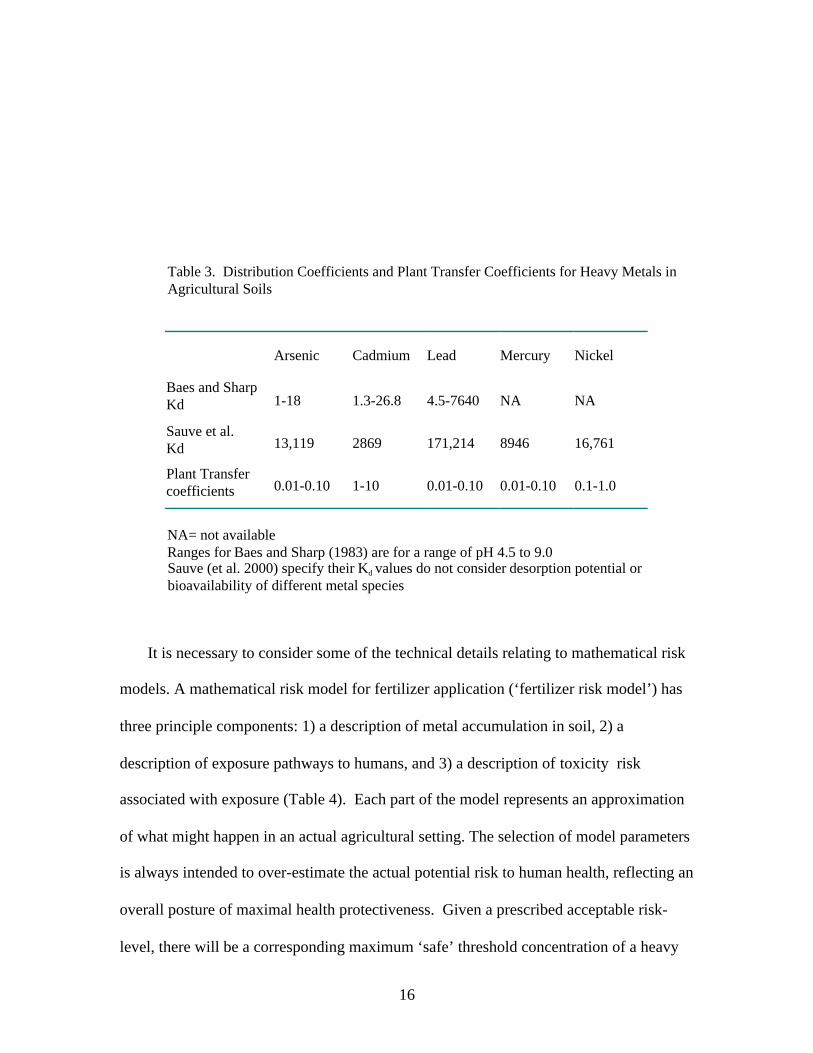
from modeling data from the literature (Baes and Sharp, 1983; Sauve et al., 2000). The
magnitude of differences in Kd value estimates between these two reviews is very large
(Table 3). In the cases of arsenic, cadmium, and lead the differences are a factor of 1000,
100, and 20 respectively. This is clearly a major problem, and is a great contributor to
uncertainty for any risk assessment.
15
Figure 2. Profound effect of Kd on the RBC for cadmium in the low range of estimated Kd
values. Note asymptotic behavior as Kd exceeds 40.
16
Table 3. Distribution Coefficients and Plant Transfer Coefficients for Heavy Metals inAgricultural Soils
Arsenic Cadmium Lead Mercury Nickel
Baes and SharpKd 1-18 1.3-26.8 4.5-7640 NA NA
Sauve et al.Kd 13,119 2869 171,214 8946 16,761
Plant Transfercoefficients 0.01-0.10 1-10 0.01-0.10 0.01-0.10 0.1-1.0
NA= not available Ranges for Baes and Sharp (1983) are for a range of pH 4.5 to 9.0
Sauve (et al. 2000) specify their Kd values do not consider desorption potential orbioavailability of different metal species
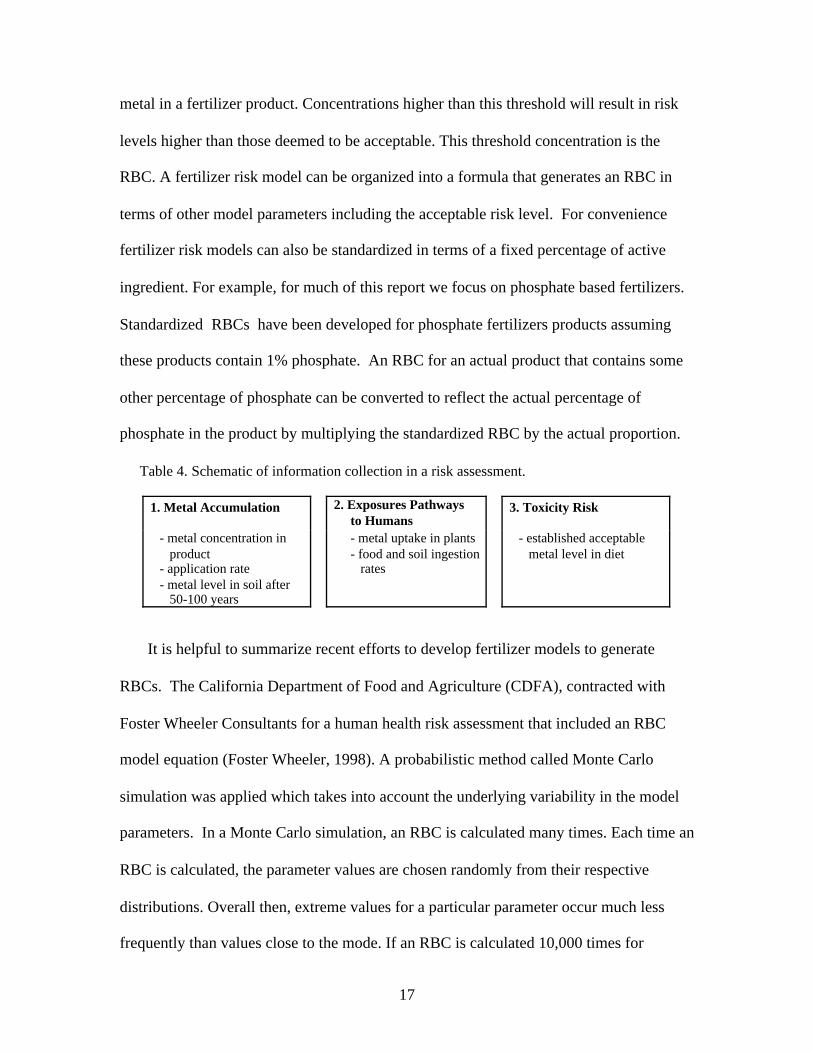
It is necessary to consider some of the technical details relating to mathematical risk
models. A mathematical risk model for fertilizer application (‘fertilizer risk model’) has
three principle components: 1) a description of metal accumulation in soil, 2) a
description of exposure pathways to humans, and 3) a description of toxicity risk
associated with exposure (Table 4). Each part of the model represents an approximation
of what might happen in an actual agricultural setting. The selection of model parameters
is always intended to over-estimate the actual potential risk to human health, reflecting an
overall posture of maximal health protectiveness. Given a prescribed acceptable risk-
level, there will be a corresponding maximum ‘safe’ threshold concentration of a heavy
17
metal in a fertilizer product. Concentrations higher than this threshold will result in risk
levels higher than those deemed to be acceptable. This threshold concentration is the
RBC. A fertilizer risk model can be organized into a formula that generates an RBC in
terms of other model parameters including the acceptable risk level. For convenience
fertilizer risk models can also be standardized in terms of a fixed percentage of active
ingredient. For example, for much of this report we focus on phosphate based fertilizers.
Standardized RBCs have been developed for phosphate fertilizers products assuming
these products contain 1% phosphate. An RBC for an actual product that contains some
other percentage of phosphate can be converted to reflect the actual percentage of
phosphate in the product by multiplying the standardized RBC by the actual proportion.
Table 4. Schematic of information collection in a risk assessment.
1. Metal Accumulation 2. Exposures Pathways to Humans
3. Toxicity Risk
- metal concentration in product- application rate- metal level in soil after 50-100 years
- metal uptake in plants - food and soil ingestion rates
- established acceptable metal level in diet
It is helpful to summarize recent efforts to develop fertilizer models to generate
RBCs. The California Department of Food and Agriculture (CDFA), contracted with
Foster Wheeler Consultants for a human health risk assessment that included an RBC
model equation (Foster Wheeler, 1998). A probabilistic method called Monte Carlo
simulation was applied which takes into account the underlying variability in the model
parameters. In a Monte Carlo simulation, an RBC is calculated many times. Each time an
RBC is calculated, the parameter values are chosen randomly from their respective
distributions. Overall then, extreme values for a particular parameter occur much less
frequently than values close to the mode. If an RBC is calculated 10,000 times for
18
example, a listing of all of these 10,000 values forms a frequency distribution. For an
RBC value such that 9,000 are above this value and the remaining 1,000 are below this
value, then this RBC value should be health protective in approximately 90 percent of
cases where fertilizers are being applied. This value defines the 90th percentile for the
RBC frequency distribution. Other percentiles can be determined in a similar fashion.
Using the resulting inferred distribution for the RBCs, CDFA set RBC values for three
metals corresponding to the 90th percentile for each metal.
In 2000 The Fertilizer Institute (TFI) contracted with the Weinberg Group to
developed RBCs for twelve metals . The RBC model equation was essentially the same
as that used by CDFA, but, instead of a probabilistic approach, TFI used a deterministic
approach, using ‘high-end’ point estimates for the model parameters. The point estimates
used were upper 95% confidence limits for the means of the model parameters. The idea
was to ensure that the resulting RBCs would be health protective in many cases where the
model parameters are higher than average. The two methods (probabilistic and
deterministic) yielded RBC values similar to one another for the three metals examined in
the CDFA report.
In 2001, TFI and CDFA consultants collaborated and refined the RBCs for twelve
metals. For this effort the important Kd and plant uptake factor (PUF) data were revised.
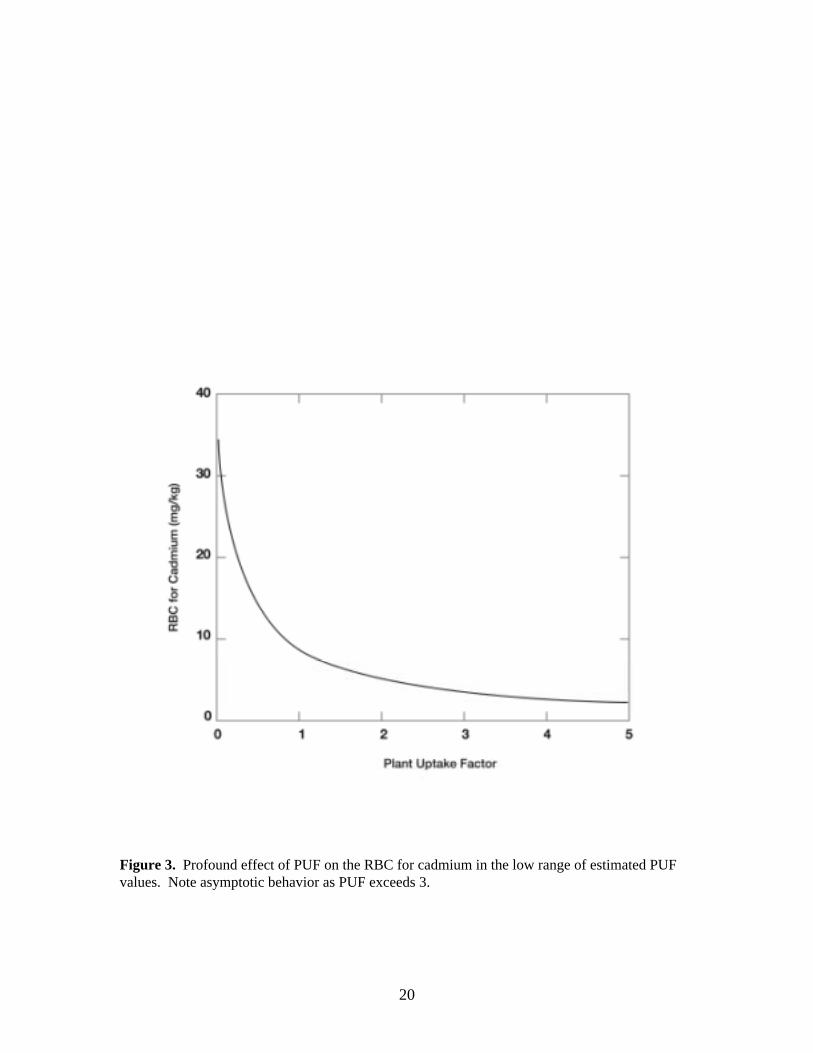
RBC values were very sensitive to changes in Kd (Fig. 2) and PUF (Fig. 3) values. For
this new effort they used recent data from the U.S. Environmental Protection Agency
(USEPA 1999), thought to be more broadly representative of agricultural settings than
those drawn from the previous data set. The Kd and PUF values were negatively
correlated. That is, high Kd values tend to be associated with low PUF values and vice-
19
versa. RBCs were generated using the probabilistic Monte Carlo simulation process
described above. The negative correlation between Kd and PUF values was considered in
that they were treated as pairs (as opposed to being randomly selected individually and
independently) during the Monte Carlo simulation process.
RBC values derived from the original data and revised paired data can be determined
for any specified percentile. The Weinberg Group (2001) compared RBCs calculated
using the Foster Wheeler (1998) and USEPA (1999) data. The Foster Wheeler (1998)
data defined upper bound conditions and the USEPA (1999) data defined lower bound
conditions for the relationship between RBC and risk percentile. They suggested the
mid-point between the upper and lower bound conditions as a basis for setting standards.
A number of simulations were performed with point estimates for risk assessment
model parameters. As discussed at the beginning of this section, fertilizer risk models are
highly sensitive to Kd ( Fig. 2) and plant uptake factor PUF values (Fig. 3). In both cases
the values not being varied are fixed at ‘high end’ point estimates. There is a high degree
of variability in the Kd and PUF data, and hence a large degree of uncertainty about what
is actually happening in ‘real life’ agricultural settings.
20
Figure 3. Profound effect of PUF on the RBC for cadmium in the low range of estimated PUFvalues. Note asymptotic behavior as PUF exceeds 3.
21
Under current modeling assumptions leaching is the principle dissipation mechanism
for metals in soils and the degree of leaching is controlled by the Kd parameter. The metal
loss parameter Ks, appearing in the exponent in fertilizer risk models is a function of the
Kd parameter. Thus the Kd parameter is a critical component of the part of the model that
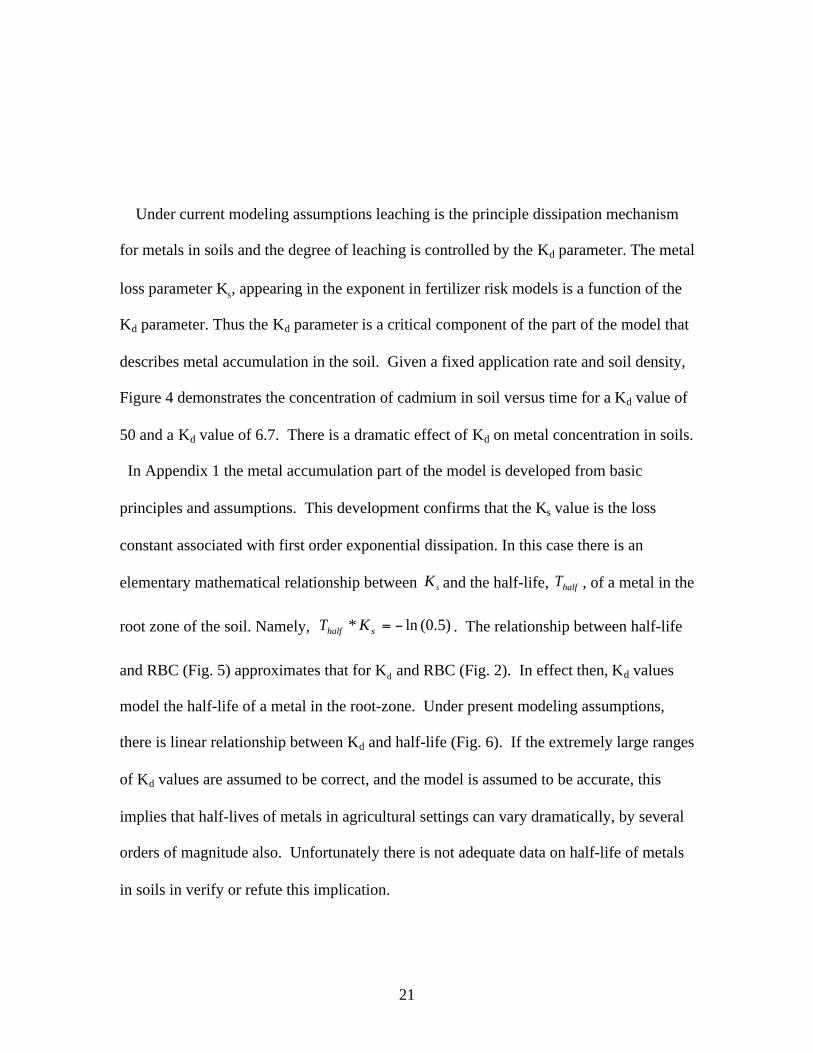
describes metal accumulation in the soil. Given a fixed application rate and soil density,
Figure 4 demonstrates the concentration of cadmium in soil versus time for a Kd value of
50 and a Kd value of 6.7. There is a dramatic effect of Kd on metal concentration in soils.
In Appendix 1 the metal accumulation part of the model is developed from basic
principles and assumptions. This development confirms that the Ks value is the loss
constant associated with first order exponential dissipation. In this case there is an
elementary mathematical relationship between sK and the half-life, halfT , of a metal in the
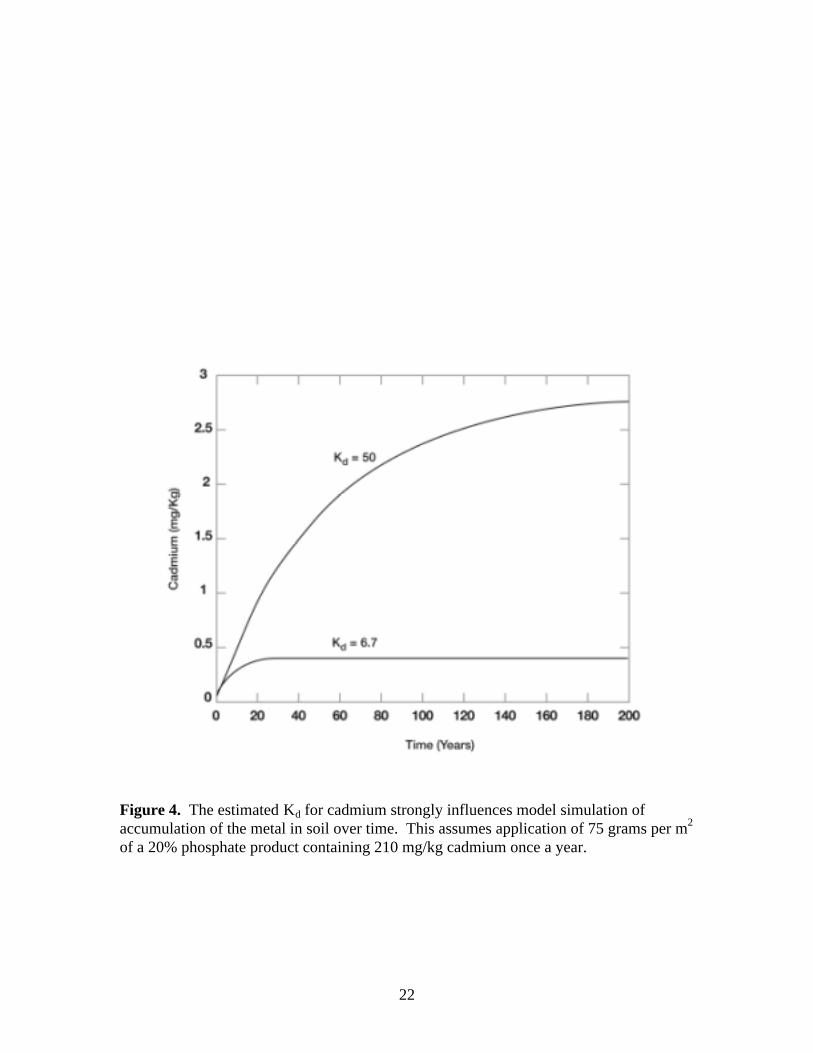
root zone of the soil. Namely, )5.0(ln* −=shalf KT . The relationship between half-life
and RBC (Fig. 5) approximates that for Kd and RBC (Fig. 2). In effect then, Kd values
model the half-life of a metal in the root-zone. Under present modeling assumptions,
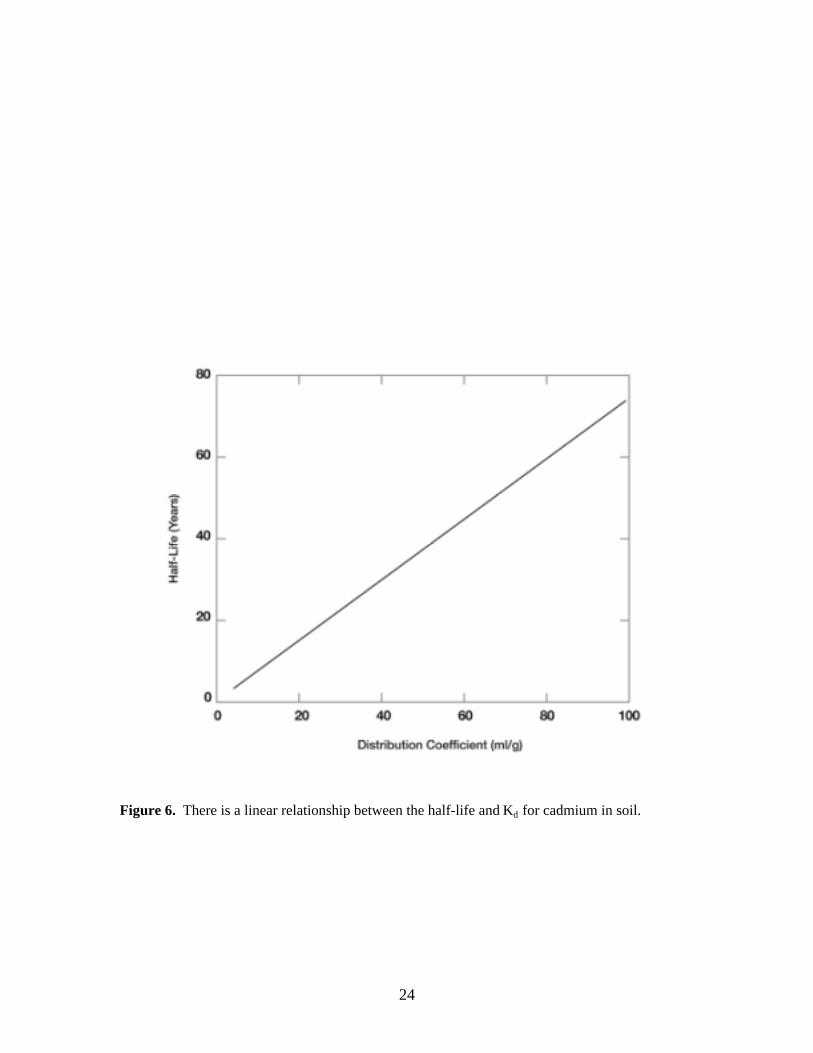
there is linear relationship between Kd and half-life (Fig. 6). If the extremely large ranges
of Kd values are assumed to be correct, and the model is assumed to be accurate, this
implies that half-lives of metals in agricultural settings can vary dramatically, by several
orders of magnitude also. Unfortunately there is not adequate data on half-life of metals
in soils in verify or refute this implication.
22
Figure 4. The estimated Kd for cadmium strongly influences model simulation ofaccumulation of the metal in soil over time. This assumes application of 75 grams per m2
of a 20% phosphate product containing 210 mg/kg cadmium once a year.
23
Figure 5. Demonstration that the relationship between half-life for cadmium in soil andRBC is essentially identical to the Kd/RBC relationship.
24
Figure 6. There is a linear relationship between the half-life and Kd for cadmium in soil.
25
The human health risk assessment available for metals in fertilizers yield RBCs that
do not allow more than one-in-one hundred thousand (105) excess risk for exposures to
arsenic, cadmium, lead, mercury, and nickel in soils. Of these metals, arsenic is unique
in that it presents cancer risk for exposure pathways relevant to soil. The excess risk
allowable for carcinogens is typically one-in-one million (106). Adjustment of the risk
assessment for arsenic to the 106 excess risk level reduces the RBC by a factor of 10. The
Weinberg (2001) work proposes a RBC for arsenic at 105 excess risk and allows 260
mg/kg arsenic in a 20% phosphate product. Application of the 106 excess risk factor
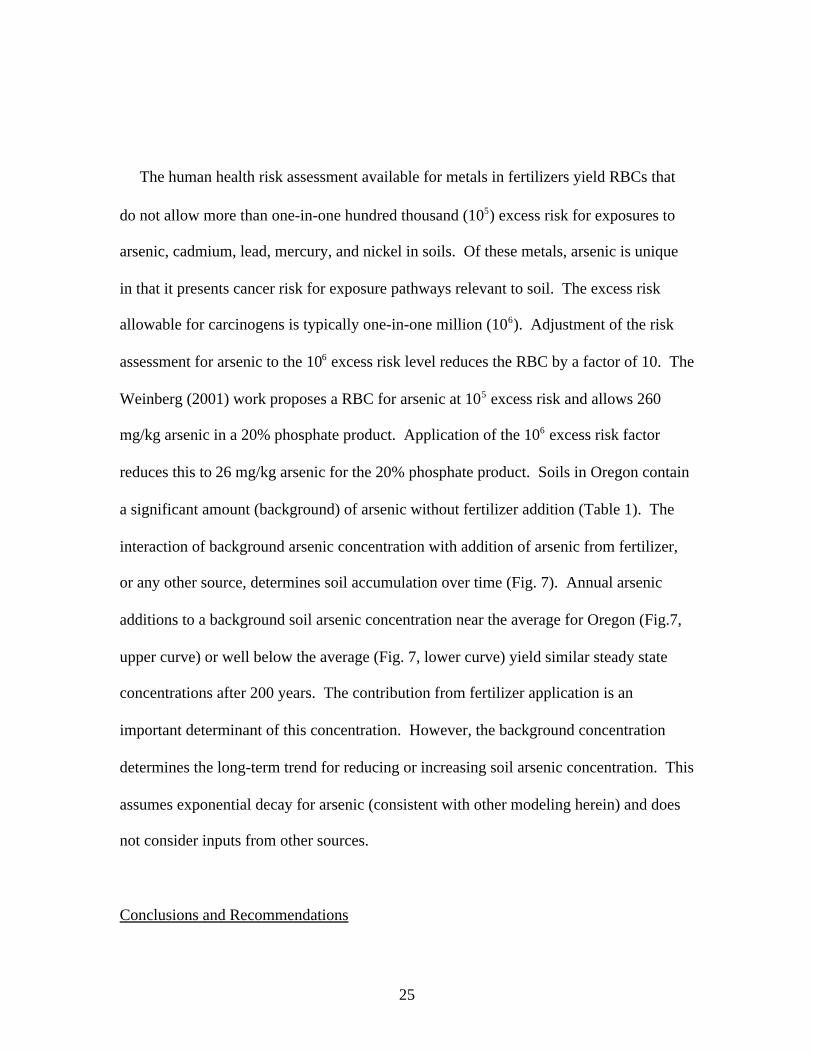
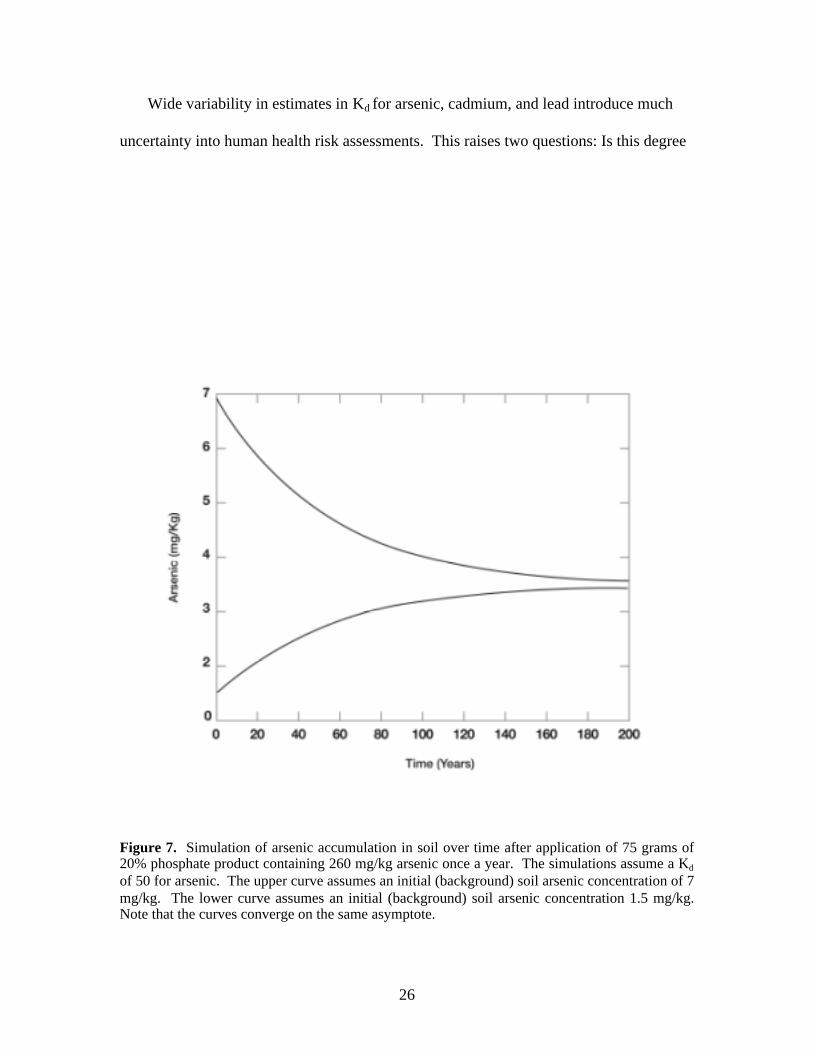
reduces this to 26 mg/kg arsenic for the 20% phosphate product. Soils in Oregon contain
a significant amount (background) of arsenic without fertilizer addition (Table 1). The
interaction of background arsenic concentration with addition of arsenic from fertilizer,
or any other source, determines soil accumulation over time (Fig. 7). Annual arsenic
additions to a background soil arsenic concentration near the average for Oregon (Fig.7,
upper curve) or well below the average (Fig. 7, lower curve) yield similar steady state
concentrations after 200 years. The contribution from fertilizer application is an
important determinant of this concentration. However, the background concentration
determines the long-term trend for reducing or increasing soil arsenic concentration. This
assumes exponential decay for arsenic (consistent with other modeling herein) and does
not consider inputs from other sources.
Conclusions and Recommendations
26
Wide variability in estimates in Kd for arsenic, cadmium, and lead introduce much
uncertainty into human health risk assessments. This raises two questions: Is this degree
Figure 7. Simulation of arsenic accumulation in soil over time after application of 75 grams of20% phosphate product containing 260 mg/kg arsenic once a year. The simulations assume a Kd
of 50 for arsenic. The upper curve assumes an initial (background) soil arsenic concentration of 7mg/kg. The lower curve assumes an initial (background) soil arsenic concentration 1.5 mg/kg.Note that the curves converge on the same asymptote.
27
of uncertainty “real” in that it reflects variability in soil chemistry that determines
sorption/desorption kinetics? Is this degree of uncertainty an artifact and problematic due
to limitations in estimation of Kd with a variety of different methods? We recommend
implementation of a monitoring program for metals in agricultural soil, surface waters,
and harvested crops. The heavy metal analyses of soil over a five year period can
provide estimates of half-lives that can directly address problems inherent to use of Kd.
Analyses of surface waters directly determines compliance with water quality standards.
Measurements in crops assess validity of plant uptake factors, an important component of
the human health risk assessments.
While Oregon Department of Agriculture can generate new data for assuring
protection of human health and natural resources other valuable information is under
development. Dr. Andrew Chang of University of California at Riverside is conducting a
major study of mass balance of heavy metals in agricultural soils. No data is currently
available. However, initial results will be available within a year. These field-based
studies will provide valuable estimates of accumulation and loss pathways for heavy
metals in high intensity agricultural systems, and very low management natural lands and
forage systems. This design of these studies is consistent with the half-life work
proposed above, and should be considered in conjunction with work done in Oregon.
The Oregon Department of Agriculture is responsible for setting standards for
arsenic, cadmium, lead, mercury, and nickel in fertilizers and related products in 2002.
28
Decision making is necessary before data from the two recommendations above are
available. There is an important line of evidence that provides guidance for development
of standards using the risk assessments currently available. First, the heavy
metal concentrations in our food supply is not increasing. Human dietary intake of
arsenic, cadmium, and lead is on a declining trajectory for 1976-1991 (Johnson et al.,
1984a,b: Podebarac et al., 1984a,b: Gundersun, 1995). For example, the estimate for
daily adult intake of arsenic for 1977 is 75 µg/day and that for 1986-1991 is 25 µg/day.
In the case of cadmium, the 1977 estimate is about 36 µg/day and the estimate for 1986-
1991 is about 13 µg/day. This does not support the contention that increasing soil and
crop heavy metal concentrations present immediate human health risk that requires strict
regulatory action. While an immediate problem is not evident, reliable estimates of
heavy metal input and output fluxes are necessary to accurately estimate sustainability of
agricultural soil quality after repeated fertilizer applications. Recent results for Swiss
agricultural soils identify sources and losses that contribute to regional net fluxes for
cadmium and zinc (Keller et al., 2002). In the Sundgau region of Switzerland about 18%
of total cadmium input is from commercial fertilizers, while 67% of input is atmospheric.
The remaining inputs are from applications of manure and biosolids. The estimate of
total annual output (in crops plus leaching) is 58% of total input. This is more output
than risk assessment using high range Kd estimates predict. It is unlikely that sources of
heavy metals for Oregon soils closely approximate those of the Sundgau region. None-
the-less, the results of this work reinforce the value of actual field data in understanding
heavy metal accumulation in agricultural soils. Until such information is available, it is
29
reasonable to adopt standards that are a comprise between RBCs generated with high and
low Kd estimates.
References
Alloway, B.J. 1995a. Soil processes and the behavior of heavy metals. In, Heavy Metals
in Soils, Second Edition (B.J. Alloway, ed.) Blackie, New York. Pages 11-37.
Alloway, B.J. 1995b. Cadmium In, Heavy Metals in Soils, Second Edition (B.J. Alloway,
ed.). Blackie, New York. Pages 122-151.
Bates, C.F. and R.D. Sharp. 1983. A proposal for estimation of soil leaching and leaching
constants for use in assessment models. J. Environ. Qual. 12: 17-28.
Boerngen, J. and J. Shackette. 1981. Chemical analyses of soils and other surficial
materials of the conterminous United States. United States Geological Survey
Report 81-197.
Culkins, D.R., R.L. Dixon, C.R. Gerber, et al. 1980. Identification, characterization, and
control of potential human carcinogens: A framework for federal decision-
making. J. Natl. Cancer Inst. 61: 169-175.
Davies, B.E. 1995. Lead In, Heavy Metals in Soils, Second Edition (B.J. Alloway, ed.).
Blackie, New York. Pages 206-223.
Faustman, E.M. and G.S. Omenn. 2001. Risk Assessment In, Casrett and Doull’s
Toxicology: The basic science of poisons, Sixth Edition (C.D. Klaasen, ed.).
McGraw-Hill, New York. Pages 83-104.
30
Ford, R.G., A.C. Scheinost, and D.L. Sparks. 2000. Frontiers in metal
sorption/precipitation mechanisms on soil mineral surfaces. Adv. Agronomy 74:
41-62.
Foster Wheeler Environmental Corporation. 1998. Development of risk-based
concentrations for arsenic, cadmium, and lead in inorganic commercial fertilizers.
Sacramento, CA.
Goyer, R.A. and T.W. Clarkson. 2001. Toxic effects of metals. In, Casarett and Doullis
Toxicology: The Basic Science of Poisons, Sixth Edition (C.D. Klaassen, ed.)
Mc-Graw-Hill, New York. Pages 811-867.
Gunderson, E.L. 1995. FDA total diet study, July 1986-April 1991, dietary intake of
pesticides, selected elements, and other chemicals. J. Assoc. Offic. Anal.Chem.
Int’l. 78: 1353-1363.
Holmgren, G., M. Meyer, R. Chaney, and R. Daniels. 1993. Cadmium, lead, zinc, copper,
and nickel in agricultural soils of the United States of America. J. Environ. Qual.
22: 335-0348.
Johnson, R.D., D.D. Manske, D.H. New, and D.S. Podrebarac. 1984a. Pesticide, heavy
metal, and other chemical residues in infant and toddler total diet samples. (iii).
August 1976-September 1977. J. Assoc. Off. Anal. Chem. 67: 145-154.
Johnson, R.D., D.D. Manske, D.H. New, and D.S. Podrebarac. 1984b. Pesticide, heavy
metal, and other chemical residues in adult total diet samples. (XIII). August
1976-September 1977. J. Assoc. Off. Anal. Chem. 67: 154-166..
31
Keller, A., K.C. Abbaspour, and R. Schulin. 2002. Assessment of uncertainty and risk in
modeling regional heavy-metal accumulation in agricultural soils. J. Environ.
Qual. 31: 175-187.
McGrath, S.P. 1995. Chromium and nickel. In, Heavy Metals in Soils, Second Edition
(B.J. Alloway, ed.). Blackie, New York. Pages 152-178.
NRC. 1983. Risk assessment in the federal government: Managing the process. National
Academy Press, Washington, DC.
O’Neill, P. 1995. Arsenic. In, Heavy Metals in Soils, Second Edition (B.J. Alloway, ed.).
Blackie, New York. Pages 105-121.
Podrebarac, D.S. 1984a. Pesticide, heavy metal, and other chemical residues in infant and
toddler total diet samples (IV). October 1977-September 1998. J. Assoc. Off.
anal. Chem. 67: 166-175.
Podrebarac, D.S. 1984b. Pesticide, heavy metal, and other chemical residues in adult total
diet samples (XIV). October 1977-September 1998. J. Assoc. Off. anal. Chem.
67: 176-185.
Sauve, S., W. Hendershot, and H.E. Allen. 2000. Solid-solution partitioning of solution
of metals in contaminated soils: dependence in pH, total metal burden, and
organic matter. Environ. Sci. Technol. 34: 1125-1131.
Strawn, D.G. and D.L. Sparks. 2000. Effects of soil organic matter on the kinetics and
mechanisms of Pb (II) sorption and desorption in soil. Soil Sci. Soc. Am. J. 64:
144-156.
Steinnes, E. 1995. Mercury. In, Heavy Metals in Soils, Second Edition (B.J. Alloway,
ed.) Blackie, New York. Pages 245-259.

32
United States Environmental Protection Agency. 1986. Office of Water Regulations and
Standards. EPA 440/5-86-001.
United States Environmental Protection Agency. 1999. Estimating risk from
contaminants contained in agricultural fertilizers. EPA 68-W-98-0085.
Washington State Department of Agriculture. 2000. Rules relating to fertilizers, minerals
and limes effective October 19, 2000. Olympia, WA.
Weinberg Group Inc. 2000. Health risk evaluation of select metals in inorganic fertilizers
post application. Washington, DC.
Weinberg Group Inc. 2001. Scientific basis for risk-based acceptable concentrations of
metals in fertilizers and their applicability as standards. Washington, DC.
APPENDIX 1
We derive an expression for the amount, A (weight), of some material
accumulated on a parcel of land as a function of the annual application rate, AR (weight
of the applied material per year), and the number of years,T , that the material has been
applied. We assume that the material is deposited uniformly over this parcel of land with
each application. Note that an expression for concentration could be obtained by simply
dividing A by the weight of the affected soil. Suppose there are n equal sized applications
per year, equally spaced throughout the year. If the material were applied monthly, for
example, n would be equal to twelve. Then the amount material applied with each
application is n
AR , and, assuming a first order exponential loss with loss constant k ,
the amount of accumulated material immediately after the second application will be,
n
AR
n
k
n
ARA +
−= exp* . (1)

33
Note that the first term on the right-hand side of (1) describes the amount of material that
remains from the initial (first) application and the second term describes the amount of
material just deposited by the second application.
In order to make the following development easier to follow, we define n
ARB = , and
−=n
ka exp . The expression in (1) above can now be written more compactly as,
BBaA += *
)1(* += aB .
Similarly, just after the third application the amount of accumulated material is,
BBBaaA ++= )*(*
)1(* 2 ++= aaB
This pattern continues for subsequent applications so that just after the thm )1( +
application, the amount of accumulated material is,
)1(* 1 ++++= − aaaBA mm L (2)
−
−=
+
1
1*
1
a
aB
m
.
The last equality arises from fact that the right-hand side of (2) is a geometric series.
After T years there will have been nT * applications, so letting nTm *= in the above
34
expression, and, using the full expressions for B and a , we obtain an expression for A
that depends on T , n , AR , and k ,
1)/exp(
1)/*exp(*
−−
−−−=
nk
nkTk
n
ARA . (3)
The expression in (3) can be simplified by making the assumption that the material is
continuously applied, which corresponds to letting n approach infinity. Letting n
approach infinity and applying limit rules from calculus we obtain,
k
TkARA
))*exp(1(* −−= (4)
The right-hand side of (4) is a familiar expression in the formulas for risk-based
concentrations that appear in the reports cited in this report. The important structural
observation is that the loss constant k corresponds to the loss constant K5 appearing in
the exponent in the formulas for risk-based concentrations. Then, as discussed in the
main body of this report, we can make direct connection between the half-life of a given
material and the value of sK , and thus infer a connection between half-life and Kd
(dissociation constant) values for the metals discussed in this report.