Embed Size (px)
Citation preview

The Science of the Total Environment 301(2003) 119–138
0048-9697/03/$ - see front matter� 2002 Elsevier Science B.V. All rights reserved.PII: S0048-9697Ž02.00295-4
Heavy metal contamination in the Taimyr Peninsula, SiberianArctic
S.M. Allen-Gil *, J. Ford , B.K. Lasorsa , M. Monetti , T. Vlasova , D.H. Landersa, a b c d e
aDepartment of Fisheries and Wildlife, Oregon State University, Corvallis, OR 97331, USAbBatelle Marine Science Laboratories, 1529 W. Sequim Rd., Sequim, WA 98382, USA
cDepartment of Energy, Environmental Measurements Laboratory, 201 Varick St., New York, NY 10014, USAdExtreme North Research Institute, Komosomolskaya Str. 1, 663302 Norilsk, Russia
eEPA-NHREEL, 200 SW 35th Street, Corvallis, OR 97333, USA
Received 23 May 2001; accepted 5 July 2002
Abstract
The Taimyr Peninsula is directly north of the world’s largest heavy metal smelting complex(Norilsk, Russia).Despite this proximity, there has been little research to examine the extent of contamination of the Taimyr Peninsula.We analyzed heavy metal concentrations in lichen(Cetraria cucullata), moss(Hylocomium splendens), soils, lakesediment, freshwater fish(Salvelinus alpinus, Lota lota and Coregonus spp.) and collared lemming(Dicrostonyxtorquatus) from 13 sites between 30 and 300 km from Norilsk. Element concentrations were low in bothC. cucullataand H. splendens, although concentrations of Al, Fe, Cu, Ni and Pb were significantly higher than those in ArcticAlaska, probably due to natural differences in the geochemical environments. Inorganic surface soils had significantlyhigher concentrations of Cd, Zn, Pb and Mg than inorganic soils at depth, although a lake sediment core from theeastern Taimyr Peninsula indicated no recent enrichment by atmospherically transported elements. Tissue concentra-tions of heavy metals in fish and lemming were not elevated relative to other Arctic sites. Our results show that theimpact of the Norilsk smelting complex is primarily localized rather than regional, and does not extend northwardbeyond 100 km.� 2002 Elsevier Science B.V. All rights reserved.
Keywords: Arctic; Metals; Vegetation; Fish; Sediment; Russia
1. Introduction
Evidence of heavy metal pollution in the Arcticenvironment has been accumulating for the past20 years. During this period, Arctic scientists havegathered information on heavy metal contamina-
*Corresponding author. Biology Department, Ithaca College,Ithaca, NY 14850, USA. Tel.yfax: q1-431-879-2994.
E-mail address: [email protected](S.M. Allen-Gil).
tion in air, snow, soils, sediment, vegetation, fish,mammals and humans to form a picture of wide-spread contamination(see Sci Total Environ, 1995vol 160y161). While many Arctic inland ecosys-tems have naturally high concentrations of heavymetals, they may be further enriched by atmos-pheric deposition from distant anthropogenicsources. The non-ferrous metal industry is theprimary anthropogenic source for cadmium, cop-

120 S.M. Allen-Gil et al. / The Science of the Total Environment 301 (2003) 119–138
per, lead, nickel, arsenic, selenium and zinc(Pacy-na, 1995). Oil combustion is the major source foratmospheric nickel and vanadium, while coal com-bustion accounts for the majority of atmosphericmercury emissions(Pacyna, 1995).
It is estimated that anthropogenic sources inEurope and Russia contribute more than 50% ofheavy metals in Arctic air samples(Arctic Moni-toring and Assessment Program, 1997). As thelargest heavy metal smelting complex in the world,the Norilsk metallurgical complex on the TaimyrPeninsula may account for a high percentage ofthese emissions. Commencing operation in the1930s, the Norilsk mining and smelting complexis the largest nickel producer in the world, supply-ing the former Soviet Union with 2y3 of its supply(Klein and Vlasova, 1992). Norilsk smelters emitapproximately 4 000 000 t of atmospheric pollut-ants annually(Vlasova et al., 1991; Blais et al.,1999), including over 2700 t of Cu and 1200 t ofNi (Revich, 1995). For Ni, this represents over 2y3 of the emissions from northern former USSR(Pacyna, 1995).
Evaluation of heavy metal contamination asso-ciated with the Norilsk smelters has been limitedby the inaccessibility of the region. As a conse-quence, there are very few reports on the environ-mental contamination of the Taimyr Peninsula inthe peer-reviewed literature. Blais et al.(1999)reported elevated Cu and Ni concentrations in thesurface sediments of lakes within a 60 km radiusfrom the Norilsk smelters. A similar geographicextent of ecological impact was reported by Vla-sova et al. (1991), who estimated that over500 000 ha(extending 80 km) were affected bythe Norilsk smelters, with the near complete elim-ination of trees and lichens within a 300 000 hazone to the south and south-east, and moderatepollution damage to the north and west of Norilsk.Contaminant-induced reproductive impairment offish was evident in seven freshwater fish speciescollected from the Noril–Pyasina system on theTaimyr Peninsula(Chebotareva et al., 1997). Thehuman population of Norilsk is also affected bythe high emission rates; more than half of theambient air samples taken in Norilsk exceeded themaximum allowable concentrations for Cu and Ni,
and it is believed that air pollution is a majorcause of the high rates of respiratory diseasesobserved in children living in Norilsk(Revich,1995).
The US Environmental Protection Agency(EPA) Arctic Contaminant Research Program(ACRP) collaborated with the Far North Agricul-tural Research Center in Norilsk to investigate thedistribution of heavy metals in the Taimyr Penin-sula. This research focused on two specific objec-tives: (1) to document levels and spatial extent ofheavy metal contamination on the Taimyr Penin-sula; and (2) to evaluate the contribution ofanthropogenic activities to these concentrationsusing soil and sediment chronologies. Sediment,soil, vegetation, fish and small mammal tissuesamples were collected from 13 sites dispersedthroughout the Taimyr Peninsula(Fig. 1).
2. Methods
2.1. Site selection
Our goal in selecting sites for terrestrial sam-pling was to visit a transect of sites running N toS and SW to NE, generally anchored to the southby the city of Norilsk. An unstratified probabilitysample design was developed for this study. Brief-ly, a grid of approximately 2500-km hexagons2
was placed on the Taimyr Peninsula using themethods of White et al.(1992). One location waspreselected that had been previously studied aspart of the International Geosphere–Biosphere Pro-gram (IGBP). For the remaining sites, hexagonswere subjectively chosen and the related randomlychosen sampling points within each of them wereidentified to complete the desired transects. Thesample strategy was constrained to ensure that oneof the sampling sites would fall on the north sideof the Byrranga mountain range. Sampling siteswere located in the field by helicopter using anonboard global positioning system(GPS). Thissampling was supplemented by additional vegeta-tion samples taken near both 1993 field camps(sites 4 and 11), and at two sites visited opportun-istically in 1991(sites 8 and 9).

121S.M. Allen-Gil et al. / The Science of the Total Environment 301 (2003) 119–138
Fig. 1. Sampling locations for 1991 and 1993 field expeditions to the Taimyr Peninsula, Russia.
2.2. Sample collection
Samples were collected during the summer of1993. Site descriptions and sampling matrices areprovided in Table 1. The intensity and location ofsampling varied among the sampling matrices(soil, sediment, vegetation, fish and small mam-mals). Soil cores were taken at five sites. Lichens(C. cucullata and C. islandica) and mosses(H.splendens and R. lanuginosum) were collected ateight sites (supplemented by two 1991 collec-tions), although not all species were present at allsites. In association with vegetation sampling,inorganic soil(surface and near-surface) sampleswere taken at seven sites. Fish(Arctic charr,Salvelinus alpinus, whitefish,Coregonus spp., andburbot,Lota lota) were collected from four lakes.Sediment cores were obtained from two lakes,although one was deemed unsatisfactory for inter-pretation based on Pb and Cs profiles. Col-210 137
lared lemmings (Dicrostonyx torquatus) werecollected at two sites. All samples were stored
cold or frozen and then shipped by air to BattelleMarine Sciences Laboratory upon re-entry to theUS.
2.2.1. Vegetation and soilsVegetation sampling focused on lichens(C.
cucullata andC. islandica) and mosses(H. splen-dens andR. lanuginosum). Both lichens and moss-es are commonly used in studies of atmosphericdeposition of heavy metals(Puckett and Finegan,1980; Ruhling, 1994) as they generally do not¨have roots or vascular systems, so active uptakefrom soils is minimized. OnlyC. cucullata andH.splendens were sufficiently well distributed andabundant to sample efficiently at 50% of our studysites. The mossH. splendens is favored for studiesof atmospheric deposition(e.g. Ruhling, 1994)¨because the annual growth increments can beeasily identified in the field, permitting preciseidentification of exposure duration. Patterns ofuptake and sequestration of elements have been

122S.M
.A
llen-Gil
etal.
/T
heScience
ofthe
TotalE
nvironment
301(2003)
119–138Table 1Descriptions of sites for soil and vegetation sampling on Taimyr Peninsula, 1993
Map Place name Matrices collecteda Latitude Longitude Elev- Setting ACRPsite
VE SS SL SD BB CH WF LM(N) (E) ation site
no (m)b noc
1 Lake Maloye X 688 189 420 898 329 110 73 Lowland drainage lake connected toLake Khantayskoye
2 Pyasina River X X 708 069 210 888 209 550 30d On top of bluff adjacent to Pyasina River; 88(Larix, Betulonana, Salix, Vaccinium, Eriophorum)collections made in open areas with no forest cover,away from frost boils associated with vehicular tracks
3 Siberia�2 X X X 738 039 150 828 249 030 150 Very dryDryas fell-field hilltop in low mountains 874 Lake Nyagamya X X X X 728 429 300 888 209 000 70 Small ridge SE of lake, mesic graminoid 85
herbaceous vegetation5 Lake Bol’shaya, X 738 059 000 898 509 000 73 Headwater lake in upland area
Lvungfada6 Siberia�4 X X X 728 409 000 918 309 000 25 Tussock tundra, between confluence of two forks 86
of the Pyasina River, triangulation towers nearby;wet site; collections generally from drier hummocks;near IBP site
7 Siberia 8A X X X 738 319 380 998 049 460 340 Rolling tundra landscape, just upslope ofSphagnum 84wetland
8 Norayc River, X 728 299 000 1018 449 000 150e Low hilltop 1.5 km from Novaya River to south 98Ary-Mas
9 Kotu River, X 718 329 000 1028 519 000 75e Hilltop in Larix, Ledum palustre, 99Estilyakh Vaccinium vitis-idea, V. uliginosum
10 Siberia�6 X 758 419 080 1008 399 040 230 Frost shattered outcrop N of Gorby Byrranga; 83bare soil polygons
11 Baikada River, X X X 748 499 460 1068 089 580 250 Hummocky bluffs at east end of L. Taimyr 81Field Camp (Bikada Base Campymusk ox research station)
12 Siberia�7 X X X 748 569 400 1098 269 330 410 Rolling tundra just south of mountains 8213 Lake 748 339 100 1098 069 310 70 Drainage lake in low elevation coastal plain
Khutudaturku X X
Matrices codes: VE, vegetation; SS, surface soils; SL, soil core; SD, sediment core; BB, burbot, CH, charr; WF, whitefish; and LM, lemming.a
Elevation derived from altimeter.b
Corresponding site numbers as referenced in Ford et al.(1997).c
Elevation derived from topographical map.d
Sediment core discarded.e

123S.M. Allen-Gil et al. / The Science of the Total Environment 301 (2003) 119–138
studied in detail forH. splendens (e.g. Ruhling¨and Tyler, 1970; Ross, 1990).
Vegetation samples were collected, dried andpackaged in the field for subsequent laboratoryanalysis following the protocols of Ford et al.(1995). This resulted in pooled samples for eachspecies of;3 g dry weight at each site. Voucherspecimens from each site were checked for taxo-nomic accuracy by B. Murray(University ofAlaska–Fairbanks); no misidentifications werefound.
Inorganic surface soils exposed by cryogenicactivity were collected to establish a fingerprint oflocal lithology. Inorganic surface soils were pooledfrom five such frost-worked areas at each site tocapture local soil heterogeneity. All soil under a9=9-cm cutting template was excavated to a2
depth of 2 cm. The five samples were pooled,mixed, subsampled into a pre-cleaned I-Chem�glass jar, and stored dark and cool until shipment.One site visited prior to the establishment of thesurface soil protocol is represented by a singlesubsurface increment(2–4 cm) of inorganic soil.
Soil cores were retrieved at five sites(Table 1).At each site we identified a homogeneous area ca.25 m , defined a 5-m transect, and collected 102
soil cores(one every 0.5 m) down to 30 cm orpermafrost, whichever came first. Cores wereincrementally collected using stainless steel soilcutters of increasing length(vegetationqsoils to5, 5–10, 10–15, 15–20 and 20–30 cm). Same-depth increments of all cores at a site were pooled,mixed, subsampled into a pre-cleaned I-Chem�glass jar, and stored dark and cool until shipment.
2.2.2. FishFish were collected from four lakes(Table 1)
by gill net or hook and line. All charr and whitefishsamples were obtained in conjunction with subsis-tence harvesting; burbot were obtained from acommercial harvesting operation. In all cases, netswere frequently checked and only live fish weresampled. Sex, weight and length were recorded.Whole livers were removed, weighed, divided fororganic and inorganic analysis and transferred topre-cleaned I-Chem� jars and acid-cleaned boro-silicate vials with Teflon screw-tops, respectively.Epaxial muscle samples were excised and proc-
essed in the same manner as liver samples. Fishgonads were excised and weighed. Liver andgonadal somatic indices(LSI, GSI) were calculat-ed aswliver wt.y(total wt.yliver wt.)x=100 andwgonad wt.y(total wt.ygonad wt.)x=100, respec-tively. Fulton-type condition factor was calculatedas wweighty(fork length) =100x (Anderson and3
Gutreuter, 1983).
2.2.3. Small mammalsLemmings were either trapped in small livetraps
or captured by hand. Weight, sex and body length(excluding tail) were recorded. Animals wereeuthanized by anesthesia with methoxyfluoranefollowed by cervical dislocation. Intact animalswere placed in pre-cleaned I-Chem� jars andstored cold or frozen.
2.2.4. SedimentLake sediment was collected from two sites(�4
and �13), located approximately1000 km apart.Sediment cores were retrieved using a modificationof methods previously described by Gubala et al.(1995). The same sampling equipment was used;however, since lakes were not solidly frozen, thecore sampler was lowered from a helicopter hov-ering approximately 30 m above the lake surface(we do not recommend this method). One corewas retrieved from each lake and subsectioned in1-cm intervals in the field. Core increment sampleswere transferred to pre-cleaned I-Chem� glassjars. The jars were labeled and stored dark andcool until shipment.
2.3. Radionuclide and heavy metal analyses
Radionuclide analyses for Pb dating were210
performed on the two lake sediment cores by theUS Department of Energy Environmental Moni-toring Laboratory usingg-spectrometric methodsas previously described by Gubala et al.(1995).
All matrices were analyzed for heavy metalcontent by Battelle Marine Science Laboratory inSequim, WA. All fish and lemming samples werestored frozen and analyzed within 6 months ofcollection. Vegetation and soil samples were ana-lyzed within 1 year of collection. Sediment sam-ples were stored in tightly capped jars within

124 S.M. Allen-Gil et al. / The Science of the Total Environment 301 (2003) 119–138
sealed bags under refrigeration prior to radionu-clide analysis, followed by inorganic analysis. Soilsamples were stored at room temperature in amberbottles. With the exception of Hg, all metals areexpected to be stable under these storage condi-tions. Some Hg may have been converted tomethyl-Hg and been lost through volatilization,making our results for Hg in soils conservative.
Although the same general analytical techniqueswere used throughout the study, different matricesrequired specific digestion procedures and analyt-ical treatment. Samples were transferred into acid-cleaned, preweighed polystyrene vials and storedat 4 8C. Wet samples were weighed, refrozen andfreeze-dried for a minimum of 72 h. Dried sampleswere reweighed, percentage moisture was calculat-ed and the dried samples were ball-milled in aSpex mixer-mill until homogenous. Quantificationof metals in the extract was performed using acombination of ICP-MS, graphite furnace, flameand cold-vapor atomic absorption(GFAA, FAAand CVAA, respectively), and energy-dispersiveX-ray fluorescence(XRF) following the methodsof Crecelius et al.(1991) and Bloom and Crecelius(1983).
Following digestion, calibration and methoddetection limit(MDL) check standards were addedto the analytical string at a minimum rate of 1:20.All analytical batches were accompanied by sev-eral Standard Reference Materials(SRMs). Forsoils and sediments, these were some combinationof National Institute of Standards and Technology(NIST) 1646 (estuarine sediment), NIST 2704(Buffalo River sediment), BEST-1 (Hg), andMESS-1 (Se); for vegetation these were NIST1547(peach leaves), NIST 1571(orchard leaves),and National Institute of Environmental Studies(NIES) (Sargasso 9). Intercalibration samplesfrom the Nordic moss monitoring program(Ruhl-¨ing, 1994) andyor the Canadian Arctic sedimentsampling program were run with each batch asappropriate.
For vegetation samples, a 500-mg aliquot ofeach dry sample was analyzed by X-ray fluores-cence(XRF) for Ca, Fe, Mn, Ti and Zn. A smallaliquot was digested with high-purity nitric acidyperchloric acid in an acid-cleaned Teflon bomband diluted to 22 ml for analysis. Lead and As in
this digestate were analyzed by inductively cou-pled plasma mass spectrometry(ICP-MS) and Seby graphite furnace atomic absorption(GFAA). Asecond, small aliquot was digested in 70% nitricy30% sulfuric acid at 3508C and diluted to 22.6ml. Aluminum, Cd, Cu, Mg, Ni and V in thisdigestate were analyzed by ICP-MS; Hg wasanalyzed by stannous fluoride reduction, goldamalgamation and CVAA. Method detection limits(mgyg d.w.) in vegetation for analyte concentra-tions not determined by X-ray fluorescence were:Al, 3.06; As, 0.024; Cd, 0.009; Cu, 0.022; Hg,0.01; Mg, 4.3; Ni, 0.046; Pb, 0.022; Se, 0.34; andV, 0.089.
For faunal tissues, all metal analyses were per-formed on a 500-mg subsample of freeze-driedtissue using methods recommended by the Nation-al Oceanic and Atmospheric Administration(Lauenstein and Cantillo, 1993). Arsenic, Cd, Cu,Pb and Zn were analyzed by inductively coupledplasma mass spectrometry(ICP-MS). Hg wasanalyzed by stannous chloride reduction, goldamalgamation and CVAA. Nickel and Se wereeither analyzed by ICP-MS or graphite furnaceatomic absorption. Detailed information on theanalytical procedures and quality assurance proto-col can be found in Allen-Gil et al.(1997). Methoddetection limits(mgyg d.w.) in tissues were: Cd,0.0034; Hg, 0.009; Ni, 0.0028; 0.117; Pb, 0.0019;0.037; and Zn, 3.58.
For soils and sediments, a 500-mg aliquot ofeach dry sample was analyzed by XRF for Al, As,Ca, Cu, Fe, Mn, Ni, Pb, Ti and Zn. One 0.2-galiquot was digested in an acid-cleaned Teflonbomb with high-purity nitric acidyperchloric acidin an oven at 1308C, cooled and then reheatedovernight with 3 ml of hydrofluoric acid, anddiluted to 22 ml for analysis. This digestate wasanalyzed for Cd and V analysis by ICP-MS, forSe by GFAA, and for Hg by stannous fluoridereduction, gold amalgamation and CVAA. For Mgin this digestate, analysis was by flame atomicabsorption (FAA), except for one(reanalyzed)batch that was digested by sodium peroxide fusionand analyzed by ICP-MS. In one batch, Al wasreanalyzed by ICP-MS after a 70% nitricy30%sulfuric acid digestion. Total organic carbon(TOC) was determined on a dried aliquot of

125S.M. Allen-Gil et al. / The Science of the Total Environment 301 (2003) 119–138
sample using a Leco carbon analyzer. Methoddetection limits(mgyg d.w.) in soils and sedimentsfor analyte concentrations not determined by X-ray fluorescence were: Cd, 0.048–0.068; Hg,0.0017–0.01; Mg, 40.0–70.4; Se, 0.26–0.4; andV, 0.633.
Data quality was examined on a batch-by-batchbasis for each analyte. Performance on qualitycontrol samples(blanks, spiked samples and stan-dard test materials) was typically"20% of expect-ed values. Data were rejected when either theoverall data quality or documentation was unsat-isfactory. This applies to Hg in sediment.
2.4. Data analysis
2.4.1. Vegetation and soilsAll laboratory replicates were averaged. The
non-parametric Mann–WhitneyU test was used tocompare groups of samples. Log-transformed veg-etation and surface soil data were approximatelynormally distributed for most elements and wereused in one-way analysis of variance(ANOVA)to examine both site differences and species dif-ferences, as there were insufficient degrees offreedom for the two combined. Untransformed soilcore data from the five coring sites were examinedfor stratigraphic patterns of element concentrations.
2.4.2. Faunal tissuesAll heavy metal data in tissues(dry wt.) were
(log q1)-transformed, as preliminary data explo-10
ration revealed proportional relationships betweenmeans and standard deviations for some metals. Inaddition, standard length, condition factor, andliver and gonadal somatic indices were(log q10
1)-transformed prior to statistical analysis. Sex-related differences in general health parametersand tissue heavy-metal concentrations for eachspecies were analyzed using ANOVA. If theassumption of equal variance was not valid(mod-ified Levene test), Kruskal–Wallis ANOVA onranks was performed. Data were examined toidentify correlations(Spearman,r ) between tissues
metal concentrations and length. Site effects forheavy metal burdens were determined using gen-eralized linear model analysis of variance andcovariance(GLM ANOVA, ANCOVA ). ANCOVA
results are reported when length was a significantcovariate; ANOVA results are reported whenlength was not a significant covariate.
Preliminary data exploration revealed consider-able variability in metal concentrations in tissuesamong individuals collected from one site. Basedon our quality assurance data, we interpret thisvariability to be real, rather than an artifact ofanalytical methods, and therefore no values weredeleted as outliers. A significance level ofP-0.05 was applied for all statistical analyses.
Distributions of liver Ni and Pb and muscle Ni,Pb and Cd are presented as the MDL for allobservations less than MDL. This substitutioncauses a slight upward bias in the summary statis-tics, but the effect is relatively small given the lowmethod detection limits achieved.
2.4.3. SedimentOne core was retrieved from each of two lakes,
although one core proved to be unsuitable forstratigraphic analysis based on Pb and Cs210 137
stratigraphy. The mean value for trace elements inthe upper two 1-cm intervals was used to representpotentially bioavailable material, based on visualobservations of insect activity within the twosediment cores. We recognize that differencesamong lakes in other sediment parameters(acid-volatile solids, hydroxide compounds and organiccarbon), as well as the chemical speciation of themetals, may ultimately determine actualbioavailability.
3. Results
3.1. Vegetation
Only H. splendens andC. cucullata were presentat )50% of sites. The heavy metal concentrationmedians and ranges forC. cucullata (10 sites) andH. splendens (five sites) are given in Table 2.Using the data from all sites and vegetation spe-cies, significant species differences were found forAl, As, Cu, Fe, Mg, Ni, Ti and V(P-0.01), andfor Ca and Zn(P-0.05), confirming that the fourspecies behave differently with respect to thesesoil-related elements. Site differences for Al, Ca,Cu, Fe, Mn, Ni, Pb, Ti and Zn(P-0.01), and for

126S.M
.A
llen-Gil
etal.
/T
heScience
ofthe
TotalE
nvironment
301(2003)
119–138Table 2Heavy metal concentrations(mgyg d.w.) in lichen, moss and soils collected from the Taimyr Peninsula, Russia
TOC (%) Al As Ca Cd Cu Fe Hg
C. cucullata na 771 0.22 4320 0.12 1.52 519 0.038(ns10) 477–1530 0.11–0.44 1280–56 600 0.066–0.382 1.12–12.79 290–1000 -0.01–0.057
H. splendens na 2820 0.39 8860 0.166 4.57 2640 0.051(ns5) 600–8760 0.28–0.90 4805–12 100 0.102–0.231 2.61–83.09 535–7870 0.012–0.055
Soil cores, top increment 20 24 900 2.1 9710 0.356 26.7 19 400 0.148(ns5, 0–5 cm, includes vegetation) 5.2–25 17 500–46 500 1.3–5.9 5270–21 200 0.12–0.528 7.4–69.1 11 900–29 000 0.074–0.368
Surface inorganic 2.2 60 600 11 13 200 0.146 30.5 40 750 0.031soil (ns7)a 0.7–2.7 49 500–71 800 3.6–83.0 8110–195 000 0.086–0.223 22.5–82.2 28 400–67 800 0.021–0.044
Soil cores, bottom increment 0.7 62 300 3.2 10 800 -0.068 21.9 42 700 0.014(ns5) 0.6–3.2 34 900–81 300 2.0–8.5 5890–29 700 -0.068–0.148 14.0–39.6 15 200–44 400 0.008–0.416
Median(surface inorganic:soil core bottom increment), 3.16 1.02 2.12 1.06 3.05 1.38 1.16 2.54(ns5)
Mg Mn Ni Pb Se Ti V Zn
C. cucullata 310 34.3 1.52 1.26 -0.34 59.7 0.9 20.5(ns10) 163–548 8.45–134 0.83–10.20 0.78–5.78 -0.34–0.37 26.3–109.0 0.38–1.70 9.73–29.6
H. splendens 1490 113 4.24 1.84 -0.34 220 4.97 27.5(ns5) 511–2340 13.5–255.5 1.16–56.70 1.41–3.27 -0.34–0.75 53.2–854 0.94–13.2 7.97–44.1
Soil cores, top increment 3320 16.70 29 6.2 0.42 2120 60.7 86.8(ns5, 0–5 cm, includes vegetation) 1120–5190 245–2340 10.8–59.2 6.05–12.2 0.33–0.58 1950–3760 33.2–92.3 24.0–89.2
Surface inorganic 10 745 815 42.3 12.8 -0.26 5900 109.5 88.5soil (ns7)a 3910–24 600 256–1410 33.3–71.0 -3.4–18.2 -0.26–0.56 4850–6840 102–229 64.8–109.0
Soil cores, bottom increment 4680 602 37.8 11 -0.26 5620 131.2 48.7(ns5) 258–11 200 243–816 16.5–46.9 5.9–15.9 -0.26–0.34 2430–6680 80.5–205.2 20.5–75.1
Median(surface inorganic:soil core bottom increment), 2.61 1.50 1.24 1.56 0.77 1.00 1.06 1.62(ns5)
Values presented as medians, with ranges provided beneath medians.Surface soils were cryogenically-exposed soils. Total organic carbon in surface soils ranged from 0.7–2.7mgyg dry wt.a

127S.M. Allen-Gil et al. / The Science of the Total Environment 301 (2003) 119–138
Table 3Arctic Alaskan vs. Taimyr samples ofH. splendens and C.cucullata (Mann–WhitneyU)
Highest group
H. splendens C. cucullata
Al Taimyr** Taimyr*
Ca NS NSCd NS NSCu Taimyr** Taimyr**
Fe Taimyr** Taimyr*
Hg NS NSMg Taimyr* Alaska**
Mn NS NSNi Taimyr** Taimyr**
Pb Taimyr** Taimyr**
Ti Taimyr** NSV Taimyr** NSZn NS NS
NS, not significant.-0.10.*
-0.05.**
As (P-0.05) were also found when all specieswere included in the analysis.
Statistical comparisons of the Taimyr vegetationdata to similar data from Arctic Alaska(Ford etal., 1997) were generally consistent using eitherthe mossH. splendens or the lichenC. cucullata,spite differences in geographical coverage. Com-pared to Alaska, the Taimyr samples were gener-ally higher in Cu, Ni, Pb, Al and Fe(Table 3). Inaddition, H. splendens (but not C. cucullata)showed the same pattern for both Ti and V.Significant differences between regions were alsofound for Mg, but the pattern varied by species,with Alaskan C. cucullata and TaimyrH. splen-dens elevated relative to their conspecifics in theother region.
3.2. Soil cores
Stratigraphic patterns of element concentrationsin the five soil cores are shown in Fig. 2. Elevatedtotal organic carbon(TOC) in the surface(0–5cm) increment reflects the inclusion of the surfacevegetation in the surface sample. Lithosphericelements(Al, Fe and Ti) are low in these samples.This surface increment is strikingly enriched in Cdin all cores, and in Cu, Hg, Mn, Se and Zn in
some cores. No cores show surface enrichment ofNi.
3.3. Inorganic surface soils
Fig. 3 shows concentrations of selected elementsin surface and near-surface soils. The most north-ern site(�10) is markedly different to other sites.At this site, exposed inorganic surface soils areparticularly low in TOC, and particularly high inAs and Ca(but low in Mg), suggesting that theparent material is geologically unique among thesites sampled. Site 2, closest to Norilsk(;60 km),is also different from other sites. Here, inorganicsurface soils are high in Cu, Ni, Mg, Mn, Fe andV. This complex of elevated heavy metals suggestsanthropogenic inputs due to proximity to Norilsk.The very low concentration of Pb is initiallysurprising, but Pb is only a minor component ofemissions from the Russian nickel industry(Ayras¨ ¨et al., 1997). Furthermore, acidic inputs likelyassociated with the anthropogenic metals signaturemay leach Pb out of surface soils.
The inorganic surface soils appear slightlyenriched in As, Cd, Cu, Hg, Mg, Mn, Ni, Pb, Vand Zn at most sites, relative to inorganic soils atdepth(see Table 2), although differences are onlysignificant for Cd, Zn, Pb and Mg(Table 4). Bycontrast, the ratio of Hg in surface inorganic vs.deep soils is 0.1 for site 12, suggesting possiblelithological sources for Hg at this site.
When all soils (surface and soil cores) areconsidered together, strong among-site differencesare found for Cu, Ni, Fe, Mn, Zn and Ca(P-0.0001). Significant site-related differences(P-0.05) were also found for other elements, with theexception of Al, Hg, Se and % TOC.
3.4. Fish
The characteristics of fish sampled revealedsignificant site differences for both charr andwhitefish, and high variability in the stage orsexual maturation of the sampled fish(Table 5).Fish taken from the western regions of the penin-sula tended to be larger and have higher conditionfactors. Charr from site 5 were larger than thosecollected from site 13. Among the female charr,

128 S.M. Allen-Gil et al. / The Science of the Total Environment 301 (2003) 119–138
Fig. 2. Bulk soil stratigraphy at each of five sites on the Taimyr Peninsula(see Fig. 1 and Table 1 for location). Depth incrementsare in cm. Inorganic constituents are given asmgyg dry weight. Each increment was analyzed as a pooled 5-cm sample(see text),except for the bottom increment, which was a pooled 10-cm sample where possible(i.e. where permafrost permitted retrieval of a20–30-cm increment). Most selenium values were-MDL (0.26 mgyg), but exceptions are of interest. Note changes in elementranges among sites.

129S.M. Allen-Gil et al. / The Science of the Total Environment 301 (2003) 119–138
Table 4Deep vs. surface inorganic soils on the Taimyr Peninsula, Rus-sia (Mann–WhitneyU)
Highest group
TOC NSAl NSCa NSCd Surface soils**
Cu NSFe NSHg NSMg Surface soils**
Mn NSNi NSPb Surface soils**
Ti NSV NSZn Surface soils**
NS, not significant.-0.05.**
Fig. 3. Inorganic constituents in surface soil samples from seven vegetation sampling sites on the Taimyr Peninsula(see Fig. 1 andTable 1 for location). TOC (total organic carbon) is given as % dry weight; all other units aremgyg dry weight. Most seleniumvalues were-MDL (0.40mgyg), but exceptions are of interest.
those from site 5 had higher gonadal somatic indexthan those from site 13, indicating a higher stageof sexual maturation among the site 5 fish. Forwhitefish, the median weight of the eight fishcollected from the western site 4 was two-foldhigher than that for fish collected from the site 11.For both species, this resulted in correspondingdifferences in condition factor: whitefish at site 4had higher condition factor values than those fromsite 11, and Arctic charr from site 5 had highercondition factor values than those from site 13.The greatest variability in sexual maturation wasobserved in female whitefish from site 11, forwhich the gonadal somatic index ranged from 0.02to 8.0. There were no convincing sex-related dif-ferences in metal concentrations in tissues. Theonly significant difference was for Cu in whitefishliver, although the sex difference was not verystrong(Ps0.045).

130 S.M. Allen-Gil et al. / The Science of the Total Environment 301 (2003) 119–138
Table 5Characteristics of fish sampled at lakes in the Taimyr Peninsula, Russia
Species Site N Sex Weight Standard Somatic index Conditionnumber ratio (g) length
Liver Gonadalfactor
(m:f) (cm)Male Female
Arctic charr 13 19 15:4 569* 34* 1.7 0.1 0.71* 0.96*
415–915 29–38 1.1–2.3 0.07–2.6 0.60–0.84 0.8–1.25 5 4:1 858 38 1.34 0.09 1.87 1.07
761–1250 36–42 0.7-1.8 0.06–0.31 0.97–1.2Whitefish 11 8 4:4 558* 32* 0.89* 0.91* 3.37 1.18*
444–1080 29–38 0.01–2.0 0.52–1.38 0.02–8.00 1.1–1.34 8 6:2 1293 40 0.01 -0.01 0.02 1.49
1030–2610 37–47 0.01–1.1 -0.01–0.83 0.00–0.03 1.3–1.8Burbot 1 10 3:7 1200 49 2.35 0.78 1.25 1.04
455–3250 35–62 0.93–3.41 0.48–1.68 0.62–1.88 0.9–1.4
Data presented as means, with ranges listed below.Significant differences between sites as indicated by ANOVA on log-transformed data(P-0.05).*
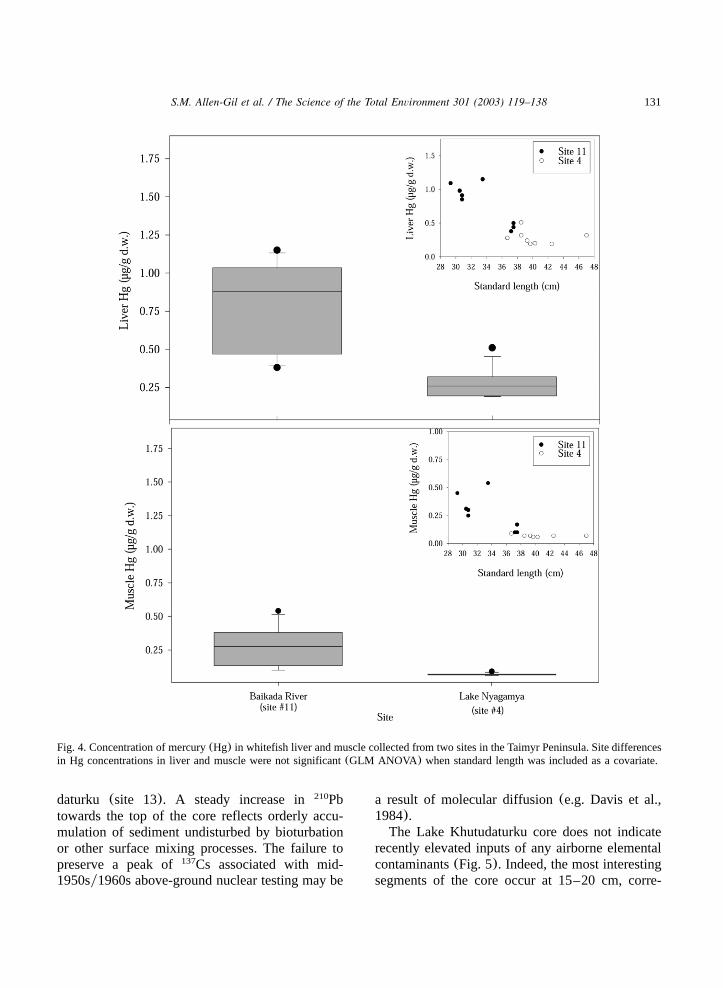
Fish size was not a significant factor for con-centrations of any metals in tissues of Arctic charror burbot. In whitefish, Hg in both liver and musclewas negatively correlated with standard length(y0.82 in liver; y0.91 in muscle). This acts as aconfounding factor when comparing tissue burdensin whitefish among sites due to site-specific vari-ation in fish size(Fig. 4). Correlations betweenfish size and concentrations of other heavy metalsin whitefish tissues were not significant.
There were several significant differences intissue concentrations by site for charr and whitefish(Table 6). For charr liver, higher concentrations ofCu, Hg and Zn, and lower concentrations of Cdand Se occurred in the eastern region(site 13)compared to those from a western location(site5). Site differences in Hg and Se in muscleparalleled those in liver. In contrast, whitefish livercollected in the western region(site 4) had higherCu concentrations than those from the easternregion (site 11). Whitefish muscle samples fromthe west(site 4) also contained higher concentra-tions of Pb and Se, but lower concentrations of Asthan those from the eastern region(site 11).
Several species differences were apparent whendata were pooled across sites. Burbot liver hadhigher concentrations of As and Cd, and lowerlevels of Pb, Se and Zn than whitefish and charr.Whitefish muscle was lower in Cu and higher inPb than the two other species. Since burbot were
not collected from the same sites as whitefish andcharr, it remains unclear whether site-relatedeffects are embedded in the species differences inheavy metal concentrations observed.
Concentrations of heavy metals were typicallyhigher in liver than muscle for all fish species.This pattern was most pronounced for Cd and Cu,for which median liver concentrations by speciesysite were 35–100- and 5–100-fold higher thanmuscle concentrations. Liverymuscle ratios of As,Hg, Ni, Pb, Se and Zn ranged from 0.5 to 10. Theproportion of Hg as methyl-Hg varied by tissueand species. Methyl-Hg was the predominant formin muscle, with median percentages ranging from82% in burbot to 98% in charr. The percentage ofHg as methyl-Hg was lower in liver for all species,ranging from 39% for whitefish to 78% for charr.
3.5. Small mammals
A total of 13 lemmings were collected andanalyzed from two sites(Table 7). Although theindividuals from site 4 were typically larger thanthose from site 11(62 vs. 39 g), the heavy metalsconcentrations in whole body samples did notdiffer by site. Median concentrations for As, Cd,Hg, Ni, Pb and Se were below 1mgyg dry wt.
3.6. Sediments
Results of Pb and Cs dating reveal good210 137
recent stratigraphy in the core from Lake Khutu-
131S.M. Allen-Gil et al. / The Science of the Total Environment 301 (2003) 119–138
Fig. 4. Concentration of mercury(Hg) in whitefish liver and muscle collected from two sites in the Taimyr Peninsula. Site differencesin Hg concentrations in liver and muscle were not significant(GLM ANOVA ) when standard length was included as a covariate.
daturku (site 13). A steady increase in Pb210
towards the top of the core reflects orderly accu-mulation of sediment undisturbed by bioturbationor other surface mixing processes. The failure topreserve a peak of Cs associated with mid-137
1950sy1960s above-ground nuclear testing may be
a result of molecular diffusion(e.g. Davis et al.,1984).
The Lake Khutudaturku core does not indicaterecently elevated inputs of any airborne elementalcontaminants(Fig. 5). Indeed, the most interestingsegments of the core occur at 15–20 cm, corre-

132 S.M. Allen-Gil et al. / The Science of the Total Environment 301 (2003) 119–138
Table 6Concentrations of heavy metals in fish liver and muscle from Taimyr Peninsula, Russia
Species Site N Dry Concentration(mgyg d.w.) MeHgyHRweight
As Cd Cu Hg(%)
LiverArctic charr 13 19 21 0.1 0.58 111 0.91 NA
(9–26) (0.02–0.21) (0.29–0.88) (29.4–275) (0.08–2.12) NAArctic charr 5 5 25 0.06 0.69 24.7 0.28 NA
(22–27) (0.05–0.08) (0.59–1.12) (17.15–42.9) (0.2–0.49)Whitefish sp. 11 8 21 0.64 1.32 30.2 0.88 NA
(18–31) (0.09–1.92) (0.17–4.27) (14.3–143) (0.38–1.15)Whitefish sp. 4 8 27 0.3 0.73 72.9 0.26 0.39
(26–36) (0.19–0.52) (0.43–1.42) (48.5–106) (0.19–0.51) (0.36–0.41)Burbot 1 10 38 1.4 20 17.35 0.48 0.62
(20–62) (0.55–2.76) (4.7–126.5) (8.75–73.2) (0.07–1.13) (0.34–0.78)
MuscleArctic charr 13 19 22 0.04 0 1.2 0.5 0.99
(17–25) (0.03–0.1) (0–0.01) (1.01–1.7) (0.3–1.52) (0.83–1.10)Arctic charr 5 5 23 0.05 0.01 1.24 0.22 0.89
(22–25) (0.04–0.08) (0–6.04) (1.16–2.56) (0.1–0.51) (0.87–1.08)Whitefish sp. 11 8 23 0.51 0.01 0.73 0.28 0.95
(21–29) (0.14–1.88) (0–0.03) (0.6–0.9) (0.1–0.54) (0.81–1.00)Whitefish sp. 4 8 27 0.13 0.02 0.76 0.07 0.9
(26–29) (0.08–6.15) (0–0.27) (0.66–0.94) (0.06–0.09) (0.8–1.00)Burbot 1 10 19 0.28 0 1.08 2.47 0.82
(16–21) (0.24–0.53) (0–0.01) (0.61–2.64) (0.4–4.28) (0.58–1.00)
Ni Pb Se ZnLiverArctic charr 0.33 0.03 3.55 118
(0.12–19.9) (0.01–0.55) (2.11–4.64) (96–180)Arctic charr 0.12 0.02 5.52 98
(0.07–0.13) (0.01–0.11) (4.35–7.35) (82–122)Whitefish sp. 0.35 0.11 4.01 121
(0.14–2.14) (0.03–0.19) (3.03–6.00) (96–158)Whitefish sp. 0.14 0.11 4.82 105
(0.12–0.61) (0.03–0.16) (3.15–6.19) (75–128)Burbot 0.4 0 2.22 51
(0.14–3.27) (0–0.02) (0.64–9.22) (22–220)
MuscleArctic charr 0.07 0.01 0.98 18
(0.05–0.15) (0.01–0.15) (0.76–1.5) (15–22)Arctic charr 0.05 0.01 1.94 17
(0.04–0.09) (0.01–0.05) (1.78–2.2) (17–20)Whitefish sp. 0.12 0.03 1.09 16
(0.08–0.25) (0.02–0.04) (0.68–1.62) (12–18)Whitefish sp. 0.24 0.11 1.53 16
(0.1–3.75) (0.04–0.26) (0.24–2.06) (15–47)Burbot 0.55 0.01 0.88 20
(0.14–2.38) (0–0.04) (0.34–1.47) (4–84)

133S.M. Allen-Gil et al. / The Science of the Total Environment 301 (2003) 119–138
Table 7Heavy metal concentrations in collared lemming from the Taimyr Peninsula, Russia
Site N Sex Weight Dry Concentration(mgyg d.w.)ratio (g) weight
As Cd Cu Hg(m:f) (%)
Baikada River 9 4:5 39 27 0.03 0.27 16.8 0.11(Site 11) (15–114) (10–32) (0.01–0.13) (0.04–0.62) (13.3–24) (0.002–0.22)L. Nyagamya 4 1:5 62 29 0.01 0.18 17.7 0.07(Site 4) (46–86) (29–32) (0–0.04) (0.04–1.16) (15–73.1) (0.02–0.11)
Ni Pb Se ZnBaikada River 0.16 0.5 0.33 89(Site 11) (0.12–1.13) (0.13–6.4) (0.32–1.62) (74–113)L. Nyagamya 0.13 0.2 0.82 88.3(Site 4) (0.12–0.24) (0.07–0.34) (0.43–1.91) (65.8–128)
Values are presented as medians, with ranges provided underneath. No significant differences between sites were revealed byANOVA.
Fig. 5. Comparison of median concentrations of elements inH. splendens collected from northern latitudes.
sponding to more than 120 years ago. During thisinterval(17–19 cm), there was apparently an inputof organic material and associated Cd and Zn,followed by an input of inorganic(low TOC) butSe-rich sediments(16–17 cm), in turn followedby an input of inorganic but Se-poor sediments(15–16 cm). The interpretation of this sequence
is unclear, although it may suggest changes inbasin hydrology.
4. Discussion
Taimyr H. splendens samples generally havelow concentrations of all contaminant elements,

134 S.M. Allen-Gil et al. / The Science of the Total Environment 301 (2003) 119–138
Fig. 6. Stratigraphy of inorganic constituents in a sediment core from Lake Khutudaturku, Taimyr Peninsula. Depth increments arein cm. Inorganic constituents are given asmgyg dry weight. Data for Hg, Mg and V are not presented due to unsatisfactory QA.Most selenium values were-MDL (0.18 mgyg), but exceptions are of interest. Note the presence of a diagenetic surface layerenriched in Fe and Mn.
with concentrations more similar to Arctic Alaskanand Nordic samples than to those of industrializedRussia or central Europe(Fig. 6, with comparativedata from Ruhling et al., 1992; Ruhling, 1994;¨ ¨Ford et al., 1995). Surface, cryogenically exposedsoils show a slight smear of Cd, Zn, Pb and Mg,although the sediment core from the remote LakeKhutudaturku(site 13) reflects no apparent recentanthropogenic enrichment from atmosphericdeposition.
The lack of an anthropogenic fingerprint in thesediments is consistent with previous reports. For
example, Blais et al.(1999) found elevated con-centrations of Cu and Ni only in lakes within 60km of Norilsk. Rognerud et al.(1998) reported alack of recent post-industrial enrichment of Cu, Niand Zn in the Russian Arctic, including two sitesin the Taimyr. The lack of significant surfacesediment enrichment of Pb in our core is alsoconsistent with the conclusion of Rognerud et al.(1998) that the magnitude of surface sedimentenrichment of Pb decreases with increasing latitudeand increasing eastward direction. Thus, it appearsthat the collective conclusion of several studies

135S.M. Allen-Gil et al. / The Science of the Total Environment 301 (2003) 119–138
Fig. 7. Heavy metal concentrations in freshwater fish from the Taimyr Peninsula, Russia, compared to those from the CanadianArctic (Lockhart et al., 1989). Data presented as ranges. Sites: 1, Fort Good Hope; 2, Arctic Red River; 3, Fort Franklin; 4, FortSimpson; 5, Baikada River(�11); 6, Lake Bol’shaya(�5); 7, Lake Nyagamya(�4); and 8, Lake Maloye(�1).
investigating the effects of the Norilsk industrialcomplex (Vlasova et al., 1991; Rognerud et al.,1998; Blais et al., 1999) is that the loadings ofselected elements are only elevated close to knownsources.
Freshwater fish from the Taimyr Peninsula donot generally show tissue metal burdens higherthan fish collected from other Arctic locations,with the possible exception of Ni in some individ-uals(Fig. 7). The ranges of Cu and Hg in whitefish

136 S.M. Allen-Gil et al. / The Science of the Total Environment 301 (2003) 119–138
muscle(wet wt.) from lakes on the Taimyr Pen-insula are similar or lower than those reportedfrom remote Canadian Arctic lakes and rivers byLockhart et al.(1989) (Fig. 7a,c). The comparisonis also true for Ni, with the exception of oneindividual from Lake Bol’shaya(Fig. 7b). Thesame pattern is observed for burbot liver; concen-tration ranges for Cu and Hg are similar to thosefrom Canadian Arctic lakes(Fig. 7d,f), while therange of Ni appears to be higher due to elevatedlevels in individual fish from Lake Maloye(Fig.7e). While the concentrations of heavy metals infish from the Taimyr Peninsula are apparently notelevated as a result of anthropogenic influence,they are higher than those reported for anadromouswhitefish species from the Pechora River in West-ern Siberia(Allen-Gil and Martynov, 1995).
The levels of heavy metals in fish are not likelyto cause health effects, either directly for the fishor for humans through subsistence consumption,with the possible exception of Hg in burbot. Forexample, the level of Pb in liver of fish collectedfrom the Taimyr Peninsula is lower than the levelin rainbow trout exposed to water Pb levels of-75 mgyl (Haux and Larsson, 1982). Therefore, theestimated exposure concentration in water is belowthat associated with toxicity in fish, includingchanges in lipid, thyroid, blood biochemistry andenzymatic activity(Haux and Larsson, 1982; Hauxet al., 1986; Katti and Sathyanesan, 1987; Tulasiet al., 1992). The heavy metal concentrations infreshwater fish from the Taimyr Peninsula aregenerally below levels of concern for human con-sumption(as defined by the US EPA, 1994), withthe exception of Hg in larger burbot from LakeMaloye, south of Norilsk. However, as actionlevels differ among federal agencies and amongcountries, individual whitefish and charr frommore remote locations may also be potentiallydangerous for human consumption, particularlyamong communities in which freshwater fish area major dietary component.
Although significant, highly localized contami-nation can occur in close proximity to emissionsources, widespread contamination by Pb, Cu andV does not appear to occur in the Alaskan andSiberian Arctic. There are several possible expla-nations for the apparent lack of significant accu-
mulation of metals in the Taimyr region, despiteits proximity to one of the largest metallurgicalcomplexes in the world. One possibility is that thecombination of higher precipitation rates in thesummer, when the prevailing winds are from thesouth, may also favor more localized depositionof these compounds. An alternate possible expla-nation is that the absence of emission scrubberson the release stacks until recently(;1990) mayhave resulted in greater simultaneous emission ofparticulates historically. In 1985, for example, over47 000 t of dust particulates were emitted from theNorilsk complex(Pis’mennyi and Filatov, 1990).Heavy metals may adsorb to the particulate matter,and therefore be deposited more locally(Blais etal., 1999). More recently, efforts to reduce emis-sions at Norilsk plants have included constructionof dust and gas removal facilities, and the intro-duction of electrostatic precipitators and liquid-phase sulfur removal technology(Pis’mennyi andFilatov, 1990). Despite the reductions of SO to2
the atmosphere between 1980 and 1990, damageto forests and mosses have increased by 10% everyyear, and it is predicted that it will require anadditional 15 years before significant localimprovements result from these facility upgrades(Pis’mennyi and Filatov, 1990). Although the rel-ative importance of these potential explanations,and others we have not considered, remainsunknown, it does appear that the ecological dev-astation of the Norilsk smelter complex appears tobe locally confined, and does not extend signifi-cantly into the Taimyr Peninsula.
Acknowledgments
This research was funded by the US Environ-mental Protection Agency. This paper has beensubject to the EPA peer and administrative reviewand approved for publication. Mention of tradenames of commercial products does not constituteendorsement or recommendation for use.
References
Allen-Gil SM, Gubala CP, Landers DH, Lasorsa BK, CreceliusEA, Curtis LR. Heavy metal accumulation in sediment andfreshwater fish in US Arctic lakes. Environ Toxicol Chem1997;16:733–741.

137S.M. Allen-Gil et al. / The Science of the Total Environment 301 (2003) 119–138
Allen-Gil SM, Martynov VG. Heavy metal burdens in ninespecies of freshwater and anadromous fish from the PechoraRiver, Northern Russia. Sci Total Environ 1995;160y:643–654.
Anderson RO, Gutreuter SJ. Length, weight, and associatedstructural indices. In: Nielson LA, Johnson DL, LamptonSS, editors. Fisheries Techniques. Bethesda, MD, USA:American Fisheries Society, 1983. p. 283–300.
Arctic Monitoring and Assessment Program. Arctic PollutionIssues: A State of the Environment Report. Oslo, Norway:AMAP, 1997.
Ayras M, Niskavaara H, Bogatyrev I, Chekushin V, Pavlov V,¨ ¨de Caritat P, Halleraker JH, Finne TE, Kashulina G, Rei-mann C. Regional patterns of heavy metals(Co, Cr, Cu,Fe, Ni, Pb, V and Zn) and sulphur in terrestrial mosssamples as indication of airborne pollution in a 188,000km area in northern Finland, Norway and Russia. J Geo-2
chem Explor 1997;58(2–3):269–281.Blais JM, Duff KE, Laing TE, Smol JP. Regional contamina-
tion in lakes from the Noril’sk region in Siberia, Russia.Water Air Soil Pollut 1999;110(3–4):389–404.
Bloom NS, Crecelius EA. Determination of mercury in sea-water at sub-nanogram per liter levels. Mar Chem1983;144:49–59.
Chebotareva YV, Savoskul SP, Savvaitova KA. Morphologicalabnormalities of the female reproductive system in fish fromthe Noril–Pyasino water bodies in Taimyr Peninsula. JIchthyol 1997;37(2):174–180.
Crecelius EA, Trefry JH, Steinhauer MS, Boehm PD. Tracemetals in sediments from the Inner Continental Shelf of theWestern Beaufort Sea. Environ Geol Water Sci 1991;18:71–79.
Davis RB, Hess CT, Norton SA, Hanson DW, Hoagland KD,Anderson DS. Cs and Pb dating of sediments from137 210
soft-water lakes in New England(USA) and Scandinavia,a failure of C dating. Chem Geol 1984;44:151–185.13
Ford J, Landers D, Kugler D, Lasorsa B, Allen-Gil S, CreceliusE, Martinson J. Inorganic contaminants in Arctic Alaskanecosystems: long-range atmospheric transport or local pointsources? Sci Total Environ 1995;160y161:323–335.
Ford J, Lasorsa B, Crecelius E, Voit J, Landers DH. Vegetationand Soil Database for Arctic Alaska and the Taimyr Penin-sula, Russia, vol. I, Elemental composition. 1997. Unpubli-shed report submitted to the US EPA Arctic ContaminantsResearch Program.
Gubala CP, Landers DH, Monetti M, Heit M, Wade T, LasorsaB, Allen-Gil S. The rates of accumulation and chronologiesof atmospherically derived pollutants in the Arctic Alaska,USA. Sci Total Environ 1995;160y161:347–361.
Haux C, Larsson A. Influence of inorganic lead on thebiochemical blood composition in the rainbow trout,Salmogairdneri. Ecotoxicol Environ Saf 1982;6:28–34.
Haux C, Larsson A, Lithner G, Sj’beck M. A field study ofphysiological effects on fish in lead-contaminated lakes.Environ Toxicol Chem 1986;5:283–288.
Katti SR, Sathyanesan AG. Lead nitrate-induced changes inthe thyroid physiology of the catfishClarias batrachus (L).Ecotoxicol Environ Saf 1987;13:1–6.
Klein DR, Vlasova TJ. Lichens, a unique forage resourcethreatened by air pollution. Rangifer 1992;12(1):21–27.
Lauenstein GG, Cantillo AY. Sampling and Analytical Methodsof the National Status and Trends Program National BenthicSurveillance and Mussel Watch Projects 1984–1992, vol.III, Comprehensive Descriptions of Elemental AnalyticalMethods. Silver Spring, MD, USA: National Oceanic andAtmospheric Administration, 1993. NOAA Technical Mem-orandum NOS ORCA 71.
Lockhart WL, Metner DA, Murray DAJ, Danell RW, BilleckBN, Baron CL, Muir DCG, Chang-Kue K. Studies toDetermine whether the Condition of Fish from the LowerMackenzie River is Related to Hydrocarbon Exposure,Environmental Studies 61. Ottawa: Department of IndianAffairs and Northern Development, 1989. (84 pp).
Pacyna JM. The origin of Arctic air pollutants: lessons learnedand future research. Sci Total Environ 1995;160y161:39–53.
Pis’mennyi E, Filatov A. Nature’s health depends on us(onthe ecology of Noril’sk). Metallurgia 1990;9:22–24.Translated.
Puckett KJ, Finegan EJ. An analysis of the element content oflichens from the Northwest Territories, Canada. Can J Bot1980;58:2073–2089.
Revich BA. Public health and ambient air pollution in Arcticand sub-Arctic cities of Russia. Sci Total Environ 1995;160y161:585–592.
Rognerud S, Skotvold T, Fjeld E, Norton SA, Hobaek A.Concentrations of trace elements in recent and preindustrialsediments from Norwegian and Russian Arctic Lakes. CanJ Fish Aquat Sci 1998;55:1512–1523.
Ross HB. On the use of mosses(Hylocomium splendens andPluerozium schrebi) for estimating atmospheric trace metaldeposition. Water Air Soil Pollut 1990;50:63–76.
Ruhling A. Atmospheric Heavy Metal Deposition in Europe—˚¨Estimations based on Moss Analysis. Copenhagen: NordicCouncil of Ministers, 1994.
Ruhling A, Tyler G. Sorption and retention of heavy metals in˚¨the woodland mossHylocomium splendens (Hedw.). Br SchOikos 1970;21:92–97.
Ruhling A, Brumelis G, Goltsova N, Kvietkus K, Kubin K,¨¨Liiv S, Magnusson S, Makinen A, Pilegaard K, Rasmussen¨´L, Sander E, Steinnes E. Atmospheric Heavy Metal Depo-sition in Northern Europe 1990. Copenhagen: Nordic Coun-cil of Ministers, 1992.
Tulasi SJ, Reddy PUM, Ramana Rao JV. Accumulation of leadand effects on total lipids and lipid derivatives in thefreshwater fish Anabas testudineus (Bloch). EcotoxicolEnviron Saf 1992;23:33–38.
US Environmental Protection Agency–Office of Science andTechnology. Guidance for Assessing Chemical ContaminantData for Use in Fish Advisories, vol. 2, Risk Assessmentand Fish Consumption Limits. Washington, DC: US EPA,1994.

138 S.M. Allen-Gil et al. / The Science of the Total Environment 301 (2003) 119–138
Vlasova TM, Kovalev BI, Filipchuk AN. Effects of pointsource atmospheric pollution on boreal forest vegetation ofNorthwestern Siberia. In: Weller G, Wilson CL, SeverinBAB, editors. International Conference on the Role of PolarRegions in Global Change. Proceedings of a conferenceheld 11–15 June 1990 at University of Alaska Fairbanks.Fairbanks, AK: Geophysical Institute and Center for Global
Change and Arctic System Research, University of Alaska,1991. p. 423–428.
White DA, Kimerling J, Overton WS. Cartographic and geo-metric components of a global sampling design or environ-mental monitoring. Cartogr Geogr Inf Syst 1992;19(1):5–22.