Embed Size (px)
Citation preview

To:
Cc:
Printed: 27 November 2017
Heathrow Performance ReportService Quality Rebate and Bonus - October 2017
Integrated Planning and Performance - Airport Operations

* SQRB calculation based on moving annual average (MAA) for these metrics
Service Level Performance
T2 T3 T4 T5 T2 T3 T4 T5 ALL
3.80 3.80 3.80 3.80 0.99 0.99 0.99 0.99
4.00 4.00 4.00 4.00 0.99 0.99 0.99 0.99
4.10 4.10 4.10 4.10 0.99 0.99 0.99 0.99
4.30 4.30 4.30 4.30 0.99 0.99 0.99 0.99
0.99 0.99 0.99 0.99
0.98 0.98 0.00 0.98
0.95 0.95 0.95 0.95 0.99 0.99 0.99 0.99
0.99 0.99 0.99 0.99 0.00 0.00 0.00
0.95 0.95 0.95 0.95 0.99 0.99 0.99 0.99
0.95 0.95 0.95 0.95
CTA Cargo EastSide T5 SouthSide
Control Post Security Search
0.95 0.95 0.95 0.95 0.95
-£ -£ 0 4.10 4.38 4.08 4.29 4.09 -£ -£ 0
-£ -£ 0 4.20 4.40 4.18 4.21 4.27 -£ -£ 0
-£ -£ 0 4.20 4.31 4.22 4.24 4.23 33,580£ 419,748£ 10
-£ -£ 0 4.40 4.42 4.39 4.39 4.39 -£ -£ 0
-£ -£ 0 Total 33,580£ 419,748£ 10
-£ -£ 0
-£ -£ 0 Bonus: All business units must exceed Lower Threshold.
-£ -£ 0 Lowest Score will be used to calculate bonus term each month for qualifying measures
-£ -£ 0 Financial year is from January 2017 - December 2017
-£ -£ 0
-£ -£ 0
-£ -£ 0
-£ -£ 0
-£ -£ 0
-£ -£ 0
-£ -£ 0
-£ -£ 0
-£ -£ 0
Total -£ -£ 0
Credit Notes:
Arrivals reclaims
Or contact: [email protected]
Printed: 27 Nov 2017 at 15:16. For further information please click here
99.44%
Estimated
Rebate
Total
FailuresTotal Pass
Estimated
Bonus
Estimated
Bonus
FEGP
Pre-conditioned air
Pier Service
Cleanliness
Stands
Jetties
Stand entry guidance
98.02% 95.10%
Control Posts Search
Rebates:
Wayfinding
4.70Flight information
CSA Queues - Both
Based on 15min time periods measured
Transfer Search
T2
Heathrow Performance Report October 2017
Will be raised and allocated to the relevant parties that used the terminal in the relevant month pro-rata with the airport charges incurred for passenger services in that month.
Aerodrome Congestion
Based on 15min time periods measured
Staff search
Security*4.26 4.22 4.23 4.19
Accuracy and ease of finding flight information
Wi-Fi*Ease of using WiFi
4.40 4.18 4.21 4.27
Staff Search
4.31 4.22 4.24
Based on 15min time periods measured
CSA queues - Times queue <10 minutes
PCA
SEGs
Availability of Pre-conditioned Air
4.50
4.39
4.23
96.32%
T2 T3
CSA queues - Times queue <5 minutes96.64% 97.05%
T4 T5
Departure lounge seat availability
99.82%
Estimated
Rebate
99.68% 96.42%
Aerodrome congestion
TTS - One carTrack Transit System - one car availability
Upper
Threshold
4.50
4.50
99.16%
Campus
99.96%
98.20% 96.73% 100% 99.04%
TTS - Two carsTrack Transit System - % time two cars available
97.97% 95.47%
Oct - 2017 YTD
Financial Report- Bonus and Rebates
Bonuses:
T3 T4 T5
99.86%
Transfer search
Passenger Sensitive Equipment (Priority)
Passenger Sensitive Equipment (General)
4.18 4.18
99.98%99.79%Based on 15min time periods measured
99.71%
97.47% 97.72%
99.99%
99.96%
98.27%
Passenger satisfaction
% Pier served passengers
Arrivals ReclaimsBag reclaim belts availability
99.95%
YTDOct - 2017
99.96%
90.70%
99.50%
99.41%
99.85%
99.98%
99.81%
99.88%
99.80%
100%
99.88%
99.98%
99.97%
99.90%
100%
99.97%
95.53%
4.38
4.23
4.42
99.48%
99.62%
99.84%
99.98%
99.68%
99.80%
Lower
Threshold
100%Pier Service*
99.91% 99.98%
Passenger Experience and Service Level Performance
99.68%
99.54%
99.82%
99.99%
99.88%
Departure lounge seat availability*Ease of finding a seat
Cleanliness*Overall cleanliness of the terminal
Wayfinding*Ease of finding your way around the airport
Flight information*
PSE (General)
PSE (Priority)
StandsAvailability of stands
FEGP
4.08 4.29 4.09
Availability of Passenger Sensitive Equipment (Priority)
Availability of Air-Bridges4.17
4.39 4.39Availability ofFixed Electrical Ground Power
Jetties
Availability of Passenger Sensitive Equipment (General)

* SQRB calculation based on moving annual average (MAA) for these metrics
Service Level Performance
2 Target Oct-17 vs. Sep-17 Target Oct-17 vs. Sep-17
`
`
Notes:
Passenger experience rating threshold 0 to 5, with 5 the highest score.
Terminal 2 Performance Report October 2017
Based on 15min time periods
measured
0.08%
Jetties
Availability of Air-Bridges
Printed: 27 Nov 2017 at 15:16. For further information please contact: [email protected] or click here.
-0.01
0.00
0.00
-0.02
0.00
1.16%
0.00%
-0.65%
1.15%
0.01%
-0.01%
-0.16%
0.66%
99.00%
99.00% 99.88%
95.00%
0.00%
Passenger Experience and Service Level Performance
4.10 4.31
4.383.80 -0.02 99.00% 99.68%
99.00% 99.82%
Cleanliness*Overall cleanliness of the
terminal
Ease of finding your way
around the airport
Wayfinding*
Ease of finding a seat
Departure lounge
seat availability*0.08%
0.16%
0.03%
4.00 4.40
PSE (General)
Availability of Passenger
Sensitive Equipment (General)
99.00% 99.71%
98.00% 99.99%
PSE (Priority)
Availability of Passenger
Sensitive Equipment (Priority)
Availability Fixed Electrical
Ground Power
SEGs
Availability of Stand entry
guidance
PCA
Availability of Pre-Conditioned
Air
99.00%
99.00% 99.96%
99.54%
99.99%
98.27%
Transfer Search
StandsAvailability of stands
FEGP
Pier Service*% Pier served passengers
99.00% 99.95%
95.00%Arrivals reclaimsBag reclaim belts availability
Ease of using WiFi
Wi-Fi*
Passenger satisfaction
Security*
CSA queues - Times
queue <5 minutes
95.00% 98.20%
99.16%
96.64%
4.30
Staff search
95.00%
Based on 15min time periods
measured
4.42
4.23
4.26
Accuracy and ease of finding
flight information
Flight information*
CSA queues - Times
queue <10 minutes
Based on 15min time periods
measured
Based on 15min time periods
measured
3.70
3.90
4.10
4.30
4.50
3.90
4.10
4.30
4.50
Nov Dec Jan Feb Mar Apr May Jun Jul Aug Sep Oct
4.00
4.10
4.20
4.30
4.40
4.50
4.20
4.30
4.40
4.50
3.90
4.10
4.30
4.50
4.00
4.10
4.20
4.30
4.40
4.50
94%
96%
98%
100%
98%
99%
100%
94%
96%
98%
100%
94%
96%
98%
100%
Nov Dec Jan Feb Mar Apr May Jun Jul Aug Sep Oct
98%
99%
100%
98%
99%
100%
98%
99%
100%
98%
99%
100%
98%
99%
100%
97%
98%
99%
100%
98%
99%
100%
94%
96%
98%
100%
98%
99%
100%

2
Rebates:
Departure lounge seat availability -£ -£ 0
Cleanliness -£ -£ 0
Wayfinding -£ -£ 0
Flight information -£ -£ 0
CSA queues - Both -£ -£ 0
Staff search -£ -£ 0
Transfer search -£ -£ 0
PSE (General) -£ -£ 0
PSE (Priority) -£ -£ 0
Stands -£ -£ 0
FEGP -£ -£ 0
Jetties -£ -£ 0
PCA -£ -£ 0
SEGs -£ -£ 0
Pier Service -£ -£ 0
Arrivals reclaims -£ -£ 0
-£ -£ 0
Bonuses:
Measure
Departure lounge seat availability MAA 4.10 4.50 4.38 -£ -£ 0
Cleanliness MAA 4.20 4.50 4.40 -£ -£ 0
Wayfinding MAA 4.20 4.50 4.31 33,580£ 419,748£ 10
Flight information MAA 4.40 4.70 4.42 -£ -£ 0
33,580£ 419,748£ 10
Credit Notes:
Financial year is from January 2017 - December 2017
Bonus: All business units must exceed Lower Threshold.
Lowest Score will be used to calculate bonus term each month for qualifying measures
All bonus measures are based on MAA
Oct - 2017
ActualEstimated Bonus (All
Terminals)
Number of
Bonus
Year-to-Date
Estimated Bonus (All
Terminals)
Terminal 2 Performance Report October 2017
Financial Report - Bonus and Rebates
Target
Achieved
Year-to-DateOct - 2017
Estimated RebateNumber of
failuresEstimated Rebate
Upper
Threshold
Will be raised and allocated to the relevant parties that used the terminal in the relevant month pro-rata with the airport charges incurred for passenger services in that month.
Or contact: [email protected]
Printed: 27 Nov 2017 at 15:16. For further information please click here
Lower
Threshold

* SQRB calculation based on moving annual average (MAA) for these metrics
Service Level Performance
3 Target Oct-17 vs. Sep-17 Target Oct-17 vs. Sep-17
`
`
Notes:
Passenger experience rating threshold 0 to 5, with 5 the highest score.
Based on 15min time periods
measured
Based on 15min time periods
measured
Based on 15min time periods
measured
Printed: 27 Nov 2017 at 15:16. For further information please contact: [email protected] or click here.
Jetties
Availability of Air-Bridges
95.00% 95.53% 0.08%% Pier served passengers
0.01%
99.97% 0.07%
99.90% 0.05%
100%98.00%
Availability of Stand entry
guidance
PCA
Availability of Pre-Conditioned
Air
99.00% 99.79% 0.24%Bag reclaim belts availability
Transfer Search95.00% 96.73% 0.97%
4.17 -0.01 99.00%
Passenger satisfaction
Staff search95.00% 99.82% -0.13%
Arrivals reclaims
CSA queues - Times
queue <10 minutes99.00% 100% 0.29%
Pier Service*
CSA queues - Times
queue <5 minutes95.00% 97.05% -0.24% 99.00%
SEGs
Ease of using WiFi
Security*
Based on 15min time periods
measured
4.22 -0.01
99.98% 0.00%Accuracy and ease of finding
flight information
Wayfinding*4.10 4.22 0.00
Stands99.00% 99.85% -0.03%
Ease of finding your way
around the airport
Availability of stands
Availability Fixed Electrical
Ground Power
Flight information*4.30 4.39 0.00
FEGP99.00%
Wi-Fi*
Terminal 3 Performance Report October 2017
99.00% 99.50% -0.04%
99.00% 99.41% -0.19%Overall cleanliness of the
terminal
PSE (General)
Availability of Passenger
Sensitive Equipment (General)
PSE (Priority)
Availability of Passenger
Sensitive Equipment (Priority)
Ease of finding a seat
Cleanliness*4.00 4.18 -0.01
Passenger Experience and Service Level Performance
Departure lounge
seat availability*3.80 4.08 0.00
3.70
3.90
4.10
4.30
4.50
3.90
4.10
4.30
4.50
Nov Dec Jan Feb Mar Apr May Jun Jul Aug Sep Oct
4.00
4.10
4.20
4.30
4.40
4.50
4.20
4.30
4.40
4.50
3.90
4.10
4.30
4.50
4.00
4.10
4.20
4.30
4.40
4.50
94%
96%
98%
100%
98%
99%
100%
94%
96%
98%
100%
94%
96%
98%
100%
Nov Dec Jan Feb Mar Apr May Jun Jul Aug Sep Oct
98%
99%
100%
98%
99%
100%
98%
99%
100%
98%
99%
100%
98%
99%
100%
97%
98%
99%
100%
98%
99%
100%
93%
95%
97%
99%
98%
99%
100%

3
Rebates:
Departure lounge seat availability -£ -£ 0
Cleanliness -£ -£ 0
Wayfinding -£ -£ 0
Flight information -£ -£ 0
CSA queues - Both -£ -£ 0
Staff search -£ -£ 0
Transfer search -£ -£ 0
PSE (General) -£ -£ 0
PSE (Priority) -£ -£ 0
Stands -£ -£ 0
FEGP -£ -£ 0
Jetties -£ -£ 0
PCA -£ -£ 0
SEGs -£ -£ 0
Pier Service -£ -£ 0
Arrivals reclaims -£ -£ 0
-£ -£ 0
Bonuses:
Measure
Departure lounge seat availability MAA 4.10 4.50 4.08 -£ -£ 0
Cleanliness MAA 4.20 4.50 4.18 -£ -£ 0
Wayfinding MAA 4.20 4.50 4.22 33,580£ 419,748£ 10
Flight information MAA 4.40 4.70 4.39 -£ -£ 0
33,580£ 419,748£ 10
Credit Notes:
Financial year is from January 2017 - December 2017
Bonus: All business units must exceed Lower Threshold.
Lowest Score will be used to calculate bonus term each month for qualifying measures
All bonus measures are based on MAA
Printed: 27 Nov 2017 at 15:16. For further information please click here
Or contact: [email protected]
Oct - 2017 Year-to-Date
Lower
Threshold
Upper
ThresholdActual
Estimated Bonus (All
Terminals)
Estimated Bonus (All
Terminals)
Number of
Bonus
Will be raised and allocated to the relevant parties that used the terminal in the relevant month pro-rata with the airport charges incurred for passenger services in that month.
Terminal 3 Performance Report October 2017
Financial Report - Bonus and Rebates
Oct - 2017 Year-to-Date
Target
AchievedEstimated Rebate Estimated Rebate
Number of
failures

* SQRB calculation based on moving annual average (MAA) for these metrics
Service Level Performance
4 Target Oct-17 vs. Sep-17 Target Oct-17 vs. Sep-17
`
`
Notes:
Passenger experience rating threshold 0 to 5, with 5 the highest score.
Based on 15min time periods
measured
Based on 15min time periods
measured
Based on 15min time periods
measured
Printed: 27 Nov 2017 at 15:16. For further information please contact: [email protected] or click here.
Jetties
Availability of Air-Bridges
95.00% 99.97% 0.01%% Pier served passengers
99.98% -0.02%
99.88% -0.09%
Availability of Stand entry
guidance
PCA
Availability of Pre-Conditioned
Air
99.00% 99.86% 0.56%Bag reclaim belts availability
Transfer Search95.00% 100% 0.00%
4.18 -0.01 99.00%
Passenger satisfaction
Staff search95.00% 99.68% -0.32%
Arrivals reclaims
CSA queues - Times
queue <10 minutes99.00% 99.91% -0.09%
Pier Service*
CSA queues - Times
queue <5 minutes95.00% 97.47% -0.05% 99.00%
SEGs
Ease of using WiFi
Security*
Based on 15min time periods
measured
4.23 0.00
100% 0.00%Accuracy and ease of finding
flight information
Wayfinding*4.10 4.24 -0.01
Stands99.00% 99.80% -0.09%
Ease of finding your way
around the airport
Availability of stands
Availability Fixed Electrical
Ground Power
Flight information*4.30 4.39 -0.01
FEGP99.00%
Wi-Fi*
Terminal 4 Performance Report October 2017
99.00% 99.81% 0.04%
99.00% 99.88% 0.18%Overall cleanliness of the
terminal
PSE (General)
Availability of Passenger
Sensitive Equipment (General)
PSE (Priority)
Availability of Passenger
Sensitive Equipment (Priority)
Ease of finding a seat
Cleanliness*4.00 4.21 -0.01
Passenger Experience and Service Level Performance
Departure lounge
seat availability*3.80 4.29 0.00
3.70
3.90
4.10
4.30
4.50
3.90
4.10
4.30
4.50
Nov Dec Jan Feb Mar Apr May Jun Jul Aug Sep Oct
4.00
4.10
4.20
4.30
4.40
4.50
4.20
4.30
4.40
4.50
3.90
4.10
4.30
4.50
4.00
4.10
4.20
4.30
4.40
4.50
94%
96%
98%
100%
98%
99%
100%
94%
96%
98%
100%
94%
96%
98%
100%
Nov Dec Jan Feb Mar Apr May Jun Jul Aug Sep Oct
98%
99%
100%
98%
99%
100%
98%
99%
100%
98%
99%
100%
98%
99%
100%
98%
99%
100%
94%
96%
98%
100%
98%
99%
100%

4
Rebates:
Departure lounge seat availability -£ -£ 0
Cleanliness -£ -£ 0
Wayfinding -£ -£ 0
Flight information -£ -£ 0
CSA queues - Both -£ -£ 0
Staff search -£ -£ 0
Transfer search -£ -£ 0
PSE (General) -£ -£ 0
PSE (Priority) -£ -£ 0
Stands -£ -£ 0
FEGP -£ -£ 0
Jetties -£ -£ 0
PCA
SEGs -£ -£ 0
Pier Service -£ -£ 0
Arrivals reclaims -£ -£ 0
-£ -£ 0
Bonuses:
Measure
Departure lounge seat availability MAA 4.10 4.50 4.29 -£ -£ 0
Cleanliness MAA 4.20 4.50 4.21 -£ -£ 0
Wayfinding MAA 4.20 4.50 4.24 33,580£ 419,748£ 10
Flight information MAA 4.40 4.70 4.39 -£ -£ 0
33,580£ 419,748£ 10
Credit Notes:
Financial year is from January 2017 - December 2017
Bonus: All business units must exceed Lower Threshold.
Lowest Score will be used to calculate bonus term each month for qualifying measures
All bonus measures are based on MAA
Printed: 27 Nov 2017 at 15:16. For further information please click here
Or contact: [email protected]
Oct - 2017 Year-to-Date
Lower
Threshol
Upper
ThresholActual
Estimated Bonus
(All Terminals)
Estimated Bonus
(All Terminals)
Number of
Bonuses
Will be raised and allocated to the relevant parties that used the terminal in the relevant month pro-rata with the airport charges incurred for passenger services in that month.
Terminal 4 Performance Report October 2017
Financial Report - Bonus and Rebates
Oct - 2017 Year-to-Date
Target
AchievedEstimated Rebate Estimated Rebate
Number of
failures

* SQRB calculation based on moving annual average (MAA) for these metrics
Service Level Performance
5 Target Oct-17 vs. Sep-17 Target Oct-17 vs. Sep-17
`
`
Notes:
Passenger experience rating threshold 0 to 5, with 5 the highest score.
Based on 15min time periods
measured
Printed: 27 Nov 2017 at 15:16. For further information please contact: [email protected] or click here.
TTS - One car
TTS - Two cars
99.00% 99.96% 0.00%
97.00% 99.44% -0.18%Track Transit System - % time
two cars available
Track Transit System - one car
availability
Transfer Search95.00% 99.04% 0.36%
0.07%% Pier served passengers
Staff search99.00% 99.98% 1.30%
CSA queues - Times
queue <10 minutes99.00% 99.98% 0.05%
Pier Service*
Bag reclaim belts availability95.00%
Based on 15min time periods
measured
Based on 15min time periods
measured
96.42% 1.22%Arrivals reclaims
90.70%
99.96% -0.03%
99.68% 0.10%Ease of using WiFi
Security*4.19 0.00 98.00% 99.80%
Jetties
Availability of Air-Bridges
0.17%
Wi-Fi*
99.00%SEGs
Availability of Stand entry
guidance
CSA queues - Times
queue <5 minutes95.00% 97.72% 0.93%
Based on 15min time periods
measured
99.00% 99.98% 0.04%Accuracy and ease of finding
flight information
Availability Fixed Electrical
Ground Power
4.18 -0.01 99.00%
Passenger satisfaction
PCA
Availability of Pre-Conditioned
Air
Flight information*4.30 4.39 0.00
FEGP
99.00% 99.62% -0.05%Overall cleanliness of the
terminal
PSE (General)
Availability of Passenger
Sensitive Equipment (General)
PSE (Priority)
Availability of Passenger
Sensitive Equipment (Priority)
Wayfinding*4.10 4.23 0.00
Stands99.00% 99.84% -0.02%
Ease of finding your way
around the airport
Availability of stands
Cleanliness*4.00 4.27 0.00
Terminal 5 Performance Report October 2017Passenger Experience and Service Level Performance
Departure lounge
seat availability*3.80 4.09 0.00 99.00% 99.48% 0.15%
Ease of finding a seat
3.70
3.90
4.10
4.30
4.50
3.90
4.10
4.30
4.50
Nov Dec Jan Feb Mar Apr May Jun Jul Aug Sep Oct
4.00
4.10
4.20
4.30
4.40
4.50
4.20
4.30
4.40
4.50
3.90
4.10
4.30
4.50
4.00
4.10
4.20
4.30
4.40
4.50
94%
96%
98%
100%
98%
99%
100%
94%
96%
98%
100%
94%
96%
98%
100%
Nov Dec Jan Feb Mar Apr May Jun Jul Aug Sep Oct
98%
99%
100%
98%
99%
100%
98%
99%
100%
98%
99%
100%
98%
99%
100%
97%
98%
99%
100%
98%
99%
100%
88%
90%
92%
94%
96%
98%
100%
98%
99%
100%
98%
99%
100%
96%
97%
98%
99%
100%
5
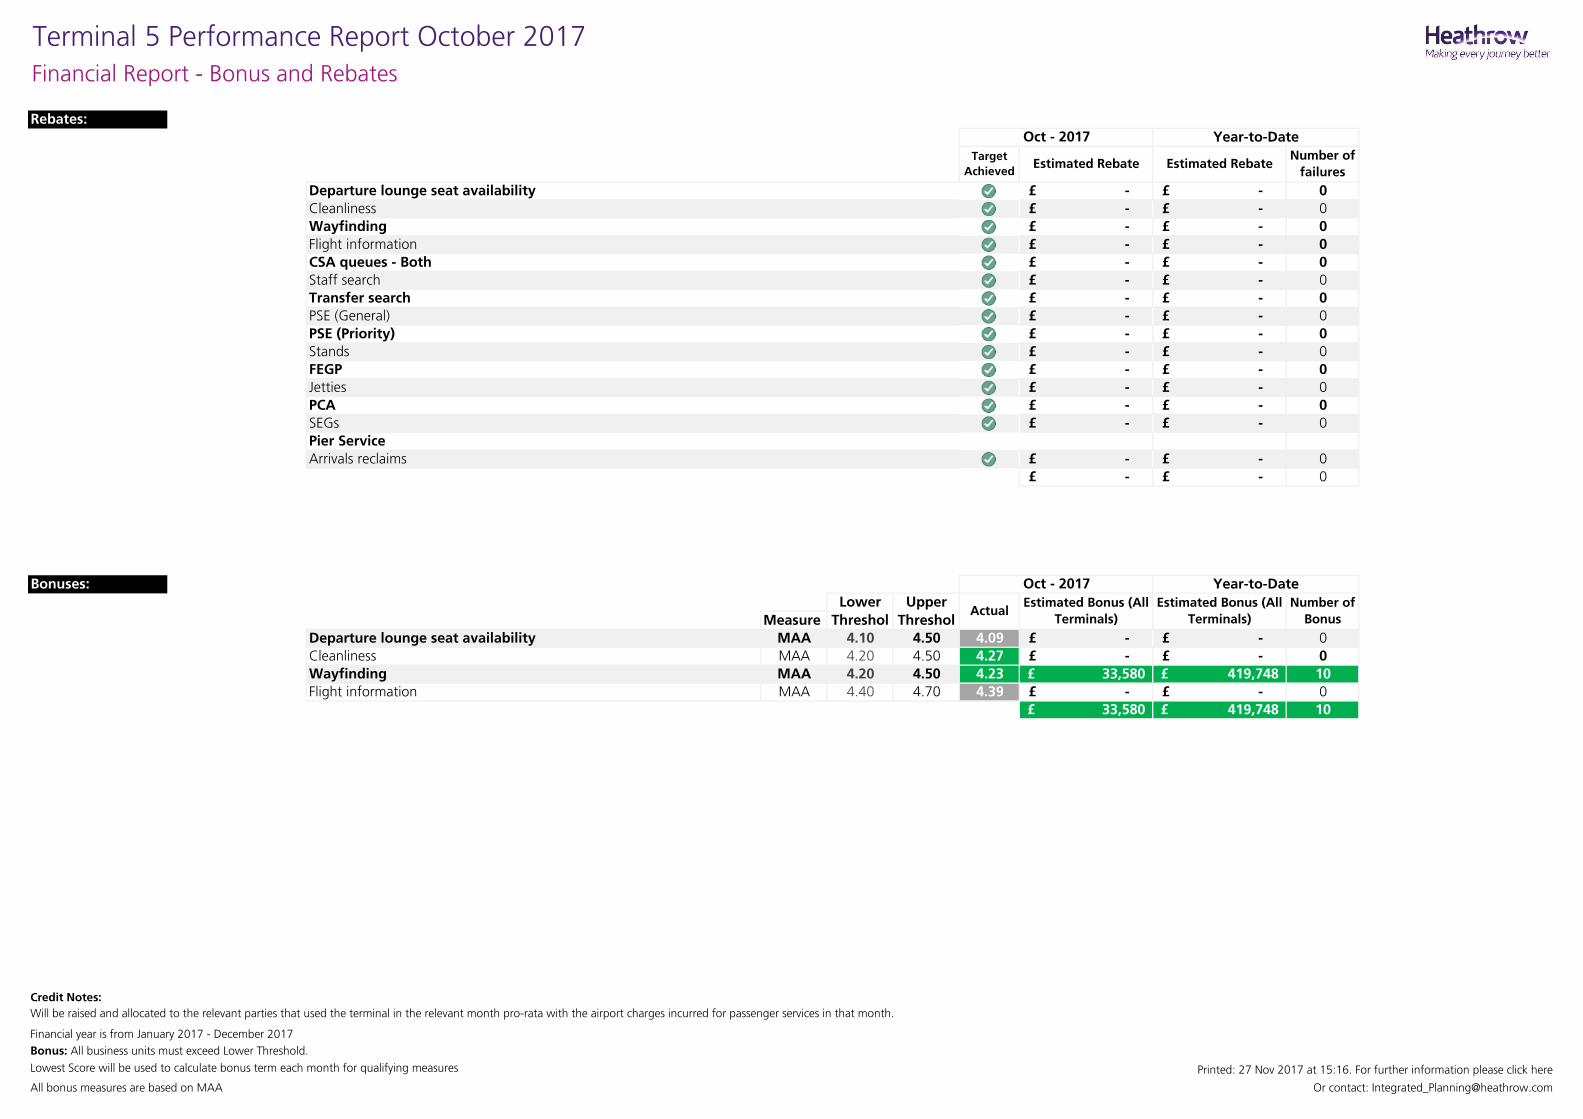
Rebates:
Departure lounge seat availability -£ -£ 0
Cleanliness -£ -£ 0
Wayfinding -£ -£ 0
Flight information -£ -£ 0
CSA queues - Both -£ -£ 0
Staff search -£ -£ 0
Transfer search -£ -£ 0
PSE (General) -£ -£ 0
PSE (Priority) -£ -£ 0
Stands -£ -£ 0
FEGP -£ -£ 0
Jetties -£ -£ 0
PCA -£ -£ 0
SEGs -£ -£ 0
Pier Service
Arrivals reclaims -£ -£ 0
-£ -£ 0
Bonuses:
Measure
Departure lounge seat availability MAA 4.10 4.50 4.09 -£ -£ 0
Cleanliness MAA 4.20 4.50 4.27 -£ -£ 0
Wayfinding MAA 4.20 4.50 4.23 33,580£ 419,748£ 10
Flight information MAA 4.40 4.70 4.39 -£ -£ 0
33,580£ 419,748£ 10
Credit Notes:
Financial year is from January 2017 - December 2017
Bonus: All business units must exceed Lower Threshold.
Lowest Score will be used to calculate bonus term each month for qualifying measures
All bonus measures are based on MAA
Printed: 27 Nov 2017 at 15:16. For further information please click here
Or contact: [email protected]
Oct - 2017 Year-to-Date
Lower
Threshol
Upper
ThresholActual
Estimated Bonus (All
Terminals)
Estimated Bonus (All
Terminals)
Number of
Bonus
Will be raised and allocated to the relevant parties that used the terminal in the relevant month pro-rata with the airport charges incurred for passenger services in that month.
Terminal 5 Performance Report October 2017
Financial Report - Bonus and Rebates
Oct - 2017 Year-to-Date
Target
AchievedEstimated Rebate Estimated Rebate
Number of
failures

Service Level Performance Service Level Performance
Control Post Security Search
CTA T5
Central Terminal Zone: Terminal 5 Zone:
CP5 CP18
CP8 CP19
CP20
Cargo
Cargo Zone:
CP10 SouthSide
SouthSide Zone:
CP10a CP24
CP25a
Rebates:
EastSide
EastSide Zone:
Credit Notes:
CP16
Financial year is from January 2017 - December 2017
0.47%
-0.40%
-0.23%
-0.30%
Oct - 2017
0
0
Or contact: [email protected]
Printed: 27 Nov 2017 at 15:16. For further information please click here
-£ -£ 0
-£ -£ 0
Target
Achieved
Estimated
Rebate
Estimated
Rebate
Number of
failures
-£ -£ 0
T4
T5 -£ -£
-£ -£
-0.07%
-2.58%
0.00%
0.29%
-0.09%
CP24
CP18, CP19 and CP20
2.23%
2.41%
2.06%
95.00% 97.56%
95.00% 95.47%
95.00% 95.47%
-0.21%
0.96%
0.96%
Financial Report
CP16
95.00% 96.73%
95.00% 96.32%
95.00% 96.32%
Year-To-Date
Will be raised and allocated to the relevant parties that used the terminal in the relevant month pro-rata with the
airport charges incurred for passenger services in that month.
T2
T3
95.00% 97.97%
95.00% 99.47%
95.00% 97.04%
95.00% 89.15%
Financial Report - Bonus and Rebates
Campus Performance Report October 2017
CP5 & CP8
CP10, CP10a & CP25a
95.00% 98.02%
95.00% 96.96%
95.00% 99.00%
95.00% 95.10%
95.00% 99.43%
Nov Dec Jan Feb Mar Apr May Jun Jul Aug Sep Oct
93%94%95%96%97%98%99%
100%
93%94%95%96%97%98%99%
100%
93%94%95%96%97%98%99%
100%
93%94%95%96%97%98%99%
100%
93%94%95%96%97%98%99%
100%
86%88%90%92%94%96%98%
100%
93%94%95%96%97%98%99%
100%
93%94%95%96%97%98%99%
100%
93%94%95%96%97%98%99%
100%
Nov Dec Jan Feb Mar Apr May Jun Jul Aug Sep Oct
93%94%95%96%97%98%99%
100%
93%94%95%96%97%98%99%
100%
93%94%95%96%97%98%99%
100%
93%94%95%96%97%98%99%
100%
93%94%95%96%97%98%99%
100%
93%94%95%96%97%98%99%
100%