Embed Size (px)
Citation preview

Heather Burnett GoldPresident & CEO
FTTH Council AmericasFiber for the New Economy 9/16/15
The Economic Case for
Fiber to the Home

Overview
• The FTTH Council Americas sponsors key market studies to analyze the impact of FTTH• Annual studies• Annual Market Survey (RVA)• Annual Consumer Survey (RVA)
• Topical studies• Impact of Gigabit Broadband on GDP (2014)(Analysis Group)• Impact of High-Speed Internet Service on Housing Prices (2015)
(Molnar, Savage, Sicker)

• Study examined whether the introduction of wide spread availability of gigabit broadband has a comparable impact on economic welfare as did the introduction of “always on” DSL and cable modems in the late 90s.
• Used NTIA data to identify MSAs in which >50% of the homes were passed by gigabit broadband in 2011-12• 14 MSAs in 9 states• On average 70% had access to gigabit broadband in 2012
• Group was compared to 41 similarly sized MSAs in same 9 states• Gigabit broadband was not widely widely available
• All MSAs review had populations <1 million.
• Used a year and MSA fixed effects regresssion model to control for other GDP drivers
Impact of Gigabit Broadband on GDP
Impact of Gigabit Broadband on GDP
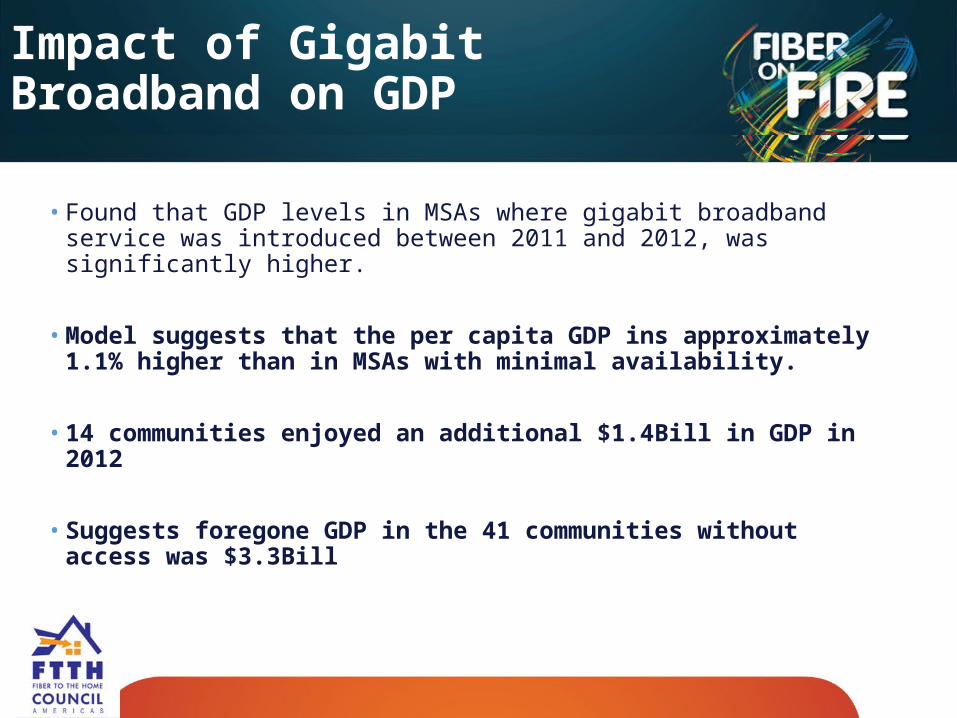
• Found that GDP levels in MSAs where gigabit broadband service was introduced between 2011 and 2012, was significantly higher.
• Model suggests that the per capita GDP ins approximately 1.1% higher than in MSAs with minimal availability.
• 14 communities enjoyed an additional $1.4Bill in GDP in 2012
• Suggests foregone GDP in the 41 communities without access was $3.3Bill
Impact of Fiber Access on Home Prices
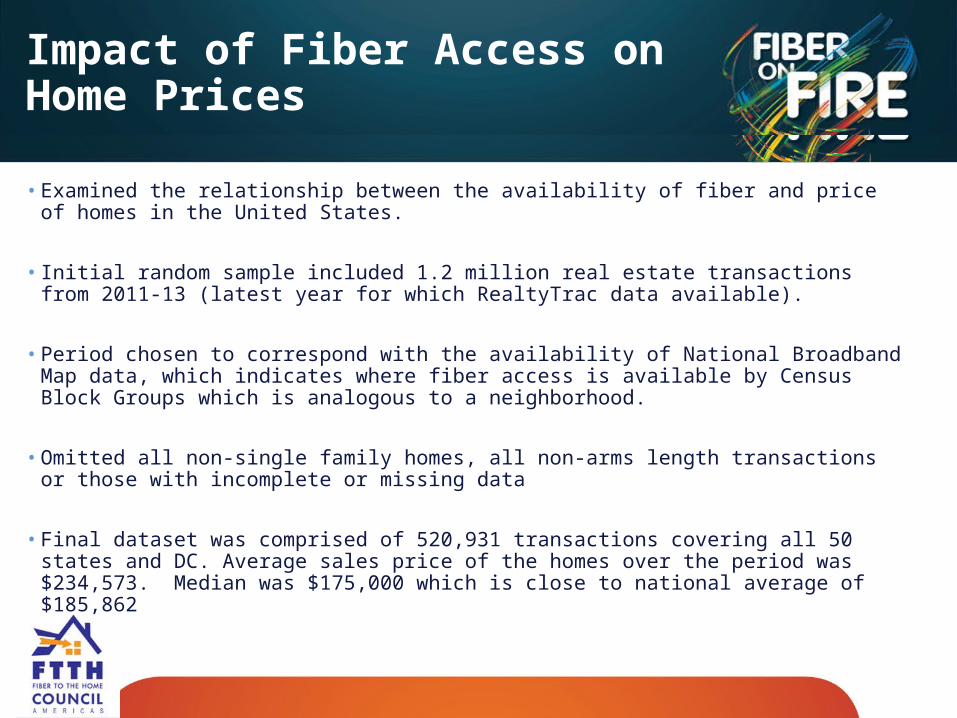
• Examined the relationship between the availability of fiber and price of homes in the United States.
• Initial random sample included 1.2 million real estate transactions from 2011-13 (latest year for which RealtyTrac data available).
• Period chosen to correspond with the availability of National Broadband Map data, which indicates where fiber access is available by Census Block Groups which is analogous to a neighborhood.
• Omitted all non-single family homes, all non-arms length transactions or those with incomplete or missing data
• Final dataset was comprised of 520,931 transactions covering all 50 states and DC. Average sales price of the homes over the period was $234,573. Median was $175,000 which is close to national average of $185,862
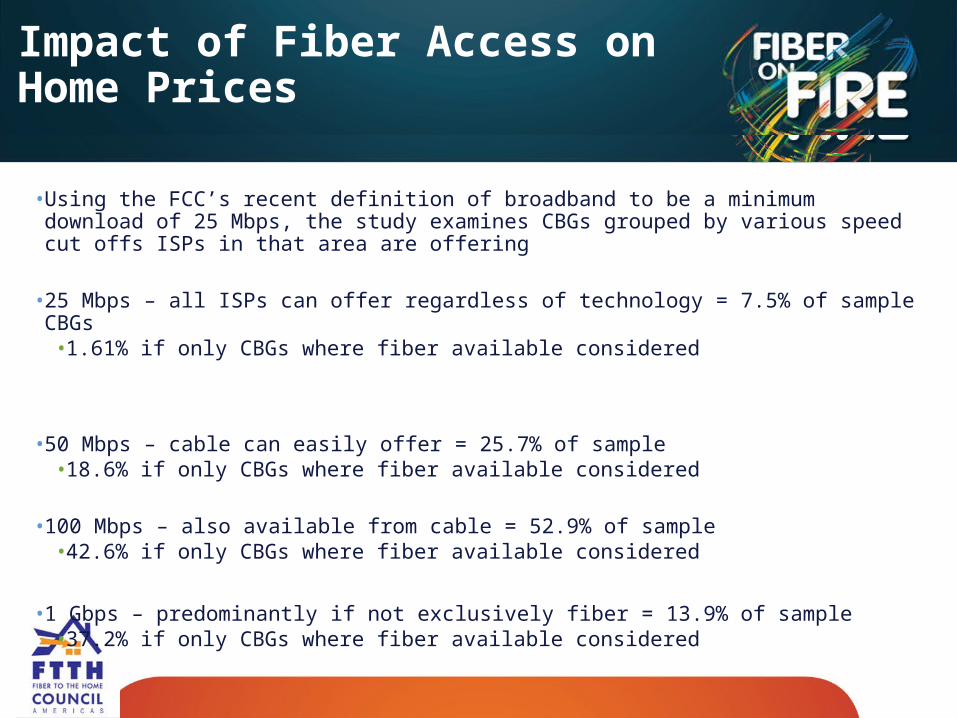
• Using the FCC’s recent definition of broadband to be a minimum download of 25 Mbps, the study examines CBGs grouped by various speed cut offs ISPs in that area are offering
• 25 Mbps – all ISPs can offer regardless of technology = 7.5% of sample CBGs• 1.61% if only CBGs where fiber available considered
• 50 Mbps – cable can easily offer = 25.7% of sample• 18.6% if only CBGs where fiber available considered
• 100 Mbps – also available from cable = 52.9% of sample• 42.6% if only CBGs where fiber available considered
• 1 Gbps – predominantly if not exclusively fiber = 13.9% of sample• 37.2% if only CBGs where fiber available considered
Impact of Fiber Access on Home Prices

Results• Access to 1 Gbps connection = + 1.8% to home’s price• Access to fiber connection = + 1.3% to home’s price
• Total Impact = +3.1% ($5437)
• Equivalent to the value of adding a fireplace or ½ of a bathroom
Impact of Fiber Access on Home Prices


![เทคโนโลยี FTTh [Fiber-to-the-home]](https://img.dokumen.tips/doc/110x75/568134f6550346895d9c3e49/-ftth-fiber-to-the-home.jpg)


