Embed Size (px)
Citation preview
Quantification of energy fluxes in contracting muscle in manis difficult. In isometric contractions with a well-definedmuscle group this has been attempted when the force of thecontraction causes a complete mechanical hindrance to theblood flow, i.e. when aerobic energy yield plays no role(Edwards et al. 1972; Saugen & Vœllested, 1995). In intensedynamic exercise, however, oxidation is the primary energy-liberating pathway after •60 s of exercise, while at theonset of dynamic exercise anaerobic energy productionpredominates. At the whole body level oxygen consumptioncan be precisely determined in humans, but it is more of aproblem to measure the amount of oxygen used by a specific
muscle or muscle group. To, at least in part, overcome thisproblem the one-legged knee-extensor exercise model wasdeveloped, confining the dynamic contractions largely to thequadriceps muscle (Andersen et al. 1985; Ray & Dudley,1998; Richardson et al. 1998). Blood flow to or from thismuscle can be measured, as can the arterial—venous (a—v)difference for oxygen, giving the oxygen uptake by the Fickprinciple. During steady-state submaximal dynamic knee-extension exercise, the mechanical efficiency estimatedaccording to the traditional concept (i.e. the ratio betweenpower output and the sum of the caloric equivalent of oxygenconsumption and power output; Benedict & Cathcart, 1913)
Journal of Physiology (2000), 524.2, pp.603—615 603
Heat production in human skeletal muscle at the onset of
intense dynamic exercise
Jos�e Gonz�alez-Alonso, Bjœrn Quistorff, Peter Krustrup, Jens Bangsboand Bengt Saltin
Copenhagen Muscle Research Centre, August Krogh Institute, University of Copenhagen,Copenhagen, Denmark
(Received 20 October 1999; accepted after revision 11 January 2000)
1. We hypothesised that heat production of human skeletal muscle at a given high power outputwould gradually increase as heat liberation per mole of ATP produced rises when energy isderived from oxidation compared to phosphocreatine (PCr) breakdown and glycogenolysis.
2. Five young volunteers performed 180 s of intense dynamic knee-extensor exercise (•80 W)while estimates of muscle heat production, power output, oxygen uptake, lactate release,lactate accumulation and ATP and PCr hydrolysis were made. Heat production wasdetermined continuously by (i) measuring heat storage in the contracting muscles,(ii) measuring heat removal to the body core by the circulation, and (iii) estimating heattransfer to the skin by convection and conductance as well as to the body core by lymphdrainage.
3. The rate of heat storage in knee-extensor muscles was highest during the first 45 s of exercise(70—80 J s¢) and declined gradually to 14 ± 10 J s¢ at 180 s. The rate of heat removal byblood was negligible during the first 10 s of exercise, rising gradually to 112 ± 14 J s¢ at180 s. The estimated rate of heat release to skin and heat removal via lymph flow was< 2 J s¢ during the first 5 s and increased progressively to 24 ± 1 J s¢ at 180 s.
4. The rate of heat production increased significantly throughout exercise, being 107% higherat 180 s compared to the initial 5 s, with half of the increase occurring during the first 38 s,while power output remained essentially constant.
5. The contribution of muscle oxygen uptake and net lactate release to total energy turnoverincreased curvilinearly from 32% and 2%, respectively, during the first 30 s to 86% and8%, respectively, during the last 30 s of exercise. The combined energy contribution fromnet ATP hydrolysis, net PCr hydrolysis and muscle lactate accumulation is estimated todecline from 37% to 3% comparing the same time intervals.
6. The magnitude and rate of elevation in heat production by human skeletal muscle duringexercise in vivo could be the result of the enhanced heat liberation during ATP productionwhen aerobic metabolism gradually becomes dominant after PCr and glycogenolysis haveinitially provided most of the energy.
0244
Keywords:

was found to be •25% (Andersen & Saltin, 1985), which isin the upper range of what has been observed at the wholebody level with cycle ergometer exercise ( �Astrand, 1960).With more intense exercise and at the onset of exercise notonly the oxygen uptake, but also the anaerobic energyliberation has to be determined in order to obtain anestimate of energy turnover. Bangsbo et al. (1990) havemade such an attempt using the knee-extensor model. Theanaerobic processes were estimated from the reductions ofmuscle ATP and PCr, the accumulation of glycolyticintermediates and lactate, and the release of lactate.Although there was an acceptable match between thisestimate of the anaerobic energy yield and the oxygendeficit (total energy turnover − aerobic energy turnover) itdid not provide sufficient insight since total energy turnoverduring exercise remained unknown.
The appropriate approach, novel in humans performingdynamic exercise, would be to measure heat production,power output and aerobic and anaerobic energy turnover.This approach has a long and successful history in muscleenergetics in the in vitro study of muscle fibres (Wilkie,1960; Hill & Woledge, 1962; Kushmerick et al. 1969), invivo in exercising animals (Ardevol et al. 1998) and in manperforming isometric contractions (Edwards et al. 1972,1975; Saugen & Vœllested, 1995, 1996). Furthermore, earlywork of Barcroft & Edholm (1942) and Pennes (1948)established the theoretical basis for the quantification ofheat transfer in perfused tissue. Despite the complexity ofthe various tissues, muscle fibre and motor unit recruitment(Lexell et al. 1983), the knee-extensor model could provide ameans to precisely determine total heat production indynamic exercise by measuring heat stored in thecontracting muscles and that dissipated from the muscle. Ifheat capacity and muscle mass are known, it is possible todetermine heat storage via thermosensors placed in thevarious active muscle portions. Heat dissipation fromdynamically contracting muscles consists of heat transfer tothe core of the body (limb blood flow ² v—a temperaturedifference according to the Fick principle) and tosurrounding tissues or environment. Heat conductancethrough tissues in the human body is a slow process (Hensel& Bock, 1955) and in knee-extensor exercise it can beestimated based on temperature measurements of inactivetissues within the thigh, including the subcutis. Heatexchange with the surroundings of the exercising thigh(convection and conduction) can be minimised by athermostat isolation system.
Thus, the aim of this study was to quantify energyliberation at the onset of and during short intense dynamicexercise by continuously measuring the rate of heatproduction and power output by the knee-extensors. Thiswas done to test the hypothesis that in man the efficiency ofconversion of chemical energy to mechanical power is highin the transition from rest to exercise, and then graduallydeclines corresponding to the change in source of ATPproduction. This hypothesis is based on the findings from in
vitro studies that heat liberation during ATP utilisationvaries from 35 to 72 kJ (mol ATP)¢ depending uponwhether PCr, glycolysis or oxidative phosphorylationprovide the energy for ATP resynthesis (Wilkie, 1968;Curtin & Woledge, 1978; Woledge & Reilly, 1988). Thus, anincrease in heat production in the order of a factor of twowould be anticipated with a shift in ATP resynthesis frompure PCr splitting to pure oxidative phosphorylation.Continuous measurements were performed of the aerobicmetabolism whereas data on the anaerobic contributioncould not be obtained simultaneously due to technicalrestraints. However, such information is available fromparallel studies using the same exercise model and of thesame intensity and duration.
METHODS
Subjects
The five healthy, recreationally active males participating in thisstudy possessed a mean age of 24 years (range 22—25 years), meanbody weight of 76·6 kg (55—92 kg) and a mean height of 180 cm(169—192 cm). The peak oxygen uptake of the quadriceps muscle ofone leg was 0·89 l min¢ (0·59—1·05 l min¢) (Table 1). The studywas approved by the Ethics Committee of Copenhagen andFrederiksberg communities and was carried out in accordance withthe Declaration of Helsinki. Subjects gave written informed consentbefore participating.
Mechanical power output
Power output was continuously recorded during exercise. The meanforce produced by the knee-extensor muscles during each kick wasestimated by integrating the area under the curve (over the activeangle •80—170 deg of the kicking cycle) obtained from the changesin voltage detected by a strain-gauge placed between the ankle andthe metal rod connecting the leg to the fly-wheel (Andersen et al.1985). The strain-gauge was calibrated by placing weights of knownmass (5 and 20 kg) on the metal rod. The duration of the kick wasmeasured by optical encoders on the cranks of the cycle ergometer.Power output was calculated by estimating the external work doneon the ergometer as well as the work done to lift the lower leg.
Oesophageal, arterial, skin and muscle temperatures
Commercially available thermistors were used to continuouslymonitor skin and oesophageal temperatures (MHC-40050-A,Ellab AÏS, Rœdovre, Denmark) and for muscle and vessel bloodtemperatures (Edslab, TD probe 94-030-2.5F).
Thigh blood flow
Femoral venous blood flow was measured by a modified version ofthe thermodilution technique originally described by Andersen &Saltin (1985). With the same experimental set-up, we obtainedcontinuous measures of the infusate and femoral venous bloodtemperatures, allowing the calculation of femoral venous blood flowsecond by second during the time of infusion of cold saline (20 s;1—3°C) after an initial stabilisation period of 5 s. This was achievedby connecting the thermistors (Edslab, TD probe 94-030-2.5F) viaa custom-made interface to a Macintosh Performa computer using aMacLab 8:s data acquisition system (ADInstruments, Sydney,Australia). The data sampling frequency was 100 Hz. Before andduring the second 3 min exercise bout, femoral venous blood flow(index of thigh blood flow; TBF) was measured at rest, during thepassive acceleration phase, and at the time intervals 0—10, 40—55,80—95, 120—135 and 170—180 s during the exercise. Infusate
J. Gonz�alez-Alonso and others J. Physiol. 524.2604

temperature was measured at the site where the infusate enteredthe venous catheter (•8 cm from the tip of the catheter). The set-upwas tested under in vitro conditions to determine the linearity ofthe system up to blood flows of 10 l min¢. The in vitro experimentwas also used to determine the elevation in the infusatetemperature occurring as the infusate travels from the measuringpoint to the tip of the catheter. Infusate temperature was correctedaccordingly by 0·6°C with infusion rates of 1·866 ml s¢ (exerciseconditions) and by 1·0°C with infusion rates of 0·766 ml s¢(resting conditions and passive acceleration phase). TBF (expressedin ml s¢) was calculated according to the following formula,derived from a heat balance equation (Ganz & Swan, 1974;Andersen & Saltin, 1985):
SICI (TB − TI)TBF = VI ² ––– ² (––––– − 1),
SBCB (TB − TM)
where VI represents infusate rate (ml s¢), TB is blood temperaturebefore saline infusion (°C), TI is temperature of infusate, TM istemperature of blood—saline mixture during steady state (after 5 sinfusion), SI and SB are specific gravities of infusate and blood(1·005 and 1·045 g cm¦Å), respectively, and CI and CB are specificheats of infusate and blood (4·173 and 3·600 J g¢ °C¢),respectively.
Under the present experimental conditions (non-steady state), thereference blood temperature increased 0·05—0·09°C during the 20 sof infusion. Furthermore, although venous blood temperature wasrestored in less than 1 s upon termination of the infusion period,repeated blood flow measurements reduced the venous bloodtemperature by 0·10—0·15°C after 3 min of exercise compared tothat observed during the first bout (no blood flow measurements).Notwithstanding, correction for this effect only increased thighblood flow values by < 1%. This effect is therefore negligiblecompared to the oscillations of limb blood flow from kick to kick(see Results).
Data sampling
Muscle and blood temperatures as well as power output wererecorded with a sampling frequency of 100 Hz. In addition to thethermistors in the blood vessels (femoral artery and vein) each ofthe muscle thermistors were connected via another custom-madeinterface and AÏD converter to an IBM computer board. Data werestored on a hard disk and displayed on-line, using LabVIEW 4.0software (National Instruments, Austin, TX, USA). Temperaturedata were then averaged per second and expressed in degreesCelsius. The seven skin thermistors and the oesophageal thermistorwere connected to an eight-channel temperature monitor (Ellab
CTF 9008 Precision thermometer; Ellab AÏS) interfaced with anIBM-AT computer. Data were stored on a hard disk every 15 s andalso simultaneously displayed on-line using the data acquisitionsoftware PCLINK92 (Ellab AÏS).
Muscle mass
Muscle mass was determined by magnetic resonance imaging (MRI)performed on a Siemens 1.5 T MAGNETOM vision scanner(Siemens, Germany). For each subject, 30—33 parallel axialT1_weighted images (cross-sections) of the right thigh (i.e. from theanterior superior iliac spine to the patellar ligament) were obtainedwith a multi-slice spin-echo FLASH sequence (TÔ is the spin-latticerelaxation time; repetition time (TR ) = 500 ms, echo time(TE ) = 15 ms) using a standard body coil. Slice thickness was 3 mmwith 12 mm interslice distance. Pixel size was 1·2 mmÂ. Thissetting was selected to optimise image quality in order to mostclearly separate muscle, bone, fat, and connective tissue.
Definitions of anatomical cross-sections were performed manuallyand the area calculations made using NIH Image software(Rasband & Bright, 1995). The proximal portion of the patella wasconsidered as the zero-reference slice for all the subjects. Thevolume of the compartments was calculated as the sum of eachanatomical cross-sectional area times the distance covered by eachslice (1·5 cm). Volume values were converted into mass values usingthe specific density of each compartment (1·043 for muscle, 0·9 forfat, 1·791 for femur, 1·053 for skin, and 1·045 for soft tissue; vonD�obeln, 1956). The anatomical compartments investigated were:(1) quadriceps plus tensor fasciae latae muscles (active during knee-extensor exercise), (2) hamstring, sartorious and adductor musclescomplex (inactive), (3) bone (femur) and (4) skin, subcutaneous fatand connective tissue complex (Fig. 1A and B).
Procedures and protocol
In preparation for this study the subjects were familiarised with theexercise model by training at a desired cadence while minimisingthe involvement of the hamstring and gluteal muscles, and therebyconfining the work to the knee-extensor muscles. In thepreliminary trials they also became accustomed to a thermistorplaced in the oesophagus at the level of the heart while exercising.
On the morning of the experiment, subjects arrived after a lightbreakfast. Three catheters were placed by the Seldinger technique atthe level of the inguinal ligament. In the resting leg, a catheter wasplaced in the femoral artery for blood sampling. In the exercisingleg, catheters were placed in both the femoral vein and artery.Through these latter two catheters, thermistors (Edslab probe94_030-2.5F) were placed just at the tip of the catheters for the
Muscle energy exchange in dynamic exerciseJ. Physiol. 524.2 605
––––––––––––––––––––––––––––––––––––––––––––––––––––––––––––––––––––––––––––––––––––––––––––––––––––––––––––––––––––––––Table 1. Subject characteristics
––––––––––––––––––––––––––––––––––––––––––––––––––––––––––––Quadriceps Hamstrings, Skin,
Mean and tensor sartorious and subcutaneous fat, Total Peak ýOµSubject Age Weight Height power output fasciae latae adductors connective tissue Femur thigh thighno. (years) (kg) (cm) (W) (kg) (kg) (kg) (kg) (kg) (l min¢)
––––––––––––––––––––––––––––––––––––––––––––––––––––––––––––1 24 74 178 87 2·6 2·8 1·1 0·7 7·2 0·992 24 90 188 72 3·0 3·7 2·1 0·9 9·8 0·783 25 55 169 66 2·1 2·8 0·8 0·7 6·5 0·594 22 92 192 109 3·3 3·6 1·7 1·0 9·6 1·025 24 72 172 80 2·4 2·5 1·2 0·7 6·7 1·05
Mean 24 77 180 83 2·7 3·0 1·4 0·8 7·9 0·89± s.d. 1 15 10 17 0·5 0·6 0·5 0·2 1·6 0·20
––––––––––––––––––––––––––––––––––––––––––––––––––––––––––––––––––––––––––––––––––––––––––––––––––––––––––––––––––––––––

measurements of arterial—venous differences for temperature (°C).Following the placement of the arterial and venous catheters, seventhermistors of the same type were inserted into the thigh musclesthrough a venflon catheter (18GÏ32 mm). The tip of the thermistorprobe used in the muscle was cut 2—3 mm beyond the thermistor
location, which was advanced into the muscle 0·5—0·8 cm beyondthe catheter tip (approximately 3·0—4·0 cm into the thigh,depending upon muscle group and size of subjects). Differentinclinations (30, 45 and 60 deg) with respect to the length directionof the muscle fibres were used when the thermistors were inserted.
J. Gonz�alez-Alonso and others J. Physiol. 524.2606
Figure 1. Anatomical compartments of the thigh and quantification of the knee-extensor muscle
mass
A, MRI of cross-sections of upper-thigh (a) and mid-thigh (b) with the white line indicating borders ofquadriceps femoris muscle, including vastus lateralis (v. l.), vastus intermedius (v. i.), vastus medialis (v.m.),rectus femoris (r.f.) and tendon of quadriceps femoris muscle (t). A cross-section of the distal end is shown in c.It was sometimes difficult to exactly determine the origin of the muscles at the proximal end (a). This wassolved by plotting the serial individual cross-sections and determining the origin by extrapolation (see Ba).Mean values ± s.e.m. for all subjects’ serial cross-sections of the thigh are shown in Bb.

This minimised their movement, reduced the risk of damaging themuscle or the thermistors and minimised the discomfort of subjects.Three thermistors were inserted in the vastus lateralis (v. l.,proximal, medial and distal portions), two in the rectus femoris (r.f.,medial and distal portions), one in the distal portion of the vastusmedialis (v.m.), and one in the medial portion of the biceps femoris.The flexible venflon catheter was left in place to provide protectionfor the thermistor probe. The thermistor probes and the venfloncatheters were fastened to the skin with tape. Due to the difficultyreaching the vastus intermedius (v. i.) muscle, which is locatedunderneath the rectus femoris (Fig. 1A), thermistors were onlyplaced in this muscle group in two separate additional experiments.Next to each of the seven muscle thermistor probes, a skinthermistor was placed and secured to the skin with tape.Thereafter, the oesophageal thermistor was inserted through thenostril down to the level of the heart.
To minimise the heat losses to the environment surrounding theexercising leg via convection and conductance, local muscle, skin,and blood temperatures were equalised to the core temperature(•oesophageal � 37°C) by perfusing a cuff surrounding the thighwith warm water (•41°C). This procedure lasted 45—60 min untilmuscle and tissue temperatures were •37°C (Fig. 3). Thereafter,the temperature of the water was reduced to 37·5°C to minimiseheat transfer to or from the surroundings.
The subject performed the 3 min knee-extensor exercise with theright leg in a recumbent position at a mean power output of83 ± 9 W (mean kicking frequency of 1·03 ± 0·02 s¢) for 3 min.The work was close to exhaustive for the subject. During exercise,the left leg was resting. Over a period of 30 s prior to the voluntaryexercise, the lower part of the right leg was accelerated passively upto the target cadence to ensure that the subject did not use extraenergy to accelerate the fly-wheel. During the 3 min exercise perioda cuff just below the knee was inflated to 240 mmHg to avoid anytransport of heat to or from this part of the leg. Additionally, bloodsamples were withdrawn from the femoral artery and vein at rest,during passive exercise and at 13, 31, 50, 75, 128 and 176 s of thefirst exercise bout, for later analysis of oxygen saturation andhaemoglobin concentration (OSM-3 Hemoximeter, Radiometer,Copenhagen, Denmark) as well as blood lactate (lactate analyser;Yellow Springs Instruments, Yellow Springs, OH, USA).
To determine the thigh blood flow the subjects repeated the sameexercise after 1 h of recovery during which femoral venous bloodflow was measured using the thermodilution method, as explainedabove. The reason for measuring blood flow during this second boutof exercise was to avoid the confounding effect of infusing coldsaline on venous and arterial blood temperatures. Previous resultsfrom this laboratory indicate that the pattern and the magnitude offemoral venous blood flow are the same during a first and a secondbout of intense knee-extensor exercise, separated by 1 h of recovery(Bangsbo et al. 1992). After each experiment all thermistors wereimmediately calibrated within the temperature range 35—40°Cagainst a mercury thermometer having a precision of 0·01°C. Theresponse time of the thermistors in the muscles and in the bloodvessels, being Teflon imbedded, was û 0·8 s.
Calculations (see Fig. 2)
Rate of heat storage in active muscles. The rate of heat storage(�Hs) in the active muscles (i.e. quadriceps and tensor of fasciae latae)was calculated for 5 s intervals by multiplying the mean increase intemperature of all muscle portions in 5 s (ÄTm; °C) by the musclemass (m; kg) and the specific heat of the muscle at 37·5 °C(cm = 3590 J kg¢ °C¢), assuming a 23% solid content (based onan average water content in quadriceps muscle of 77%). The
resulting value was divided by 5 to express the rate of heat storagein joules per second. The active muscle mass was corrected by theestimated increases in muscle volume observed during intenseknee-extensor exercise (Bangsbo et al. 1992; Ray & Dudley, 1998).The same principle was used to determine the rate of heat storagein the hamstrings muscle:
�Hs = ÄTmmcm. (1)
Rate of heat removal by the blood. The mean thigh blood flow(TBF; l s¢) during each 5 s interval was estimated from theindividual curve fitting applying a 3rd-order polynomial model(r = 0·84—0·93). The rate of heat removal by the blood (�Hr) wascalculated for 5 s intervals by multiplying the mean v—atemperature gradient (Tv—a; °C) by TBF and the specific heat of theblood at 37·5°C (blood specific heat (cb) = 3610 J l¢ °C¢;haemotocrit •45%):
�Hr = Tv—a ² TBF ² cb. (2)
Additional heat loss
The additional rate of heat loss ( �Ha) was calculated by adding theestimated heat loss to the surrounding skin by the processes ofconductance and convection as well as the heat transfer to the bodycore by the lymph drainage.
(1) Rate of heat loss by conductance. The heat transfer from theknee-extensor muscles to the skin through conductance ( �Hc) wasestimated every 5 s by multiplying the temperature gradientbetween the muscle and skin (ÄTm—sk; °C) by the thermalconductivity of human muscle (ch = 4·8 J s¢ cm¢ °C¢; Hensel &
Muscle energy exchange in dynamic exerciseJ. Physiol. 524.2 607
Figure 2. Schematic model used for calculation of total
energy turnover
Ta and Tv, arterial and venous temperature. Tv—a,venous—arterial temperature difference. ÄTm, mean increasein temperature of all muscles.

Bock, 1955) and the mean distance through which heat is conductedin the anterior thigh (l = •3 cm):
�Hc = ÄTm—sk ² ch ² l. (3)
(2) Rate of heat loss by convection. Heat loss from the skin of thethigh by convection ( �Hcv) was calculated every 5 s by multiplyingthe estimated thigh skin blood flow (SkBF = 0·005 l s¢ measuredin the saphenous vein) by the temperature gradient between thearterial blood and saphenous venous blood (equal to skintemperature under these conditions; Ta—v, °C) and the specific heatof the blood (cb = 3610 J l¢ °C¢):
�Hcv = Ta—v ² SkBF ² cb. (4)
(3) Rate of heat loss by the lymph flow. Heat loss by the lymph flow( �Hl) was estimated by multiplying the estimated lymph flow(LF = 0·003 l s¢) by the arterial-to-lymph temperature gradient,assuming that the lymph leaving the thigh has the sametemperature as the venous blood and the same specific heat asplasma (cp = 3930 J l¢ °C¢):
�Hl = Ta—v ² LF ² cp. (5)
Rate of heat production. Total rate of heat production ( �Ht) wascalculated by adding the rate of heat storage in the active muscles,the rate of heat removal by the blood and the rate of heat transferto the skin by conductance and convection as well as to the bodycore by the lymph drainage:
�Ht = �Hs + �Hr + �Ha, where �Ha = �Hc + �Hcv + �Hl. (6)
Total energy turnover (�Et) was calculated by summing �Ht andmechanical power output (W):
�Et = �Ht + W. (7)
Mechanical efficiency. Mechanical efficiency (MEf) was calculatedby dividing the mechanical power output by the total energyturnover:
MEf = W�Et. (8)
Aerobic and anaerobic heat liberation. Oxygen uptake (ýOµexpressed in ml s¢) of the exercising thigh was obtained by
multiplying the a—v Oµ difference by thigh blood flow (Fickprinciple), and converted into moles of Oµ assuming that 1 mole Oµequals 25·4—25·5 l Oµ when temperature ranges from 37 to 38°C.ýOµ was then converted into moles of ATP assuming a P:O ratio of3·0 throughout exercise. Resting ýOµ was subtracted from exerciseýOµ to compare aerobic heat liberation to total energy turnover. NetPCr hydrolysis and lactate accumulation estimations per 30 sinterval are based on the initial and final biopsy mean values(vastus lateralis) obtained in parallel studies with the sameexperimental protocol (J. Bangsbo, P. Krustrup, J. Gonz�alez-Alonso& B. Saltin, unpublished observations; ÄPCr 16·3 mmol (kg wetwt)¢ and Älactate 22·3 mmol (kg wet wt)¢) and the kineticsdescribed by Gollnick & Hermansen (Fig. 3, p. 12; 1973) andSinclair et al. (1999). Lactate concentrations were converted intoATP concentrations by multiplying lactate concentrations by afactor of 1·5. Heat produced per mole of ATP used was assumed tobe 35 kJ for ATP and PCr hydrolysis, 65 kJ for glycolysis and 72 kJfor oxidation (Curtin &Woledge, 1978; Woledge & Reilly, 1988).
Analysis
The mean response time for total heat production was estimated byfitting a two-component exponential model to the data, using a(non-linear) least squares regression technique.
Statistics
A one-way repeated measures analysis of variance (ANOVA) wasperformed to test significance over time. When the F value wassignificant, pairwise differences were identified using Tukey’shonestly significant difference post hoc procedure. The significancelevel was set at P < 0·05. Data are presented as means ± s.e.m.unless otherwise stated.
RESULTS
Pre-exercise thermal equilibration
The use of a water-perfused jacket was quite successful inequalising temperatures at •37·0°C within the thigh beforethe exercise (see Fig. 3). This was true for the various musclesexcept for the hamstrings. At the start of the exercise, thehamstrings had a slightly higher temperature than •37·0°C(i.e. 37·3—37·4°C), probably due to the direct contact with,and pressure of the posterior side of the thigh on, the waterjacket.
Thigh size
The mean mass of the knee-extensor muscle including thetensor fasciae latae was 2·68 ± 0·46 kg (± s.d.) (Table 1).The mass of m. rectus femoris was •0·2—0·3 kg with theother three portions of the quadriceps being of similarweight (0·6—0·8 kg). After 180 s of knee-extension exercise,the active muscle volume is estimated to increase by0·26 ± 0·04 kg to 2·94 ± 0·50 kg due to fluid gain.
Muscle temperature
At the onset of the voluntary dynamic exercise thetemperature in the quadriceps muscles was promptlyelevated at all sites, i.e. after the first kick (Figs 4A and 5A,B). However, there were some differences in the magnitudeof increase in temperature among the different muscleportions (v. l., r.f. and v.m.) and subjects. A faster increasewas observed in rectus femoris with 0·26—0·31°C elevationover the first 30 s compared to the vastus medialis and
J. Gonz�alez-Alonso and others J. Physiol. 524.2608
Figure 3. Thigh temperature during the thermal
equilibration procedure prior to exercise
The tissue temperatures of the thigh are depicted whenwarming it with a water-perfused wrapping set at 41°C for•70 min to equalise these temperatures with the coretemperatures (•37°C). Thereafter, the water temperaturewas adjusted to 37·5°C for the remainder of the experiment.

vastus lateralis which reached 0·14—0·19°C over the sametime interval (P < 0·05; Fig. 5A). At the end of the 3 minexercise bout, the temperature rise ranged between 0·89 and1·03°C in v.l., v.m. and r.f. In two additional experiments inwhich thermistors were placed in the v.i. portion of thequadriceps femoris muscle and in the tensor fasciae latae,the temperature elevation was similar to that observed inthe other portions of the knee-extensor muscles (Fig. 6A).This rendered the basis for using a mean value oftemperature in v.l., v.m. and r.f. for the entire knee-extensormuscles. When comparing the rate of rise in muscletemperature, it was observed that knee-extensor muscletemperature increased 0·04 ± 0·01 °C during the first 5 s todecline progressively to 0·01 ± 0·01 °C during the last 5 s ofexercise (P < 0·05). In contrast to the knee-extensormuscles, the temperature in the hamstrings barely increased
Muscle energy exchange in dynamic exerciseJ. Physiol. 524.2 609
Figure 4. Mean quadriceps muscle temperature,
arterial and femoral blood temperature (A) and thigh
blood flow (B) for all subjects at rest and during
passive exercise, dynamic exercise and recovery
Of note is the observation that the decline in muscletemperature during recovery can be accounted for almostcompletely by the on-going convective heat removal to thebody core.
Figure 5. Temperature and thigh blood flow during
intense dynamic knee-extensor exercise
A,mean values (n = 5) for temperature increases in the rectusfemoris (r.f.; 2 sites), vastus medialis (v.m.; 1 site) and vastuslateralis (v. l.; 2 sites) of the quadriceps muscle and hamstringsmuscle (1 site; biceps femoris medial) during dynamic knee-extensor exercise. s.e.m. bars are not included for reasons ofclarity (s.e.m. range 0·00—0·10°C; mean s.e.m. values0·04—0·07°C for all muscle portions). B, the mean (± s.e.m.)increases (n = 5) in arterial and venous blood temperaturesare given from start to end of the exercise. For comparisonmean (± s.e.m.) quadriceps, oesophageal (core) and skintemperature are given as well. C,mean (± s.e.m.) values forthigh blood flow during exercise are presented. The meanelevation (n = 5) observed during the exercise fits thepolynomial equation:
y = 0·001xÅ − 0·27x + 42·11x + 1979·6 (r = 0·96).

during the first 120 s of exercise (Figs 5A and 6B), but wasat the end elevated by 0·19°C (range 0·13—0·42°C). Half ofthis elevation occurred during the last 30 s of exercise(Fig. 5A). In the additional experiments, it was observedthat anterior thigh subcutaneous tissue temperature andhamstrings temperature in three different sites onlyincreased slightly during exercise (Fig. 6B).
Blood temperature
Femoral venous temperature increased after the first kickwith the arterial temperature lagging behind (Figs 4A and5B). The v—a temperature difference was nil during the first5 s but increased to 0·09 ± 0·06 °C after 15 s (Fig. 5B).Thereafter, v—a temperature difference increased further toreach 0·39 ± 0·04 °C at the end of exercise. The absolutevalues at the termination of exercise for femoral artery and
venous blood temperatures were 37·65 ± 0·06 and37·21 ± 0·08°C, respectively. The rate of rise in oesophagealtemperature (Toes) was only slightly lower than that offemoral artery temperature, reaching a value of37·1 ± 0·1 °C at the end of exercise (Fig. 5B). Theobservation that the rise in Toes (index of body core orcentral blood temperature) throughout exercise was similarto that of arterial temperature, indicates that countercurrentheat exchange between the femoral vein and femoral artery,if it indeed occurred, was very small.
Thigh blood flow
Although the passive acceleration of the leg did not causeany alteration in temperature of the muscle or the arterialblood (Fig. 4A), it increased the thigh blood flow from itsresting level of 7·7 ± 1·5 ml s¢ to 33·7 ± 1·2 ml s¢ (Figs 4Band 5C). A fast further elevation occurred in the blood flowduring the voluntary exercises reaching 56·7 ± 10·3 ml s¢at 45 s and 76·7 ± 16 ml s¢ at the end of the exercise.
Heat production
The rate of heat storage in the knee-extensors ( �Hs) waslargest early in the exercise, amounting to 70—80 J s¢ afterthe first 30 s, after which it gradually declined to14 ± 10 J s¢ for the last 30 s of exercise (Fig. 7). The rate ofheat removal by the blood ( �Hr) was not significant until after10 s of exercise, then being 8 ± 10 J s¢. Thereafter,convective heat removal increased progressively to reach avalue of 112 ± 14 J s¢ during the last 5 s of exercise(Fig. 7). The decline in �Hs was less than the elevation in �Hr,especially during the first 60—75 s of exercise, in keepingwith an increased heat production during the exercise(Fig. 7). The rate of heat production was 70 ± 10 J s¢
J. Gonz�alez-Alonso and others J. Physiol. 524.2610
Figure 6. Temperature in various knee-extensor and
hamstring muscles as well as subcutaneous tissue
during intense knee-extensor exercise
A, mean increases in the two additional experiments whenthermistors were placed in vastus intermedius (v. i.) andtensor fasciae latae (t.f. l.) in addition to other knee-extensors.B, data from another additional experiment. Threethermistor probes were placed in different hamstring muscles(biceps femoris, semitendinosus and semimembranosus), andone in the subcutaneous fat (•5 mm under the skin) next to athermistor probe placed in the rectus femoris (depth •3 cm).
Figure 7. Heat production during dynamic knee-
extensor exercise
Mean values (± s.e.m.; n = 5) of total heat production ( �Ht)are depicted for each 5 s period of the exercise as well as itssubdivision in terms of storage in the quadriceps muscle (�Hs)and removal by the blood from the thigh ( �Hr).

during the first 5 s of the exercise, and approached a valuejust above 100 J s¢ at 60—75 s (P < 0·05). Thereafter, theincrease in the rate of heat production was linear reaching126 ± 26 J s¢ at the end of the exercise. Therefore, heatproduction was 77% higher (P < 0·05) during the lastcompared to the first 5 s. After 180 s of exercise, total heatstorage in the knee-extensors amounted to 9276 J (range7822—11776 J), whereas total heat removal by the bloodamounted to 10993 J (range 6808—20403 J).
Additional heat loss
To the above reported heat production should be added thesmall heat losses by convection, conduction and convectionvia the lymph flow ( �Ha). The amount of heat conducted tothe skin of the anterior thigh during exercise was estimatedto range from •2 J s¢ during the first 5 s of exercise to6 J s¢ during the last 5 s of exercise, with almost nodifference among subjects. The corresponding calculation forthe posterior portion of the thigh demonstrated that it canbe neglected due to the temperatures in the hamstring andthe skin being similar. With no temperature gradient, heattransfer to the thigh skin through convection was estimatedto be zero at the beginning of exercise, increasingprogressively throughout exercise to a value of 12 ± 4 J s¢.Heat transfer to the body core via the lymph might amountto a maximum of 6 J s¢. Therefore, during the first 5 s ofexercise, �Ha was negligible (< 2 J s¢), and increasedthroughout exercise to a value of 24 J s¢ (range 6—48 J s¢)at 180 s. The total value for �Ha is 2446 J (range 334—3096 J),which represents a maximum of 10% of �Ht (22726 J; range16612—33878 J) or 6% of �Et (37652 J; range 31650—44769 J). When including �Ha, �Ht during the last 5 s ofexercise was twice as high as that observed during the first5 s of exercise (P < 0·05) (Fig. 7), with half of the increaseoccurring during the first 38 ± 12 s.
Mechanical power output
During the first 30 s of exercise the mean power output was83 W (range 58—114 W). During the subsequent 90 s, poweroutput was within 1% of this level (Fig. 8C). Overall therewas a trend for a reduction in power output which was dueto a progressive decline in kicking frequency from1·08 ± 0·03 s¢ during the first 5 s to 0·96 ± 0·03 s¢ duringthe last 5 s (P < 0·05; Fig. 8A and B). After 120 s ofexercise, power output dropped somewhat more in twosubjects. This coincided with a progressive increase in thework performed by the hamstrings as evidenced by the forcetracing.
Mechanical efficiency
With heat production doubling over the 180 s of the exercisewhile power output was in essence constant (Fig. 8C), theestimated mechanical efficiency declined from an initial valueof 53 ± 6% to 36 ± 5% at the end of exercise (P < 0·05).
Oxygen consumption and lactate release
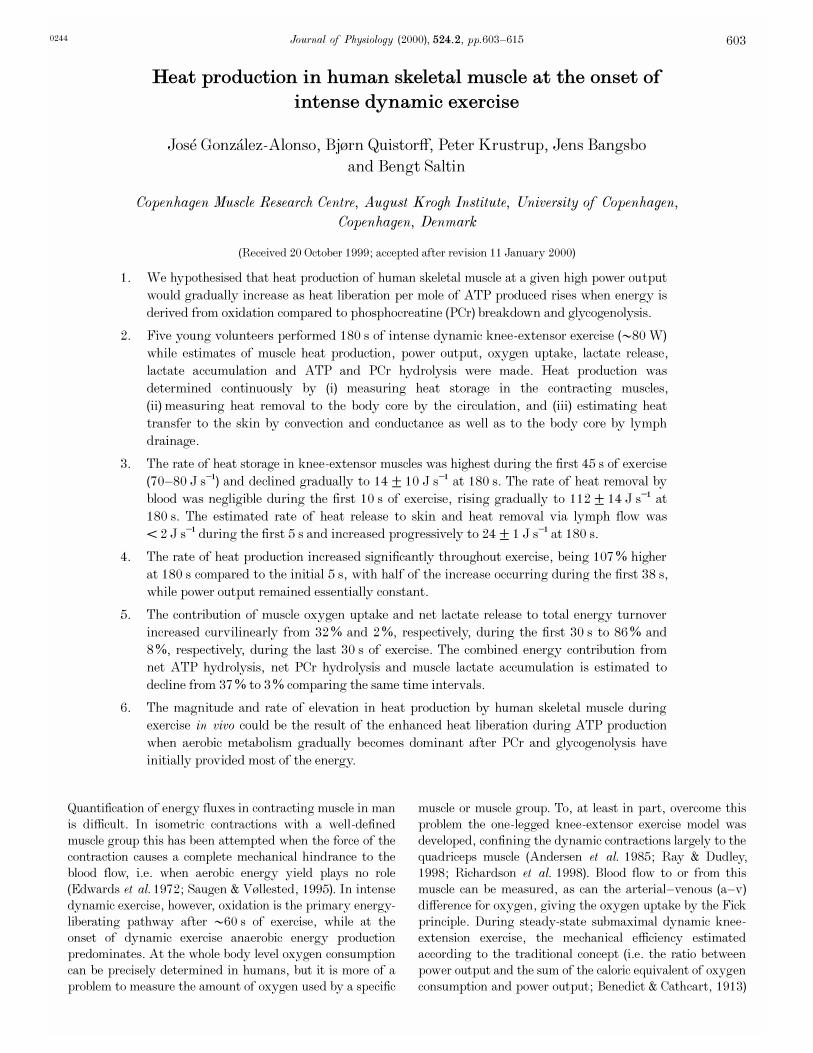
Thigh ýOµ increased in a curvilinear fashion from0·055 ± 0·023 mmol s¢ immediately before exercise to
0·464 ± 0·035 mmol s¢ at the end of exercise, with one-halfof the increase occurring during the first 28 ± 3 s (Fig. 9A).Net lactate release from the thigh increased from0·01 ± 0·01 mmol s¢ immediately before exercise to0·15 ± 0·03 mmol s¢ (P < 0·05) after 70 s and 0·21 ±0·02 mmol s¢ at the end of exercise (P < 0·05; Fig. 9B).
DISCUSSION
The major finding of this study was that heat production bycontracting human skeletal muscle doubled over 3 min ofintense dynamic exercise at essentially constant poweroutput. Half of this increase in rate of heat productionoccurred during the first 38 s of exercise. This elevated heat
Muscle energy exchange in dynamic exerciseJ. Physiol. 524.2 611
Figure 8. Mechanical power output during dynamic
knee-extensor exercise
Mean values for mechanical work per kick (A) and thekicking frequency (B) as well as the mean power output over30 s intervals (C) for n = 5.
production in contracting skeletal muscle appears to betightly coupled with changes in heat liberation during ATPproduction in the metabolic reactions involved early inexercise.
Measurement in man of heat production in dynamicallycontracting muscle with a free blood flow is complex,requiring a high time resolution and precise measurements.This was accomplished in this study and one major findingwas that after 60 s of exercise, when aerobic metabolismprovided 82—89% of the ATP resynthesis, the matchbetween total energy turnover (sum of rate of heatproduction and power output) and total metabolic input(sum of net PCr and net ATP hydrolysis, glycolysis andoxidative phosphorylation) was quite close. However, thecritical time period is the very first minute of exercise wherethe rate of heat production is much smaller than in the laterphase of the exercise bout. Multiple thermistors were placedin all major muscle portions developing the force as well asin one adjacent inactive muscle and temperature wasrecorded continuously. As evidenced in Figs 4A and 5A, anelevation in temperature in the active muscle can be
observed during the first few contractions (1—3 s). Theobservation that passive exercise did not elevate quadricepsmuscle temperature and that knee-extensor exercise did notincrease hamstring temperature early in exercise indicatesthat movement friction of the thermistor did not add to theheat gain in the muscle. Therefore, the precise muscletemperature and volume measurements in the present studyprovided highly valid estimates of heat accumulated in themuscle, including the initial phase of the exercise.
Some uncertainty, however, is involved in the estimation ofthe heat removal from the muscle by the blood flow. Theinflow and outflow temperatures are obtained with the sametime resolution and sensitivity as the measurements of thechanges in muscle temperature and have an error of•0·01°C. The largest uncertainty in the measurement ofheat removal by the blood is the blood flow determinations.The thermodilution technique does not allow for continuousmeasurements. Thus, thigh blood flow in the present studywas measured for 20 s every •30 s and mean thigh bloodflow during each 5 s interval was estimated using a curve-fitting polynomial model. The present rate of rise andabsolute values in thigh blood flow correspond closely withcontinuous Doppler measurements using the same exercisemodel and exercise intensity (R�adegran & Saltin, 1998). Inthis study, a rapid increase in thigh blood flow was foundwith the first contractions. However, in this time intervalthe v—a temperature difference was very small, indicatingthat heat removal by the blood was negligible and that evena large error in blood flow measurement would onlyconstitute a very small error in the estimation of convectiveheat removal. Furthermore, in the present experimental
J. Gonz�alez-Alonso and others J. Physiol. 524.2612
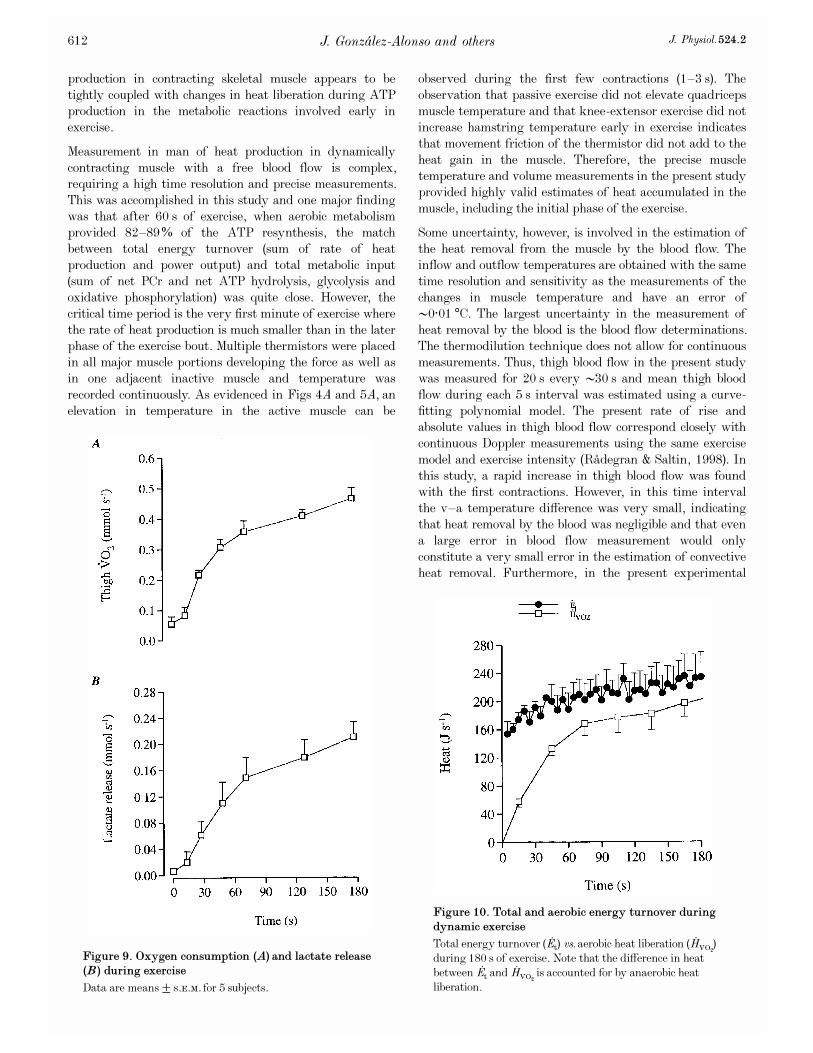
Figure 10. Total and aerobic energy turnover during
dynamic exercise
Total energy turnover ( �Et) vs. aerobic heat liberation ( �HVOµ)during 180 s of exercise. Note that the difference in heatbetween �Et and �HVOµ is accounted for by anaerobic heatliberation.
Figure 9. Oxygen consumption (A) and lactate release
(B) during exercise
Data are means ± s.e.m. for 5 subjects.

conditions with no or small temperature gradients betweenmuscle and skin during the first 30 s of exercise, theadditional heat loss to the skin by convection andconductance as well as to the body core by lymph drainageamounted to < 3% of total heat production. Taken together,these findings indicate that most (> 90%) of the heatproduced during the first 10 s of exercise accumulated in thecontracting muscles whereas, at the end of exercise, most ofthe heat produced was transported by the blood to the bodycore (see Fig. 7). Therefore, it is very unlikely that the heataccounting during the initial phase of the exercise bout ismissing significant amounts of heat and vice versa for thelater part of the exercise bout. Consequently, since workoutput is maintained nearly constant throughout theexercise, the overall efficiency of the muscle work performedis decreasing proportionally to the additional heat output.
There are several possible mechanisms explaining ourobservation at the onset of exercise of progressive increasingrate of heat production during generally maintained poweroutput. One likely explanation is based on Wilkie’s work inthe 1960 s (Wilkie, 1968) and that of Woledge & Reilly(1988). They studied the heat produced during musclecontraction when the ATP resynthesis was powered by a netbreakdown of PCr and found that the immediate heatliberated was only •35 kJ per mole of ATP used due to thenear-equilibrium state of the creatine kinase reaction(Wilkie, 1968; Woledge & Reilly, 1988) as compared to the•72 kJ per mole of ATP used when ATP is resynthesisedvia oxidation (Curtin & Woledge, 1978). ATP resynthesisfrom the anaerobic usage of glycogen (glucose) appears to
have an intermediate value for heat liberation compared toPCr breakdown and aerobic metabolism (i.e. •65 kJ permole of ATP used; Curtin & Woledge, 1978). We measuredthigh ýOµ and lactate release and observed that oxidationaccounted for •30% of the total energy turnover during thefirst 30 s of exercise, increasing to > 82% after 60 s ofexercise. PCr degradation and lactate accumulation inmuscle were not assessed in this study; however, theseparameters have been measured repeatedly in the samemodel with similar work rate and exercise regimen in otherstudies (Bangsbo et al. 1990; Sinclair et al. 1999). Basedupon measured absolute values in parallel studies and well-documented PCr and lactate kinetics (Gollnick & Hermansen,1973; Meyer, 1988; Bangsbo et al. 1990; Sinclair et al. 1999),a likely model can be described for the energy contributionof these pathways (see Table 2). Accordingly, PCr andanaerobic glycogenolysis would account for 15 and 25% ofthe total energy turnover, respectively, and 20 and 33% ofthe total ATP production, respectively, during the first 30 sof exercise. During this 30 s interval the anaerobic processestherefore provided approximately two-thirds of the ATPresynthesis (Table 2; see also Fig. 10 for an indirect accountof the anaerobic heat liberation). The observation that themetabolic rate of heat liberation was 53—68% higher in allthe 30 s intervals following the initial 30 s of exercisestrongly suggests lesser heat liberation per ATP provided byATP-PCr hydrolysis and glycogenolysis compared to ATPprovided by oxidative phosphorylation.
Oxygen uptake of the thigh gradually increased throughoutthe exercise period. However, it did not reach a plateau
Muscle energy exchange in dynamic exerciseJ. Physiol. 524.2 613
––––––––––––––––––––––––––––––––––––––––––––––––––––––––––––––––––––––––––––––––––––––––––––––––––––––––––––––––––––––––Table 2. Muscle energetics during 3 min of intense dynamic knee-extension exercise
––––––––––––––––––––––––––––––––––––––––––––––––––––––––––––
Time interval (s)
Energy source 0—30 30—60 60—90 90—120 120—150 150—180 0—180––––––––––––––––––––––––––––––––––––––––––––––––––––––––––––(1) Oxygen consumption (J s¢) 57·6 ± 7·5 132·8 ± 9·7 168·0 ± 16·9 176·8 ± 22·0 182·0 ± 22·6 196·7 ± 19·6 152·3 ± 15·3(2) Net PCr hydrolysis (J s¢)
a
27·0 15·0 6·3 1·7 0·8 0·3 8·6(3) Net ATP hydrolysis (J s¢)
b
0·4 0·6 0·6 0·6 0·6 0·6 0·6(4) Lactate accumulation (J s¢)
a
40·6 64·3 12·6 7·9 6·3 5·0 21·7(5) Lactate release (J s¢) 4·1 ± 1·2 11·4 ± 2·1 17·1 ± 2·6 19·0 ± 2·9 18·2 ± 2·7 18·4 ± 2·4 14·7 ± 2·2
Ó(1—5) Total metabolic input (J s¢) 133·8 224·1 204·6 206·0 207·9 221·0 197·9
Total energy turnover (J s¢)c
181·9 ± 13·6 197·2 ± 16·3 211·0 ± 17·4 216·0 ± 21·0 220·8 ± 20·4 228·1 ± 23·2 209·2 ± 15·3––––––––––––––––––––––––––––––––––––––––––––––––––––––––––––
Data represent mean rates for 30 s time intervals and the overall mean for 180 s. Measured data aredepicted as means ± s.e.m. for 5 subjects.
a
Net PCr hydrolysis and lactate accumulation estimations arebased on the initial and final values observed in biopsy samples from vastus lateralis obtained in parallelstudies with the same experimental protocol (J. Bangsbo, P. Krustrup, J. Gonz�alez-Alonso & B. Saltin,unpublished; ÄPCr 16·3 mmol (kg wet wt)¢ and Älactate 22·3 mmol (kg wet wt)¢; see also Bangsbo et al.1990, for similar measurements) and the kinetics described by Gollnick & Hermansen (Fig. 3, p. 12; 1973)and Sinclair et al. (1999). Heat produced per mole of ATP used was assumed to be 35 kJ for ATP and PCrhydrolysis, 65 kJ for glycogenolysis and 72 kJ for oxidation (Curtin & Woledge, 1978; Woledge & Reilly,1988). P:O ratio was assumed to be constant throughout exercise and equal to theoretical 3·0. Totalmetabolic input was calculated as the sum of the energy input from oxygen consumption, net ATP and netPCr hydrolysis and lactate production.
b
Net ATP hydrolysis estimation (ÄATP 1·1 mmol (kg wet wt)¢) isbased on data from Hellsten et al. (1999).
c
Total energy turnover was calculated by summing power outputand rate of heat production.
––––––––––––––––––––––––––––––––––––––––––––––––––––––––––––––––––––––––––––––––––––––––––––––––––––––––––––––––––––––––

value, although the work rate and thus energy turnover wasin each individual above the aerobic capacity. To whatextent this continuous elevation in oxygen uptake is due to(i) altered motor unit and fibre type recruitment,(ii) declining mitochondrial P:O ratio, (iii) reduced freeenergy (ÄG) from the hydrolysis of ATP, (iv) decliningcrossbridge cycling efficiency, and (v) increasing non-crossbridge ATPase activity (Crow & Kushmerick, 1982;Curtin & Woledge, 1991, 1993; Barclay et al. 1993; Willis &Jackman, 1994; Barclay, 1996) requires furtherinvestigations. The possibility cannot be excluded that oneor all five of these mechanisms could play a role. The knee-extensor muscles are mixed with regard to their fibre typedistribution, usually containing similar amounts of type Iand type II muscle fibres (Saltin et al. 1977; Lexell et al.1983). As the efficiency of type I muscle fibres is likely to begreater than that of type II fibres when contraction velocityis < 25% of the maximal value (Crow & Kushmerick, 1982;Curtin & Woledge, 1991, 1993; Aagaard et al. 1994;Barclay, 1996), the question arises as to whether a shift infibre recruitment andÏor enhanced motor unit recruitmentcontributed to the observed increases in oxygen uptake andheat production. Based on Tµ-weighted MRI images obtainedbefore and after exercise and the glycogen depletion pattern,all knee-extensor muscles are engaged when the intensity ofcontractions is high (Bangsbo et al. 1992; Richardson et al.1998; Ray & Dudley, 1998). The rapid increase in muscletemperature in all the locations in the knee-extensormuscles after the first contractions is consistent with thisnotion. The glycogen depletion pattern reveals a recruitmentof all fibre types at this intensity of exercise (Bangsbo et al.1992). Thus, it is most likely that the relative role of type Ifibres is enhanced rather than reduced in the presentexperiment. Therefore, it appears unlikely that an alteredmotor unit recruitment pattern influenced to a significantextent the slow increase in muscle ýOµ and heat productionduring exercise.
The free energy (ÄG) for ATP hydrolysis will decrease fromrest to maximal exercise, since the contribution from theRT lnK' term of the equation ÄG = ÄG° + RT lnK' (whereÄG° is the free energy under standard conditions), willdecline with the increase in free ADP, Pé and H¤, occurringduring contraction. It may be estimated that the K' willtypically increase by a factor of 300 or more, comparingresting conditions and end-exercise conditions (seee.g. Ratkevicius et al. 1998), corresponding to a decrease inÄG by about 15 kJ mol¢. Whether or not the P:O ratiodeclines with intense exercise is unknown at present;however, in vitro measurements do not suggest that this isthe case (Hinckle & Yu, 1979; Willis & Jackman, 1994).Whether a decreasing efficiency of the crossbridge couplingduring maximal exercise occurs is also unknown. Judgingfrom NMR measurements of the cost of contraction (molesof ATP hydrolysis per watt of power output) underanaerobic conditions, this does not appear to be the case(Y. Nakagawa, A. Ratkevicius, M. Mizuno & B. Quistorff,
unpublished observations). Finally, the possibility cannot beexcluded that the non-crossbridge ATPase activity couldcontribute to the observed elevated heat production (Barclayet al. 1993; Barclay, 1996).
In conclusion, the total skeletal muscle heat production inhumans performing intense work was accurately quantifiedduring dynamic knee-extension exercise by summing:(a) heat storage in the contracting muscles, (b) heat removalto the body core by the circulation, and (c) heat release tothe skin and environment. At constant power output, heatproduction increased progressively throughout exercise.This meant that heat production was •100% larger duringthe final as compared to the initial 5 s of exercise, with halfof the increase occurring during the first 38 s. This allowsthe comparison of metabolic energy input with heatproduction. Concomitant measurements of aerobic energymetabolism and net lactate release supplemented with dataon PCr depletion and muscle lactate accumulation in similarexercise made possible the accurate estimation of themagnitude of energy yield from these three metabolicpathways throughout exercise. The match was found to bevery close provided correct values for the heat liberatedfrom the breakdown of PCr, anaerobic glycolysis andoxidative phosphorylation were applied.
Aagaard, P., Simonsen, E. B., Trolle, M., Bangsbo, J. & Klausen,K. (1994). Moment and power generation during maximal kneeextensions performed at low and high speeds. European Journal ofApplied Physiology 69, 376—381.
Andersen, P., Adams, R. P., Sjœgaard, G., Thorboe, A. & Saltin,B. (1985). Dynamic knee extension as model for study of isolatedexercising muscle in humans. Journal of Applied Physiology 59,1647—1653.
Andersen, P. & Saltin, B. (1985). Maximal perfusion of skeletalmuscle in man. Journal of Physiology 366, 233—249.
Ardevol, A., Adan, C., Remesar, X., Fern�andez-L�opez, J. A. &Alemany, M. (1998). Hind leg heat balance in obese Zucker ratsduring exercise. Pfl�ugers Archiv 435, 454—464.
�Astrand, I. (1960). Aerobic work capacity in men and women withspecial reference to age. Acta Physiologica Scandinavica 49(suppl. 169), 67—158.
Bangsbo, J., Gollnick, P. D., Graham, T. E., Juel, C., Kiens, B.,Mizuno, M. & Saltin, B. (1990). Anaerobic energy production andOµ deficit debt relationship during exhaustive exercise in humans.Journal of Physiology 422, 539—559.
Bangsbo, J., Graham, T. E., Kiens, B. & Saltin, B. (1992). Elevatedmuscle glycogen and anaerobic energy production during exhaustiveexercise in man. Journal of Physiology 451, 205—227.
Barclay, C. J. (1996). Mechanical efficiency and fatigue of fast andslow muscles of the mouse. Journal of Physiology 497, 781—794.
Barclay, C. J., Curtin, N. A. & Woledge, R. C. (1993). Changes incrossbridge and non-crossbridge energetics during moderate fatigueof frog muscle fibres. Journal of Physiology 468, 543—555.
Barcroft, H. & Edholm, O. G. (1942). The effect of temperature onblood flow and deep temperature in the human forearm. Journal ofPhysiology 102, 5—20.
J. Gonz�alez-Alonso and others J. Physiol. 524.2614

Benedict, F. G. & Cathcart, E. P. (1913). Muscular Work: AMetabolic Study with Special Reference to the Efficiency of theHuman Body as a Machine. Carnegie Institution of Washington,Publication No. 187, Washington, DC, USA.
Crow, M. T. & Kushmerick, M. J. (1982). Chemical energetics ofslow- and fast-twitch muscles of the mouse. Journal of GeneralPhysiology 79, 147—166.
Curtin, N. A. & Woledge, R. C. (1978). Energy changes andmuscular contraction. Physiological Reviews 58, 690—761.
Curtin, N. A. & Woledge, R. C. (1991). Efficiency of energyconversion during shortening of muscle fibres from the dogfishScyliorhinus canicula. Journal of Experimental Biology 158,343—353.
Curtin, N. A. & Woledge, R. C. (1993). Efficiency of energyconversion during sinusoidal movement of white muscle fibres fromdogfish Scyliorhinus canicula. Journal of Experimental Biology183, 137—147.
Edwards, R. H. T., Harris, R. C., Hultman, E., Kaijser, L., Koh,D. & Nordesj�o, L._O. (1972). Effect of temperature on muscleenergy metabolism and endurance during successive isometriccontractions, sustained to fatigue, of the quadriceps muscle in man.Journal of Physiology 220, 335—352.
Edwards, R. H. T., Hill, D. K. & Jones, D. A. (1975). Heatproduction and chemical changes during isometric contractions ofthe human quadriceps muscle. Journal of Physiology 251, 303—315.
Ganz, W. & Swan, H. J. C. (1974). Measurements of blood flow by thethermodilution technique. In Dye Curves: The Theory and Practiceof Indicator Dilution, ed. Bloomfield, D. A., pp. 245—266.University Park Press, Baltimore.
Gollnick, P. D. & Hermansen, L. (1973). Biochemical adaptations toexercise: anaerobic metabolism. In Exercise and Sport SciencesReviews, vol. 1, ed.Wilmore, J. H., pp. 1—43. Academic Press, NewYork.
Hellsten, Y., Richter, E. A., Kiens, B. & Bangsbo, J. (1999).AMP deamination and purine exchange in human skeletal muscleduring and after intense exercise. Journal of Physiology 520,909—919.
Hensel, H. & Bock, K. D. (1955). Durchblutung undW�armeleiff�ahigkeit des menschlichen Muskels. Pfl�ugers Archiv 260,361—367.
Hill, A. V. & Woledge, R. C. (1962). An examination of absolutevalues in myothermic measurements. Journal of Physiology 162,311—333.
Hinckle, P. C. & Yu, M. L. (1979). The phosphorousÏoxygen ratio ofmitochondrial oxidative phosphorylation. Journal of BiologicalChemistry 254, 2450—2455.
Kushmerick, M. J., Larsen, R. E. & Davies, R. E. (1969). Thechemical energetics of muscle contraction. I. Activation heat, heat ofshortening and ATP utilization for contraction. Proceedings of theRoyal Society B 174, 293—313.
Lexell, J., Henriksson-Lars�en, K. & Sj�ostrom, M. (1983).Distribution of different fibre types in human skeletal muscles. 2. Astudy of cross-sections of whole m. vastus lateralis. ActaPhysiologica Scandinavica 117, 115—122.
Meyer, R. A. (1988). A linear model of muscle respiration explainsmonoexponential phosphocreatine changes. American Journal ofPhysiology 254, C548—553.
Pennes, H. H. (1948). Analysis of tissue and arterial bloodtemperatures in the resting human forearm. Journal of AppliedPhysiology 1, 93—122.
R�adegran, G. & Saltin, B. (1998). Muscle blood flow at onset ofdynamic exercise in humans. American Journal of Physiology 274,H314—322.
Rasband, W. S. & Bright, D. S. (1995). NIH Image: A public domainimage processing program for the Macintosh. Microbeam AnalysisSociety Journal 4, 137—149.
Ratkevicius, A., Mizuno, M., Povilonis, E. & Quistorff, B.(1998). Energy metabolism of the gastrocnemius and soleus musclesduring isometric voluntary and electrically induced contractions inman. Journal of Physiology 507, 593—602.
Ray, C. A. & Dudley, G. A. (1998). Muscle use during dynamic kneeextension: implication for perfusion and metabolism. Journal ofApplied Physiology 85, 1194—1197.
Richardson, R. S., Frank, L. R. & Haseler, L. J. (1998). Dynamicknee-extensor and cycle exercise: functional MRI of muscularactivity. International Journal of Sports Medicine 19, 182—187.
Saltin, B., Henriksson, J., Nygaard, E., Andersen, P. & Jansson,E. (1977). Fiber types and metabolic potentials of skeletal musclesin sedentary man and endurance runners. Annals of the New YorkAcademy of Sciences 301, 3—29.
Saugen, E. & Vœllested, N. K. (1995). Non-linear relationshipbetween heat production and force during voluntary contractions inman. Journal of Applied Physiology 79, 2043—2049.
Saugen, E. & Vœllested, N. K. (1996). Metabolic heat productionduring fatigue from voluntary repetitive isometric contractions inhumans. Journal of Applied Physiology 81, 1323—1330.
Sinclair, A. S., Montain, S. J., Matott, R. P., Zientara, G. P.,Jolesz, F. A. & Fielding, R. A. (1999). Effects of creatinesupplementation on the energy cost of muscle contraction: a31
P_MRS study. Journal of Applied Physiology 87, 116—123.
von D�obeln, W. (1956). Human standard and maximal metabolic ratein relation to fat-free body mass. Acta Physiologica Scandinavica 37(suppl. 126), 1—79.
Wilkie, D. R. (1960). Thermodynamics and interpretations ofbiological heat measurements. Progress in Biophysics andBiophysical Chemistry 10, 259—289.
Wilkie, D. R. (1968). Heat work and phosphorylcreatine breakdownin muscle. Journal of Physiology 195, 157—183.
Willis, W. T. & Jackman, M. R. (1994). Mitochondrial functionduring heavy exercise. Medicine and Science in Sports and Exercise26, 1347—1354.
Woledge, R. G. & Reilly, P. J. (1988). Molar enthalpy change forhydrolysis of phosphorylcreatine under conditions in muscle cells.Biophysical Journal 54, 97—104.
Acknowledgements
Special thanks are given to the subjects in this study. The excellentengineering assistance of Flemming Jensen is acknowledged. Theauthors also thank Markus Novak (Rigshospitalet) for his workcollecting the MRI scans. This study was supported by a grant fromThe Danish National Research Foundation (504-14). J.G.-A. wassupported by a Marie Curie Research Training Grant(FMBICT950007).
Corresponding author
B. Saltin: Copenhagen Muscle Research Centre, Rigshospitalet,section 7652, Blegdamsvej 9, DK-2100 Copenhagen Œ, Denmark.
Email: [email protected]
Muscle energy exchange in dynamic exerciseJ. Physiol. 524.2 615