Embed Size (px)
Citation preview

Heat Maps: Trends in Late Stage Diagnoses of Screenable Cancers in California Counties, 1988 – 2013

Acknowledgements and DisclaimerThe collection of cancer incidence data used in this study was supported by California Department of Public Health as part of the statewide cancer reporting program mandated by the California Health and Safety Code Section 103885; the National Cancer Institute’s Surveillance, Epidemiology and End Results Program under contracts awarded to the Cancer Prevention Institute of California, the University of Southern California, and the Public Health Institute; and the Centers for Disease Control and Prevention’s National Program of Cancer Registries, under agreement awarded to the California Department of Public Health. The ideas and opinions expressed herein are those of the author(s) and endorsement by the State of California, Department of Public Health, the National Cancer Institute, the Centers for Disease Control and Prevention, or their Contractors and Subcontractors is not intended nor should be inferred.
Inquiries regarding the content of this report should be directed to:
California Cancer Reporting and Epidemiologic Surveillance (CalCARES) Program Institute for Population Health Improvement, UC Davis Health System 1631 Alhambra Blvd., Suite 200 Sacramento, CA 95816 (916) 731-2500 http://www.ucdmc.ucdavis.edu/iphi/

Table of ContentsSUMMARY OF FINDINGS . . . . . . . . . . . . . . . . . . . . . . . . . . . . . . . . . . . . . . . . . . . . . . . . . . . . . . . . . . . . . . . . . . . . . . . . . . . . 5
INTRODUCTION . . . . . . . . . . . . . . . . . . . . . . . . . . . . . . . . . . . . . . . . . . . . . . . . . . . . . . . . . . . . . . . . . . . . . . . . . . . . . . . . . . . . 6
Methods . . . . . . . . . . . . . . . . . . . . . . . . . . . . . . . . . . . . . . . . . . . . . . . . . . . . . . . . . . . . . . . . . . . . . . . . . . . . . . . . . . . . . . . . 6
Cautions on Interpretation . . . . . . . . . . . . . . . . . . . . . . . . . . . . . . . . . . . . . . . . . . . . . . . . . . . . . . . . . . . . . . . . . . . . . . . . 7
FEMALE BREAST CANCER . . . . . . . . . . . . . . . . . . . . . . . . . . . . . . . . . . . . . . . . . . . . . . . . . . . . . . . . . . . . . . . . . . . . . . . . . . 8
COLON AND RECTUM CANCER . . . . . . . . . . . . . . . . . . . . . . . . . . . . . . . . . . . . . . . . . . . . . . . . . . . . . . . . . . . . . . . . . . . . . 11
CERVICAL CANCER . . . . . . . . . . . . . . . . . . . . . . . . . . . . . . . . . . . . . . . . . . . . . . . . . . . . . . . . . . . . . . . . . . . . . . . . . . . . . . . 14
PROSTATE CANCER . . . . . . . . . . . . . . . . . . . . . . . . . . . . . . . . . . . . . . . . . . . . . . . . . . . . . . . . . . . . . . . . . . . . . . . . . . . . . . . 17
MELANOMA . . . . . . . . . . . . . . . . . . . . . . . . . . . . . . . . . . . . . . . . . . . . . . . . . . . . . . . . . . . . . . . . . . . . . . . . . . . . . . . . . . . . . . . 20
CANCER OF THE ORAL CAVITY AND PHARYNX (OROPHARYNGEAL CANCER) . . . . . . . . . . . . . . . . . . . . . . . . 23
CONCLUSION . . . . . . . . . . . . . . . . . . . . . . . . . . . . . . . . . . . . . . . . . . . . . . . . . . . . . . . . . . . . . . . . . . . . . . . . . . . . . . . . . . . . . 25
REFERENCES: . . . . . . . . . . . . . . . . . . . . . . . . . . . . . . . . . . . . . . . . . . . . . . . . . . . . . . . . . . . . . . . . . . . . . . . . . . . . . . . . . . . . 26
Heat Maps: Trends in Late Stage Diagnoses of Screenable Cancers in California Counties, 1988 – 2013

Frances B. Maguire, M.P.H. CalCARES Program Institute for Population Health Improvement UC Davis Health System
Yi W. Chen, B.S. CalCARES Program Institute for Population Health Improvement UC Davis Health System
Cyllene R. Morris, D.V.M., Ph.D. Research Program Director CalCARES Program Institute for Population Health Improvement UC Davis Health System
Arti Parikh-Patel, Ph.D., M.P.H. Program Director CalCARES Program Institute for Population Health Improvement UC Davis Health System
Kenneth W. Kizer, M.D., M.P.H.Distinguished Professor, UC Davis School of Medicine and Betty Irene Moore School of NursingDirector, CalCARES ProgramandDirector, Institute for Population Health ImprovementUC Davis Health System
This publication was prepared by the California Cancer Reporting and Epidemiologic Surveillance (CalCARES) Program, Institute for Population Health Improvement, University of California Davis Health System
1631 Alhambra Blvd., Suite 200 Sacramento, CA 95816 (916) 731-2500 http://www.ucdmc.ucdavis.edu/iphi/
Suggested citation:
Maguire FB, Chen Y, Morris CR, Parikh-Patel A, Kizer KW. Heat Maps: Trends in Late Stage Diagnoses of Screenable Cancers in California Counties, 1988-2013. Sacramento, CA: California Cancer Reporting and Epidemiologic Surveillance Program, Institute for Population Health Improvement, University of California Davis, June 2016.
Copyright information:
All material in this report is in the public domain and may be reproduced or copied without permission; citation as to source, however, is appreciated.
Layout and design by UC Davis Repro Graphics
Prepared by:

Heat Maps: Trends in Late Stage Diagnoses of Screenable Cancers in California Counties, 1988 – 2013 • 5
Summary of FindingsThis report presents data on six types of cancer diagnosed at an advanced stage in California from 1988 through 2013. The tissue types were cancers of the: (1) breast (females), (2) colon and rectum, (3) cervix, (4) prostate, (5) skin (melanoma), and (6) oral cavity and pharynx. These cancers have the greatest potential for early diagnosis through screening.
For the 15 year period 1999 through 2013, inclusive, the trends of cancers diagnosed at late stages were assessed for California counties.
• The proportion of breast cancer diagnosed at late stage decreased significantly, while the proportion of colon cancer diagnosed at late stage remained steady. In contrast, late stage diagnoses of prostate, oropharyngeal, and cervical cancers significantly increased.
• Across the state, there was a progression towards early diagnosis of breast cancer. This was especially evident in the San Francisco Bay Area, Sacramento, San Diego, and the High Sierra regions, as well as various other counties. In contrast, Del Norte-Humboldt counties showed a statistically significant trend of increasing late stage diagnoses. A number of counties (San Bernardino, Kern, Merced, and Kings) had consistently high proportions of breast cancer diagnosed at an advanced stage.
• There was notable regional variation in the proportions of colorectal cancer diagnosed at late stage. San Diego-Imperial and northern California counties exhibited significant increases in the proportions of late stage diagnosis, while the San Francisco Bay Area, Inland Empire, and Central Valley regions had significantly decreased proportions of colorectal cancers diagnosed at late stages.
• Late stage diagnosis of cervical cancer increased statewide, but in the most populous regions of the state (Los Angeles-Orange, San Francisco Bay Area, San Diego-Imperial), the proportions remained relatively steady. The Central Valley, Sacramento, and northern California regions all had significantly increasing trends. The Central Valley had the highest percentage of late stage diagnoses.
• There was a statewide trend of increasing late stage diagnosis of prostate cancer. This was especially evident in the Los Angeles-Orange, Central Valley, and Sacramento regions. Individual counties with persistently high proportions of late stage diagnoses in recent years include Kern, Imperial, Del Norte-Humboldt, Lake, and Siskiyou-Trinity.
• The San Francisco Bay Area and Central Coast counties showed significant decreases in the proportion of melanoma cases diagnosed at late stages, while the Sacramento and High Sierra regions and Los Angeles County exhibited significant increases. Several counties had persistently high proportions of late stage melanoma diagnoses, including Riverside, San Bernardino, Fresno, Kern, Tulare, Merced, Madera, Kings, Imperial, Mendocino, Lake, and Mariposa-Tuolumne.
• The Los Angeles-Orange, San Francisco Bay Area, Central Valley, San Diego-Imperial, and Sacramento regions had significantly increasing trends of advanced stage diagnoses of oropharyngeal cancer. No California regions or counties exhibited significantly decreasing trends. There was significant variation in trends across counties.

6 • Heat Maps: Trends in Late Stage Diagnoses of Screenable Cancers in California Counties, 1988 – 2013
IntroductionThis report presents data on six types of cancer diagnosed at an advanced stage in California from 1988 through 2013. These are cancers of the: (1) breast (females), (2) colon and rectum, (3) cervix, (4) prostate, (5) skin (melanoma), and (6) oral cavity and pharynx. These cancers have the greatest potential for early diagnosis through screening, whether by visual inspection (oral cancer and melanoma) or procedures such as mammography, Pap smears, endoscopic evaluation (e.g., colonoscopy), fecal occult blood tests (FOBT), and prostate-specific antigen (PSA) tests.
Cancer staging describes the severity of the disease at the time of its diagnosis, taking into account the growth and size of the tumor and whether it has spread to adjacent organs, lymph nodes, or distant organs. The staging of a cancer determines the most effective treatment and is a predictor of survival. For screenable cancers, diagnosis beyond a localized stage represents a possible screening failure and the maps in this report show trends of late-stage diagnoses over time in individual California counties and regions. Monitoring these trends helps evaluate the impact of screening.
Information presented in this report was gathered by the California Cancer Registry (CCR), the state mandated population-based cancer surveillance system. Data collected by the CCR on cancers diagnosed in California are used to monitor cancer incidence and mortality over time, thus providing the foundation for cancer control initiatives throughout the state. Since 2012, the California Cancer Reporting and Epidemiologic Surveillance (CalCARES) Program within the Institute for Population Health Improvement, University of California Davis Health System, has partnered with the California Department of Public Health to manage day-to-day operations of the CCR.
MethodsIncident cases of female breast, colorectal, cervical, prostate, melanoma, and oropharyngeal cancer reported to the CCR from 1988 to 2013 are included in this report. Cancer sites were based on site recodes adopted by the National Cancer Institute’s Surveillance, Epidemiology and End Results (SEER) program.1
Summary stage at the time of diagnosis was used to classify the cases into early and advanced stages. This staging system was used because complete information is available for all years included. For all cancer types except cervical and prostate, in situ and localized tumors were classified as early stage while regional, remote, and unknown tumors were classified as advanced stage. In situ cases were excluded from cervical cancer counts because the CCR no longer collects information on these tumors. Because localized and regional tumors have the same five year survival (near 100%) for prostate cancer, regional tumors were included in the early stage category. For each cancer type, the five year survival rates for the unknown stage values fell between the regional and remote survival rates. Therefore, the unknown stage values were included in the advanced stage category. The percentage of unknown stage for each cancer site ranged from 2% to 9%: 2% for breast, 6% for colorectal, 3% for cervical, 9% for prostate, 3% for melanoma, and 7% for oropharyngeal.
The percent of cases diagnosed at an advanced stage for each cancer type in each county or region was calculated by dividing the number of advanced stage cases by the total number of cases for each year. This range of percentages of advanced stage cases for each cancer type was divided into eight categories which are represented on the map by eight colors. Counties with fewer than fifteen cases were excluded from the county analysis but were included in the regional and state calculations. For cervical and oropharyngeal cancer, years were grouped because the annual number of cases is small.
Heat Maps: Trends in Late Stage Diagnoses of Screenable Cancers in California Counties, 1988 – 2013 • 7
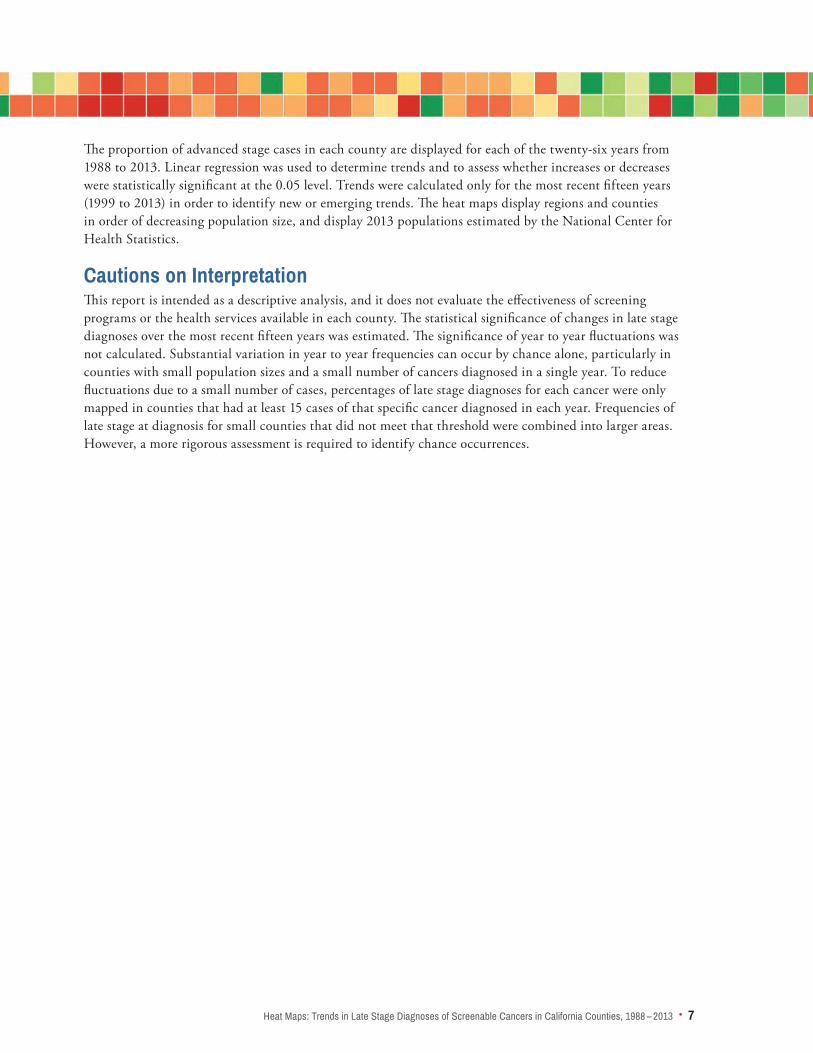
The proportion of advanced stage cases in each county are displayed for each of the twenty-six years from 1988 to 2013. Linear regression was used to determine trends and to assess whether increases or decreases were statistically significant at the 0.05 level. Trends were calculated only for the most recent fifteen years (1999 to 2013) in order to identify new or emerging trends. The heat maps display regions and counties in order of decreasing population size, and display 2013 populations estimated by the National Center for Health Statistics.
Cautions on InterpretationThis report is intended as a descriptive analysis, and it does not evaluate the effectiveness of screening programs or the health services available in each county. The statistical significance of changes in late stage diagnoses over the most recent fifteen years was estimated. The significance of year to year fluctuations was not calculated. Substantial variation in year to year frequencies can occur by chance alone, particularly in counties with small population sizes and a small number of cancers diagnosed in a single year. To reduce fluctuations due to a small number of cases, percentages of late stage diagnoses for each cancer were only mapped in counties that had at least 15 cases of that specific cancer diagnosed in each year. Frequencies of late stage at diagnosis for small counties that did not meet that threshold were combined into larger areas. However, a more rigorous assessment is required to identify chance occurrences.

8 • Heat Maps: Trends in Late Stage Diagnoses of Screenable Cancers in California Counties, 1988 – 2013
Female Breast Cancer
Breast cancer is the most commonly occurring cancer in California women, accounting for 32% of all cancers diagnosed in women.2 There were 25,632 new cases diagnosed in California in 2013, and 4,361
deaths.3 Risk factors include a personal or family history of breast cancer, genetic predisposition, early menarche, older age at first birth, nulliparity, later age at menopause, use of menopausal hormone therapy, dense breast tissue (as visualized by mammography), history of radiation to the chest, alcohol consumption, obesity, and being of white race.4
Incidence of breast cancer has been fairly stable since 1988, while mortality has declined by 37% since 1988.3 The observed decline is largely due to the combined effects of earlier diagnosis and better treatment. The majority (71%) of breast cancers in California are now diagnosed at an early stage, and the rate of late-stage disease has declined.5 Five-year survival rates are 99% for localized stage, 86% for regional stage cancer, and 28% for cancers with distal spread.5 This shift to earlier stage diagnoses reflects, in part, the increased numbers of women who receive regular breast cancer screening. Current American Cancer Society screening guidelines for women at average risk recommend that those 40 to 44 years of age have the choice for annual mammography; those 45 to 54 have annual mammography; and those 55 year of age and older have biennial or annual mammography, continuing as long as overall health is good and life expectancy is 10 or more years.6 Women at increased risk (by family history, genetic predisposition, past breast cancer), are advised to talk with their health care provider about the benefits and limitations of starting mammography screening earlier, having additional tests (e.g., breast ultrasound, magnetic resonance imaging [MRI]), and/or having more frequent exams. In 2013, 82% of women of screening age in California reported that they had a mammogram in the past year, compared to 68% in 1988.5 Non-Hispanic white women were most likely to have been screened in the past year (45%), followed by Hispanic (21%), Asian/Pacific Islander (8%), and non-Hispanic black (6%) women.5
Overall, the proportion of breast cancer cases diagnosed at later stages in California declined from 1999-2013. Across the state, there is a progressive trend towards early diagnosis of breast cancer, particularly in the San Francisco Bay Area, Sacramento, San Diego, and the High Sierra regions, as well as various individual counties (Figures 1a and 1b). Del Norte-Humboldt counties showed a statistically significant increasing trend of late stage diagnoses, and a number of counties (San Bernardino, Kern, Merced, and Kings) had consistently high proportions of breast cancer diagnosed at an advanced stage in recent years (Figure 1a). In 2013, San Bernardino, Kern, Merced, and Kings counties had the highest percentages of late stage disease in the state (33.2%-34.8% for San Bernardino and Kern; 34.9%-37.3% for Merced and Kings). Reasons for these disparities merit further investigation.

Heat Maps: Trends in Late Stage Diagnoses of Screenable Cancers in California Counties, 1988 – 2013 • 9
1988$ Los Angeles-Orange* (7,287,884) 0.38 0.38 0.37 0.35 0.35 0.35 0.34 0.33 0.32 0.32 0.34 0.33 0.33 0.33 0.33 0.33 0.33 0.33 0.32 0.32 0.31 0.31 0.32 0.31 0.3 0.3
$ Los Angeles* 0.39 0.39 0.38 0.36 0.34 0.35 0.35 0.34 0.34 0.33 0.35 0.34 0.34 0.34 0.34 0.35 0.34 0.33 0.33 0.32 0.33 0.32 0.32 0.33 0.3 0.31
$ Orange* 0.38 0.39 0.35 0.32 0.36 0.32 0.34 0.34 0.29 0.3 0.32 0.33 0.32 0.3 0.33 0.32 0.31 0.32 0.32 0.31 0.29 0.3 0.29 0.28 0.29 0.28
$ Ventura* 0.35 0.34 0.35 0.33 0.32 0.34 0.28 0.27 0.27 0.29 0.27 0.33 0.32 0.33 0.3 0.27 0.32 0.3 0.29 0.27 0.27 0.28 0.33 0.28 0.27 0.27
# Santa Barbara 0.36 0.28 0.4 0.3 0.33 0.38 0.29 0.32 0.31 0.24 0.25 0.27 0.26 0.31 0.26 0.3 0.31 0.34 0.24 0.27 0.31 0.27 0.28 0.31 0.28 0.27
$ Bay Area* (3,747,180) 0.35 0.36 0.34 0.33 0.31 0.32 0.29 0.3 0.3 0.28 0.29 0.3 0.3 0.3 0.3 0.29 0.29 0.29 0.28 0.28 0.28 0.26 0.27 0.26 0.27 0.26
$ Santa Clara* 0.38 0.42 0.35 0.35 0.33 0.35 0.3 0.32 0.3 0.26 0.29 0.29 0.3 0.33 0.3 0.3 0.31 0.28 0.27 0.3 0.27 0.26 0.26 0.24 0.28 0.25
$ Alameda* 0.37 0.39 0.34 0.36 0.32 0.32 0.31 0.33 0.29 0.32 0.33 0.31 0.32 0.32 0.29 0.31 0.32 0.31 0.29 0.3 0.29 0.27 0.29 0.27 0.28 0.27
$ Contra Costa* 0.33 0.34 0.3 0.27 0.31 0.3 0.29 0.29 0.3 0.28 0.29 0.31 0.3 0.31 0.33 0.3 0.29 0.28 0.28 0.28 0.29 0.25 0.28 0.27 0.27 0.27
$ San Francisco* 0.36 0.34 0.33 0.32 0.29 0.32 0.31 0.3 0.32 0.26 0.26 0.33 0.35 0.29 0.28 0.27 0.28 0.29 0.3 0.27 0.25 0.26 0.24 0.26 0.24 0.25
$ San Mateo* 0.34 0.31 0.31 0.34 0.32 0.31 0.23 0.25 0.27 0.25 0.26 0.27 0.27 0.27 0.28 0.23 0.23 0.27 0.25 0.25 0.26 0.23 0.24 0.24 0.22 0.22
$ Sonoma 0.36 0.37 0.37 0.34 0.28 0.36 0.34 0.28 0.29 0.27 0.29 0.29 0.3 0.28 0.35 0.32 0.32 0.3 0.27 0.27 0.26 0.26 0.29 0.28 0.3 0.27
$ Solano 0.37 0.36 0.4 0.36 0.34 0.31 0.27 0.35 0.37 0.36 0.36 0.37 0.34 0.28 0.31 0.32 0.28 0.31 0.32 0.34 0.32 0.32 0.29 0.28 0.3 0.29
$ Marin* 0.27 0.29 0.33 0.28 0.31 0.27 0.24 0.27 0.26 0.28 0.24 0.27 0.27 0.29 0.31 0.27 0.29 0.26 0.26 0.27 0.25 0.22 0.24 0.21 0.28 0.24
# Napa 0.31 0.33 0.32 0.27 0.3 0.33 0.29 0.26 0.3 0.27 0.31 0.26 0.25 0.28 0.29 0.24 0.28 0.27 0.22 0.21 0.34 0.29 0.25 0.28 0.33 0.27
$ Inland Empire* (2,198,647) 0.36 0.39 0.36 0.34 0.36 0.34 0.36 0.35 0.34 0.32 0.33 0.35 0.32 0.32 0.33 0.35 0.34 0.34 0.32 0.32 0.33 0.33 0.33 0.32 0.31 0.31
$ Riverside* 0.36 0.38 0.37 0.33 0.35 0.31 0.34 0.35 0.33 0.3 0.31 0.33 0.33 0.34 0.33 0.36 0.33 0.31 0.32 0.31 0.3 0.29 0.31 0.3 0.3 0.3
# San Bernardino 0.36 0.39 0.36 0.36 0.36 0.37 0.38 0.36 0.36 0.34 0.35 0.36 0.3 0.31 0.34 0.35 0.35 0.37 0.33 0.33 0.36 0.37 0.34 0.34 0.32 0.33
$ Central Valley (2,019,003) 0.4 0.41 0.37 0.37 0.37 0.37 0.34 0.33 0.31 0.3 0.32 0.33 0.32 0.35 0.33 0.34 0.33 0.32 0.33 0.35 0.34 0.32 0.31 0.34 0.33 0.31
$ Fresno* 0.35 0.39 0.38 0.38 0.34 0.36 0.33 0.34 0.27 0.26 0.3 0.32 0.32 0.37 0.35 0.35 0.34 0.3 0.31 0.31 0.34 0.33 0.26 0.3 0.3 0.3
$ Kern 0.44 0.43 0.42 0.41 0.41 0.41 0.32 0.35 0.36 0.36 0.35 0.37 0.35 0.36 0.33 0.38 0.35 0.38 0.35 0.37 0.37 0.34 0.3 0.38 0.34 0.33
# San Joaquin 0.35 0.34 0.36 0.34 0.33 0.34 0.35 0.31 0.27 0.27 0.31 0.33 0.31 0.32 0.33 0.28 0.28 0.33 0.31 0.33 0.3 0.31 0.33 0.29 0.35 0.31
# Stanislaus 0.46 0.45 0.4 0.35 0.38 0.37 0.34 0.3 0.33 0.29 0.34 0.31 0.26 0.28 0.28 0.31 0.31 0.26 0.32 0.42 0.35 0.34 0.32 0.39 0.31 0.3
$ Tulare 0.42 0.46 0.32 0.37 0.39 0.38 0.37 0.32 0.32 0.29 0.32 0.33 0.35 0.36 0.38 0.36 0.35 0.29 0.31 0.38 0.3 0.35 0.35 0.31 0.31 0.31
# Merced 0.43 0.46 0.36 0.34 0.51 0.37 0.4 0.39 0.29 0.36 0.32 0.3 0.29 0.4 0.35 0.35 0.38 0.35 0.4 0.34 0.37 0.32 0.35 0.43 0.4 0.35
$ Madera 0.39 0.42 0.34 0.37 0.4 0.39 0.31 0.38 0.27 0.38 0.34 0.32 0.43 0.33 0.35 0.44 0.3 0.38 0.37 0.23 0.32 0.24 0.34 0.35 0.32 0.31
$ Kings 0.44 0.36 0.31 0.43 0.36 0.34 0.4 0.35 0.51 0.36 0.42 0.45 0.38 0.38 0.28 0.38 0.32 0.37 0.45 0.36 0.27 0.24 0.4 0.51 0.36 0.36
$ San Diego-Imperial* (1,683,299) 0.37 0.38 0.35 0.34 0.35 0.36 0.33 0.32 0.31 0.3 0.31 0.32 0.34 0.33 0.33 0.33 0.31 0.32 0.3 0.32 0.3 0.28 0.29 0.29 0.29 0.28
$ San Diego* 0.36 0.38 0.35 0.33 0.35 0.36 0.33 0.32 0.31 0.3 0.31 0.32 0.34 0.33 0.33 0.33 0.31 0.31 0.29 0.32 0.3 0.28 0.29 0.29 0.29 0.28
# Imperial 0.49 0.5 0.61 0.51 0.45 0.37 0.36 0.47 0.42 0.3 0.37 0.32 0.34 0.38 0.36 0.35 0.35 0.37 0.33 0.38 0.35 0.26 0.45 0.37 0.36 0.31
$ Sacramento Region* (1,180,040) 0.35 0.35 0.35 0.33 0.31 0.29 0.29 0.3 0.32 0.3 0.32 0.3 0.3 0.31 0.32 0.3 0.29 0.29 0.31 0.31 0.3 0.27 0.27 0.26 0.27 0.27
$ Sacramento* 0.36 0.36 0.36 0.33 0.33 0.29 0.3 0.31 0.35 0.31 0.32 0.31 0.3 0.31 0.32 0.31 0.29 0.3 0.34 0.32 0.31 0.3 0.3 0.28 0.27 0.29
$ Placer* 0.36 0.37 0.34 0.3 0.24 0.33 0.28 0.31 0.28 0.26 0.32 0.29 0.3 0.3 0.31 0.29 0.31 0.28 0.28 0.34 0.26 0.23 0.21 0.23 0.25 0.25
$ Yolo* 0.28 0.32 0.35 0.31 0.26 0.22 0.3 0.34 0.23 0.37 0.37 0.31 0.34 0.33 0.28 0.26 0.28 0.31 0.31 0.27 0.27 0.23 0.29 0.23 0.26 0.27
$ El Dorado 0.32 0.38 0.31 0.34 0.31 0.31 0.32 0.29 0.35 0.32 0.32 0.3 0.33 0.28 0.32 0.3 0.31 0.28 0.27 0.29 0.34 0.26 0.27 0.3 0.29 0.28
$ Nevada 0.32 0.28 0.36 0.41 0.33 0.34 0.21 0.22 0.22 0.21 0.3 0.22 0.27 0.32 0.33 0.21 0.24 0.29 0.26 0.29 0.26 0.25 0.2 0.22 0.23 0.22
$ Northern California (553,917) 0.38 0.37 0.35 0.35 0.31 0.36 0.33 0.35 0.29 0.31 0.31 0.31 0.33 0.3 0.33 0.3 0.31 0.31 0.31 0.33 0.31 0.3 0.31 0.32 0.32 0.3
$ Butte 0.36 0.29 0.41 0.36 0.3 0.37 0.3 0.38 0.29 0.28 0.26 0.32 0.33 0.29 0.3 0.26 0.31 0.33 0.34 0.31 0.31 0.26 0.36 0.32 0.31 0.3
$ Shasta 0.39 0.3 0.3 0.31 0.29 0.34 0.35 0.32 0.27 0.39 0.32 0.33 0.36 0.27 0.33 0.33 0.34 0.32 0.32 0.34 0.33 0.27 0.28 0.33 0.28 0.31
# Del Norte-Humboldt* 0.41 0.45 0.33 0.35 0.31 0.34 0.35 0.38 0.28 0.24 0.36 0.3 0.25 0.25 0.32 0.29 0.33 0.25 0.27 0.35 0.3 0.39 0.32 0.32 0.41 0.3
$ Colusa-Glenn-Tehama 0.4 0.52 0.36 0.33 0.32 0.44 0.37 0.39 0.3 0.3 0.28 0.3 0.34 0.34 0.38 0.32 0.3 0.24 0.37 0.36 0.33 0.34 0.27 0.32 0.36 0.3
# Sutter 0.35 0.33 0.4 0.3 0.24 0.34 0.28 0.43 0.37 0.27 0.34 0.23 0.28 0.32 0.3 0.34 0.21 0.35 0.23 0.29 0.36 0.32 0.26 0.2 0.26 0.26
$ Mendocino* 0.41 0.46 0.28 0.35 0.29 0.29 0.26 0.33 0.26 0.3 0.24 0.34 0.4 0.35 0.45 0.26 0.35 0.29 0.34 0.32 0.31 0.27 0.21 0.31 0.27 0.28
$ Sierra-Yuba 0.48 0.35 0.27 0.45 0.31 0.34 0.35 0.25 0.42 0.29 0.41 0.38 0.34 0.32 0.3 0.21 0.4 0.3 0.26 0.34 0.39 0.25 0.33 0.33 0.27 0.29
# Lake 0.31 0.47 0.43 0.36 0.39 0.35 0.32 0.26 0.26 0.29 0.29 0.29 0.27 0.34 0.36 0.39 0.22 0.38 0.33 0.3 0.22 0.31 0.38 0.33 0.33 0.3
# Siskiyou-Trinity 0.38 0.33 0.41 0.41 0.31 0.37 0.44 0.33 0.29 0.3 0.32 0.22 0.33 0.26 0.35 0.25 0.21 0.3 0.29 0.38 0.25 0.35 0.28 0.37 0.47 0.31
$ Lassen-Modoc-Plumas 0.33 0.38 0.25 0.39 0.53 0.3 0.27 0.46 0.26 0.46 0.38 0.32 0.42 0.32 0.32 0.45 0.35 0.4 0.3 0.31 0.43 0.22 0.3 0.38 0.25 0.32
$ Central Coast (508,193) 0.41 0.37 0.32 0.34 0.33 0.34 0.29 0.32 0.28 0.3 0.32 0.28 0.37 0.32 0.28 0.31 0.29 0.3 0.34 0.31 0.3 0.3 0.29 0.29 0.26 0.28
$ Monterey 0.38 0.35 0.31 0.34 0.32 0.39 0.33 0.29 0.27 0.28 0.33 0.26 0.33 0.3 0.3 0.3 0.33 0.31 0.33 0.26 0.27 0.31 0.31 0.31 0.28 0.28
$ Santa Cruz 0.45 0.39 0.32 0.33 0.28 0.3 0.27 0.31 0.29 0.37 0.32 0.34 0.45 0.33 0.29 0.37 0.31 0.28 0.38 0.36 0.36 0.3 0.26 0.32 0.3 0.31
$ San Luis Obispo 0.39 0.36 0.31 0.35 0.4 0.35 0.27 0.34 0.3 0.29 0.31 0.26 0.35 0.33 0.25 0.31 0.24 0.3 0.29 0.33 0.29 0.29 0.29 0.23 0.2 0.25
# San Benito 0.38 0.4 0.29 0.24 0.38 0.43 0.29 0.29 0.33 0.24 0.27 0.37 0.32 0.21 0.21 0.3 0.45 0.32 0.24 0.2 0.36 0.4 0.25
$ High Sierra* (90,162) 0.45 0.33 0.31 0.33 0.38 0.32 0.36 0.32 0.29 0.36 0.26 0.33 0.32 0.39 0.31 0.35 0.32 0.26 0.33 0.36 0.34 0.29 0.28 0.3 0.22 0.28
$ Alpine-Amador-Calaveras 0.35 0.29 0.3 0.23 0.36 0.3 0.34 0.33 0.34 0.26 0.24 0.33 0.28 0.32 0.29 0.38 0.35 0.22 0.31 0.34 0.26 0.28 0.28 0.31 0.21 0.28
$ Mariposa-Tuolumne* 0.58 0.4 0.36 0.39 0.35 0.33 0.38 0.31 0.27 0.43 0.29 0.3 0.36 0.4 0.35 0.34 0.3 0.29 0.3 0.35 0.4 0.29 0.28 0.3 0.23 0.28
$ Inyo-Mono 0.26 0.23 0.38 0.53 0.35 0.4 0.33 0.17 0.39 0.21 0.47 0.36 0.6 0.27 0.23 0.25 0.24 0.56 0.43 0.4 0.36 0.3 0.21 0.19
$ California* (19,268,325) 0.37 0.38 0.36 0.34 0.34 0.34 0.33 0.32 0.31 0.31 0.32 0.32 0.32 0.32 0.32 0.32 0.32 0.31 0.31 0.31 0.31 0.3 0.3 0.3 0.29 0.29
1999 15 Year Trend Period 2013
Figure 1a. Percent of Female Breast Cancer Cases Diagnosed at an Advanced Stagea by California Region and County (1988-2013)
Percent of Cancer Cases Diagnosed at Advanced Stage
Not calculated (<15 cases) 00.2 – 26.7 26.8 – 29.0 29.1 – 30.3 30.4 – 31.7 31.8 – 33.1 33.2 – 34.8 34.9 – 37.3 37.4 – 61.1
Female Population Size~
15,741 – 49,999 50,000 – 249,999 250,000 – 499,999 500,000 – 1,600,000 5,074,852
15-year Trends (1999 – 2013)
� decreasing trend � increasing trend
* statistically significant trend (p<0.05)
~ Number of people in 2013 estimated by National Center for Health Statistics (NCHS); Number in parentheses represents the female population size in the region/state. a Advanced Stage includes summary stage values of regional, remote, and unknown.
1988 1999 15 Year Trend Period 2013

10 • Heat Maps: Trends in Late Stage Diagnoses of Screenable Cancers in California Counties, 1988 – 2013
Figure 1b. Percent of Female Breast Cancer Cases Diagnosed at an Advanced Stagea by California Region (1988-2013)
1988$ Los Angeles-Orange* 0.38 0.38 0.37 0.35 0.35 0.35 0.34 0.33 0.32 0.32 0.34 0.33 0.33 0.33 0.33 0.33 0.33 0.33 0.32 0.32 0.31 0.31 0.32 0.31 0.3 0.3
$ Bay Area* 0.35 0.36 0.34 0.33 0.31 0.32 0.29 0.3 0.3 0.28 0.29 0.3 0.3 0.3 0.3 0.29 0.29 0.29 0.28 0.28 0.28 0.26 0.27 0.26 0.27 0.26
$ Inland Empire* 0.36 0.39 0.36 0.34 0.36 0.34 0.36 0.35 0.34 0.32 0.33 0.35 0.32 0.32 0.33 0.35 0.34 0.34 0.32 0.32 0.33 0.33 0.33 0.32 0.31 0.31
$ Central Valley 0.4 0.41 0.37 0.37 0.37 0.37 0.34 0.33 0.31 0.3 0.32 0.33 0.32 0.35 0.33 0.34 0.33 0.32 0.33 0.35 0.34 0.32 0.31 0.34 0.33 0.31
$ San Diego-Imperial* 0.37 0.38 0.35 0.34 0.35 0.36 0.33 0.32 0.31 0.3 0.31 0.32 0.34 0.33 0.33 0.33 0.31 0.32 0.3 0.32 0.3 0.28 0.29 0.29 0.29 0.28
$ Sacramento Region* 0.35 0.35 0.35 0.33 0.31 0.29 0.29 0.3 0.32 0.3 0.32 0.3 0.3 0.31 0.32 0.3 0.29 0.29 0.31 0.31 0.3 0.27 0.27 0.26 0.27 0.27
$ Northern California 0.38 0.37 0.35 0.35 0.31 0.36 0.33 0.35 0.29 0.31 0.31 0.31 0.33 0.3 0.33 0.3 0.31 0.31 0.31 0.33 0.31 0.3 0.31 0.32 0.32 0.3
$ Central Coast 0.41 0.37 0.32 0.34 0.33 0.34 0.29 0.32 0.28 0.3 0.32 0.28 0.37 0.32 0.28 0.31 0.29 0.3 0.34 0.31 0.3 0.3 0.29 0.29 0.26 0.28
$ High Sierra* 0.45 0.33 0.31 0.33 0.38 0.32 0.36 0.32 0.29 0.36 0.26 0.33 0.32 0.39 0.31 0.35 0.32 0.26 0.33 0.36 0.34 0.29 0.28 0.3 0.22 0.28
$ California* 0.37 0.38 0.36 0.34 0.34 0.34 0.33 0.32 0.31 0.31 0.32 0.32 0.32 0.32 0.32 0.32 0.32 0.31 0.31 0.31 0.31 0.3 0.3 0.3 0.29 0.29
1999 15 Year Trend Period 2013
Percent of Cancer Cases Diagnosed at Advanced Stage
Not calculated (<15 cases) 00.2 – 26.7 26.8 – 29.0 29.1 – 30.3 30.4 – 31.7 31.8 – 33.1 33.2 – 34.8 34.9 – 37.3 37.4 – 61.1
1988 1999 15 Year Trend Period 2013
15-year Trends (1999 – 2013)
� decreasing trend � increasing trend
* statistically significant trend (p<0.05)
a Advanced Stage includes summary stage values of regional, remote, and unknown.

Heat Maps: Trends in Late Stage Diagnoses of Screenable Cancers in California Counties, 1988 – 2013 • 11
Colon and Rectum Cancer
Colon and rectum (colorectal) cancer is the third most common cancer in California among both men and women, and it is the third most common cause of cancer-related death for each sex.2 It is less
common than either breast or prostate cancer, but has a poorer prognosis. The five-year survival rate for colorectal cancer for all stages combined is 67% compared to 91% for breast cancer and nearly 100% for prostate cancer.5 The poorer prognosis is related to it being detected more often at a later stage.
Colorectal cancer screening offers opportunities for both prevention and early detection. Current guidelines recommend that screening begin at age 50 for men and women who are at average risk of developing colorectal cancer.7 Endoscopic screening allows for the removal of polyps that might become cancerous, as well as detecting cancer at earlier stages when treatment is usually more successful. There are a number of recommended screening options (colonoscopy, sigmoidoscopy, CT colonography, fecal occult blood test, stool DNA test [gene expression profiling], fecal immunochemical test) which differ by the extent of bowel preparation, as well as test performance, time interval, and cost. When detected at a localized stage, the five year survival rate for colorectal cancer is 92%, compared to 13% when diagnosed after it has metastasized.5
Colorectal cancer risk has declined steadily in California over the past 25 years, with incidence and mortality rates declining in all racial ethnic groups.3 This trend likely reflects improvements in early detection and treatment, although only 42% of colorectal cancers are diagnosed at an early stage at present.5 Unfortunately, screening is still underutilized in California. In 2013, only 49% of California adults ages 50 and over reported having been screened with sigmoidoscopy or colonoscopy within the past five years. The proportion screened was even lower among persons living in poverty (10% male, 12% female).5
In 2013, 57.5%-59.2% of colorectal cancers were diagnosed at an advanced stage (Figures 2a and 2b). This is a slight decline since 1997, when 59.3%-60.8% were diagnosed at a late stage, but the percentage has slightly increased since 2008, when it was 52.5%-55.8%. Overall, the percentage has remained relatively constant in recent years. Some regions have improved over time, including the San Francisco Bay Area, Inland Empire, and Central Valley, while other regions (San Diego-Imperial and Northern California) have worsened (Figure 2b). Some counties (Sacramento, Placer, Mendocino, Lake, Lassen-Modoc-Plumas, Santa Cruz) have had persistently high percentages of late stage diagnoses which have remained relatively constant over time (Figure 2a). Individual counties with statistically significant worsening trends include Santa Barbara, Sonoma, Butte, and Sutter. Population health could be materially improved if communities with high proportions of late-stage colorectal cancer were identified, the reasons for late stage diagnosis investigated, and effective strategies to increase access to high quality screening implemented.

12 • Heat Maps: Trends in Late Stage Diagnoses of Screenable Cancers in California Counties, 1988 – 2013
Figure 2a. Percent of Colorectal Cancer Cases Diagnosed at an Advanced Stagea by California region and county (1988-2013)
$ Los Angeles-Orange (14,406,748) 0.61 0.61 0.62 0.61 0.59 0.6 0.59 0.6 0.6 0.6 0.59 0.58 0.58 0.57 0.57 0.57 0.58 0.57 0.57 0.55 0.55 0.57 0.57 0.58 0.58 0.58
# Los Angeles 0.61 0.62 0.62 0.6 0.59 0.6 0.6 0.6 0.6 0.6 0.59 0.59 0.59 0.58 0.57 0.58 0.58 0.58 0.57 0.55 0.56 0.58 0.57 0.59 0.59 0.59
$ Orange 0.63 0.63 0.6 0.64 0.59 0.59 0.59 0.59 0.59 0.58 0.58 0.55 0.55 0.56 0.57 0.52 0.57 0.54 0.56 0.54 0.51 0.53 0.57 0.54 0.55 0.52
$ Ventura 0.6 0.54 0.62 0.62 0.62 0.6 0.65 0.64 0.65 0.65 0.62 0.62 0.56 0.62 0.59 0.58 0.53 0.48 0.52 0.5 0.51 0.57 0.55 0.59 0.6 0.6
# Santa Barbara* 0.59 0.52 0.66 0.52 0.53 0.59 0.51 0.59 0.51 0.59 0.56 0.55 0.64 0.46 0.55 0.59 0.55 0.49 0.58 0.57 0.55 0.56 0.62 0.64 0.61 0.69
$ Bay Area* (7,438,456) 0.62 0.59 0.62 0.62 0.61 0.62 0.6 0.6 0.6 0.61 0.57 0.58 0.6 0.6 0.6 0.6 0.58 0.57 0.58 0.56 0.55 0.57 0.59 0.56 0.55 0.57
$ Santa Clara* 0.62 0.63 0.6 0.65 0.61 0.63 0.6 0.6 0.61 0.63 0.56 0.58 0.61 0.6 0.62 0.55 0.58 0.55 0.57 0.54 0.54 0.54 0.58 0.54 0.57 0.54
$ Alameda 0.61 0.6 0.63 0.64 0.63 0.68 0.57 0.61 0.57 0.62 0.6 0.57 0.66 0.63 0.62 0.61 0.6 0.58 0.64 0.58 0.56 0.6 0.6 0.58 0.57 0.58
$ Contra Costa 0.58 0.6 0.59 0.63 0.58 0.61 0.62 0.56 0.59 0.59 0.55 0.6 0.57 0.59 0.57 0.62 0.64 0.6 0.55 0.63 0.57 0.56 0.55 0.58 0.56 0.56
$ San Francisco 0.62 0.57 0.66 0.6 0.65 0.61 0.61 0.61 0.59 0.55 0.54 0.59 0.57 0.59 0.54 0.61 0.55 0.59 0.55 0.55 0.51 0.57 0.61 0.58 0.53 0.57
$ San Mateo* 0.63 0.58 0.64 0.67 0.66 0.63 0.61 0.59 0.61 0.58 0.58 0.56 0.61 0.61 0.59 0.63 0.52 0.55 0.56 0.54 0.55 0.56 0.59 0.51 0.5 0.56
# Sonoma* 0.65 0.57 0.67 0.57 0.61 0.64 0.56 0.6 0.62 0.64 0.55 0.58 0.59 0.56 0.63 0.6 0.63 0.64 0.64 0.64 0.62 0.65 0.73 0.63 0.64 0.67
$ Solano* 0.69 0.51 0.65 0.55 0.56 0.65 0.67 0.65 0.68 0.75 0.66 0.7 0.62 0.61 0.63 0.72 0.53 0.54 0.55 0.5 0.5 0.54 0.56 0.54 0.58 0.54
$ Marin* 0.68 0.65 0.61 0.51 0.53 0.53 0.62 0.57 0.64 0.62 0.61 0.65 0.58 0.5 0.61 0.56 0.53 0.55 0.59 0.49 0.52 0.52 0.5 0.5 0.43 0.54
# Napa 0.51 0.53 0.44 0.44 0.51 0.4 0.57 0.54 0.67 0.62 0.42 0.43 0.5 0.6 0.56 0.6 0.54 0.52 0.42 0.45 0.55 0.5 0.54 0.46 0.48 0.65
$ Inland Empire* (4,380,878) 0.64 0.61 0.61 0.6 0.62 0.6 0.64 0.62 0.58 0.63 0.61 0.59 0.6 0.58 0.57 0.58 0.57 0.6 0.59 0.56 0.56 0.57 0.54 0.57 0.56 0.57
$ Riverside 0.62 0.63 0.61 0.62 0.6 0.6 0.63 0.61 0.6 0.6 0.58 0.56 0.57 0.61 0.58 0.58 0.55 0.59 0.57 0.55 0.58 0.59 0.55 0.59 0.57 0.56
$ San Bernardino* 0.65 0.58 0.62 0.58 0.64 0.6 0.65 0.63 0.55 0.66 0.65 0.61 0.63 0.55 0.55 0.58 0.59 0.61 0.61 0.56 0.55 0.54 0.53 0.56 0.53 0.58
$ Central Valley* (4,069,986) 0.61 0.6 0.59 0.59 0.56 0.59 0.57 0.56 0.63 0.61 0.6 0.6 0.57 0.59 0.59 0.61 0.6 0.56 0.57 0.55 0.54 0.54 0.54 0.55 0.57 0.57
$ Fresno* 0.64 0.68 0.59 0.65 0.61 0.68 0.69 0.67 0.68 0.65 0.61 0.63 0.62 0.64 0.58 0.63 0.56 0.53 0.55 0.6 0.54 0.59 0.56 0.52 0.57 0.58
$ Kern 0.62 0.61 0.63 0.65 0.56 0.64 0.57 0.56 0.64 0.57 0.58 0.59 0.53 0.56 0.69 0.65 0.67 0.64 0.58 0.51 0.57 0.58 0.6 0.54 0.6 0.54
$ San Joaquin* 0.61 0.62 0.65 0.54 0.52 0.51 0.55 0.52 0.59 0.65 0.63 0.63 0.59 0.61 0.62 0.62 0.61 0.57 0.63 0.54 0.52 0.47 0.47 0.52 0.54 0.54
$ Stanislaus 0.64 0.55 0.44 0.54 0.51 0.56 0.47 0.43 0.55 0.52 0.57 0.58 0.49 0.53 0.58 0.54 0.6 0.53 0.54 0.57 0.54 0.52 0.47 0.59 0.56 0.52
# Tulare 0.45 0.47 0.61 0.56 0.57 0.57 0.52 0.58 0.65 0.53 0.56 0.57 0.57 0.52 0.52 0.56 0.57 0.51 0.62 0.52 0.53 0.53 0.59 0.57 0.56 0.63
# Merced 0.61 0.65 0.63 0.56 0.58 0.47 0.5 0.58 0.61 0.65 0.63 0.56 0.51 0.63 0.48 0.64 0.58 0.54 0.41 0.68 0.6 0.51 0.63 0.69 0.6 0.66
$ Madera 0.64 0.67 0.64 0.6 0.54 0.64 0.59 0.63 0.59 0.78 0.67 0.53 0.67 0.71 0.65 0.55 0.5 0.52 0.49 0.49 0.61 0.53 0.55 0.44 0.56 0.61
# Kings 0.74 0.42 0.69 0.49 0.57 0.6 0.59 0.64 0.79 0.71 0.82 0.56 0.63 0.55 0.5 0.63 0.57 0.67 0.64 0.44 0.48 0.44 0.56 0.57 0.6 0.73
# San Diego-Imperial* (3,387,836) 0.57 0.57 0.6 0.59 0.56 0.57 0.57 0.59 0.57 0.56 0.59 0.56 0.58 0.58 0.59 0.59 0.57 0.57 0.58 0.58 0.56 0.57 0.59 0.61 0.59 0.6
# San Diego 0.59 0.57 0.59 0.59 0.56 0.58 0.57 0.58 0.57 0.55 0.58 0.56 0.58 0.58 0.6 0.58 0.57 0.56 0.58 0.59 0.56 0.57 0.59 0.61 0.6 0.59
# Imperial 0.33 0.51 0.79 0.61 0.52 0.52 0.62 0.76 0.56 0.75 0.75 0.49 0.48 0.54 0.49 0.68 0.51 0.63 0.64 0.51 0.5 0.59 0.63 0.63 0.52 0.64
$ Sacramento Region (2,313,970) 0.56 0.61 0.66 0.61 0.64 0.65 0.62 0.62 0.62 0.63 0.61 0.6 0.62 0.62 0.65 0.64 0.64 0.62 0.59 0.64 0.62 0.61 0.58 0.57 0.6 0.61
$ Sacramento 0.57 0.61 0.67 0.6 0.65 0.67 0.63 0.65 0.62 0.66 0.62 0.62 0.63 0.63 0.65 0.65 0.64 0.63 0.59 0.67 0.6 0.59 0.57 0.58 0.61 0.63
$ Placer 0.53 0.63 0.65 0.68 0.64 0.6 0.61 0.6 0.62 0.72 0.66 0.61 0.63 0.58 0.69 0.65 0.64 0.62 0.64 0.59 0.66 0.67 0.62 0.55 0.62 0.6
$ Yolo 0.54 0.67 0.75 0.62 0.68 0.71 0.66 0.66 0.62 0.57 0.65 0.64 0.66 0.6 0.64 0.62 0.68 0.62 0.53 0.68 0.65 0.71 0.68 0.59 0.59 0.51
# El Dorado 0.55 0.53 0.46 0.53 0.53 0.52 0.56 0.52 0.64 0.44 0.44 0.47 0.49 0.61 0.59 0.53 0.6 0.49 0.6 0.46 0.6 0.56 0.53 0.52 0.57 0.6
$ Nevada 0.58 0.61 0.67 0.61 0.59 0.6 0.57 0.56 0.64 0.58 0.64 0.57 0.54 0.62 0.64 0.68 0.65 0.67 0.53 0.63 0.72 0.56 0.48 0.56 0.52 0.56
# Northern California* (1,115,996) 0.62 0.68 0.62 0.63 0.65 0.62 0.6 0.64 0.59 0.61 0.57 0.6 0.59 0.55 0.59 0.62 0.58 0.6 0.55 0.59 0.62 0.58 0.62 0.62 0.62 0.63
# Butte* 0.61 0.71 0.66 0.62 0.61 0.6 0.58 0.64 0.61 0.65 0.62 0.59 0.59 0.58 0.6 0.63 0.68 0.69 0.58 0.65 0.67 0.68 0.74 0.68 0.67 0.61
$ Shasta 0.61 0.67 0.53 0.59 0.72 0.58 0.57 0.69 0.63 0.59 0.57 0.62 0.58 0.6 0.56 0.64 0.55 0.59 0.45 0.58 0.58 0.46 0.62 0.68 0.48 0.55
# Del Norte-Humboldt 0.63 0.68 0.63 0.63 0.58 0.52 0.61 0.6 0.49 0.64 0.56 0.46 0.46 0.47 0.5 0.54 0.55 0.48 0.57 0.46 0.54 0.47 0.41 0.49 0.54 0.68
# Colusa-Glenn-Tehama 0.45 0.71 0.61 0.58 0.7 0.65 0.64 0.7 0.64 0.54 0.48 0.65 0.67 0.52 0.67 0.66 0.47 0.61 0.58 0.67 0.59 0.63 0.73 0.69 0.69 0.6
# Sutter* 0.7 0.6 0.57 0.77 0.58 0.67 0.61 0.67 0.48 0.59 0.48 0.51 0.41 0.6 0.54 0.59 0.36 0.49 0.49 0.56 0.67 0.59 0.56 0.52 0.73 0.71
# Mendocino 0.76 0.76 0.62 0.65 0.75 0.52 0.56 0.63 0.52 0.68 0.67 0.72 0.69 0.62 0.63 0.67 0.56 0.67 0.7 0.56 0.74 0.51 0.76 0.69 0.74 0.6
# Sierra-Yuba 0.64 0.59 0.59 0.75 0.47 0.57 0.61 0.41 0.55 0.54 0.58 0.69 0.6 0.46 0.57 0.6 0.61 0.65 0.52 0.64 0.52 0.78 0.56 0.64 0.5 0.75
$ Lake 0.62 0.71 0.71 0.63 0.84 0.81 0.6 0.56 0.75 0.7 0.59 0.7 0.8 0.6 0.66 0.67 0.7 0.66 0.57 0.61 0.72 0.65 0.67 0.57 0.66 0.7
$ Lassen-Modoc-Plumas 0.81 0.47 0.53 0.71 0.84 0.81 0.7 0.44 0.71 0.7 0.67 0.7 0.62 0.64 0.53 0.67 0.67 0.71
# Siskiyou-Trinity 0.74 0.56 0.78 0.67 0.61 0.73 0.72 0.67 0.57 0.61 0.5 0.57 0.51 0.39 0.64 0.57 0.64 0.52 0.42 0.59 0.57 0.52 0.57 0.64 0.68 0.58
# Central Coast (1,032,288) 0.62 0.62 0.64 0.64 0.61 0.62 0.63 0.6 0.56 0.62 0.58 0.61 0.58 0.57 0.61 0.59 0.56 0.55 0.58 0.59 0.54 0.58 0.6 0.63 0.61 0.6
$ Monterey 0.64 0.61 0.67 0.69 0.61 0.64 0.66 0.59 0.51 0.55 0.55 0.58 0.52 0.5 0.56 0.54 0.49 0.49 0.48 0.51 0.47 0.46 0.59 0.51 0.5 0.58
# San Luis Obispo 0.55 0.51 0.56 0.54 0.49 0.56 0.57 0.5 0.55 0.61 0.53 0.63 0.55 0.59 0.61 0.54 0.56 0.54 0.6 0.63 0.57 0.69 0.62 0.73 0.7 0.58
$ Santa Cruz 0.65 0.72 0.72 0.72 0.7 0.65 0.67 0.69 0.63 0.66 0.65 0.62 0.67 0.63 0.67 0.74 0.66 0.71 0.71 0.65 0.61 0.58 0.58 0.68 0.61 0.66
# San Benito 0.47 0.42 0.63 0.59 0.53 0.76 0.71 0.7 0.65 0.58 0.36 0.4 0.56 0.43 0.55 0.55 0.71 0.65
$ High Sierra (186,363) 0.65 0.61 0.65 0.58 0.6 0.68 0.6 0.58 0.54 0.6 0.72 0.66 0.56 0.56 0.46 0.6 0.5 0.54 0.56 0.5 0.62 0.57 0.54 0.59 0.54 0.59
$ Alpine-Amador-Calaveras 0.59 0.62 0.66 0.58 0.6 0.63 0.63 0.49 0.51 0.59 0.7 0.63 0.52 0.56 0.5 0.64 0.43 0.57 0.5 0.57 0.58 0.56 0.52 0.63 0.44 0.6
# Mariposa-Tuolumne 0.74 0.63 0.62 0.57 0.65 0.71 0.51 0.64 0.56 0.57 0.69 0.66 0.56 0.54 0.31 0.55 0.56 0.53 0.63 0.45 0.68 0.57 0.55 0.57 0.62 0.5
$ Inyo-Mono 0.5 0.44 0.73 0.82 0.63 0.65 0.63 0.57 0.61 0.63
$ California (38,332,521) 0.61 0.6 0.62 0.61 0.6 0.61 0.6 0.6 0.6 0.61 0.59 0.58 0.59 0.58 0.59 0.59 0.58 0.57 0.57 0.56 0.56 0.57 0.57 0.58 0.58 0.58
1988 1999 201315 Year Trend Period
Percent of Cancer Cases Diagnosed at Advanced Stage
Not calculated (<15 cases) 00.3 – 52.4 52.5 – 55.8 55.9 – 57.4 57.5 – 59.2 59.3 – 60.8 60.9 – 62.9 63.0 – 66.1 66.2 – 84.2
Population Size~
32,541 – 99,999 100,000 – 499,999 500,000 – 999,999 1,000,000 – 3,300,000 10,017,068
15-year Trends (1999 – 2013)
� decreasing trend � increasing trend
* statistically significant trend (p<0.05)
~ Number of people in 2013 estimated by National Center for Health Statistics (NCHS); Number in parentheses represents the population size in the region/state. a Advanced Stage includes summary stage values of regional, remote, and unknown.
1988 1999 15 Year Trend Period 2013

Heat Maps: Trends in Late Stage Diagnoses of Screenable Cancers in California Counties, 1988 – 2013 • 13
Figure 2b. Percent of Colorectal Cancer Cases Diagnosed at an Advanced Stagea by California region (1988-2013)
Percent of Cancer Cases Diagnosed at Advanced Stage
Not calculated (<15 cases) 00.3 – 52.4 52.5 – 55.8 55.9 – 57.4 57.5 – 59.2 59.3 – 60.8 60.9 – 62.9 63.0 – 66.1 66.2 – 84.2
15-year Trends (1999 – 2013)
� decreasing trend � increasing trend
* statistically significant trend (p<0.05)
$ Los Angeles-Orange 0.61 0.61 0.62 0.61 0.59 0.6 0.59 0.6 0.6 0.6 0.59 0.58 0.58 0.57 0.57 0.57 0.58 0.57 0.57 0.55 0.55 0.57 0.57 0.58 0.58 0.58
$ Bay Area* 0.62 0.59 0.62 0.62 0.61 0.62 0.6 0.6 0.6 0.61 0.57 0.58 0.6 0.6 0.6 0.6 0.58 0.57 0.58 0.56 0.55 0.57 0.59 0.56 0.55 0.57
$ Inland Empire* 0.64 0.61 0.61 0.6 0.62 0.6 0.64 0.62 0.58 0.63 0.61 0.59 0.6 0.58 0.57 0.58 0.57 0.6 0.59 0.56 0.56 0.57 0.54 0.57 0.56 0.57
$ Central Valley* 0.61 0.6 0.59 0.59 0.56 0.59 0.57 0.56 0.63 0.61 0.6 0.6 0.57 0.59 0.59 0.61 0.6 0.56 0.57 0.55 0.54 0.54 0.54 0.55 0.57 0.57
# San Diego-Imperial* 0.57 0.57 0.6 0.59 0.56 0.57 0.57 0.59 0.57 0.56 0.59 0.56 0.58 0.58 0.59 0.59 0.57 0.57 0.58 0.58 0.56 0.57 0.59 0.61 0.59 0.6
$ Sacramento Region 0.56 0.61 0.66 0.61 0.64 0.65 0.62 0.62 0.62 0.63 0.61 0.6 0.62 0.62 0.65 0.64 0.64 0.62 0.59 0.64 0.62 0.61 0.58 0.57 0.6 0.61
# Northern California* 0.62 0.68 0.62 0.63 0.65 0.62 0.6 0.64 0.59 0.61 0.57 0.6 0.59 0.55 0.59 0.62 0.58 0.6 0.55 0.59 0.62 0.58 0.62 0.62 0.62 0.63
# Central Coast 0.62 0.62 0.64 0.64 0.61 0.62 0.63 0.6 0.56 0.62 0.58 0.61 0.58 0.57 0.61 0.59 0.56 0.55 0.58 0.59 0.54 0.58 0.6 0.63 0.61 0.6
$ High Sierra 0.65 0.61 0.65 0.58 0.6 0.68 0.6 0.58 0.54 0.6 0.72 0.66 0.56 0.56 0.46 0.6 0.5 0.54 0.56 0.5 0.62 0.57 0.54 0.59 0.54 0.59
$ California 0.61 0.6 0.62 0.61 0.6 0.61 0.6 0.6 0.6 0.61 0.59 0.58 0.59 0.58 0.59 0.59 0.58 0.57 0.57 0.56 0.56 0.57 0.57 0.58 0.58 0.58
1988 1999 201315 Year Trend Period
a Advanced Stage includes summary stage values of regional, remote, and unknown.
1988 1999 15 Year Trend Period 2013

14 • Heat Maps: Trends in Late Stage Diagnoses of Screenable Cancers in California Counties, 1988 – 2013
Cervical Cancer
Both cervical cancer incidence and mortality rates have decreased in California since 1988, largely due to improved diagnosis through effective screening with Pap tests. Incidence rates have decreased from 11.88
in 1988, to 7.09 in 2013, and mortality rates have decreased from 3.4 in 1988 to 2.4 in 2013 (rates are age adjusted and per 100,000).3 Screening can detect cervical cancer early and identify precancerous changes that can be removed before they become cancer. Despite the availability of screening, there were 1,401 cases of cervical cancer diagnosed and 492 deaths in California.3
The number one risk factor for cervical cancer is infection with human papillomavirus (HPV).5 Almost all cervical cancers (more than 99%) are related to HPV. An effective vaccine against HPV exists and is recommended for preteens beginning at age 11 or 12.8
If detected early (localized stage), cervical cancer is highly curable with a five-year survival rate of 93%. This survival rate decreases to 59% for cases diagnosed at a regional stage and 19% when detected at a distant stage.5 In 2013, 45% of cases were diagnosed at stage I.9 The American Cancer Society recommends that women begin cervical cancer screening with a Pap smear at 21 years of age.10 A repeat Pap test every three years is recommended through age 29. For women ages 30 to 65, the testing interval can be extended to five years if it is combined with a HPV test. In California, 67% of women reported having a Pap test within the past two years. Non-Hispanic white women were the most likely to have had a Pap smear within the prior two years (29%), followed by Hispanic (25%), Asian and Pacific Islander (8%), and non-Hispanic black (4%) women.5
Overall, the percentage of cervical cancer cases diagnosed at a late stage increased in California over the study period, and was 54.9%-58.8% in 2013 (Figures 3a and 3b). The Central Valley, Sacramento region, and Northern California all had significantly increasing trends over the most recent fifteen year time period, and the Central Valley had the highest percentage of late stage diagnoses (58.9%-87.5%) in 2013 (Figure 3b). Only El Dorado County and the High Sierra region saw a significant decrease in the percentage of late stage diagnoses. Many counties have had consistently high percentages of late stage diagnoses in the most recent fifteen years, including Los Angeles, Orange, Riverside, San Bernardino, Fresno, San Joaquin, Stanislaus, San Diego, Imperial, Sacramento, and Butte (Figure 3a). Although lower percentages were observed in the San Francisco Bay Area and Central Coast regions, these areas have not seen a significant improvement in the past fifteen years. In 2013, 48.5%-50% of cases in the San Francisco Bay Area were diagnosed at late stage, while 46%-48.4% of cervical cancers were diagnosed at late stage in the Central Coast. Cervical cancer can be prevented, and it is important that health care professionals offer, and women follow, recommended measures to prevent the disease from occurring.

Heat Maps: Trends in Late Stage Diagnoses of Screenable Cancers in California Counties, 1988 – 2013 • 15
Figure 3a. Percent of Cervical Cancer Cases Diagnosed at an Advanced Stagea by California region and county (1990-2013b)
15 Year Trend Period90-92 99-02 11-13
# Los Angeles-Orange (7,287,884) 0.5 0.49 0.5 0.49 0.53 0.54 0.53 0.56
# Los Angeles 0.5 0.5 0.52 0.49 0.54 0.55 0.53 0.56
# Orange* 0.5 0.49 0.44 0.51 0.53 0.52 0.54 0.57
# Ventura 0.54 0.4 0.52 0.38 0.49 0.49 0.45 0.54
# Santa Barbara 0.43 0.48 0.39 0.48 0.35 0.58 0.63 0.53
# Bay Area (3,747,180) 0.49 0.43 0.43 0.43 0.47 0.48 0.5 0.49
# Santa Clara 0.49 0.38 0.39 0.4 0.41 0.52 0.49 0.47
$ Alameda 0.52 0.47 0.45 0.49 0.5 0.46 0.46 0.47
$ Contra Costa 0.44 0.44 0.49 0.46 0.5 0.44 0.47 0.46
# San Francisco 0.51 0.46 0.4 0.4 0.43 0.52 0.5 0.51
# San Mateo 0.42 0.42 0.37 0.39 0.5 0.43 0.54 0.47
# Sonoma 0.52 0.36 0.53 0.35 0.52 0.46 0.56 0.58
# Solano* 0.48 0.5 0.5 0.45 0.49 0.48 0.52 0.57
$ Marin 0.44 0.43 0.43 0.65 0.48 0.46 0.54 0.35
# Napa 0.41 0.48 0.4 0.6 0.56
# Inland Empire (2,198,647) 0.51 0.53 0.58 0.52 0.52 0.53 0.52 0.57
# Riverside 0.55 0.51 0.58 0.55 0.5 0.53 0.5 0.57
# San Bernardino 0.47 0.55 0.59 0.48 0.55 0.53 0.53 0.56
# Central Valley* (2,019,003) 0.53 0.5 0.46 0.49 0.53 0.55 0.56 0.62
# Fresno 0.5 0.53 0.47 0.52 0.54 0.58 0.52 0.64
# Kern* 0.51 0.6 0.46 0.48 0.47 0.58 0.55 0.62
# San Joaquin 0.53 0.36 0.51 0.55 0.52 0.62 0.68 0.65
# Stanislaus 0.49 0.51 0.43 0.46 0.66 0.53 0.51 0.75
# Tulare 0.47 0.47 0.5 0.49 0.71 0.49 0.62 0.56
# Merced* 0.66 0.62 0.32 0.32 0.45 0.44 0.63 0.57
$ Madera 0.53 0.35 0.46 0.52 0.33 0.46 0.54 0.37
# Kings 0.88 0.36 0.44 0.56 0.27 0.6
# San Diego-Imperial (1,683,299) 0.49 0.5 0.49 0.53 0.51 0.51 0.52 0.55
# San Diego 0.48 0.49 0.48 0.53 0.51 0.5 0.52 0.55
$ Imperial 0.68 0.6 0.76 0.6 0.55 0.61 0.52 0.45
# Sacramento Region* (1,180,040) 0.46 0.4 0.46 0.5 0.51 0.55 0.56 0.57
# Sacramento 0.43 0.39 0.45 0.5 0.51 0.59 0.58 0.56
# Placer* 0.58 0.4 0.48 0.41 0.51 0.35 0.4 0.54
# Yolo 0.59 0.43 0.47 0.67 0.5 0.41 0.65 0.7
$ El Dorado* 0.33 0.5 0.6 0.56 0.45 0.48 0.5
Nevada# Northern California* (553,917) 0.49 0.52 0.52 0.52 0.58 0.56 0.61 0.57
$ Butte 0.31 0.5 0.47 0.7 0.59 0.68 0.35 0.6
# Shasta 0.48 0.6 0.5 0.37 0.56 0.65 0.5
# Del Norte-Humboldt* 0.47 0.5 0.45 0.45 0.5 0.47 0.61 0.69
Colusa-Glenn-Tehama 0.65 0.4 0.59 0.63
Sutter 0.6
Mendocino 0.5 0.44
Sierra-Yuba 0.27
LakeSiskiyou-TrinityLassen-Modoc-Plumas
# Central Coast (508,193) 0.48 0.42 0.49 0.45 0.5 0.43 0.48 0.46
# Monterey* 0.45 0.39 0.48 0.46 0.46 0.44 0.53 0.56
$ Santa Cruz 0.64 0.55 0.54 0.52 0.38 0.46 0.38 0.33
# San Luis Obispo* 0.36 0.35 0.55 0.38 0.68 0.43 0.55 0.55
San Benito$ High Sierra* (90,162) 0.53 0.35 0.43 0.63 0.68 0.55 0.46 0.36
Alpine-Amador-Calaveras 0.47
Mariposa-Tuolumne 0.4
Inyo-Mono# California* (19,268,325) 0.5 0.48 0.49 0.49 0.52 0.53 0.53 0.55
Percent of Cancer Cases Diagnosed at Advanced Stage
Not calculated (<15 cases) 00.3 – 41.1 41.2 – 45.9 46.0 – 48.4 48.5 – 50.0 50.1 – 52.3 52.4 – 54.8 54.9 – 58.8 58.9 – 87.5
Female Population Size~
15,741 – 49,999 50,000 – 249,999 250,000 – 499,999 500,000 – 1,000,000 5,074,852
15-year Trends (1999 – 2013)
� decreasing trend � increasing trend
* statistically significant trend (p<0.05)
~ Number of people in 2013 estimated by National Center for Health Statistics (NCHS); Number in parentheses represents the female population size in the region/state. a Advanced Stage includes summary stage values of regional, remote, and unknown.b Each column aggregates 3 years starting from 1990.
15 Year Trend Period
90-92 99-02 11-13

16 • Heat Maps: Trends in Late Stage Diagnoses of Screenable Cancers in California Counties, 1988 – 2013
Figure 3b. Percent of Cervical Cancer Cases Diagnosed at an Advanced Stagea by California region (1990-2013b)
90-92 99-02 11-13
# Los Angeles-Orange 0.5 0.49 0.5 0.49 0.53 0.54 0.53 0.56
# Bay Area 0.49 0.43 0.43 0.43 0.47 0.48 0.5 0.49
# Inland Empire 0.51 0.53 0.58 0.52 0.52 0.53 0.52 0.57
# Central Valley* 0.53 0.5 0.46 0.49 0.53 0.55 0.56 0.62
# San Diego-Imperial 0.49 0.5 0.49 0.53 0.51 0.51 0.52 0.55
# Sacramento Region* 0.46 0.4 0.46 0.5 0.51 0.55 0.56 0.57
# Northern California* 0.49 0.52 0.52 0.52 0.58 0.56 0.61 0.57
# Central Coast 0.48 0.42 0.49 0.45 0.5 0.43 0.48 0.46
$ High Sierra* 0.53 0.35 0.43 0.63 0.68 0.55 0.46 0.36
# California* 0.5 0.48 0.49 0.49 0.52 0.53 0.53 0.55
15 Year Trend Period
Percent of Cancer Cases Diagnosed at Advanced Stage
Not calculated (<15 cases) 00.3 – 41.1 41.2 – 45.9 46.0 – 48.4 48.5 – 50.0 50.1 – 52.3 52.4 – 54.8 54.9 – 58.8 58.9 – 87.5
15-year Trends (1999 – 2013)
� decreasing trend � increasing trend
* statistically significant trend (p<0.05)
a Advanced Stage includes summary stage values of regional, remote, and unknown.b Each column aggregates 3 years starting from 1990.
15 Year Trend Period
90-92 99-02 11-13

Heat Maps: Trends in Late Stage Diagnoses of Screenable Cancers in California Counties, 1988 – 2013 • 17
Prostate Cancer
Prostate cancer is the most commonly occurring cancer among men, and the second most common cancer in California overall.2 The number of prostate cancers diagnosed each year rose dramatically in the early
1990s, when the prostate specific antigen (PSA) test began to be widely used for screening. Incidence rates peaked in 1992-93 and since 2011 have been below the 1988 rate.3 Although prostate cancer is the second leading cause of cancer death in men, mortality has decreased in California by 42% since 1988.2,3 In 2013, there were 18,655 new cases of prostate cancer diagnosed in California, and 3,111 deaths.3 Risk factors for prostate cancer include increasing age, African ancestry, a family history of the disease, and certain inherited genetic conditions.5 Approximately 60% of cases occur in men 65 years of age and older, and 97% occur in men 50 and older.5 Obesity and smoking are associated with an increased risk of dying from the disease.5
Because of concerns about over-diagnosis and treatment of slow-growing cancers that would never have caused harm, no credible organizations currently endorse routine prostate cancer screening with PSA for men at average risk. The American Cancer Society recommends that men of average risk have a conversation with their health care provider about the benefits and limitations of PSA testing beginning at age 50. Men at high risk (black men or those with a close relative diagnosed before the age of 65) should have this conversation beginning at age 40 to 45.11
The overwhelming majority (93%) of prostate cancers are diagnosed while still in a local or regional stage, when five-year survival rates approach 100%.5 Over the past 25 years, the five-year relative survival rate for all stages combined has increased from 68% to almost 100%, meaning that men diagnosed with non-metastatic prostate cancer have a similar life expectancy to those free from the disease.5
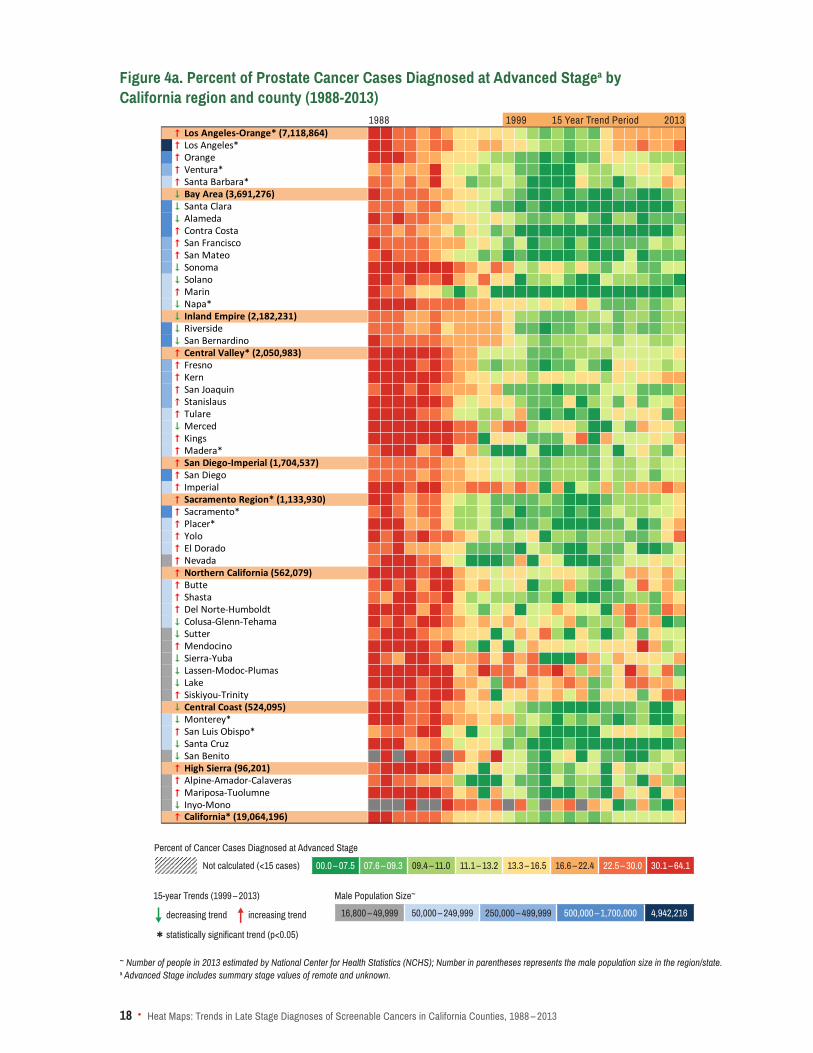
The percentage of late stage (remote) diagnoses of prostate cancer was high (16.6%-64.1%) from 1988 to 1994 in all regions and then began to decline in 1995. (Figure 4b). From 2000 to 2006 most regions had a low percentage of late stage diagnoses (under 13.2%). In the most recent fifteen years, a worsening trend has been seen in the state overall and particularly in the Los Angeles-Orange, Central Valley, and Sacramento regions. Only Napa and Monterey counties had a significantly decreasing percentage of late stage diagnoses in the most recent time frame (Figure 4a). Counties with persistently high proportions of late stage diagnoses in recent years include Kern, Imperial, Del Norte-Humboldt, Lake, and Siskiyou-Trinity. Many counties had a significantly increasing trend in late stage diagnoses, including Los Angeles, Ventura, Santa Barbara, Madera, Sacramento, Placer, and San Luis Obispo. Since the late 90’s, the San Francisco Bay Area has consistently had the lowest percentage of advanced stage diagnoses (0%-11%). In 2013, Los Angeles, Yolo, and Siskiyou-Trinity counties had the highest percentage of advanced stage diagnoses (22.5%-30%).
18 • Heat Maps: Trends in Late Stage Diagnoses of Screenable Cancers in California Counties, 1988 – 2013
Figure 4a. Percent of Prostate Cancer Cases Diagnosed at Advanced Stagea by California region and county (1988-2013)
1988# Los Angeles-Orange* (7,118,864) 0.31 0.32 0.28 0.23 0.2 0.23 0.2 0.15 0.14 0.16 0.16 0.15 0.12 0.1 0.09 0.1 0.08 0.1 0.09 0.13 0.17 0.18 0.19 0.17 0.17 0.2
# Los Angeles* 0.32 0.33 0.3 0.24 0.2 0.23 0.23 0.15 0.14 0.17 0.18 0.16 0.14 0.12 0.1 0.11 0.09 0.1 0.09 0.14 0.19 0.21 0.23 0.21 0.2 0.24
# Orange 0.31 0.33 0.3 0.23 0.2 0.21 0.15 0.14 0.14 0.11 0.11 0.11 0.09 0.08 0.07 0.08 0.07 0.08 0.08 0.14 0.14 0.12 0.11 0.09 0.1 0.11
# Ventura* 0.21 0.23 0.2 0.17 0.21 0.32 0.14 0.11 0.12 0.1 0.12 0.12 0.09 0.08 0.07 0.07 0.03 0.12 0.11 0.11 0.12 0.13 0.13 0.12 0.15 0.11
# Santa Barbara* 0.25 0.26 0.17 0.23 0.22 0.32 0.15 0.13 0.08 0.1 0.1 0.11 0.1 0.06 0.04 0.06 0.06 0.15 0.09 0.1 0.07 0.11 0.11 0.13 0.17 0.14
$ Bay Area (3,691,276) 0.31 0.29 0.27 0.25 0.24 0.22 0.19 0.15 0.14 0.13 0.12 0.1 0.09 0.07 0.07 0.08 0.07 0.09 0.07 0.07 0.08 0.08 0.07 0.07 0.08 0.1
$ Santa Clara 0.28 0.28 0.27 0.2 0.23 0.25 0.15 0.14 0.13 0.12 0.09 0.09 0.08 0.08 0.06 0.07 0.05 0.06 0.05 0.06 0.06 0.06 0.05 0.05 0.06 0.1
$ Alameda 0.31 0.29 0.31 0.28 0.26 0.19 0.17 0.15 0.16 0.12 0.15 0.13 0.1 0.09 0.09 0.1 0.09 0.12 0.09 0.06 0.1 0.1 0.07 0.08 0.09 0.09
# Contra Costa 0.25 0.24 0.2 0.24 0.21 0.18 0.16 0.1 0.14 0.11 0.09 0.11 0.06 0.06 0.06 0.05 0.06 0.06 0.07 0.07 0.07 0.07 0.05 0.07 0.07 0.09
# San Francisco 0.33 0.3 0.27 0.24 0.24 0.22 0.2 0.18 0.12 0.14 0.12 0.09 0.11 0.07 0.08 0.08 0.07 0.1 0.07 0.08 0.09 0.09 0.09 0.11 0.1 0.13
# San Mateo 0.26 0.33 0.27 0.23 0.23 0.22 0.15 0.13 0.13 0.08 0.11 0.07 0.08 0.06 0.06 0.05 0.07 0.08 0.07 0.05 0.07 0.11 0.07 0.09 0.09 0.09
$ Sonoma 0.43 0.36 0.37 0.34 0.32 0.37 0.39 0.24 0.2 0.15 0.25 0.19 0.11 0.1 0.16 0.14 0.1 0.16 0.1 0.08 0.13 0.12 0.08 0.08 0.11 0.13
$ Solano 0.31 0.31 0.27 0.31 0.26 0.27 0.32 0.19 0.13 0.25 0.15 0.14 0.07 0.1 0.1 0.12 0.09 0.07 0.07 0.12 0.1 0.11 0.1 0.08 0.09 0.07
# Marin 0.33 0.25 0.27 0.2 0.16 0.14 0.1 0.06 0.1 0.14 0.05 0.06 0.04 0.04 0.03 0.06 0.03 0.05 0.04 0.04 0.07 0.04 0.04 0.06 0.04 0.09
$ Napa* 0.46 0.34 0.31 0.37 0.28 0.3 0.24 0.27 0.21 0.2 0.15 0.16 0.16 0.12 0.13 0.11 0.15 0.21 0.11 0.08 0.09 0.08 0.11 0.08 0.1 0.13
$ Inland Empire (2,182,231) 0.29 0.27 0.24 0.2 0.22 0.26 0.17 0.21 0.22 0.19 0.18 0.15 0.1 0.1 0.08 0.09 0.09 0.1 0.1 0.11 0.09 0.11 0.1 0.09 0.1 0.11
$ Riverside 0.28 0.27 0.24 0.18 0.22 0.28 0.16 0.2 0.22 0.21 0.19 0.15 0.08 0.09 0.07 0.08 0.08 0.1 0.08 0.1 0.09 0.1 0.09 0.08 0.1 0.1
$ San Bernardino 0.3 0.27 0.24 0.23 0.23 0.25 0.18 0.22 0.21 0.18 0.17 0.16 0.12 0.1 0.09 0.1 0.09 0.1 0.12 0.13 0.09 0.12 0.12 0.1 0.1 0.12
# Central Valley* (2,050,983) 0.38 0.4 0.41 0.35 0.31 0.35 0.24 0.18 0.17 0.13 0.12 0.12 0.12 0.09 0.09 0.09 0.1 0.11 0.09 0.1 0.13 0.13 0.11 0.12 0.12 0.15
# Fresno 0.35 0.37 0.38 0.32 0.27 0.31 0.26 0.19 0.17 0.1 0.09 0.1 0.1 0.08 0.07 0.08 0.09 0.12 0.08 0.07 0.14 0.16 0.11 0.12 0.09 0.12
# Kern 0.47 0.5 0.44 0.44 0.32 0.45 0.24 0.17 0.16 0.15 0.13 0.14 0.15 0.1 0.14 0.13 0.12 0.15 0.14 0.1 0.15 0.12 0.13 0.14 0.18 0.2
# San Joaquin 0.29 0.32 0.31 0.27 0.3 0.26 0.17 0.21 0.2 0.16 0.17 0.09 0.08 0.08 0.09 0.07 0.09 0.09 0.09 0.12 0.13 0.11 0.08 0.09 0.08 0.1
# Stanislaus 0.4 0.45 0.54 0.35 0.41 0.4 0.23 0.16 0.13 0.14 0.14 0.15 0.09 0.08 0.08 0.08 0.15 0.07 0.1 0.11 0.08 0.14 0.09 0.12 0.13 0.17
# Tulare 0.46 0.4 0.37 0.37 0.26 0.27 0.18 0.11 0.13 0.11 0.1 0.12 0.18 0.09 0.06 0.09 0.05 0.08 0.07 0.12 0.14 0.12 0.14 0.15 0.08 0.17
$ Merced 0.33 0.39 0.42 0.38 0.45 0.39 0.43 0.23 0.26 0.09 0.22 0.23 0.25 0.11 0.11 0.15 0.15 0.09 0.06 0.07 0.12 0.08 0.17 0.16 0.14 0.1
# Kings 0.56 0.46 0.59 0.55 0.34 0.49 0.35 0.24 0.24 0.07 0.16 0.14 0.13 0.08 0.09 0.08 0.14 0.23 0.07 0.19 0.12 0.11 0.11 0.13 0.12 0.2
# Madera* 0.23 0.33 0.34 0.32 0.18 0.24 0.3 0.16 0.2 0.11 0.03 0.03 0.03 0.13 0.06 0.06 0.08 0.08 0.09 0.13 0.07 0.12 0.16 0.1 0.08 0.14
# San Diego-Imperial (1,704,537) 0.26 0.24 0.27 0.26 0.22 0.24 0.21 0.18 0.15 0.16 0.12 0.13 0.1 0.1 0.09 0.11 0.09 0.1 0.08 0.12 0.1 0.11 0.12 0.1 0.13 0.12
# San Diego 0.26 0.23 0.26 0.26 0.21 0.23 0.21 0.18 0.15 0.15 0.12 0.13 0.1 0.1 0.09 0.1 0.1 0.1 0.08 0.11 0.1 0.1 0.11 0.09 0.12 0.11
# Imperial 0.34 0.4 0.64 0.24 0.45 0.51 0.22 0.21 0.25 0.26 0.3 0.17 0.22 0.2 0.07 0.22 0.04 0.12 0.1 0.21 0.1 0.17 0.21 0.18 0.26 0.18
# Sacramento Region* (1,133,930) 0.3 0.32 0.3 0.21 0.23 0.24 0.16 0.12 0.1 0.11 0.08 0.09 0.08 0.09 0.09 0.09 0.07 0.07 0.07 0.09 0.11 0.11 0.1 0.1 0.12 0.16
# Sacramento* 0.3 0.31 0.26 0.2 0.23 0.24 0.14 0.11 0.1 0.13 0.08 0.1 0.07 0.09 0.08 0.09 0.07 0.08 0.07 0.1 0.12 0.11 0.11 0.11 0.12 0.16
# Placer* 0.32 0.31 0.34 0.2 0.22 0.25 0.16 0.11 0.09 0.13 0.09 0.07 0.08 0.08 0.1 0.07 0.06 0.07 0.07 0.08 0.08 0.11 0.07 0.09 0.14 0.17
# Yolo 0.34 0.3 0.49 0.23 0.32 0.26 0.27 0.17 0.16 0.11 0.12 0.11 0.11 0.13 0.07 0.1 0.1 0.09 0.09 0.1 0.1 0.09 0.09 0.11 0.15 0.26
# El Dorado 0.29 0.28 0.31 0.21 0.2 0.19 0.15 0.16 0.08 0.08 0.08 0.09 0.04 0.11 0.11 0.08 0.07 0.08 0.11 0.09 0.08 0.11 0.06 0.05 0.09 0.12
# Nevada 0.3 0.48 0.45 0.33 0.3 0.25 0.15 0.12 0.04 0.06 0.07 0.09 0.18 0.06 0.16 0.13 0.05 0.05 0.03 0.08 0.1 0.12 0.13 0.15 0.13 0.16
# Northern California (562,079) 0.31 0.33 0.35 0.34 0.27 0.31 0.33 0.17 0.14 0.16 0.11 0.14 0.14 0.11 0.13 0.13 0.14 0.11 0.1 0.09 0.12 0.17 0.19 0.14 0.18 0.13
# Butte 0.23 0.34 0.27 0.3 0.21 0.32 0.34 0.19 0.16 0.18 0.12 0.11 0.14 0.05 0.1 0.1 0.17 0.1 0.08 0.07 0.09 0.12 0.23 0.16 0.18 0.11
# Shasta 0.28 0.2 0.33 0.32 0.28 0.25 0.34 0.15 0.1 0.13 0.1 0.1 0.11 0.09 0.1 0.06 0.1 0.06 0.06 0.08 0.08 0.09 0.11 0.09 0.2 0.13
# Del Norte-Humboldt 0.32 0.51 0.46 0.37 0.18 0.39 0.3 0.15 0.12 0.09 0.12 0.14 0.06 0.12 0.12 0.22 0.14 0.11 0.13 0.07 0.18 0.24 0.21 0.09 0.26 0.18
$ Colusa-Glenn-Tehama 0.35 0.23 0.47 0.28 0.35 0.37 0.25 0.17 0.15 0.22 0.15 0.16 0.14 0.11 0.13 0.13 0.18 0.09 0.11 0.1 0.1 0.23 0.2 0.18 0.05 0.08
$ Sutter 0.24 0.33 0.32 0.39 0.23 0.2 0.18 0.14 0.14 0.16 0.02 0.11 0.21 0.16 0.3 0.1 0.04 0.16 0.11 0.07 0.11 0.16 0.08 0.14 0.11 0.13
# Mendocino 0.5 0.42 0.39 0.38 0.4 0.28 0.54 0.17 0.1 0.03 0.14 0.07 0.11 0.21 0.14 0.16 0.12 0.14 0.11 0.15 0.13 0.15 0.45 0.18 0.1 0.13
$ Sierra-Yuba 0.34 0.29 0.2 0.45 0.39 0.26 0.21 0.21 0.19 0.29 0.16 0.24 0.19 0.25 0.04 0.03 0.04 0.24 0.19 0.12 0.22 0.14 0.15 0.16 0.12 0.18
$ Lassen-Modoc-Plumas 0.35 0.41 0.6 0.43 0.48 0.37 0.35 0.13 0.22 0.35 0.25 0.23 0.14 0.25 0.25 0.36 0.17 0.1 0.18 0.09 0.15 0.34 0.17 0.13 0.28 0.09
$ Lake 0.54 0.41 0.33 0.33 0.24 0.32 0.31 0.19 0.2 0.16 0.09 0.25 0.27 0.17 0.15 0.19 0.26 0.2 0.09 0.1 0.14 0.3 0.25 0.17 0.19 0.11
# Siskiyou-Trinity 0.24 0.29 0.24 0.47 0.3 0.36 0.39 0.25 0.14 0.19 0.05 0.13 0.14 0.17 0.15 0.22 0.12 0.21 0.09 0.14 0.16 0.15 0.08 0.16 0.29 0.27
$ Central Coast (524,095) 0.33 0.31 0.33 0.27 0.27 0.36 0.19 0.17 0.14 0.14 0.15 0.12 0.1 0.09 0.08 0.07 0.07 0.07 0.07 0.09 0.08 0.08 0.1 0.07 0.07 0.12
$ Monterey* 0.38 0.36 0.36 0.29 0.28 0.37 0.27 0.21 0.2 0.16 0.18 0.17 0.1 0.13 0.1 0.05 0.1 0.09 0.11 0.08 0.07 0.08 0.1 0.07 0.05 0.09
# San Luis Obispo* 0.22 0.23 0.27 0.28 0.31 0.39 0.12 0.14 0.04 0.11 0.12 0.09 0.09 0.1 0.06 0.07 0.03 0.06 0.05 0.13 0.14 0.14 0.12 0.12 0.1 0.18
$ Santa Cruz 0.38 0.33 0.34 0.22 0.21 0.27 0.17 0.13 0.16 0.14 0.12 0.09 0.1 0.03 0.07 0.07 0.09 0.04 0.02 0.05 0.04 0.03 0.08 0.04 0.07 0.08
$ San Benito 0.35 0.35 0.27 0.48 0.3 0.14 0.17 0.38 0.13 0.11 0.09 0.06 0.13 0.15 0.03 0.12 0.08 0.09 0.02 0.05 0.09 0.13 0.1
# High Sierra (96,201) 0.28 0.36 0.36 0.38 0.3 0.34 0.25 0.14 0.13 0.06 0.15 0.11 0.12 0.08 0.07 0.11 0.09 0.11 0.11 0.07 0.14 0.11 0.11 0.12 0.1 0.14
# Alpine-Amador-Calaveras 0.26 0.38 0.25 0.28 0.21 0.2 0.21 0.1 0.04 0.03 0.07 0.11 0.08 0.08 0.07 0.13 0.08 0.1 0.11 0.07 0.12 0.09 0.05 0.17 0.1 0.09
# Mariposa-Tuolumne 0.34 0.39 0.46 0.46 0.39 0.53 0.26 0.16 0.2 0.05 0.22 0.13 0.13 0.08 0.04 0.06 0.07 0.1 0.09 0.05 0.19 0.13 0.15 0.07 0.13 0.18
$ Inyo-Mono 0.45 0.37 0.24 0.29 0.2 0.27 0.24 0.1 0.21 0.26 0.21 0.16 0.07 0.09 0.21 0.08 0.04 0.2
# California* (19,064,196) 0.31 0.31 0.29 0.25 0.23 0.25 0.2 0.16 0.15 0.15 0.14 0.13 0.11 0.09 0.09 0.09 0.08 0.1 0.08 0.11 0.12 0.13 0.13 0.12 0.13 0.15
1999 15 Year Trend Period 2013
Percent of Cancer Cases Diagnosed at Advanced Stage
Not calculated (<15 cases) 00.0 – 07.5 07.6 – 09.3 09.4 – 11.0 11.1 – 13.2 13.3 – 16.5 16.6 – 22.4 22.5 – 30.0 30.1 – 64.1
Male Population Size~
16,800 – 49,999 50,000 – 249,999 250,000 – 499,999 500,000 – 1,700,000 4,942,216
15-year Trends (1999 – 2013)
� decreasing trend � increasing trend
* statistically significant trend (p<0.05)
~ Number of people in 2013 estimated by National Center for Health Statistics (NCHS); Number in parentheses represents the male population size in the region/state. a Advanced Stage includes summary stage values of remote and unknown.
1988 1999 15 Year Trend Period 2013

Heat Maps: Trends in Late Stage Diagnoses of Screenable Cancers in California Counties, 1988 – 2013 • 19
Figure 4b. Percent of Prostate Cancer Cases Diagnosed at an Advanced Stagea by California region (1988-2013)
Percent of Cancer Cases Diagnosed at Advanced Stage
Not calculated (<15 cases) 00.0 – 07.5 07.6 – 09.3 09.4 – 11.0 11.1 – 13.2 13.3 – 16.5 16.6 – 22.4 22.5 – 30.0 30.1 – 64.1
15-year Trends (1999 – 2013)
� decreasing trend � increasing trend
* statistically significant trend (p<0.05)
1988# Los Angeles-Orange* 0.31 0.32 0.28 0.23 0.2 0.23 0.2 0.15 0.14 0.16 0.16 0.15 0.12 0.1 0.09 0.1 0.08 0.1 0.09 0.13 0.17 0.18 0.19 0.17 0.17 0.2
$ Bay Area 0.31 0.29 0.27 0.25 0.24 0.22 0.19 0.15 0.14 0.13 0.12 0.1 0.09 0.07 0.07 0.08 0.07 0.09 0.07 0.07 0.08 0.08 0.07 0.07 0.08 0.1
$ Inland Empire 0.29 0.27 0.24 0.2 0.22 0.26 0.17 0.21 0.22 0.19 0.18 0.15 0.1 0.1 0.08 0.09 0.09 0.1 0.1 0.11 0.09 0.11 0.1 0.09 0.1 0.11
# Central Valley* 0.38 0.4 0.41 0.35 0.31 0.35 0.24 0.18 0.17 0.13 0.12 0.12 0.12 0.09 0.09 0.09 0.1 0.11 0.09 0.1 0.13 0.13 0.11 0.12 0.12 0.15
# San Diego-Imperial 0.26 0.24 0.27 0.26 0.22 0.24 0.21 0.18 0.15 0.16 0.12 0.13 0.1 0.1 0.09 0.11 0.09 0.1 0.08 0.12 0.1 0.11 0.12 0.1 0.13 0.12
# Sacramento Region* 0.3 0.32 0.3 0.21 0.23 0.24 0.16 0.12 0.1 0.11 0.08 0.09 0.08 0.09 0.09 0.09 0.07 0.07 0.07 0.09 0.11 0.11 0.1 0.1 0.12 0.16
# Northern California 0.31 0.33 0.35 0.34 0.27 0.31 0.33 0.17 0.14 0.16 0.11 0.14 0.14 0.11 0.13 0.13 0.14 0.11 0.1 0.09 0.12 0.17 0.19 0.14 0.18 0.13
$ Central Coast 0.33 0.31 0.33 0.27 0.27 0.36 0.19 0.17 0.14 0.14 0.15 0.12 0.1 0.09 0.08 0.07 0.07 0.07 0.07 0.09 0.08 0.08 0.1 0.07 0.07 0.12
# High Sierra 0.28 0.36 0.36 0.38 0.3 0.34 0.25 0.14 0.13 0.06 0.15 0.11 0.12 0.08 0.07 0.11 0.09 0.11 0.11 0.07 0.14 0.11 0.11 0.12 0.1 0.14
# California* 0.31 0.31 0.29 0.25 0.23 0.25 0.2 0.16 0.15 0.15 0.14 0.13 0.11 0.09 0.09 0.09 0.08 0.1 0.08 0.11 0.12 0.13 0.13 0.12 0.13 0.15
1999 15 Year Trend Period 2013
a Advanced Stage includes summary stage values of remote and unknown.
1988 1999 15 Year Trend Period 2013

20 • Heat Maps: Trends in Late Stage Diagnoses of Screenable Cancers in California Counties, 1988 – 2013
Melanoma
Melanoma is the most serious and aggressive type of skin cancer. It accounts for fewer than 2% of skin cancer cases but the vast majority of skin cancer deaths.5 The incidence of the disease has sharply
increased since the early 1990s, but the mortality rates have been decreasing since 2008. In 1991 the age-adjusted incidence rate (per 100,000) was 13.68, and in 2013 it was 21.92.3 Since 2008, mortality rates have decreased by 7.5% per year in individuals younger than 50 and by 0.5% per year among those 50 and older.5 The five year survival rate is 98% for localized melanoma (84% of cases), 63% for regional stage disease, and 16% for distant stage disease.5 Although melanoma is highly curable when detected early, it is more likely than other skin cancers to spread to other parts of the body. In 2013, there were 8,683 new cases of melanoma diagnosed in California and 914 deaths.3
Risk factors for melanoma include a personal or family history of melanoma, presence of atypical, large, or numerous (more than 50) moles, a fair complexion, history of many blistering sunburns (especially as a child or teenager), and having a weakened or suppressed immune system.5,12 The best way to detect melanoma early is to recognize new or changing skin growths, especially those that look different from other moles. Melanomas often start as small, mole-like growths that increase in size and change color. They are marked by asymmetry, irregular borders, non-uniform pigmentation, and diameters greater than 6 millimeters.5 All major areas of the skin should be examined regularly, and any new, unusual, or progressive lesions promptly evaluated by a clinician.
Although the incidence rates for melanoma have been steadily increasing since 1988, the percentage of cases diagnosed at an advanced stage in California has declined from 13.9%-17.5% in 1988, to 8.9%-10% in 2013. (Figures 5a and 5b). In recent years, the state percentage has remained constant at 8.9%-10%. The San Francisco Bay Area and Central Coast have seen significant decreases in the percentage of cases diagnosed late in the most recent fifteen years, while the Sacramento and High Sierra regions and Los Angeles County have seen significant increases. Several counties have had persistently high percentages of late stage diagnoses over the years including Riverside, San Bernardino, Fresno, Kern, Tulare, Merced, Madera, Kings, Imperial, Mendocino, Lake, and Mariposa-Tuolumne (Figure 5a).

Heat Maps: Trends in Late Stage Diagnoses of Screenable Cancers in California Counties, 1988 – 2013 • 21
Figure 5a. Percent of Melanoma Cases Diagnosed at an Advanced Stagea by California region and county (1988-2013)
1988# Los Angeles-Orange (14,406,748) 0.14 0.13 0.12 0.13 0.12 0.13 0.12 0.09 0.08 0.09 0.08 0.09 0.09 0.11 0.1 0.1 0.1 0.1 0.1 0.09 0.09 0.1 0.12 0.11 0.09 0.1
# Los Angeles* 0.13 0.1 0.1 0.12 0.1 0.11 0.12 0.1 0.08 0.08 0.07 0.08 0.09 0.1 0.1 0.12 0.1 0.11 0.11 0.09 0.11 0.11 0.14 0.12 0.12 0.13
$ Orange 0.15 0.18 0.18 0.17 0.15 0.18 0.13 0.08 0.09 0.1 0.1 0.1 0.09 0.12 0.1 0.08 0.1 0.08 0.09 0.11 0.09 0.09 0.12 0.12 0.07 0.09
$ Ventura 0.22 0.25 0.14 0.16 0.28 0.21 0.1 0.05 0.07 0.11 0.09 0.06 0.1 0.11 0.08 0.06 0.09 0.12 0.1 0.05 0.05 0.09 0.07 0.09 0.05 0.08
$ Santa Barbara 0.11 0.14 0.14 0.09 0.19 0.14 0.05 0.02 0.05 0.07 0.09 0.13 0.04 0.09 0.07 0.09 0.09 0.05 0.05 0.04 0.04 0.07 0.04 0.07 0.06 0.05
$ Bay Area* (7,438,456) 0.12 0.11 0.13 0.12 0.13 0.12 0.1 0.1 0.08 0.08 0.11 0.09 0.08 0.09 0.09 0.1 0.1 0.09 0.08 0.09 0.08 0.07 0.07 0.07 0.07 0.06
$ Santa Clara 0.13 0.14 0.13 0.13 0.09 0.08 0.09 0.1 0.1 0.05 0.11 0.09 0.05 0.08 0.07 0.08 0.1 0.08 0.09 0.08 0.06 0.08 0.09 0.08 0.07 0.06
$ Alameda 0.11 0.05 0.11 0.12 0.19 0.12 0.07 0.08 0.1 0.11 0.11 0.08 0.12 0.12 0.08 0.13 0.08 0.14 0.11 0.09 0.09 0.1 0.08 0.09 0.08 0.08
$ Contra Costa* 0.13 0.13 0.11 0.11 0.17 0.14 0.11 0.1 0.06 0.09 0.1 0.08 0.09 0.09 0.1 0.08 0.1 0.09 0.08 0.08 0.07 0.07 0.05 0.07 0.07 0.05
$ San Francisco* 0.16 0.11 0.12 0.14 0.17 0.13 0.15 0.19 0.11 0.12 0.18 0.14 0.14 0.13 0.16 0.14 0.15 0.08 0.07 0.12 0.09 0.08 0.06 0.07 0.06 0.06
# San Mateo 0.06 0.13 0.13 0.17 0.12 0.16 0.07 0.05 0.08 0.07 0.05 0.06 0.04 0.08 0.06 0.08 0.09 0.11 0.05 0.07 0.08 0.08 0.07 0.06 0.08 0.08
$ Sonoma* 0.3 0.15 0.17 0.1 0.11 0.18 0.22 0.13 0.09 0.09 0.08 0.11 0.07 0.09 0.08 0.09 0.13 0.06 0.09 0.12 0.1 0.07 0.08 0.07 0.08 0.03
$ Solano 0.08 0.05 0.19 0.09 0.04 0.12 0.1 0.04 0.05 0.04 0.17 0.15 0.05 0.13 0.13 0.12 0.1 0.08 0.06 0.09 0.08 0.06 0.08 0.1 0.18 0.1
$ Marin* 0.1 0.07 0.03 0.03 0.08 0.05 0.06 0.04 0.07 0.09 0.14 0.09 0.04 0.06 0.09 0.1 0.04 0.08 0.07 0.08 0.07 0.05 0.05 0.04 0.03 0.04
$ Napa* 0.33 0.24 0.13 0.14 0.18 0.17 0 0.07 0.13 0.12 0.11 0.08 0.16 0.21 0.15 0.13 0.06 0.07 0.06 0.08 0.11 0.03 0.1 0.04
# Inland Empire (4,380,878) 0.17 0.19 0.15 0.15 0.18 0.2 0.13 0.12 0.12 0.09 0.14 0.12 0.11 0.12 0.11 0.14 0.11 0.12 0.11 0.12 0.11 0.14 0.15 0.14 0.12 0.11
# Riverside 0.18 0.16 0.18 0.18 0.19 0.25 0.14 0.11 0.13 0.09 0.14 0.13 0.11 0.1 0.09 0.12 0.11 0.11 0.1 0.13 0.12 0.14 0.13 0.14 0.11 0.1
# San Bernardino 0.16 0.23 0.12 0.12 0.16 0.15 0.11 0.12 0.12 0.09 0.15 0.12 0.12 0.14 0.14 0.16 0.13 0.13 0.12 0.11 0.11 0.15 0.17 0.14 0.12 0.13
# Central Valley (4,069,986) 0.23 0.19 0.22 0.23 0.17 0.22 0.14 0.11 0.1 0.1 0.12 0.1 0.11 0.1 0.1 0.13 0.13 0.13 0.12 0.11 0.13 0.13 0.12 0.12 0.14 0.09
# Fresno 0.25 0.17 0.2 0.16 0.17 0.2 0.15 0.08 0.09 0.12 0.08 0.08 0.1 0.09 0.05 0.09 0.11 0.17 0.1 0.1 0.12 0.13 0.15 0.09 0.13 0.07
# Kern 0.24 0.14 0.17 0.24 0.17 0.2 0.1 0.12 0.14 0.09 0.19 0.07 0.14 0.13 0.12 0.21 0.19 0.15 0.09 0.1 0.12 0.15 0.12 0.13 0.18 0.14
$ San Joaquin 0.03 0.06 0.16 0.11 0.19 0.16 0.06 0.06 0.09 0.1 0.08 0.1 0.05 0.13 0.18 0.13 0.14 0.1 0.21 0.11 0.11 0.07 0.16 0.09 0.1 0.09
# Stanislaus 0.33 0.23 0.3 0.39 0.14 0.24 0.15 0.15 0.08 0.06 0.07 0.11 0.12 0.06 0.05 0.09 0.07 0.09 0.09 0.09 0.12 0.11 0.11 0.13 0.18 0.06
# Tulare 0.19 0.29 0.22 0.11 0.14 0.32 0.14 0.08 0.1 0.15 0.11 0.12 0.07 0.12 0.11 0.17 0.1 0.09 0.2 0.16 0.16 0.16 0.11 0.15 0.1 0.11
# Merced 0.4 0.41 0.24 0.17 0.52 0.14 0.21 0.07 0.13 0.22 0.16 0.12 0.14 0.14 0.11 0.32 0.2 0.14 0.21 0.09 0.26 0.09 0.15 0.17 0.15
$ Madera 0.2 0.25 0.18 0.12 0.24 0 0.11 0.11 0.17 0.14 0.15 0.04 0.16 0.05 0.11 0.13 0.12 0.17 0.15 0.1 0.09 0.13 0.16 0.04
$ Kings 0.33 0.13 0.27 0.19 0.15 0.11 0.13 0.19 0.13 0.21 0.09 0.19 0.13 0.11 0.08 0.13 0.06
$ San Diego-Imperial (3,387,836) 0.17 0.12 0.14 0.21 0.11 0.12 0.14 0.09 0.07 0.1 0.08 0.11 0.07 0.08 0.07 0.09 0.08 0.06 0.07 0.08 0.07 0.09 0.08 0.09 0.09 0.08
$ San Diego 0.17 0.12 0.14 0.21 0.11 0.13 0.14 0.09 0.07 0.1 0.08 0.11 0.07 0.07 0.07 0.09 0.08 0.06 0.07 0.08 0.07 0.09 0.08 0.08 0.09 0.08
$ Imperial* 0.25 0.47 0.24 0.29 0.08 0.18 0.21 0.15 0.19 0.11
# Sacramento Region* (2,313,970) 0.11 0.09 0.1 0.07 0.08 0.06 0.06 0.03 0.06 0.05 0.06 0.05 0.08 0.08 0.08 0.07 0.1 0.07 0.08 0.1 0.07 0.08 0.09 0.08 0.11 0.1
# Sacramento* 0.12 0.08 0.11 0.06 0.07 0.05 0.06 0.04 0.05 0.04 0.07 0.03 0.07 0.08 0.08 0.07 0.1 0.06 0.09 0.08 0.07 0.09 0.09 0.07 0.12 0.12
$ Placer 0.18 0.1 0.07 0.09 0.14 0.09 0.11 0.03 0.06 0.07 0.01 0.08 0.1 0.08 0.07 0.09 0.13 0.08 0.09 0.08 0.08 0.06 0.1 0.08 0.11 0.05
# Yolo* 0.08 0.11 0.07 0.07 0.03 0.03 0.03 0 0.04 0.02 0.02 0.02 0.07 0.1 0.04 0.02 0.09 0.07 0.07 0.05 0.06 0.06 0.09 0.07 0.1 0.17
# El Dorado 0.03 0.08 0.14 0.07 0.09 0.07 0.03 0.03 0.07 0.06 0.03 0.1 0.06 0.05 0.09 0.06 0.1 0.05 0.07 0.21 0.09 0.08 0.04 0.07 0.08 0.1
$ Nevada 0.12 0.12 0.05 0.19 0.1 0.11 0.19 0 0.08 0.06 0.14 0.06 0.11 0.15 0.16 0.12 0.08 0.07 0.04 0.17 0.05 0.05 0.15 0.13 0.09 0.07
$ Northern California (1,115,996) 0.27 0.24 0.17 0.22 0.11 0.23 0.16 0.22 0.09 0.05 0.11 0.11 0.11 0.1 0.11 0.18 0.16 0.11 0.11 0.1 0.1 0.08 0.11 0.11 0.08 0.11
$ Butte 0.29 0.42 0.27 0.27 0.03 0.16 0.14 0.34 0.09 0.05 0.08 0.03 0.05 0.15 0.14 0.17 0.23 0.03 0.17 0.12 0.11 0.1 0.13 0.12 0.07 0.08
$ Shasta 0.13 0.33 0.25 0.32 0.17 0.22 0.12 0 0.18 0.16 0.11 0.06 0.11 0.2 0.08 0.11 0.11 0.09 0.07 0.08 0.1 0.09 0.05 0.09
$ Del Norte-Humboldt 0.26 0.16 0.28 0.09 0.07 0.1 0.32 0.11 0.07 0.05 0.05 0.09 0.18 0.14 0.1 0.27 0.19 0.1 0.08 0.07 0.1 0.12 0.13 0.11 0.05 0.09
$ Colusa-Glenn-Tehama 0.19 0.15 0.33 0.08 0.31 0.05 0 0.07 0.08 0.13 0.13 0.1 0.21 0.06 0.05 0.12 0.1 0.11 0.02 0.08 0.15 0.07 0.15
# Sutter 0.13 0.12 0.05 0.08 0.13 0.04 0 0 0.08 0.05 0.21 0.07 0.13 0.17 0.16 0 0.1 0.03 0.07 0.15
$ Mendocino 0.17 0.04 0.14 0.21 0.16 0.05 0.15 0.18 0.09 0.14 0.1 0.15 0.1 0.1 0.11 0.19 0.18 0.15
$ Sierra-Yuba 0.05 0.06 0.12 0.26 0.09 0.05 0.13 0.15 0 0.07 0.14
# Lake 0.05 0.11 0.15 0.1 0.11 0.13 0.13 0.29 0.05 0.07 0.3 0.08 0.07 0.21 0.17 0.18
$ Lassen-Modoc-Plumas 0.2 0.19 0.33 0.35 0.29 0.06 0.06 0.17 0.14 0.07 0.18
$ Siskiyou-Trinity 0.19 0 0.09 0 0.16 0.17 0 0.07 0.1 0.07 0.06 0.09 0.03 0.08 0.08
$ Central Coast* (1,032,288) 0.1 0.1 0.17 0.15 0.15 0.13 0.12 0.1 0.13 0.07 0.06 0.08 0.09 0.08 0.09 0.09 0.11 0.06 0.07 0.06 0.06 0.05 0.06 0.06 0.07 0.06
$ Monterey 0.17 0.06 0.18 0.1 0.15 0.16 0.13 0.06 0.14 0.06 0.06 0.11 0.09 0.06 0.12 0.12 0.2 0.09 0.08 0.08 0.11 0.02 0.05 0.08 0.07 0.05
$ San Luis Obispo 0.13 0.13 0.28 0.38 0.27 0.07 0.15 0.19 0.05 0.08 0.04 0.07 0.04 0.17 0.07 0.06 0.05 0.04 0.06 0.03 0.05 0.05 0.06 0.04 0.08 0.06
$ Santa Cruz 0.06 0.11 0.1 0.05 0.07 0.07 0.11 0.08 0.18 0.09 0.09 0.06 0.09 0.03 0.12 0.11 0.17 0.07 0.09 0.1 0.06 0.08 0.06 0.06 0.06 0.06
$ San Benito 0.18 0.05 0 0.11 0.06 0.11
# High Sierra* (186,363) 0.17 0.28 0.25 0.19 0.23 0.17 0.13 0.12 0.07 0.12 0.06 0.08 0.12 0.06 0.13 0.17 0.08 0.13 0.11 0.18 0.19 0.12 0.15 0.15 0.23 0.13
$ Alpine-Amador-Calaveras 0.19 0.19 0.06 0.1 0.05 0.04 0.07 0.1 0.08 0.09 0.23 0 0.11 0.16 0 0.07 0.03 0.17 0.02 0.09 0.12 0.07 0.21 0.04
$ Mariposa-Tuolumne* 0.42 0.35 0.39 0.2 0.08 0.15 0.03 0.07 0.05 0.06 0.18 0.18 0.14 0.2 0.16 0.22 0.33 0.13 0.22 0.23 0.24 0.2
Inyo-Mono 0.12
# California (38,332,521) 0.14 0.13 0.14 0.14 0.13 0.14 0.12 0.09 0.08 0.08 0.09 0.09 0.09 0.1 0.09 0.11 0.1 0.09 0.09 0.09 0.09 0.09 0.1 0.1 0.09 0.09
1999 15 Year Trend Period 2013
Percent of Cancer Cases Diagnosed at Advanced Stage
Not calculated (<15 cases) 00.0 – 05.7 05.8 – 07.5 07.6 – 08.8 08.9 – 10.0 10.1 – 11.7 11.8 – 13.8 13.9 – 17.5 17.6 – 52.2
Population Size~
32,541 – 99,999 100,000 – 499,999 500,000 – 999,999 1,000,000 – 3,300,000 10,017,068
15-year Trends (1999 – 2013)
� decreasing trend � increasing trend
* statistically significant trend (p<0.05)
~ Number of people in 2013 estimated by National Center for Health Statistics (NCHS); Number in parentheses represents the population size in the region/state. a Advanced Stage includes summary stage values of regional, remote, and unknown.
1988 1999 15 Year Trend Period 2013

22 • Heat Maps: Trends in Late Stage Diagnoses of Screenable Cancers in California Counties, 1988 – 2013
Figure 5b. Percent of Melanoma Cases Diagnosed at an Advanced Stagea by California region (1988-2013)
1988# Los Angeles-Orange 0.14 0.13 0.12 0.13 0.12 0.13 0.12 0.09 0.08 0.09 0.08 0.09 0.09 0.11 0.1 0.1 0.1 0.1 0.1 0.09 0.09 0.1 0.12 0.11 0.09 0.1
$ Bay Area* 0.12 0.11 0.13 0.12 0.13 0.12 0.1 0.1 0.08 0.08 0.11 0.09 0.08 0.09 0.09 0.1 0.1 0.09 0.08 0.09 0.08 0.07 0.07 0.07 0.07 0.06
# Inland Empire 0.17 0.19 0.15 0.15 0.18 0.2 0.13 0.12 0.12 0.09 0.14 0.12 0.11 0.12 0.11 0.14 0.11 0.12 0.11 0.12 0.11 0.14 0.15 0.14 0.12 0.11
# Central Valley 0.23 0.19 0.22 0.23 0.17 0.22 0.14 0.11 0.1 0.1 0.12 0.1 0.11 0.1 0.1 0.13 0.13 0.13 0.12 0.11 0.13 0.13 0.12 0.12 0.14 0.09
$ San Diego-Imperial 0.17 0.12 0.14 0.21 0.11 0.12 0.14 0.09 0.07 0.1 0.08 0.11 0.07 0.08 0.07 0.09 0.08 0.06 0.07 0.08 0.07 0.09 0.08 0.09 0.09 0.08
# Sacramento Region* 0.11 0.09 0.1 0.07 0.08 0.06 0.06 0.03 0.06 0.05 0.06 0.05 0.08 0.08 0.08 0.07 0.1 0.07 0.08 0.1 0.07 0.08 0.09 0.08 0.11 0.1
$ Northern California 0.27 0.24 0.17 0.22 0.11 0.23 0.16 0.22 0.09 0.05 0.11 0.11 0.11 0.1 0.11 0.18 0.16 0.11 0.11 0.1 0.1 0.08 0.11 0.11 0.08 0.11
$ Central Coast* 0.1 0.1 0.17 0.15 0.15 0.13 0.12 0.1 0.13 0.07 0.06 0.08 0.09 0.08 0.09 0.09 0.11 0.06 0.07 0.06 0.06 0.05 0.06 0.06 0.07 0.06
# High Sierra* 0.17 0.28 0.25 0.19 0.23 0.17 0.13 0.12 0.07 0.12 0.06 0.08 0.12 0.06 0.13 0.17 0.08 0.13 0.11 0.18 0.19 0.12 0.15 0.15 0.23 0.13
# California 0.14 0.13 0.14 0.14 0.13 0.14 0.12 0.09 0.08 0.08 0.09 0.09 0.09 0.1 0.09 0.11 0.1 0.09 0.09 0.09 0.09 0.09 0.1 0.1 0.09 0.09
1999 15 Year Trend Period 2013
Percent of Cancer Cases Diagnosed at Advanced Stage
Not calculated (<15 cases) 00.0 – 05.7 05.8 – 07.5 07.6 – 08.8 08.9 – 10.0 10.1 – 11.7 11.8 – 13.8 13.9 – 17.5 17.6 – 52.2
15-year Trends (1999 – 2013)
� decreasing trend � increasing trend
* statistically significant trend (p<0.05)
a Advanced Stage includes summary stage values of regional, remote, and unknown.
1988 1999 15 Year Trend Period 2013

Heat Maps: Trends in Late Stage Diagnoses of Screenable Cancers in California Counties, 1988 – 2013 • 23
Cancer of the oral cavity and pharynx (oropharyngeal cancer)
The oral cavity includes the lip, tongue, floor of the mouth, gingiva, buccal surface (mucosa), hard palate, and oropharynx. Although these sites are accessible for self-inspection and during medical and dental
exams, cancer is often confused with common benign lesions. As a result, the majority of oropharyngeal cancers (64%) are not diagnosed early, but instead at regional (45%) and remote (19%) stages.9 The five year survival rate is 84% when diagnosed at a localized stage, 63% at a regional stage, and 38% at a distant stage.5 The age-adjusted incidence and mortality rates have both decreased slightly since 1988 (incidence: 12.34 per 100,000 in 1988, decreasing to 10.29 in 2013; mortality: 3.68 per 100,000 in 1988, decreasing to 2.86 in 2013).3 In 2013, there were 4,208 cases of oropharyngeal cancer diagnosed in California and 950 deaths.3
Primary risk factors for cancers of the oral cavity and pharynx include tobacco use, frequent alcohol consumption, and infection with human papillomavirus (HPV).13,14 Although there have been advances in surgical treatment, these cancers remain a challenge because of the functional and esthetic problems that may result from treatment.14
Since 1990, the percentage of oropharyngeal cancer cases diagnosed at an advanced stage has increased throughout the state; in 2013 it was 65.7%-68.4%. (Figures 6a and 6b). In the most recent fifteen years, the Los Angeles-Orange, San Francisco Bay Area, Central Valley, San Diego-Imperial, and Sacramento regions had significantly increasing trends of advanced stage diagnoses (Figure 6b). No California regions or counties exhibited significantly decreasing trends.
Many counties had consistently high percentages of advanced stage diagnoses (61.4%-85%) in recent years, including Los Angeles, San Francisco, Riverside, San Bernardino, Fresno, Kern, Stanislaus, Kings, Imperial, Yolo, Butte, Shasta, Siskiyo-Trinity, Monterey, Alpine-Amador-Calaveras, and Mariposa-Tuolumne (Figure 6a). Counties that have remained relatively stable with lower percentages of advanced stage diagnoses include Sonoma, Napa, and San Luis Obispo.

24 • Heat Maps: Trends in Late Stage Diagnoses of Screenable Cancers in California Counties, 1988 – 2013
Figure 6a. Percent of Oropharyngeal Cancer Cases Diagnosed at an Advanced Stagea by California region and county (1990-2013b)
15 Year Trend Period 90-92 99-02 11-13# Los Angeles-Orange* (14,406,748) 0.61 0.61 0.61 0.6 0.64 0.65 0.67 0.66
# Los Angeles* 0.64 0.63 0.63 0.62 0.65 0.66 0.67 0.68
# Orange 0.53 0.57 0.57 0.59 0.62 0.65 0.67 0.64
# Ventura 0.65 0.56 0.62 0.54 0.62 0.64 0.69 0.6
# Santa Barbara 0.49 0.54 0.47 0.57 0.59 0.63 0.59 0.64
# Bay Area* (7,438,456) 0.59 0.58 0.6 0.6 0.61 0.62 0.63 0.64
$ Santa Clara 0.61 0.59 0.56 0.63 0.67 0.57 0.63 0.63
# Alameda 0.62 0.62 0.64 0.62 0.6 0.61 0.64 0.66
# Contra Costa 0.57 0.54 0.59 0.55 0.61 0.72 0.64 0.64
# San Francisco 0.65 0.61 0.67 0.71 0.69 0.67 0.68 0.72
# San Mateo 0.49 0.58 0.62 0.49 0.51 0.66 0.59 0.59
# Sonoma 0.48 0.52 0.57 0.47 0.6 0.6 0.59 0.58
# Solano 0.59 0.53 0.54 0.64 0.58 0.55 0.67 0.69
# Marin 0.59 0.52 0.51 0.54 0.54 0.56 0.65 0.61
# Napa 0.6 0.49 0.46 0.61 0.48 0.48 0.58 0.58
# Inland Empire (4,380,878) 0.6 0.62 0.63 0.6 0.64 0.69 0.66 0.67
# Riverside 0.58 0.62 0.65 0.57 0.65 0.66 0.66 0.68
# San Bernardino 0.61 0.61 0.62 0.62 0.63 0.72 0.67 0.66
# Central Valley* (4,069,986) 0.61 0.6 0.59 0.6 0.65 0.65 0.63 0.65
# Fresno 0.68 0.63 0.56 0.61 0.67 0.68 0.62 0.66
# Kern 0.66 0.6 0.59 0.61 0.65 0.65 0.68 0.64
# San Joaquin 0.61 0.64 0.63 0.58 0.61 0.63 0.57 0.64
# Stanislaus 0.52 0.54 0.62 0.62 0.55 0.66 0.62 0.66
# Tulare 0.55 0.55 0.52 0.59 0.72 0.6 0.56 0.78
# Merced 0.54 0.64 0.55 0.6 0.7 0.69 0.7 0.61
# Madera 0.58 0.52 0.58 0.5 0.67 0.64 0.54 0.59
$ Kings 0.56 0.46 0.7 0.73 0.75 0.73 0.69 0.56
# San Diego-Imperial* (3,387,836) 0.6 0.59 0.59 0.55 0.61 0.61 0.64 0.68
# San Diego* 0.6 0.59 0.59 0.55 0.61 0.6 0.63 0.68
# Imperial 0.63 0.78 0.66 0.73 0.5 0.7 0.75 0.7
# Sacramento Region* (2,313,970) 0.47 0.5 0.51 0.58 0.62 0.62 0.67 0.67
# Sacramento* 0.49 0.52 0.51 0.58 0.62 0.64 0.68 0.69
# Placer 0.57 0.45 0.48 0.46 0.61 0.52 0.65 0.7
$ Yolo 0.33 0.49 0.52 0.75 0.68 0.71 0.76 0.59
# El Dorado 0.5 0.4 0.54 0.61 0.54 0.5 0.64 0.62
# Nevada 0.27 0.55 0.47 0.42 0.67 0.73 0.62 0.51
# Northern California (1,115,996) 0.62 0.6 0.57 0.57 0.62 0.66 0.68 0.62
# Butte 0.58 0.66 0.6 0.62 0.63 0.69 0.67 0.7
$ Shasta 0.69 0.61 0.64 0.66 0.62 0.68 0.7 0.57
# Del Norte-Humboldt 0.64 0.33 0.52 0.57 0.64 0.61 0.55 0.63
# Colusa-Glenn-Tehama 0.58 0.5 0.49 0.47 0.56 0.63 0.66 0.58
# Sutter 0.54 0.55 0.58 0.38 0.67 0.69 0.63 0.56
$ Mendocino 0.79 0.75 0.53 0.53 0.67 0.6 0.73 0.5
# Sierra-Yuba 0.62 0.82 0.42 0.64 0.53 0.71 0.8 0.68
# Lake 0.62 0.56 0.68 0.57 0.58 0.56 0.63 0.71
Lassen-Modoc-Plumas 0.63 0.73 0.73
# Siskiyou-Trinity 0.52 0.65 0.41 0.42 0.7 0.65 0.85 0.67
# Central Coast (1,032,288) 0.57 0.59 0.6 0.58 0.6 0.63 0.6 0.62
# Monterey 0.56 0.6 0.7 0.58 0.67 0.71 0.63 0.68
$ San Luis Obispo 0.58 0.58 0.48 0.61 0.5 0.59 0.56 0.56
# Santa Cruz 0.57 0.6 0.64 0.55 0.62 0.57 0.61 0.62
San Benito 0.59 0.6 0.68
# High Sierra (186,363) 0.56 0.48 0.45 0.68 0.67 0.62 0.7 0.69
# Alpine-Amador-Calaveras* 0.48 0.52 0.47 0.59 0.61 0.67 0.67 0.71
$ Mariposa-Tuolumne 0.62 0.52 0.41 0.7 0.73 0.56 0.71 0.68
Inyo-Mono# California* (38,332,521) 0.59 0.59 0.59 0.59 0.63 0.64 0.65 0.66
Percent of Cancer Cases Diagnosed at Advanced Stage
Not calculated (<15 cases) 00.3 – 52.0 52.1 – 56.8 56.9 – 59.3 59.4 – 61.3 61.4 – 62.9 63.0 – 65.6 65.7 – 68.4 68.5 – 85.0
Population Size~
32,541 – 99,999 100,000 – 499,999 500,000 – 999,999 1,000,000 – 3,300,000 10,017,068
15-year Trends (1999 – 2013)
� decreasing trend � increasing trend
* statistically significant trend (p<0.05)
~ Number of people in 2013 estimated by National Center for Health Statistics (NCHS); Number in parentheses represents the population size in the region/state. a Advanced Stage includes summary stage values of regional, remote, and unknown.b Each column aggregates 3 years starting from 1990.
15 Year Trend Period
90-92 99-02 11-13

Heat Maps: Trends in Late Stage Diagnoses of Screenable Cancers in California Counties, 1988 – 2013 • 25
Figure 6b. Percent of Oropharyngeal Cancer Cases Diagnosed at an Advanced Stagea by California region (1990-2013b)
ConclusionThis report shows heterogeneous changes over time in advanced stage diagnoses of cancers that have the potential to be detected early or even prevented through screening. In the most recent fifteen years, advanced stage diagnoses have significantly increased for cervical, prostate, and oropharyngeal cancers; significantly decreased for breast cancer; and remained relatively constant for colorectal cancer and melanoma. For all of these cancer types, regional and county differences in advanced stage diagnoses were evident.
These maps provide a visual overview of the trends in late stage diagnoses throughout the state and can help identify areas that might benefit from increased screening efforts. Further research should be done to elucidate the reasons for the geographic variability found in this analysis and steps should be taken to reduce disparities and allocate more resources to areas in need of better screening.
Percent of Cancer Cases Diagnosed at Advanced Stage
Not calculated (<15 cases) 00.3 – 52.0 52.1 – 56.8 56.9 – 59.3 59.4 – 61.3 61.4 – 62.9 63.0 – 65.6 65.7 – 68.4 68.5 – 85.0
15-year Trends (1999 – 2013)
� decreasing trend � increasing trend
* statistically significant trend (p<0.05)
90-92 99-02 11-13# Los Angeles-Orange* 0.61 0.61 0.61 0.6 0.64 0.65 0.67 0.66
# Bay Area* 0.59 0.58 0.6 0.6 0.61 0.62 0.63 0.64
# Inland Empire 0.6 0.62 0.63 0.6 0.64 0.69 0.66 0.67
# Central Valley* 0.61 0.6 0.59 0.6 0.65 0.65 0.63 0.65
# San Diego-Imperial* 0.6 0.59 0.59 0.55 0.61 0.61 0.64 0.68
# Sacramento Region* 0.47 0.5 0.51 0.58 0.62 0.62 0.67 0.67
# Northern California 0.62 0.6 0.57 0.57 0.62 0.66 0.68 0.62
# Central Coast 0.57 0.59 0.6 0.58 0.6 0.63 0.6 0.62
# High Sierra 0.56 0.48 0.45 0.68 0.67 0.62 0.7 0.69
# California* 0.59 0.59 0.59 0.59 0.63 0.64 0.65 0.66
15 Year Trend Period 15 Year Trend Period
90-92 99-02 11-13
a Advanced Stage includes summary stage values of regional, remote, and unknown.b Each column aggregates 3 years starting from 1990.

26 • Heat Maps: Trends in Late Stage Diagnoses of Screenable Cancers in California Counties, 1988 – 2013
References:1. National Cancer Institute: Surveillance, Epidemiology, and End Results Program website: Site Recode
ICD-O-3/WHO 2008 Definition, http://seer.cancer.gov/siterecode/icdo3_dwhoheme/index.html
2. Mann SC, Giddings BH, Morris CR, Parikh-Patel A, Kizer KW, Kwong SL, Snipes KP. Cancer in California, 1988-2012. Sacramento, CA: California Department of Public Health, Cancer Surveillance Section, June 2015.
3. California Department of Public Health, California Cancer Registry website: Annual Statistical Tables by Site, http://www.ccrcal.org/Reports_and_Factsheets/Annual_Statistical_Tables_by_Site.shtml
4. National Cancer Institute website: Breast Cancer Treatment-Patient Version (PDQ), General Information about Breast Cancer, http://www.cancer.gov/types/breast/patient/breast-treatment-pdq#link/_148
5. American Cancer Society, California Department of Public Health, California Cancer Registry. California Cancer Facts & Figures. Oakland, CA: American Cancer Society, Inc., California Division; 2015.
6. American Cancer Society website: American Cancer Society recommendations for early breast cancer detection in women without breast symptoms, http://www.cancer.org/cancer/breastcancer/moreinformation/breastcancerearlydetection/breast-cancer-early-detection-acs-recs
7. American Cancer Society website: American Cancer Society recommendations for colorectal cancer early detection, http://www.cancer.org/cancer/colonandrectumcancer/moreinformation/colonandrectumcancerearlydetection/colorectal-cancer-early-detection-acs-recommendations
8. Petrosky E, Bocchini JA, Hariri S, Chesson H, Curtis CR, Saraiya M, et al. Use of 9-Valent Human Papillomavirus (HPV) Vaccine: Updated HPV Vaccination Recommendations of the Advisory Committee on Immunization Practices MMWR. 2015;64(11);300-304.
9. Surveillance Research Program, National Cancer Institute SEER*Stat software (www.seer.cancer.gov/seerstat) version 8.3.2. California Cancer Registry (www.ccrcal.org), California Department of Public Health. SEER*Stat Database: Incidence-California, December 2015 (1988-2013), 02/03/2016; NAACCR 3339 Version. Benchmarked 1988-1989 DOF population estimates, 6/12/2006; NCHS population estimates 1990-2013.
10. American Cancer Society website: New Screening Guidelines for Cervical Cancer, March 2012, http://www.cancer.org/cancer/news/new-screening-guidelines-for-cervical-cancer
11. American Cancer Society website: American Cancer Society recommendations for prostate cancer early detection, http://www.cancer.org/cancer/prostatecancer/moreinformation/prostatecancerearlydetection/prostate-cancer-early-detection-acs-recommendations
12. National Cancer Institute website: Melanoma Treatment-Patient Version (PDQ), General Information about Melanoma, http://www.cancer.gov/types/skin/patient/melanoma-treatment-pdq#section/all
13. Miller, Stack, Human Papillomavirus (HPV)-Associated Oropharyngeal Cancer; 2015: http://www.springer.com/us/book/9783319210995
14. National Cancer Institute website: Oropharyngeal Cancer Treatment-Patient Version (PDQ), General Information about Oropharyngeal, http://www.cancer.gov/types/head-and-neck/patient/oropharyngeal-treatment-pdq
15. Cancer stage at diagnosis, California Cancer Registry, June 2013: http://www.ccrcal.org/pdf/Reports/CCR_Cancer_Stage_at_Diagnosis_2013.pdf