Embed Size (px)
Citation preview
HAL Id: hal-01807364https://hal-univ-rennes1.archives-ouvertes.fr/hal-01807364
Submitted on 12 Apr 2019
HAL is a multi-disciplinary open accessarchive for the deposit and dissemination of sci-entific research documents, whether they are pub-lished or not. The documents may come fromteaching and research institutions in France orabroad, or from public or private research centers.
L’archive ouverte pluridisciplinaire HAL, estdestinée au dépôt et à la diffusion de documentsscientifiques de niveau recherche, publiés ou non,émanant des établissements d’enseignement et derecherche français ou étrangers, des laboratoirespublics ou privés.
Heart rate differences between symptomatic andasymptomatic Brugada syndrome patients at nightMireia Calvo, Virginie Le Rolle, Daniel Romero, Nathalie Behar, Pedro
Gomis, Philippe Mabo, Alfredo Hernandez
To cite this version:Mireia Calvo, Virginie Le Rolle, Daniel Romero, Nathalie Behar, Pedro Gomis, et al.. Heart rate dif-ferences between symptomatic and asymptomatic Brugada syndrome patients at night. PhysiologicalMeasurement, IOP Publishing, 2018, 39 (6), pp.065002. �10.1088/1361-6579/aac550�. �hal-01807364�
Heart rate differences between symptomatic and
asymptomatic Brugada syndrome patients at night
M Calvo1,2, V Le Rolle1, D Romero1, N Behar3, P Gomis2,4, P
Mabo1,3, A Hernandez1
1 LTSI - INSERM U1099, Universite de Rennes 1, Rennes, 35042, France2 Dept ESAII, CREB, Universitat Politecnica de Catalunya, Barcelona, 08028, Spain3 Service de Cardiologie et Maladies Vasculaires, CHU Rennes, Rennes, 35000, France4 CIBER of Bioengineering, Biomaterials and Nanomedicine (CIBER-BBN),
Zaragoza, 50018, Spain
E-mail: [email protected]
March 2018
Abstract. Objective: Ventricular arrhythmias in Brugada syndrome (BS) mainly
occur at rest, especially during nighttime, suggesting that parasympathetic activity at
night may play an important role in the arrhythmogenesis of the disease. This study
examined and compared the autonomic function of symptomatic and asymptomatic BS
patients overnight. Approach: We analyzed different heart rate variability (HRV) and
heart rate complexity (HRC) markers in a clinical series including 87 BS patients, where
23 were symptomatic. Main results: Statistically significant differences were found
in MIRR, SDNN , SDANN , δSDANN and SampEn, suggesting that symptomatic
patients may be related to lower heart rate variability and complexity values, as well
as to greater circadian fluctuations overnight. Significance: The results provide further
evidence for the role of autonomic imbalance in the pathophysiology of BS, highlighting
the relevance of nighttime analysis to unmask significant ANS changes. Based on these
outcomes, the role of HRV and HRC assessment at night could be a step forward
towards the understanding of BS and the risk for the occurrence of symptoms in these
patients, with a potential future impact on therapeutic strategies.
Keywords: Brugada syndrome, autonomic nervous system, heart rate variability, heart
rate dynamics
1. Introduction
Brugada syndrome (BS) is a genetic disease presenting a typical electrocardiographic
pattern characterized by a distinctive ST-segment elevation in right precordial leads
and a high risk of sudden cardiac death (SCD) due to ventricular fibrillation (VF) in
individuals with structurally normal hearts (Priori, et al. 2013, Priori, et al. 2015).
Since its first description as a distinct cardiac disease in (Brugada & Brugada 1992),
Page 1 of 14 AUTHOR SUBMITTED MANUSCRIPT - PMEA-102355.R2
123456789101112131415161718192021222324252627282930313233343536373839404142434445464748495051525354555657585960
Acc
epte
d M
anus
crip
t

Heart rate differences in Brugada syndrome at night 2
BS continues to spark a great research interest due to its high incidence, especially in
Southeast Asia, and due to its association with SCD in young adults and, less frequently,
in children and infants. The syndrome is estimated to be responsible for 4% of the
total amount of SCD and for 20% of SCD in structurally normal hearts (Brugada,
et al. 1998, Antzelevitch, et al. 2005).
Although several markers have been reported as predictive factors of SCD
occurrence, the largest series including BS patients only determined two reliable
indicators of cardiac events: prior symptoms, such as recovered SCD or syncope,
and spontaneous type-1 ECG pattern (Antzelevitch et al. 2005, Probst, et al. 2010).
Since implantable cardioverter defibrillators (ICD) are the only effective treatment
though associated with a high incidence of adverse events (Sacher, et al. 2013),
while symptomatic patients must undergo an implantation, risk stratification for
asymptomatic patients still remains controversial.
Ventricular arrhythmias in BS mainly occur at rest, especially at night during
sleep, suggesting that parasympathetic activity may play an important role in the
arrhythmogenesis of the syndrome (Matsuo, et al. 1999, Kies, et al. 2004). Indeed,
some studies on cardiac autonomic nervous system (ANS) analyzed by positron emission
tomography have evidenced that BS patients display some autonomic dysfunction (Kies
et al. 2004, Wichter, et al. 2002, Paul, et al. 2011, Bigi, et al. 2008). Thus, changes
in the autonomic modulation assessed by heart rate variations might provide useful
information about the arrhythmic risk of these patients.
Previous studies assessing the autonomic function through heart rate variability
(HRV) analyses along 24-hour ECG recordings have led to contradictory results
(Krittayaphong, et al. 2003, Hermida, et al. 2003, Pierre, et al. 2007, Tokuyama,
et al. 2014, Nakazawa, et al. 2003, Kostopoulou, et al. 2010, Behar, et al. 2016).
Moreover, since linear temporal and spectral HRV parameters are unable to capture
the complexity of heart rate regulation, features measuring the nonlinear dynamics
of RR series, such as Sample Entropy (SampEn), could better predict the risk of
suffering symptoms in BS. Although we already reported significant results in heart
rate complexity (HRC) during exercise testing in a previous work including BS patients
(Calvo, et al. 2017), we are not aware of any study having assessed HRC at night.
Therefore, in order to identify significant differences in the autonomic function of
BS patients at different levels of risk (symptomatic and asymptomatic subjects), the
aim of this study was to compare HRV and HRC markers and its circadian fluctuations
at night in a clinical series including 87 BS patients. The evaluation of heart rate
variability and complexity markers may provide supplementary information that could
be useful for risk stratification in asymptomatic BS patients.
Page 2 of 14AUTHOR SUBMITTED MANUSCRIPT - PMEA-102355.R2
123456789101112131415161718192021222324252627282930313233343536373839404142434445464748495051525354555657585960
Acc
epte
d M
anus
crip
t
Heart rate differences in Brugada syndrome at night 3
2. Methods
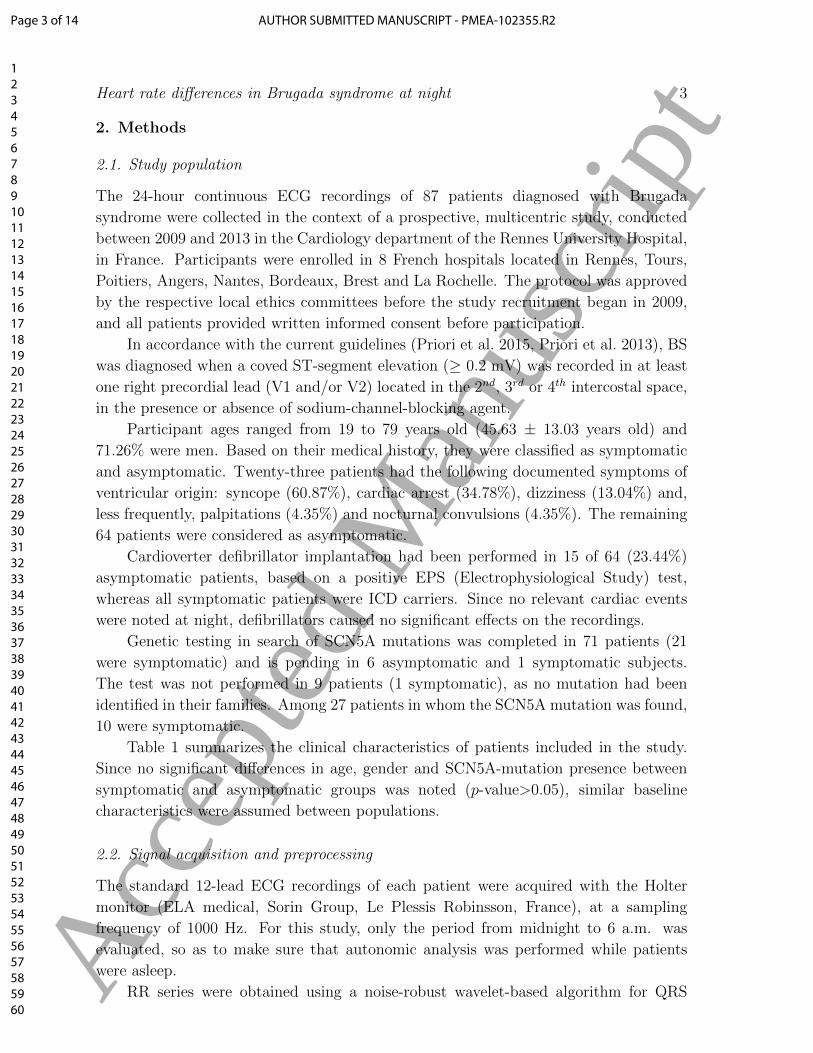
2.1. Study population
The 24-hour continuous ECG recordings of 87 patients diagnosed with Brugada
syndrome were collected in the context of a prospective, multicentric study, conducted
between 2009 and 2013 in the Cardiology department of the Rennes University Hospital,
in France. Participants were enrolled in 8 French hospitals located in Rennes, Tours,
Poitiers, Angers, Nantes, Bordeaux, Brest and La Rochelle. The protocol was approved
by the respective local ethics committees before the study recruitment began in 2009,
and all patients provided written informed consent before participation.
In accordance with the current guidelines (Priori et al. 2015, Priori et al. 2013), BS
was diagnosed when a coved ST-segment elevation (≥ 0.2 mV) was recorded in at least
one right precordial lead (V1 and/or V2) located in the 2nd, 3rd or 4th intercostal space,
in the presence or absence of sodium-channel-blocking agent.
Participant ages ranged from 19 to 79 years old (45.63 ± 13.03 years old) and
71.26% were men. Based on their medical history, they were classified as symptomatic
and asymptomatic. Twenty-three patients had the following documented symptoms of
ventricular origin: syncope (60.87%), cardiac arrest (34.78%), dizziness (13.04%) and,
less frequently, palpitations (4.35%) and nocturnal convulsions (4.35%). The remaining
64 patients were considered as asymptomatic.
Cardioverter defibrillator implantation had been performed in 15 of 64 (23.44%)
asymptomatic patients, based on a positive EPS (Electrophysiological Study) test,
whereas all symptomatic patients were ICD carriers. Since no relevant cardiac events
were noted at night, defibrillators caused no significant effects on the recordings.
Genetic testing in search of SCN5A mutations was completed in 71 patients (21
were symptomatic) and is pending in 6 asymptomatic and 1 symptomatic subjects.
The test was not performed in 9 patients (1 symptomatic), as no mutation had been
identified in their families. Among 27 patients in whom the SCN5A mutation was found,
10 were symptomatic.
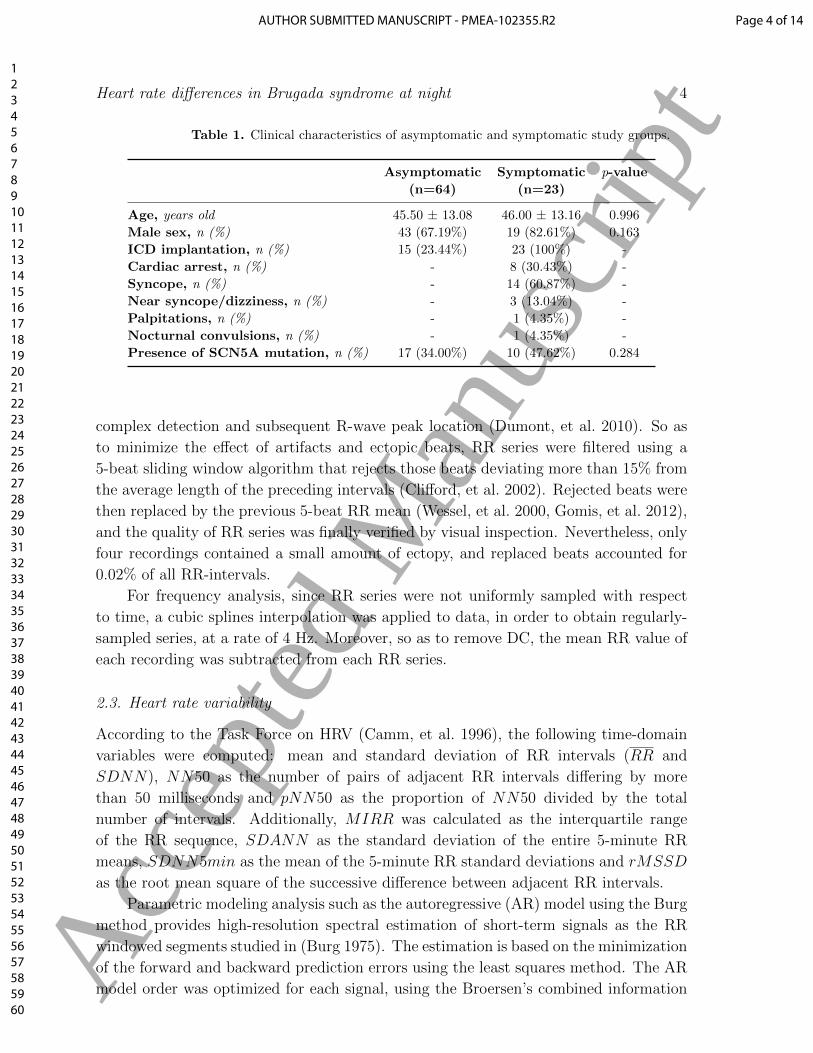
Table 1 summarizes the clinical characteristics of patients included in the study.
Since no significant differences in age, gender and SCN5A-mutation presence between
symptomatic and asymptomatic groups was noted (p-value>0.05), similar baseline
characteristics were assumed between populations.
2.2. Signal acquisition and preprocessing
The standard 12-lead ECG recordings of each patient were acquired with the Holter
monitor (ELA medical, Sorin Group, Le Plessis Robinsson, France), at a sampling
frequency of 1000 Hz. For this study, only the period from midnight to 6 a.m. was
evaluated, so as to make sure that autonomic analysis was performed while patients
were asleep.
RR series were obtained using a noise-robust wavelet-based algorithm for QRS
Page 3 of 14 AUTHOR SUBMITTED MANUSCRIPT - PMEA-102355.R2
123456789101112131415161718192021222324252627282930313233343536373839404142434445464748495051525354555657585960
Acc
epte
d M
anus
crip
t
Heart rate differences in Brugada syndrome at night 4
Table 1. Clinical characteristics of asymptomatic and symptomatic study groups.
Asymptomatic Symptomatic p-value
(n=64) (n=23)
Age, years old 45.50 ± 13.08 46.00 ± 13.16 0.996
Male sex, n (%) 43 (67.19%) 19 (82.61%) 0.163
ICD implantation, n (%) 15 (23.44%) 23 (100%) -
Cardiac arrest, n (%) - 8 (30.43%) -
Syncope, n (%) - 14 (60.87%) -
Near syncope/dizziness, n (%) - 3 (13.04%) -
Palpitations, n (%) - 1 (4.35%) -
Nocturnal convulsions, n (%) - 1 (4.35%) -
Presence of SCN5A mutation, n (%) 17 (34.00%) 10 (47.62%) 0.284
complex detection and subsequent R-wave peak location (Dumont, et al. 2010). So as
to minimize the effect of artifacts and ectopic beats, RR series were filtered using a
5-beat sliding window algorithm that rejects those beats deviating more than 15% from
the average length of the preceding intervals (Clifford, et al. 2002). Rejected beats were
then replaced by the previous 5-beat RR mean (Wessel, et al. 2000, Gomis, et al. 2012),
and the quality of RR series was finally verified by visual inspection. Nevertheless, only
four recordings contained a small amount of ectopy, and replaced beats accounted for
0.02% of all RR-intervals.
For frequency analysis, since RR series were not uniformly sampled with respect
to time, a cubic splines interpolation was applied to data, in order to obtain regularly-
sampled series, at a rate of 4 Hz. Moreover, so as to remove DC, the mean RR value of
each recording was subtracted from each RR series.
2.3. Heart rate variability
According to the Task Force on HRV (Camm, et al. 1996), the following time-domain
variables were computed: mean and standard deviation of RR intervals (RR and
SDNN), NN50 as the number of pairs of adjacent RR intervals differing by more
than 50 milliseconds and pNN50 as the proportion of NN50 divided by the total
number of intervals. Additionally, MIRR was calculated as the interquartile range
of the RR sequence, SDANN as the standard deviation of the entire 5-minute RR
means, SDNN5min as the mean of the 5-minute RR standard deviations and rMSSD
as the root mean square of the successive difference between adjacent RR intervals.
Parametric modeling analysis such as the autoregressive (AR) model using the Burg
method provides high-resolution spectral estimation of short-term signals as the RR
windowed segments studied in (Burg 1975). The estimation is based on the minimization
of the forward and backward prediction errors using the least squares method. The AR
model order was optimized for each signal, using the Broersen’s combined information
Page 4 of 14AUTHOR SUBMITTED MANUSCRIPT - PMEA-102355.R2
123456789101112131415161718192021222324252627282930313233343536373839404142434445464748495051525354555657585960
Acc
epte
d M
anus
crip
t

Heart rate differences in Brugada syndrome at night 5
criterion (Broersen 2000), in order to extract the spectral HRV indices from the resulting
Power Spectral Density (PSD).
The total power (TP) was obtained as the sum of the four spectral bands: ultra-low
frequency (ULF: 0-0.003 Hz), very-low frequency (VLF: 0.003-0.04 Hz), low frequency
(LF: 0.04-0.15 Hz) and high frequency (HF: 0.15-0.4 Hz). The HF component is
defined as a marker of vagal modulation and the LF component is modulated by
both the sympathetic and parasympathetic nervous systems, leading to controversial
interpretations (Camm et al. 1996). These were calculated from the average of 5-minute
intervals and normalized by subtracting the VLF component from the total power in
order to reduce the effects of noise artifacts:
LFnu =LF
TP − V LF(1)
HFnu =HF
TP − V LF(2)
The LF/HF ratio reflects the global sympathovagal balance and can be used as a
measure of this balance.
2.4. Heart rate complexity
According to a critical review of newly developed HRV methods published after the
Task Force on HRV (Sassi, et al. 2015), although several nonlinear markers, such as
those capturing the chaotic behavior of HRV, have been proposed to characterize HRC,
the results collected thus far are still too limited to conclude that human HRV arises
from a chaotic behavior of the cardiovascular system.
Conversely, according to the same review, entropy measures such as sample
entropy (SampEn) seem to accurately represent the responsiveness of the cardiovascular
system to environmental stimuli, decreasing when RR series become more ordered and
predictable. Therefore, HRC was herein evaluated through the analysis of the entropy
captured by SampEn. This marker is indeed a refined version of the traditionally used
irregularity measure Approximate Entropy (ApEn) (Richman & Moorman 2000). It is
defined as the conditional probability that two sequences of m consecutive data points
which are similar to each other (with a tolerance r) will remain similar when one more
consecutive point is included. Large values of SampEn indicate high irregularity and
great complexity, whereas smaller values indicate a more regular and predictable signal,
commonly associated with disease (Khandoker, et al. 2009, Javorka, et al. 2008, Tuzcu,
et al. 2006).
Although no consensus has been yet established for the appropriate selection of the
embedding dimension m and tolerance threshold r, based on the exhaustive evaluation
performed by (Lake, et al. 2002) that led to the selection of m = 3 and r = 0.2 · SD,
we chose, as in (Tuzcu et al. 2006, Al-Angari & Sahakian 2007), this combination of
parameters.
Page 5 of 14 AUTHOR SUBMITTED MANUSCRIPT - PMEA-102355.R2
123456789101112131415161718192021222324252627282930313233343536373839404142434445464748495051525354555657585960
Acc
epte
d M
anus
crip
t

Heart rate differences in Brugada syndrome at night 6
2.5. Statistical analysis
Kolmogorov-Smirnov tests were applied so as to assess normality on extracted markers.
Since, according to the results, normal distributions could not be assumed, statistical
comparisons between symptomatic and asymptomatic patients during the whole night
(midnight to 6 a.m.), as well as for each interval of one hour, were evaluated by
Mann-Whitney U non-parametric tests. Moreover, fluctuations in HRV at night were
calculated as in (Behar et al. 2016), using a coefficient of variation δ = (maximum −minimum value)/maximum value.
Logistic regression is a statistical method that finds the best fitting model to
describe the relationship between a dichotomous outcome (here the presence/absence of
symptoms) and a set of independent variables X1, · · · , Xk. It generates the coefficients
bo, b1, · · · , bk (and its standard errors and significance levels) that maximize the likelihood
of observing the sample values in order to predict a logit transformation of the
probability of suffering symptoms from the following formula:
logit(p) = lnp
1− p= b0 + b1X1 + · · ·+ bkXk (3)
Therefore, binary logistic regression models were applied to each variable differing
significantly between groups in order to predict the probability of experiencing
symptoms related to those HRV and HRC measures. By calculating the odds ratios
(OR) related to these models, we quantified how strongly the presence of each extracted
feature may be associated with the presence of symptoms in Brugada syndrome.
HRV parameter calculations and statistical tests were performed by applying
algorithms developed in our laboratory for HRV analysis, using the commercially
available software MatLab (Mathworks Inc., MI, USA) and setting the level of
significance at p < 0.05.
3. Results
When the whole night was taken into account, similar results with no significant
differences between study groups were found. However, the variation coefficient of
SDANN , δSDANN , was significantly higher in symptomatic than in asymptomatic
patients between 1 a.m. and 5 a.m. (p < 0.005).
Regarding heart rate variability and complexity differences analyzed for each
interval of one hour, some relevant tendencies, represented by some exemplifying markers
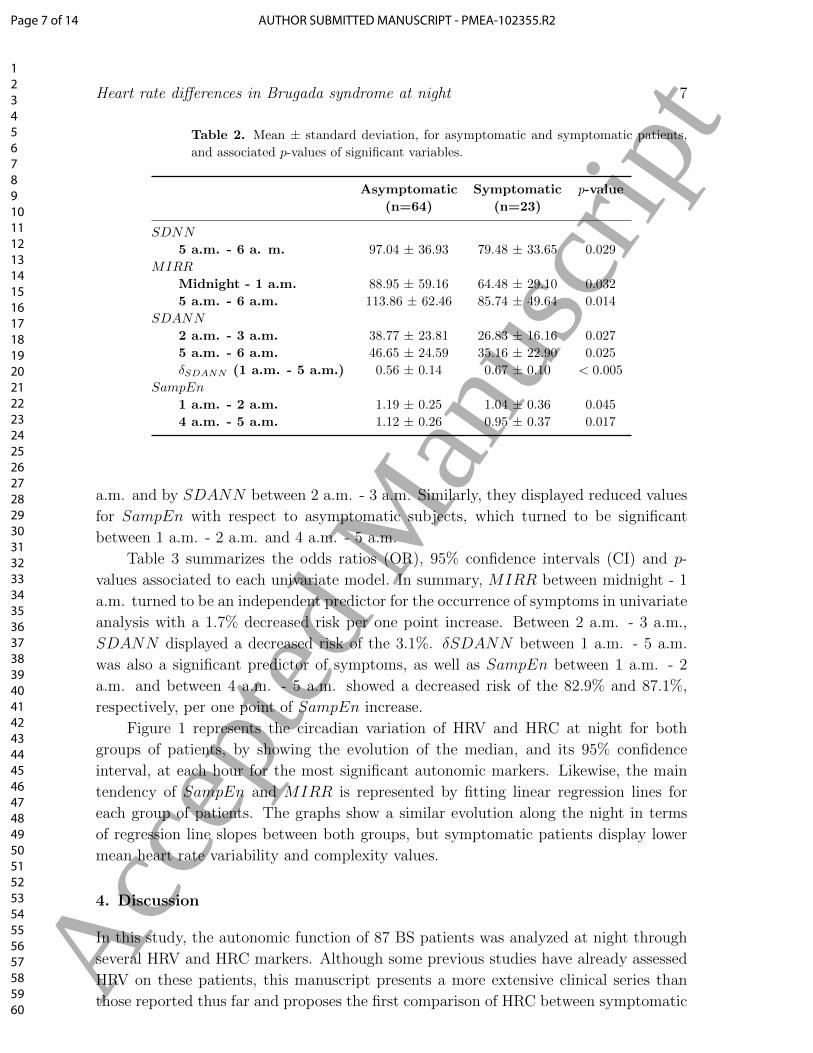
in Figure 1, were observed. Table 2 summarizes the mean ± standard deviation values
for symptomatic and asymptomatic patients and the associated p-values obtained in each
significant case. Results from all the analyzed markers are provided as Supplementary
material.
Symptomatic patients showed a decreased heart rate variability, which was
statistically significant between 5 a.m. - 6 a.m., according to SDNN , MIRR and
SDANN . Significant differences were also captured by MIRR between midnight - 1
Page 6 of 14AUTHOR SUBMITTED MANUSCRIPT - PMEA-102355.R2
123456789101112131415161718192021222324252627282930313233343536373839404142434445464748495051525354555657585960
Acc
epte
d M
anus
crip
t
Heart rate differences in Brugada syndrome at night 7
Table 2. Mean ± standard deviation, for asymptomatic and symptomatic patients,
and associated p-values of significant variables.
Asymptomatic Symptomatic p-value
(n=64) (n=23)
SDNN
5 a.m. - 6 a. m. 97.04 ± 36.93 79.48 ± 33.65 0.029
MIRR
Midnight - 1 a.m. 88.95 ± 59.16 64.48 ± 29.10 0.032
5 a.m. - 6 a.m. 113.86 ± 62.46 85.74 ± 49.64 0.014
SDANN
2 a.m. - 3 a.m. 38.77 ± 23.81 26.83 ± 16.16 0.027
5 a.m. - 6 a.m. 46.65 ± 24.59 35.16 ± 22.90 0.025
δSDANN (1 a.m. - 5 a.m.) 0.56 ± 0.14 0.67 ± 0.10 < 0.005
SampEn
1 a.m. - 2 a.m. 1.19 ± 0.25 1.04 ± 0.36 0.045
4 a.m. - 5 a.m. 1.12 ± 0.26 0.95 ± 0.37 0.017
a.m. and by SDANN between 2 a.m. - 3 a.m. Similarly, they displayed reduced values
for SampEn with respect to asymptomatic subjects, which turned to be significant
between 1 a.m. - 2 a.m. and 4 a.m. - 5 a.m.
Table 3 summarizes the odds ratios (OR), 95% confidence intervals (CI) and p-
values associated to each univariate model. In summary, MIRR between midnight - 1
a.m. turned to be an independent predictor for the occurrence of symptoms in univariate
analysis with a 1.7% decreased risk per one point increase. Between 2 a.m. - 3 a.m.,
SDANN displayed a decreased risk of the 3.1%. δSDANN between 1 a.m. - 5 a.m.
was also a significant predictor of symptoms, as well as SampEn between 1 a.m. - 2
a.m. and between 4 a.m. - 5 a.m. showed a decreased risk of the 82.9% and 87.1%,
respectively, per one point of SampEn increase.
Figure 1 represents the circadian variation of HRV and HRC at night for both
groups of patients, by showing the evolution of the median, and its 95% confidence
interval, at each hour for the most significant autonomic markers. Likewise, the main
tendency of SampEn and MIRR is represented by fitting linear regression lines for
each group of patients. The graphs show a similar evolution along the night in terms
of regression line slopes between both groups, but symptomatic patients display lower
mean heart rate variability and complexity values.
4. Discussion
In this study, the autonomic function of 87 BS patients was analyzed at night through
several HRV and HRC markers. Although some previous studies have already assessed
HRV on these patients, this manuscript presents a more extensive clinical series than
those reported thus far and proposes the first comparison of HRC between symptomatic
Page 7 of 14 AUTHOR SUBMITTED MANUSCRIPT - PMEA-102355.R2
123456789101112131415161718192021222324252627282930313233343536373839404142434445464748495051525354555657585960
Acc
epte
d M
anus
crip
t

Heart rate differences in Brugada syndrome at night 8
Table 3. Odds ratios, 95% confidence intervals and p-values from univariate analysis
of significant autonomic markers.
OR 95% CI p-value
SDNN
5 a.m. - 6 a. m. 0.984 0.969 - 1.000 0.053
MIRR
Midnight - 1 a.m. 0.983 0.967 - 1.000 0.047*
5 a.m. - 6 a.m. 0.989 0.978 - 1.000 0.060
SDANN
2 a.m. - 3 a.m. 0.969 0.941 - 0.998 0.037*
5 a.m. - 6 a.m. 0.978 0.956 - 1.001 0.059
δSDANN (1 a.m. - 5 a.m.) 1039.321 11.293 - 95650.848 0.003*
SampEn
1 a.m. - 2 a.m. 0.171 0.032 - 0.913 0.039*
4 a.m. - 5 a.m. 0.129 0.023 - 0.714 0.019*
*p < 0.05 when comparing symptomatic and asymptomatic study groups.
Figure 1. Median and 95% confidence intervals, for SampEn and MIRR on
symptomatic and asymptomatic BS patients at each hour during nighttime (*p <0.05).
Dotted black lines are fitted linear regression lines that represent the main tendencies
of each variable along the night, for both study groups.
and asymptomatic BS patients overnight.
In a clinical series of 27 patients with BS, of whom 10 were asymptomatic subjects
with Brugada ECG, and 45 controls, Krittayaphong et al (Krittayaphong et al. 2003)
found that symptomatic BS patients showed lower HRV and lower vagal tone at night
compared to controls, as well as lower diurnal and higher overnight heart rates compared
to asymptomatic subjects and controls. Similarly, Hermida et al (Hermida et al. 2003)
detected a significant reduction in SDANN at night when comparing Holter recordings
in 21 symptomatic and 26 asymptomatic BS patients. Pierre et al (Pierre et al. 2007)
also confirmed in a clinical series of 46 BS patients and 46 controls that HRV in BS
Page 8 of 14AUTHOR SUBMITTED MANUSCRIPT - PMEA-102355.R2
123456789101112131415161718192021222324252627282930313233343536373839404142434445464748495051525354555657585960
Acc
epte
d M
anus
crip
t

Heart rate differences in Brugada syndrome at night 9
was significantly lower with respect to healthy subjects. Tokuyama et al (Tokuyama
et al. 2014) results showed a significant reduction of the LF and HF components in BS
patients with previous VF when analyzing a series of 12 symptomatic (with previous
VF), 17 asymptomatic and 16 healthy individuals. The results showed a decreased
circadian variation of the autonomic response over 24 hours, with respect to controls.
Conversely, Nakazawa et al (Nakazawa et al. 2003) analyzed, in 24-hour ECG recordings,
the autonomic function of 27 BS patients (10 of them had a history of VF and 17 did not)
and of 26 healthy subjects. They found higher vagal and reduced sympathetic activities
(increase of HF component and decrease of LF/HF) in BS patients with previous VF
compared to controls, as well as an increase of HF component when compared to
asymptomatic BS patients. Kostopoulou et al (Kostopoulou et al. 2010) did not find
any significant differences in HRV between 20 patients with BS and 20 age-matched
controls, although a high susceptibility to vasovagal syncope during head-up tilt test in
BS patients was noticed.
In our study, according to time-domain HRV markers, symptomatic patients showed
lower MIRR, SDNN and SDANN values, mainly during the last hour (5 a.m.
- 6 a.m.). Therefore, patients with higher risk for cardiac events seem to show a
decreased HRV, following the tendency published in previous works (Krittayaphong
et al. 2003, Hermida et al. 2003, Pierre et al. 2007, Tokuyama et al. 2014), emphasizing
differences during the last hour of sleep.
From HRC analysis, statistically significant results were observed between 2 a.m.
- 3 a.m. and 4 a.m. - 5 a.m. Symptomatic patients showed more regularity in RR
series, which might be related to a worse cardiac health condition since a reduced
complexity in HR has been associated with disease (Khandoker et al. 2009, Javorka
et al. 2008, Tuzcu et al. 2006). The ANS is controlled by complex interactions resulting
from feedback loops of nonlinear systems that permit the organism to adapt to particular
physiological conditions, such as metabolic variations, stress or disease. Thus, according
to previous studies, a reduction in the complexity of biological control systems reflects a
decreased organism adaptability, generally associated with age and disease (Goldberger,
et al. 2002, Rabinovich & Abarbanel 1998, Magrans, et al. 2010, Smith, et al. 2005).
In a previous study, we reported reduced values of HRC in symptomatic BS
patients with respect to asymptomatic subjects, during recovery after physical stress
testing (Calvo et al. 2017). As it was suggested, this affected ANS dynamics when
parasympathetic activity is predominant confirms previous studies that highlight the
importance of autonomic imbalance in the genesis of life-threatening arrhythmias in
BS (Matsuo et al. 1999, Kies et al. 2004). Indeed, ventricular arrhythmias and sudden
cardiac death (SCD) mainly occur at rest and especially during sleep, when vagal tone
is dominant.
Regarding circadian fluctuations, based on δSDANN results, we observed
significantly greater variations during nighttime in symptomatic than in asymptomatic
patients, which concurs with previous studies having compared these groups during
daytime and when the night was analyzed between midnight and 4 a.m. As suggested
Page 9 of 14 AUTHOR SUBMITTED MANUSCRIPT - PMEA-102355.R2
123456789101112131415161718192021222324252627282930313233343536373839404142434445464748495051525354555657585960
Acc
epte
d M
anus
crip
t

Heart rate differences in Brugada syndrome at night 10
by (Behar et al. 2016), this increase in δSDANN might be caused by wider fluctuations
in the autonomic tone, or by a greater sinus node autonomic receptors sensitivity.
Then, we included those statistically significant variables in univariate logistic
regression models in order to estimate the discrimination power of each parameter.
According to HRV results, MIRR turned to be an independent predictor between
midnight and 1 a.m.; SDANN at 2 a.m. - 3 a.m; and δSDANN between 1 a.m. and 5
a.m. HRC captured by SampEn was also a significant predictor for the occurrence of
cardiac events.
It should be noted that, since significant differences in ANS activity have been
reported during waking and sleep stages (Penzel, et al. 2003b), sleep-phase classification
could provide relevant information for a better understanding of the autonomic function
in Brugada syndrome patients. However, the gold-standard for automatic sleep staging
requires data from the electroencephalogram, electroculogram and electromyogram,
which were not available for this study (Berry, et al. 2012).
Nevertheless, several works have proposed the use of heart rate variability (HRV)
markers for sleep-phase classification. Penzel et al. showed that HRV dynamics captured
by detrended fluctuation analysis (DFA) were different in waking and sleep stages
(Penzel et al. 2003b), and that this measure was more sensitive than spectral markers
(Penzel, et al. 2003a). Indeed, since many studies on cardiac autonomic function based
on spectral HRV analysis have failed to represent ANS activity even in healthy subjects
(Michael, et al. 2017), sleep staging should not be determined from these markers.
The LF component does not provide a reliable measure of the sympathetic tone but
rather reflects a complex interplay among many factors including the sympathetic and
vagal contributions to ANS. Similarly, just as parasympathetic activity influences LF
values, sympathetic activation modulates the HF component (Billman 2013), which is
also sensitive to variations in respiratory frequency and tidal volume. Therefore, most
recent studies on sleep staging based on the ECG, also include respiratory information
(Redmond & Heneghan 2006, Redmond, et al. 2007).
Although several works have provided multivariate solutions for automatic sleep
staging based on HRV information, they are based on complex models difficult to
reproduce since results after training are not explicitly provided (Mendez, et al. 2010,
Adnane, et al. 2012, Ebrahimi, et al. 2013). Moreover, they have been trained with data
from populations not related to Brugada syndrome. Since a high inter-patient variability
is expected, particularly when evaluating diseases differently affecting ANS activity, the
proposed HRV markers may not accurately reflect sleep staging in the context of BS.
Finally, it has been reported that HRV changes precede variations in the EEG,
probably due to changes in the central nervous system. Although HRV changes have
been reported to occur around 5 minutes before changes observed in the EEG (Bonnet
& Arand 1997), this interaction may be significantly altered in diseases affecting ANS
activity, such as the Brugada syndrome. Therefore, we consider that a previous study
based on the polysomnography data of BS patients should be performed so as to validate
conclusions on ECG-based sleep staging for this particular population.
Page 10 of 14AUTHOR SUBMITTED MANUSCRIPT - PMEA-102355.R2
123456789101112131415161718192021222324252627282930313233343536373839404142434445464748495051525354555657585960
Acc
epte
d M
anus
crip
t
Heart rate differences in Brugada syndrome at night 11
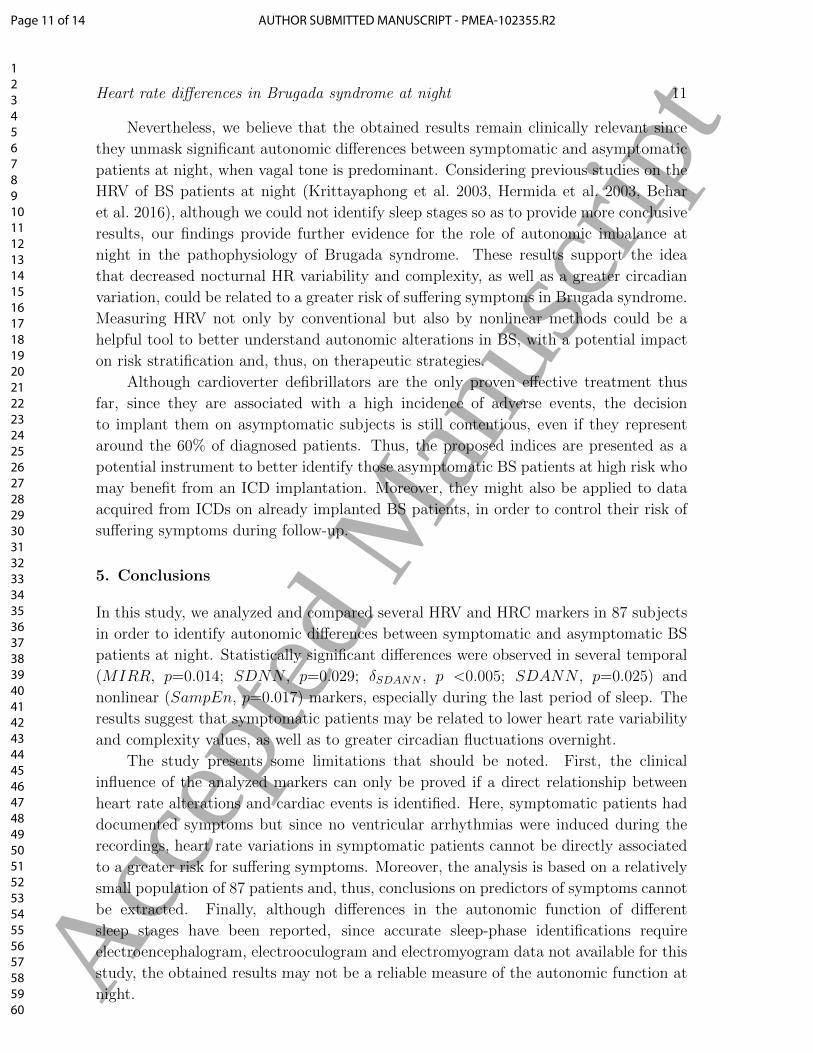
Nevertheless, we believe that the obtained results remain clinically relevant since
they unmask significant autonomic differences between symptomatic and asymptomatic
patients at night, when vagal tone is predominant. Considering previous studies on the
HRV of BS patients at night (Krittayaphong et al. 2003, Hermida et al. 2003, Behar
et al. 2016), although we could not identify sleep stages so as to provide more conclusive
results, our findings provide further evidence for the role of autonomic imbalance at
night in the pathophysiology of Brugada syndrome. These results support the idea
that decreased nocturnal HR variability and complexity, as well as a greater circadian
variation, could be related to a greater risk of suffering symptoms in Brugada syndrome.
Measuring HRV not only by conventional but also by nonlinear methods could be a
helpful tool to better understand autonomic alterations in BS, with a potential impact
on risk stratification and, thus, on therapeutic strategies.
Although cardioverter defibrillators are the only proven effective treatment thus
far, since they are associated with a high incidence of adverse events, the decision
to implant them on asymptomatic subjects is still contentious, even if they represent
around the 60% of diagnosed patients. Thus, the proposed indices are presented as a
potential instrument to better identify those asymptomatic BS patients at high risk who
may benefit from an ICD implantation. Moreover, they might also be applied to data
acquired from ICDs on already implanted BS patients, in order to control their risk of
suffering symptoms during follow-up.
5. Conclusions
In this study, we analyzed and compared several HRV and HRC markers in 87 subjects
in order to identify autonomic differences between symptomatic and asymptomatic BS
patients at night. Statistically significant differences were observed in several temporal
(MIRR, p=0.014; SDNN , p=0.029; δSDANN , p <0.005; SDANN , p=0.025) and
nonlinear (SampEn, p=0.017) markers, especially during the last period of sleep. The
results suggest that symptomatic patients may be related to lower heart rate variability
and complexity values, as well as to greater circadian fluctuations overnight.
The study presents some limitations that should be noted. First, the clinical
influence of the analyzed markers can only be proved if a direct relationship between
heart rate alterations and cardiac events is identified. Here, symptomatic patients had
documented symptoms but since no ventricular arrhythmias were induced during the
recordings, heart rate variations in symptomatic patients cannot be directly associated
to a greater risk for suffering symptoms. Moreover, the analysis is based on a relatively
small population of 87 patients and, thus, conclusions on predictors of symptoms cannot
be extracted. Finally, although differences in the autonomic function of different
sleep stages have been reported, since accurate sleep-phase identifications require
electroencephalogram, electrooculogram and electromyogram data not available for this
study, the obtained results may not be a reliable measure of the autonomic function at
night.
Page 11 of 14 AUTHOR SUBMITTED MANUSCRIPT - PMEA-102355.R2
123456789101112131415161718192021222324252627282930313233343536373839404142434445464748495051525354555657585960
Acc
epte
d M
anus
crip
t

Heart rate differences in Brugada syndrome at night 12
Nevertheless, the observed differences between symptomatic and asymptomatic BS
patients indicate important trends of clinical relevance that could provide new insights
in the understanding of the physiopathology of the syndrome. Future work will be
based on combining these parameters, together with other relevant markers of risk, on
a multivariate classification method capable of identifying BS patients who may benefit
from an ICD implantation.
Acknowledgments
This work was supported by the French Ministry of Health (Programme Hospitalier de
Recherche Clinique - PHRC Regional). MC thanks la Caixa Foundation (Spain) and
DR acknowledges Lefoulon-Delalande Foundation (France) for financial support.
References
M. Adnane, Z. Jiang & Z. Yan (2012). ‘Sleep–wake stages classification and sleep efficiency estimation
using single-lead electrocardiogram’. Expert Systems with Applications 39(1):1401–1413.
H. M. Al-Angari & A. V. Sahakian (2007). ‘Use of sample entropy approach to study heart rate
variability in obstructive sleep apnea syndrome’. IEEE Transactions on Biomedical Engineering
54(10):1900–1904.
C. Antzelevitch, et al. (2005). ‘Brugada Syndrome: Report of the Second Consensus Conference:
Endorsed by the Heart Rhythm Society and the European Heart Rhythm Association’. Circulation
111(5):659–670.
N. Behar, B. Petit, V. Probst, F. Sacher, G. Kervio, J. Mansourati, P. Bru, A. Hernandez & P. Mabo
(2016). ‘Heart rate variability and repolarization characteristics in symptomatic and asymptomatic
Brugada syndrome’. Europace p. euw224.
R. B. Berry, R. Brooks, C. E. Gamaldo, S. M. Harding, C. Marcus & B. Vaughn (2012). ‘The
AASM manual for the scoring of sleep and associated events’. Rules, Terminology and Technical
Specifications, Darien, Illinois, American Academy of Sleep Medicine .
M. A. B. Bigi, A. Aslani & A. Aslani (2008). ‘Significance of cardiac autonomic neuropathy in risk
stratification of Brugada syndrome’. Europace 10(7):821–824.
G. E. Billman (2013). ‘The LF/HF ratio does not accurately measure cardiac sympatho-vagal balance’.
Frontiers in physiology 4:26.
M. Bonnet & D. Arand (1997). ‘Heart rate variability: sleep stage, time of night, and arousal influences’.
Clinical Neurophysiology 102(5):390–396.
P. Broersen (2000). ‘Finite sample criteria for autoregressive order selection’. Signal Processing, IEEE
Transactions on 48(12):3550–3558.
J. Brugada, R. Brugada & P. Brugada (1998). ‘Right Bundle-Branch Block and ST-Segment Elevation
in Leads V1 Through V3 : A Marker for Sudden Death in Patients Without Demonstrable
Structural Heart Disease’. Circulation 97(5):457–460.
P. Brugada & J. Brugada (1992). ‘Right bundle branch block, persistent {ST} segment elevation
and sudden cardiac death: A distinct clinical and electrocardiographic syndrome: A multicenter
report’. Journal of the American College of Cardiology 20(6):1391 – 1396.
J. P. Burg (1975). Maximum Entropy Spectral Analysis. Phd thesis, Stanford University, Stanford,
CA 94305.
M. Calvo, P. Gomis, D. Romero, V. Le Rolle, N. Behar, P. Mabo & A. Hernandez (2017). ‘Heart
rate complexity analysis in Brugada syndrome during physical stress testing’. Physiological
measurement 38(2):387.
Page 12 of 14AUTHOR SUBMITTED MANUSCRIPT - PMEA-102355.R2
123456789101112131415161718192021222324252627282930313233343536373839404142434445464748495051525354555657585960
Acc
epte
d M
anus
crip
t
Heart rate differences in Brugada syndrome at night 13
A. Camm, et al. (1996). ‘Heart rate variability: standards of measurement, physiological interpretation
and clinical use. Task Force of the European Society of Cardiology and the North American Society
of Pacing and Electrophysiology’. Circulation 93(5):1043–1065.
G. Clifford, P. McSharry & L. Tarassenko (2002). ‘Characterizing artefact in the normal human 24-
hour RR time series to aid identification and artificial replication of circadian variations in human
beat to beat heart rate using a simple threshold’. In Computers in Cardiology, 2002, pp. 129–132.
IEEE.
J. Dumont, A. Hernandez & G. Carrault (2010). ‘Improving ECG Beats Delineation With an
Evolutionary Optimization Process’. Biomedical Engineering, IEEE Transactions on 57(3):607–
615.
F. Ebrahimi, S.-K. Setarehdan, J. Ayala-Moyeda & H. Nazeran (2013). ‘Automatic sleep staging
using empirical mode decomposition, discrete wavelet transform, time-domain, and nonlinear
dynamics features of heart rate variability signals’. Computer methods and programs in biomedicine
112(1):47–57.
A. L. Goldberger, C.-K. Peng & L. A. Lipsitz (2002). ‘What is physiologic complexity and how does
it change with aging and disease?’. Neurobiology of aging 23(1):23–26.
P. Gomis, P. Caminal, M. Vallverdu, S. G. Warren, P. K. Stein & G. S. Wagner (2012). ‘Assessment of
autonomic control of the heart during transient myocardial ischemia’. Journal of electrocardiology
45(1):82–89.
J.-S. Hermida, A. Leenhardt, B. Cauchemez, I. Denjoy, G. Jarry, F. Mizon, P. Milliez, J.-L. Rey,
P. Beaufils & P. Coumel (2003). ‘Decreased nocturnal standard deviation of averaged NN intervals’.
European heart journal 24(22):2061–2069.
M. Javorka, Z. Trunkvalterova, I. Tonhajzerova, J. Javorkova, K. Javorka & M. Baumert (2008).
‘Short-term heart rate complexity is reduced in patients with type 1 diabetes mellitus’. Clinical
Neurophysiology 119(5):1071–1081.
A. H. Khandoker, H. F. Jelinek & M. Palaniswami (2009). ‘Identifying diabetic patients with cardiac
autonomic neuropathy by heart rate complexity analysis’. Biomedical engineering online 8(1):3.
P. Kies, et al. (2004). ‘Abnormal Myocardial Presynaptic Norepinephrine Recycling in Patients With
Brugada Syndrome’. Circulation 110(19):3017–3022.
A. Kostopoulou, et al. (2010). ‘Disorders of the Autonomic Nervous System in Patients With Brugada
Syndrome: A Pilot Study’. Journal of Cardiovascular Electrophysiology 21(7):773–780.
R. Krittayaphong, G. Veerakul, K. Nademanee & C. a. Kangkagate (2003). ‘Heart rate variability in
patients with Brugada syndrome in Thailand’. European Heart Journal 24(19):1771–1778.
D. E. Lake, J. S. Richman, M. P. Griffin & J. R. Moorman (2002). ‘Sample entropy analysis of neonatal
heart rate variability’. American Journal of Physiology-Regulatory, Integrative and Comparative
Physiology 283(3):R789–R797.
R. Magrans, P. Gomis, P. Caminal & G. Wagner (2010). ‘Multifractal and nonlinear assessment
of autonomous nervous system response during transient myocardial ischaemia’. Physiological
measurement 31(4):565–580.
K. Matsuo, T. Kurita, M. Inagaki, M. Kakishita, N. Aihara, W. Shimizu, A. Taguchi, K. Suyama,
S. Kamakura & K. a. Shimomura (1999). ‘The circadian pattern of the development of ventricular
fibrillation in patients with Brugada syndrome’. European Heart Journal 20(6):465–470.
M. O. Mendez, M. Matteucci, V. Castronovo, L. Ferini-Strambi, S. Cerutti & A. Bianchi (2010). ‘Sleep
staging from heart rate variability: time-varying spectral features and hidden markov models’.
International Journal of Biomedical Engineering and Technology 3(3-4):246–263.
S. Michael, K. S. Graham & G. M. Davis (2017). ‘Cardiac autonomic responses during exercise and
post-exercise recovery using heart rate variability and systolic time intervals—a review’. Frontiers
in physiology 8:301.
K. Nakazawa, T. Sakurai, A. Takagi, R. Kishi, K. Osada, T. Nanke, F. Miyake, N. Matsumoto &
S. Kobayashi (2003). ‘Autonomic imbalance as a property of symptomatic Brugada syndrome’.
Circulation journal : official journal of the Japanese Circulation Society 67(6):511—514.
Page 13 of 14 AUTHOR SUBMITTED MANUSCRIPT - PMEA-102355.R2
123456789101112131415161718192021222324252627282930313233343536373839404142434445464748495051525354555657585960
Acc
epte
d M
anus
crip
t
Heart rate differences in Brugada syndrome at night 14
M. Paul, M. Meyborg, P. Boknik, U. Gergs, W. Schmitz, G. Breithardt, T. Wichter & N. Joachim
(2011). ‘Autonomic Dysfunction in Patients with Brugada Syndrome: Further Biochemical
Evidence of Altered Signaling Pathways’. Pacing and Clinical Electrophysiology 34(9):1147–1153.
T. Penzel, J. W. Kantelhardt, L. Grote, J.-H. Peter & A. Bunde (2003a). ‘Comparison of detrended
fluctuation analysis and spectral analysis for heart rate variability in sleep and sleep apnea’. IEEE
Transactions on biomedical engineering 50(10):1143–1151.
T. Penzel, J. W. Kantelhardt, C.-C. Lo, K. Voigt & C. Vogelmeier (2003b). ‘Dynamics of heart rate
and sleep stages in normals and patients with sleep apnea’. Neuropsychopharmacology 28(S1):S48.
B. Pierre, D. Babuty, P. Poret, C. Giraudeau, O. Marie, P. Cosnay & L. Fauchier (2007). ‘Abnormal
nocturnal heart rate variability and QT dynamics in patients with Brugada syndrome’. Pacing
and clinical electrophysiology 30(s1):S188–S191.
S. G. Priori, et al. (2015). ‘2015 ESC Guidelines for the management of patients with ventricular
arrhythmias and the prevention of sudden cardiac death: The Task Force for the Management
of Patients with Ventricular Arrhythmias and the Prevention of Sudden Cardiac Death of the
European Society of Cardiology (ESC) Endorsed by: Association for European Paediatric and
Congenital Cardiology (AEPC)’. European heart journal 36(41):2793–2867.
S. G. Priori, et al. (2013). ‘Executive summary: HRS/EHRA/APHRS expert consensus statement
on the diagnosis and management of patients with inherited primary arrhythmia syndromes’.
Europace 15(10):1389–1406.
V. Probst, et al. (2010). ‘Long-term prognosis of patients diagnosed with Brugada syndrome results
from the FINGER Brugada Syndrome Registry’. Circulation 121(5):635–643.
M. Rabinovich & H. Abarbanel (1998). ‘The role of chaos in neural systems’. Neuroscience 87(1):5–14.
S. J. Redmond, P. de Chazal, C. O’Brien, S. Ryan, W. T. McNicholas & C. Heneghan (2007). ‘Sleep
staging using cardiorespiratory signals’. Somnologie-Schlafforschung und Schlafmedizin 11(4):245–
256.
S. J. Redmond & C. Heneghan (2006). ‘Cardiorespiratory-based sleep staging in subjects with
obstructive sleep apnea’. IEEE Transactions on Biomedical Engineering 53(3):485–496.
J. S. Richman & J. R. Moorman (2000). ‘Physiological time-series analysis using approximate
entropy and sample entropy’. American Journal of Physiology-Heart and Circulatory Physiology
278(6):H2039–H2049.
F. Sacher, et al. (2013). ‘Outcome after implantation of a cardioverter-defibrillator in patients with
Brugada syndrome’. Circulation 128(16):1739–1747.
R. Sassi, et al. (2015). ‘Advances in heart rate variability signal analysis: joint position statement by
the e-Cardiology ESC Working Group and the European Heart Rhythm Association co-endorsed
by the Asia Pacific Heart Rhythm Society’. EP Europace 17(9):1341–1353.
R. G. Smith, L. Betancourt & Y. Sun (2005). ‘Molecular endocrinology and physiology of the aging
central nervous system’. Endocrine reviews 26(2):203–250.
T. Tokuyama, et al. (2014). ‘Deterioration of the circadian variation of heart rate variability in Brugada
syndrome may contribute to the pathogenesis of ventricular fibrillation’. Journal of cardiology
64(2):133–138.
V. Tuzcu, S. Nas, T. Borklu & A. Ugur (2006). ‘Decrease in the heart rate complexity prior to the
onset of atrial fibrillation’. Europace 8(6):398–402.
N. Wessel, A. Voss, J. Kurths, A. Schirdewan, K. Hnatkova & M. Malik (2000). ‘Evaluation of
renormalised entropy for risk stratification using heart rate variability data’. Medical and Biological
Engineering and Computing 38(6):680–685.
T. Wichter, et al. (2002). ‘Cardiac Autonomic Dysfunction in Brugada Syndrome’. Circulation
105(6):702–706.
Page 14 of 14AUTHOR SUBMITTED MANUSCRIPT - PMEA-102355.R2
123456789101112131415161718192021222324252627282930313233343536373839404142434445464748495051525354555657585960
Acc
epte
d M
anus
crip
t