Embed Size (px)
Citation preview

4/3/2017
1
Heart Failure Readmissions 2017
Where do we stand?
Peter Eckman, MD, FACC, FHFSA
Section Head, Advanced Heart Failure
Disclosure InformationPeter Eckman, MD, FACC, FHFSA
Disclosure InformationPeter Eckman, MD, FACC, FHFSA
I have the following financial relationships to disclose:
Consultant for:
Abbott/St Jude Medical (Current and Future LVADs) SHAPE Medical Systems (prior)
Medtronic
Novartis (LCZ696, prior)
Grant/Research support:
Abbott/St Jude Medical (Prior)
Sensible Medical (Current Site PI)
Cardiac Profiles, Inc. (Prior)
Advisory Board:
Abbott/St Jude Medical (CardioMEMS)Medtronic (Polaris, Contractility Modulation System)

4/3/2017
2
What’s next?
If you think I know,
please see me afterwards
for a great deal on one of these:
How to prepare?
• Take great care of patients!
• Use clinical practice guidelines, AUC,
evidence-based tests and treatments
• Process improvement: Measure, change, re-
measure
• Focus on real descriptors of quality
• Embrace multidisciplinary, integrated teams of
care
Edward TA Fry, MD, FACC (http://www.acc.org/latest-in-cardiology/articles/2017/01/13/13/17/macra-how-to-prepare-for-the-unknown)

4/3/2017
3
• ACA = Affordable Care Act (“Obamacare”) (2010)
• MACRA = Medicare Access & CHIP Reauthorization Act (2015)
• SGR = Sustainable Growth Rate (1997)
• QPP = Quality Payment Program
• MIPS = Merit-based Incentive Payment System
• APM = Alternative Payment Models
• PQRS = Physician Quality Reporting Program
• VM = Value-Based Payment Modifier
• MACRA = Medicare Access & CHIP Reauthorization Act
– Passed in 2015 with SGR repealed
– Replaces SGR with QPP
– Bipartisan support
• SGR = Sustainable Growth Rate
– Prevent cost increase of physician payments from CMS
• QPP = Quality Payment Program
– Intended to create incentives for high-quality and cost-effective care:
– MIPS = Merit-based Incentive Payment System
– APM = Alternative Payment Models
• (A) MIPS = Merit-based Incentive Payment System– Combines PQRS, VBP, EHR incentives (meaningful use)
– Adds quality, resource use, advancing care information, and clinical practice improvement activities
– Quality (60%) – select 6 metrics with best fit to practice
– Advancing Care (25%) – replaces HER incentives
– Improvement Activities (15%) – Care coordination, engagement, patient safety, anticoagulation management improvement, etc.
– Cost (0%) – Postponed, comparison to peers
• 5% in 2017 will have small penalties (and rewards)
• Penalties/rewards will scale up over few years
• Low volume practices (~32% Medicare) exempt 2017 as only ~5% of spending
QPP = Quality Payment Program (A) or (B)
Reference: https://www.cms.gov/Medicare/Quality-Initiatives-Patient-Assessment-Instruments/Value-Based-Programs/
MACRA-MIPS-and-APMs/Resource-Use-Performance-Category-slide-deck.pdf

4/3/2017
4
Reference: https://www.cms.gov/Medicare/Quality-Initiatives-Patient-Assessment-Instruments/Value-Based-Programs/
MACRA-MIPS-and-APMs/Resource-Use-Performance-Category-slide-deck.pdf
Reference: https://www.cms.gov/Medicare/Quality-Initiatives-Patient-Assessment-Instruments/Value-Based-Programs/
MACRA-MIPS-and-APMs/Resource-Use-Performance-Category-slide-deck.pdf
ACC/AHA Proposed MIPS Metrics
• HF: ACEi/ARB for LVSD
• HF: BB for LVSD
• Cardiac rehab patient referral from outpatient
setting (CMS page doesn’t include HF*)
• CAD: Inappropriate stress testing after PCI
• Stress imaging outside AUC for asymptomatic,
low-risk patients
• AF/AFL: Chronic anticoagulationhttps://www.google.com/url?sa=t&rct=j&q=&esrc=s&source=web&cd=2&ved=0ahUKEwi4-_34hPXSAhUM3IMKHfXRBI8QFgghMAE&url=https%3A%2F%2Fwww.acc.org
%2F~%2Fmedia%2FNon-Clinical%2FFiles-PDFs-Excel-MS-Word-etc%2FTools%2520and%2520Practice%2520Support%2FAdvocacy%2520at%2520the%2520ACC%2FACC
%2520AHA%2520Proposed%2520Measures.pdf%3Fla%3Den&usg=AFQjCNHEErUde3Z7nEGwfS9v8efuHSBoEg
*https://qpp.cms.gov/measures/quality

4/3/2017
5
Metrics Listed on CMS Site
• HF/Depression– % of patients with diagnosis of Major Depressive Disorder
and HF with communication to physician treating HF
• Functional status assessments– % of patients 65+ with HF who completed initial and F?U
patient-reported functional status assessments
• ACEi/ARB for LVSD– % of patients >18 with HF and current or prior LVEF<40%
with ACEi or ARB within a 12 month period OR at D/C
• BB for LVSD– % of patients >18 with HF and current or prior LVEF<40%
with BB within 12 month period OR at D/C
https://qpp.cms.gov/measures/quality
• (B) APM = Alternative Payment Models
– Prioritizes patient-reported outcomes and
measures of patient perception and measurable
clinical outcomes
– Those who meet thresholds of participation are
exempt from MIPS (ESRD, oncology examples)
– Participation in coordinated care delivery models
and assume financial risk for outcomes
– Bonuses can exceed payment increases from MIPS
• Could this be to Part B what DRG was to Part A?
QPP = Quality Payment Program (A) or (B)
Reference: https://www.cms.gov/Medicare/Quality-Initiatives-Patient-Assessment-Instruments/Value-Based-Programs/
MACRA-MIPS-and-APMs/Resource-Use-Performance-Category-slide-deck.pdf

4/3/2017
6
Are we being properly incentivized?
• Analysis of 171 centers with 43,143 participants in GWTG-HF registry
• July 2008 – June 2011
• 49% centers had excess readmission ratio (HF-ERR)
• No difference between low and high risk-adjusted 30-day readmission groups in median adherence to all performance measures (95.7% vs96.5%) or median percentage of deficit-free care (90.0% vs 91.1%).
• Composite 1-year death or all-cause readmission was not different (median 59.1% vs 54.7%)
• 1-year mortality rates were lower among high versus low HF-ERR (median 28.2% vs 31.7%, p=0.07)
• Quality of care and clinical outcomes were comparable
• It is therefore not clear that the hospital readmission reduction program (HRPP) is improving care
Pandey A et al, JACC: HF 2016;4:935-46
Pandey A et al, JACC: HF 2016;4:935-46
• “This metric has driven our entire provider workforce to construct machinery designed to reduce short-term post-hospitalization utilization, while doing little to improve quality for the 5.7 million…with heart failure.”
• “The knowledge of our misdirection in responding to the mandate of this metric and the inaction in modifying it should be a call to action toward patient enablement in selecting clinical care metrics-ensuring that future metrics indeed speak to patients’ interests for improving their own care. It is time to consider a systemic shift in our approach to driving quality.”
• Flaws in the 30-day penalty– 1) 30-days is an arbitrary time frame without validity or relevance
• 77% of readmissions occurred >30 days after discharge (EVEREST, e.g.)
– 2) Incentive to delay care until after 30-day time period
– 3) More diligent follow-up may actually INCREASE hospitalizations, which may be medically appropriate
– 4) Disease-specific, ambulatory management may not generate sufficient ROI in relation to the short-term penalties
– 5) Disproportionate impact on sickest/most vulnerable populations
– 6) Competing risk of death
Konstam M, JACC HF 2017;4(12):935-6.

4/3/2017
7
What if mortality was weighted
equally?
• Patients who die within 30 days of ADHF are excluded from readmission metrics
• Financial penalties are ~10x greater for readmission than mortality
• 1963 hospitals from FY2014
– Readmission penalties closely tracked excess readmissions (r=0.81), but were minimally and inversely correlated with excess combined readmission and mortality (r=-0.12)
• Note that age-adjusted mortality rates for US patients with HF have increased at the same time 30-day readmission rates decreased (ref 10,13)
Abdul-Aziz AA et al, JAMA Cardiology 2017;2(2):200-203.
Date of download: 2/16/2017Copyright © 2017 American Medical
Association. All rights reserved.
From: Association Between Medicare Hospital Readmission Penalties and 30-Day Combined Excess
Readmission and Mortality
JAMA Cardiol. 2017;2(2):200-203. doi:10.1001/jamacardio.2016.3704
Readmission Penalty vs Concordance of Readmission and Combined Mortality and ReadmissionFor the readmission low, high combined mortality and readmission population, the ERRAgg was less than 1 and the ECORAgg was more than 1. For the readmission high, low combined mortality and readmission population, the ERRAgg was greater than 1 and the ECORAgg was less than 1. DRG indicates diagnosis-related group; ECORAgg, excess combined outcome ratio; ERRAgg, excess readmission ratio.
Figure Legend:
• Questions have been raised about the use of
risk-adjusted 30-day readmission rates to
serve as a metric of hospital quality
• Poor to no correlation between rates and care
quality
• Rates are largely driven by severity of
underlying condition and SES of the patients

4/3/2017
8
Readmission identified by CMS as a
way to reduce costs
Image: Pixabay.com
LOS of Medicare Patients Hospitalized
for HF, 1993-2006
P<.001
Bueno. JAMA. 2010;303(21):2141-47.
Mortality Rates
P<.001
Bueno. JAMA. 2010;303(21):2141-47.

4/3/2017
9
Mortality
Heidenreich. J Am Coll Cardiol 2010;56:362-8.
Risk Adjusted Trends:
Readmissions vs. Mortality
Heidenreich. J Am Coll Cardiol 2010;56:362-8.
How to Reduce Readmissions?

4/3/2017
10
“Bridge Clinic”Patients Hospitalizations ALOS
(d)
CMI % Cardiology
Involvement
Bridge 142 145 5.4 2.33 89%
Non-bridge 508 639 5.0 2.17 75.6%
Abbott Northwestern
Feb ‘16 through Feb ‘17
Discharges to home or home health
Follow-up within 5 days
Patients %CV F/U %PCP F/U 30-day
Readmits
PPR A/E
Bridge 142 100% 19.3% 13.5% 0.48
Non-bridge 508 10.2% 20.2% 22.8% 1.07
Role of Cognitive Impairment?
• 720 consecutive patients with HF hospitalization
• Mini-Cog
– RN asks patient to repeat 3 unrelated words, complete
clock drawing test, asks for recall 3 words
• 23% of cohort had cognitive impairment
• Poor performance was a predictor of composite
(readmission or mortality) – adjusted hazard ratio
1.90 (1.47-2.44, p<0.0001)
Patel A et al, Circ HF 2015
Adjunct therapies – Anemia
• 2278 patients with systolic HF and Hgb 9-12
g/dL to darbopoetin alfa to target Hgb >13
or placebo
• Outcome: composite of
all-cause mortality or
hospitalization for
worsening HF
Swedberg, K et al, NEJM 2013.

4/3/2017
11
Adjunct therapies – Iron
• Intravenous iron (CONFIRM-HF) for
symptomatic HF and iron deficiency
Ponikowski P et al, Eur Heart J 2014.
SGLT2 inhibitors & HF readmissions?
• EMPA-REG OUTCOME with empagliflozindemonstrated reduction in HF hospitalization and all-cause death in patients with T2DM and established CV disease
• Dapa-HF (NCT03036124)*
– 4500 adult patients, LVEF≤40%, NTproBNP≥600 pg/mL and eGFR ≥30 ml/min/1.73 m2
– Primary outcome: time to first occurence of CV death or hospitalization for HF or urgent HF visit (3 years)
*https://clinicaltrials.gov/ct2/show/NCT03036124
Kosiborod M et al, presented at ACC 2017https://www.acc.org/education-and-meetings/image-and-slide-gallery/media-detail?id=7f5d0c3c0a2343a3a04b16fc60a883fb

4/3/2017
12
Kosiborod M et al, presented at ACC 2017
Kosiborod M et al, presented at ACC 2017
Are readmissions a sign
of poor quality care?
Gorodeski EZ et al, NEJM 2010.

4/3/2017
13
Relationship between LOS & readmissions
• Retrospective analysis of adults admitted in
CA during 2008 (n=47,563)
• Association between LOS during index
hospitalization for HF and readmission within
7- and 30-days
• Simulated 1-day increase in LOS decreased
readmissions between 1-8%
Carey K and Lin M-Y, Med Care Res Rev 2013.
LOSRE-
ADMISSIONS
This is hard
• How do you define HF admissions?
– ICD-9 codes? (May include HF as
comorbidity, but not the key reason
for hospitalization)
– DRG codes? (Excludes primary HF admission if a
procedure such as PCI or ICD implant)
– Manually?
• Who pays to do all this work?
• What is the appropriate comparison?
– Accurate attribution of acuity of illness is hard

4/3/2017
14
HF Readmissions
• AHRQ National Readmission Database
• 36 million discharges from 21 states with
reliable numbers; 49.1% of total US
hospitalizations
• 301,892 index admissions with 64,264
readmits within 30 days
• LOS 5.3 days for both
Arora S et al, Am J Cardiol 2017
All Readmits
Readmits for HF
Arora S et al, Am J Cardiol 2017
Timing?
Etiologies of Readmissions
• Cardiac 49.8% (34.5% HF, 4.4% CAD, 4.3% Arr)
• Respiratory 13.1%
• Kidney/GU 8.9% (5.1% AKI on CKD)
• Infectious 8.1%
Arora S et al, Am J Cardiol 2017

4/3/2017
15
Predictors of Readmissions
• Diabetes 1.06 (1.03-1.08)
• Chronic pulmonary disease 1.13 (1.11-1.16)
• Renal failure 1.12 (1.10-1.15)
• Discharge to facilities 1.07 (1.04-1.09)
• Transfusion 1.12 (1.08-1.16)
• CCI≥2, LOS≥3 days
• Obesity 0.84 (0.82-0.86)
• Higher SES ~0.93 (0.90-0.96)
Arora S et al, Am J Cardiol 2017
Readmissions in HF Network Trials
• DOSE-AHF, CARRESS-HF, ROSE-AHF (n=744)
• 26% all-cause 30-day readmission/death
• Risk factors: elevated BUN, ACEi/ARB non-use,
lower baseline Na, non-white race, elevated
bicarbonate, lower SBP, depression, increased
LOS, and male sex
Vader JM et al, J Card Fail 2016
NP/RN Transitional Program
• Standardized stroke clinic
• Phase I – calling high risk <7 days and clinic <2-
4 weeks
• Phase II – all get 2-day RN call and NP <7-14
days
• 510 patients enrolled
• TSC visit 48% reduction in 30-day readmission
Condon C et al, Stroke 2016.

4/3/2017
16
Protocol-driven
allied health transition clinic
• 2 Visits: 1 week and 4-6 weeks
• 114 seen once, 80% came for 2nd visit
• HF NP and clinical pharmacist
• Physical exam, labs, medication education and reconciliation, medication adjustment and titration, and care coordination
• Average of 2.1 and 0.8 errors at visits 1 and 2
• Participants showed a 44% reduction in 30-day readmissions
Donaho EK et al, J Am Heart Assoc 2015.
Pharmacist counseling intervention?
• Randomized trial 851 (Vanderbilt and BWH)
• Medication reconciliation, inpatient
counseling, low-literacy adherence aids, and
phone follow-up
• No effect on time to first unplanned readmit
or ED visit but differed by site
• Adjusted HR 0.41 (0.17-1.00) in those with low
literacy
Bell SP et al, J Gen Intern Med 2016.
Multidisciplinary post-hospitalization
program
• Retrospective cohort, Greater LA VAMC (277)
• 6 clinic visits with PA, clinical pharmacist specialist, case manager, overseen by MD
• Focused on optimizing therapy, identifying etiology/exacerbating factors, medication titration, education, and medication adherence
• 9.0% vs 28.6% 90-day time to first HF readmit or all-cause mortality
• Adjusted HR 0.17 (0.07-0.41) with NNT of 7
Jackevivius CA et al, Ann Pharmacother, 2015

4/3/2017
17
Transitional Care Interventions –
Systematic Review & Meta-analysis• 47 trials
• High-intensity home-visit reduced all-cause readmission at 30-days (low SOE)
• Home-visits and MDS-HF reduced all-cause readmission over 3-6 months (high SOE)
• Home-visiting programs reduced HF-specific readmit and readmit or death (moderate SOE)
• Structured telephone support reduced HF-specific (high), but not all-cause readmits (moderate SOE)
• Neither telemonitoring or primarily educational interventions reduced readmission or mortality rates
Feltner C et al, Ann Intern Med 2014.
Multidisciplinary HF Clinics – Ontario
• 14,468 patients with 1,288 seen in HF clinics
Wijeysundera HC et al, Circ Heart Fail 2013
HF Clinic Non-HF Clinic p-value
Mortality (4 years) 52.1% 54.7% 0.02
Readmissions 87.4% 86.5% 0.009
HF-Readmits 58.7% 47.3% 0.001
CHAMPION - CardioMems• 64 centers, 550 patients, NYHA III
• Wireless implantable hemodynamic monitor versus usual care
• 83 vs 120 admits for HR 0.7 (0.6-0.84, p<0.0001) with device
Abraham WT et al for CHAMPION, Lancet 2011.
4/3/2017
18
CardioMEMS in practice
• First consecutive 2000 implants with ≥ 6m F/U
• Older (69.7 vs 61.6 years)
• More women (40% vs 28%)
• More HFpEF (34% vs 22%)*
Heywood et al, Circulation 2017. *EF only available in ~50% of 2000 patients
Blue = mPAP <25
Grey= 25< mPAP <35
Red= mPAP ≥35
Implantable PA Sensors and Cost
• US Medicare Claims Data of 1,114 patients with Cardiomems implant
• 1020 HFH in 6m prior
• 381 HFH, 139 deaths, and 17 VAD/Tx inin 6m after implant
• HR 0.55, 0.49-0.61
• 6-month comprehensive HF cost reduction of $7,433/patient
Desai AS et al, J Am Coll Cardiol 2017 [epub]
Age
Sex
Inpt/Outpt
Excluding death
Excluding death/VAD/Tx
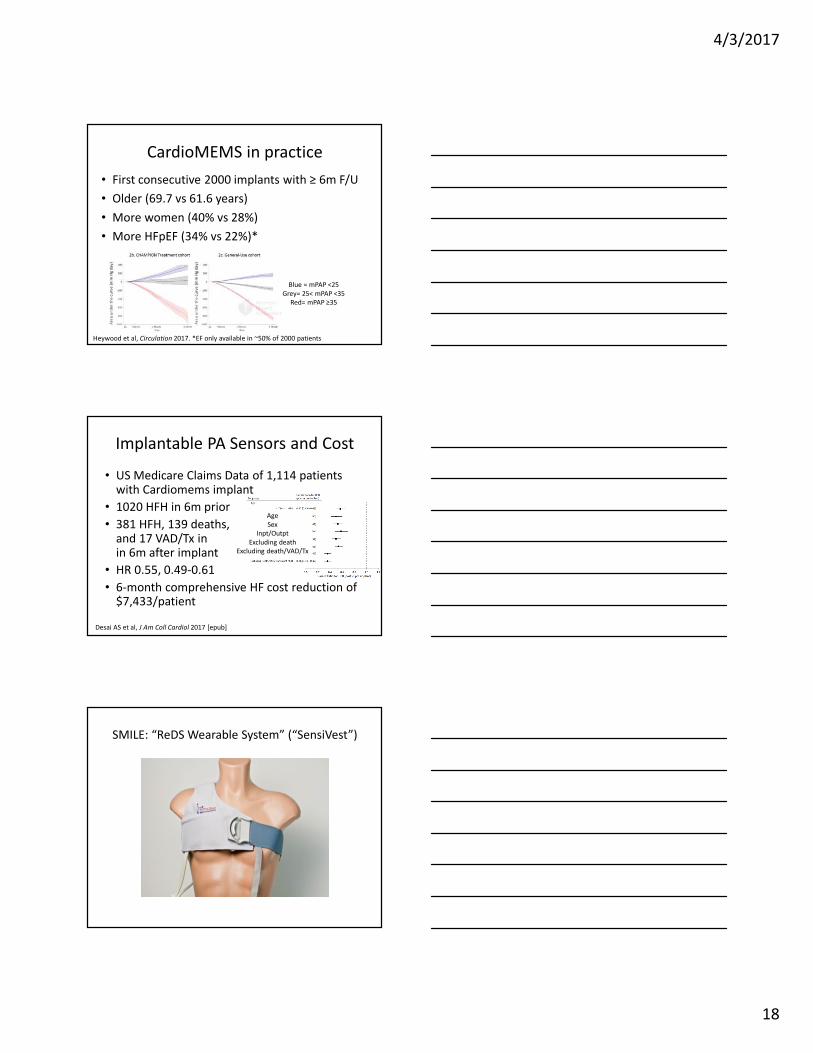
SMILE: “ReDS Wearable System” (“SensiVest”)

4/3/2017
19
ReDS Guided Management Reduced the Number of
Heart Failure Hospitalization Over 90 Days
0
2
4
6
8
10
12
14
16
Number of Heart Failure Hospitalizations (N = 50)
87%Reduction
78% Increase
3 months with
standard care
3 months WITH
Sensible vest
3 months back to
standard care
Pre vs. ReDS: P = 0.01
Post vs. ReDS: P = 0.037
15
2
9
Abraham WT et al, HFSA 2015
Example of ReDS Guided Management
Furosemide IV (coordinated with GP) addition to 200 mg Furosemide PO ▲
C
r
2.9 3.14
Discha
rge
2.82.76 2.72 2.68
Abraham WT et al, HFSA 2015
Health Economics & Program Evaluation –
Heart Failure Care Coordination 10/13/2015
Melissa Hutchison, TC Tong

4/3/2017
20
58Health Economics & Program Evaluation
1. Evaluation of cost effectiveness of care coordination
59Health Economics & Program Evaluation
Health Economics and Program Evaluation Framework
Logic Model
Describe program
Evaluation Design
Identify process and
impact measures
Economic Analysis
Determine cost-
benefit
Enables Decision-Making and Program Improvement
Heart Failure
Program
Committee, site-
based leaders
and/or physician
champions, and
staff to oversee
the program
Access to the EHR
and/or other
database
program(s)
Funding for Care
Coordinator,
office space,
training, patient
ed materials and
equipment
EHR build
capacity and
tracking/
reporting tools
Identify and
approach
appropriate patients
Provide in-person
patient education
Schedule follow-up
appointment(s)
Identify barriers
prior to discharge
and address
concerns
Improve optimal
care:
• Post-
discharge
follow-up
within 5 days
• Optimal
medication
therapy
• Timely
interventions
Increase
completed
follow-up visits
• Cardiac NP
/PA
• Primary care
• Cardiologist
Improve patient
self-
management
skills and
engagement
Improve
communication
between care
team across
settings
Improve patient
experience
Reduce length of
stay
Improve
consistency of
communication
between
patients and
care team
Reduce 30-day
readmissions
Reduce ED visits
and
hospitalizations
Increase survival
Reduce total
cost of care
Inputs/Resources
Care Coordinator Activities
Outcomes – Short Term
Outcomes – Intermediate and
Long Term
Outcomes – Intermediate and
Long Term
Care Coordinators provide consistent, coordinated and cost effective care to Allina Health patients with heart failure. Through ongoing relationship with
the patient/family, the Care Coordinator manages care between health care providers across the continuum to achieve patient goals and improve
outcomes.
Heart Failure Care Coordination Logic Model
v.20150916
Coordinate optimal
medication therapy
During hospitalization
Follow-up with
patients within 24-
48 hours of
discharge and at
least weekly until
stable, review
meds, diet, appts.,
and patient
concerns/goals
Attend follow-up
visit with patients
at cardiology clinic,
as able
Transition patients
from acute care
follow-up to self-
management
Availability for
cardiology
appointments
and 24/7 support
Identify patients
appropriate for
consults and
coordinate across
specialties
Assess self-
management skills
Coordinate
communication
among providers
Early assessment of
progressive or
urgent symptoms
and coordinate
appropriate
interventions
Enhance quality
of life
Increase
provider job
satisfaction
Multi-disciplinary
inpatient and
outpatient care
support and
resources
Improve
symptom
management in
alignment with
patient goals
Develop patient-
centered goals
Improve provider
efficiency
Post-discharge

4/3/2017
21
61Health Economics & Program Evaluation
Analysis Plan
2008 2009 2010 2011 2012 2013 2014 2015
AbbottApr -
Jun
Jan -
Apr
Apr -
Jun
Jan -
Apr
Mercy Full Year Full Year
UnitedJune 11
- May 12
Sept 13
- Aug 14
Unity Full Year Full Year
• Study population: patients flagged eligible for heart failure care coordination
• Comparison cohorts
• Treatment: post-implementation
• Controls: pre-implementation
• Additional interventions such as LOS, RARE, CDIP, and others occurred during timeframe between
treatment and control study period
Treatment
Controls
Start Date
62Health Economics & Program Evaluation
Data to be presented