Embed Size (px)
Citation preview
Clinical Medicine Journal
Vol. 3, No. 3, 2017, pp. 15-29
http://www.aiscience.org/journal/cmj
ISSN: 2381-7631 (Print); ISSN: 2381-764X (Online)
* Corresponding author
E-mail address: [email protected] (R. H. Kamel)
Heart Diseases Detection Based on Analysis and Diagnosis of Electrocardiogram Using Wavelet Transform and Prediction of Future Complications
Kamel Hussein RAHOUMA1, *, Rabab Hamed MUHAMMAD2, Hesham Fathi Ali HAMED1, Mona AbdelBaset ABO-ELDAHAB1
1Electrical Engineering Department, Faculty of Engineering, Minia University, Minia, Egypt
2Computer and System Engineering Department, Faculty of Engineering, Minia University, Minia, Egypt
Abstract
This paper aims to Analyze the heart electrocardiograph (ECG) to diagnose the heart performance and predict any future
complications. The authors utilize the MIT BIH database to obtain the original data. The discrete wavelet transform (DWT) is
used to decompose the ECG signal and to reconstruct it. The means of different performance measures of the heart
performance (QRS, RR, ST, QT, PR) are tested for their significance before comparing them to the limits of normal
performance. Any abnormal measure is used to diagnose the corresponding disease(s). Prediction techniques are used to expect
any future complications regarding the abnormal measure(s). Two methods of prediction are applied: the Linear Prediction
Method (LPM) and the Grid Partitioning and Fuzzy c-mean Clustering based on Neuro-Fuzzy prediction.
Keywords
Electrocardiograph (ECG), Heart Diseases Diagnosis, Wavelet Transform, Linear Prediction Method,
Grid Partitioning Method, Fuzzy c-mean (FCM), Neuro-Fuzzy (ANFIS)
Received: March 15, 2017 / Accepted: April 1, 2017 / Published online: November 1, 2017
@ 2017 The Authors. Published by American Institute of Science. This Open Access article is under the CC BY license.
http://creativecommons.org/licenses/by/4.0/
1. Introduction
For the time being, the computerized systems are one of the
most important systems for analyzing the biomedical
electrical signals. This has become very important especially
for understanding the real biological processes such as the
electrical activity signal of the heart (i.e.,
Electrocardiography or ECG) or the electrical activity signal
of the brain (i.e., Electroencephalograph or EEG) or the
electrical activity signal of the muscles (i.e.,
Electromyography or EMG). Computerized techniques have
many advantages in features extraction of the biomedical
signals and this helps in diagnosing the diseases of the
mentioned parts [1]. In this paper, we are interested in
diagnosing the heart diseases.
Diagnosing the heart diseases depends on processing its beats
information to extract some main features which are used in
the diagnosis. These features represent the bioelectric signal
generated by the processes of the repolarization and
depolarization of the heart. Thus, the accurate detection of
ECG depends on the values of atrial depolarization (P), the
distance between the start of atrial depolarization and the
start of ventricular depolarization (PR), the ventricular
depolarization (QRS complex), the temporary pause of the
ventricular electrical activity before repolarization (ST
segment), the ventricular repolarization (T wave) and the
ventricular activity repolarization and depolarization (QT

16 Kamel Hussein RAHOUMA et al.: Heart Diseases Detection Based on Analysis and Diagnosis of
Electrocardiogram Using Wavelet Transform and Prediction of Future Complications
segment). Figure (1) shows these values [1, 2].
Figure 1. The ECG signal and its features’ values.
Many researchers have suggested computerized techniques to
analyze the ECG signal and to diagnose the heart diseases.
These techniques have utilized different tools such as the
Neural Networks (NN), the Fuzzy Logic (FL), the Linear
Regression (LR), …., etc.
This paper uses these tools and combines them to analyze the
ECG, diagnose the heart diseases, and predict any future
complications. MATLAB software is used to simulate the
results and the MIT BIH database is used for the processed
data of the ECG.
The paper is composed of six sections. Section (1) gives an
introduction and section (2) discusses the previous work.
Section (3) explains the methodology of the research and
section (4) presents the results. Section (5) analyzes and
discusses the results and compares them to some algorithms
from the previous work. Section (6), highlights some
conclusions. Some of the used references are listed at the end
of the paper.
2. Previous Work
All previous research on ECG processing focuses on three
main stages for diagnosing the heart diseases. These are the
preprocessing, the extraction, and the diagnosing stages [2,3].
The preprocessing stage aims to remove the noise from the
original signal and reconstruct the signal values. This is
based on using quantized coefficient digital filters [4,5].
Discrete wavelet transform (DWT) is an effective technique
which is used for that purpose. It has excellent properties for
time-frequency resolution. This means that the signal can be
resolved in different frequency bands using different
coefficients. This technique will be discussed and used in this
paper [2, 6].
Many algorithms focus only on using QRS and/or R peaks
for diagnosing the heart diseases. These measures are
considered main features. Pan Tompkins suggested an
algorithm for microprocessor based real time QRS based on
the analysis of slope and amplitude of ECG signal where the
width of QRS is used to compute the energy which helps in
the diagnosis process [7, 8]
In [9], the authors described a Hilbert transform method for
QRS. They discussed how to locate R peaks using the first
differentiation of the ECG signal. The algorithm ciuld detect
the values of R, T and P with a high level of accuracy (e.g.,
99.8%).
In [10], the authors analyzed the ECG signal to detect QRS
accurately. They used the first derivative based method,
introduced by Hamilton-Tompkins with the Hilbert transform
method (HT) for QRS detection with improving the threshold.
The main target of this method is to reach the best performance
to detect the normality and abnormality of the beats.
In [11], the authors introduced a survey about the main
techniques of features’ extraction with different types of
algorithms of signal analysis. In [12], the authors discussed
six methods of features’ extraction of the ECG signal. The
authors concluded that Eigenvector technique is the best
method for performance analyze in the frequency domain.
Many algorithms have been proposed for prediction and
classification of the heart features. In [13], the authors
applied the fuzzy clustering algorithm (FCM) and used it for
classifying the data. In [14], the authors discussed the
prediction of ECG signal features based on neural network
using a new method of time series prediction based on
Linguistic fuzzy technique.
Adaptive filtering and morphology related analysis of time
domain were presented in [15]. Analysis of time domain and
frequency domain based on wavelet and other nonlinear
transforms were presented in [16-18]. The principal
component analysis (PCA) based on discrete wavelet
transform (DWT), and neural network classification were
presented in [19].
In this paper, we use, combine, and modify some of the
mentioned methods to study the heart performance
information of its beats and predict any future complications
in this performance.
3. Methodology of the Research
Our system is composed of three main units for the diagnosis
of heart diseases (e.g., the preprocessing, feature extraction,
and the diagnosis units) and a fourth unit is used to predict
any future complications. Figure (2) gives the system block
diagram of the system. The block diagram is briefly
described in the following subsections. Notice that our
analysis uses the MIT-BIH database [20].

Clinical Medicine Journal Vol. 3, No. 3, 2017, pp. 15-29 17
Figure 2. The system block diagram.
3.1. The Preprocessing Unit
The ECG recording is affected by different types of noise and
interference from other activities of the body. The signal is
passed through a series of filters to compute its DWT. The
signal threshold is important in denoising it. The main
functions and advantages of DWT are [21-24]:
a) Recovering the original signal from the noisy signal.
b) Analyzing the signal in time and frequency domain.
c) Representing the function in case it has discontinuities and
sharp peaks more efficiently than using only discrete Fourier
transform (DFT) .
The main procedures of this paper, based on DWT are:
a) Decompose the input signal by calculating the levels and
number of layers of the wavelet decomposition.
b) Use the soft thresholding method as follows:
1) Choose thresholds for wavelet quantization coefficients.
2) Use a threshold for each level of the wavelet to remove
every value of coefficient above of threshold value.
c) Use the inverse discrete wavelet (IDW) to reconstruct the
signal for the decomposition levels [25].
In the following, we explain these processes.
1) Signal decomposition:
The decomposition process is based on the coefficients of the
wave let (i.e., the details coefficients which are extracted
from the high pass filter coefficients and approximation
coefficients which are extracted from the low pass filter
coefficients), according to equation (1). The signal is
processed by dividing the frequency by 2n times where n is
the number of levels. In this paper, we use four levels of
decomposition as shown in figure (3).
DWT (m,k)=��∑ �������� �� �� � (1)
Where s(n) is the ECG original signal, (a,b) are scaling
parameters, m is decomposition level, ��. � is the mother
wavelet function and N is number of sampling.
Figure 3. The decomposition process.
2) Thresholding:
We obtain the threshold from the following equation:
T=��2 log� (2)
where T is the threshold, � is the standard deviation of noise
and N is number of samples. [26].
3) The signal reconstruction:
The signal reconstruction is the inverse process of the signal
decomposition process and it also needs the same number of
levels which are used in the decomposition process.
This is done by using inverse discrete wavelet transform
(IDWT) of equation (1). Using a simple description, it is

18 Kamel Hussein RAHOUMA et al.: Heart Diseases Detection Based on Analysis and Diagnosis of
Electrocardiogram Using Wavelet Transform and Prediction of Future Complications
upsampled by 2n (where n is the number of stages) to obtain
the approximation and detail coefficients. Then, the
approximation and detailed coefficients are added after
passing them in a low pass filter and in a high pass filter as
shown in figure (4) [19, 26].
Figure 4. The reconstruction process.
3.2. The Features Extraction Unit
This unit consists of two sub-units:
a) The features extraction sub-unit:
The main target of this sub-unit is to extract all features of
the ECG signal (RR,QRS,PR,ST,QT). We extract the heart
performance features according to the algorithm(s) which
will be discussed in a later section [3].
b) Significance test sub-unit:
The obtained feature’ means are tested for significance to
help us to determine if the computed means can be
significantly used to diagnose the heart performance or not.
This is done by computing the z-test value, based on the
mean and standard deviation ratio (equation 3-a). Referring
to the normal distribution table, we can obtain the table z0
value. The computed and the tabulated z values are compared
for significance. If the computed z value lies between the
minus and positive tabulated values (equation 3-b), it
indicates the significance of the mean value. The confidence
levels and tabulated z values are shown in figure (5) [27].
� � ���/√� (3-a)
! " �# $⁄ & �√�' ( ) ( ! * �# $⁄ & �√�' (3-b)
Where + is population mean value, , is the standard
deviations,n is length of data (feature),.//! the mean value of
features for test it.
1) For a 90% confidence interval:01 2⁄ � 3. 456
2) For a 95% confidence interval:01 2⁄ � 3. 74
3) For a 99% confidence interval:01 2⁄ � 2. 68
Figure 5. Confidence interval.
3.3. The Diagnosis Unit
In this unit, the features’ values, which were obtained in the
extraction unit, are compared to some limits to determine if
they are normal or not. In case, there is any one of these
values which is abnormal, we can interpret this abnormality
by diagnosing a corresponding disease. Table (1) gives the
limit values of the heart features and the different diseases
values are given in table (2) [28]. The algorithm of
diagnosing the heart diseases based on its obtained features’
values is given in a separate coming section [3, 29].
Table 1. The normal standard values of features.
Name of Feature wave Standard normal value (ms)
RR 0.6-1.2
ST 0.08-0.12
QRS 0.08-0.12
PR 0.12-0.2
QT 0.42-0.65
3.4. Prediction Unit
It is important not only to diagnose the heart diseases but also
to predict any complications in the future. Different
remarkable prediction methods have been proposed to predict
and classify the future features’ values and consequently
predict any future complications. From these methods, we
discuss and apply: the linear prediction coding (LPC), the
Grid partitioning method (GPM) and Fuzzy c-mean

Clinical Medicine Journal Vol. 3, No. 3, 2017, pp. 15-29 19
Clustering based on Neuro-Fuzzy prediction method [30-32].
Comparing the three methods, we got almost similar results.
3.4.1. Linear Prediction Coding Method
(LPC)
In LPC, predication of the future (estimated value is
computed through a linear combination of the present value
and history values. The formula of the estimated value is
[33]:
E(X(n+1))= -∑ a:X�n " i�>: � (4)
Table 2. The Features of some heart diseases.
Name of diseases Rate PR QRS
Atrial Fibrillation >350 Absent Normal but may be widened
Ventricular Tachycardia (100-250 bpm) Not-measurable Wide (>0.10 sec)
1stDegree Heart Block The underlying rate Prolonged (>0.20 sec) Normal (0.06-0.10 sec)
Supraventricular Tachycardia Fast (150-250 bpm) Normal (0.12 sec) Normal (.10 sec)
Bundle Branch Block The underlying rate Normal (0.12-0.20 sec) Wide (>0.12 sec)
Sinus Bradycardia Slow (< 60 bpm) Normal (0.12-0.20 sec) Normal (0.06-0.10 sec)
Multifocal Atrial Tachycardia (>100 bpm) Variable Normal (0.06-0.10 sec)
Suppose that we want to predict the sample value x(n+1) using a
linear combination of the points, x(n), x(n-1), x(n-2),….., x(n-N)
which represent the present and hisotry sample values
respectively. It is important to mention here that the estimated
sample value {E(X(n+1))} and the actual computed future value
{X(n+1)} are generally not equal. This can be interpreted as a
prediction error. The formula gives this error as:
Err(X(n+1))={X(n+1)- E(X(n+1))}/X(n+1) (5)
Where X(n+1) is the actual next value and E(X(n+1)) is
predicted one. Notice that, we use the first 80% from the data
set for training of equation (4) till the ai coefficients are
determined. The rest 20% of the data set are then used to
predict the future values. This is repeated for all the features.
The prediction LPC algorithm which is applied in our work is
given below.
3.4.2. Grid Partitioning (GP) Method
This method is based on Takagi–Sugeno (T.S.) adaptive
neuro-fuzzy inference system (ANFIS) of prediction. ANFIS
model is composed of if-then rules as well as couples of
input-output. In the ANFIS architecture, both artificial
network and fuzzy logic are used. Also, the algorithms of
training and learning of the neural networks are applied. The
fuzzy systems present problems such as:
1) The if-then rules must be determined which is a problem
of experience and knowledge acquisition and it is also time
consuming.
2) The Fuzzy set is determined by what is called the
membership function which has its own parameters and these
parameters need to be determined. ANFIS learns the rules
and membership functions from the used data. Fuzzy
partitioning is a technique used for producing fuzzy sets
which represent the underlying data. There are three fuzzy
partitioning methods. These are the grid partitioning, tree
partitioning, and scatter partitioning. In our work, we use the
grid partitioning based on ANFIS prediction Takagi–Sugeno
Fuzzy technique.
The grid partitioning is done by dividing the input area into
different fuzzy slices, each of them is used by a membership
function to estimate the feature value. The grid partitioning
model is of Sugeno fuzzy design that's implemented into the
neuro-fuzzy systems [34].
ANFIS has a training step by using the I/O data and back-
propagation algorithm or hybrid learning algorithm.
The general ANFIS adaptive network is a network of nodes
and directional links, associated with a learning mechanism
(e.g. back propagation mechanism). The ANFIS networks
learn the relationship(s) between the input(s) and output(s)
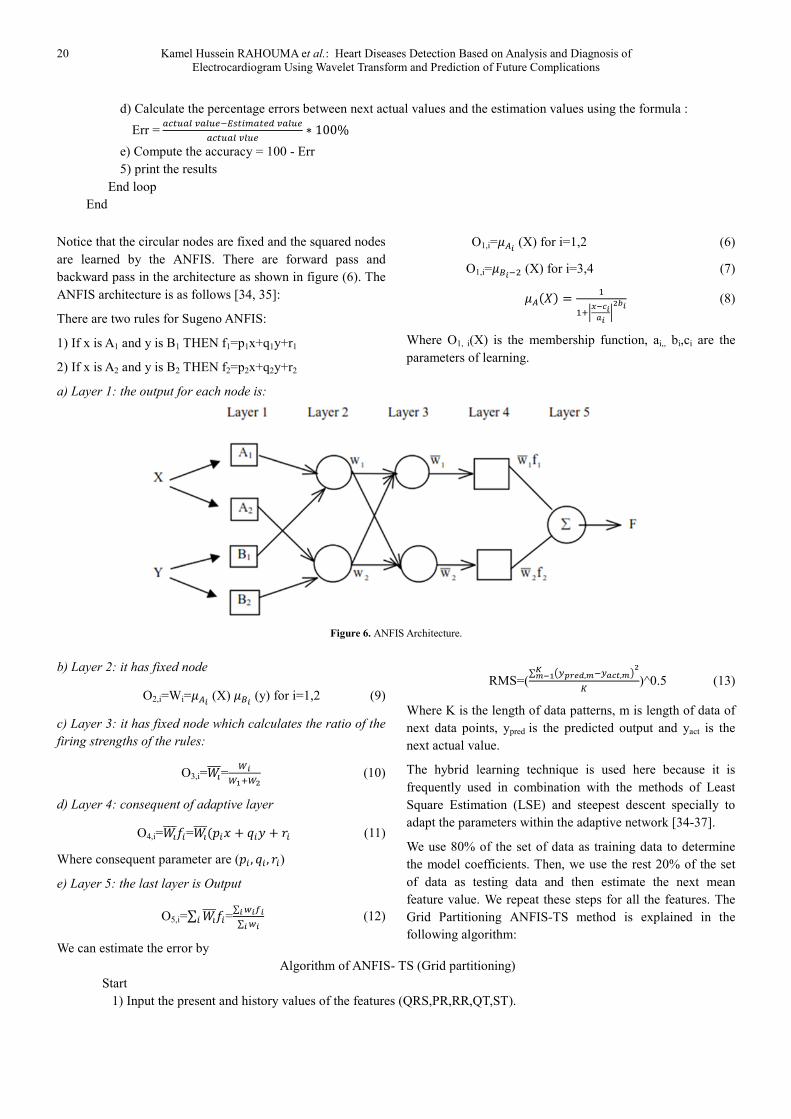
using one of the many available approaches [34]. Figure (6)
introduces the ANFIS architecture.
The prediction LPC algorithm
Algorithm of LPC
Start
1) Input the present and history values of the features (QRS,PR,RR,QT,ST).
2) For each feature do the following:
Start looop
a) Use 80% of data to determine the coefficients of equation (4).
b) Use the rest 20% of data to estimate the future value of the feature.
c) Extract the next actual value of the feature.
20 Kamel Hussein RAHOUMA et al.: Heart Diseases Detection Based on Analysis and Diagnosis of
Electrocardiogram Using Wavelet Transform and Prediction of Future Complications
d) Calculate the percentage errors between next actual values and the estimation values using the formula :
Err =�?@A�BC�BADEF@GH�@DIC�BAD�?@A�BCBAD ∗ 100%
e) Compute the accuracy = 100 - Err
5) print the results
End loop
End
Notice that the circular nodes are fixed and the squared nodes
are learned by the ANFIS. There are forward pass and
backward pass in the architecture as shown in figure (6). The
ANFIS architecture is as follows [34, 35]:
There are two rules for Sugeno ANFIS:
1) If x is A1 and y is B1 THEN f1=p1x+q1y+r1
2) If x is A2 and y is B2 THEN f2=p2x+q2y+r2
a) Layer 1: the output for each node is:
O1,i=)NO (X) for i=1,2 (6)
O1,i=)PO$ (X) for i=3,4 (7)
)N� � � ��QRSTUOVO R
WXO (8)
Where O1, i(X) is the membership function, ai,, bi,ci are the
parameters of learning.
Figure 6. ANFIS Architecture.
b) Layer 2: it has fixed node
O2,i=Wi=)NO (X) )PO (y) for i=1,2 (9)
c) Layer 3: it has fixed node which calculates the ratio of the
firing strengths of the rules:
O3,i=YZ[[[= \O\]Q\W (10)
d) Layer 4: consequent of adaptive layer
O4,i=YZ[[[ G=YZ[[[�_G` * aGb * cG (11)
Where consequent parameter are (_G , aG , cG) e) Layer 5: the last layer is Output
O5,i=∑ YZ[[[ GG =∑ eOfOO∑ eOO
(12)
We can estimate the error by
RMS=(∑ ghijkl,mhVUn,moWpmT]
q )^0.5 (13)
Where K is the length of data patterns, m is length of data of
next data points, ypred is the predicted output and yact is the
next actual value.
The hybrid learning technique is used here because it is
frequently used in combination with the methods of Least
Square Estimation (LSE) and steepest descent specially to
adapt the parameters within the adaptive network [34-37].
We use 80% of the set of data as training data to determine
the model coefficients. Then, we use the rest 20% of the set
of data as testing data and then estimate the next mean
feature value. We repeat these steps for all the features. The
Grid Partitioning ANFIS-TS method is explained in the
following algorithm:
Algorithm of ANFIS- TS (Grid partitioning)
Start
1) Input the present and history values of the features (QRS,PR,RR,QT,ST).

Clinical Medicine Journal Vol. 3, No. 3, 2017, pp. 15-29 21
2) For each feature do the following:
Start a loop
a) Apply the "Grid partitioning" MATLAB function with the data set of the feature.
b) Select the parameter of Grid partitioning function:
1) Choose the membership function (MF) of our design.
2) Select the type of input function ( Gaussian )
3) Select the type of input function (linear).
c) To train ANFIS structure, insert the important parameters for this structure:
1) Select type of optimization (Hybrid)
2) Choose the number of epochs.
3) Compute the error
Err=�?@A�BC�BADEF@GH�@DIC�BAD�?@A�BC�BAD ∗ 100%
4) calculate accuracy
5) Compute the accuracy = 1 - Err
d) Print the results
End Loop
End
3.4.3. ANFIS Fuzzy Clustering Mean (FCM)
Prediction
The FCM is used in ANFIS to improve its performance by
classifying data into sets depending on the degree of the
member function of each of them. The FCM uses the fuzzy
techniques based on K-means and it divides the spaces into a
set of chosen clusters, each of them has a corresponding
centroid. In this case, all elements of feature space belong to
all clusters with different degrees [30, 38]. The FCM
algorithm is described as follows:
1) Determine the clusters after partitioning the data into
fuzzy groups where the vector of data xi=1,2,…n
2) Determine the center of each cluster ci=1,2,….c
3) Determine the membership function from [38]:
+rs = 3∑ (trs tusv )2 wT3xyuz3
(14)
4) Determine the objective function from [38]:
J (U, C1, C2,..., Cc) =∑ {G = ∑ .∑ )G|H}G|$?G �?G �?G � (15)
Where i=[1,2,..,c] is the number of clusters selected from
data points n,j is number of object m∈[1,∞],)G|the member
function in object j and cluster i, and dij=��G − |� is the
Euclidean distance between ci,xj.
5) Compute the new c-fuzzy cluster from [38]:
�G = ∑ �O�m��U�z]∑ �O�mU�z]
(16)
FCM algorithm will be used to obtain the accurate prediction
value of next feature based of ANFIS as given by the
following algorithm:
Algorithm of ANFIS- FCM (Fuzzy C-mean )
Start
1) Input the present and history values of the features (QRS,PR,RR,QT,ST).
2) For each feature do the following:
Start a loop
a) Apply "FCM" MATLAB function and determine the parameter of FCM function as follows:
1) Choose the number of clusters.
2) Choose number of iteration.
3) Choose Partition Matrix Exponent.
4) Choose the minimum value of improvement
b) To train ANFIS structure use the first 80% of the data and:
1) Select the type of optimization (Hybrid)
2) Choose the number of epochs.
3) Estimate the predicted value using the rest 20% of data.

22 Kamel Hussein RAHOUMA et al.: Heart Diseases Detection Based on Analysis and Diagnosis of
Electrocardiogram Using Wavelet Transform and Prediction of Future Complications
4) Calculate the actual next value
5) Compute the error as follows:
Err =�?@A�BC�BADEF@GH�@DIC�BAD�?@A�BC�BAD ∗ 100%
6) Calculate the accuracy = 100 – Err.
7) Print the results.
End Loop
End
Accuracy of this method is found 99% - 100% for all features (RR,PR, ST, QRS, QT).
3.5. The Whole System Algorithm
The block diagram, given in figure (2), is programmed using MATLAB and the user is given the chance to choose the method
of prediction. In the following, the general algorithm of the system is described and figure (7) gives the corresponding flow
chart.
Main algorithm of System block diagram
Start
1) Read the samples from the MIT database file and divide them in periods corresponding to one minute each.
2) For each period of samples, apply the DWT as it was explained in the preprocessing section above.
3) The values of P, Q, R, S, and T are extracted as follows:
a) The peak R is taken as a reference for the signal detection with a threshold of 60%.
b) The position of the peak R is taken as a reference for the following peaks of (Q, P,R,S,T) [3].
4) Extract the features values.
5) Compute the averages of the feature values.
6) Test for significance of the means of the feature values.
7) Use the significant means of the feature values to diagnose the heart performance.
Notice that the MIT database is using a sampling frequency of 120 s/sec. Thus, the sampling period Ts=1/Fs [21].
8) For all the features, compare the feature values to their limit values according to table (1).
9) If heart features’ values are within the limits, then the heart performance is normal.
10) If the heart features values are out of the limits, they are abnormal.
11) For each abnormal feature:
a) Determine the corresponding disease according to table (2).
b) Choose the prediction methods (LPC,ANFIS-FCM or ANFIS-TS) to estimate its future value.
c) Compute the next actual values of the features and calculate the errors and accuracies of prediction.
12) Print the results
End

Clinical Medicine Journal Vol. 3, No. 3, 2017, pp. 15-29 23
Figure 7. The system flow chart.

24 Kamel Hussein RAHOUMA et al.: Heart Diseases Detection Based on Analysis and Diagnosis of
Electrocardiogram Using Wavelet Transform and Prediction of Future Complications
4. Results
In this section, we present the results which were obtained based on the previous sections. For that purpose, the MATLAB
2016a is used to write and run a code corresponding to the general system algorithm. The following initial data are used for
running the code and obtaining the results.
1) The original heart performance data are taken from the MIT HIB database. We used 1000000 samples, with a sampling
frequency of 250 samples per second. We divided the samples in groups, each of them corresponds to 10 minutes, such that we
process the samples of the first minute (15000 samples) of the period and hold the results on the screen for the remaining 9
minutes. Figure (8) shows a train of samples of the used data.
2) The ECG samples are processed using DWT as explained in pervious sections and the results are shown in figures (9,10).
3) The main peaks of (Q,R,S,T,P) are extracted as shown in figure (11).
4) The obtained means of the features are tested for significance as shown in table (3).
5) The mean values are compared to the normal limits of the heart performance given in table (1).
6) From the obtained values of the features, we notice that PR is abnormal (according to table (1). Thus, the corresponding
disease from table (2) is "Multifocal Atrial Tachycardia".
7) For the abnormal feature PR, we applied the prediction methods as described before to expect any future complications. We
applied three methods: the LPM and the GPM,FCM based on TAP. The results of the two methods are shown in figures (12 –
16).
8) To collect all the results and figures on the screen to help doctors to follow up the patient situation, we designed a Guide
User Interface (GUI) as shown in figure (17).
Table 3. Results of the features detections.
Features Mean values Significant _estimation %
RR 0.45 99.5%
ST 0.24 97.5%
QRS 0.08 95.05%
PR 0.35 97.5%
QT 0.32 95.05%
Figure 8. Original sampled signal.

Clinical Medicine Journal Vol. 3, No. 3, 2017, pp. 15-29 25
Figure 9. Reconstructed signals at levels of figure (4).
Figure 10. Base line corrected with smoothing signal.
Figure 11. Peaks detection.

26 Kamel Hussein RAHOUMA et al.: Heart Diseases Detection Based on Analysis and Diagnosis of
Electrocardiogram Using Wavelet Transform and Prediction of Future Complications
Figure 12. Results of the three prediction methods in regard with the RR feature.
Figure 13. Results of the three prediction methods in regard with the PR feature.
Figure 14. Results of the three prediction methods in regard with the QRS feature.
Figure 15. Results of the three prediction methods in regard with the QT feature.

Clinical Medicine Journal Vol. 3, No. 3, 2017, pp. 15-29 27
Figure 16. Results of the three prediction methods in regard with the ST feature.
Figure 17. GUI of the heart diagnoses and prediction figures.
5. Analysis and Discussion
Our discussion here is done in two parts: a) discussion of the
results and b) comparing our results with other results from
the previous work.
5.1. Discussion of the Results
The original heart performance data are taken from the MIT
HIB database. We used 1000000 samples, with a sampling
frequency of 250 samples per second. We divided the samples
in groups, each of them corresponds to 10 minutes, such that
we draw the beats and process them in the first minute (15000
samples) of the period and hold the results on the screen for
the remaining 9 minutes. This gives the doctors a chance to
read the results and they can change the scale of the drawings
to see them more clearly. The GUI includes all the results in
values and drawings, as shown in figure (17). This includes the
different present and predicted features’ values.
The wave let transform is used to decompose and reconstruct
the signal. It gives low pass and high pass filter coefficients.
The signal details coefficients are extracted from the high
pass filter coefficients and the signal approximation
coefficients are extracted from the low pass filter
coefficients. This means that the wave let transform is an
excellent tool for time and frequency domain analyses.
The means of the obtained values are tested for significance
28 Kamel Hussein RAHOUMA et al.: Heart Diseases Detection Based on Analysis and Diagnosis of
Electrocardiogram Using Wavelet Transform and Prediction of Future Complications
before using them in the diagnosis process. High confidence
levels are obtained for RR = 99.5%, QRS = 95.05%, ST =
97.5%, PR = 97.5%, QT = 95.05%. This assures the validity
and reliability of the analysis and diagnosis.
The obtained mean values RR, QRS and PR are used for
diseases diagnosis. The results show that these values are
abnormal and this means we need to apply the prediction
techniques to predict any future complications. The other two
features St and QT are also found abnormal which assures
that the used data are taken from a patient. The heart rate is
computed using RR as: 60/RR = 133.33 bpm. Looking at
table (2), we notice that this value is greater than 100 bpm
which means that the patient has a “Ventricular Tachycardia”.
Also the computed rate may be taken for the "Multifocal
Atrial Tachycardia". The value of PR can’t be measured for
the first disease and it is variable for the second disease.
Thus, we conclude that the patient has a "Multifocal Atrial
Tachycardia". This conclusion is confirmed by the result of
QRS (=0.08) which is in the range (0.06 – 0.1).
For the abnormal feature PR, we applied the prediction
methods (LPC, GPM and FCM based on TAP). The results of
the three methods are shown in figures (12 – 16). From these
figures, we notice that they change closely, and give very close
values, except in the start (the first processing period) where
no history points are available for the prediction process.
The prediction process divided the data into two parts: 80%
from the data is used for training and 20% is used for testing.
The accuracy of the features mean values of PR, QRS, ST,
and QT are found to be between 97 to 100%.
We can conclude from the results that for a big change on the
RR interval, The LPC prediction algorithm is found to be the
best accurate one.
5.2. Comparison of the Results with the
Previous Work Results
In [3], the analysis of ECG signal is based on only the value
of ST while our results take the values of RR, PR, and QRS
into consideration. When we applied the same technique of
[3], the value of ST was found normal while it is found in our
results to be abnormal and its confirmed by the value of
QRS. We could reach the same conclusion of the abnormality
of ST by using the technique of [39].
We agree with [39] in using the same concepts and values of
RR, PR, and QRS to diagnose the heart diseases. Our results
agree with the its results of the means of features but we
added to the detection operation two steps: the first is to test
the significance of the mean values, and the the second is to
predict any future complications using the LPC, GPM and
FCM based on TAP methods.
6. Conclusion
This paper aimed to analyze the heart electrocardiograph
(ECG) to diagnose the heart performance and predict any
future complications. The MIT BIH database is used to obtain
the original data. The discrete wavelet transform (DWT) is
used to decompose the ECG signal and to reconstruct it. The
means of different performance measures of the heart
performance (QRS,RR,ST,QT,PR) are tested for their
significance before comparing them to the limits of normal
performance. Any abnormal measure is used to diagnose the
corresponding disease(s). The Linear Prediction Coding
(LPC), the Grid Partitioning and Fuzzy c-mean Clustering
based on Neuro-Fuzzy prediction are used for prediction. High
confidence levels are obtained for significance. This assure the
validity and reliability of the analysis and diagnosis. Our
results showed that the patient suffered from a "Multifocal
Atrial Tachycardia" disease. This is different from the results
of some previous work [3, 23] and matching with the results of
another pervious work [39]. The three used prediction methods
give very close values but for a big change in RR interval, the
LPC method is the best accurate one.
References
[1] Hernández, A. I., Dumont, J., Altuve, M., Beuchée, A., & Carrault, G. (2012). Evolutionary Optimization of ECG Feature Extraction Methods: Applications to the Monitoring of Adult Myocardial Ischemia and Neonatal Apnea Bradycardia Events. In ECG Signal Processing, Classification and Interpretation (pp. 237-273). Springer London
[2] Gupta, R., Mitra, M., & Bera, J. (2014). ECG Signal Analysis. In ECG Acquisition and Automated Remote Processing (pp. 15-49). Springer India.
[3] Vidya, M. J., & Kavya, D. (2013). Analysis of ECG Signal Using Matlab for the Detection of Ischemia. International Journal of Innovative Research and Development ISSN 2278–0211, 2(4), 308-319.
[4] Pal, S., & Mitra, M. (2010). Detection of ECG characteristic points using multiresolution wavelet analysis based selective coefficient method. Measurement, 43(2), 255-261.
[5] Hamilton, P. S. (1996). A comparison of adaptive and nonadaptive filters for reduction of power line interference in the ECG. IEEE transactions on biomedical engineering, 43(1), 105-109.
[6] Banerjee, S., Gupta, R., & Mitra, M. (2012). Delineation of ECG characteristic features using multiresolution wavelet analysis method. Measurement, 45(3), 474-487.
[7] Lourenço, A., Silva, H., Leite, P., Lourenço, R., & Fred, A. L. (2012, February). Real Time Electrocardiogram Segmentation for Finger based ECG Biometrics. In Biosignals (pp. 49-54).
[8] Trahanias, P. E. (1993). An approach to QRS complex detection using mathematical morphology. IEEE Transactions on Biomedical Engineering, 40(2), 201-205.

Clinical Medicine Journal Vol. 3, No. 3, 2017, pp. 15-29 29
[9] Benitez, D., Gaydecki, P. A., Zaidi, A., & Fitzpatrick, A. P. (2001). The use of the Hilbert transform in ECG signal analysis. Computers in biology and medicine, 31(5), 399-406.
[10] Arzeno, N. M., Deng, Z. D., & Poon, C. S. (2008). Analysis of first-derivative based QRS detection algorithms. IEEE Transactions on Biomedical Engineering, 55(2), 478-484.
[11] Karpagachelvi, S., Arthanari, M., & Sivakumar, M. (2010). ECG feature extraction techniques-a survey approach. arXiv preprint arXiv:1005.0957.
[12] Vaneghi, F. M., Oladazimi, M., Shiman, F., Kordi, A., Safari, M. J., & Ibrahim, F. (2012, February). A comparative approach to ECG feature extraction methods. In Intelligent Systems, Modelling and Simulation (ISMS), 2012 Third International Conference on (pp. 252-256). IEEE.
[13] De Sarkar, S. C., Chattopadhyay, S., & Pratihar, D. K. (2011). A comparative study of fuzzy c-means algorithm and entropy-based fuzzy clustering algorithms.
[14] Volna, E., Kotyrba, M., & Habiballa, H. (2015). ECG Prediction Based on Classification via Neural Networks and Linguistic Fuzzy Logic Forecaster. The Scientific World Journal, 2015.
[15] Mazomenos, E. B., Chen, T., Acharyya, A., Bhattacharya, A., Rosengarten, J., & Maharatna, K. (2012, March). A time-domain morphology and gradient based algorithm for ECG feature extraction. In Industrial Technology (ICIT), 2012 IEEE International Conference on (pp. 117-122). IEEE.
[16] Li, C., Zheng, C., & Tai, C. (1995). Detection of ECG characteristic points using wavelet transforms. IEEE Transactions on biomedical Engineering, 42(1), 21-28.
[17] Saxena, S. C., Kumar, V., & Hamde, S. T. (2002). Feature extraction from ECG signals using wavelet transforms for disease diagnostics. International Journal of Systems Science, 33(13), 1073-1085.
[18] Martínez, J. P., Almeida, R., Olmos, S., Rocha, A. P., & Laguna, P. (2004). A wavelet-based ECG delineator: evaluation on standard databases. IEEE Transactions on biomedical engineering, 51(4), 570-581.
[19] Martis, R. J., Chakraborty, C., & Ray, A. K. (2009, December). An integrated ECG feature extraction scheme using PCA and wavelet transform. In India Conference (INDICON), 2009 Annual IEEE (pp. 1-4). IEEE.
[20] https://www.physionet.org/physiobank/database/mitdb
[21] Khan, M. I., Hossain, M. B., & Uddin, A. N. (2013, May). Performance analysis of modified zero crossing counts method for heart arrhythmias detection and implementation in HDL. In Informatics, Electronics & Vision (ICIEV), 2013 International Conference on (pp. 1-6). IEEE.
[22] Abo-Zahhad, M. (2011). ECG signal compression using discrete wavelet transform. Discrete Wavelet Transforms-Theory and Application, 143-168.
[23] Vidya, K. S., Acharya, U. R., Ghista, D. N., Lim, W. J. E., Molinari, F., & Sankaranarayanan, M. (2015). Computer-aided diagnosis of diabetic subjects by heart rate variability signals using discrete wavelet transform method. Knowledge-based systems, 81, 56-64.
[24] Griswold, N. C., Mathur, S. S., Yeary, M., & Spencer, R. G.
(2000). Wavelet decomposition/reconstruction of images via direct products. Journal of Electronic Imaging, 9(1), 61-71.
[25] Kabir, M. A., & Shahnaz, C. (2011, November). An ECG signal denoising method based on enhancement algorithms in EMD and wavelet domains. In TENCON 2011-2011 IEEE Region 10 Conference (pp. 284-287). IEEE
[26] Kaur, M., & Kaur, G. (2015). Adaptive Wavelet Thresholding for Noise reduction in Electrocardiogram (ECG) Signals. International Journal of Computer Science and Network Security (IJCSNS), 15(4), 100.
[27] Olsson, U. (2000). Confidence intervals for the mean of a log-normal distribution. Swedish University of Agricultural Sciences.
[28] http://www.practicalclinicalskills.com/ekg-reference-guide
[29] Mannurmath, J. C., & Raveendra, M. (2014). MATLAB Based ECG Signal Classification. International Journal of Science, Engineering and Technology Research (IJSETR), 3(7).
[30] Dallali, A., Kachouri, A., & Samet, M. (2011). Fuzzy c-means clustering, Neural Network, wt, and Hrv for classification of cardiac arrhythmia. ARPN Journal of Engineering and Applied Sciences, 6(10), 2011.
[31] Viswanath, C., & Valliyammai, C. (2012, March). CPU load prediction using ANFIS for grid computing. In Advances in Engineering, Science and Management (ICAESM), 2012 International Conference on (pp. 343-348). IEEE.
[32] Abhinav-Vishwa, M. K., Lal, S. D., & Vardwaj, P. (2011). Clasification of arrhythmic ECG data using machine learning techniques. International Journal of Interactive Multimedia and Artificial Intelligence, 1(4).
[33] Loong, J. C., Subari, K. S., Besar, R., & Abdullah, M. K. (2010). A new approach to ECG biometric systems: a comparative study between LPC and WPD systems. World Academy of Science, Engineering and Technology, 68(20), 759-764.
[34] Jin, X. B., Wang, J. F., Zhang, H. Y., & Cao, L. H. (2013). ANFIS model for time series prediction. In Applied Mechanics and Materials (Vol. 385, pp. 1411-1414). Trans Tech Publications.
[35] Nazmy, T. M., El-Messiry, H., & Al-Bokhity, B. (2010, March). Adaptive neuro-fuzzy inference system for classification of ECG signals. In Informatics and Systems (INFOS), 2010 The 7th International Conference on (pp. 1-6). IEEE.
[36] Kaur, R. P., & Klair, A. S. Empirical Study of Grid partitioning and Subtractive Clustering based NF Systems for the Evaluation of Fault Proneness in Open source Software Systems.
[37] Au, W. H. (2008). A Distributed Algorithm for Mining Fuzzy Association Rules in Traditional Databases. In Handbook of Research on Fuzzy Information Processing in Databases (pp. 685-705). IGI Global.
[38] Schwämmle, V., & Jensen, O. N. (2010). A simple and fast method to determine the parameters for fuzzy c–means cluster analysis. Bioinformatics, 26(22), 2841-2848.
[39] Peterkova, A., & Stremy, M (2015). The raw ECG signal processing and the detection of QRS complex.