Embed Size (px)
Citation preview
Heart comorbidity correlates with lung toxicity after (chemo)radiotherapy
Georgi Nalbantov, 2013
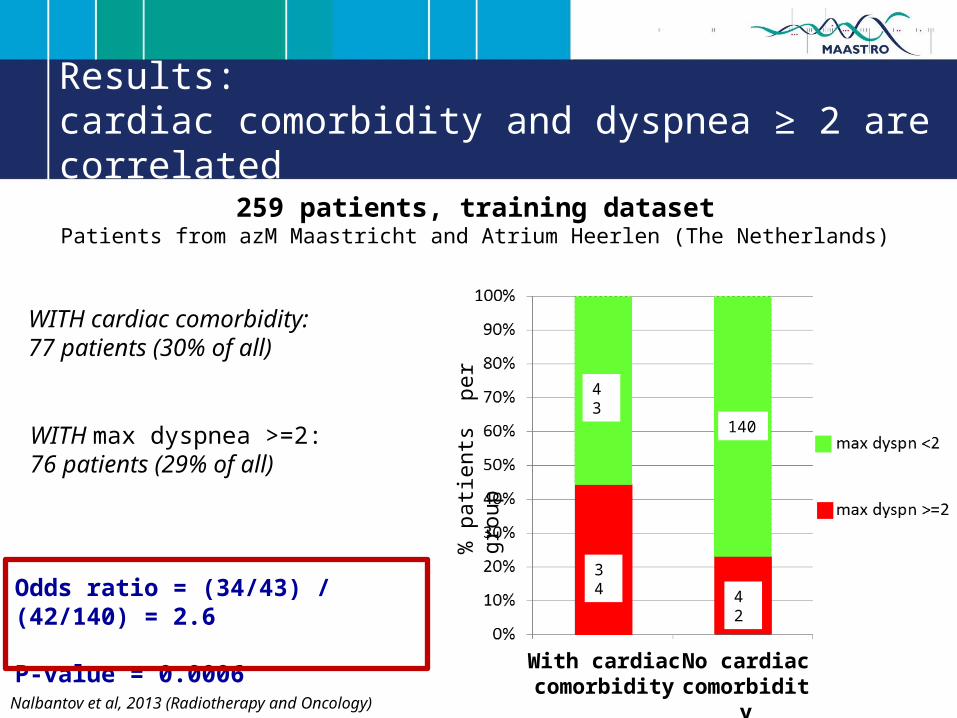
Results: cardiac comorbidity and dyspnea ≥ 2 are correlated
259 patients, training datasetPatients from azM Maastricht and Atrium Heerlen (The Netherlands)
% p
atien
ts p
er g
roup
With cardiaccomorbidity
No cardiac comorbidity
Odds ratio = (34/43) / (42/140) = 2.6
P-value = 0.0006
WITH cardiac comorbidity:77 patients (30% of all)
34
42
43
140WITH max dyspnea >=2:76 patients (29% of all)
Nalbantov et al, 2013 (Radiotherapy and Oncology)
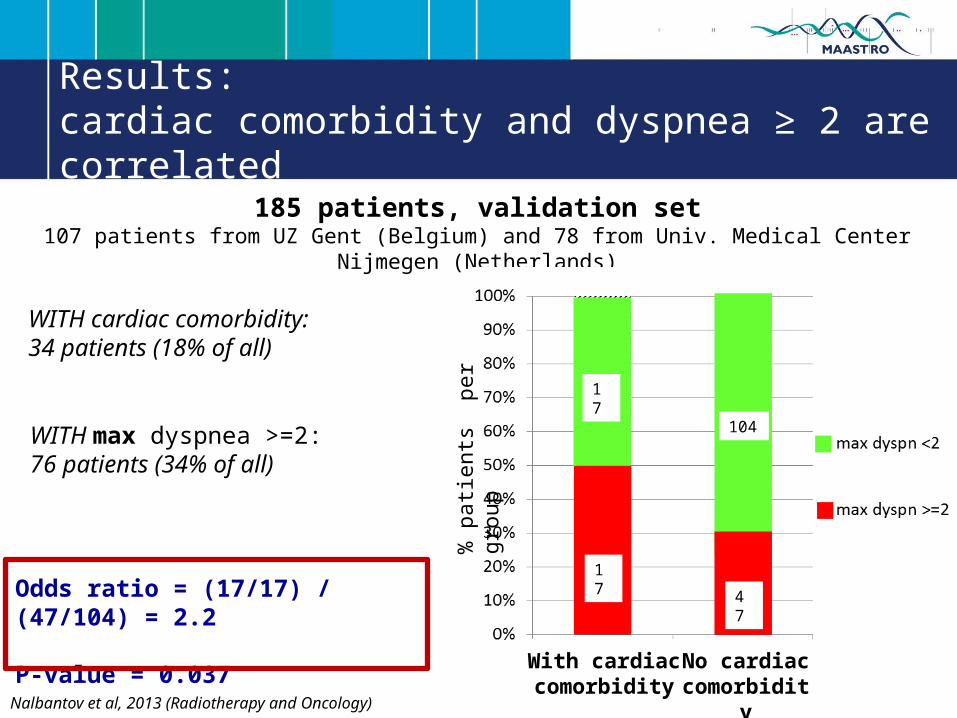
Results: cardiac comorbidity and dyspnea ≥ 2 are correlated
185 patients, validation set107 patients from UZ Gent (Belgium) and 78 from Univ. Medical Center Nijmegen (Netherlands)
% p
atien
ts p
er g
roup
With cardiaccomorbidity
No cardiac comorbidity
Odds ratio = (17/17) / (47/104) = 2.2
P-value = 0.037
17
17
104
47
WITH cardiac comorbidity:34 patients (18% of all)
WITH max dyspnea >=2:76 patients (34% of all)
Nalbantov et al, 2013 (Radiotherapy and Oncology)
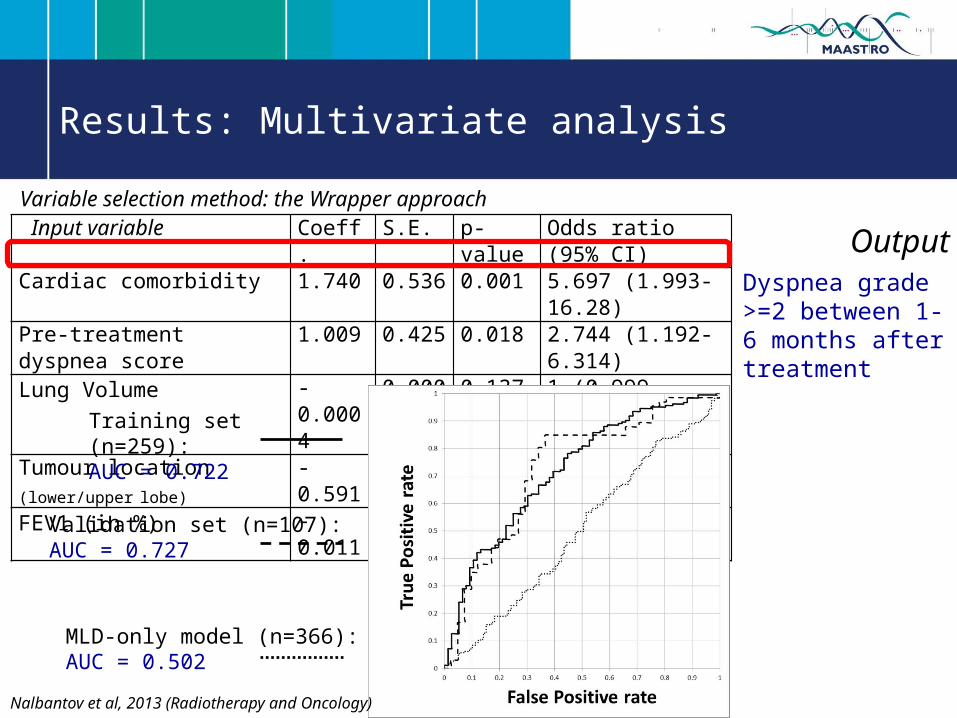
Results: Multivariate analysis
Input variable Coeff. S.E. p-value Odds ratio (95% CI)Cardiac comorbidity 1.740 0.536 0.001 5.697 (1.993-16.28)Pre-treatment dyspnea score 1.009 0.425 0.018 2.744 (1.192-6.314)Lung Volume -0.0004 0.0003 0.137 1 (0.999-1.000)Tumour location (lower/upper lobe) -0.591 0.543 0.276 0.554 (0.191-1.604)FEV1 (in %) -0.011 0.013 0.396 0.989 (0.963-1.015)
Output
Variable selection method: the Wrapper approach
Training set (n=259):AUC = 0.722
Validation set (n=107):AUC = 0.727
MLD-only model (n=366):AUC = 0.502
Dyspnea grade >=2 between 1-6 months after treatment
Nalbantov et al, 2013 (Radiotherapy and Oncology)
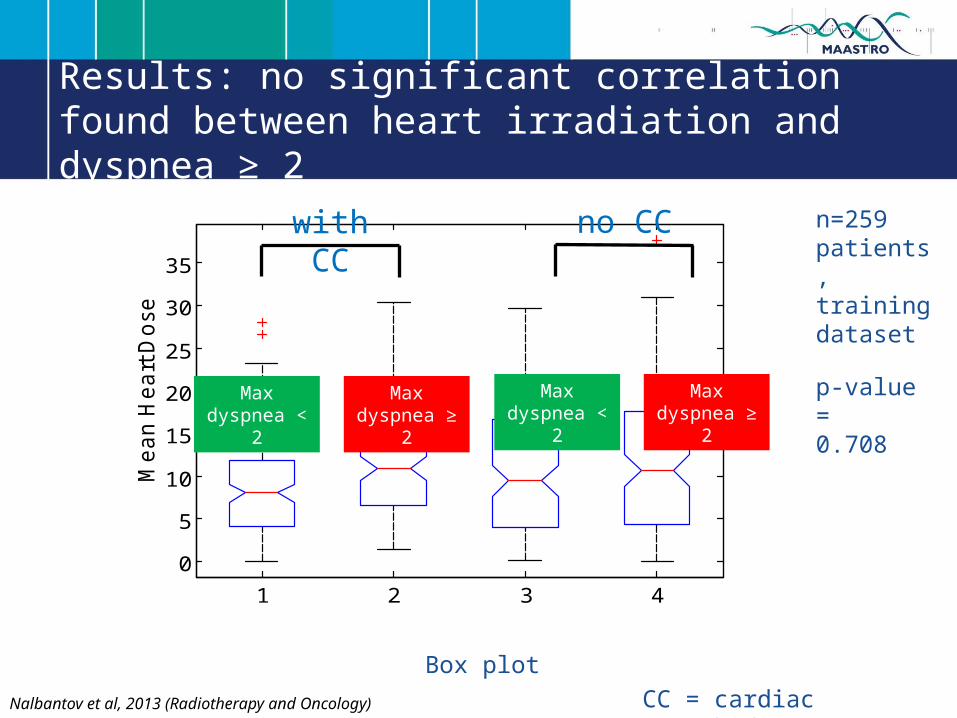
Results: no significant correlation found between heart irradiation and dyspnea ≥ 2
Figure 3. Boxplot for Mean Heart Dose for four groups: (1) CC (cardiac comorbidity) = yes and maximal dyspnea <2, (2) CC = yes and maximal dyspnea ≥ 2, (3) CC = no and maximal dyspnea <2, and (4) CC = no and maximal dyspnea ≥ 2. The p-value = 0.708 from a Kruskal-Wallis test for equality of the medians across the fours group, indicating no significant difference.
1 2 3 4
0
5
10
15
20
25
30
35
Me
an
He
art
Do
se
CC = yes, Maximal dyspnea < 2
CC = yes, Maximal dyspnea >=2
CC = no, Maximal dyspnea < 2
CC = no, Maximal dyspnea >= 2 CC = cardiac comorbidity
p-value =0.708
n=259 patients, training dataset
with CC
Max dyspnea ≥ 2
no CC
Max dyspnea ≥ 2
Max dyspnea < 2
Max dyspnea < 2
Box plot
Nalbantov et al, 2013 (Radiotherapy and Oncology)