Embed Size (px)
Citation preview

HEALTHY WATERS/FOREST RETENTION STUDY FINAL REPORT: JUNE 30, 2017 1
HEALTHY WATERSHEDS FOREST RETENTION PROJECT
PHASES 1 & 2
FINAL REPORT A Virginia and Pennsylvania partnership focused on expanding the use of forestland to meet Chesapeake Bay Watershed goals from the perspective of the local leaders who are responsible for making it happen.
Prepared for: The Chesapeake Bay Program Partnership Healthy Watersheds Goal Implementation Team, Land Use Workgroup and Forestry Workgroup
The Local Government Advisory Committee to the Chesapeake Bay Executive Council
The US EPA Chesapeake Bay Program Office
The Commonwealths of Virginia and Pennsylvania
The Rappahannock River Basin Commission
The George Washington Regional Commission
The Chesapeake Bay Commission
The Nature Conservancy
The Chesapeake Bay Trust
The US Endowment for Forests and Communities
The Virginia Environmental Endowment
June 30, 2017

HEALTHY WATERS/FOREST RETENTION STUDY FINAL REPORT: JUNE 30, 2017 2
Table of Contents LIST OF FIGURES ................................................................................................................................... 6
LIST OF TABLES ..................................................................................................................................... 7
ACKNOWLEDGEMENTS ........................................................................................................................... 8
BACKGROUND LEADING TO PROJECT ........................................................................................................10
PHASE II ...........................................................................................................................................14
VIRGINIA ......................................................................................................................................................... 15
PENNSYLVANIA ................................................................................................................................................. 15
FOREST RETENTION MODELING METHODOLOGY AND FINDINGS .....................................................16
CITY OF FREDERICKSBURG ............................................................................................................................................... 19
GENERAL METHODOLOGY FOR CURRENT LAND COVER FOR COUNTY AREAS ............................................................................. 19
UNIQUE METHODS OR ASSUMPTIONS BY COUNTY .............................................................................................................. 20
SCENARIO MODELING ......................................................................................................................29
VIRGINIA ......................................................................................................................................................... 29
PENNSYLVANIA ................................................................................................................................................. 29
SCENARIO DESCRIPTIONS ................................................................................................................30
SCENARIO (A) 2025: MODIFIED 5.3.2 BAY MODEL ............................................................................................................ 30
SCENARIO (B) 2025: COMMUNITY PLANS BUILD-OUT ......................................................................................................... 31
SCENARIO (C) 2025: GREENPRINT/FOREST RETENTION ....................................................................................................... 31
SCENARIO (D) 2025: PHASED DEVELOPMENT IMPACT ON COMMUNITY PLANS BUILD-OUT ........................................................ 32
SCENARIO (A) 2025: MODIFIED 5.3.2 BAY MODEL ............................................................................................................ 32
CORRELATION WITH 2014 CHESAPEAKE BAY WATERSHED AGREEMENT STATED GOALS AND OUTCOMES ................................ 12
PROJECT DESIGN ............................................................................................................................................... 13
PROJECT DESIGN ............................................................................................................................................... 14
STUDY AREAS ................................................................................................................................................... 15
VIRGINIA (PHASE I) ............................................................................................................................................ 16
PENNSYLVANIA (PHASE II) ................................................................................................................................... 17 FORECASTING LAND COVER CHANGE: 2010 – 2025 .................................................................................................. 18 VIRGINIA (PHASE I) ............................................................................................................................................ 18
SUPPORTING DEMOGRAPHIC ASSUMPTIONS .............................................................................................................. 21
POPULATION PROJECTIONS FOR PD 16 AND RAPPAHANNOCK WATERSHED AREA ................................................................ 22 PENNSYLVANIA (PHASE II) ................................................................................................................................... 24 POPULATION TRENDS AND PROJECTIONS FOR THE YBC WATERSHED ................................................................................ 24 LAND COVER CONVERSION TRENDS, 2001-2011 ....................................................................................................... 25 DIFFERENTIAL CONVERSION TRENDS IN URBAN AND RURAL MUNICIPALITIES OF THE WATERSHED ............................................ 26
VIRGINIA ......................................................................................................................................................... 30
PENNSYLVANIA ................................................................................................................................................. 32

HEALTHY WATERS/FOREST RETENTION STUDY FINAL REPORT: JUNE 30, 2017 3
SCENARIO (B) 2025: FOREST RETENTION .......................................................................................................................... 33
SCENARIO (C) 2025: URBAN FOREST RETENTION SCENARIO ................................................................................................. 35
SCENARIO (D) 2025: RURAL RIPARIAN BUFFER RESTORATION SCENARIO ................................................................................ 35
SCENARIO RESULTS ..........................................................................................................................36
PHASE II ENGAGEMENT/DISCOVERY OBJECTIVES .............................................................................38
PENNSYLVANIA ............................................................................................................................................................. 39
OPEN SPACE & FOREST RETENTION TOOLS IN VA AND PA ................................................................42
4. MULTI-YEAR APPLICATION OF LAND USE VALUATION TAXATION ............................................................................. 87
5. EXPANDING LOCAL TREE PROTECTION AUTHORITY ................................................................................................ 88
6. TREE CONSERVATION FOR OZONE NON-ATTAINMENT ........................................................................................... 89
PHASE II KEY FINDINGS AND CHALLENGES .................................................................................................95
1. FOREST CONSERVATION TMDL CREDIT .............................................................................................................. 95
2. STORMWATER MANAGEMENT PLANNING, REGULATION & CHESAPEAKE BAY PROGRAMS ............................................ 95
3. STATIC VS. DYNAMIC TMDL MODEL .................................................................................................................. 98
1. TRACKING FOREST ACREAGE UNDER LUVT OR CONSERVATION EASEMENT PROGRAMS ................................................ 99
2. INTRA-BASIN CREDIT TRADING ........................................................................................................................ 100
3. ROLE AND IMPORTANCE OF COMMUNITY PLANNING AND THE COMPREHENSIVE PLAN IN VIRGINIA ............................... 102
PHASE II APPROACH ........................................................................................................................................... 38
VIRGINIA ......................................................................................................................................................... 38
ORGANIZING AND SEEKING STAKEHOLDER INPUT....................................................................................................... 39
VIRGINIA ......................................................................................................................................................... 39 PENNSYLVANIA .................................................................................................................................................. 41
A. TAX AND FISCAL POLICY TOOLS ..................................................................................................................... 43
B. ENVIRONMENTAL PLANNING AND REGULATION TOOLS ....................................................................................... 48 C. LAND USE AND ZONING POLICIES .................................................................................................................. 60 D. VOLUNTARY LANDOWNER ACTIONS ............................................................................................................... 74 E. LAND & DEVELOPMENT RIGHTS ACQUISITION .................................................................................................. 80 F. FOREST RETENTION TOOLS: ENHANCEMENT OPPORTUNITIES ............................................................................... 85
1. CONSERVATION EASEMENT TAX CREDIT POLICY ............................................................................................ 85 2. CONSIDERATION OF TERM CONSERVATION EASEMENTS ................................................................................... 85 3. RECOGNITION OF RESOURCE PROTECTION AREA RESTRICTIONS ......................................................................... 86
7. PROMOTING USE OF CONSERVATION SUBDIVISION DESIGN (CSD) PLANNING ....................................................... 90
8. FACTORING ECOSYSTEM SERVICE FUNCTIONS INTO CONSERVATION EASEMENT TAX CREDIT POLICY ............................. 92 9. RECOGNIZING NATURAL CAPITAL AS TAXABLE ASSETS ..................................................................................... 93 10. NUTRIENT AND CARBON SEQUESTRATION CREDIT TRADING .............................................................................. 93
A. VIRGINIA AND PENNSYLVANIA: SHARED FINDINGS ............................................................................................. 95
B. VIRGINIA-SPECIFIC FINDINGS AND CHALLENGES................................................................................................. 99
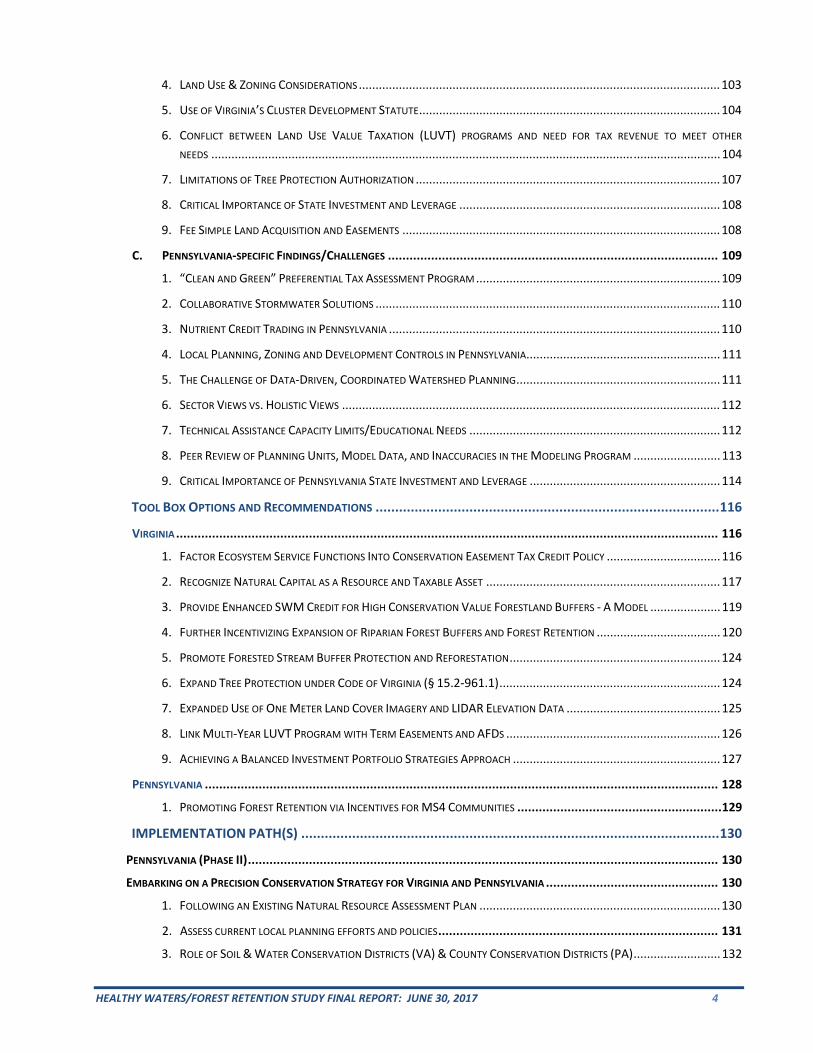
HEALTHY WATERS/FOREST RETENTION STUDY FINAL REPORT: JUNE 30, 2017 4
4. LAND USE & ZONING CONSIDERATIONS ............................................................................................................ 103
5. USE OF VIRGINIA’S CLUSTER DEVELOPMENT STATUTE .......................................................................................... 104
6. CONFLICT BETWEEN LAND USE VALUE TAXATION (LUVT) PROGRAMS AND NEED FOR TAX REVENUE TO MEET OTHER
NEEDS ........................................................................................................................................................ 104
7. LIMITATIONS OF TREE PROTECTION AUTHORIZATION ........................................................................................... 107
8. CRITICAL IMPORTANCE OF STATE INVESTMENT AND LEVERAGE .............................................................................. 108
9. FEE SIMPLE LAND ACQUISITION AND EASEMENTS ............................................................................................... 108
1. “CLEAN AND GREEN” PREFERENTIAL TAX ASSESSMENT PROGRAM ......................................................................... 109
2. COLLABORATIVE STORMWATER SOLUTIONS ....................................................................................................... 110
3. NUTRIENT CREDIT TRADING IN PENNSYLVANIA ................................................................................................... 110
4. LOCAL PLANNING, ZONING AND DEVELOPMENT CONTROLS IN PENNSYLVANIA.......................................................... 111
5. THE CHALLENGE OF DATA-DRIVEN, COORDINATED WATERSHED PLANNING ............................................................. 111
6. SECTOR VIEWS VS. HOLISTIC VIEWS ................................................................................................................. 112
7. TECHNICAL ASSISTANCE CAPACITY LIMITS/EDUCATIONAL NEEDS ........................................................................... 112
8. PEER REVIEW OF PLANNING UNITS, MODEL DATA, AND INACCURACIES IN THE MODELING PROGRAM .......................... 113
9. CRITICAL IMPORTANCE OF PENNSYLVANIA STATE INVESTMENT AND LEVERAGE ......................................................... 114
TOOL BOX OPTIONS AND RECOMMENDATIONS ........................................................................................ 116
1. FACTOR ECOSYSTEM SERVICE FUNCTIONS INTO CONSERVATION EASEMENT TAX CREDIT POLICY .................................. 116
2. RECOGNIZE NATURAL CAPITAL AS A RESOURCE AND TAXABLE ASSET ...................................................................... 117
3. PROVIDE ENHANCED SWM CREDIT FOR HIGH CONSERVATION VALUE FORESTLAND BUFFERS - A MODEL ..................... 119
4. FURTHER INCENTIVIZING EXPANSION OF RIPARIAN FOREST BUFFERS AND FOREST RETENTION ..................................... 120
5. PROMOTE FORESTED STREAM BUFFER PROTECTION AND REFORESTATION ............................................................... 124
6. EXPAND TREE PROTECTION UNDER CODE OF VIRGINIA (§ 15.2-961.1) .................................................................. 124
7. EXPANDED USE OF ONE METER LAND COVER IMAGERY AND LIDAR ELEVATION DATA .............................................. 125
8. LINK MULTI-YEAR LUVT PROGRAM WITH TERM EASEMENTS AND AFDS ................................................................ 126
9. ACHIEVING A BALANCED INVESTMENT PORTFOLIO STRATEGIES APPROACH .............................................................. 127
1. PROMOTING FOREST RETENTION VIA INCENTIVES FOR MS4 COMMUNITIES ......................................................... 129
IMPLEMENTATION PATH(S) ........................................................................................................... 130
1. FOLLOWING AN EXISTING NATURAL RESOURCE ASSESSMENT PLAN ........................................................................ 130
3. ROLE OF SOIL & WATER CONSERVATION DISTRICTS (VA) & COUNTY CONSERVATION DISTRICTS (PA) .......................... 132
C. PENNSYLVANIA-SPECIFIC FINDINGS/CHALLENGES ............................................................................................ 109
VIRGINIA ....................................................................................................................................................... 116
PENNSYLVANIA ............................................................................................................................................... 128
PENNSYLVANIA (PHASE II) ................................................................................................................................... 130
EMBARKING ON A PRECISION CONSERVATION STRATEGY FOR VIRGINIA AND PENNSYLVANIA ................................................ 130
2. ASSESS CURRENT LOCAL PLANNING EFFORTS AND POLICIES.............................................................................. 131
HEALTHY WATERS/FOREST RETENTION STUDY FINAL REPORT: JUNE 30, 2017 5
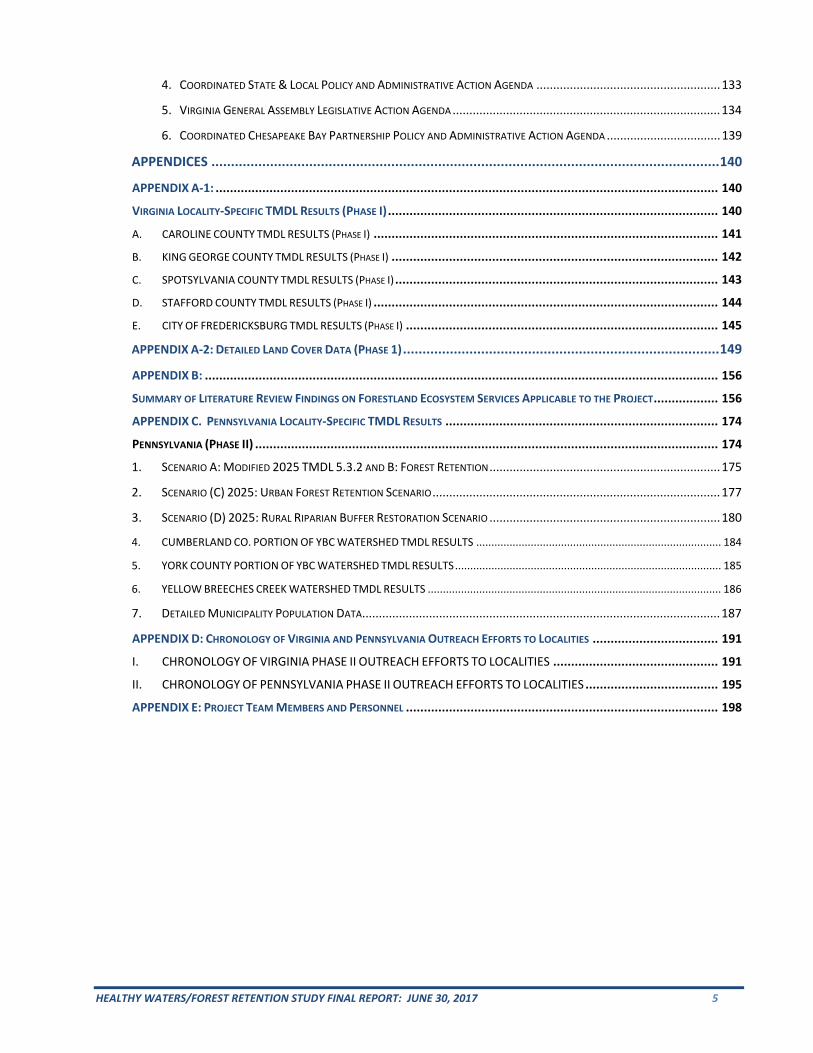
4. COORDINATED STATE & LOCAL POLICY AND ADMINISTRATIVE ACTION AGENDA ....................................................... 133
5. VIRGINIA GENERAL ASSEMBLY LEGISLATIVE ACTION AGENDA ................................................................................ 134
6. COORDINATED CHESAPEAKE BAY PARTNERSHIP POLICY AND ADMINISTRATIVE ACTION AGENDA .................................. 139
APPENDICES .................................................................................................................................. 140
APPENDIX A-2: DETAILED LAND COVER DATA (PHASE 1) ................................................................................. 149
1. SCENARIO A: MODIFIED 2025 TMDL 5.3.2 AND B: FOREST RETENTION ..................................................................... 175
2. SCENARIO (C) 2025: URBAN FOREST RETENTION SCENARIO ...................................................................................... 177
3. SCENARIO (D) 2025: RURAL RIPARIAN BUFFER RESTORATION SCENARIO ..................................................................... 180
4. CUMBERLAND CO. PORTION OF YBC WATERSHED TMDL RESULTS ................................................................................. 184
5. YORK COUNTY PORTION OF YBC WATERSHED TMDL RESULTS ........................................................................................ 185
6. YELLOW BREECHES CREEK WATERSHED TMDL RESULTS ................................................................................................. 186
7. DETAILED MUNICIPALITY POPULATION DATA........................................................................................................... 187
APPENDIX A-1: ............................................................................................................................................ 140
VIRGINIA LOCALITY-SPECIFIC TMDL RESULTS (PHASE I) ............................................................................................ 140 A. CAROLINE COUNTY TMDL RESULTS (PHASE I) ................................................................................................ 141
B. KING GEORGE COUNTY TMDL RESULTS (PHASE I) ........................................................................................... 142
C. SPOTSYLVANIA COUNTY TMDL RESULTS (PHASE I) .......................................................................................... 143
D. STAFFORD COUNTY TMDL RESULTS (PHASE I) ................................................................................................ 144
E. CITY OF FREDERICKSBURG TMDL RESULTS (PHASE I) ....................................................................................... 145
APPENDIX B: ............................................................................................................................................... 156
SUMMARY OF LITERATURE REVIEW FINDINGS ON FORESTLAND ECOSYSTEM SERVICES APPLICABLE TO THE PROJECT .................. 156 APPENDIX C. PENNSYLVANIA LOCALITY-SPECIFIC TMDL RESULTS ............................................................................ 174 PENNSYLVANIA (PHASE II) ................................................................................................................................. 174
APPENDIX D: CHRONOLOGY OF VIRGINIA AND PENNSYLVANIA OUTREACH EFFORTS TO LOCALITIES ................................... 191
I. CHRONOLOGY OF VIRGINIA PHASE II OUTREACH EFFORTS TO LOCALITIES .............................................. 191 II. CHRONOLOGY OF PENNSYLVANIA PHASE II OUTREACH EFFORTS TO LOCALITIES ..................................... 195 APPENDIX E: PROJECT TEAM MEMBERS AND PERSONNEL ....................................................................................... 198

HEALTHY WATERS/FOREST RETENTION STUDY FINAL REPORT: JUNE 30, 2017 6
LIST OF FIGURES FIGURE NO. FIGURE TITLE PAGE NO.
1 The Chesapeake Bay Watershed 10 2 The Rappahannock River Basin Watershed 15 3 The Yellow Breeches Creek Watershed 15 4 Conserved and Easement Lands in the Rappahannock River Watershed 16 5 Caroline County Study Area 20 6 King George County Study Area 20 7 Spotsylvania County Study Area 20 8 Stafford County Study Area 21 9 LUVT Programs in Virginia 44
10 Comparison of Conventional and Conservation Subdivision Designs 91 11 Matching Rural and Urban Needs: Blue/Green Economy Concept 101 12 Riparian Forest Buffer Benefits vs. Buffer Widths 123 13 Three-Zone Buffer Design 124
APPENDIX C 14 Scenario C: Forest Loss and Population Trends 178 15 Scenario C and D Municipalities Location Map 179
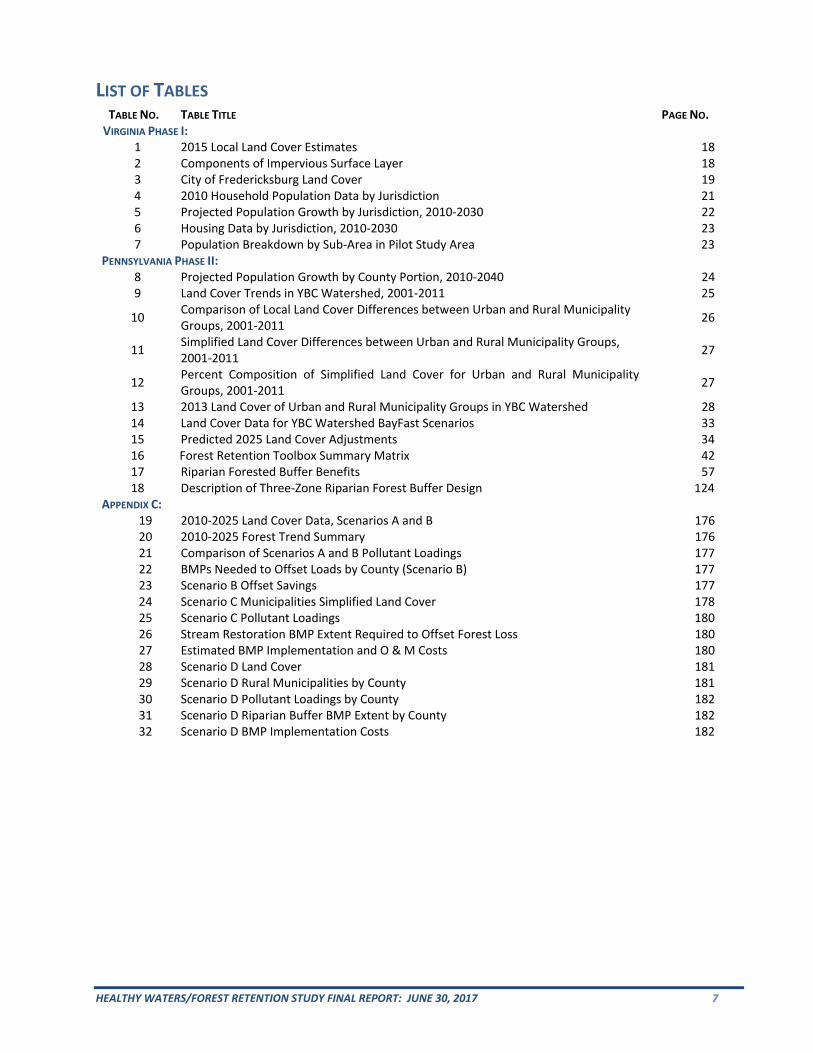
HEALTHY WATERS/FOREST RETENTION STUDY FINAL REPORT: JUNE 30, 2017 7
LIST OF TABLES TABLE NO. TABLE TITLE PAGE NO.
VIRGINIA PHASE I: 1 2015 Local Land Cover Estimates 182 Components of Impervious Surface Layer 183 City of Fredericksburg Land Cover 194 2010 Household Population Data by Jurisdiction 215 Projected Population Growth by Jurisdiction, 2010-2030 226 Housing Data by Jurisdiction, 2010-2030 237 Population Breakdown by Sub-Area in Pilot Study Area 23
PENNSYLVANIA PHASE II: 8 Projected Population Growth by County Portion, 2010-2040 249 Land Cover Trends in YBC Watershed, 2001-2011 25
10 Comparison of Local Land Cover Differences between Urban and Rural Municipality Groups, 2001-2011 26
11 Simplified Land Cover Differences between Urban and Rural Municipality Groups, 2001-2011 27
12 Percent Composition of Simplified Land Cover for Urban and Rural Municipality Groups, 2001-2011 27
13 2013 Land Cover of Urban and Rural Municipality Groups in YBC Watershed 2814 Land Cover Data for YBC Watershed BayFast Scenarios 3315 Predicted 2025 Land Cover Adjustments 3416 Forest Retention Toolbox Summary Matrix 4217 Riparian Forested Buffer Benefits 5718 Description of Three-Zone Riparian Forest Buffer Design 124
APPENDIX C: 19 2010-2025 Land Cover Data, Scenarios A and B 17620 2010-2025 Forest Trend Summary 17621 Comparison of Scenarios A and B Pollutant Loadings 17722 BMPs Needed to Offset Loads by County (Scenario B) 17723 Scenario B Offset Savings 17724 Scenario C Municipalities Simplified Land Cover 17825 Scenario C Pollutant Loadings 18026 Stream Restoration BMP Extent Required to Offset Forest Loss 18027 Estimated BMP Implementation and O & M Costs 18028 Scenario D Land Cover 18129 Scenario D Rural Municipalities by County 18130 Scenario D Pollutant Loadings by County 18231 Scenario D Riparian Buffer BMP Extent by County 18232 Scenario D BMP Implementation Costs 182

HEALTHY WATERS/FOREST RETENTION STUDY FINAL REPORT: JUNE 30, 2017 8
ACKNOWLEDGEMENTS The concept for this project began as an interesting dinner conversation in 2014 following a meeting of the Citizens’ Advisory Committee to the Chesapeake Bay Executive Council. It proposed to answer two questions: Can we quantify the contribution of forestland in economic terms toward achieving Chesapeake Bay cleanup goals; and if the value is significant, what needs to be done to incentivize forestland retention so that contribution is maximized? The follow-on analyses, modeling, evaluations, interviews, discussions and negotiations required to answer those two questions has consumed thousands of hours since and drawn on the expertise and advice of many people across two Commonwealths who generously contributed their time and energy to develop the findings and recommendations in this report.
We would like to begin by thanking the Project’s sponsors: the Rappahannock River Basin Commission and the Virginia Department of Forestry for the strong commitment from their executive leadership and the technical and administrative resources they provided. We are also indebted to our project partner organizations who contributed in many ways to the content of this report: the Virginia Department of Environmental Quality, the George Washington Regional Commission, the Chesapeake Bay Commission, the Virginia Polytechnic Institute & State University, The Nature Conservancy, the Pennsylvania Department of Conservation and Natural Resources Bureau of Forestry, the Pennsylvania Department of Environmental Protection, and the Center for Watershed Protection. And lastly, the organizations that recognized the importance of this initiative and provided the funding that made it possible: the Chesapeake Bay Partnership Healthy Watersheds Goal Implementation Team through the Chesapeake Bay Trust, the U.S. Endowment for Forests and Communities, and the Virginia Environmental Endowment.
Organizations, however, are the creations of people and while it is impossible to thank everyone by name, we would like to recognize a few who continuously gave of their time and expertise and then gave some more: Mr. Kevin Byrnes with Regional Decision Systems, LLC (RDS, LLC) for the many, many hours he spent during phase one assimilating the one meter resolution data, and defining and matching land cover edges to land parcel boundaries across the entire Virginia pilot project area, and then did it all over again in phase two to assist the Pennsylvania Project team with their analysis so the land use and growth scenarios in both Commonwealths could be effectively modeled and compared, and provided invaluable service helping to compile the final project report; Mr. James Davis-Martin with the Virginia Department of Environmental Quality for single-handily formatting and running all of the 24 individual alternative land use modeling scenarios needed by the Virginia team to complete its phase one work; Dr. Michael Chandler, Director of Education at the Land Use Education Program at Virginia Tech for participating in dozens upon dozens of meetings, large and small, with local elected and appointed officials, planners, environmental technical personnel, landowners, NGO representatives, and other citizens, lending his land use planning expertise to help focus those discussions on the goal of developing the forestland retention policy and incentive toolbox options; several members of the Rappahannock River Basin Commission’s Technical Advisory Committee, including: Ms. Deirdre Clark, John Marshall SWCD; Mr. Patrick Coady, Northern Virginia Conservation Trust; Mr. Michael Collins, Center for Natural Capital; Ms. Michelle Edwards, Rappahannock Rapidan Regional Commission; Ms. Kathy Harrigan, Friends of the Rappahannock; Ms. Ann Jennings, Chesapeake Bay Commission; Mr. Mohan Karki, Stafford County; Mr. Terry Lasher, Virginia Department of Forestry; Mr. David Nunnally, Caroline County; Ms. Shannon O’Neil, Northern Virginia Conservation Trust; Mr. Doug Pickford, Conservation Concepts; Mr. Ross Pickford, Conservation Concepts; Mr. Kyle Settle, Culpeper County; Ms. Peggy Stevens, Northern Virginia Conservation Trust; Mr. Kevin Utt, City of Fredericksburg, and Mr. Joe Wood,

HEALTHY WATERS/FOREST RETENTION STUDY FINAL REPORT: JUNE 30, 2017 9
Chesapeake Bay Foundation; who served individually as subject matter specialists and as facilitators helping to arrange meetings with key individuals and who served collectively as our monthly sounding board helping us to review and interpret what we were learning in the phase II discussion sessions; Mr. John Smoluk with the Pennsylvania Department of Conservation and Natural Resources, Bureau of Forestry for compiling and adjusting the entirety of the land use cover data and land parcel boundaries across the Pennsylvania pilot study area needed by the Pennsylvania team to complete its phase two work and participating in dozens of planning and outreach meetings in support of Pennsylvania’s Phase two work; Mr. Mark Hockley with the Pennsylvania Department of Conservation and Natural Resources Bureau of Forestry for participating in rigorous meeting schedules with the jurisdictions in the Pennsylvania Phase II project area where his local knowledge added significant value to the project findings; and Mr. Bryan Seipp with the Center for Watershed Protection (CWP) for bringing excellent, pre-existing partnerships with Pennsylvania communities in the study area to the table, and conducting all the individual alternative land use modeling scenarios needed by the Pennsylvania team for Phase two, while adapting to changing conditions in order to attain a true peer review of Virginia’s Phase one work.
Without their efforts and those of numerous others this project would not have been successful. We thank them all.
For the Project Team:
Greg Evans Mitigation Program Manager/ Chesapeake Bay Program Lead Virginia Department of Forestry
Eldon James Coordinator Rappahannock River Basin Commission
Su Ann Shupp Land Conservation Coordinator PA Department of Conservation and Natural Resources Bureau of Forestry/Rural & Community Forestry Section
June 30, 2017

HEALTHY WATERS/FOREST RETENTION STUDY FINAL REPORT: JUNE 30, 2017 10
BACKGROUND LEADING TO PROJECT The 2014 Chesapeake Bay Watershed Agreement includes outcomes for protecting healthy watersheds, high-conservation priority wetlands, and forestland of highest value for maintaining water quality. To accomplish this, there is agreement among the signatories to use management strategies whose aim is to improve the knowledge of land conversion and associated impacts throughout the Watershed by developing a methodology and metrics to characterize the rate of farmland, forestland and wetland conversion, and by measuring the extent and rate of change in impervious surface coverage. The goal is to provide localities with the tools they will need to quantify potential impacts of land conversion and evaluate policy options, incentives, and planning tools that could continually improve their capacity to reduce the rate of conversion of agricultural lands, forestlands, and wetlands.
Throughout the Watershed, it is projected that the majority of future growth will result from development of agricultural and forest lands into residential and commercial urban uses. In Virginia, to account for this growth in urban land, a load balancing approach was developed. It uses the allocation loads for forest, cropland, pasture, and hay land in the Chesapeake Bay Program’s Phase 5.3 Watershed Model for determining Total Maximum Daily Loads (TMDL) of nitrogen, phosphorous, and sediments to calculate the average pollutant loads from a generic pre-development acre based on the mix of land available to be developed in Virginia’s and Pennsylvania’s portions of the Chesapeake Bay Watershed. To meet TMDL requirements, the post-development land use must be treated with sufficient best management practices (BMPs) to meet the nutrient-neutral pre-development loads of nitrogen, phosphorus, and sediments.
The Phase I study partners: the Virginia Department of Forestry (VDOF), the Virginia Department of Environmental Quality (VDEQ), the Rappahannock River Basin Commission (RRBC), George Washington Regional Commission (GWRC), The Nature Conservancy, the Chesapeake Bay Commission and the Virginia Water Resources Research Center (VWRRC) at Virginia Tech hypothesized that retaining more forestland will protect and enhance healthy watersheds by reducing nitrogen, phosphorus, and sediment loads, thereby reducing the slope of the current TMDL 2025 projections for localities within the Chesapeake Bay Watershed. Therefore, if (1) localities, private land owners, and others take actions to retain forestland and those actions result in a decrease in actual load over the 2025 projected TMDL load allocation land cover; and (2) those decreases subsequently reduce probable future offset costs localities within the region could be facing in 2025, then (3) a way to credit localities and others for retaining forestland now through the Chesapeake Bay TMDL Model should be considered.
This idea was proposed to and supported in concept by the EPA Chesapeake Bay Program Office and the Chesapeake Bay Program’s Healthy Watershed Goal Implementation Team (GIT) of partner organizations responsible for developing the management strategies for restoring the Bay. A two phase pilot project was then developed. Phase I was designed to test and prove the concept. It was completed in 2016 and validated the working hypothesis by demonstrating that substantial savings were possible for localities if more forestland was retained.
Figure 1. Chesapeake Bay Watershed

HEALTHY WATERS/FOREST RETENTION STUDY FINAL REPORT: JUNE 30, 2017 11
Phase II expanded the project in Virginia from its Phase I pilot area in the George Washington Regional Commission service area of the basin to the entire Rappahannock River basin as a proxy for the Chesapeake Bay watershed. Since the Virginia project team’s working hypothesis was that crediting forestland retention in the TMDL would stimulate and, perhaps, even drive development of additional incentives at the local level to conserve high conservation value forestland, outreach to and negotiation with local government leaders was critical. The key priority was to build consensus, from the locality level up, on a toolbox of policy, regulatory and financial incentives necessary to stimulate land use decisions required to achieve the Chesapeake Bay healthy watershed goals by retaining high conservation value forestland while simultaneously meeting local economic and other ecosystem service needs. It was believed that the toolbox elements, to be credible on a peer to peer basis, had to be designed to help local officials optimize land use decisions so development can occur at the same time that water quality protection actions are maximized. A forest land retention TMDL credit would be a driver but only one of what could be a package of incentives available.
EPA and senior Chesapeake Bay Program Partner representatives also proposed that Virginia and Pennsylvania partner together in Phase II on a Commonwealth to Commonwealth basis. The rationale being that as Virginia moved forward with working with local government officials, Pennsylvania could serve the role of a peer reviewer and evaluate Virginia’s modeling methodologies, assumptions and assortment of tools to test ways other states could adapt and implement the lessons learned in Virginia. Pennsylvania in Phase II tested the quantification methodology Virginia employed in Phase I in a water basin study area it identified to determine what savings, if any, a forest retention strategy offered to Pennsylvania. It also worked with localities in its study area to learn the same type of information Virginia was endeavoring to discover and the two Commonwealths pooled their findings. Given the differences between Pennsylvania’s various municipal governments environment and Virginia’s strict Dillon Rule government environment, the forest retention incentives toolbox resulting from these two state governance models was expected to be different.
Such a partnership was also viewed as a potentially effective way to speed adoption and implementation of forestland retention actions across the Watershed as the 2017 amendments to the TMDL model are adopted and rolled out. If all goals were met, a toolbox of incentives and policies that could augment and support a forestland retention credit in the TMDL model would have been developed and tested by localities within the two jurisdictions comprising the largest land area in the Chesapeake Bay watershed. This could provide the other Chesapeake Bay Watershed (CBW) jurisdictions with tool options that fit their own situations and further the goal of sustaining currently healthy sub-watersheds throughout the entire CBW.
The Pennsylvania project team included representatives of Pennsylvania’s Department of Conservation and Natural Resources Bureau of Forestry (BOF), Policy Office, Bureau of Recreation and Conservation (BRC), the Department of Environmental Protection (DEP), Cumberland County Planning Commission (CCPC); and the Center for Watershed Protection (CWP).
Phase II concluded June 30, 2017. This report includes findings and recommendations for both Phase I and Phase II of the project. The study findings are being shared with 1) local government officials in the study areas to inform their decision making as it pertains to development patterns and forest retention; 2) state officials for consideration in milestone planning and attainment of Chesapeake Bay Watershed Agreement Outcomes; and 3) Bay Program officials to help inform the suite of growth models and advance efforts to account for and credit forest retention actions. It is the goal of the partners that this effort can provide

HEALTHY WATERS/FOREST RETENTION STUDY FINAL REPORT: JUNE 30, 2017 12
encouragement for further study and implementation of public policy-sponsored forest retention efforts and lead to adoption of a forest retention credit recognized by the Chesapeake Bay TMDL Model.
Correlation with 2014 Chesapeake Bay Watershed Agreement Stated Goals and Outcomes Although forest cover is recognized as one of the best land uses for achieving Chesapeake Bay water quality and healthy watershed goals and outcomes, localities and particularly MS4 jurisdictions in the watershed, have long maintained that unless TMDL credit is given for retaining forestland, there is little local incentive for doing so. This project addressed that issue. An objective was to determine the present economic value implications of the reduction in nitrogen, phosphorus, and sediment loads of alternative land-use change scenarios and pass that value on to localities as a forestland credit in the TMDL model to create an incentive for local officials and private land owners to retain more high-conservation-value forestland now.
The project was designed to advance implementation of several cross-goal benefits identified in the Chesapeake Bay Program’s Healthy Watersheds Management Strategy and to create collaboration opportunities with other Chesapeake Bay Program Goal Implementation Team (GITs) stated goals and outcomes to minimize the effect of potential barriers to success. Proving the value of a forestland retention credit in the TMDL model along with the creation of a toolbox of policies and incentives that can be used to stimulate forestland retention throughout the watershed are principle objectives of the project.
It also supports the following priorities of other Chesapeake Bay Partner Program Goal Implementation Teams:
1. The Protected Lands Management Strategy language related to crediting conservation: “Land conservation is not credited towards reductions in the Bay jurisdictions’ annual pollution reduction progress reporting. However, land conservation may be able to generate credits for use in compliance trades and/or as offsets for new loads. There may also be opportunities to quantify and incorporate conservation practices into the Chesapeake Bay Program decision support system and to explore how land use projections might be used to quantify future pollutant load reduction incentives for land conservation”;
2. The Water Quality Goal Implementation Team’s efforts to meet the Watershed Implementation
Plan (WIP) and Water Quality Standards Attainment & Monitoring Outcomes associated with meeting the goals of the Chesapeake Bay Total Maximum Daily Load (TMDL); as well as the desired outcomes for its Riparian Forest Buffer and Urban Tree Canopy strategies;
3. The Vital Habitat Goal Implementation Team’s call for cooperation in listing and maintaining a
network of land and water habitats that support priority species, water quality, recreational uses, and scenic values;
4. The Stewardship Goal Implementation Team’s strategy of promoting individual stewardship,
supporting environmental education, protected lands and assisting citizens, communities, and local governments in undertaking conservation initiatives in the Bay region; and
5. The Enhancing Partnering, Leadership and Management Goal Implementation Team’s Local

HEALTHY WATERS/FOREST RETENTION STUDY FINAL REPORT: JUNE 30, 2017 13
Leadership Management Strategy objective to increase the knowledge and capacity of local officials on issues relating to water resources and the implementation of economic and policy incentives that support local conservation actions.
PHASE I
Project Design The portion of the basin encompassed by the George Washington Regional Commission’s (GWRC) service area was selected for a Phase I proof-of-concept alternative growth scenario modeling study for cost reasons and because it served well as a microcosm of the Rappahannock River Basin sharing many of the same attributes as the basin at-large, including a strong commitment to water quality leadership through the GWRC. The objective of Phase I was to model various land use scenarios using EPA/TMDL model methodologies and high resolution land use data provided by the GWRC localities to determine if forest retention actions by individual localities would result in a decrease in actual load over their current 2025 projected TMDL load allocation land cover. The modeling data and assumptions were shared with EPA and localities to determine the present economic value implications of the reduction in nitrogen, phosphorus, and sediment loads of alternative land-use-change scenarios. The broader, longer term goal was to develop a Chesapeake Bay watershed-wide methodology with local level metrics. Once done, the value could be passed on to localities as a forestland retention credit in the TMDL model to create a greater incentive for localities to implement land use policies to retain more high-conservation-value forestland.
Data collection and scenario modeling was completed July 31, 2015 using different assessments and evaluations of growth trends in the pilot region that paralleled modeling criteria the Chesapeake Bay (CB) program used to revise the 2017 6.0 version of the CB TMDL model. The effort was completed in coordination with Chesapeake Bay program staff, DEQ and the GWRC pilot area localities. The scenarios were as follows:
A. The current TMDL 2025 predictions (based on revised 2015 land cover estimates) for the localities in the pilot area;
B. A model based on projected land use if pending developments approved for development in accordance with the comprehensive plans for each locality in the pilot area and development proffers were followed and implemented;
C. A green infrastructure model that significantly factored in increased forestland retention (i.e. 10% reduction in rate of forest loss assumed under Scenario 1); and
D. A hypothetical scenario that was a hybrid between (2) and (3) which postponed 50 percent of projected forest loss from long-term development until the post-2025 era.
E. In addition, 2010 and 2015 scenarios were also run to identify trends.
The results of the alternative development model scenario runs confirmed the water quality and healthy watershed value of forestland retention and demonstrated that a range of potential offsets are possible depending on the investment made early in BMPs that retain forestland. Summary charts are provided in Appendix A. Quantification of the offset economic values demonstrated possible savings of up to $125 million depending on the land use planning decisions made. This information has been shared to inform discussions

HEALTHY WATERS/FOREST RETENTION STUDY FINAL REPORT: JUNE 30, 2017 14
in Phase II with local government leaders, EPA, and pertinent Chesapeake Bay Program Goal Implementation Teams.
Concurrently with the Phase I scenario modeling work, the Virginia Water Resources Research Center at Virginia Tech conducted an independent review and synthesis of the literature regarding ecosystem services related to water-quality protection and remediation provided by forests. This review looked at the specific attributes of forestland that contribute to those ecosystem services to provide information for prioritization of forestland retention decisions in the pilot area. Evaluation of spatial variability and landscape position of water-related ecosystem services provided within classifications of forestland was considered as part of the literature review. This will help in determining which forest areas (e.g., headwaters, upland, lowland, riparian, etc.) in Virginia’s diverse geomorphic regions offer the greatest value if retained or otherwise protected from development. A complete copy of the literature review conducted by the Water Resources Research Center at Virginia Tech is provided in Appendix B.
At the end of Phase I, all findings and recommendations were presented to EPA, the Chesapeake Bay Healthy Watershed Goal Implementation Team and to local elected and appointed leaders in the Rappahannock River Basin at a summit held September 23, 2015 sponsored by the Rappahannock River Basin Commission. A workshop at the summit was structured to begin discussions with local officials on strategic implementation strategy next steps including policy, incentives and land use planning approaches that would be tested and if successful, captured to create the basis for the tool box that could be incorporated into a planned Chesapeake Bay Program on-line repository and used by all the jurisdictions in the Chesapeake Bay watershed.
PHASE II PROJECT DESIGN Because of the potentially very significant offset savings resulting from greater forestland retention demonstrated in Phase I, a phase II of the project was authorized and as noted previously, at the urging of the Chesapeake Bay Program Partners phase II was also expanded to a Commonwealth to Commonwealth partnership between Virginia and Pennsylvania. The goal was to collaborate on initiatives aimed at helping both jurisdictions meet the 2015 Chesapeake Bay Watershed Agreement (CBWA) goals and objectives.
In Phase II, Pennsylvania tested how Virginia’s phase I methodology could be applied in Pennsylvania and the two Commonwealths worked concurrently with their localities to develop the suite of tools necessary to implement forest retention actions that support CBWA Healthy Watershed goals and outcomes. The goal was to develop a toolbox of incentives, policies, etc. that can augment and support a forestland retention credit in the TMDL model 6.0 version along with challenges that could constrain forestland retention. Such findings could then be shared with the other Chesapeake Bay watershed jurisdictions and provide them with tool options that fit their own situations and further the goal of sustaining currently healthy sub-watersheds throughout the entire Chesapeake Bay Watershed.

HEALTHY WATERS/FOREST RETENTION STUDY FINAL REPORT: JUNE 30, 2017 15
STUDY AREAS VIRGINIA The Rappahannock River Basin was selected as the project study area to serve as a proxy for the Chesapeake Bay Watershed. The reasons for this choice were because the basin mirrors most of the attributes of the Chesapeake Bay Watershed, e.g.: ● Geography: headwaters to coast ● Land Use: forest, agriculture, urban, rural ● Areas of high-density development growth ● Rappahannock River Basin Commission (RRBC)
consisting of local government leaders and VA General Assembly members with long, active leadership history promoting innovative approaches for meeting water quality goals
● Basin is 100 percent in Virginia so watershed issues outside of Virginia control are minimal (other than air).
PENNSYLVANIA The Yellow Breeches Creek (YBC) watershed was selected as the project study area to serve as a proxy for the Pennsylvania portion of the Chesapeake Bay Watershed. Moreover, the watershed in South-Central PA was chosen for its proximity to Harrisburg as the State capitol and because it serves well as a microcosm of the Chesapeake Bay watershed in Pennsylvania, e.g.:
• Has diverse Land Cover: rural forest and agriculture, small town urban and suburban
• Has areas of moderate-density development growth
• Is 100 percent in Pennsylvania and has variety of local government forms to model different urban and rural land cover scenarios.
• Has local communities that reflect a full range of interest in preserving and/or improving the water quality of the watershed.
Figure 2. Rappahannock River Basin
Figure 3. Yellow Breeches Creek Watershed

HEALTHY WATERS/FOREST RETENTION STUDY FINAL REPORT: JUNE 30, 2017 16
FOREST RETENTION MODELING METHODOLOGY AND FINDINGS VIRGINIA (PHASE I) 1. Methodology: Data Collection
• Necessary data inputs from local governments within the pilot study area included: a) Current local parcel GIS polygon datasets (.shp), indicating parcel improvement status, zoning,
acreage, parcel ownership information, year structure built
b) Subdivision GIS polygon datasets, with subdivision name and number of improved and current vacant lots.
• Data inputs from the USGS/Chesapeake Bay Program, the Virginia Department of Environmental Quality and the Virginia Department of Conservation and Recreation included:
• Confirmed Rappahannock River Basin riversegmentshed GIS polygon files (.shp) • Estimated acreages and change rates by 5-year period (1995-2000, 2000-2005, 2005-2010, and
2010-2015) for all major land cover categories of the BayFAST model for each riversegmentshed of the Rappahannock River basin in PD 16
• Projection data1, for each land cover type for 2020 & 2025 by riversegmentshed by locality for the Rappahannock River basin (GWRC service area part)
• Urban BMP inventory by riversegmentshed • Latest conservation easement and conserved lands .shp layers for PD 16 (see Figure 4)
Figure 4. Conserved and Easement Lands in Rappahannock River Watershed
Data inputs from the George Washington Regional Commission (GWRC) included:
a) Socio-Economic (Population & Employment) 2005 Estimates and 2035 Projections by Traffic Zone from 2035 Constrained Long-Range Transportation Plan (CLRTP).
b) Socio-Economic (Population & Employment) 2010 Estimates and 2040 Projections by Traffic
1 Land use data estimated both before & after BMPs are applied to the land, since some BMPs convert projected agricultural or urban lands to forest. Both versions for each year are available.

HEALTHY WATERS/FOREST RETENTION STUDY FINAL REPORT: JUNE 30, 2017 17
Zone from 2035 CLRTP.
Data inputs from within the pilot study area from Google Earth included 2013 color photography imagery for delineation of existing forestry/tree canopy coverage polygons.
2. Methodology: Data Preparation a) Data Cropping: used GIS to crop various spatial (ArcGIS .shp) files to the Rappahannock River
Watershed area in PD 16 b) Geo-tagging: used GIS to assign all area polygon data (e.g. parcels, subdivisions, conservation
easements, conserved lands, traffic zones, forestry cover polygons, etc.) to the corresponding riversegmentshed and locality (FIPS)
c) Digitizing: created existing forestry polygons to obtain acreage value d) Interpolation: used to define 2010 base year, 2015 current condition and 2025 horizon year
data by traffic zone (applied to riversegmentsheds) for “business as usual” (decentralized) and “community plans” scenarios.
e) Overlay: done to determine the impact of existing approved subdivisions and PUDs on the forestry cover layer and determine the amount of forest cover throughout the watershed and by riversegmentshed that is already under a form of conservation protection.
PENNSYLVANIA (PHASE II) 1. Methodology: Data Collection
Spatial data collection efforts included acquiring the following:
• Chesapeake Bay watershed land-riversegment shed polygon layer, • Chesapeake Bay TMDL model 5.3.2 land cover and pollutant load data, 2010-2025 by land-
riversegmentshed • National Land Cover datasets, 2001-2006-2011 • Municipal and County level GIS data • Chesapeake Bay 2013 High Resolution Land Cover Imagery data (polygon and raster) • Polygon file of municipality borders • Population Estimates and Projections for all municipalities in the study area
Reference publications on Pennsylvania local government, and municipal planning, zoning, subdivision and planned unit development regulations and administration; Pennsylvania forest and agricultural land protection programs, conservation easement law, the “Clean and Green” program, Natural Resources Conservation Services programs, U.S. Department of Agriculture Forest Service programs, etc.
2. Methodology: Data Preparation The spatial data files defining the riversegmentsheds were “clipped” (or “cropped”) to fit the actual hydrological area of the YBC watershed, omitting small areas in Adams County and small areas of a few municipalities that were barely in the watershed. These deletions required manual adjustments of the land cover data which were prepared by DCNR staff.
The spatial data files defining the riversegmentsheds were “clipped” (or “cropped”) to fit the actual hydrological area of the YBC watershed, omitting small areas in Adams County and small areas of a few municipalities that were barely in the watershed. These deletions required manual adjustments

HEALTHY WATERS/FOREST RETENTION STUDY FINAL REPORT: JUNE 30, 2017 18
of the land cover data which were prepared by Department of Conservation and Natural Resources (DCNR) staff.
2010 land cover data were enhanced by replacing forest and tree canopy estimates with 2010 forest and tree canopy estimates from 1-meter National Agricultural Imagery Program (NAIP) data, with the other land covers (except water area) proportionally reduced to equal the total for each riversegmentshed area.
While 2013 1-meter land cover data were available for analysis, the land cover categories in which the data are aggregated did not line up with previous land cover categories. Agriculture was also not clearly defined in the 2013 land cover, despite being a critically-important category regarding run-off estimations. Due to this, National Land Cover Data were used, ranging from 2001 to 2011 for historical trends, and adjusted using a 2010 1-meter tree canopy raster. This was done to reflect as accurately as possible a 2010 baseline dataset for land cover throughout the watershed.
Forecasting Land Cover Change: 2010 – 2025
VIRGINIA (PHASE I) The method of developing local estimates by riversegmentshed varied by locality, based (in part) on the availability of local spatial (GIS) data files. To avoid repetition of the list of GIS data files provided and used (to varying degrees), they are summarized in the following tables.
Table 1. 2015 Local Land Cover Estimates
Locality Tax Parcels Subdivision
Borders Zoning RPA Border Conservation
Easements Federal, State &
Local Lands Water Areas Tree
Canopy Land Use City • • • • DCR • • • • Caroline • • • • DCR • • King George • • • • DCR • • Spotsylvania • • • • DCR • • Stafford • • • • Local/DCR • • •
Table 2. Components of Impervious Surface Area Layer
Locality
Components of Impervious Surface Area Layer
Actual Layer
Street Centerlines
Street ROW Driveways Sidewalks
Building Footprints
Parking Lots
Pools & Hard
Courts Other City 1. • Caroline • • • King George • • • • • o o Spotsylvania • • • • • • • o Stafford 2. • • • • • • • •
• = locally-provided o = calculated by RDS, LLC
1. Impervious area included in urban tree canopy study (2010) based on summer, 2008 1-meter NAIP imagery classified by VDOF imagery analyst Jim Pugh. 2. Impervious layer created by Stafford Co. by converging multiple spatial data layers, including: airports, athletic courts, bridges, buildings, concrete slabs, open
storage, paved driveways, paved medians, paved parking, pools, paved roads, public sidewalks, (storage) tanks, unpaved driveways, unpaved roads, unpaved parking.
The process of developing a “current/2015” land cover estimate for each locality and each riversegmentshed area is summarized below.

HEALTHY WATERS/FOREST RETENTION STUDY FINAL REPORT: JUNE 30, 2017 19
City of Fredericksburg The City2 is completely encompassed by and unique in the study area due to the existence of a land cover/urban tree canopy (UTC) spatial dataset3. This file represented a study performed by the Virginia Department of Forestry (VDOF) in 2010, based on summer 2008 one-meter imagery. This dataset, provided by VDOF as a GIS data layer, provided an excellent starting point for identifying necessary updates. Overlaying this GIS layer on the current (2014) Google Maps and/or Microsoft Bing high-resolution imagery, combined with updated reference layers from the City, produced an updated layer that reflected new development in the City since the original 2008 imagery was taken as well as land cover conversions (e.g. building demolition reverting to open space).
Updated GIS layers (e.g. building footprints) provided by the City were merged with the Urban Tree Cover (UTC) land cover file to confirm current building impervious areas. These included adding new buildings constructed by the University of Mary Washington and other private development interests as well as identifying older buildings which have been removed reverting the impervious area to pervious open space. In addition, paved additions to the City bike trail system, public and private parking areas, City-defined paved ROW and other available impervious feature layers were added to enhance the non-building impervious layer. Pre- and post-updated land coverage for the City as a whole is shown in the following table.
Table 3. City of Fredericksburg Land Cover
Land Cover Total Acres: Pre-Update (2008)
Total Acres: Post-Update (2015)
Update: Net Difference (+/-)
Building Impervious 463 604 141 Non-Building Impervious 1,658 1,597 -61 Non-tree Vegetation 1,609 1,512 -36 Tree Canopy 2,979 2,981 2 Water 55 73 18 Total 6,754 6,828 64
The enhanced land cover polygon file was then queried to obtain aggregate updated land cover estimates for each of the three riversegmentshed areas within the City of Fredericksburg.
General Methodology for Current Land Cover for County Areas Each County’s tax parcel file was cropped to create a land cover work file covering the Rappahannock River watershed area of each County. Several attribute columns were added to the work file, including riversegmentshed ID, acres, and (land) cover class (to store the description of the RDS-determined current land cover on the parcel). The work file was then viewed in the GIS with Google Maps (Hybrid view) imagery (2014) as a background image and parcel boundaries were merged, adjusted, deleted or otherwise modified to conform to a close approximation of the dominant land cover pattern for the immediate area and the project area as a whole. This operation provided a vector polygon file for the approximate boundaries between land cover types. This vector boundary file is useful to identify the areas (and amount of protection) provided by existing RPA, conservation and riparian easement boundaries described by other GIS vector polygon datasets.
2 Containing 6,771.67 acres in land area and 24,286 persons in 2010. 3 Land cover types include: building impervious, non-building impervious, non-tree vegetation, tree canopy, and water.
Source: Va. Dept. of Forestry, “A Report on Fredericksburg’s Existing and Possible Urban Tree Canopy”, (Virginia Tech, 2010); and Regional Decision Systems, LLC, 2015.

HEALTHY WATERS/FOREST RETENTION STUDY FINAL REPORT: JUNE 30, 2017 20
For parcel lots in subdivisions adjoining forested areas where the forest appeared to cover a significant portion of the back or side yard of a property, the areas taken up by the house, out-buildings, scattered trees and yard were coded as “pervious”, whereas the denser, tree-covered area of the lot was described as “forest”. Water bodies were digitized and coded as “water along with stream channels (where the imagery reflected a transition in vegetation pattern from wetland to upland vegetation).
The resulting aggregate area for each land cover type (e.g. forest, pervious, construction, extraction) was then adjusted (reduced) to take into account the existence of impervious area (i.e. building footprint area + public road paved roadway4 and other impervious features) within the aggregate area covered by each land cover type. Finally, each land cover record was coded for being partially or wholly located in the County RPA, a conservation easement or affected by considerations affecting future development potential.
Unique Methods or Assumptions by County
1. Caroline County The study area (75,546.05 acres) covers 21.89 percent of the County land area (344,960 acres) and includes 1,889 persons (6.6 percent of the County population (2010). Most of the study area is covered by portions of Fort A. P. Hill and is under federal government jurisdiction. Ideally, if the data had been available, such features as driveways, sidewalks, parking lots and other surfaces would have been included. For this portion of the study area, driveway surface area was estimated based on the average length of driveways observed in King George County and multiplied by the number of residences within the Caroline study area and the assumed width of 10 feet per driveway. Otherwise, due to budgetary limitations and the comparative rural nature of the Caroline portion of the study area, these elements were not included.
2. King George County The study area (45,644.64 acres) covers 37.9 percent of the County land area and includes 6,817 persons (28.9 percent of the County 2010 population). The provided sidewalk centerline file was enhanced by manually digitizing (from Google Maps 2014 imagery) additional sidewalks in the Hopyard subdivision as well as other developed areas (e.g. near County courthouse). The sidewalk and driveway centerline (polyline) layers were converted to polygon files by using a 2 ft. buffer for sidewalks and 10 ft. buffer to define driveway areas.
4 Unless defined by locally-supplied GIS layer, paved roadway was estimated by multiplying the study area’s (and for each riversegmentshed area) aggregate length (miles) of road centerline x 5280 ft. = total linear feet, times the number of lanes (2-lane assumed for all roads, except US Rt. 301 and St. Route 3, which were coded as 4-lane), x 10 ft. per lane = total square feet of paved road surface, which was then divided by 43,560 sq. feet per acre = total acres of paved roadway.
Figure 5. Caroline County Study Area
Figure 6. King George County Study Area

HEALTHY WATERS/FOREST RETENTION STUDY FINAL REPORT: JUNE 30, 2017 21
3. Spotsylvania County The study area (60,004.78 acres) covers 22.75 percent of the County land area (263,680 acres) and includes 86,197 persons (70.4 percent of the County 2010 population). The County GIS department provided many spatial data layers which were merged to create an impervious surface layer generally comparable to the layer provided by Stafford County.
4. Stafford County The study area (52,390.15 acres) covers 29.2 percent of the County land area (179,200 acres) and includes 42,092 persons (32.6 percent of the County 2010 population). The County GIS department provided a detailed impervious surface layer (2013-2014 vintage) which, when combined with building footprint area, provides a very accurate estimate of this land cover. The shape and extent of the other land cover types were determined by adjusting parcel lines to approximate the land cover outlines shown on Google and Bing maps imagery.
Supporting Demographic Assumptions Absent natural catastrophes such as wildfire, flood and tornadoes; land cover conversion is mostly a result of human actions through the land development process in response to economic and population growth. Consequently, it is necessary to understand how much development demand is expected to drive future land conversion. The sub-jurisdictional, sub-watershed population and economic forecasts used for this study are taken (depending on the scenario used) from the GWRC/Fredericksburg Area Metropolitan Planning Organization (FAMPO) 2035 or 2040 Constrained Long-Range Transportation Plans (CLRTP). However, these forecasts are based, in part, on GWRC’s analysis of other demographic and real estate market factors, such as changing family and average household size, rates of housing stock absorption, commercial space vacancy rates, etc.
Jurisdictions in Study Area
2010 Census
Total Population
Total Occupied Vacant Housing Average Household Housing Housing Housing Vacancy Household Population Units Units Units Rate Size
Caroline Co. 1,889 1,619 727 644 83 11.42% 2.514 Share of Study Area 1.17% 1.04% 1.21% 1.15% 2.22%
Fredericksburg, City of 24,286 21,655 10,442 9,484 958 9.17% 2.283 Share of Study Area 15.06% 13.88% 17.44% 16.90% 25.64%
King George Co. 6,817 6,657 2,551 2,320 231 9.06% 2.869 Share of Study Area 4.23% 4.27% 4.26% 4.13% 6.18%
Spotsylvania Co. 86,197 84,101 30,657 29,038 1,619 5.28% 2.896 Share of Study Area 53.45% 53.91% 51.21% 51.73% 43.32%
Stafford Co. 42,092 41,966 15,488 14,644 846 5.46% 2.910 Share of Study Area 26.10% 26.90% 25.87% 26.09% 22.64%
GWRC - Rappahannock Watershed 161,281 155,998 59,865 56,130 3,737 6.24% 2.791 Source: Regional Decision Systems, LLC. 2010 Block Statistics, aggregated for study area.
Figure 7. Spotsylvania County Study Area
Figure 8. Stafford County Study Area
Table 4. 2010 Household Population Data by Jurisdiction

HEALTHY WATERS/FOREST RETENTION STUDY FINAL REPORT: JUNE 30, 2017 22
Population Projections for PD 16 and Rappahannock Watershed area The historic rapid population growth of the region and its unique geographic setting midway between the national and Virginia state capitals makes population projection work a difficult challenge. Commonly, population projections continue to extrapolate past growth trends over several decades into the future. This was the case for projections used for the last 2 CLRTP updates and is generally the method behind the “official” local population projections produced under contract for the Virginia Employment Commission by the Demographics Research team of the Weldon Cooper Center at the University of Virginia.
These forecasts generally failed to consider the dampening effect of the Great Recession era (Dec. 2007 – June 2009) on housing and credit markets and the unexpected extended duration of the housing market’s recovery. Consequently, they already portray population growth greater than actually measured by their own Population Estimates program. To mirror the effect of this slow recovery on the long-term population growth of the study area, the short-term 2010-2014 population growth trend was used to dampen existing “official” forecasts as shown below. These forecasts are believed to represent the “new normal” for continued population growth of the study area for some time to come.
Total Population Jurisdiction 2010 2014 2015 2020 2025 2030 Caroline County 28,545 29,727 29,973 31,400 32,423 33,447 King George County 23,584 24,739 25,347 27,109 28,553 29,997 Spotsylvania County 122,397 126,337 144,316 166,236 195,077 223,917 Stafford County 128,961 138,230 153,557 178,152 211,281 244,410 Fredericksburg city 24,286 28,213 25,466 26,647 27,515 28,383
GWRC-PD 16 327,773 347,246 378,658 429,544 494,849 560,154 Group Quarters Population Jurisdiction 2010 2014 2015 2020 2025 2030 Caroline Co 513 565 1,725 1,881 2,098 2,463 King George Co 301 332 330 333 344 374 Spotsylvania Co 524 577 1,133 1,266 1,440 1,710 Stafford Co 3,593 3,958 2,941 3,049 3,310 3,777 Fredericksburg city 2,596 2,860 2,353 2,381 2,470 2,700
GWRC-PD 16 7,527 8,292 8,483 8,911 9,660 11,024 Household Population Jurisdiction 2010 2014 2015 2020 2025 2030 Caroline Co 28,032 29,162 28,247 29,520 30,326 30,984 King George Co 23,283 24,407 25,016 26,776 28,209 29,623 Spotsylvania Co 121,873 125,760 143,184 164,969 193,637 222,208 Stafford Co 125,368 134,272 150,616 175,103 207,971 240,632 Fredericksburg city 21,690 25,353 23,113 24,265 25,045 25,684
GWRC-PD 16 320,246 338,954 370,176 420,633 485,188 549,131
Table 5. Projected Population Growth by Jurisdiction 2010 - 2030

HEALTHY WATERS/FOREST RETENTION STUDY FINAL REPORT: JUNE 30, 2017 23
Table 7 below also reflects the updated growth forecasts resulting from the post 2010 growth trends for the whole Middle Basin and the Rappahannock River watershed portion. The locality-level breakdown of the total population for the study area is shown in the detailed data tables in Appendix A.
*University of Virginia, Weldon Cooper Center, “Local Population Estimates for July 1, 2014”. Note: 2015-2030 “official” population projections have been downward-adjusted by RDS, LLC for consistency with the area growth rates from 2010-2014, and future population growth rates from decade to decade were applied to 2014 base estimate to complete forecast through 2030.
Average Household Size Jurisdiction 2010 2014 2015 2020 2025 2030 Caroline Co 2.68 2.64 2.64 2.64 2.64 2.64 King George Co 2.78 2.74 2.74 2.74 2.74 2.74 Spotsylvania Co 2.91 2.86 2.86 2.86 2.86 2.86 Stafford Co 3.00 2.95 2.95 2.95 2.95 2.95 Fredericksburg city 2.28 2.24 2.24 2.24 2.24 2.24
GWRC-PD 16 2.88 2.81 2.82 2.83 2.84 2.84 Note: The estimated 2014 average household size was estimated by regressing the local rates against the national trend from 2010-2014, and then held constant into the future since national demographic experts are undecided about future national trends due to the national debate over immigration policy.Occupied Housing Units Jurisdiction 2010 2014 2015 2020 2025 2030 Caroline Co 10,456 11,053 10,706 11,188 11,494 11,743 King George Co 8,376 8,918 9,140 9,783 10,307 10,824 Spotsylvania Co 41,942 43,897 49,979 57,583 67,590 77,563 Stafford Co 40,869 45,462 50,996 59,287 70,415 81,474 City of Fredericksburg 9,505 11,295 10,297 10,810 11,158 11,442
GWRC-PD 16 111,148 120,625 131,118 148,652 170,964 193,046 Total Housing Units Jurisdiction 2010 2014 2015 2020 2025 2030 Caroline Co 11,729 12,398 12,009 12,550 12,893 13,173 King George Co 9,477 10,090 10,342 11,069 11,662 12,246 Spotsylvania Co 45,185 47,291 53,843 62,036 72,816 83,560 Stafford Co 43,078 47,919 53,752 62,491 74,221 85,878 Fredericksburg city 10,467 12,438 11,339 11,904 12,287 12,600
GWRC-PD 16 119,936 130,137 141,286 160,051 183,879 207,457 Vacant Housing Stock Jurisdiction 2010 2014 2015 2020 2025 2030 Caroline Co 1,273 1,346 1,303 1,362 1,399 1,430 King George Co 1,101 1,172 1,201 1,286 1,355 1,423 Spotsylvania Co 3,243 3,394 3,864 4,452 5,226 5,997 Stafford Co 2,209 2,457 2,756 3,204 3,806 4,404 Fredericksburg city 962 1,143 1,042 1,094 1,129 1,158
GWRC-PD 16 8,788 9,537 10,367 11,753 13,517 15,263 Housing Units Vacancy Rate Jurisdiction 2010 2014 2015 2020 2025 2030 Caroline Co 10.85% 10.85% 10.85% 10.85% 10.85% 10.85% King George Co 11.62% 11.62% 11.62% 11.62% 11.62% 11.62% Spotsylvania Co 7.18% 7.18% 7.18% 7.18% 7.18% 7.18% Stafford Co 5.13% 5.13% 5.13% 5.13% 5.13% 5.13% Fredericksburg city 9.19% 9.19% 9.19% 9.19% 9.19% 9.19%
GWRC-PD 16 7.33% 7.33% 7.34% 7.34% 7.35% 7.36%
Geography Sub-Area Total Population (Household and Group Quarters Combined)
2010 2014 2015 2020 2025 2030
Middle Basin
Rappahannock River Watershed Area 161,281 182,955 188,008 213,273 245,698 295,130 Rappahannock River Basin Communities 327,773 347,246* 356,837 404,790 466,331 560,154 Share of Total Middle Basin Area 49.21% 52.69% 52.69% 52.69% 52.69% 52.69%
Table 7. Population Breakdown by Sub-Area in Pilot Study Area
Table 6. Housing Data by Jurisdiction 2010 - 2030

HEALTHY WATERS/FOREST RETENTION STUDY FINAL REPORT: JUNE 30, 2017 24
PENNSYLVANIA (PHASE II)
Population Trends and Projections for the YBC Watershed In light of the significance of municipalities as the land development approval authority for all of the YBC watershed and throughout Pennsylvania (PA), the project team was challenged to find municipal-level population projections, as both the Penn State Data Center and the Center for Rural Pennsylvania both only produce County-level population projections. In the absence of locally-prepared municipality projections produced by either York or Cumberland Counties, this study is based on a series of 2010-2040 population projections developed by the PA Department of Environmental Protection for the State Water Plan (see Table 8).
Note: The full municipal detail for this table can be found in Appendix C. Municipal data used represent the total area for the municipality, so County portions and watershed totals may overstate population total for the actual resident population within the YBC watershed area boundary.
Sources:
1) Center for Rural Pennsylvania, Pennsylvania Population Projections, 2010-2040, (2014) at: http://www.rural.palegislature.us/documents/reports/Population_Projections_Report.pdf
2) PA Dept. of Environmental Protection, “Population Projection Report” found at: http://www.pawaterplan.dep.state.pa.us/docs/TechnicalDocuments/2010_2040PopulationProjections.pdf
3) York County Planning Commission, York County Population Projections, 2020 -2050 (2011) found at http://www.ycpc.org/images/pdfs/2011_Pop_Projections_2020-2050.pdf
A review of the above table illustrates that the YBC watershed study area has been growing at 2.5 – 3 times the growth rate for the Commonwealth of Pennsylvania as a whole. Projected growth rates show a slight slowdown (as compared with the State), but continued population growth pressure is expected in the YBC watershed. Additional demographic and socio-economic data about the YBC watershed study area can be found in Appendix C.
DEMOGRAPHIC DATA Pennsylvania (State Total)
Cumberland Co. (pt.)
York Co. (pt.) Study Area
Total Pct. Of PA
Total (Data Source:) (1) (2) (3)
POPULATION TRENDS Population, 1960 11,319,366 68,722 18,595 87,317 0.77% Population, 1970 11,793,909 88,488 23,961 112,449 0.95% Population, 1980 11,863,895 99,198 30,480 129,678 1.09% Population, 1990 11,881,643 108,282 35,989 144,271 1.21% Population, 2000 12,281,071 120,466 42,338 162,804 1.33% Population, 2010 12,702,379 132,542 48,092 180,634 1.42%
% Change, 2000-10 3.40% 10.00% 13.60% 10.95% N/A Population, 2014 (Estimate) 12,787,209 137,104 49,250 186,354 1.46%
% Change, 2010-14 0.70% 3.40% 2.40% 3.17% N/A POPULATION PROJECTIONS
Population, 2020 13,230,170 144,987 53,021 198,008 1.50% % Change, 2010-2020 4.20% 9.40% 10.20% 9.62% N/A
Population, 2025 13,494,882 151,091 56,229 207,320 1.54% % Change, 2010 -2025 6.20% 14.00% 16.90% 14.77% N/A
Population, 2030 13,759,594 157,195 59,436 216,631 1.57% % Change, 2020-2030 4.00% 8.40% 12.10% 9.41% N/A
Population, 2040 14,132,588 169,260 64,993 234,253 1.66% % Change, 2020-2030 2.70% 7.70% 9.30% 8.13% N/A
Table 8. Projected Population Growth by County Portion 2010 - 2040

HEALTHY WATERS/FOREST RETENTION STUDY FINAL REPORT: JUNE 30, 2017 25
Land Cover Conversion Trends, 2001-2011 The YBC watershed is an area of approximately 193 square miles (excluding a small area in Adams County). Over the decade from 2001 to 2011, 2,338 acres of forest cover (-3.45 percent), and 4,517 acres of agricultural lands (-15.64 percent) were converted; while 6,223 additional acres of developed pervious (+52 percent) and 532 acres (3.67 percent) of developed impervious area were added in the watershed (see Table 9).
Source: Compiled by RDS, LLC from land cover data provided by PA DCNR staff member, John Smoluk, using the Multi-Resolution Land Characteristics (MRLC) Consortium, National Land Cover Datasets, (30 meter resolution). See: https://www.mrlc.gov/nlcd2011.php. Source: Ibid.
The land cover conversion data model that informs the Chesapeake Bay TMDL water quality model applies the assumption, among others, that land cover conversion will continue to follow historical trends and be correlated with urbanization and population growth. To validate whether these assumptions were appropriate within these two different scenario areas, the National Land Cover Dataset (2001, 2011) was processed to develop localized trends of land cover change for comparison with land cover conversion trends of the 5.3.2 Chesapeake Bay TMDL Model.
YBC Watershed (in Cumberland & York Counties’ Portions of the Watershed) Land Cover 2001 2006 2011 2001 - 2011 2011
Simplified Categories Land Cover Type Acres Acres Acres
Acreage Change
Percent Change
Share of Total
Forest Cover 67,748.796 66,442.145 65,411.048 -2,337.748 -3.45% 53.02% Developed, Pervious 11,823.287 16,888.998 18,046.702 6,223.414 52.64% 14.63% Developed, Impervious 14,505.046 14,268.930 15,037.171 532.125 3.67% 12.19% Agriculture 28,857.012 25,340.580 24,344.283 -4,512.728 -15.64% 19.73% Water 440.221 433.105 534.089 93.868 21.32% 0.43% Total 123,374.362 123,373.758 123,373.293 -1.069 0.00% 100.00%
YBC Watershed (in Cumberland & York Counties’ Portions of the Watershed) Land Cover 2001 2006 2011 2001 - 2011 2011
Land Cover Type Acres Acres Acres Acreage Change
Percent Change
Share of Total
Barren Land 4.687 7.031 35.408 30.721 655.45% 0.03% Cultivated Cropland 13,505.468 13,384.048 13,212.356 -293.112 -2.17% 10.71% Deciduous Forest 56,802.118 57,075.311 56,377.324 -424.794 -0.75% 45.70% Developed, High Intensity 1,033.490 1,100.212 1,241.132 207.642 20.09% 1.01% Developed, Low Intensity 9,701.335 10,045.742 10,128.853 427.518 4.41% 8.21% Developed, Medium Intensity 3,770.222 3,122.976 3,667.186 -103.036 -2.73% 2.97% Developed, Open Space 7,714.540 9,926.658 11,117.635 3,403.095 44.11% 9.01% Emergent Herbaceous Wetlands 3,168.618 1,997.775 1,708.013 -1,460.605 -46.10% 1.38% Evergreen Forest 3,285.742 2,974.145 2,953.757 -331.985 -10.10% 2.39% Grassland/Herbaceous 0.000 22.531 337.491 337.491 0.27% Mixed Forest 3,111.779 2,954.763 2,924.715 -187.065 -6.01% 2.37% Open Water 440.221 433.105 534.089 93.868 21.32% 0.43% Pasture/Hay 15,351.544 11,956.532 11,131.928 -4,219.616 -27.49% 9.02% Shrub/Scrub 4,104.060 6,932.777 6,556.168 2,452.108 59.75% 5.31% Woody Wetlands 1,380.539 1,440.151 1,447.239 66.700 4.83% 1.17% Grand Total 123,374.362 123,373.758 123,373.293 -1.069 0.00% 100.00%
Table 9. Land Cover Trends in Yellow Breeches Creek Watershed, 2001-2011

HEALTHY WATERS/FOREST RETENTION STUDY FINAL REPORT: JUNE 30, 2017 26
Differential Conversion Trends in Urban and Rural Municipalities of the Watershed Eleven municipalities of the study area were classified for this study as “urban” or “urbanizing” (based on their local percent coverage of impervious area with an aggregate land area of 24,138.93 acres, roughly a quarter of the aggregate land area (99,234.36 acres) of the rural municipalities. A comparison of the 2001-2011 land cover composition of the two groups of communities is presented in Table 10.
Table 10. Comparison of Local Land Cover Differences between Urban and Rural Municipalities, 2001-2011
Source: Compiled by RDS, LLC from land cover data provided by PA DCNR staff member, John Smoluk, using the Multi-Resolution Land Characteristics (MRLC) Consortium, National Land Cover Datasets, (30 meter resolution). See: https://www.mrlc.gov/nlcd2011.php. A more simplified summary of these data is presented in Table 11, which consistently groups similar land cover categories to make larger overall land cover conversion trends more obvious. The dramatic differences in the amount of forest and wetlands vs. developed lands, both pervious and impervious, shown in Table 11 underscore the reason for creating appropriate stormwater management BMP scenarios (i.e. Scenario C for the urban group and Scenario D for the rural group) to compare the relative value on forest retention strategies between the two areas. The dominance of developed land cover (i.e. 75.16 percent in 2011) in the urban municipalities compares starkly with the dominance of forest, wetland and agricultural land cover (81.35 percent in 2011) among the rural municipality group. It is apparent that the growth in developed impervious land cover in the urban municipalities has come mostly from the conversion of developed pervious and, to a lesser extent, forest lands. In this environment, testing the impact of urban stream restoration was the most obvious urban BMP. In contrast, for rural municipalities, the decline in agricultural and forest lands (and even developed impervious lands) has contributed to expansion of the developed pervious land cover (i.e. which can be explained by the growth of suburban, residential, and commercial landscaped lawns common with urbanization). For this group, testing the impact of Pennsylvania’s statewide strategy of riparian buffer restoration was considered most appropriate to measure the offset savings of forest retention.
An unexpected increase in agricultural land cover occurred in the Urban Municipalities group during the period from 2001 to 2011. Another urban group trend was a growth in water body surface area (which may be attributable to the growth in urban stormwater retention ponds associated with urban residential and commercial development). In the rural municipality group, the most prominent land cover change was the significant decline in water body surface area, the cause of which is unknown.

HEALTHY WATERS/FOREST RETENTION STUDY FINAL REPORT: JUNE 30, 2017 27
Table 11. Simplified Land Cover Differences between Urban and Rural Municipalities, 2001-2011
Source: Compiled by RDS, LLC from 30-meter NLCD imagery data summaries provided by PA DCNR. *Compound annual growth rate (CAGR)
Table 12. Percent Composition of Simplified Land Cover for Urban and Rural Municipalities, 2001-2011
Source: Compiled by RDS, LLC from 30-meter NLCD imagery data summaries provided by PA DCNR.
Finally, the more accurate and more current (2013) 1-meter high-resolution imagery (summarized in Table 13 on next page) provides a better profile of the relatively current land cover of the study area and highlights the important differences between the urban and rural municipality landscapes and the corresponding differences in non-point sources between these different areas (i.e. more urban vs. more rural).
Land Cover Class Scenario C Urban Municipalities Scenario D Rural Municipalities
2001 Acreage
2011 Acreage
% Annual Change* 2001 Acreage 2011
Acreage % AnnualChange*
Agriculture (Pasture, Hay, Cropland) 1,664.46 1,709.66 0.30% 15,031.03 14,624.85 -0.20%Developed/Impervious 10,143.59 11,007.96 0.91% 4,361.46 4,029.21 -0.56%Developed/Pervious 4,959.93 5,583.87 1.33% 8,901.03 10,997.80 1.52%Forest Cover/Woody Wetlands 6,582.73 4,964.72 -3.09% 58,088.67 57,862.48 -0.03%Water 788.62 872.72 1.13% 12,773.02 8,958.08 -2.50%Total 24,139.33 24,138.93 0.00% 99,155.21 96,472.42 -0.20%
Land Cover Urban Municipalities -
Land Cover Percent Rural Municipalities-Land Cover Percent
2001 2011 2001 2011 Agriculture 9.70% 9.76% 24.92% 20.85%Developed, Impervious 42.02% 45.60% 4.40% 4.06%Developed, Pervious 32.98% 29.56% 5.37% 7.81%Forest Cover/Woody Wetlands 14.84% 14.14% 61.47% 60.75%Water 0.47% 0.94% 0.33% 0.31%Total 100.00% 100.00% 100.00% 100.00%

HEALTHY WATERS/FOREST RETENTION STUDY FINAL REPORT: JUNE 30, 2017 28
Table 13. 2013 Land Cover of Urban and Rural Municipality Groups in YBC Watershed
Land Cover Description
Urban Municipalities Rural Municipalities Total YBC Watershed
Acreage Pct. of Total
Pct. of YBC Watershed Acreage
Pct. of Total
Pct. of YBC Watershed Acreage
Pct. of Total
Pct. of YBC Watershed
Barren 246.944 1.25% 34.57% 467.332 0.41% 65.43% 714.277 0.53% 100.00% Emergent Wetlands 24.362 0.12% 37.76% 40.160 0.04% 62.24% 64.523 0.05% 100.00% Low Vegetation 7,066.326 35.64% 16.07% 36,916.204 32.26% 83.93% 43,982.530 32.76% 100.00% Other Impervious Surface 2,307.317 11.64% 55.88% 1,821.755 1.59% 44.12% 4,129.072 3.08% 100.00%
Roads 944.771 4.76% 47.01% 1,065.026 0.93% 52.99% 2,009.797 1.50% 100.00% Scrub/Shrub 174.338 0.88% 16.90% 857.209 0.75% 83.10% 1,031.548 0.77% 100.00% Structures 1,372.700 6.92% 60.25% 905.637 0.79% 39.75% 2,278.337 1.70% 100.00% Tree Canopy 6,927.540 34.94% 8.86% 71,247.069 62.26% 91.14% 78,174.609 58.23% 100.00% Tree Canopy Over Other Impervious Surfaces
321.019 1.62% 53.51% 278.891 0.24% 46.49% 599.910 0.45% 100.00%
Tree Canopy Over Roads 187.813 0.95% 33.57% 371.686 0.32% 66.43% 559.499 0.42% 100.00%
Tree Canopy Over Structures 103.955 0.52% 55.63% 82.929 0.07% 44.37% 186.884 0.14% 100.00%
Water 151.320 0.76% 28.73% 375.307 0.33% 71.27% 526.626 0.39% 100.00% Grand Total 19,828.405 100.00% 14.77% 114,429.206 100.00% 85.23% 134,257.611 100.00% 100.00% SIMPLIFIED: Tree Canopy (Forest) & Wetlands 6,951.902 35.06% 8.89% 71,287.229 62.30% 91.11% 78,239.131 58.28% 100.00%
Impervious 5,237.575 26.41% 53.64% 4,525.925 3.96% 46.36% 9,763.499 7.27% 100.00% Pervious 7,487.609 37.76% 16.37% 38,240.746 33.42% 83.63% 45,728.355 34.06% 100.00% Water 151.320 0.76% 28.73% 375.307 0.33% 71.27% 526.626 0.39% 100.00% Grand Total 19,828.405 100.00% 14.77% 114,429.206 100.00% 85.23% 134,257.611 100.00% 100.00%
Source: Compiled by RDS, LLC from land cover data provided by PA DCNR staff.
Urban Municipalities include: Camp Hill borough, Dillsboro borough, East Pennsboro Twp., Fairview Twp. (25%), Hampden borough, Lower Allen twp., Mechanicsburg borough, Mt Holly Springs borough, New Cumberland Twp., Shiremanstown borough, Upper Allen Twp. Rural Municipalities include: Carroll Twp., Cooke Twp., Dickinson Twp., Fairview Twp. (75%), Franklin Twp., Monaghan Twp., Monroe Twp., Penn Twp., South Middleton Twp., South Newton Twp., Southampton Twp., Warrenton Twp.

HEALTHY WATERS/FOREST RETENTION STUDY FINAL REPORT: JUNE 30, 2017 29
SCENARIO MODELING VIRGINIA The Virginia Department of Environmental Quality (VDEQ) was responsible for modeling the various development scenarios. The BayFAST5 scenario model was used to compute the water quality (and associated pollution abatement cost) effects of different land cover scenarios selected by the project team. These scenarios were:
1. Modified TMDL Bay model: enhanced the base year estimate of forest cover for 2015 and applied Bay 5.3.2 model land cover conversion rates to create a modified 2025 land cover projection from enhanced 2015 base year estimate.
2. Community Plans: reflected projected land cover conversions resulting from all rezoning and
planned unit developments approved by local governments in conformance with local comprehensive plan and not yet built.
3. Forest Retention Scenario: based on modified TMDL Bay model scenario, with an adjustment
of reducing the rate of loss of forest cover assumed in Scenario 1 by 10 percent.
4. Phased Development/Forest Retention: preserves 50 percent of the projected forest cover lost from long-range build-out development projects used under Community Plans scenario until after 2025 horizon year.
5. In addition, for comparison purposes and to identify trends, modeling runs based on EPA’s
TMDL model methodology were run for 2015.
To initiate the BayFAST simulation, facilities were created to delineate the Rappahannock River Basin portion of each locality (Caroline, Fredericksburg, King George, Spotsylvania, and Stafford). The land use data from the BayFAST Scenario Development Templates representing each scenario was then used to create a unique facility-land use representing each scenario in each locality. Where necessary, the general land use classes (e.g. pervious) in the templates were broken out to the detailed land use classes (e.g. regulated pervious and unregulated pervious) needed in BayFAST based on the proportions of the detailed land classes in the Bay model 2015 land use. Each scenario was run in a “no action” state meaning they assumed no BMPs were present.
Detailed information pertaining to modeling methodology and the results achieved for each jurisdiction in the Phase I test area are provided under Appendix A and in the September 23, 2015 Phase I final report noted previously. That report is available on the Rappahannock River Basin website at https://rappriverbasin.org/.
PENNSYLVANIA The Pennsylvania Department of Conservation and Natural Resources (DCNR), working through its consultant The Center for Watershed Protection (CWP), was responsible for modeling the
5 For more information on BayFast model, see: http://www.bayfast.org/About.aspx

HEALTHY WATERS/FOREST RETENTION STUDY FINAL REPORT: JUNE 30, 2017 30
various development scenarios. The BayFAST5 scenario model was used to compute the water quality (and associated pollution abatement cost) effects of different land cover scenarios selected by the project team. These scenarios were:
A. A revised TMDL 2025 forecast (applying 2010-2025 TMDL growth rates to more accurate 2010 forest and other land cover estimates) by sub-watershed and aggregated for the localities in the pilot area,
B. A forest retention model that factored in increased forestland retention (i.e. by assuming a 10 percent reduction in the projected rate of forest loss, yielding more forest than the losses forecast under Scenario A),
C. An “Urban Community BMP” Scenario describes a future land cover pattern for a selected subset of municipalities in the study area that reflect local implementation of policies which are intended to encourage urban forest and tree canopy retention, as well as both afforestation and reforestation of vacant urban landscapes.
D. A “Rural Community Riparian Forest Buffer Restoration” Scenario describes a future rural land cover pattern where the Scenario A land cover projection is modified to include the assumed conversion of acreage gaps in existing riparian buffers with rural riparian forest buffer reforestation.
To initiate the BayFAST simulation, facilities were created to delineate the YBC watershed portion of each locality (i.e. Cumberland and York Counties)6. The land use data from the BayFAST Scenario Development Templates representing each scenario were then used to create a unique facility-land use representing each scenario in each locality. Where necessary, the general land use classes (e.g. pervious) in the templates were broken out to the detailed land use classes (e.g. regulated pervious and unregulated pervious) needed in BayFAST based on the proportions of the detailed land classes in the Bay model 2010 land use. Each scenario was run in a “no action” state meaning they assumed no BMPs were present.
SCENARIO DESCRIPTIONS VIRGINIA Scenario (A) 2025: Modified 5.3.2 Bay Model The existing baseline projected land cover conversion rates (2015-2025 from TMDL model ver. 5.3.2) were applied to the revised 2015 land cover estimates by riversegmentshed to create an alternative 2025 land cover projection. This scenario was designed to help simulate the effect of substituting one-meter imagery into the TMDL model without re-calibrating pollution run-off coefficients associated with historic and existing land cover. A revised population forecast (developed for this study) was used to reflect post-2010 population growth based on “official” 2014 estimated levels.
6 The small area of Adams County which lies in the YBC watershed was omitted from further study consideration due to its limited land area and minimal impact on the overall study results.

HEALTHY WATERS/FOREST RETENTION STUDY FINAL REPORT: JUNE 30, 2017 31
The approach to forecasting land cover conversion for the first scenario relied heavily on the existing assumptions and results of the Chesapeake Bay land use model, which has been derived from historic trends in land cover conversion at the sub-watershed level, and linear projections of population and economic growth associated with continued urban growth and sprawling development patterns. These forecasting assumptions assume urban development will continue to drive land conversion from forest and farmland/open space to subdivisions, commercial development and significant growth in the urban impervious area coverage. These forecasts also assume that local governments will continue to regulate development in much the same way they always have, without extraordinary efforts to encourage higher densities, tree canopy and forest retention.
Scenario (B) 2025: Community Plans Build-out This scenario was designed to simulate each locality’s implementation of its comprehensive plan through the granting of re-zonings and approval of residential subdivision and commercial and industrial plan of development (POD) applications found to conform to the goals of the adopted comprehensive plan. The 2015 Pre-BMP land cover base and a complete inventory of pending development information by riversegmentshed was used to show the net change (i.e. pre- and post-development) to existing land cover for effected parcels from all approved and pending development projects (irrespective of the rate of market demand for and absorption of the approved development). In the absence of specific approved development plans, existing undeveloped subdivision lots and vacant housing stock were used to absorb projected population and household growth. This scenario attempts to reflect the Scenario A “Modified Bay Model”” scenario impacted by approved development guided by local governments’ current open space and tree protection policies (if any) by zoning district and/or any proffered tree, forest and open space preservation commitments made by the developers.
Scenario (C) 2025: Greenprint/Forest Retention This scenario was derived from Scenario A by adjusting the 2025 land cover forecast to reflect the assumed implementation and enforcement of local tree canopy and forest retention policies (e.g. use of conservation subdivisions, tree protection ordinances, RPA enforcement and reforestation of riparian forest gaps, etc.) to protect and restore forest and tree canopy. All current forested acreage in RPA, conservation easements, and publically-owned riparian buffers; Federal, State and local government park or other land use is assumed to remain standing and not harvested. The net effect of the implementation of a variety of forest retention policies is assumed under this scenario to result in a 10 percent reduction in the Bay model’s predicted rate of forest acreage loss under Scenario A.
In light of the uncertainty regarding to what extent local governments might adopt forest retention policies and the amount of existing forest and tree canopy that could be affected without knowing where development might occur and what land covers might be impacted, the

HEALTHY WATERS/FOREST RETENTION STUDY FINAL REPORT: JUNE 30, 2017 32
project team arbitrarily developed this scenario using the assumption that the rate of forest loss would be slowed by 10 percent as compared to the case under Scenario A.
Scenario (D) 2025: Phased Development Impact on Community Plans Build-out Under this Scenario, in contrast to Scenario B, researchers hypothesized that rather than losing all of the forest acreage from approved development by 2025, the approved developments might, considering the long-term build-out of their projects with encouragement from local governments, pursue a phasing plan for land clearing and eventual development which could postpone 50 percent of the expected forest loss until some date after 2025.
PENNSYLVANIA Scenario (A) 2025: Modified 5.3.2 Bay Model The approach to forecasting land cover conversion for the first scenario relies heavily on the existing assumptions and results of the Chesapeake Bay 5.3.2 land use model. This model was derived from historic trends in land cover conversion at the sub-watershed level, and linear projections of population and economic growth associated with continued urban growth and sprawl development patterns. These forecasting assumptions assume urban development will continue to drive land conversion from forest and farmland/open space to subdivisions, commercial development and continued growth in urban impervious area coverage. These forecasts also assume that local governments will continue to regulate development in historical patterns, not accounting for extraordinary efforts to encourage higher development densities, or conservation of tree canopy and forest land cover.
The PA DCNR provided adjusted land cover data (see “5.3.2 Acreage” in Table 14 below) by riversegmentshed to the Center for Watershed Protection (CWP). To develop nutrient and sediment loading estimates, the Chesapeake Assessment and Scenario Tool (CAST) was used to establish loading rates for each land use category, by creating scenarios for each of the two counties (Cumberland and York) in the Yellow Breeches Creek (YBC) Watershed with 2010 initial conditions and no BMPs implemented. The CAST model was run and the results were sorted based on the riversegmentshed units in each county. Next, all riversegmentsheds in each of the counties, but not in the YBC watershed, were removed. Using Edge-of-Stream (EOS) total loads and the acres provided by CAST, CWP calculated the loading rate (lbs./ac./yr.) for each land use category in each riversegmentshed unit. CWP then used the adjusted land cover data (See Scenario A in Table 14 below) provided by Pennsylvania DCNR and the loading rates provided by CAST to calculate “Enhanced 2010 Land Cover” annual loads. Land cover data for riversegmentsheds were aggregated by County for presentation in Table 14.

HEALTHY WATERS/FOREST RETENTION STUDY FINAL REPORT: JUNE 30, 2017 33
Table 14. Land Cover Data for YBC Watershed BayFAST Scenarios
County Portion Model 5.3.2 Scenario A Scenario B Scenario C* Scenario D Scenario D**Cumberland Co. 2010 2025 2010 2025 2025 2010 2025 2010 2025Agriculture 30,280.34 29,557.12 29,190.33 28,084.49 27,944.88 30,072.53 16,006.26Forest 57,341.93 55,889.32 58,153.23 56,322.00 56,565.68 56,527.84 1,486.88Construction 402.04 305.16 355.78 317.75 303.56 388.38 205.54Extractive 679.46 680.30 689.37 664.95 650.76 666.74 177.29Impervious 5,993.06 6,550.00 5,439.98 6,118.94 6,085.58 5,773.00 4,446.58Pervious 15,333.44 17,053.00 14,314.61 16,636.71 16,594.37 14,863.00 12,728.37Water 396.67 395.55 385.50 384.37 384.37 390.30 186.53TOTAL 110,426.95 110,430.46 108,528.79 108,529.21 108,529.21 108,681.80 35,237.45York Co. 2010 2025 2010 2025 2025 2010 2025 2010 2025Agriculture 7,418.62 5,479.71 7,220.15 5,280.35 5,278.51 7,433.25 5,261.61Forest 12,794.15 13,262.14 11,539.42 11,527.71 11,530.29 12,794.15 11,372.17Construction 125.31 123.85 103.11 118.36 118.17 125.31 117.84Extractive 22.24 22.24 20.86 22.24 22.06 22.24 22.06Impervious 1,499.00 1,773.00 1,295.68 1,656.63 1,656.44 1,499.00 1,644.14Pervious 5,153.00 6,366.00 4,497.45 6,073.42 6,073.23 5,153.00 6,041.82Water 151.67 151.67 56.87 56.85 56.85 151.67 48.82TOTAL 27,163.99 27,178.62 24,733.54 24,735.54 24,735.54 27,178.62 24,508.45YBC Watershed 2010 2025 2010 2025 2025 2010 2025 2010 2025Agriculture 37,698.97 35,036.84 36,410.48 33,364.84 33,223.39 37,505.78 21,267.87Forest 70,136.08 69,151.46 69,692.66 67,849.71 68,095.97 69,321.99 12,859.05Construction 527.35 429.01 458.88 436.11 421.74 513.69 323.38Extractive 701.70 702.54 710.23 687.19 672.82 688.98 199.34Impervious 7,492.06 8,323.00 6,735.66 7,775.56 7,742.02 7,272.00 6,090.71Pervious 20,486.44 23,419.00 18,812.05 22,710.12 22,667.60 20,016.00 18,770.18Water 548.34 547.22 442.37 441.22 441.22 541.97 235.35TOTAL 137,590.94 137,609.07 133,262.33 133,264.75 133,264.75 135,860.42 59,745.90
* See Appendix C, Table 24 and discussion of Scenario C for land cover input for this scenario involving 3 municipalities. ** CWP’s BayFAST modelling consultant was unable to explain missing data for riversegmentsheds in Cumberland Co. summary data table provided RDS, LLC which prevents accurate comparison in this table for Scenario D 2025 scenario with 2010.
Adjusted 2011 land cover data by riversegmentshed were used to give general estimates of run-off and produce loads in the watershed per the Bay Model 2025 projected land use change and load output. With adjusted land cover numbers, Bay Model land use acres were adjusted to fit the more accurate 2010 tree canopy estimates, resulting in the other land cover categories being adjusted proportionately to keep total acreages consistent.
Scenario (B) 2025: Forest Retention Scenario B-1: Estimated 2025 loads (Baseline): The Forest Retention scenario, as in the Virginia Phase I study, makes the assumption that the assumed trend of forest loss reflected in the original TMDL model data is changed by local land use policy to achieve a “slow-down” in the rate of forest loss. In light of the uncertainty regarding how local governments may be able to adopt and enforce forest retention policies and the amount of existing forest and tree canopy that could be effected by such policy actions, the PA project team applied the same assumption as used in Virginia (i.e., there would be 10 percent reduction in the rate of loss of the aggregate forest acreage projected under Scenario A). The adjusted 2011 land cover acres along with historical development trends throughout the watershed by riversegmentshed used to show the estimated change in land cover

HEALTHY WATERS/FOREST RETENTION STUDY FINAL REPORT: JUNE 30, 2017 34
by 2025, and the estimated run off produced by the Bay Model. By implementing a 10 percent reduction in the estimated forest rate of loss by 2025, this scenario alongside Scenario A is aimed at providing an insight as to the benefits of local governments working toward retention of forest and pervious landscapes.
Predicted land cover data by riversegmentshed also were provided to CWP by DCNR. To develop nutrient and sediment loading estimates, total watershed acres for 2010 and 2025 need to be equal. In some cases, the total acres were off slightly because of the development of the enhanced 2010 Forest Land Cover Estimates. In these instances, all land cover classes, except water, were proportionally adjusted to bring the 2025 land cover projection in alignment with the 2010 enhanced land cover data provided by DCNR. In some cases, where large acreage discrepancies were noticed, specific land cover numbers were adjusted based on discussions with DCNR staff on how watershed boundaries were established during the development of the 2010 Enhanced Land Cover Data set and what land cover should be adjusted as a result. In all cases, 2025 predicted data were modified to conform to 2010 enhanced land cover total acreages. A summary of land cover data modifications are described below in Table 15. CWP then used the adjusted 2025 land cover data and the land use loading rates provided by CAST to calculate “2025 Forecast Land Cover” annual loads.
Table 15: Predicted 2025 Land Cover Adjustements
River segmentshed Acres Modified Reason
A4204SL3_2400_2440 1,701 Adjusted 2025 data to remove State-Owned Public Land A42041SL3_2400_2380 1.5 Proportional adjustmentA42133SL3_2400_2380 81 Proportional adjustmentA42133SL3_2440_2380 3 Proportional adjustmentA42133SL9_2380_2310 2,522 Adjusted to remove land outside of the Yellow Breeches study areaB42041SL3_2400_2440 194 Adjusted to remove land in Adams CountyF42041SL3_2400_2440 291 Adjusted to remove and associated with a federal facility
Scenario B-2: Estimated 2025 loads (Forest Retention:-10% reduction in rate of forest loss):
The Forest Retention scenario uses the 2025 land cover data developed for scenario B-1 (i.e. Scenario A 2025 in Table 14) as the basis for determining load differences resulting from the reduction in the rate of forest loss reflected in Scenario B (i.e. Scenario B 2025 in Table 14 and based on TMDL model 5.3.2 land cover projections).
To determine the rate of forest loss, the amount of forest forecast for 2025 was compared to the Enhanced 2010 Land Cover data to determine the total amount of forest loss by riversegmentshed between 2010 and 2025. The total amount of forest loss was then divided by 15 to determine the average rate of forest loss per year. The annual forest loss rate was then reduced by 10% to get an adjusted rate of annual forest loss. This annual forest loss was then multiplied by 15 to determine the total adjusted amount of forest lost from 2010 to 2025 and the amount of forest “gained” (or retained) by reducing the rate of loss. All other land cover categories for the 2025
HEALTHY WATERS/FOREST RETENTION STUDY FINAL REPORT: JUNE 30, 2017 35
Forecast Land Cover dataset, except water, were adjusted proportionally to accommodate the “retained” forest land. CWP then used the new adjusted 2025 land cover data (i.e. reflecting the 10% reduced forest loss rate assumption) and the land use loading rates provided by CAST to calculate 2025 Forest Retention Land Cover annual loads.
Scenario (C) 2025: Urban Forest Retention Scenario The Urban Forest Retention BMP Scenario describes a future land cover pattern for a selected subset of municipalities in the study area (i.e. Upper Allen and Lower Allen Townships in Cumberland County, and Fairview Township in York County) that assumes local implementation of policies which are anticipated to encourage urban forest and tree canopy retention, as well as both afforestation and reforestation of vacant urban landscapes. Under this scenario (like Scenario B), a case study was developed to reflect possible implementation of stream restoration projects to offset projected forest loss under Scenario A 2025 in the YBC watershed. Past population data is also used to determine possible future trends in population growth in these urban areas, and assumes local governments have already, or will implement forest retention policies to the same extent as Scenario A 2025. Similar to Virginia’s assumptions, Federal, State, and local government parks or other conserved, forested lands are assumed to remain standing and not harvested. Like Scenario D, this scenario only covers portions of the two counties in the YBC watershed and is not directly comparable to either Scenarios A, B or D.
Scenario (D) 2025: Rural Riparian Buffer Restoration Scenario Development of this Scenario depended on developing an estimate of existing land area that would be converted from its existing land cover to a riparian forest buffer as the BMP strategy to be tested for determining the offset cost savings of retaining forest lost under the Scenario A 2025 projection. DCNR provided CWP with a spreadsheet identifying the acres of each land cover category within a 200-foot riparian forested stream buffer area for the following jurisdictions; Carroll, Cooke, Dickenson, Fairview, Franklin, Monaghan, Monroe, Penn, South Middleton, South Newton, and Southampton. This data was developed by DCNR using the National Land Cover Data Set. These 200 foot riparian buffer data were then summarized as forest, agriculture, and urban, thereby identifying the extent of land area to be converted from either agriculture, urban pervious or impervious through the implementation of the riparian forest buffer BMP.
CWP further divided urban land into urban pervious and urban impervious by using the impervious to pervious ratio from BayFAST to determine the amount of impervious acres associated with the “Developed” land cover categories in NLCD7 (High Density, Medium Density, and Low Density) are in the buffer area. The remaining pervious acres from the “Developed” land cover categories were combined with the “Developed Open Space” acres to determine the number urban pervious acres in the buffer area. CWP also further categorized agricultural land into Crop and Hay/Pasture by separating Cultivated Crops and Hay/Pasture.
7 NLCD = National Land Cover dataset, 30-meter pixel resolution land cover comparable to CB TMDL model 5.3.2 data.

HEALTHY WATERS/FOREST RETENTION STUDY FINAL REPORT: JUNE 30, 2017 36
In BayFAST, CWP developed the Rural Riparian Forest Buffer scenario using the unique facilities developed for each jurisdiction. To develop this scenario, CWP implemented riparian forest buffers BMPs on the urban acres and agricultural acres within the buffer zone. To implement forest buffers on urban land, CWP implemented the impervious removal BMP equal to the amount of impervious acres identified in the data provided by DCNR. CWP then implemented the riparian forest buffer BMP on an amount of acreage equal to the amount of urban pervious and impervious acres identified in the buffer zone data provided by DCNR.
To implement forest buffers on agricultural land, CWP implemented forest buffers on hay and pasture land, and on crop land; equal to the acres identified in the data provided by DCNR. The BayFAST model was then run to determine the new nutrient and sediment loads as a result of the forest buffer BMP implementation.
SCENARIO RESULTS Between 2015 and 2025 (or 2010 – 2025 in the Pennsylvania case), the Forest Retention analysis demonstrates TDML compliance costs could be offset by modest forest retention effort in both watersheds (i.e. by $125+ million in the Virginia case, and $12.28+ million in the Pennsylvania case). One could also look at these values as the cost savings that public and private development in each region could experience by instituting additional provisions to retain existing forestlands. These savings would be further enhanced by the increased ecosystem service values associated with those retained forests.
The comparative results of scenario acreages, pollutant loadings and land cover trends across all modeled scenarios for Virginia’s Phase I study can be found under Appendix A; while the inputs and results for all Pennsylvania scenarios are provided in Appendix C.
1. The comparative analysis of Pennsylvania’s Scenario A 2025 and Scenario B 2025 shows that the value of the assumed level of forest retention effort would be equivalent to the off-set stream restoration BMP project implementation, operation and maintenance cost for 17,311 feet of restored stream channel at $12.28 million dollars through 2025.
2. To place this value in context with the Virginia Phase I study, the Virginia study found the forest retention strategy off-set cost savings in a portion of the Rappahannock River watershed to be $125+ million. It is important for the reader to note that there is a nearly 10:1 difference in the potential off-set savings between the two studies, This difference can be explained largely by the following three factors:
a. The Yellow Breeches Creek watershed in Pennsylvania is roughly 55 percent of the land area
of the middle basin portion of the Rappahannock River watershed in Virginia, thus the two study areas were not of the same geographic scale,
b. While the Chesapeake Bay Model 5.3.2 projections for forest loss in the Virginia study area showed a consistent pattern of forest loss across all riversegmentsheds through 2025, the

HEALTHY WATERS/FOREST RETENTION STUDY FINAL REPORT: JUNE 30, 2017 37
same projections for the YBC watershed in Pennsylvania showed 5 out of 7 riversegmentshed sections of the watershed with projected increases in forest cover. Consequently, the impact of the forest retention scenario was limited to the two riversegmentsheds with projected forest losses, rather than being applicable throughout the entire watershed, and
c. The Pennsylvania BayFAST modeler did not copy Virginia’s blend of BMP practices to make
the two studies as comparable as possible in determining the BMP off-set cost-savings of forest retention. The CWP staff only applied the most cost-effective BMP strategy (i.e. stream restoration) to determine the off-set savings achievable through forest retention (Scenario B), rather than using the more costly mix of BMPs applied in the Virginia study (which included stream restoration, along with wetponds and wetlands, and dry extended retention ponds) to represent a better average off-set cost savings calculation across a diverse, developing landscape.
3. These four scenarios in the Pennsylvania study do not cover the same geographic area, nor do they
apply the same off-set BMP strategy to consistently measure, in equivalent off-set cost savings, the benefit of the forest retention strategy (using the assumed 10 percent reduction in the rate of forest loss over the 15 year modeling period). a) The comparative analysis of Scenario A 2025 and Scenario C 2025 for the three urban
municipalities included in this urban case study shows that the value of the forest retention effort is equal to the off-set urban stream restoration BMP project implementation, operation and maintenance cost for 5,381 feet of restored stream channel of $3.77 million dollars through 2025. The cost estimate represents part of the $12.28 million off-set cost savings described above, as the Scenario C project area is a subset of the entire watershed tested under Scenario B using the same BMP for determining the off-set cost-savings of forest retention.
b) The comparative analysis of Scenario A 2025 and Scenario D 2025 for the eleven rural
municipalities included shows that the value of the forest retention effort in this rural portion of the YBC watershed is equal to the off-set riparian forest buffer restoration BMP project implementation, operation and maintenance cost (for conversion of 1,424 acres of urban land cover, 71 acres of impervious area and 1,899 acres of agricultural land in the YBC watershed to riparian forest buffer) of $5.25 million dollars through 2025. This estimated cost (which does not assume any land acquisition or other costs to accommodate the land cover conversions), while based on a different BMP practice (i.e. riparian forest buffer restoration instead of urban stream restoration) might be thought of as an alternate off-set cost estimate for the rural portions of the YBC watershed which overlap the Scenario B analysis.
4. As Scenarios A and B are derivatives of the Chesapeake Bay Model 5.3.2 land cover projections by riversegmentshed, it is important to note that these original projections, unlike the projections used in the Virginia Phase I proof-of-concept study, anticipated actual forest acreage increases for some riversegmentsheds, rather than projecting a uniform trend of forest loss throughout the watershed

HEALTHY WATERS/FOREST RETENTION STUDY FINAL REPORT: JUNE 30, 2017 38
as was the case in the Virginia proof-of-concept study. Still, once adjusting the 2010 base year to better estimate the baseline acreage of forest in the watershed and applying the 5.3.2 model assumptions of forest cover change, Scenario B ‘s 2025 forecast of retained forest cover in the YBC watershed was 246.25 acres higher than the adjusted Model 5.3.2 forest cover projection.
PHASE II ENGAGEMENT/DISCOVERY OBJECTIVES PHASE II APPROACH
For purposes of Phase II, high conservation value (HCV) forestland was defined based on forest composition, soil type, and topographic location to maximize water protection; and possessed one or more of the following attributes:
1. Nationally - significant concentrations of naturally-occurring bio-diversity, forest areas that are in, contain or impact on rare, threatened or endangered ecosystems (e.g. the Chesapeake Bay);
2. Forest areas that provide basic services of nature in critical situations (e.g. watershed protection, groundwater recharge, and erosion control); and
3. Forest areas fundamental to meeting basic needs of local communities (e.g. subsistence, health) and/or are critical to a local communities' traditional cultural identity.
VIRGINIA The project team divided the Rappahannock River Basin into three separate study areas – the lower, middle and upper basins because each area provided very different political, economic, environmental and social perspectives. The objective was to learn how different dynamics change the thinking about what works and doesn’t work. The lower basin is primarily rural and it’s near proximity to the Chesapeake Bay make it an area accustomed to addressing Chesapeake Bay issues. The middle basin includes some of the fastest growing urban areas in the Commonwealth and also includes large military facilities. The upper basin with its mountains represented a very different topography including headwaters as well as federal conservation areas. All five counties of the upper basin are outside the Chesapeake Bay Preservation Area and have fewer state imposed land development limitations.
Under the sponsorship of the Rappahannock River Basin Commission and/or the Virginia Department of Forestry, a series of peer-to-peer discussion sessions and other presentations were held, sixty-three in total, since early Spring of 2016 with geographically targeted focus groups involving key local elected officials and constitutional officers (e.g. Commissioners of Revenue), senior county financial staff, planning commissioners and planning and environmental management senior staff and other stakeholders, including SWCD directors and staff, General Assembly members, NGOs, builders/developers, forestland owners, timber brokers, timber mill owners, the farming community, land trust representatives, financiers, and other representatives of Chesapeake Bay partner jurisdictions to identify administrative or legal obstacles, incorporate best practices and lessons learned elsewhere in Virginia (and beyond), develop solutions, and build the toolbox elements.

HEALTHY WATERS/FOREST RETENTION STUDY FINAL REPORT: JUNE 30, 2017 39
PENNSYLVANIA As a new team partner in Phase II, Pennsylvania’s primary objective was to model alternative growth strategies emphasizing different levels of forest retention following Chesapeake Bay TMDL program protocols to determine the value of a robust forest retention initiative in Pennsylvania as compared to the Virginia experience. Its secondary objective was to engage in a limited dialogue (due to time constraints) with local officials for the same reason Virginia was – it is at the local level that land use planning decisions are made. To accomplish these objectives, the team needed to:
• Mobilize local and state interest to join the proposed Commonwealth-to-Commonwealth partnership,
• Choose a target watershed to model various forest retention based land use scenarios, • Line up the project team and allocate resources, • Collect necessary TMDL model land cover data suitable for the needs of the differing
state governance structures within the selected study area, • Evaluate the value of incorporating newer land cover data into the model runs that became available to project use near the end of 2016, and • Conduct outreach efforts with municipal officials in the selected Yellow Breeches Creek watershed as well as environmental and conservation-oriented NGOs, to raise community awareness of the project, its goals and objectives and the potential for addressing the Chesapeake Bay TMDL.
The project team, completed the Phase I analysis, validated Virginia’s methodology and confirmed that forest retention actions in land use planning offsets investments that would otherwise need to be made in more expensive BMPs while reducing the TMDL for nitrogen, phosphorus and sediments. Moreover, PA’s DCNR staff had some opportunity to discuss the new incentive tools, as well as challenges with existing planning and conservation tools, to gain more insight into conservation toolbox initiatives needed to foster greater forest retention outcomes in Pennsylvania.
ORGANIZING AND SEEKING STAKEHOLDER INPUT VIRGINIA Outreach to and negotiation with local government leaders in coordination with the Rappahannock River Basin Commission, EPA and the pertinent Chesapeake Bay Program Goal Implementation teams and workgroups was the principal focus of Phase II. Phase I led into Phase II when the Phase I findings and recommendations were presented in a September 2015 report to
During the September 2015, RRBC Summit-sponsored workshop with local officials, then Chairman of the RRBC Joe Grzeika of the King George County Board of Supervisors opined:
“…if we have the technical knowledge of how to identify high (conservation) value forestland within our county, make clear policy statements in our comprehensive plan of how and why retaining such existing forests is important, couple that with the strong economic development goals that exist in most comprehensive plans, we have given the development community clear direction of the outcomes we desire. This transparency better empowers a developer to package a rezoning request in a way that can more easily be found in conformance with the goals stated in the comprehensive plan and everyone wins. Of course, we have to look to our friends at DOF to help us with the technical knowledge. If we develop these tools right, relative to the property & project under consideration, we have empowered our local government and our business community to improve water quality without spending tax dollars on (stormwater) capital facilities and empowered the business-person to invest in water quality improvements with a positive ROI...”

HEALTHY WATERS/FOREST RETENTION STUDY FINAL REPORT: JUNE 30, 2017 40
EPA and the Chesapeake Bay Program Partners Healthy Watershed Goal Implementation Team; and separately to local elected and appointed leaders in the Rappahannock River Basin at a regional summit held September 23, 2015 sponsored by the Rappahannock River Basin Commission. A workshop at the summit was structured to begin discussions with local officials (see text box on previous page) on strategic implementation strategy next steps including policy, incentives and land use planning approaches that could create the basis for a “tool box” of actions. Identifying the challenges and opportunities associated with the “tool box” was the focus in Virginia of the Phase II discovery and negotiation discussions project team members held with localities and various other stakeholders. In addition, the Chesapeake Bay Partners program was also creating a Chesapeake Bay Program on-line repository of information that would be available for use by all the jurisdictions in the Chesapeake Bay watershed and one goal of the Healthy Watersheds Forests project team was to make its findings and recommendations available to others through that repository.
Phase II field efforts also broadened outreach efforts beyond the Phase I pilot area in the George Washington Regional Commission service area of the basin to the entire Rappahannock River basin as a proxy for the Chesapeake Bay watershed. Since land use decisions are largely local, it was considered very important that the forestland retention incentives tool box be built from a bottom up rather than a top down perspective. The components had to be credible on a peer-to-peer basis, and they had to be designed to help local officials optimize land use decisions so development could occur at the same time that water quality protection and forest retention actions were maximized. As such, project team members consulted extensively through the RRBC, with local government officials within the Basin, as well as with the Chesapeake Bay Program’s Local Government Advisory Committee (LGAC) and other Chesapeake Bay program partner goal implementation teams.
Because the Rappahannock River basin represents a large, landscape level study area, it was necessary to divide it into three sub-basin study areas – the lower, middle and upper basins to more accurately gauge the drivers for each area. Each sub-basin provided very different political, economic, environmental and social perspectives. The objective has been to learn how different dynamics change the thinking about what works and does not work. The lower basin is primarily rural and its near proximity to the Chesapeake Bay makes it an area accustomed to addressing Chesapeake Bay issues. The middle basin includes some of the fastest growing urban areas in the Commonwealth and also includes large military facilities. The upper basin with its mountains represents a very different topography, including headwaters as well as federal conservation areas. All five counties of the upper basin are outside the Chesapeake Bay Preservation Area and have fewer state-imposed land development limitations.
Under the sponsorship of the Rappahannock River Basin Commission or the Department of Forestry, a series of peer-to-peer discussion sessions and presentations were held, sixty-three in total, beginning in early Spring of 2016 through May 2017 with geographically targeted focus groups involving key local elected officials and constitutional officers (e.g. Commissioners of Revenue), senior county financial staff, planning commissioners and planning and environmental management senior staff, General Assembly members and other stakeholders, including S&WCD directors and staff, NGOs, builders/developers, forestland owners, timber brokers, lumber mill owners, the farming community, land trust managers, financiers, and other representatives of Chesapeake Bay partner jurisdictions to identify administrative or

HEALTHY WATERS/FOREST RETENTION STUDY FINAL REPORT: JUNE 30, 2017 41
legal obstacles, incorporate best practices and lessons learned elsewhere in Virginia (and beyond), develop solutions, and build the toolbox elements. These discussions occurred through multiple mediums including but not limited to regularly-scheduled meetings with the target audiences within the localities, special forums, and individual meetings.
Peer to peer discussion sessions between team members and interviewees occurred through multiple mediums including, but not limited to: regularly-scheduled meetings with the target audiences within the localities, special forums, and individual meetings. Notes were kept whenever possible and as ideas, issues and challenges surfaced, the Rappahannock River Basin Commission technical advisory committee, a group consisting of technical representatives from the organizations represented on the Commission acted on a monthly basis as a sounding board to help the project team interpret what was being heard. In this manner, the project team was better able to delve more deeply into key issues and concerns in follow-on discovery sessions.
PENNSYLVANIA Stakeholder perspectives on and reactions to the Healthy Waters Forest Retention project were collected by PA DCNR staff through six primary outreach initiatives, including:
1. A survey of municipalities throughout the YBC watershed on their staff assessment of community environmental values, particularly the relative value of forests, and the status of local comprehensive plans, and development control ordinances, and availability of local population and economic growth projections.
2. DCNR staff conversations with municipal and state agency and conservation/environmental stakeholders throughout the YBC watershed, and elsewhere in Pennsylvania.
3. A DCNR project presentation on October 13th, 2016 to the Yellow Breeches Creek Watershed
Association (Cumberland Co.), followed by discussion, questions, and comments raised by the audience.
4. A project presentation on May 10, 2017 to local audience at Fairview Twp. Community Hall (York
Co.), followed by discussion, questions and comments raised by the audience.
5. A project presentation on June 1, 2017 to local audience at Cumberland Co. Planning Office (Carlisle, PA), followed by discussion, questions and comments raised by the audience.
6. PA Department of Environmental Protection, Pennsylvania Phase III Watershed Improvement
Plan (WIP), Open Space Forum.

HEALTHY WATERS/FOREST RETENTION STUDY FINAL REPORT: JUNE 30, 2017 42
OPEN SPACE & FOREST RETENTION TOOLS IN VA AND PA The research into the various means of protecting forests, particularly high conservation value forest (and open space, in general) identified five groups of tools and a sixth group of possible tool enhancements.
Table 16. Forest Retention Tool Box Summary Matrix
Each of these and their potential for forest conservation and retention is discussed for each Commonwealth further in this section.
Open Space & Forest Retention Tools Pennsylvania VirginiaA. Tax & Fiscal Policy Tools 1. Agricultural/Forestal Districts 2. Clean & Green/Land Use Valuation Taxation 3. Impact Fees
B. Environmental Planning & Regulation 1. Stormwater Management, Environmental Regulation & Chesapeake Bay Programs 2. Forest Management Planning 3. Tree Protection Ordinances 4. Riparian (Stream) Buffers
C. Land Use Planning & Zoning Policy Tools 1. Comprehensive Plan 2. Official Map 3. Urban Growth Boundary 4. Changing Permissible Zoning 5. Agricultural Preservation Zoning 6. Zoning to Preserve Natural Resources 7. Open Space Districts 8. Overlay Zoning 9. Performance Zoning 10. Conditional Zoning and Proffers 11. Development Agreements 12. Cluster Development Zoning 13. Planned Unit Development 14. Conservation Development D. Voluntary Landowner Actions 1. Land Trusts 2. Conservation Easements 3. Outright donation of land 4. Land Swaps 5. Stewardship Agreements E. Land & Development Rights Acquisition 1. Purchase of Development Rights (PDRs) 2. Transfer of Development Rights (TDRs) 3. Acquisition of land for parks and recreation areas via purchase or condemnation 4. Mandatory dedication of recreational lands in new subdivisions or payment of fees in lieu 5. Fee Simple Land Acquisition F. Forest Retention Tools: Enhancement Opportunities 1. Conservation Easement Tax Credit Policy 2. Consideration of Term Conservation Easements 3. Recognition of Resource Protection Area Restrictions 4. PA’s Purchase/Transfer of Development Rights (P/TDRs) Options 5. Multi-Year Application of Land Use Valuation Taxation 6. Expanding Local Tree Protection Authority 7. Forest Retention Incentive (Cost-Share) Programs 8. Tree Conservation for Ozone Non-Attainment 9. Promoting Use of Conservation Subdivision Design (CSD) Planning 10. Factoring Ecosystem Service Functions Into Conservation Easement Tax Credit Policy 11. Recognizing Natural Capital as Taxable Assets 12. Nutrient & Carbon Sequestration Credit Trading

HEALTHY WATERS/FOREST RETENTION STUDY FINAL REPORT: JUNE 30, 2017 43
A. Tax and Fiscal Policy Tools 1. Agricultural and Forestal Districts
VIRGINIA The Virginia Code provides for the voluntary creation of Agricultural and Forestal Districts (AFD’s) in order to provide a means for a mutual undertaking by landowners and localities to protect and enhance agricultural and forestall land as a viable segment of the Commonwealth’s economy and as an economic and environmental resource of major importance.
An agricultural and forestal district (AFD), as used in Virginia, is a rural conservation zone reserved for the production of agricultural products, timber, and the maintenance of open space as an important economic and environmental resource. A district is voluntary – it is initiated by a landowner or group of landowners as a mutual undertaking with local government. By establishing a District, property owners agree not to convert their farm, forestland, and other open space to more intense commercial, industrial or residential uses for a term of four to 10 years. In return, the county and the Commonwealth agree not to take actions or make infrastructure investments that will place increased pressure on landowners to convert land in the district to more intense land uses during the term of the District.
Agricultural and/or Forestal Districts8 in Virginia are established by local ordinance, at the request of the landowner(s), who must assemble at least 200 acres of contiguous land, to run for a set number of years (from 4 to 10, and renewable for subsequent terms), during which the property owner continues to hold fee simple title to the land, and enjoys various benefits provided by the Code for such districts. The local ordinances usually include provisions that permit the landowner to withdraw from the program under certain defined circumstances. Virginia Code, §15.2-4300 et. seq. allows any locality to adopt Agricultural and Forestal Districts. Land lying within a district and used in agricultural or forestal production is automatically qualified for a land use valuation assessment pursuant to Article 4 of Chapter 32 of Title 58.1 regardless if a local ordinance pursuant to §58.1-3231 has been adopted. The AFD also provides some extra protection against certain public infrastructure improvements. In and of itself, an AFD does not change the zoning within its borders. However, an AFD can be a factor in the locality’s zoning decisions and planning policies. Further, in adopting an AFD, the governing body may require, as a condition to creation of the district, that any parcel in the district shall not, without the prior approval of the governing body, be developed to any more intensive use or to certain more intensive uses (other than uses resulting in more intensive agricultural or forestal production), during the period which the parcel remains within the district. Virginia Code, §15.2-4400 allows for certain localities (i.e. Counties of Albemarle, Augusta, Fairfax, Hanover, James City, Loudoun, Prince William, Roanoke, and Rockingham) to create “Local
8 Source: American Planning Association, Virginia Chapter, “Managing Growth and Development in Virginia”, November, 2016, page 62.

HEALTHY WATERS/FOREST RETENTION STUDY FINAL REPORT: JUNE 30, 2017 44
Agricultural and Forestal Districts” for periods of eight years. These can be as little as twenty acres in size and have similar provisions as regular AFDs. See “Clean and Green” program below under the LUVT program for discussion of Pennsylvania’s related tax reduction program for forested lands.
2. Use Valuation Taxation (VA)/Clean & Green (PA)
VIRGINIA Use Value Assessment (also known as land use or land use assessment) is a state-guided program in which a participating locality can tax land at its “use value” rather than its fair market value. To date, as the accompanying visual details, most counties in Virginia and most cities in Virginia have chosen to adopt some form of land taxation based on use value.
Localities may choose to apply use value to four categories of land including agriculture, forestry, horticulture and open space. The program is voluntary and requires only five acres to qualify under the agricultural or open space classification or 20 acres under the forest use classification. It is important to note property as small as one quarter of an acre may also qualify if the property is adjacent to a designated scenic river or a designated scenic highway.
Upon enrolling in the use value program, property is assessed at a reduced rate based on its actual use which in turn results in a lower property tax obligation. A State Land Evaluation Advisory Committee (SLEAC), which is housed in the Department of Agricultural and Applied Economics at Virginia Tech, oversees Virginia’s use value program and is responsible for preparing the annual use value assessment estimates local government Commissioners of Revenue are to “consider" when assessing the “use” value of land enrolled in the program. It is important to note, however, that local Commissioners of Revenue are not required to use the SLEAC generated estimates in arriving at assessment values for property enrolled in the use value program although many choose to do so.
As required by statute, property enrolled in use value must re-apply annually to remain in the program in order to secure a reduced assessment and realize lower property taxes on their land. It is important to note that rollback taxes must be paid when a property is removed from the program prior to the program’s scheduled expiration. A change in the use of the property will also trigger the rollback tax penalty.
Figure 9. Virginia Localities with LUVT Programs

HEALTHY WATERS/FOREST RETENTION STUDY FINAL REPORT: JUNE 30, 2017 45
PENNSYLVANIA Pennsylvania’s “Clean and Green” program9 was enacted by the PA General Assembly in 1974 as a tool to encourage protection of the Commonwealth's valuable farmland, forestland and open spaces. Once enrolled, a PA landowner does not need to reapply. Landowners must, however, notify their county tax assessment office if the status of their enrolled land changes. It is noted that in PA, the State-determined land use valuations represent the highest assessment values that may be applied by municipal tax authorities. A county assessor may establish use values for land use subcategories that are less than the use values established by the Department of Agriculture. A county assessor may use these lower use values in determining preferential assessments under the Clean and Green program. A county may not, under any circumstances, establish or apply use values that are higher than those use values established by the Department of Agriculture.
To be eligible for enrollment in the Clean and Green program, land must be devoted to one of the following three qualifying uses: a) agricultural use, b) agricultural reserve use, or c) forest reserve use. Land in “Agricultural Use” is land (10 contiguous acre minimum) which is used for the purpose of producing an agricultural commodity or is devoted to and meets the requirements for qualifications for payments or other compensation under a soil conservation program under an agreement with an agency of the Federal government. “Agricultural land” includes the following: a) any farmstead land on the tract, b) a woodlot, and c) land which is rented to another person and used for the purpose of producing an agricultural commodity.
Land in “Agricultural Reserve Use” is non-commercial open space land used for outdoor recreation or the enjoyment of scenic or natural beauty and open to the public for that use, without charge or fee, on a non-discriminatory basis. This definition also includes any farmstead land on the tract, and now by State regulation (7 Pa. Code § 137b.64) landowners may place reasonable restrictions on the public's access to a tract of land that is enrolled in Clean and Green as Agricultural Reserve land. These restrictions might include limiting access to the land to pedestrians only, prohibiting hunting or the carrying or discharging of firearms on the land, prohibiting entry where damage to the land might result or where hazardous conditions exist, or other reasonable restrictions.
Land in “Forest Reserve Use” is a tract of land, 10 acres or more, stocked by forest trees of any size and capable of producing timber or other wood products.
The general rule of the Clean and Green program is that after land is enrolled, the landowner is obligated to continue using the land in a qualified use indefinitely or face the penalty of roll-back taxes for the most recent seven years, plus interest. The roll-back tax is the difference between the taxes paid based on the Clean and Green rate and the taxes that would have been paid if the land were not enrolled in the Clean and Green program.
9 http://www.agriculture.pa.gov/Encourage/farmland/clean/Pages/default.aspx

HEALTHY WATERS/FOREST RETENTION STUDY FINAL REPORT: JUNE 30, 2017 46
3. Impact Fees VIRGINIA Requiring growth to pay its own way is a major reason local governments across America have adopted impact fee programs through which developers are required to pay for, in whole or in part, improvements necessitated by new growth associated with development projects. The costs to be paid are often for utilities and roads, as well as schools, parks, and other public facilities. Impact fees are typically collected at the time of building permit approval thereby allowing localities to secure impact fees for by-right ministerial development approvals as well as development projects that require a rezoning of property.
The Code of Virginia, at present, does not permit impact fees as described above. Instead, the Virginia Code (15.2-2119) permits localities to levy a fair and reasonable fee for connecting to a water and/or sewer system. As administered, the fee is usually designed to cover the actual connection charge or tap fee as well as a capitalized portion of the cost associated with constructing or enhancing the actual water and/or sewer facility.
The Virginia Code also permits localities authorized to create Urban Development Areas to enact an impact fee program for road improvements and related appurtenances. This authority specifically states road impact fees may be use to expand existing roads in order to serve new development and/or be imposed for the construction of new roads to meet increased demands attributable to new development. Virginia localities wishing to initiate an impact fee program for roads must satisfy several criteria featured in the Code including the designation of one or more Impact Fee Service Areas (IFSA), adopting each IFSA road improvement program as an amendment to the community’s comprehensive plan, and incorporating each IFSA road improvement plan in the locality’s capital improvement program (CIP) as well as the locality’s six-year road program that is shared with the Virginia Department of Transportation (VDOT).
PENNSYLVANIA The PA Municipality Planning Code (§ 502) stipulates that the governing body of each municipality, other than a county, may enact, amend, and repeal impact fee ordinances and may establish impact fees to be paid by property owners to help fund off-site public transportation improvements necessitated by new development.10 No municipality may impose fees for or require construction of or payment for off-site improvements except as provided for in the MPC and Article V-A
Impact fees may be used for acquisition of land, legal and planning costs, engineering, construction, and debt service where these costs are for identified transportation capital improvements attributable to new development. Impact fees may not be used for facilities not included in the transportation capital improvements plan, operation or maintenance, upgrades not attributable to new development, upgrades to remedy lack of municipal funding of
10 See: https://www.dot.state.pa.us/public/Bureaus/Cpdm/ImpactFees.pdf

HEALTHY WATERS/FOREST RETENTION STUDY FINAL REPORT: JUNE 30, 2017 47
maintenance, and preparation of the transportation capital improvements plan except as specified further in Section 503-A(d)(5).
To use impact fees as an instrument to indirectly foster forest retention, PA municipalities would have to rely on the use of an official map and transportation capital improvement plan that avoids planning public roads through or adjacent to forested areas for the community to buy public roadway ROW in areas planned for road development (i.e. away from areas of high conservation value forests).

HEALTHY WATERS/FOREST RETENTION STUDY FINAL REPORT: JUNE 30, 2017 48
B. Environmental Planning and Regulation Tools
1. Stormwater Management, Environmental Regulation & Chesapeake Bay Programs
The conversion of agricultural land, forests and open space to residential or commercial land use can result in an increase in storm water as impervious surfaces associated with land conversions will alter hydrologic patterns and, depending upon the location and intensity of the development, may potentially overwhelm nearby forest buffers and streams. In some instances, the hydrologic modifications will require the use of “grey” infrastructure to manage the storm water. In other instances, Best Management Practices (BMP’) (i.e. structures such as bio filters, ponds, levees, swales, and filters) might be used to remove pollutants, contain and slow the release of flood water, and essentially perform the functions that forest cover had performed prior to land conversion. Either approach will be costly in terms of community storm water services.
There are an assortment of federal and state environmental regulatory programs which urban and rural localities in Virginia have to manage in dealing with both proposed new and existing development modifications. Provided below are highlights of those regulatory program requirements which affect, directly or indirectly, forest retention in the Commonwealth.
1. Virginia’s Chesapeake Bay Program, developed pursuant to the Virginia Chesapeake Bay Preservation Act, only addresses Resource Protection Area (RPA) Buffers with regards to buffer width, buffer establishment and re-vegetation and of course with modifications of existing land cover, i.e., allowing tree clearing for site vista and view, limiting encroachments, and allowing and encouraging the removal of dead dying or diseased trees within the RPA, particularly in proximity to the stream edge or on a steep bank adjoining a stream.
2. The Chesapeake Bay Act regulations set out, for those localities affected in Tidewater Virginia, 10 general performance standards which all local development ordinances, programs and enforcement actions shall require that any use, development or redevelopment of land in Chesapeake Bay Preservation Areas meets the following performance criteria (which are abbreviated in the following list):
a) No more land shall be disturbed than is necessary to provide for the proposed use or development.
b) Indigenous vegetation shall be preserved to the maximum extent practicable, consistent with the use or development proposed.
c) All development exceeding 2,500 square feet of land disturbance shall be accomplished through a plan of development review process.

HEALTHY WATERS/FOREST RETENTION STUDY FINAL REPORT: JUNE 30, 2017 49
d) Land development shall minimize impervious cover consistent with the proposed use or development.
e) Any land disturbing activity that exceeds an area of 2,500 square feet (including construction of all single family houses, septic tanks and drain fields .….shall comply with the requirements of the local erosion and sediment control ordinance.
f) Any Chesapeake Bay Preservation Act land-disturbing activity …..shall comply with the requirements of 9VAC25-870-51 and 9VAC25-870-103.
g) Onsite sewage treatment systems not requiring a Virginia Pollutant Discharge
Elimination System (VPDES) permit shall be managed in accordance with the procedures detailed in these regulations.
h) Land upon which agricultural activities are being conducted, including but not limited to crop production, pasture, and dairy and feedlot operations, or lands otherwise defined as agricultural land by the local government, shall have a soil and water quality conservation assessment conducted consistent with the Act and this chapter.
i) Silvicultural activities in Chesapeake Bay Preservation Areas are exempt from this chapter provided that silvicultural operations adhere to water quality protection procedures prescribed by the Virginia Department of Forestry in the Fifth Edition (March 2011) of "Virginia's Forestry Best Management Practices for Water Quality Technical Manual." The Virginia Department of Forestry will oversee and document installation of best management practices and will monitor in-stream impacts of forestry operations in Chesapeake Bay Preservation Areas.
j) Local governments shall require evidence of all wetlands permits required by law prior to authorizing grading or other onsite activities to begin.
It is noteworthy that there is no reference in the general performance standards of the Bay Act regulations that speaks to the desirability of forest retention. However, the Virginia Stormwater Management Permit (VSMP) regulations do offer developers some credit for forest retention in applying the runoff reduction method to calculating pollutant loads and credits from various BMPs.
3. No other mandated programs reviewed for this study require forest retention, including:
• Virginia Stormwater Management Program (VSMP) (VDEQ or locality) • Erosion and Sediment Control (ESC) (VDEQ & locality) • National Flood Insurance Program (NFIP) (FEMA), (locality) • Virginia Pollutant Discharge Elimination System Permit (VPDES) (VDEQ), and • Virginia Water Protection (VWP) Permit Program (for wetlands and stream impacts) (VDEQ).

HEALTHY WATERS/FOREST RETENTION STUDY FINAL REPORT: JUNE 30, 2017 50
4. The Virginia BMP clearinghouse guidance on the use of conserved open space to
handle sheet flow of stormwater recommends the use of vegetated filter strips as a BMP. The manual states: “Once established, Vegetated Filter Strips have minimal maintenance needs outside of the spring clean-up, regular mowing, repair of check dams and other measures to maintain the hydraulic efficiency of the strip and a dense, healthy grass cover. Vegetated Filter Strips that consist of grass/turf cover should be mowed at least twice a year to prevent woody growth”. So naturally-regenerating tree growth, with the trees’ additional uptake of water and nutrients from stormwater, is presumed, apparently, to be bad for the environment.
5. Under the VSMP program, a developer can utilize existing forest area (conserved open space) on the parcel as part of their Run-Off Reduction Calculation (RRM), this area cannot be disturbed before or after construction, thus receiving credit towards RRM/SWM compliance.
Moreover, the VSMP program articulates the goal of establishing Conserved Open Space to protect a vegetated area contiguous to a receiving system, such as a stream or natural channel, for treating stormwater runoff. Establishing isolated Conserved Open Space pockets on a development site may not achieve this goal unless they effectively serve to connect the surface runoff to the receiving system. As a consequence, a locality may choose to establish goals for minimum acreage to be conserved (in terms of total acreage or percentage of the total project site), and the physical location (adjacent to a stream, or other criteria) in order for the cumulative conserved open space to qualify for the RRM credit. The Conserved Open Space must be protected by a perpetual easement or deed restriction.
6. Under the federal Municipal Separate Storm Sewer Systems (MS4) program/regulations, pertaining to Chesapeake Bay TMDL Action Plan Guidance (Guidance Memo 14-2012). a) There is a credit given for land use change from impervious to forest. b) Credit for Forest Buffers is applied to upland areas that drain to a (forested)
buffer, and the efficiency is applied at up to 2-to-1 ratio for upland acres that drain to the buffer as sheet flow. Both a) and b) have efficiency formulas and calculations to determine the amount of credit generated for TN, TP and TSS.

HEALTHY WATERS/FOREST RETENTION STUDY FINAL REPORT: JUNE 30, 2017 51
2. Intra-Basin Credit Trading
VIRGINIA11,12 In Virginia, the authority for nutrient credit trading and use of credit offsets to account for new and expanded sources is provided for in the Code of Virginia and in two implementing regulations:
• §62.1-44.19: 12 -Authorizing Legislation, findings, definitions, etc. • §10.1-603.8:1. - Stormwater non-point nutrient offsets. • 9 VAC 25-720- The Water Quality Management Planning Regulation and • 9 VAC 25-820 - The General VPDES Watershed Permit Regulation for Total Nitrogen and Total Phosphorus Discharges and Nutrient Trading in the Chesapeake Bay Watershed in Virginia (Virginia Watershed General Permit)
In the authorizing legislation in 2005 (§62.1-44.19:12), the Virginia General Assembly determined that adoption and utilization of a watershed general permit and market-based point source nutrient credit trading program would assist in meeting Chesapeake Bay pollution reduction goals in the most cost-effective manner, accommodating continued growth and economic development, and providing a foundation for further market-based incentives to help achieve the non-point source reduction goals.
The Virginia General Assembly further amended the Virginia Code in 2009 to allow for a stormwater non-point nutrient offsets program to meet nutrient control requirements for new development. The Virginia Watershed General Permit (9V AC 25-820), called for in the legislation, established the underlying framework for the market-based point source credit trading program under which 125 significant dischargers comply with Tributary Strategy-based load reductions. The first watershed general permit was effective on January 1, 2006 and expired on December 31, 2011. The State Water Control Board then approved a new Virginia Watershed General Permit that Virginia has determined incorporated the wasteload allocations of the Chesapeake Bay TMDL; the Virginia Watershed General Permit became effective on January 1, 2012 and expired on December 31, 2016. Three new bills relevant to the trading and offset programs in Virginia were passed during the 2011 session of the Virginia General Assembly. SB 1099 dealt with non-point source nutrient offsets, SB 1100 created a nutrient offsets sub fund of the WQIF, and SB 1102 addressed trade ratios for trades involving manure-to-energy projects. Provisions in all of these three bills became effective July 1, 2011.
Most germane to this focus on forest retention are the regulations which apply to trades involving non-point off-sets. For non-point sources, Virginia's current policies are defined in the document, "Trading Nutrient Reductions from Non-point Source Best Management Practices in the Chesapeake Bay Watershed: Guidance for Agricultural Landowners and Your Potential Trading Partners" (Ag Guidance) (DEQ 2008). In order for an agricultural non-point source to generate
11 Source: https://www.epa.gov/sites/production/files/2015-07/documents/vafinalreport.pdf 12Source:http://www.deq.virginia.gov/Portals/0/DEQ/Water/PollutionDischargeElimination/NutrientCreditStudyReport-ProposedExpansionFramework-FINAL.pdf

HEALTHY WATERS/FOREST RETENTION STUDY FINAL REPORT: JUNE 30, 2017 52
credits in Virginia, the property must implement five baseline BMPs that are appropriate for that farming operation:
• Soil Conservation Plan • Nutrient Management Plans • Cover Crops • Livestock Stream Exclusion w/ 35' buffer • 35' Riparian buffer
Once the baseline is met, the following BMP enhancements (or land conversion) are available to generate credits in Virginia:
• Soil Conservation Plan - Continuous No-Till • Nutrient Management Plans - 15% N reduction on corn • Cover Crops - Early planting date • Livestock Stream Exclusion w/ 35' buffer - Increase size • 35' Riparian buffer - Increase size • Land Conversion
VDEQ and VDCR have distinct roles regarding offsets and trading in Virginia. Specifically, VDEQ oversees the wastewater treatment plants, whereas VDCR oversees the stormwater activities.
To generate credits in Virginia, it is not necessary to implement baseline requirements on land being converted (e.g. agriculture to forest); however, the baseline requirements do apply to any remaining portions of the parcel not being converted. Cost share funds can be used to achieve the baseline but not to generate credits. Point source credit purchasers must purchase two pounds of nutrient reductions from non-point sources to offset every one pound of nutrient (i.e., two pounds of nutrient reduction from agricultural land equals one pound of nutrient credit for a point source). Currently, Virginia has only specified methodologies for determining baselines for point sources (WLAs in the watershed general permit) and agriculture (Ag Guidance). Virginia expects to develop methodologies to address meeting baseline requirements for other sectors (e.g. forests), but has not determined which specifically or how.
Virginia has no requirements for contractual agreements between individual credit generators, aggregators and purchasers. For Virginia point sources, all compliance liabilities remain with the permittee. However, contracts between buyers and sellers are used for internal purposes within the Virginia Nutrient Credit Exchange Association and address things like practical and operational requirements and include firm buy/sell commitments between the facilities. For Virginia non-point sources, DEQ is required to certify each offset. Once offsets are certified and released for sale, DEQ has no involvement in any agreements between buyers and sellers.
HEALTHY WATERS/FOREST RETENTION STUDY FINAL REPORT: JUNE 30, 2017 53
Some specific restrictions of Virginia’s current nutrient credit trading program of concern to the forest retention agenda are:
1. Offsets by Storm Water sources are limited to new development and to securing non-point source offsets when on-site practices cannot practicably achieve sufficient pollution reductions. Concern: Demand for non-point nutrient credit off-sets are dependent on strong development demand in the same river basin. Intra-county or inter-county credit trades between different river basins do not appear to be allowed under the current nutrient credit trading regulations.
2. Agriculture and Forest sources may sell offsets only to new or expanding wastewater treatment facilities or new development if the agriculture lands or newly-created forest area meet established "baselines" of management practices. Concern: Existing forests, even those under new conservation protection and unavailable to support new development, appear not to be eligible to participate in nutrient credit off-set trades.
PENNSYLVANIA13
Since 2005, the Pennsylvania Department of Environmental Protection (DEP) has been developing its nutrient trading program. The program is one of the first programs in the country to have both agricultural operations (non-point sources) and wastewater treatment facilities (point sources) participating in a nutrient credit trading program. Pennsylvania built its program with significant input from stakeholders – and those very stakeholders are now participants in the program. Pennsylvania built its program to meet Pennsylvania’s needs with regard to the Chesapeake Bay.
The key to the program’s success is that it is voluntary and follows these principles:
• A trade must involve comparable credits (for example, nitrogen may only be traded for nitrogen) that are expressed as mass per unit time (pounds per year);
• Credits generated by trading cannot be used to comply with existing technology- based effluent limits except as expressly authorized by regulation;
• Trading may only occur in a PA DEP-defined watershed; • Trading may take place between any combination of eligible point sources, non-point
sources and third-party aggregators; and, • Each trading entity must meet applicable eligibility criteria established under the
Nutrient Trading Program regulations, 25 Pa. Code Section 96.8.
The Phase 2 WIP identified the success of the existing program and a plan of action to move forward to address a number of recommendations the U.S. Environmental Protection Agency (EPA) made in 2012. These recommendations were divided into two tiers, with the first tier
13 Source: http://files.dep.state.pa.us/Water/BPNPSM/NutrientTrading/NutrientTradingSupplementToPhase2WIP.pdf
HEALTHY WATERS/FOREST RETENTION STUDY FINAL REPORT: JUNE 30, 2017 54
being those recommendations specific to Pennsylvania. As stated in the Phase 2 WIP, DEP has been working with stakeholders and EPA to define the details for the plan of action to address these recommendations since 2012.
In April 2014, EPA began objecting to the issuance of National Pollutant Discharge Elimination System (NPDES) permits prepared by DEP that contained Cap Loads and permit language that enabled the use of credits to achieve compliance with those Cap Loads. The objections were based on EPA’s concerns with the non-point source agricultural baseline requirements in the nutrient trading regulations. To resolve EPA’s objections and retain the ability to issue the NPDES permits in question, DEP has established additional eligibility and credit calculation requirements to ensure the effectiveness of the use of credits to meet legal requirements of the Chesapeake Bay TMDL as authorized by its regulations (25 Pa. Code §§ 96.8(d)(5) & (e)(3)(vi)).
3. Forest Management Planning
VIRGINIA The development of a forest management plan (sometimes referred to a “forest stewardship plan”) is important for a forest landowner to realize the best return on their land investment and timber resource. Foresters from the VDOF are available in every county to provide management plans for woodland owners. Some tax benefits and cost-share incentive programs require a Forest Stewardship Plan to ensure landowner's commitment to conservation practices in return for financial benefits. Landowners must have at least 10 acres of contiguous forest land in order to be eligible to participate in the Forest Stewardship Program, and it is important that the landowner understand the various types of stewardship plans (e.g. Stewardship, Tree Farm, Conservation, Nutrient Management and Soil Sample). This planning effort should fully explore both the maximization of eventual timber revenues, but also a thorough analysis of tax relief (i.e. LUVT and AFD) and easement programs to fit the landowner’s conservation and tax minimization goals. Also, it is important to note that an approved forest management plan is also a pre-requisite to enrolling forest lands in any carbon sequestration credit trading program; consequently, it would be prudent to ensure that the Plan be developed by a forester certified by the Chicago Carbon Exchange (CCX) if there is any thought of pursuing the carbon credit market.
There is a fee for VDOF’s forest stewardship planning service. VDOF will charge $1.50 per acre for every planned acre, with a minimum charge of $200.00 per plan.

HEALTHY WATERS/FOREST RETENTION STUDY FINAL REPORT: JUNE 30, 2017 55
PENNSYLVANIA14
A forest management/stewardship plan is a working guide that allows the landowner to maximize a mix of forest benefits, including wildlife, timber, recreation, aesthetic value and other benefits. Because many changes to a forest are seen over time, a plan is essential to guiding the future of a tract of forest land.
A good plan combines the natural and geographic characteristics of a woodlot with the owner’s interests and objectives to produce a set of forest management recommendations. PA Forest Stewardship Plans, Tree Farm Plans, National Resource Conservation Service CAP106 Plans are now comparable. Forest landowners will need to hire a plan writer trained by the DCNR Bureau of Forestry or a Technical Service Provider trained by NRCS to complete a full plan.
The basic components of a forest stewardship plan are:
• Goals and Objectives – The plan begins with a statement of landowner’s goals and objectives and is meant to express they desire for the future of the land. Few landowners have goals that seek to maximize timber production, but many landowners are interested in timber harvest activities that enhance wildlife, recreation, forest health, and other forest benefits.
• Maps – The maps denote the property’s location, boundaries, forest stands and soil types.
• Inventory – Examples include a timber inventory complete with fill volume, stocking and
species information; an inventory of critical areas and/or endangered species; biological inventory; descriptions of geological features, cultural features, ecological communities and soil data. The intensity of the survey can vary depending on the owner’s interests.
• Activities – This part of the plan provides detailed actions steps to meet the mentioned
goals and objectives. This includes a chronology of activities that will be done each year over the next 10-year period.
Plans are typically written for a 10-year period, but should be updated about every 5 years.
4. Tree Protection Ordinances
VIRGINIA Virginia has an assortment of statutes that deal with the conservation and protection of trees, although mostly in an urban forest, development landscaping or street tree context. Virginia Tech’s Department of Forest Resources and Environmental Conservation has catalogued on-
14 See: Forest Stewardship: Best Management Practices for Pennsylvania Forests (PDF)

HEALTHY WATERS/FOREST RETENTION STUDY FINAL REPORT: JUNE 30, 2017 56
line15 a collection of local tree ordinances from 37 counties, cities and towns throughout the Commonwealth. This on-line resource also provides hyper-links to the various enabling statutes found in the Code of Virginia, dealing with:
• Tree conservation ordinance; civil penalties. • Replacement of trees during development process in certain localities. • Conservation of trees during land development process in localities belonging to a non-
attainment area for air quality standards. • Conservation of trees; notice of infill lot grading plan. • Destruction of trees, shrubs, etc. • Cutting or damaging trees; damaging bridges; damaging markers; obstructing highways;
penalty. • Tree-trimming policies.
The strongest of Virginia’s statutes for tree and forest protection is the authority given local governments in Northern Virginia to conserve trees (as an ozone non-attainment mitigation measure) threatened by development and allows localities to require developers to replace trees or make payment in lieu of planting replacement trees. This statute is discussed more fully later in this report.
PENNSYLVANIA The earliest tree ordinance in the United States was drafted around 1700 by William Penn in order to set standards for tree planting in some of the early settlements around Philadelphia. Today, statewide tree protection falls under the State oversight provided through Pennsylvania Code, §102.14 which provides tree protection on lands being near (i.e. within 150 feet of) Special Protection Waters—those waters classified by the state as either Exceptional Value (EV) or High Quality (HQ) streams. Otherwise, local municipalities may adopt tree protection ordinances.
However, the most recent amendments to the PA Municipalities Planning Code16 specifically direct all municipalities to permit forestry activities in their zoning ordinances as a “use by right” in all zoning districts. The intent of this amendment was to make it easier to carry out all forestry activities by limiting the scope of zoning and other regulations. Municipalities that choose to regulate forestry activities are advised to create reasonable ordinance provisions that encourage sound forestry principles and practices. Guidance in appropriate tree protection ordinance design and adoption is available through the www.ConservationTools.org website17 maintained by the Pennsylvania Land Trust Association.
The PA Department of Conservation and Natural Resources (DCNR) Bureau of Forestry also offers a wide range of services to communities and private citizens, in addition to maintaining
15 See: http://vtod.frec.vt.edu/ 16http://extension.psu.edu/natural-resources/forests/finance/policy-and-ordinances/timber-harvesting-in-pennsylvania-information-for-citizens-and-local-government-officials 17 http://conservationtools.org/guides/37-tree-ordinance/

HEALTHY WATERS/FOREST RETENTION STUDY FINAL REPORT: JUNE 30, 2017 57
the stewardship of State Forest lands. DCNR foresters work with Penn State Urban Foresters to offer a similar set of services: assistance with starting a new tree management program, performing an inventory, selecting trees, and caring for trees. Foresters also provide technical advice and site visits as a municipality develops a plan of action, provide assistance with project development and grant applications, and offer educational opportunities to communities and volunteer groups through workshops and training. Additional technical assistance includes forest management technical assistance, cost-share assistance, Forest Stewardship Plans, regional planning advice, forestry and water best management practices advice and riparian forest buffer restoration.
5. Riparian (Stream) Buffers
Vegetated riparian buffers are one of the most functionally beneficial and biologically diverse systems that also provide services of great economic and social value. Benefits derived from vegetated riparian buffers, especially forested buffers, include water quality enhancement, stormwater and floodwater management, stream bank and shoreline stabilization, water temperature modification, wildlife habitat protection, and absorption of airborne pollutants. These benefits can translate into increased quality of life and real savings for the community (see Table 17).
Table 17. Riparian Forest Buffer Benefits
BENEFIT BENEFIT EXPLANATION
Reduce Runoff Volume
Watershed imperviousness can be reduced by as much as five percent by setting aside 100-foot buffer areas.
Reduce Small Drainage Problems
Buffers can reduce complaints from property owners regarding flooding, erosion, and drainage problems by allowing space for the natural meandering of stream channels.
Stabilize Banks and Limit Channel Erosion
The roots of native grasses and woody plants preserved along the shoreline help stabilize stream banks and limit channel erosion.
Increase Property Values
Ninety percent of buffer administrators surveyed believe that buffers and other forested lands have a positive impact on property values.
Reduce Pollutant Loads
When properly designed, buffers can provide effective pollutant removal for development when located within 150 feet of the buffer boundary. A buffer's long-term pollutant removal capacity depends on a number of actors, including soil conditions, vegetative character, and buffer size and slope.
Provide a Foundation for Greenways
The systematic protection or creation of riparian buffers can connect non-contiguous fragments of forest that create a valuable community resource.
Provide Food and Habitat for Wildlife
Leaf litter is a base food source for many stream ecosystems. Forested buffers also provide woody debris that creates cover and habitat structure for aquatic insects and fish.
Preserve Important Terrestrial Habitat
Riparian corridors are important transition zones that are rich in species. A mile of stream buffer can provide 25 to 40 acres of habitat area. Unbroken stream buffers provide corridors for conservation that are highways for migration of plant and animal populations.
Maintain an Essential Habitat for Amphibians
Preservation of flood plains in a forested state effectively protects aquatic and terrestrial habitats that are dependent on riparian environments to protect their life cycles.

HEALTHY WATERS/FOREST RETENTION STUDY FINAL REPORT: JUNE 30, 2017 58
VIRGINIA There are a variety of buffer requirements in Virginia Code and regulation which provide differing amounts of land protection from development or human intervention/encroachment. Some of these are discussed below.
The Chesapeake Bay Act regulations require that a 100-foot wide buffer area be designated as the landward component of the Resource Protection Area (RPA). The Act defines RPA as “… that component of the Chesapeake Bay Preservation Area comprised of lands adjacent to water bodies with perennial flow that have an intrinsic water quality value due to the ecological and biological processes they perform or are sensitive to impacts which may result in significant degradation to the quality of state waters.” As part of the RPA, the Regulations require that “…a 100-foot wide buffer area of vegetation that is effective in retarding runoff, preventing erosion, and filtering non-point source pollution from runoff shall be retained if present and established where it does not exist.”
Virginia’s Chesapeake Bay Preservation Act (CBPA) established 50 feet as the Resource Protection Area (RPA) limit for a “no impact zone” designated as the waterside of the overall RPA limit. Minimal impacts are allowed for water dependent uses and utilities.
The Virginia Department of Conservation and Recreation (VDCR) identifies 35 feet as a minimum buffer for agricultural uses in accordance with the USDA Natural Resources Conservation Service (NRCS) minimum buffer limits dependent on use.
The minimum stream and wetland buffer for the select timber harvesting of property recognized by the Virginia Department of Forestry (VDOF) is 25 feet. Note VDOF Streamside Management Zone (SMZ) has buffer widths based on slopes adjacent to the water features.
In recent years, studies have suggested that streamside forests can serve as highly effective filters that control both surface runoff and, in many landscapes, groundwater flow in streams. In addition, they provide shade, temperature control, and food required by many aquatic species. Streamside forests, as a result, are being viewed as a way to partially mitigate the loss of forest over much of the remaining landscape. This recognition has come after many streamside forests were cleared for other uses. The Chesapeake Basin has more than 112,000
BENEFIT BENEFIT EXPLANATION
Mitigate Stream Warming
Shading provided by a forest canopy protects the thermal regime of streams. This is especially important in urban areas where stream warming is a significant cause of in-stream species mortality.
Preserve Wetlands Urban buffers offer protection of associated wetlands that are frequently found along stream corridors. Wetlands are critical to the control of both the quantity and quality of stormwater runoff, with direct contributions to nutrient recycling.
Protect Steep Slopes
Areas that should be excluded from development, like steep slopes, can be set aside to reduce soil erosion if located in riparian areas.
Source: Palone, R.S. and A.H. Todd (editors.) 1997. Chesapeake Bay riparian handbook: a guide for establishing and maintaining riparian forest buffers. USDA Forest Service. NA-TP-02-97. Radnor, PA., page 11-2.

HEALTHY WATERS/FOREST RETENTION STUDY FINAL REPORT: JUNE 30, 2017 59
miles of rivers, streams, and shorelines, but it has been estimated that as much as 60 percent of the streamside forests have been removed or severely impaired. Although comprising only 5- 10 percent of the land in the watershed, riparian areas have an extremely important role in maintaining the health of the Bay in its entirety.18
PENNSYLVANIA Pennsylvania has a goal of planting 95,000 acres of riparian forest buffers statewide by 2025 to improve water quality in waterways in the Commonwealth and the Chesapeake Bay. Only when a waterway is state-designated as Exceptional Value or High Quality and, even then, only in certain circumstances do state regulations protect these riparian buffers. To achieve this goal requires the help and cooperation of landowners and communities. To assist, there are a number of cost share and grant programs in place for restoring riparian forest buffers.
Pennsylvania law allows municipalities to adopt land use regulations to protect riparian buffers whether or not state regulations apply. These local regulations can ensure that riparian buffers are maintained as forest and, if not already under substantial forest canopy, are appropriately planted at the time of development. Particularly in the absence of state regulation, these municipal regulations play a crucial role in achieving and maintaining the quality of the Commonwealth’s water.
18 Palone, R.S. and A.H. Todd (editors.) 1997. Chesapeake Bay riparian handbook: a guide for establishing and maintaining riparian forest buffers. USDA Forest Service. NA-TP-02-97. Radnor, PA., page 1-2.

HEALTHY WATERS/FOREST RETENTION STUDY FINAL REPORT: JUNE 30, 2017 60
C. Land Use and Zoning Policies 1. Comprehensive Plan
VIRGINIA The Comprehensive Plan in Virginia is (or is intended to be) the foundation for all decision-making in matters involving land use planning and growth management. Planning is necessary if a community intends to manage its future. Localities in Virginia plan for two major reasons. The first issue is that state law mandates that every local government in Virginia must prepare and adopt a Comprehensive Plan (§15.2- 2223). The second reason Virginia localities engage in planning is to prepare for and cope with change. The Virginia Code reflects this reality in the Declaration of Legislative Intent (15.2-2200) which outlines the Commonwealth’s rationale and reasoning for requiring all local governments to plan for their communities tomorrow today. Once adopted, Virginia’s localities are required to review their Comprehensive Plan at least once every 5 years to determine if amendments are needed to maintain its relevancy for guiding the community’s growth and development. Although having a plan is required by law, the Virginia Code does not mandate that a comprehensive plan be implemented or followed. Despite this shortcoming, most Virginia localities have chosen to implement, in whole or part, the goals, objectives and policies featured in their respective plans. Of equal importance, the Virginia Supreme Court has opined that a locality is empowered to follow and/or implement its comprehensive plan. With respect to forest retention, localities can include a policy statement in their comprehensive plan stating the preservation of high conservation-value forest (HCVF) is important to the community. Moreover, the comprehensive plan could be structured to reflect the following:
a) map the location of HCVF and recommend notification procedures to alert property owners of their HCVF holdings,
b) a comprehensive plan chapter focused on the locality’s natural resources including forests, wetlands, prime agricultural soils, water resources, and related natural features. The chapter could also include policy statements designed to protect the locality’s ecologically-sensitive lands,
c) alert forest, wetland and prime agriculture landowners of the opportunity to pursue Agriculture-Forestry district designation, LUVT tax reduction programs, and wetland banking opportunities, and
d) affirm the retention of forests as a comprehensive plan policy goal. PENNSYLVANIA Pennsylvania’s Municipalities’ Planning Code (MPC) requires each municipality and county to develop and adopt a comprehensive plan. The county plans must generally conform to plans

HEALTHY WATERS/FOREST RETENTION STUDY FINAL REPORT: JUNE 30, 2017 61
adopted by the municipalities (individually or collectively in the case of a multi-municipality plan). County plans must be updated every 10 years, while municipality plans only require a review every 10 years. MPC Section 301 (7) requires a county plan to:
a) Identify land uses as they relate to important natural resources and appropriate utilization of existing minerals.
b) Identify current and proposed land use which have a regional impact and significance, such as large shopping centers, major industrial parks, mines and related activities, office parks, storage facilities, large residential developments, regional entertainment and recreational complexes, hospitals, airports and port facilities.
c) Identify a plan for the preservation and enhancement of prime agricultural land19 and encourage the compatibility of land use regulation with existing agricultural operations.
d) Identify a plan for historic preservation.
2. Official Map VIRGINIA The official map is one of four primary tools localities can use to implement the local comprehensive plan. According to §15.2-2233 of the Virginia Code, a local planning commission may make a map showing the location of any: 1. Legally-established public street, alley, walkway, waterway and public area of the locality; and 2. Future or proposed public street, alley, walkway, waterway and public area. If developed, the official map must establish the centerline, width and right-of-way of streets and the metes and bounds of public areas in relation to known, fixed and permanent monuments either by physical or aerial survey. Such an instrument could be an indirect instrument of forest and wetland retention if the mapping of ROW features and public areas avoided HCV forest and wetlands.
The official map is defined and described in §15.2-2233 through §15.2-2238 of the Code of Virginia. As a discretionary tool of plan implementation, localities are not mandated to adopt an official map. Numerous localities across the state have developed maps detailing the location of existing streets, waterways and public areas. While these maps satisfy a component of the official map definition, they completely ignore the second criterion regarding future or proposed public streets, waterways and public areas. As such, no locality in Virginia has an official map that matches the complete code definition.20
19 Author’s Note: There is no parallel requirement to preserve and enhance high-conservation value forests. 20 Source: American Planning Association-VA Chapter, “Managing Growth and Development in Virginia”, November 2016, page 18.

HEALTHY WATERS/FOREST RETENTION STUDY FINAL REPORT: JUNE 30, 2017 62
PENNSYLVANIA In Pennsylvania, an official map shows the locations of planned future public lands and facilities such as streets, trails, parks and open space. The official map expresses a municipality’s interest in acquiring these lands for public purposes sometime in the future and notifies developers and property owners of this interest. Official maps may be used by townships, boroughs, cities, and counties. An official map is not a municipal base map, existing or future land use map, a zoning map, or any map in a comprehensive plan, though these can be used to help identify areas for the official map ordinance. Section 107(b) of the PA Municipalities Planning Code (MPC) defines an official map as a “land use ordinance” with the map as the primary component of an official map ordinance. If a landowner seeks to build on or subdivide land noted on the official map, the municipality has up to a year to acquire the land from the owner before the owner may freely build or subdivide The PA MPC, Article 4, Section 401 authorizes municipalities to make and adopt an Official Map regarding to public lands and facilities, and which may include, but need not be limited to:
a) Existing and proposed public streets, watercourses and public grounds, including widenings, narrowings, extensions, diminutions, openings or closing of same
b) Existing and proposed public parks, playgrounds and open space reservations c) Pedestrian ways and easements d) Railroad and transit rights-of-way and easements e) Flood control basins, floodways and flood plains, storm water management areas
and drainage easements f) Support facilities, easements and other properties held by public bodies
undertaking the elements described in section 301
The Official Map tool is used more in Pennsylvania than in Virginia.
3. Urban Growth Boundary An Urban Growth Boundary can be defined as a line on a map marking the separation of forested or otherwise open land from land on which development should be concentrated as defined by a locality’s comprehensive plan. The goals for an urban growth boundary generally focus on protecting urban land, containing urban sprawl, and providing for an orderly transition from urban to open land uses. VIRGINIA In Virginia, the effect of the “Urban Growth Boundary” tool is more commonly achieved through “Targeted Development Area”, “Urban Development Area (UDA)” or “Urban Service Area (USA)” designations. Localities’ (through their comprehensive plan and public water and sewer master plans) define areas where growth and development are encouraged as a matter of public policy, leaving areas outside the designated “Targeted Development Areas” as less

HEALTHY WATERS/FOREST RETENTION STUDY FINAL REPORT: JUNE 30, 2017 63
suitable for development, usually with rural, agricultural preservation or large-lot zoning designed to limit development. As a tool for forest retention, UDA/USAs could be useful if Transfer of Development Rights programs are used, in combination with UDA/USAs, to remove “by right” and family subdivision development pressure on rural, farm and forest lands and move or transfer these development rights to the designated UDA/USA where urban services are planned to support the expected additional population. Since the actual severance of the development rights is done through a voluntary contractual sale between landowner and private developer based on a fair market negotiation of unit value, there is no unconstitutional public “taking” without compensation.
PENNSYLVANIA Pennsylvania’s home rule governance environment allows for the delineation by municipalities of “Urban Growth Boundaries (UGBs)” as an “urban development containment” strategy.21,22,23.
4. Changing Permissible Zoning The uses that may be allowed on land can be changed either by amending the regulations of the zoning district in which the land is located (i.e. a “zoning text amendment”), or by amending the zoning map and changing the district in which the land is situated (i.e. “a zoning map amendment”). Both actions are commonly referred to as a “rezoning”. Typically, a zoning map amendment either up-zones or down-zones the land. An up-zoning is the rezoning of land in a manner that increases the permitted intensity of use or development by right, and it may include an increase in permitted density. A down-zoning is the rezoning of land that reduces the permitted intensity of use or development by right, including a reduction in permitted density. Land may be also be up-zoned or down-zoned by a zoning text amendment by liberalizing or restricting, respectively, the by-right uses allowed in the zoning district.
Up-zonings are the more common type of rezoning action and are typically initiated by the landowner. Down-zonings, on the other hand, are less common and are typically initiated by the locality. It is important to note the United States Supreme Court has long opined that up-zonings and down-zonings are equally permissible. However, both the U.S. and Virginia Supreme Courts have cautioned that a key inquiry in determining the legality of a down-zoning is whether it is comprehensive or piecemeal. Comprehensive down-zonings are lawful, provided that all other requirements for a lawful rezoning are satisfied and the down-zoning itself does not result in a “taking” (i.e. denying access, use or enjoyment of one’s property by the government without the payment of fair compensation to the property owner). Piecemeal down-zonings are impermissible under Virginia law except where there is a change in
21 Source: http://conservationtools.org/guides/48-urban-growth-boundary 22 Additional background on UGBs at: https://www.brookings.edu/wp-content/uploads/2016/06/pendallfultoncontainment.pdf 23 Source: http://www.williamsmullen.com/news/transfer-development-rights-virginia-tapping-market-land-use-entitlements

HEALTHY WATERS/FOREST RETENTION STUDY FINAL REPORT: JUNE 30, 2017 64
circumstances associated with the property, a mistake in fact was made when the property was originally zoned, or the property was zoned as a result of fraud.
The ability to change permissible zoning – either up or down - is a resource tool localities should consider relative to ensuring forested land, even if privately-owned, remains an asset in relation to sustaining water quality and reducing publically-funded grey infrastructure costs for stormwater management or other public programs.
5. Agricultural (Preservation) Zoning Agricultural land is steadily being lost through both non-farm development and soil erosion. Agricultural land preservation rose to a level of national importance and gained recognition through the 1981 passage of the Farmland Protection Policy Act. Even when metropolitan areas are not increasing in population, much scattered development occurs in their vicinity. Much of this scattered development is on Important Agricultural Land, whose physical characteristics are generally excellent for building.
Scattered development in farming areas removes agricultural land from production both directly and indirectly. Development directly removes the agricultural land on which it is built from productivity. Indirectly, it may force nearby farmers out of production by traffic, trespassing, and pilferage by non-farm residents, by their complaints about dust, smells, sprays, and noise, and especially by causing a general rise in land values, and higher property taxes.
All states have recognized the need to preserve good agricultural land and have provided tax and other incentives for farmers to continue farming. But only a few, such as Wisconsin, have linked the incentives to controls preventing development. The federal government, and most states (Oregon is the outstanding exception) have inconsistent land use and infrastructure policies that generate pressures for development in farming areas.24
VIRGINIA The conventional approach in Virginia for maintaining agriculture as a land use has been the use of agricultural zoning which limits residential densities by acreage. In several localities, agriculturally-zoned land permits a dwelling unit to be built for every acre, two acres or three acres. In other localities, dwelling units are permitted, but on a larger scale such as one unit for every 25, 40 or 50 acres. This level of density makes a stronger statement with regard to how agriculture is viewed in some Virginia localities.
PENNSYLVANIA Pennsylvania has enacted several laws to sustain agriculture in the State economy. Some townships have utilized the powers under Agricultural Area Security Law, Act 43 of 1981, 3 §§ PS.901-915 to establish agricultural security areas (ASA) as a land use tool in combination or addition to agricultural zoning. Most importantly, ASAs protect farmers from local nuisance
24 American Planning Association, APA Policy Guide on Agricultural Land Preservation, 1999.

HEALTHY WATERS/FOREST RETENTION STUDY FINAL REPORT: JUNE 30, 2017 65
complaints. Other state programs include Agricultural Conservation Easements (ACE) and the Pennsylvania Farmland and Forest Land Assessment Act 319 of 1974 (AKA, “Clean and Green Act”). These programs protect PA’s agricultural lands as well as help municipalities define their agriculturally dominant areas. If there is a large agricultural component to a community, it may opt to create an agricultural zone in addition to ASAs and ACEs, which would afford another layer of protection to a local farm or farm community.25
Agricultural Protection Zoning (APZ) 26 is used by municipalities to preserve the availability of agricultural lands for farming and provide stability to the farming economy. The local government designates areas where agriculture is intended to be the principal use. Regulations are established for these agricultural zoning districts to constrain non-agricultural development and uses APZ regulations can help to:
a) reduce conflicts between farm and non-farm uses; b) maintain a critical mass of farmland that keeps businesses and organizations that
support farms, such as farm suppliers and granges, viable; c) protect prime agricultural soils, which, if developed, are irretrievable; d) keep land affordable for farmers; e) promote more efficient agricultural operations; and f) protect the character of the community
The following are various iterations of agricultural zoning used in both Virginia and Pennsylvania.
a) Sliding Scale Zoning The key concept behind this zoning approach is that the number of development rights is based on the sizes of existing parcels and not on a fixed ratio. For example, a sliding scale might permit one dwelling unit on parcels of 1 to 14 acres, another dwelling unit on 15 acres to 50 acres, and another on parcels of 51 to 100 acres. In this example, the sliding scale would limit the total of nonfarm dwellings subdivided from a farm of 100 acres to no more than three. Sliding scale zoning is being used in both Virginia and Pennsylvania.
b) Exclusive Agricultural Zoning Exclusive agricultural zones basically allow only agricultural and agriculturally-related support operations. This tool has been used with success in both Commonwealths as well as across the country.
25 Source: PA DECD, Planning monograph “Zoning; Planning Series #4”, 10th Edition, April, 2015, page 26. 26 Descriptions in this section draw heavily and quote from http://conservationtools.org/guides/67-agricultural-protection-zoning. We recognize the excellent reference information at this website developed through PATA.

HEALTHY WATERS/FOREST RETENTION STUDY FINAL REPORT: JUNE 30, 2017 66
c) Large Lot Zoning
With large lot zoning the minimum lot size is specified as something in the order of one development right for every 25, 40 or 50 acres to severely restrict non-agricultural development in proximity to the agricultural enterprise. Such a lot size may or may not be large enough to support the needs of a working farm. Also, subdivisions producing new lots of 25 acres that become residential estates can remove a significant amount of prime farmland soil from production. Large lot zoning has emerged as a favored zoning technique for sustaining working farms, but it should be recognized that large lot zoning will generally not, on its own, secure large tracts of farmland for sustained agriculture.
d) Fixed-Area Based Allocation Area based allocation takes several forms. For example, one dwelling might be allowed per a specified number of farm acres, such as 25. In another approach, a percentage of a parcel (such as 10%) is permitted to be developed for residential purposes. In such cases, the homes to be built are clustered to ensure the bulk of the land remains in agricultural use. The Lehigh Valley agricultural protection zoning ordinance in Pennsylvania uses a 90/10 ratio to protect farmland land that is suitable for residential subdivision. In Virginia, the Hanover County AR-6 zoning district uses an approximate 75/25 ratio to protect farmland, while accommodating limited residential development.
6. Zoning for Natural Resources VIRGINIA Within Tidewater Virginia (i.e. comprised of the localities east of the I-95 corridor within the Chesapeake Bay watershed), local governments have designated Resource Protection Areas (RPAs) under the authority of the Chesapeake Bay Preservation Act. Additionally, some Virginia localities have used the overlay zoning technique to increase protection of critical local natural resources to provide for increased natural buffer areas and setback distances from perennial streams, floodplains and coastal waters, limitation of land-disturbance activities, restrictions on the use on non-native plant species in landscaping sites, prohibition of land development on steep slopes or unsuitable shrink-swell soils, as well as for various better management of access to private lands from the public roadways.

HEALTHY WATERS/FOREST RETENTION STUDY FINAL REPORT: JUNE 30, 2017 67
PENNSYLVANIA Natural resource protection zoning standards have been used by some PA municipalities to support the protection of green infrastructure areas and natural conservation zones within their community.27
7. Open Space Districts VIRGINIA This is a zoning district created to protect the natural and/or unique features within an identified area. An open space district usually imposes density limitations and other development restrictions intended to protect a natural or unique feature. Land in Virginia can be valued at an open space rate for tax purposes, but there is currently no basis in Virginia open space law to establish such districts through zoning actions; rather, they are initiated by the landowner that applies for land use tax treatment for eligible open space land. Open space lands can qualify under the Agricultural/Forestal District Act (§ 15.2-4400) for designation as Agricultural or Forestal Districts, but not as Open Space Districts. The definition of open space in § 58.1-512 of the Virginia tax code, if made applicable as well to the various Virginia open space enabling legislation could remedy this situation.
PENNSYLVANIA Municipalities in PA may designate common or public open space in comprehensive plans, set-out guidelines for common open space in residential and planned unit developments and may accept a dedication of open space made by developers under development agreements (like conditional zoning proffers in Virginia). Open space may also be reserved under the Clean and Green Program provided the land meets the criteria for agricultural reserve lands (i.e. non-commercial open space lands used for outdoor recreation of the enjoyment of scenic or natural beauty and open to the public for that use, without charge or fee, on a nondiscriminatory basis).
8. Overlay Zoning This tool can be used for areas containing one or more natural or unique features worthy of protection. Overlay zoning involves superimposing an additional district boundary (e.g. a floodplain or water basin district or land along a highway corridor) over the existing zoning map. The overlay zoning district creates a supplemental set of regulations intended to protect the specific features of the land or to add additional controls needed to mitigate development impact within the defined overlay area. This tool has been used successfully in both Virginia and Pennsylvania. An Overlay Zoning District could be used as a tool to protect High-Conservation Value forest (or a local green infrastructure network) where forest retention provides greater public benefit. Overlay zoning has been used in Pennsylvania by various
27 See: http://conservationtools- production.s3.amazonaws.com/library_item_files/924/846/ modelconservzoningdistnatresourcestds.pdf?AWSAccessKeyId=AKIAIQFJLILYGVDR4AMQ&Expires=1496697189&Signature=wdaYIAIMSSGM4IIzTvw36jb530s%3D

HEALTHY WATERS/FOREST RETENTION STUDY FINAL REPORT: JUNE 30, 2017 68
municipalities for a variety of purposes (e.g. wellhead protection and water supply protection zones).28
9. Performance Zoning The development standards accompanying performance zoning are based on permissible impacts rather than on permissible uses. Performance zoning involves a review of the impacts of a proposed development with the intent of reducing negative impacts on the land’s natural and unique features. Performance zoning originated as an industrially-related concept. Standards were established for such elements of industry as particle emissions, noise, glare, and vibration. When a particular use could prove that it was able to meet these certain standards, it would then be accepted as a permitted use in that district. Performance zoning has now been expanded to include land uses other than industry, in particular residential uses. The performance standards typically applied in residential instances may include the reduction of impact on environmentally-sensitive areas (i.e. floodplain, wetlands, prime agricultural land, steep slopes, forest, etc.), the allocation of required recreational land and open space, total tract size, density, the ratio of impervious surfaces, and a minimum percentage of community open space. Such environmental standards are instituted for the purpose of natural resource protection. Environmental performance zoning attempts to relate the intensity of development to the site’s natural carrying capacity. This type of performance zoning differs from the industrial method by determining a quantity or degree of permissible development and consequently the number of lots allowable, not whether a particular use is permitted.
Performance zoning standards provide a greater degree of specific control to the municipality while also affording developers increased design flexibility. Although this approach does offer several advantages, it also creates an additional burden with respect to the administration and enforcement of the zoning ordinance. Pennsylvania29 allows performance zoning; however, instead of being based on a defined list of specific permitted uses, the Pennsylvania model uses a list of specific quantifiable criteria which must be met by any proposed use.
10. Conditional Zoning and Proffers
Development projects that seek significant variance from what is allowed under the underlying zoning district for a property, may seek “conditional zoning” which may include proffered actions by a developer. “Proffers” are voluntary offers made through negotiation
28 PA Municipalities Planning Code (Act of 1968, P.L. 805, No. 247, as amended). 29 PA Department of Community and Economic Development (DCED), “Zoning: Planning Series #4”, 2015, page 27

HEALTHY WATERS/FOREST RETENTION STUDY FINAL REPORT: JUNE 30, 2017 69
with a local government by a rezoning applicant to offset the impact of a requested rezoning. The conditional zoning process and the use of proffers had been used widely in Virginia until 2016, when the Virginia General Assembly passed legislation significantly limiting their use to address project-specific impacts related to transportation, public safety, schools or parks. This legislative change has had a significant impact on local governments’ reliance on proffers, particularly in high growth areas like Northern Virginia.
Proffers can limit uses allowed on the site, and provide public improvements, land or cash to mitigate development impact within the four enumerated public services and facilities. In a typical situation, a local government estimates what it would cost to provide infrastructure to a new project, then suggests what “fair-share” percentage the developers could offer to pay. If the developer agrees with or comes close to the government’s suggested estimate and proffers the estimated cash amount or dedications of land (e.g. for school or park sites, land for transportation ROW, etc.), the rezoning request could likely be approved. Proffers have been used successfully in the past to create tree buffers in urban areas on a localized scale, but are of limited use in conserving large, unfragmented forestland parcels which are key to HCV forestland retention. Under the new restrictions, proffers intended to help retain forest lands may likely need to tie-in with a community’s park plan to meet the new limitations passed in 2016.
VIRGINIA Virginia gave birth to conditional zoning nearly 45 years ago. Since that time, the concept has grown in popularity as well as use. In 2016, the Virginia General Assembly passed legislation designed to temper the escalating costs associated with proffers in selected Virginia high growth localities, as well as restrict the protocol many localities and developers had previously used to formulate and craft proffers. The by-product of this change has been a decline in the number of conditional zoning requests in several high growth localities across the Old Dominion. Time will tell if this decline is temporary or an indication some localities have decided to no longer accept proffers or rely upon conditional zoning to manage and guide land development systematically. It is important to note proffers have been used to create tree buffers in selected urban localities.
Under Virginia law (§ 15.2-2296), there are three different types of conditional zoning (also known as proffer zoning) which localities are authorized to use:
a) Conditional zoning as authorized by §§ 15.2-2296 through 15.2-2302 (excluding §15.2-2298). This form of conditional zoning is available to all localities but is quite restrictive. The proffered condition must arise from the rezoning application and may not include cash proffers nor dedication of real or personal property.
b) Conditional zoning authorized by § 15.2-2298. This is the most recently authorized form of conditional zoning and is available to any locality which has had a population increase of 5 percent or greater from the next-to-latest to latest decennial census

HEALTHY WATERS/FOREST RETENTION STUDY FINAL REPORT: JUNE 30, 2017 70
year. Cash proffers are permitted under this type of conditional zoning; however, there are restrictions on how this type of conditional zoning can be used that are not applicable to the type authorized by §15.2-2303.
c) Conditional zoning authorized by § 15.2-2303. This type of conditional zoning applies
to selected Northern Virginia localities as well as the two counties on Virginia’s Eastern Shore. This style of conditional zoning is the most flexible as the Virginia Code did not limit the scope or character of the proffers accompanying the rezoning request including the acceptance of cash as well as land.
PENNSYLVANIA The Conditional Zoning process and the use of proffers are not recognized in Pennsylvania under the Municipality Planning Code (Act of 1968, PL 805, No 247 as reenacted and amended). Pennsylvania law appears to view such actions as a form of illegal “contract zoning”. Under the exercise of Conditional Zoning (or Development Agreements in Pennsylvania, see next section), negotiations between the developer and the locality may include the discussion of the mechanisms listed below. The developer’s response, customarily in the form of “proffers”, expresses a legal commitment to do the “proferred” action.
a) Dedications: This would be a request from a local government that as a condition to obtaining conditional rezoning approval to build, a developer dedicates a negotiated portion of the parcel of land proposed for development to be retained as forestland (or a school site, or other public facility needed to mitigate the impact of the development).
b) Development Incentives: These include bonus densities offered to landowners or developers who wish to set aside large portions of their land (usually more than half) as open space. Cluster development aimed at conserving high conservation value forested (HCV) parcels is an example.
c) Development Disincentives: These discourage conventional “cookie cutter’ development designs. A disincentive could involve significant density reduction in lot yield (i.e. 33 percent or more) for those developers who discount community open space objectives.
d) Deed Restrictions & Covenants: Deed restrictions represent a legal constraint on the use of one’s property that is recorded on the property’s deed. Deed restrictions may be required of or proffered by new developments or negotiated with current landowners. The right to enforce the restriction may be assigned to a tax-exempt

HEALTHY WATERS/FOREST RETENTION STUDY FINAL REPORT: JUNE 30, 2017 71
charitable organization or retained by a government agency. A common form of deed restriction is a conservation easement which is discussed separately on page 75.
Covenants represent an agreement or commitment made by the property owner, recorded with the deed, to perform specific actions. A developer, for example, could covenant the creation of a conservation easement over a portion of a development tract. A properly-worded covenant can have the same effect as a conservation easement and have the same permanency.
11. Development Agreements Development agreements permit a locality to enter into a contract with a landowner that locks in existing zoning standards impacting a development project for an extended period of time. In most instances, development agreements are crafted to stimulate economic growth consistent with the locality’s comprehensive plan over an extended period of time.
VIRGINIA The Code of Virginia authorizes New Kent County to enter into binding development agreements with any persons owning legal or equitable interests in real property in the County if the property to be developed contains at least one thousand acres. The Agreement, if executed, shall be by authorized by ordinance and be for a term not to exceed 15 years. Subsequent terms may be added not to exceed 10 years.
PENNSYLVANIA Pennsylvania law does provide for various forms of development agreements30 which, in Pennsylvania’s home rule governance environment, may achieve the same effect as conditional zoning. Municipalities use development agreements to enumerate any special conditions that may be attached to the project. Developers use the agreements to provide a complete list of permits, municipality-imposed conditions and other contingencies that will affect the project.
12. Cluster Development and Cluster Zoning Cluster development is used in residential development situations. It allows a fixed number of lots on a given parcel of land, but the owner of the property is given the right to increase the density of development beyond what applicable zoning regulations may allow in one area by clustering all the residences on a portion of a development site to preserve the remaining open space, agricultural land or a unique natural feature such as forestland, wetlands or wildlife habitat. Sensitive areas, buffers, and open space are situated on the remaining land. This land development site planning approach fosters a more cost-effective development pattern that enables local governments and developers to incur savings on public infrastructure services such as roads and sewer lines. Because clustered development maintains the prescribed density (and often offers bonuses), there is a greater compromise
30Source: http://www.philadelphiarealestatelawyersblog.com/2016/03/understanding-development-agreements-in-pennsylvania.shtml

HEALTHY WATERS/FOREST RETENTION STUDY FINAL REPORT: JUNE 30, 2017 72
between the developer looking for economic return and the local jurisdiction seeking land conservation. Some negatives are that the permitting and approval process for cluster developments can be long and complicated and some developers view clustering as being financially-risky. Jurisdictions with successful clustering regulations claim active public participation and a supportive comprehensive plan are key factors. The point has been made that for the public to accept clustered development that optimizes existing infrastructure and conserves forestland, more densely-populated communities must provide premium services and attractive environments for the people living there. Since trees in a community are often cited by real estate and quality of life studies as adding value to a property, retaining forestland could be considered an addition that creates an attractive environment. PENNSYLVANIA While Pennsylvania planning literature, planning and zoning technical assistance manuals and other conservation planning resources lack reference to cluster subdivisions, it is recognized and practiced by some municipalities, often under the guise of “conservation subdivisions”31.
13. Planned Unit Development (PUD) Planned Unit Developments (PUDs) came of age 55 years ago as a way for developers to mix commercial and residential land uses through flexible design standards, while going through a single approval process. From this humble beginning, PUDs have become a preferred style of development in most states across the nation. As used today, PUDs permit a mix of housing, office, commercial and industrial uses, along with retail and service facilities. In addition, the resolution of approval allowing a PUD to be developed will include parameters by which the PUD will operate including parking and circulation, landscaping, signage, lighting, permitted land uses, permitted densities, as well as provisions governing open space and the management of natural resources associated with the property.
As designed, a PUD functions much like a floating zone. It is not shown on a locality’s zoning map, but it is listed and described in the text of the locality’s zoning ordinance. The decision to permit or allow a PUD to come into existence is a decision the local governing body will make.
VIRGINIA Planned unit developments have been a part of the Virginia land development protocol for nearly 60 years. In fact, the design and evolution of the Reston community in Fairfax County is viewed by many as Virginia’s first modern PUD.
31 See: Chester County Planning Commission, http://www.landscapes2.org/ToolsElement/Pages/Cluster.cfm

HEALTHY WATERS/FOREST RETENTION STUDY FINAL REPORT: JUNE 30, 2017 73
PENNSYLVANIA These allow for more flexible development practices while continuing to meet overall density and land use goals. Development within a PUD may be of mixed use, massed, or clustered so that the individual lots are small and open space is preserved. Communities can also require that PUD’s set aside a portion of the development for recreation and/or natural areas, such as HCV forestland. Local jurisdictions may create a PUD zoning district or permit a PUD in a conventional district if it meets all zoning requirements.
Pennsylvania was one of the first states to enact PUD enabling legislation32. Pursuant to this statute, local governmental units enact planned residential development ordinances. The local boards then make the required statutory findings as specified PUD proposals are brought before it. The findings of fact include, but are not limited to, the following: (1) consistency with the comprehensive plan; (2) consistency with the zoning and subdivision regulations; (3) adequacy of the amount and purpose of common open space; (4) relationship between project design and public services; (5) effect of the plan on the neighborhood; and (6) consistency with the public interest33.
14. Conservation Development Conservation development is intended to limit development to a small portion of a tract of land to help protect natural or unique features located on the property. If the landowner’s development plan adheres to local ordinances, conservation development effectively becomes a private approach to cluster zoning. A conservation development may be combined with the donation or sale of conservation easements. Conservation development is practiced in both Virginia and Pennsylvania; albeit perhaps under a different name (e.g. PUDs, cluster subdivisions, etc.). § 15.2-22.861 of the Code of Virginia sets out provisions for clustering of single-family dwellings so as to preserve open space; however, the enabling authority for local governments is limited to localities whose historic population growth rate and population density meet criteria set out in the statute.
32 PA. STAT. ANN. tit. 53, §§ 10701-12 (1972). The Pennsylvania PUD statute was enacted as a section of the Municipalities Planning Code, Pennsylvania's comprehensive enabling statute, to encourage innovations in residential development and renewal so that the growing demand for housing may be met by greater variety in type, design and layout of dwellings and by the conservation and more efficient use of open space . . . , to provide a procedure which can relate the type, design and layout of residential development to the particular site and the particular demand for housing . . . , and to insure that the increased flexibility of regulations . . . is carried out . . . without undue delay .... Id. at § 10701. 33 “Land Use—Judicial Interpretation of the Planned Unit Development Statute in Pennsylvania”, 9 Urb. L. Ann. 273 (1975) Available at: http://openscholarship.wustl.edu/law_urbanlaw/vol9/iss1/13, Page 276.

HEALTHY WATERS/FOREST RETENTION STUDY FINAL REPORT: JUNE 30, 2017 74
D. Voluntary Landowner Actions
1. Land Trusts Land trusts are most commonly private, non-profit organizations which advise and assist landowners in negotiating land transactions and then purchase (or accept donations of) the land in question and then hold and enforce the land easements. Land trusts represent the fastest growing sector of land conservation in the United States. Both Virginia and Pennsylvania permit land trusts. To achieve land preservation goals, land trusts use a variety of creative methods that are designed to meet needs of both the community and the landowner. Some of the larger national organizations, such as The Nature Conservancy, operate on the market principle: if you want to have control over something, own it. These groups identify land they believe is worthy of protection – high conservation value forestland, land with scenic vistas, wetlands, habitat for rare species, etc. and they buy it or partner with other organizations to conserve it. However, the majority of land trusts are local or regional in character and pursue voluntary conservation or historic preservation easements and donations of land. Few regional or local land trusts have the financial resources to purchase and retain ownership of land. Factors that have contributed to the success of land trusts include public support, donations, and partnership approaches between landowners and management organizations. The success of land trusts as a conservation mechanism has been limited by their reliance on private donors, the lack of public knowledge regarding their function, and the cost and challenge associated with saving large blocks of land. Nonetheless, they represent a very market-oriented approach for acquiring open space that complements the goal of retaining high conservation value forestland. In most cases, their transactions are between willing buyers and willing sellers, or between a land trust and a willing donor. Little to no government participation is involved as long as the transaction conforms to the local government’s Comprehensive Plan. VIRGINIA The Virginia Outdoors Foundation (VOF) is a quasi-public state agency created by statute in 1966 and is the largest holder of easements in the Commonwealth. The Virginia Department of Forestry is the second largest holder of easements in the Commonwealth and focuses its efforts on conserving working forests. There are many other more localized private land trusts in operation throughout Virginia and land trusts, as a group, have formed the Virginia United Land Trusts (VaULT)34 organization to advance land conservation interests in Virginia. Within the Rappahannock River basin and other parts of Virginia, the U.S. military has partnered with the Commonwealth and its localities and/or private land trusts, providing
34 See: http://vaunitedlandtrusts.org/

HEALTHY WATERS/FOREST RETENTION STUDY FINAL REPORT: JUNE 30, 2017 75
funding for easement acquisition in areas which either: a) buffer existing military installations or b) experience base-related off-site impacts. PENNSYLVANIA There are dozens of land trusts operating in Pennsylvania that have formed an active statewide land trust association (Pennsylvania Land Trust Association or PALTA) to help land trusts and other conservation practitioners improve their effectiveness, build public understanding, and advocate for better governmental policy. The PA Department of Conservation and Natural Resources, through its Bureau of Forestry and Bureau of Conservation and Recreation, works with conservation partners statewide. The PALTA organization is responsible for the website: www.ConservationTools.org which provides a variety of conservation-oriented information resources to the association network and general public interested in land conservation.
2. Conservation Easements Conservation easements are legally-binding agreements in which a landowner retains ownership of his/her private property yet donates (or sells) specifically identified rights to an organization (usually a non-profit, like a land trust). The parties agree to protect specified natural resources or cultural values by limiting the property’s use and development. Each easement is different, reflecting the conservation values of the property and the goals of the landowner. The easement ‘runs with the land’, it does not change with the sale of the property and is recorded with the deed in the local courthouse as a less-than-fee interest in real property which is an encumbrance on the title limiting future use of the property.
As a result, the easement may provide significant property and federal income tax benefits to the landowner because he/she is allowed to write off the value of the easement when the holder of the easement is a non-profit or government organization. At the same time, natural and unique areas are permanently protected from development.
The downside of perpetual easements from the perspective of many small or revenue-strapped localities is that they permanently remove property from the tax base and deprive the locality of needed revenue to meet other basic services needed by its citizens. An alternative option that is gaining in popularity is the idea of term easements that would allow reconsideration of whether to continue the easement at some point in the future, perhaps 10 – 20 years out. From a Chesapeake Bay TMDL model perspective, such long-term easements could be factored into the load projections for the given parcel over the easement period.
Granting an easement also generally allows the landowner to continue current uses including residential, forestry or farming activities and recreation. Disadvantages specific to easements include the need for monitoring and enforcement of the conditions of the easement, a task that many localities can’t afford to perform. In addition, while the favorable tax treatment an easement receives helps the landowner.

HEALTHY WATERS/FOREST RETENTION STUDY FINAL REPORT: JUNE 30, 2017 76
Conservation easements represent a negotiated legal agreement to remove and transfer land development rights to protect significant natural and cultural attributes of the land. The easement agreement is between a landowner and an easement holder, which may be a public, private or non-profit entity. From the perspective of prospective easement holders and the general public interest, land conservation easements are a strategy for:
• protection and improvement of water quality; • preservation of cultural and historic sites; • protection of native or local plant and animal communities; • sustaining working landscapes and natural areas; and • enhancement of the quality of life of the local area.
The most common conservation easement holders are public entities (e.g. local governments) or public or private non-profit land trusts which may either accept a donated easement given by a landowner, or more commonly, purchase the easement for a negotiated price. Since “eased” property cannot be fully used or developed as local zoning would otherwise allow, its market value is lessened (which may lower the assessed value of the property, with positive tax consequences for the owner). The easement holder may fully or partially compensate the landowner for this reduction in value (through the easement purchase price); or the landowner may choose to “donate” the reduction in value to the grantee. As long as certain IRS requirements are met, the reduction in market value attributable to a donated easement may be considered a charitable donation that makes the landowner eligible for a federal income tax deduction and estate tax benefits.
Either way, the landowner and easement acquirer negotiate for what development rights, if any, are retained by the landowner and the transferred development rights are subsequently “retired” by the easement holder. As opposed to a fee simple property sale (when land ownership with all rights are transferred from seller to buyer, the landowner continues to own the land conserved by an easement and retains many rights of use. An easement document might specify, for example, that the owner reserves the right to:
• engage in agricultural production; • build barns, sheds, and other farm structures; • use, maintain, and expand an existing residence; • manage woodlands for timber production; and/or • minimally subdivide the land and construct one or more additional residences in
agreed-upon areas or “building envelopes”.
The retention or complete preservation of the natural landscape under a conservation easement is not guaranteed. In fact, in most cases, the landowner retains the right to manage their land as a “working” farm or forest, keeping the land in agri- or silva-cultivation, rather than allowing the land to be sold off, subdivided and developed into urban development land uses. Through the process of placing a permanent conservation easement on their property,

HEALTHY WATERS/FOREST RETENTION STUDY FINAL REPORT: JUNE 30, 2017 77
landowners can realize both federal and state tax credits for placing a conservation easement on their land.
Under federal and state law, the acquirer of the easement assumes a responsibility to monitor and enforce the terms of the easement from a breach by the current or successor property owners (e.g. heirs of the property owners’ estate or future fee simple owners of the property).
Provided below is a general summary of the conservation easement programs in each Commonwealth, highlighting differences where they may exist
VIRGINIA These are one of the most common tools used by land trusts. However, in Virginia the term “conservation easement” has a very strict definition and is not applicable to all situations, so it is important to understand the distinction. Easements under Virginia law are dealt with under two laws: the Open Space Land Act and the Conservation Easement Act. The Open Space Land Act deals with easements held by public bodies, while the Conservation Easement Act deals with easements held by private bodies. Under Virginia law, the term conservation easement pertains only to easements held by private organizations. The more generic term for Virginia, one that would also include an easement held by a government body is an “easement in gross”.
In most cases, conservation easements are perpetual; but under the Virginia Open Space Land Act, publicly-held easements can be extinguished by agreement of the parties involved. However, in such a situation, the property owner’s income and real estate taxes will be impacted because back taxes owed on the property if it had not been a dedicated easement would be calculated and charged to the land owner. By contrast, a perpetual easement offers a landowner significant potential financial incentives, allowing the tax on the land in question to be qualified under the Commonwealth’s open space land use rate which is substantially below other tax rate categories for land.
A list of Virginia-based resources to explain and explore the conservation easement program is available on-line at: http://landtrustvaorg/protect/conservation-resources/. Section §10.1-18.011 of the Code of Virginia, enacted in 1997, created a fund to assist landowners with the costs of preparing and conveying conservation easements.
PENNSYLVANIA35 Conservation easements have been allowed for decades as an instrument of common law, but the PA General Assembly passed clarifying legislation in the Pennsylvania Conservation and Preservation Easements Act, the act of June 22, 2001 (PL 390, No 29). (32 PS §§5051-5059) was enacted in its final form as House Bill 975, PN 2294. It is Pennsylvania's enabling
35 Source: http://www.dcnr.state.pa.us/cs/groups/public/documents/document/dcnr_002310.pdf

HEALTHY WATERS/FOREST RETENTION STUDY FINAL REPORT: JUNE 30, 2017 78
act for conservation easements (excluding agricultural conservation easements created under the Agricultural Area Security Law).
Land being placed under conservation easements may be either donated or sold to a public entity or charitable land trust; moreover, it is also possible that such land interest could be affected by land swap, TDR or PDR actions in the creation and recording of the easement.
3. Outright donation of land Land donated to land trusts and other private non-profit organizations may be managed as private open space or provide only limited, controlled public access to preserve sensitive and unique natural features. Landowners donating land to either government or non-profit organizations are often eligible to claim a federal tax charitable deduction value of the land at the time of the gift and may be exempt from transfer taxes (varies by state). Such public donations may be treated differently under the tax code than land dedicated for public use as a term of conditional development approval. In Virginia, § 58.1-811 of the Code of Virginia sets out 16 exemptions from the state transfer tax on real estate sales transactions, including (but not limited to) charitable donations to: colleges and universities, The Nature Conservancy or other recognized charities, units of local government, non-stock private hospitals, etc. “Natural Area Dedications” are a conservation option available to landowners of highly significant natural areas. Dedication is the placement of natural areas, both privately and publicly owned, into Virginia's Natural Area Preserve System, administered by DCR. The landowner retains ownership and transfer rights of the land, while voluntarily restricting land uses that are incompatible with the conservation needs of the natural area.
To be eligible, a property must include one or more of these natural values: habitat for rare, threatened for endangered plant or animal species; rare or state significant natural communities; and rare or state significant geologic sites. If your property qualifies for Natural Area Dedication, a legal document known as an "instrument of dedication" will be written and signed by you and DCR. The document will be recorded with the deed of the property thereby ensuring permanent protection of the natural area against conversion to inappropriate uses.
A landowner may receive financial incentives for dedicating his/her land. Examples include possible reduced assessment for real estate purposes, reduction of federal estate and Virginia inheritance taxes, and a charitable deduction for state and federal income tax purposes. For details on tax advantages, see tax incentives related to land conservation.36
Landowners in Pennsylvania can donate land to charity and receive a tax deduction for the market value of the donation. However, Pennsylvania requires that a transfer tax be paid on the market value at the time of transfer of a property regardless of whether it is a donation
36 See: http://www.dcr.virginia.gov/land-conservation/tools03

HEALTHY WATERS/FOREST RETENTION STUDY FINAL REPORT: JUNE 30, 2017 79
or not. In other words, most states only charge a transfer tax if this were to be a cash transaction. Pennsylvania charges the transfer tax regardless. Donors are responsible for paying this transfer tax, normally 2% of the market value of the property at the time of transfer.
4. Land Swaps This tool most often involves the exchange of land between a governmental agency and a private landowner or organization. The goal of land swaps is to conserve unique or natural features of the land involved in the swap by offering an exchange of surplus land that may be more suitable for development. Land swaps may also be negotiated by private organizations and may involve the exchange of easements or property. Such private exchanges often are done under the “Like Kind Exchange” section (1031) of the US Tax Code to provide property owners the benefit of deferring capital gains tax liability37.
5. Stewardship Agreements The US Forest Service is authorized to enter into Stewardship Agreements (SA) under the authority of Section 323 of Public Law 108-7 (16 USC 2104 Note, as revised February 28, 2003, to reflect sec 323 of JJ Res 2 as enrolled), the Consolidated Appropriations Resolution, 2003, amending Public Law 105-277. This authority allows the Forest Service to enter into stewardship agreements to exchange goods for services, exchange funds for services, or a combination of the two to complete restoration activities on National Forest System lands. The stewardship authority also allows the Forest Service to enter into stewardship agreements for up to ten years. Permitted restoration activities include:
• Road and trail maintenance or obliteration to restore or maintain water quality; • Soil productivity, habitat for wildlife and fisheries or other resource values; • Setting of prescribed fires to reduce wildfire hazards, improve the composition,
structure, condition, and health of forest stands, or to improve wildlife habitat; • Removing vegetation or other activities to promote healthy forest stands, reduce
wildfire hazards, or achieve other land management objectives; • Watershed restoration and maintenance; • Restoration and maintenance of wildlife and fish habitat; • Control of noxious and exotic weeds and reestablishment of native plant species.
In order to enter into stewardship agreements, there must be: • Mutual interest: each party has a need for, and an interest in, the jointly agreed
upon project goals & deliverables; and • Mutual benefit: which reflects a relationship when the parties have a shared
interest, contribute resources, and mutually benefit (other than monetarily) from the objective of the agreement.
37 See: https://www.irs.gov/uac/like-kind-exchanges-under-irc-code-section-1031

HEALTHY WATERS/FOREST RETENTION STUDY FINAL REPORT: JUNE 30, 2017 80
The parties pool their resources to carry out the project and obtain the deliverables. While the stewardship authority does not require partner cost-sharing; Forest Service policy requires a minimum 20% contribution of the total project value.
E. Land & Development Rights Acquisition Land acquisition and voluntary programs are effective and efficient ways of preserving land, although their use is somewhat limited in scope. Most land acquisition and voluntary preservation programs have similar advantages and disadvantages. In general, these programs involve few legal disputes over property rights and takings issues. Land acquired through these methods is seldom controversial and usually remains as permanent forest land or open space.
Many voluntary programs, such as easements and land donations, may qualify the property owner for tax incentives. Present federal tax law allows both individuals and corporations to take deductions from their taxable income for gifts of property to a tax-exempt nonprofit organization or to a government agency. Individuals may deduct the value of the gift up to a certain percentage of their income and spread a sizable deduction over several years. Property owners may also receive a tax break on their estate and property taxes for donating property or easements. Such tax incentives may encourage property owners to donate part or all of their property. Disadvantages of these programs include the relatively small amount of land usually acquired and the difficulties in creating large contiguous blocks of forestland, open space or natural habitat.
1. Purchase of Development Rights (PDRs) Purchase of Development Rights (PDR) programs use public money to purchase development rights associated with privately-owned land. PDR programs are generally seen by their advocates as a more permanent approach to preserving agricultural and forestland and open space than traditional zoning methods. In such a program, a landowner is paid the difference between the value of the land based on its development potential and the value of the land in its present use. Funding for PDR programs vary between jurisdictions, with many communities using bonding or tax schemes to raise money for a PDR program. A PDR program is considered most effective when it is part of a land conservation strategy that includes a variety of different tools, particularly planning and zoning tools. To be successful, lands must be ranked and objectives clearly defined so that limited funds can be used to derive the greatest benefit. PDR also offers a mechanism for localities with limited financial resources to preserve land in perpetuity without incurring the cost of purchasing the land outright. PDR has an incentive advantage over other conservation tools in that most PDR programs are voluntary, and they offer compensation to a landowner for placing restrictions on his/her land. However, if a local jurisdiction does not have sufficient funds to purchase the development rights for all the land it wants to conserve, the result, in the case of forestland, could be small fragmented parcels that have limited ecosystem services value. There is also no guarantee that the owners of the undeveloped land will be willing to sell their development rights.

HEALTHY WATERS/FOREST RETENTION STUDY FINAL REPORT: JUNE 30, 2017 81
PDR programs are allowed in both Virginia and Pennsylvania. PDR programs require the development rights on the purchased land to be retired and a conservation easement to be placed on the property to preserve its natural state. In Pennsylvania, the Pennsylvania Agricultural Conservation Easement Purchase Program (ACEPP)38 is a voluntary PDR program that enables county governments to protect active farmland by purchasing agricultural conservation easements from willing landowners. These easements limit the use of farmland to activities compatible with agriculture, while keeping the land in the landowner’s ownership and control. Currently, 57 counties participate in the Pennsylvania program. Like a conventional PDR program, under the ACEPP system, the development rights are retired, rather than being transferred to another area for development use.
2. Transfer of Development Rights (TDRs) Like PDR, TDR programs include protection mechanisms designed to compensate the landowner for the real or perceived loss of land value. Under a TDR program, development rights (or density units) are transferred from an area where land conservation is desired (by a landowner and the community) to a more developed or developing area with the ability to accommodate a higher density (usually an area with existing or planned infrastructure). Unlike PDR programs, which are often publicly-funded, an urban developer pays the rural landowner directly for the transferred development rights. The objective of the developer is to profit from the higher density allowed in the “receiving” target development area. A TDR system works best if the development rights are transferred to an existing urban development and do not contribute to urban sprawl, thus the rationale for defining targeted “receiving areas” in the process. Other advantages and disadvantages are similar to a PDR program. A TDR program may require the coordination of multiple governing bodies to set up sending and receiving zones if inter-jurisdictional trading of the development rights is involved. Furthermore, for a TDR program to be successful in conserving open space such as forestland, it is often necessary for the affected rural community to be supportive and be a willing participant in the exchange.
One promising application of TDRs for forest retention could involve the application of an overlay district over the defined high conservation forest (or forested “eco-core” areas of a green infrastructure plan) wherein the by-right development units would be made available, being located in the TDR’s designated “sending zone”. In this example, the overlay district could be considered a “sending zone” for TDR program implementation, or a target area for public or private PDR transactions and carbon sequestration credit trading. Virginia law requires that lands in “sending areas” be placed under conservation easement if their development rights are transferred to another property through a TDR program, while their development rights are retired under a PDR program.
38 Pennsylvania Land Trust Assoc., “Agricultural Conservation Easement Purchase Program: A Pennsylvania Tool for Preserving Farmland,” found at: http://conservationtoolsproduction.s3.amazonaws.com/library_item_files/1248/1462/CT_ACEPP_170203.pdf?AWSAccessKeyId=AKIAIQFJLILYGVDR4AMQ&Expires=1490826293&Signature=JijjSR70AFRaeEvPGy%2FZbj1PTWU%3D

HEALTHY WATERS/FOREST RETENTION STUDY FINAL REPORT: JUNE 30, 2017 82
VIRGINIA Although in use nationally for some time, TDRs are relatively new to Virginia. The General Assembly first adopted statewide enabling legislation (presently contained in Va. Code §§ 15.2-2316.1 and 15.2-2316.2) allowing local jurisdictions to enact zoning ordinances permitting TDRs in 2006. Because cities and counties are independent of each other in Virginia, this was amended in 2007 to allow TDRs to cross unilaterally from a county to an adjoining city, provided the city has passed a zoning ordinance amendment designating the receiving areas for the transferred development rights.39 Likewise, counties can transfer development rights from the county to areas designated by a local town as “receiving zones” for any incorporated town within the same county. Virginia law is silent on whether counties, adjoining or otherwise, can transfer development rights between counties, or that cities or towns can transfer development rights to adjoining counties or non-adjoining municipalities. It is not known if such additional flexibility would be desired by Virginia cities, counties, and towns; but under the strict Dillon Rule construct, it appears that they don’t have this authority under current Virginia law.
PENNSYLVANIA TDR is implemented in Pennsylvania through the incorporation of a TDR section into local zoning ordinances as enabled by the Pennsylvania Municipalities Planning Code. The actual transfer of development rights is limited to the boundaries of single municipality, or may occur between multiple municipalities where joint zoning, an inter-municipal agreement, or multi-municipal comprehensive plan is in place. PA allows “regional” or inter-jurisdictional P/TDRs to occur regardless of whether the purchaser of the development rights is a public or private entity40. Where a regional plan (e.g. regional green infrastructure or similar environmental management or comprehensive plan) exists (provided that has been adopted by participating municipalities) that provides a framework for such inter-governmental transfer of development rights, this flexibility could be supportive of forest retention, nutrient credit, TMDL BMP offset trading and other community and state public policy objectives. In 2000, the Pennsylvania Municipalities Planning Act was amended, making the TDR tool available to regional planning organizations who want to transfer TDRs across municipal boundaries without having to first enact a joint zoning ordinance. Under this amendment, multi-municipal TDR transfers may now occur where a county or multi-municipal comprehensive plan has been adopted41. By virtue of selling or donating the development rights severed from the land, a conservation easement on the land is created that defines what remaining uses for and on the land are allowed.
39 Source: http://www.williamsmullen.com/news/transfer-development-rights-virginia-tapping-market-land-use-entitlements 40 See Pennsylvania Municipalities Planning Act, Section 619.1(d) which states (in part): “….in the case of…. a written agreement among two or more municipalities, development rights shall be transferable within the boundaries of the municipalities…. or where there is a written agreement, the boundaries of the municipalities who are parties to the agreement.” 41 See: http://conservationtools.org/guides/12-transfer-of-development-rights#heading_6

HEALTHY WATERS/FOREST RETENTION STUDY FINAL REPORT: JUNE 30, 2017 83
3. Acquisition of land for parks and recreation areas via purchase or condemnation Local governments in Virginia and Pennsylvania can acquire land by fee simple purchase for use as public parkland and recreational area. In Virginia, such purchases are commonly funded through the sale of general obligation bonds by the locality/park developer (e.g. park authority) to raise the funds to purchase and develop the park sites and recreation areas. Virginia localities can also acquire park and recreation lands by condemnation through the exercise of their power of eminent domain, provided the property owner is provided fair market value compensation for their land. Constitutional concerns over “takings without compensation” and more restrictive opinions by federal and state supreme courts have made the use of the eminent domain power quite controversial. The timetable for condemnation may be affected if the land targeted for acquisition has been included as “reserved” on an Official Map adopted by the locality or be part of an Agricultural/Forestal District.
4. Mandatory dedication of recreational lands in new subdivisions or payment of fees in lieu Land developers may either grant (dedicate) lands from their land area under development for future parks and recreation area uses through the conditional zoning process or to comply with a locally-adopted impact fee ordinance. Alternatively, local development ordinances may allow the developer to make cash payments in lieu of dedicating sites needed by the locality for parks and recreation, public education school sites or ROW for transportation projects on or serving the developer’s property. High-conservation value forests that may exist on the developer’s land could be transferred by dedication to the local government to meet open space or park land requirements.
5. Fee Simple Land Acquisition In cases where forestland is purchased outright, the full title to the land and all rights associated with it are usually purchased at a price equivalent to its value at its “highest and best” use. The appraised fair market value of the property is the standard for all sales and donations. Purchasing land at its fair market value has two principal advantages: the acquisition process is relatively simple, and the rights and privileges of fee simple ownership are rarely challenged. Out-right ownership makes it easier to manage open space. However the value of the most vulnerable HCV forestland when priced at its “highest and best use” market value is very expensive, and as such is often beyond the capabilities of a single entity to purchase and manage over the long term. In this case, joint purchases through collaborative partnerships are an option. The following are examples of how forest land can be purchased.
a) Fee Simple Acquisition - This is the outright purchase of land. It fully compensates the landowner and is the most complete means of affecting control over how the land will be used.

HEALTHY WATERS/FOREST RETENTION STUDY FINAL REPORT: JUNE 30, 2017 84
b) Purchase and Lease-back - In this case, land is purchased outright and then leased by the owner to another individual who can gain some economic return from the land for example as a working forest. Farmland is often retained as agricultural land through lease-backs.
c) Bargain Sale - In this case, land is purchased from a willing seller for less than fair market
value. This type of sale is often used by land trusts or a government to acquire HCV land It makes the land more affordable and provides the landowner with immediate cash and can provide a charitable income tax deduction for the difference in the price received for the property and its fair market value It can also benefit the landowner by offsetting any capital gains tax owed.
d) Land Banking - Under a land banking sale, land is purchased by a governmental unit and
reserved for later use or development. The land could then be leased in the interim for immediate use such as agriculture. Essentially, land banking is a land trust operated by a government and funded by real estate transfer taxes, either at the local or state level.

HEALTHY WATERS/FOREST RETENTION STUDY FINAL REPORT: JUNE 30, 2017 85
F. Forest Retention Tools: Enhancement Opportunities
1. Conservation Easement Tax Credit Policy Through the process of placing a permanent conservation easement on their property, landowners can realize both federal and state tax credits for placing a conservation easement on their land. Conservation easements (as an instrument of forest retention) may have greater environmental (and thus greater public) benefit when located strategically. It would seem logical (and preferable) if the tax credit system could take into account the differential public benefit derived through the ecosystem service functions protected or enhanced by an area under conservation easement protection Thus, land owners that agree to conserve (with conservation easements) the forest in areas that have been identified as being of high conservation value (or would agree to retain the natural forest and forego harvesting the timber) might realize a greater tax credit incentive than those conserving forestland in non-high conservation value areas (or by retaining the right to harvest timber from their land under conservation easement) Localities too, could use such credits as incentives in proffer discussions with developers to encourage retention of high conservation value lands and/or the forested area of the site.
Another consideration on the application of federal and/or state tax credits is the effect of the 2016 Virginia Supreme Court ruling in the Wetlands America Trust v White Cloud Nine Ventures, LP. Under the Court’s ruling in this case, “…that Virginia open space and conservation easements are interpreted and construed in the same manner as common-law restrictive covenants, with any ambiguities and interpretational debates resolved with deference to the free use of land, and not toward the preservation of the status quo or conservation values” 42.
2. Consideration of Term Conservation Easements It is common for private land trusts to hold and enforce conventional conservation easements which are established in perpetuity. The permanency of such typical easements is a deterrent to the expanded use of conservation easements, whether donated by the landowner or purchased by a municipality or conservation land trust. In community outreach discussions in the Virginia Phase II project service area (i.e. the Rappahannock River basin), the concept of a “term easement” has been mentioned often as a more attractive scenario to potential easement donors and a less expensive option for land trusts interested in possible short-term easement purchase, which might be considered a form of land rights lease. To promote this option, it has been suggested that such term easements might be held by the local government or by a regional entity that could manage these term easements on behalf of the participating local governments. This feasibility of this implementation option should be explored through Pennsylvania’s participation in Phase II of the Healthy Waters/Forest retention TMDL project
42 http://thelandlawyers.com/virginia-farm-winery-stands-up/

HEALTHY WATERS/FOREST RETENTION STUDY FINAL REPORT: JUNE 30, 2017 86
For Virginia, it has been determined that the Virginia Open Space Land Act (§10.1-1700 of the Code of Virginia, as amended) already allows several public bodies43 the authority to acquire open space lands and easements (for at least a minimum of 5 years, up to and including perpetuity), provided that the open space designation conforms to the comprehensive plan adopted by the governing jurisdiction for the affected area. This law also includes two unusual provisions:
1) in the event that the provisions of this chapter are inconsistent with the provisions of any other law, the provisions of this chapter shall be controlling; and,
2) the powers conferred by this chapter shall be in addition and supplemental to the powers conferred by any other law.
Other sections of this VA Act provide:
1) that continued farming and timbering operations be allowed under fee simple interest or easements acquired under this Act,
2) that the use of eminent domain is prohibited to acquire the land or easements thereon, 3) the public body may exercise its authority through a board or commission or jointly and
cooperatively through any public bodies of the Commonwealth
Since the authority to approve and hold term easements is defined in VA state law as a power of public bodies (as defined by the Open Space Land Act), there is some question whether such term easements should or could be allowed under VA law to be held by private land trust entities or by such political subdivisions as planning district commissions and other special purpose district authorities. Exploring these issues in PA is recommended to understand what is allowed under the PA Municipality Planning Code and other relevant state law.
3. Recognition of Resource Protection Area Restrictions VIRGINIA Through the Virginia Chesapeake Bay Preservation Act (CBPA) and the regulations promulgated thereunder, local governments in the Chesapeake Bay watershed area of Virginia are required to designate and protect the natural vegetative buffers within 100 feet on either side of perennial streams and in the landward side of tidal wetlands. As described by the CPBA regulations:
“…these lands provide for the removal, reduction or assimilation of sediments, nutrients and potentially harmful or toxic substances in runoff entering the bay and its tributaries, and minimize the adverse effects of human activities on state waters and aquatic resources”
With these considerations in mind, a developer might choose to place RPA-designated sections of their property under a conservation easement. In such instances, the developer would need to
43 ”Public body” means any state agency having authority to acquire land for a public use, or any county or municipality, any park authority, any public recreational facilities authority, any soil and water conservation district, any community development authority formed pursuant to Article 6 (§ 15.2-5152 et seq.) of Chapter 51 of Title 15.2, or the Virginia Recreational Facilities Authority.

HEALTHY WATERS/FOREST RETENTION STUDY FINAL REPORT: JUNE 30, 2017 87
work with a recognized 3rd-party land trust to accept and hold the easement, as well as to exercise the monitoring responsibility.
Agricultural landowners are allowed to encroach on the state-designated RPA riparian buffer area provided they comply with the land and farm management options set-out under the riparian buffer exemption for agricultural operators.
PENNSYLVANIA In Pennsylvania, the analogous program at the state level is contained in Chapter 102 “Erosion and Sediment Control” of the Pennsylvania Code, § 10214 which limits State oversight to activities near Special Protection Waters—those waters classified by the state as either Exceptional Value (EV) or High Quality (HQ) streams. Further authorization for riparian buffer protection44 is authorized to municipalities through the Pennsylvania Municipalities Act which allows for local protections to be put in place through the zoning and/or subdivision and land development ordinances provided for under the Municipalities Planning Code Act.
4. Multi-Year Application of Land Use Valuation Taxation45 VIRGINIA In Virginia, a landowner with 20 or more acres of land in agricultural, forest, horticultural or open space use must apply annually for participation in the locally-adopted land use valuation program to receive a reduced assessment and pay reduced property taxes on their land to encourage retention of the covered land use. While the State program calculates annual recommended use valuations for each locality for each use, the local Commissioner of Revenue is not obligated to apply this valuation (unless directed to do so in a local land use valuation ordinance). In Virginia, landowners with a minimum of 200 acres can apply for designation by the County as either an agricultural, forestall or agricultural-forestal district which, if approved by the County Board of Supervisors, takes effect for up to eight years as long as the landowner keeps the land in agricultural or forestall use. Both states have roll-back tax provisions should the agricultural or forestal use change, making the back taxes avoided from the application of a fair market valuation-based assessment, due to the locality
For Virginia, it would appear that consideration of PA’s approach of recognizing the original land use valuation enrollment application until there is a change in land use could save significant annual burden on landowners and County Commissioners of Revenue to process annual applications. Moreover, the expected multi-year continuation of the acreage under use valuation program (and possibly the 10-year agricultural and forestal district program) could then be considered a form of “term easement” in the context of discussions about recognizing “term easements” in the Chesapeake Bay TMDL model that tries to predict future changes to land cover and the associated pollution impacts on Chesapeake Bay tributaries and the Bay itself.
44 See: http://www.dep.state.pa.us/dep/deputate/watermgt/wc/Subjects/StreamReleaf/Docs/1506bufferpreserve.pdf and http://conservationtools.org/guides/119-riparian-buffer-protection-via-local-government-regulation 45 https://pubs.ext.vt.edu/448/448-037/448-037.html

HEALTHY WATERS/FOREST RETENTION STUDY FINAL REPORT: JUNE 30, 2017 88
PENNSYLVANIA Pennsylvania’s “Clean and Green” program46 was enacted by the General Assembly in 1974 as a tool to encourage protection of the Commonwealth's valuable farmland, forestland and open spaces. Once enrolled, a PA landowner does not need to reapply. Landowners must, however, notify their county tax assessment office if the status of their enrolled land changes. It is noted that in PA, the State-determined land use valuations cannot be exceeded by municipal tax authorities who may adopt lower assessment rates than those recommended by the State.
5. Expanding Local Tree Protection Authority Due to the differences between these two Commonwealths (i.e. with VA viewed as a “Dillon Rule” state and PA viewed as a “Modified Dillon Rule” state with some designated “Home Rule” municipalities), it is useful to compare and contrast the approaches available to encourage the protection and retention of forests and tree canopy.
VIRGINIA In Virginia, the VA Department of Forestry (VDOF) oversees forest management and urban tree canopy programs47 In 2004, the VDOF performed a study entitled: “Virginia Board of Forestry Study on the Provision of Incentives to Private Landowners to Hold and Preserve Their Forestland (SJR 75)“48 This study resulted 3 core findings, namely:
• Core Findings #1 - “Working Landscapes” Input received at the public meetings and focus group as well as the ongoing work of the Board of Forestry and Department leads to the conclusion that forestland preservation and forestland economic viability are inextricably linked If private, non-industrial forest landowners are not able to market both the hard products such as timber and softer products such as hunting leases or horseback riding, then there are no incentives to counter the pressure to convert to non-forest use Hence, landowners must be able to manage their land to achieve these goals ……”
• Core Findings #2 - “Landowner Incentives” Also widely discussed during the Board’s work has been the realization that the proper mix of landowner incentives can deter conversion or permanently preserve forestland Up front in this discussion are conservation easements and forest management incentives For real preservation and a stable forestland base to be established, significant funding should be made available for easements and forest management activities
• Core Findings #3 - “Landowner Education” From Department of Forestry work through the last decade, forestland is converting at a faster rate than ever before It is estimated that over 400,000 private forest landowners now live in Virginia The average tract size continues to decrease Hence, forest landowner education on topics ranging from tax issues to basic forest management continues to be a very real need and key to landowners understanding what value, both resource-wise and landscape-wise their land possesses”
PENNSYLVANIA In Pennsylvania, statewide tree protection falls under the State oversight provided through Pennsylvania Code, § 102.14 which provides tree protection on lands being near (i.e. within 150
46 http://www.agriculture.pa.gov/Encourage/farmland/clean/Pages/default.aspx 47 http://dof.virginia.gov/laws/index.htm 48 http://dof.virginia.gov/print/law/SJR75-Final-Report_2004.pdf

HEALTHY WATERS/FOREST RETENTION STUDY FINAL REPORT: JUNE 30, 2017 89
feet of) Special Protection Waters—those waters classified by the state as either Exceptional Value (EV) or High Quality (HQ) streams. Otherwise, local municipalities may adopt tree protection ordinances; however, the most recent amendments to the PA Municipalities Planning Code49 specifically direct all municipalities to permit forestry activities in their zoning ordinances as a “use by right” in all zoning districts The intent of this amendment was to make it easier to carry out all forestry activities by limiting the scope of zoning and other regulations Municipalities that choose to regulate forestry activities are advised to create reasonable ordinance provisions that encourage sound forestry principles and practices. Guidance in appropriate tree protection ordinance design and adoption is available through the www.ConservationTools.org website50 maintained by the Pennsylvania Land Trust Association.
6. Tree Conservation for Ozone Non-Attainment Section §15.2-961151 of the Code of Virginia authorizes local governments in Northern Virginia (i.e. Planning District 8) to conserve trees in the land development process as an ozone non-attainment mitigation measure. This statute, with possible amendments could serve as a model for forest retention, offering several opportunities to promote tree canopy and forest retention for the improvement of the waters of the Commonwealth and the Chesapeake Bay
a) Given the importance placed on trees and natural vegetation proximate to perennial streams and tidal wetlands and waters to be protected in defined Resource Protection Areas (RPAs), it seems reasonable that the provisions of §15.2-9611 could be extended to local governments in other portions of the Commonwealth (e.g. the Chesapeake Bay watershed) Moreover, the justification for tree conservation under this statute could be broadened from a focus on air quality non-attainment to support Chesapeake Bay water quality enhancement and TMDL goal reductions
b) Furthermore, the provisions of §15.2-9611 allow local ordinances enacted under this statute to require tree planting where the tree conservation/preservation targets for a development cannot practically be met, and further allow the local ordinance to provide for developer contributions to a local tree canopy bank or fund to allow other tree planting or conservation efforts undertaken by the locality to offset the unmet on-site requirements for any development.
In light of the potential greater efficiency of a regional tree canopy bank or fund to serve multiple local governments’, enabling language added as an amendment to this section could authorize local governments to establish and operate such a regional program on its own, or allow an existing non-profit regional entity or perhaps through the local regional planning district commission to do so. This might allow for more strategic tree replanting and/or tree conservation
49http://extension.psu.edu/natural-resources/forests/finance/policy-and-ordinances/timber-harvesting-in-pennsylvania-information-for-citizens-and-local-government-officials 50 http://conservationtools.org/guides/37-tree-ordinance/ 51 Conservation of tree during land development process in localities belonging to a nonattainment area for air quality standards, found at: http://law.lis.virginia.gov/vacode/title15.2/chapter9/section15.2-961.1/

HEALTHY WATERS/FOREST RETENTION STUDY FINAL REPORT: JUNE 30, 2017 90
within a multi-jurisdictional sub-watershed area where larger regional environmental and landscape enhancement benefits could accrue from coordinated regional tree planting and conservation efforts in support of local government TMDL actions.
c) In the event that local or regional non-point nutrient trading credit programs become established, the potential for such entities to also support local needs for a local or regional tree canopy bank or fund might be recognized under the suggested Code section amendment.
d) Section §15.2-9611 might also reference or encourage that local ordinances adopted under this authority to encourage tree conservation and/or planting efforts which consider on-site soil conditions to promote conservation of tree canopy on more permeable A and B soils (as classified by USDA-NRCS). Areas with these soil types are more conducive to healthy tree and plant growth. This could be one criteria for locally- defining high conservation value forestland.
Moreover, conservation of trees in areas with these highly-infiltrative soils will help retain such soils (by stabilizing the soils through the tree root systems) and promote groundwater recharge, thereby supporting the replenishment of Virginia’s aquifers with storm water rather than adding flow to stormwater management surface retention structures and surface flow through the natural tributary system.
7. Promoting Use of Conservation Subdivision Design (CSD) Planning Conservation subdivisions (or “CSD”, sometimes mistakenly referred to as “cluster subdivisions”) are designed to concentrate the gross density of units per acre allowed on a tract of land to a smaller development area while preserving more open space This development approach reduces the infrastructure cost of serving the same number of units spread out over the land tract at a lower density per acre. CSD differs from traditional cluster developments in that it establishes higher standards for both the quantity and quality of open space. Most importantly, through a four-step design process written into the SALDO, it places conservation planning at the beginning of the development process rather than at the end52
The CSD approach (see Figure 10) causes significantly less land disturbance, reduces lot sizes, reduces the amount of impervious surface area, and preserves more open space (both forested and unforested) for the common enjoyment of residents of the development (and/or the community). One of the leading proponents of conservation subdivision design (CSD), landscape architect Randall Arendt, describes the CSD approach:
52 http://conservationtools.org/guides/9-growing-greener-conservation-by-design

HEALTHY WATERS/FOREST RETENTION STUDY FINAL REPORT: JUNE 30, 2017 91
“…This is primarily a design approach for conserving existing natural and cultural resources, although a limited amount of active recreation is permissible (such as ballfields and neighborhood greens) Subdivisions where the majority of open space is taken up by a golf course do not meet this basic criterion. Conservation subdivisions are generally "density-neutral", meaning that the overall number of dwellings built is not different from that done in conventional developments. Small density bonuses are sometimes granted in return for dedicating some or all of the conservation land for public access or use, for endowing permanent maintenance of the open space, or for providing workforce housing. Conservation subdivisions are specifically designed around each site's most significant natural and cultural resources, with their open space networks being the first element to be "green-lined" in the design process. This open space includes all of the "Primary Conservation Areas" (inherently unbuildable wetlands, floodplains, and steep slopes), plus 30-80% of the remaining unconstrained land, depending upon zoning densities and infrastructure availability”.53
VIRGINIA Project team discussions with VA land developers have revealed developers’ greater willingness to use the conservation subdivision (CSD) or planned residential (or commercial) development (PRD/PUD) processes if the locality will allow them a small density bonus (e.g. 5-10 percent) when using CSD/PRD/PUD approaches to concentrate development densities in areas of the development tract more suitable for development and reserving a greater portion of the tract as undeveloped. VA developers also note that there is no existing mechanism for them to realize any economic return
53 Arendt, Randall. “Conservation Subdivision Design: A Brief Overview”, found at: http://www.greenerprospects.com/PDFs/CSD_Overview.pdf
Figure 10. Comparison of Conventional and Conservation Subdivision Designs

HEALTHY WATERS/FOREST RETENTION STUDY FINAL REPORT: JUNE 30, 2017 92
from the undeveloped portion of their land unless the community or a 3rd party land trust is willing to purchase the development rights to establish a conservation easement on these areas. The VA project team believes that the existence of a forest retention BMP recognized by the Chesapeake Bay TMDL program could foster an offset trading marketplace that provides a greater incentive for rural communities to work with urban communities and development interests. Private capital could be generated to buy and transfer the development rights from high-value conservation areas for use in other parts of the property, the community or the watershed; providing greater economic return to rural, conservation-oriented residential and commercial land developers.
PENNSYLVANIA The PA Municipal Planning Code provides guidance to municipalities on the design, adoption and implementation of land and subdivision development ordinances (“SALDOs”) and planned residential development ordinances (“PRDs”) through Articles V and VII, respectively, of the Code. Both of these tools allow considerable flexibility to municipalities in defining land planning standards to conserve open space Planned residential development (PRD) ordinances generally apply to land that bears a “conservation zoning” designation under the local zoning ordinance, and the PRD ordinance represents a blending of zoning and subdivision standards administered through a more interactive planning process with municipal planning representatives.
A properly designed PRD can benefit both the developer and the municipality. Generally, although not necessarily, the PRD permits the developer to increase his overall density in return for devoting a percentage of total land for common open space. The common open space is usually owned and maintained by a homeowners’ association or by the developer, although the Municipal Planning Code allows the municipality (or a 3rd party land trust) to hold a conservation easement on the common area lands. The developer may benefit by having to install fewer roads and utility lines, while the municipality benefits by centralization of service areas and less maintenance. Also, the developer is permitted added design flexibility. Since density can be increased in some areas, other areas (e.g. wooded areas, a floodplain, etc.) that should not be developed can be left untouched. It is conceivable that the community (or a 3rd party land trust) may gain title to some or all of the common open space, adding further to the municipal or general public gain from utilizing the CSD/PRD process.54
8. Factoring Ecosystem Service Functions Into Conservation Easement Tax Credit Policy Through the process of placing a permanent conservation easement on their property, landowners can secure both federal and state tax credits for placing a conservation easement on their land. Conservation easements (as an instrument of forest retention) may have greater environmental (and thus greater public) benefit when located strategically. It would be logical (and preferable) if the tax credit system could take into account the differential public benefit derived through the ecosystem service functions55 protected or enhanced by an area under conservation easement protection. Thus, land owners that might agree to conserve the forested areas by conservation easement in areas that
54 http://conservationtools.org/guides/58-planning-land-use-ordinance-basics 55 Ecosystem services are grouped into four broad categories: provisioning, such as the production of food and water; regulating, such as the control of climate and disease; supporting, such as nutrient cycles and crop pollination; and cultural, such as spiritual and recreational benefits. To help inform decision-makers, many ecosystem services are being assigned economic values. Source: Wikipedia

HEALTHY WATERS/FOREST RETENTION STUDY FINAL REPORT: JUNE 30, 2017 93
have been identified as being of high conservation value would realize a greater tax credit incentive than those conserving forestland in non-high conservation value areas. Localities too, could use such credits as incentives in proffer discussions with developers to encourage retention of high conservation value lands. Similarly, the VA-LUVT or PA Clean and Green programs’ recommended use valuations only consider the value of the land to support the production of a specific use (i.e. agricultural, forestal, horticultural or open space), and not the natural capital value of the land use (i.e. the land cover), particularly the diverse ecosystem services performed by forest land and wetlands. Considering natural capital values in the LUVT and Clean and Green programs would help elevate landowner interest in conserving higher conservation value lands by conservation easement, in order to derive greater economic benefit through natural capital (nutrients and carbon) off-set credit trading programs. At the same time, these additional income streams derived from natural capital trading could supplement and replace local government revenue streams lost through the tax relief given under LUVT and easement programs.
9. Recognizing Natural Capital as Taxable Assets Increasingly, domestic national and global capital markets are recognizing and valuing “natural capital”, i.e. the ecosystems service functions (e.g. carbon sequestration, water quality enhancement through nutrient take-up and soil stabilization, ground water aquifer re-charge, etc.) performed by the natural landscape. Forested lands and wetlands have attracted significant interest in the natural capital marketplace, as consumer demand and corporate responsibility and accountability to their stockholders have pushed investments into “green” and “smart growth” technologies and various off-set credit trading investment options. The Virginia and Pennsylvania project teams view this marketplace evolution as the opportunity to help forest landowners realize better cash-flow from existing forest lands. Furthermore, the natural capital marketplace provides the business model incentive to encourage some voluntary private conversion of agricultural lands back to forest or woody wetlands. Such conversion offers the multiple benefits of: a) reducing non-point agricultural run-off, b) improving water quality through the sediment filtration and nutrient take-up services performed by forest, c) carbon sequestration by the forest, and d) potentially generating more revenue streams than the one-time revenue realized from harvesting the forest timber. So that land use valuation and conservation easements do not erode an already strained local tax base, recognizing and leveraging these natural capital markets could encourage forest retention and expansion, and generate new tax revenue streams for local governments challenged to attract more conventional real estate development to grow the community tax base.
10. Nutrient and Carbon Sequestration Credit Trading Nutrient credit trading involves the sale of excess nutrient reduction “credits” to a landowner/developer or local government that wants to use these excess nutrient reduction credits for purposes of compliance with either on-site stormwater nutrient reduction requirements (in the

HEALTHY WATERS/FOREST RETENTION STUDY FINAL REPORT: JUNE 30, 2017 94
case of a private developer) or municipal stormwater watershed implementation plans or MS4 permit target load reduction requirements. This trading activity oftentimes offers cost-savings to the urban developer or locality as the purchaser over the alternative cost of conventional stormwater BMP project implementation, while offering revenue benefits to the generator of the excess credits. The credit trading alternative may also offer time-savings and the avoided cost of design and permitting of conventional BMP practices. Nutrient credit trading is authorized in Virginia and Pennsylvania between point sources, as well as between point and agricultural non-point sources.
In theory and in natural function, forested land has great value for the ecosystem service benefits performed by the natural forest. However, under current nutrient credit trading regulations in both Virginia and Pennsylvania, existing forest is not eligible to generate any nutrient credits for trading purposes; only new forest land created from converted agricultural or other land covers is eligible for possible nutrient credit trading. Also, placing a tract of forest land under a conservation easement to protect it from being sold and subdivided for development still does not make it eligible for nutrient credit trading.
Carbon sequestration credits are a relatively new “commodity” recognized as a means of helping offset the cost of compliance for carbon source emissions (e.g. coal-burning electric power plants, rail and air traffic emissions, etc.). The sequestration credit is valued based on the calculated amount of additional carbon that will be captured and sequestered in growing forests over a period of time from a baseline period.
Existing forest (as well as new forest), with proper management planning, timber analysis, and appropriate conservation actions; may be eligible to generate carbon sequestration credits which can be sold to an aggregator for trading on the Chicago Carbon Exchange (CCX). See further discussion under heading: “Recognize Natural Capital as a Resource and Taxable Asset”.
Select forms of nutrient credit trading have been authorized under both Virginia and Pennsylvania state law. Forest land owners in either Commonwealth willing to go through the process required by the California cap-and-trade offset protocols for the California Carbon Allowance program for carbon credit trading may be able to do so. However, entrants to this market do so at their own risk, as these markets like other commodity markets, are highly volatile. For State agencies or localities in Virginia, enabling authority would be needed from the General Assembly to engage in this innovative and emerging marketplace which could have a profound impact for stimulating new forest planting and forest retention.

HEALTHY WATERS/FOREST RETENTION STUDY FINAL REPORT: JUNE 30, 2017 95
PHASE II KEY FINDINGS AND CHALLENGES A. VIRGINIA AND PENNSYLVANIA: SHARED FINDINGS
1. Forest Conservation TMDL Credit Through the process of placing a permanent conservation easement on their property, landowners can secure both federal and state tax credits for placing a conservation easement on their land. Conservation easements (as an instrument of forest retention) may have greater environmental (and thus greater public) benefit when located strategically. It would be logical (and preferable) if the tax credit system could take into account the differential public benefit derived through the ecosystem service functions protected or enhanced by an area under conservation easement protection. Thus, landowners that might agree to conserve forested areas by conservation easement in areas that have been identified as being of high conservation value would realize a greater tax credit incentive than those conserving forestland in non-high conservation value areas. Localities, too, could use such credits as incentives in discussions with developers to encourage retention of high conservation value forest lands.
Similarly, the LUVT-recommended use valuations only consider the value of the land to support the production of a specific use (i.e. agricultural, forestal, horticultural or open space), and not the natural capital value of the land use, particularly the diverse ecosystem services performed by forestland and wetlands. Considering natural capital values in the LUVT program would help elevate landowner interest in conserving these higher conservation value lands by conservation easement, while deriving greater economic benefit through natural capital credit trading programs. At the same time, these additional income streams derived from natural capital trading could supplement and replace local government revenue streams lost through the tax relief given under the LUVT and easement programs.
The project sponsors’ original hypothesis was that modifying the Chesapeake Bay TMDL model to recognize the conservation benefit of existing forest land as demonstrated in Phase I offer potentially significant infrastructure development cost-savings. MS4 communities agreed with this hypothesis. However, among the non-MS4 communities, without the same regulatory pressures, the TMDL was not a primary driver. Through further discussions with stakeholders, it became apparent that, if monetized, trading credits between MS4 and non-MS4 communities to meet TMDL and/or SWM targets could be a potentially strong driver for conserving forest lands, improving water quality and meeting economic growth objectives, particularly if credit trading were feasible both upstream and downstream of the MS4 communities.
2. Stormwater Management Planning, Regulation & Chesapeake Bay Programs The conversion of agricultural land, forests and open space to residential or commercial land use can result in an increase in stormwater as impervious surfaces associated with land conversions will alter hydrologic patterns and, depending upon the location and intensity of the development, may potentially overwhelm nearby forest buffers and streams. In some instances, the hydrologic modifications will require the use of “grey” infrastructure to manage the stormwater. In other

HEALTHY WATERS/FOREST RETENTION STUDY FINAL REPORT: JUNE 30, 2017 96
instances, ponds, levees, swales, and filters might be used to remove pollutants, contain flood water, and essentially perform the functions that forest cover had performed prior to land conversion. Either approach will be costly in terms of community stormwater services. With forest cover, less of a site needs to be included in a storm water management plan.
VIRGINIA There is an assortment of federal and state environmental regulatory programs which urban and rural localities in Virginia have to manage in dealing with both proposed new and existing development modifications.
1. Virginia’s Chesapeake Bay Program, developed pursuant to the Virginia Chesapeake Bay Preservation Act, only addresses Resource Protection Area (RPA) Buffers with regards to buffer width, buffer establishment and re-vegetation and of course with modifications of existing land cover, i.e., allowing tree clearing for site vista and view, limiting encroachments, and allowing and encouraging the removal of dead dying or diseased trees within the RPA, particularly in proximity to the stream edge or on a steep bank adjoining a stream.
2. The Chesapeake Bay Act regulations set-out 10 general performance standards which all local development ordinances, programs and enforcement actions shall require that any use, development or redevelopment of land in Chesapeake Bay Preservation Areas meets the following performance criteria (which are abbreviated in the following list):
a) No more land shall be disturbed than is necessary to provide for the proposed use or development.
b) Indigenous vegetation shall be preserved to the maximum extent practicable, consistent with the use or development proposed.
c) All development exceeding 2,500 square feet of land disturbance shall be accomplished through a plan of development review process
d) Land development shall minimize impervious cover consistent with the proposed use or development.
e) Any land disturbing activity that exceeds an area of 2,500 square feet (including construction of all single family houses, septic tanks and drainfields ….shall comply with the requirements of the local erosion and sediment control ordinance.
f) Any Chesapeake Bay Preservation Act land-disturbing activity …..shall comply with the requirements of 9VAC25-870-51 and 9VAC25-870-103.
g) Onsite sewage treatment systems not requiring a Virginia Pollutant Discharge Elimination System (VPDES) permit shall e managed in accordance with the procedures detailed in these regulations.

HEALTHY WATERS/FOREST RETENTION STUDY FINAL REPORT: JUNE 30, 2017 97
h) Land upon which agricultural activities are being conducted, including but not limited to crop production, pasture, and dairy and feedlot operations, or lands otherwise defined as agricultural land by the local government, shall have a soil and water quality conservation assessment conducted consistent with the Act and this chapter.
i) Silvicultural activities in Chesapeake Bay Preservation Areas are exempt from this chapter provided that silvicultural operations adhere to water quality protection procedures prescribed by the Virginia Department of Forestry in the Fifth Edition (March 2011) of "Virginia's Forestry Best Management Practices for Water Quality Technical Manual." The Virginia Department of Forestry will oversee and document installation of best management practices and will monitor in-stream impacts of forestry operations in Chesapeake Bay Preservation Areas.
j) Local governments shall require evidence of all wetlands permits required by law prior to authorizing grading or other onsite activities to begin.
It is noteworthy that there is no reference in the general performance standards of the Bay Act regulations that speak to the desirability of forest retention. However, the Virginia Stormwater Management Program (VSMP) regulations due offer developers some credit for forest retention in applying the runoff reduction method to calculating pollutant loads and credits from various BMPs.
3. No other mandated programs reviewed for this study require forest retention, i.e.:
• VSMP (Virginia Stormwater Management Program, VDEQ) • E&S (Erosion and Sediment Control , VDCR) • NFIP (National Flood Insurance Program, FEMA) • VPDES (Virginia Pollutant Discharge Elimination System Permit, VDEQ), and • Virginia Water Protection (VWP) Permit Program (for Wetlands, VDEQ).
4. The Virginia BMP clearinghouse guidance on the use of conserved open space to handle sheet flow of stormwater recommend the use of vegetated filter strips as a BMP. The manual states: “Once established, Vegetated Filter Strips have minimal maintenance needs outside of the spring clean-up, regular mowing, repair of check dams and other measures to maintain the hydraulic efficiency of the strip and a dense, healthy grass cover. Vegetated Filter Strips that consist of grass/turf cover should be mowed at least twice a year to prevent woody growth”. (emphasis added)
5. Under the Virginia Stormwater Management Permit (VSMP) program, a developer can utilize existing forest area (conserved open space) on the parcel as part of their Run-Off Reduction Calculation (RRM), this area cannot be disturbed before or after construction, thus receiving credit towards RRM/SWM. Moreover, the VSMP program articulates the goal of establishing Conserved Open Space to protect a vegetated area contiguous to a receiving system, such as a stream or natural channel, for treating stormwater runoff. Establishing isolated Conserved Open Space

HEALTHY WATERS/FOREST RETENTION STUDY FINAL REPORT: JUNE 30, 2017 98
pockets on a development site may not achieve this goal unless they effectively serve to connect the surface runoff to the receiving system. As a consequence, a locality may choose to establish goals for minimum acreage to be conserved (in terms of total acreage or percentage of the total project site), and the physical location (adjacent to a stream, or other criteria) in order for the cumulative conserved open space to qualify for the RRM credit. The Conserved Open Space must be protected by a perpetual easement or deed restriction.
6. Under the federal Municipal Separate Storm Sewer System (MS4) program/regulations, pertaining to Chesapeake Bay TMDL Action Plan Guidance (Guidance Memo 14-2012). a) There is a credit given for land use change from impervious to forest. b) Credit for Forest Buffers is applied to upland areas that drain to a (forested) buffer,
and the efficiency is applied at up to 2-to-1 ratio for upland acres that drain to the buffer as sheet flow. Both a) and b) have efficiency formulas and calculations to determine the amount of credit generated for TN, TP and TSS.
The net effect of these assorted regulations is a general treatment of forests and woodlots as part of the landscape suitable for development without any special value warranting more incentives to retain the forest asset. There is ample evidence in planning and public works literature of the value of forest retention as a stormwater management practice. Fairfax County (Palone and Todd, 1997) reduced their stormwater costs by $57 million dollars by choosing to mandate that forested areas and buffers be retained during development. A second study56 of merit found that one acre of forest can filter 1,880 gallons of water per day and, in so doing, can help mitigate the cost of having to construct stormwater management infrastructure that otherwise would have been required. A third study found that a mixed forest allows water infiltration at a rate of 12.42 inches/day vs. a lawn that infiltrates 4.41 inches/day (Kays, 1980). The value implicit with incorporating forest land as a component of a locality’s stormwater management strategy should not be discounted.
PENNSYLVANIA Pennsylvania allows stormwater credit for open space and conserved forest areas on a site. An example for a 10 acre site is given in the storm water management manual57 for the Keystone state. In that example, three of the ten acres are forested. If the forest is conserved, storm water management is calculated only for the remaining seven acres.
3. Static vs. Dynamic TMDL Model Throughout the conduct of the Phase II study and local discussions in both Pennsylvania and Virginia, many localities were not very familiar with the discussions underway within and among
56 Source: Environmental cats, 2003. 57 Source: Commonwealth of Pennsylvania, Draft Technical Guidance Document 363-0300-002 2006 Pennsylvania Appendix D.

HEALTHY WATERS/FOREST RETENTION STUDY FINAL REPORT: JUNE 30, 2017 99
the Chesapeake Bay Program partners concerning changing the TMDL model from a static model that uses 2010 as a baseline, to a dynamic model that would use 2025 projections as the baseline. However, among those that were familiar with the debate, there appears to be more support for using the dynamic model approach. The rationale is that such a model would provide more flexibility to local officials to make more tailored economic decisions. The assumption from a local planning standpoint is that setting the baseline against a projected future point would allow a jurisdiction to model different development options.
Moreover, with the benefit of the one-meter high resolution land cover and LIDAR data that are now available to support the TMDL model version 6.0, localities can make planning and zoning decisions that help them meet economic objectives, while simultaneously maximizing their load reduction actions. The high resolution data (along with LIDAR elevation and hydrology data) provide them better means to identify the most valuable land to conserve and minimize adverse impacts on the Bay and its tributaries. A final decision by the Chesapeake Bay Program Partnership on whether to make the change from a static model to a dynamic model has not yet been made as of this writing.
B. Virginia-specific Findings and Challenges 1. Tracking Forest Acreage under LUVT or Conservation Easement Programs
When asked about a locality’s ability to track forest acreage under LUVT, AFD or conservation easement programs to facilitate qualifying for such a TMDL credit if it were available, a Commissioner of Revenue (COR)58 in the Basin indicated that:
• “Computer-Aided Mass Appraisal (CAMA) systems typically track forest land by various categories (access via paved road, gravel road, off-road, cutover, non-productive (e.g. swamp or marsh)). Additionally, all owners in a land use program (i.e. LUVT) may be required to file an initial application declaring forest land by productive/non-productive use, and then the locality will require a revalidation of parcels in land use every time they perform a general reassessment of real estate (usually every four years). Local CORs are able to spot-check parcels using satellite and GIS-aided imagery, along with on-site visits. Some localities look forward to future access to a remote detection system for parcel land cover change that will periodically evaluate land-cover differences.
• For tracking forested lands under conservation easement, generally the previous methods are used. However, since owners with land under easement are not required to apply/revalidate (as required under LUVT), the local COR may send a letter after every general reassessment. The letter describes how the value of each parcel in the easement has been adjusted based on the current land use values, and the COR will request the owner to report any updates on the usage of the land. Unfortunately, local CORs don't have as much control as they do with under the land use program.”
58 Abstracted from e-mail message, dated 6/13/17, from Thomas Blackwell, Commissioner of Revenue, Essex County to Eldon James, Coordinator, RRBC.

HEALTHY WATERS/FOREST RETENTION STUDY FINAL REPORT: JUNE 30, 2017 100
The VA project team notes that there is no State-level, central reporting of the local acreage under each of the four categories of LUVT or the three categories of AFDs or local AFDs throughout the Commonwealth of Virginia. Moreover, State records of recorded conservation easements with VDCR omit many smaller easements which go unreported. This lack of central information on the acreage, forest character and spatial extent of these various forms of land conservation action, ranging from annual to permanent, makes it difficult to evaluate the potential impact of possible State policy changes to promote forest retention and provide better information to the Chesapeake Bay program, should the Model 6.0 be able to accommodate this information, about the location, size and character of protected lands in Virginia.
2. Intra-Basin Credit Trading Lower basin officials are not directly impacted by the TMDL because they are not MS4 jurisdictions and are not projected to experience significant economic growth between now and 2025. However, they are in need of revenue to meet basic local budget requirements and are therefore interested in some type of intra-basin credit trading scheme with other localities in the Rappahannock River Basin or beyond as may be appropriate. Their rationale is based on the premise that because the TMDL is a Chesapeake Bay TMDL and they are the last land mass before the Chesapeake Bay, as rural green localities, their remaining undeveloped land is of value to upstream urban areas who would otherwise face additional BMP requirements to offset development impacts. The HWF/TMDL project team was specifically requested by one county representative to note the need to determine how to monetize for the county and its residents the environmental value of the water quality and air quality that it provides to others. The point was that monetizing of the lower basin’s green assets must financially benefit both landowners and local governments because landowners would be giving up traditional development potential and localities would be giving up taxable assets. Middle basin officials, particularly in urban MS4 jurisdictions are impacted by TMDL and stormwater management requirements and are interested in an intra-basin credit trading scheme if it could save them dollars over expected needed SWM investment. The Fredericksburg City Manager noted that the capital cost associated with meeting the WIP III’s next level of SWM reductions required under the TMDL and the City’s MS4 permit is projected to be an amount that is equivalent to half of the City’s current annual operating budget. That is an unsustainable level of spending for the City. Upper basin officials take the position that their land use planning and development actions result in clean water being provided downstream to urban areas and they should be compensated for it in some manner for the same reasons as cited in the lower basin – they also need funding to meet basic public service requirements but taking actions that limit the development potential of properties limits future growth of taxable assets.
To address all these positions, a challenge to intra-basin credit trading is that it would have to be structured so down-stream, rural communities would be able to trade with urbanized up-stream

HEALTHY WATERS/FOREST RETENTION STUDY FINAL REPORT: JUNE 30, 2017 101
communities. This is different than how most credit trading schemes are structured. The focus is on up-stream. Secondly, there is a need for an infusion of capital from somewhere to augment what is currently available from the one urban area in the basin. Third, measures must be put in place to assure that trading does not result in reduced water quality in urban streams. Lastly, one rural water quality manager also raised the point that rural, non-MS4 areas experiencing rapid growth and with the potential of becoming MS4 jurisdictions in the future must be careful they do not trade away all of the future capability to meet SWM requirements if they do become MS4s. Matching Rural and Urban Needs: Blue/Green Economy Concept59 The Virginia Project team learned through discovery conversations with rural local officials in the lower and upper Rappahannock River Basins that stormwater management costs serve much the same functional driver for forestland retention as would a possible TMDL credit for retaining forestland - that is, it mattered if they were MS-4 jurisdictions, but did not if they were not. However, if a financial benefit through a credit trading mechanism were available that helped MS-4 jurisdictions offset some of their costs to meet SWM requirements while at the same time creating a revenue stream for non-MS-4 jurisdictions to retain their blue and green economies while meeting their basic services budgetary requirements, there was interest from both MS-4 and non-MS-4 jurisdictions.
With regard to stormwater management, the Blue/Green economy concept is rather straightforward. Rural jurisdictions upstream and downstream of urban jurisdictions are all upstream of the Chesapeake Bay. The term coined in 2017 in Virginia to focus public attention on restoring the health of the watershed, “Back to the Bay”, reflects this fact. Furthermore, many of the rural jurisdictions, especially in the lower basin, are not expected to experience significant population growth between now and 2025, nor do they want it. They do however, want to build their economies on the blue and green assets they currently have. As noted previously, rural communities downstream of urban areas maintain that because of their development plans, they are not adding significantly to pollution of water that is
59 The Virginia Project team learned of an innovative and novel strategy being developed by the Middle Peninsula Planning District Commission which looks to leverage the blue and green infrastructure, common across much of the Basin, for both economic gain and water quality protection.
Figure 11. Matching Rural and Urban Needs: Blue/Green Economy Concept

HEALTHY WATERS/FOREST RETENTION STUDY FINAL REPORT: JUNE 30, 2017 102
coming to them after being treated in urban areas. As a result the water quality in the Chesapeake Bay is better. If they adopted more robust development strategies, the adverse impact on the Bay would be greater and all jurisdictions would have higher targets to meet.
Localities upstream of urban MS4 jurisdictions make a similar argument, e.g. because they too are following blue/green economic strategies, the water they are sending downstream to urban areas is much cleaner than it would be if they pursued more aggressive development strategies. In both cases, the upstream and downstream localities believe they should be compensated for the blue-green economic strategies they are pursuing. For the urban jurisdictions in the middle, their position is if it’s less expensive to buy credits than it is to install SWM BMPs and they meet or exceed water quality requirements, it’s worth pursuing.
One suggestion has been that a state-defined Overlay District could be established encompassing the entire Rappahannock River Basin (or watershed). Within such a District, a common set of performance standards could be provided throughout the Basin under such a template ordinance to achieve greater uniformity in local development controls. For localities to adopt the model ordinance, the incentive could be the freedom to trade nutrient credits with projects within the same locality but a different river basin, or with other localities in the effected same basin overlay area that had also adopted the overlay ordinance. A second option could be to establish the entire Virginia portion of the Chesapeake Bay watershed as an Overlay District and allow nutrient credit trading to occur among all localities within the Bay watershed.
Discussions with the stakeholders across the basin revealed common interests: a willingness of local governments, rural and urban/suburban, MS4 and non-MS4; to work together for their mutual benefit in efforts to address water quality goals of the Chesapeake Bay TMDL if the outcome is a “win-win”. In this context, the “win” that MS4 jurisdictions seek is lower cost per pound to meet water quality permit requirements, while the “win” that non-MS4 jurisdictions seek is turning green assets (such as forests and wetlands) into an economic driver that benefits rural landowners and the local tax base. As this opportunity emerged a caution also emerged – that the economic trading transaction envisioned must truly reflect water quality improvement at the local, basin and Bay scales (another “win”). The project team’s finding is that an opportunity exists for all parties to continue exploring strategies, possibly through the on-going WIP III planning process, to enable transactions with “win-win-win” outcomes.
3. Role and Importance of Community Planning and the Comprehensive Plan in Virginia The practice of land use planning in Virginia can be traced to an English outpost that took root along the James River nearly 400 years ago. The palisade the hardy band of explorers and settlers carved out along the James River in the spring of 1607 was, in many respects, a planned community. Planning concerns and issues influencing the design of “James Fort” included security matters, access and internal movement considerations, the use and preservation of indigenous natural resources, the procurement and storage of drinking water, the disposal of waste, as well as discernment regarding the location of living quarters within the settlement in relation to selected enterprises such as the making of iron works. On this latter point, standards governing

HEALTHY WATERS/FOREST RETENTION STUDY FINAL REPORT: JUNE 30, 2017 103
the minimum distance selected practices and activities should be from one another were established and strictly enforced. In short, the settlement that became Jamestown was designed, constructed and managed with full consideration given to the well-being and general welfare needs of its initial inhabitants as well as subsequent inhabitants.
Fast-forward 400 years and addressing the public health, safety and welfare needs of nearly 8.5 million Virginians is a fundamental reason the Commonwealth has mandated that the network of 324 local governments across the state must plan for the future. In doing so, the state has acknowledged that change is a fundamental reality every county, city and town, just like every business and every family, must anticipate and deal with proactively. As such, the Code of Virginia mandates that every locality in the Commonwealth must prepare and adopt a comprehensive plan to manage the present while anticipating the future. The comprehensive plan, as discussed and outlined in the Code of Virginia (15.2-2200 and 15.2-2223), is a tangible representation of what a community wants to be in the future. It functions as a policy guide for anticipating, forecasting and managing change within a locality.
In this regard, the comprehensive plan is the foundation for all decision making in matters involving land use planning and community change management. This admonition applies equally to localities that are growing as well as localities experiencing decline. The comprehensive plan captures in pictures, as well as words, how a community plans to address the issues of the present while anticipating and planning for the challenges and opportunities that will accompany the future. To this end, the comprehensive plan has gained stature as a policy guide for local decision-making in matters involving the management of land, land use issues, and local zoning actions. Indeed, the Virginia Supreme Court has ruled a local governing body can choose to implement the goals, objectives and policies featured in a comprehensive plan in order to advance the generalized public health, safety and welfare of the community being served by the plan. On this point, it should be noted that no locality participating in this study found disfavor with this characterization of the comprehensive plan’s role, importance and value as a document of consequence.
It is important to note, however, that expressing support for the comprehensive plan does not mean a locality will rely on the comp plan when making land use decisions. This reality is witnessed across the state as well as within the Rappahannock River Basin as the Code does not require a locality to implement the comprehensive plan once it is adopted. As such, mechanisms are needed to ensure that the goals, objectives and policies featured in a comprehensive plan actively influence land use planning decisions on an ongoing basis.
4. Land Use & Zoning Considerations By design, the comprehensive plan serves as a guide for determining the range of land uses in a community. If the plan is to have an impact in the community, it must be implemented as the plan does not, by itself, regulate land use in a community. Zoning is considered the quintessential tool of comprehensive plan implementation in Virginia and Pennsylvania, as well as across the nation. The Code of Virginia, for example, permits any locality to classify the territory under its

HEALTHY WATERS/FOREST RETENTION STUDY FINAL REPORT: JUNE 30, 2017 104
jurisdiction or any substantial part thereof, into such districts of such number, size and shape as deemed important to the community and the purposes of zoning as defined in the Code. All localities within the Rappahannock River Basin have adopted a zoning ordinance. Some localities in the Basin have relied upon zoning for half a century or more, while others are comparatively new to zoning as a result of being under the purview of the Virginia Chesapeake Bay Preservation Act wherein the Virginia General Assembly mandated all localities impacted by the act must adopt a local zoning ordinance.
Linking zoning with the comprehensive plan is essential if a locality intends to implement its local comprehensive plan. Many localities in the Rappahannock River Basin expressed support for this construct but not all have enjoyed success in making the planning/zoning connection work. Accordingly, strong consideration should be given to sponsoring an educational initiative that examines how the zoning tools featured in the Code of Virginia can be put into play to foster forest retention and healthy waters throughout the Rappahannock River Basin and beyond.
5. Use of Virginia’s Cluster Development Statute Under cluster subdivision/zoning provisions, when a residential subdivision is created, it is designed so that the dwelling units are clustered together on smaller than average lots on only a portion of the tract, leaving the remainder available for open space or similar uses. Clustering may be used in either urban or rural areas. However, the term “cluster zoning” is usually associated with rural land use issues. Depending on the provisions of the specific cluster ordinance, the remaining open space within a cluster development may be held in common and/or be strictly an agricultural or environmental area with no “development rights” remaining on it; or, the open space parcel(s) may be allowed to have a dwelling unit with a permanent easement that prohibits further subdivision or additional dwellings. In urban areas, cluster provisions are typically used for preserving sensitive environmental features and/or for encouraging a compact development pattern that makes efficient use of infrastructure. In rural areas, cluster provisions are typically aimed at agricultural and forest conservation.60
There are a variety of examples across the Rappahannock River Basin (e.g. Fauquier, Orange, Spotsylvania, and Caroline counties) and elsewhere in the Commonwealth where localities have used this authority in different ways to accomplish different local goals. The tool has been used successfully to incentivize voluntary conservation of thousands of acres of agricultural and forest lands.
6. Conflict between Land Use Value Taxation (LUVT) programs and need for tax revenue to meet other needs
Land Use Value Taxation is a tool that has been used by rural localities with significant amounts of undeveloped land to encourage conservation efforts mostly in agriculture, and working forests
60 Source: APA Virginia Chapter, “Managing Growth and Development in Virginia,” October 2016.

HEALTHY WATERS/FOREST RETENTION STUDY FINAL REPORT: JUNE 30, 2017 105
as a means of generating jobs in local economies. Under such programs, a landowner who retains land in a use that is covered by the locality’s LUVT is taxed based on the land’s value in use (use value) as opposed to the land’s market value.
Although such preferential tax assessment programs as LUVT serve as an important incentive for landowners to retain forest or other uses covered by the program, they frustrate other residents who resent the shift of tax burden to those who are not large landowners. HWF/TMDL project team members were advised that as more forest and agricultural lands are converted to alternative suburban-type uses, citizens’ pressure on local elected officials is growing to modify or do away with LUVT programs because they are increasingly perceived as an “unfair” tax break to large landowners and corporations. This perception is to some extent a holdover from the time most forest properties were held by corporations but that is no longer the case in Virginia. This reality however creates uncertainty for the individual forest landowner and makes long-term business decisions troublesome.
In Virginia, for localities that have adopted a land use value taxation ordinance, property owners must initially submit an application for taxation on the basis of a use assessment. In addition, some localities require property owners to annually re-certify the continued eligibility for the special tax treatment afforded under the land use valuation program. In one high-growth locality, this annual revalidation represents an annual processing of 1,100 applications which places an administrative burden on the local COR office staff as well as the many participating landowners, some of whom have increasing difficulty properly preparing the application which places even more administrative burden on the COR staff in trying to assist the applicants.
There is also a conflict between LUVT programs that promote land conservation and the calculation of
“…. One of the more critical issues is to keep real estate tax es low enough to allow ownership offorest land…Localities are scrapping for every tax dollar they can get so land use assessment is always on the table for removal….Remove land use assessment and land owners are faced with a $25-$74/acre tax bill every year…forest land only returns about $50/acre gross income per year. Those two figures just don’t work, so you end up with forest land being fragmented and sold for development. That’s bad for the bay, bad for wildlife, bad for the forest products industry but very good for developers as land comes on the market at “relatively” affordable prices.…Bay mitigation costs increase with the loss of forest land… so do all the other local government costs for…services. However, the short term gain of tax dollars by removing land use assessment are sometimes too enticing and local officials face continuing pressure to remove land use assessment.
What if part of the EPA and/or state grants and funding were direct payment to localities for the deferred revenue for land use assessment on forest lands? That would be simple to administer as the number of participants are finite, the dollars are already calculated and the education and outreach would be minimal compared to touching individual landowners. It would be quick and simple to set up compared to a cap and trade system and the local governments already have all of the necessary powers to enforce land use assessment under existing law.”
William C. Latane Forest Landowner

HEALTHY WATERS/FOREST RETENTION STUDY FINAL REPORT: JUNE 30, 2017 106
Virginia’s Composite Index that determines state funding contributions to localities in support of K-12 education which discourages adoption of LUVT programs. The Composite Index formula uses multiple factors to determine a locality’s financial ability to support K-12 education. One factor in the Index formula is the taxable value of all real estate. The Composite Index formula however does not recognize the reduced taxable value of land enrolled in the LUVT program. The net effect is that a locality gives up tax revenue as an incentive for land owners to keep land in forest or agriculture or open space but that loss of revenue is not acknowledged by the Commonwealth when determining state support for local schools. One recommendation from many counties across the basin has been to modify the Composite Index formula to more appropriately recognize the actual “ability to pay” of a locality rather than ignoring the reduced taxable value of lands in LUVT. It was felt this would provide state policy consistency and would lessen the concern of some taxpayers towards LUVT. In discussing this issue with legislators and others familiar with the history of this state policy and budget issue concern was voiced that merely changing the Composite Index formula creates winners and losers. Past legislative efforts to make such a change to the formula have been unsuccessful because of the impact on the losers (those localities not utilizing LUVT). It was noted that to be successful additional K-12 funding would need to be included in the state budget to hold the losers “harmless.”
One person commented that additional K-12 funding for this purpose would represent an increase in education funding for Chesapeake Bay cleanup and as such, it could be a multi-benefit investment. It could strengthen the LUVT program locally by offsetting some of the negative budget impact of the program.
Another suggestion designed to ease the administrative burden associated with filing for LUVT status was that Virginia localities be allowed to offer a multi-year application (e.g. for forest lands) for the LUVT program. This was well-received by one surveyed Commissioner of Revenue (COR) and would presumably be well-received by land-owners relieved of the annual application burden. On the other hand, other CORs do not require an annual re-application, but only an annual validation or re-certification of the continued land use activity (i.e. forest, agriculture, open space or horticulture).
As currently implemented in Virginia, localities either: a) accept annual applications from landowners wanting the benefit of the reduced land use valuation or b) annually re-certify the continued eligibility for the special tax treatment afforded under the land use valuation program. In one high-growth locality, this annual re-application requires processing 1,100 applications each year which places an administrative burden on the local Commissioner of Revenue office staff. In addition, many participating landowners, some of whom have difficulty properly preparing the application and as such require assistance, placing even more administrative burden on the COR staff in trying to assist landowners.

HEALTHY WATERS/FOREST RETENTION STUDY FINAL REPORT: JUNE 30, 2017 107
Past legislative efforts to make such a change to the formula have been unsuccessful because of the impact on the losers (those localities not utilizing LUVT). It was noted that to be successful, additional K-12 funding would need to be included in the state budget to hold the losers “harmless.” One person commented that additional K-12 funding for this purpose would represent an increase in education funding for Chesapeake Bay cleanup and as such, it could be a multi-benefit investment. It could strengthen the LUVT program locally by offsetting some of the negative budget impact of the program.
7. Limitations of Tree Protection Authorization VA Code Section 15.2-961.1 authorizes local governments in Northern Virginia (i.e. Planning District 8) to conserve trees in the land development process as an ozone non-attainment mitigation measure. This statute could be amended to promote tree canopy and forest retention for water quality improvement throughout the Commonwealth as follows:
• Extend the provisions of §15.2-961.1 to local governments in other portions of the Commonwealth (e.g. the Chesapeake Bay watershed).
• Broadened the statute from its limited focus on air quality ozone non-attainment mitigation to include broader support for Chesapeake Bay water quality enhancement and TMDL goal reductions, along with ozone non-attainment mitigation.
§15.2-961.1 further allows local ordinances enacted under this statute to require tree planting where the tree conservation/preservation targets for a development cannot practically be met, and allows local ordinance to provide for developer contributions to a local tree canopy bank or fund to allow other tree planting or conservation efforts undertaken by the locality to meet the unmet on-site stormwater requirements requirements for any development.
• To maximize economies of scale, amend §15.2-961.1 to authorize local government(s) to establish and operate a regional tree canopy bank capable of serving multiple local governments, or to allow an existing non-profit regional entity to do so. This could allow for more environmentally strategic tree replanting and/or tree conservation within a multi-jurisdictional sub-watershed area. Larger regional environmental and landscape enhancement benefits could then accrue from coordinated regional tree planting and conservation efforts in support of local government land and forest conservation and TMDL BMP actions.
• Enable a Regional Trading Aggregator Function. In the event that local or regional non-point nutrient or carbon sequestration credit trading programs become established, the potential for such entities to also support local needs for a local or regional tree canopy bank or fund also could be recognized under this section.

HEALTHY WATERS/FOREST RETENTION STUDY FINAL REPORT: JUNE 30, 2017 108
• Encourage Precision Conservation Practices by amending §15.2-961.1 so that local ordinances adopted under this authority to encourage tree planting efforts (e.g. riparian forest buffers) also consider on-site soil conditions to promote conservation of forest and tree canopy on more permeable class A and B soils (per USDA-NCRS). Areas with these soil types are more conducive to healthy tree and plant growth. This could be one state criterion for defining high conservation value forestland that could be implemented at the local level. Conservation of trees in areas with highly-infiltrative soils will help retain such soils by stabilizing the soils through the tree root systems. This is turn, promotes groundwater recharge, thereby supporting the replenishment of Virginia’s aquifers with stormwater rather than adding flow to stormwater management surface retention structures and surface flow through the natural tributary system.
8. Critical Importance of State Investment and Leverage Since 1998, the Commonwealth of Virginia has invested over $1.2 billion in Chesapeake Bay clean-up efforts. Most of these funds have been used as leverage for other investments. About 70 percent of the State’s leverage investment has gone to upgrade 89 waste water treatment plants. The State share of that investment has leveraged close to $1 billion in local, utility customer-funded investment. This investment has resulted in water quality improvements that are a major reason for Virginia’s meeting its 2017 TMDL targets for nitrogen and phosphorus load reductions. The Team heard many times about the critical nature of continued State investment. It was stated in several discussions that State investment has made it possible to upgrade treatment plants and thereby reach the 2017 targets.
Since the wastewater treatment upgrade effort is virtually complete, there was common agreement throughout the Basin that the primary focus now needs to turn to controlling stormwater from non-point sources. Landowners, as well as local officials, said that State support for forest conservation through policy and budget decisions is critical. It was noted by several stakeholders that if the State does not continue its leadership through such a financial commitment, they fear the ability at the local level to be successful in meeting the 2025 TMDL pollution reduction targets.
9. Fee Simple Land Acquisition and Easements Substantial feedback was received from localities in the lower and upper Rappahannock River basin that fee simple acquisition of land by the state or federal government is not popular because it removes land from the tax rolls and diminishes a locality’s ability to raise revenue for critical services like schools. Easements appear to be the preferred option because the land remains taxable, albeit at a lower rate. This creates more long-term certainty for the landowner but offers little or no flexibility. Perpetual easements lower the annual tax burden for the landowner (as well as offering significant one-time federal and state tax credit opportunities). In Virginia, this helps the locality in the calculation of its K-12 funding formula. The lower taxable value associated with land under conservation easement is reflected in the Composite Index vs.

HEALTHY WATERS/FOREST RETENTION STUDY FINAL REPORT: JUNE 30, 2017 109
properties in the LUVT program. These present some clear choices, or tradeoffs, in the local decision-making process. Some localities, however, have expressed concern that as more easements are recorded over time, the negative impact on a County’s tax base will become more pronounced. The idea of term easements appears to be gaining popularity and they were suggested as an alternative that should be available and explored. Reasons cited for considering term easements included: 1) they offer more flexibility than perpetual easements, 2) they offer more certainty than LUVT, and 3) they do not have an adverse impact on the Composite Index formula calculation. However, a downside (from a landowner’s perspective) is that they do not offer the one-time tax credits for the landowner. As an example, if a landowner offered an easement for a specific time period, say 20 years, then the landowner enjoys a lower local real estate tax burden for the term of the easement and the conservation benefits exist for that term as well. If, at the end of the term, the landowner wants to renew the easement, then the value of the easement to the landowner and the easement holder can be reassessed at that point in time, making for a more dynamic monetization of the environmental (eco-system) services provided. Based on preliminary conversations with EPA, it also appears term easements (with a 20-year term minimum) could be accommodated in the TMDL model. Virginia’s Open Space Land Act (§10.1-1701 of the Code of Virginia), passed in 1966, allows for easements less than perpetual but no locality in the Rappahannock has any such term easements on record. Under this Act, a term must be for at least 5 years but otherwise the length of the term is up to the landowner and easement holder. The Easement holder must be a public body, defined as: "any state agency having authority to acquire land for a public use, or any county or municipality, any park authority, any public recreational facilities authority, any soil and water conservation district, any community development authority…."
C. Pennsylvania-specific Findings/Challenges 1. “Clean and Green” Preferential Tax Assessment Program The Clean and Green program is a preferential tax assessment program that bases property taxes on use values for the land rather than fair market values. This typically results in tax savings for agricultural and forest landowners enrolled in the program. Penn State University faculty develop the Forest Reserve use values annually, based on timber type values in specific regions of the state, then create average values for each county. The program partners review these figures to ensure their accuracy before sending them off to the Department of Agriculture. Counties can then elect to use the Penn State figure, use an average, use a previous year’s figure, or develop their own, however the figure must be less than what it would be if the landowner was not enrolled in the program. Harvesting timber is a long-term endeavor, while tax revenues are collected yearly. It can be difficult for landowners to make property tax payments on land that is not currently generating revenue for

HEALTHY WATERS/FOREST RETENTION STUDY FINAL REPORT: JUNE 30, 2017 110
them. This is an issue that needs to be looked at in more detail. In the Pennsylvania Phase II outreach efforts and discussions, YBC Watershed community members, planners, and other interested stakeholders identified the need and desire for amendments to the current Clean and Green program for enhanced applicability and success. To the point about forest landowner concern about annual tax burden and the long-term deferral of income from a growing forest; when addressing local audiences in both Cumberland and York Counties, Pennsylvania project team staff peaked significant forest landowner interest in reference to the potential for an annualized income stream from the emerging carbon sequestration credit market and the sale of credits generated by their forest holdings.
2. Collaborative Stormwater Solutions An interesting alternative to finding forest retention incentives has been found in Pennsylvania through new, collaborative approaches. Recently, within the YBC Watershed, and the greater York County, 72 municipalities joined together with PennDot and the PA Department of Environmental Protection to develop collaborative stormwater solutions. However, not all municipalities in the county joined the effort. During the PA forest retention project outreach and discovery process, the Town Hall meetings discovered that several jurisdictions are experiencing or are expected to experience significant forest loss because of infrastructure expansion, particularly as it relates to transportation and utility networks. Some of the 2025 land cover predictions may not accurately project the amount of forest loss that occurs from these projects. Additional discussions with Penn DOT and Turnpike representatives could allow for a more accurate forecast of forest loss resulting from infrastructure projects at the local scale. These data could be added into the forest loss analysis to determine if there are additional forest loss hotspots that are not effectively identified using the methodology employed for the project alone.
PennDOT and the PA Turnpike Authority are both under the same MS4 water quality permit conditions as many of the local municipalities and have expressed interest in working cooperatively with local jurisdictions to meet mutual water quality goals. The Healthy Watersheds/Forest TMDL project presented a unique opportunity to engage the State Authorities in watersheds where they are expecting to have expansion or maintained projects that result in localized forest loss. Some of this may include financial support for tree plantings at priority locations and riparian sites to offset the overall forest loss in the effected watershed.
3. Nutrient Credit Trading in Pennsylvania Nutrient credit trading is already happening in the wastewater sector in Pennsylvania, with trades between point sources and point to non-point sources. PA project team members heard from many who have expressed a need for credit trading between the municipal and agricultural sectors. It is not known if PA nutrient credit trading regulations allow any nutrient trading with the existing forest sector (which is not recognized or allowed in Virginia). Public comments at project outreach meetings called for a need for MS4 WIP activities to make forest retention a priority, rather than treating it as something “extra” to do.

HEALTHY WATERS/FOREST RETENTION STUDY FINAL REPORT: JUNE 30, 2017 111
4. Local Planning, Zoning and Development Controls in Pennsylvania Planning in Pennsylvania is a municipal endeavor. Throughout the state, comprehensive planning is less impactful at the county level. Authority over development exists at the municipal level, and it is at this level that decisions are made. Generally-speaking, municipal officials can choose whether to heed county-level decisions or not. This includes land use decisions, encompassing planning and zoning (but municipalities must comply with any state environmental laws). Many Pennsylvania counties have greenway plans. They are not legally binding and more information can be found through the Department of Conservation and Natural Resources, Bureau of Recreation and Conservation or the Pennsylvania Department of Agriculture. Some municipalities have extensive planning and zoning programs, going beyond expected requirements to adopt voluntary ordinances to enhance environmental stewardship. For example, a Fairview Township ordinance mandated the creation of a riparian forest buffer along the YBC Watershed to hold back development. Other municipalities have engaged in no planning and zoning (even though they are mandated to do so under the PA Municipality Code). It is unclear what State sanctions, if any, apply in Pennsylvania for a municipality’s failure to comply with planning mandates in the PA Municipality Planning Code. With the diversity of governance structures, the flexibility allowed the municipalities under a modified Dillon Rule environment (which fosters more autonomous “Home Rule” decision-making), the apparent lack of oversight or control at the county-level over municipalities in each county, and the universal competition to attract business to grow the local tax base; it is easy to see, with all these factors, how local priorities might not focus on voluntary local forest retention. With so many municipal actors, coordinated actions become very hard to achieve. Currently, Pennsylvania has Agricultural Security Areas (ASAs, like Virginia’s Agricultural/Forestal Districts) that apply to farmland, but not specifically to forested land. These ASAs provide some protections to farm operations, and farms within these areas are eligible for PA’s Farmland Preservation Program. Over the last several years, interest has grown (including a recent publication from the Governor’s Office, entitled: “Woods that Work: PA Green Ribbon Task Force Report on Forest Products, Conservation, and Jobs”) concerning the possibility of creating “Forest Security Areas,” which would provide benefits to forest landowners that mirror what the ASA program offers farmers. This initiative, however, remains in the discussion phase.
5. The Challenge of Data-Driven, Coordinated Watershed Planning As noted above, Pennsylvania land-use decisions are made at the municipal level, with numerous individual municipalities in a watershed. Forest loss, in many cases, is a result of development policy and enforcement actions (or the lack thereof) at the local scale. Consequently, a watershed assessment and action plan really needs to be addressed at the municipality level, requiring a

HEALTHY WATERS/FOREST RETENTION STUDY FINAL REPORT: JUNE 30, 2017 112
jurisdictional-scale assessment of land cover conversion and forest trends to determine precisely where in the watershed, forests are most vulnerable to conversion. When looking at forest loss trends at the land-river segmentshed scale used in the Chesapeake Bay TMDL model, it is impossible to identify, at that scale, if or where areas of forest loss are occurring. As an example, in a land river-segmentshed there may be some jurisdictions that experience forest loss because of specific development patterns and policies, while others are expected to gain forest for similar reasons. The overall land-river segmentshed may indicate that forest loss is not projected to occur, while at the local scale some portions of the land-river segmentshed will continue to experience forest loss. Moreover, it is challenging to fit the land cover data classes, even from the most recent high resolution 1-meter imagery data, into the land use classifications which most municipal officials are accustomed to working with. Furthermore, the boundaries of the land-river segmentsheds do a poor job of delineating federal lands and county borders, making it harder to apply or adjust the tabular data for land cover classes.
6. Sector Views vs. Holistic Views Traditionally, the Chesapeake Bay Program tends to view the world through a “Sector”-lens, i.e. the watershed is subdivided into urban, agricultural, forest and other sectors, with a dominant focus on the urban and the agricultural sectors. Many Pennsylvanians maintain that the Bay program would have more success if it took and emphasized a holistic watershed view, where forestland is viewed with equal, if not greater, importance as the other component land covers of the watershed. Unfortunately, with the current “Sector”-oriented perspective, State legislation emphasis and local-level planning frameworks revolve around the two dominant sectors (agriculture and urban), leaving forestland retention a low priority in Pennsylvania. Similarly, forest retention incentive programs become a challenge both to fund and promote, on either a short- or long-term basis. As this project continues to emphasize, by incorporating forest retention into the holistic view of watershed management, additional forest value is recognized in the ecosystem services which forests perform, human connectivity to the land and water increases, the development of a more informed and engaged public and, ultimately, quality communities emerge, with community values that produce ordinances needed to sustain a forest resources within Pennsylvania, the Chesapeake Bay watershed and beyond.
7. Technical Assistance Capacity Limits/Educational Needs Locally within the YBC Watershed, but especially statewide, there are a limited number of trained professionals able to provide technical assistance within areas such as riparian forest buffer plantings, let alone those capable of assisting landowners navigate and implement the programs that are available to provide financial assistance for this technical work. Programs such as the Pennsylvania Conservation Reserve Enhancement Program (CREP), are exceedingly beneficial to landowners across the state. A few comments at recent Town Hall meetings,

HEALTHY WATERS/FOREST RETENTION STUDY FINAL REPORT: JUNE 30, 2017 113
conducted as part of this project’s outreach, found that while programs like these are needed and provide a myriad of benefits; many challenges still exist. Along with programs working with conservation, the issues that arise working with forest and open space retention vary from invasive species management, to dealing with return on investment queries because landowners are not harvesting annual crops, but rather waiting, in some cases, for a once-in-a-lifetime timber harvest. With approximately 2,000 municipalities across the Commonwealth of Pennsylvania, and over 740,000 private landowners, more professionals are needed in the workforce. With this need, additional training would be required and the challenge of acquiring funding for these requirements. However, when one compares the costs saved, even over the 2010 to 2025 period for one locality (let alone one watershed) all of these needs seem justified. In the meantime, the needs must be met somehow. Is that through continuing outreach with landowner education? The Pennsylvania project outreach efforts identified a few localities, exhausted of planning and solely engaging in outreach and education projects with partners, ready to abandon these efforts, requested and recommended projects involving technical assistance and implementation involving forestland retention along the YBC Watershed.
8. Peer Review of Planning Units, Model Data, and Inaccuracies in the Modeling Program During the peer review of the Virginia team methodology, it is important to note several differences that occurred at the data processing level, due, in part, to differences in governance structure between the two study areas in Virginia and Pennsylvania, respectively; as well as due to the difficult “fit” of the selected watershed to the modelling tools being applied.
a) The Yellow Breeches Watershed has portions of 7 land-river segmentsheds, with no single
land-river segment fully encompassed in the watershed; thus the aggregate land cover data at this level was largely useless when parsed or “clipped” to describe a portion of the watershed.
b) The GIS analysis completed by the PA DCNR shows that 4 out of 7 land-river segmentsheds are projected by the Chesapeake Bay TMDL model (version 5.3.2) to either gain or maintain forest land cover between 2010 and 2025. One portion of the watershed in York County, while projected to lose some forest land to development, is projected to lose more agricultural land to development than forest land. Since many agricultural land uses have higher sediment and nutrient loading rates compared to developed land uses this land-river segmentshed is projected to have a net decrease in nutrient and sediment loads between 2010 and 2025, masking the load reduction benefits of forest conservation.
c) The unadjusted land-use analysis provided by Peter Claggett from the Chesapeake Bay program office shows that only 2 out of 7 land-river segments are projected to have a net decrease in forest land between 2010 and 2025.

HEALTHY WATERS/FOREST RETENTION STUDY FINAL REPORT: JUNE 30, 2017 114
d) The Chesapeake Bay Model 5.3.2 tools use tabular land use data at the land-river segmentshed scale; the modeling tool allocates a percentage of each agricultural land use to the area of interest based on the proportion of the land river segment that area of interest occupies. For example, if there is 100 acres of hay land in the land-river segmentshed and the watershed contains 25 percent of the land-river segmentshed then the model assumes that there are 25 acres of hay land in the watershed. However, on the ground, that 25 acres may or may not be located in the watershed. This is also true for forest. If there is a projected forest loss or gain predicted at the land-river segmentshed scale, it is not possible to discern where, within that land-river segmentshed, that change is occurring using the current modeling tools. Since the Yellow Breeches Creek Watershed contains only portions of land-river segmentsheds, one cannot accurately predict, using this methodology at this scale, if the forest loss or gain is occurring inside the watershed or potentially outside of the watershed but in another portion of the land-river segmentshed.
The team found these challenges to be reasonable and a necessary part of the scientific process and true to any successful collaborative partnership. This is especially accurate regarding one between two states so dedicated and intertwined in the fiber of the Chesapeake Bay Partnership.
9. Critical Importance of Pennsylvania State Investment and Leverage Realizing the critical importance of forestland to the quality of life and healthy watersheds, Pennsylvania has made a commitment to the Chesapeake Bay to plant 95,000 acres of streamside buffers by 2025. Promotion of the retention, protection, and reforestation of streamside buffers is key in Pennsylvania. Research and implementation are key resources during this time and grants are essential tools to see this occur. For localities and landowners, these can be administered through the DCNR’s Bureau of Recreation and Conservation’s Community Conservation Partnerships Program with dollars from the Keystone Fund. In times where localities and states and entire watersheds are proactively addressing the concerns of their environments, this project’s research and methods are timely.
Other programs highlight such investments, like the Healthy Forest Reserve Program (HFRP), which is an easements program that is set up similarly to the Wetlands Reserve Program (WRE), available through the NRCS. HFRP is listed as a program option under the Regional Conservation Partnership Program (RCPP), but most landowners utilize the Environmental Quality Incentives Program (EQIP) or the Conservation Stewardship Program (CSP).
Through the RCPP, the PA DCNR could apply. Then, NRCS co-invests with partners in innovative, workable and cost-effective approaches to benefit farming, ranching and forest operations; local economies; and the communities and resources in a watershed or other geographic area. The partners develop project applications, as described in the annual RCPP Application for Program Funding, to address specific natural resource objectives in a proposed area or region. Partnering organizations design, promote, implement and evaluate the project outcomes. A current

HEALTHY WATERS/FOREST RETENTION STUDY FINAL REPORT: JUNE 30, 2017 115
challenge is that 2017 is the last year for the current 2014 Farm Bill which is being redeveloped by Congress.

HEALTHY WATERS/FOREST RETENTION STUDY FINAL REPORT: JUNE 30, 2017 116
TOOL BOX OPTIONS AND RECOMMENDATIONS VIRGINIA The Healthy Watersheds Forest/TMDL project’s ultimate goal is implementation of forestland retention actions on a broad, long-term, self-sustaining basis through the creation of a supportive economic, environmental and political private/public infrastructure at the local and state levels. Over the past year, the Virginia HWF/TMDL project team has had extensive discussions with local and state elected and professional public officials, representatives of the finance, real estate and natural resource sectors, NGO’s focused on land conservation, the agricultural community, and other interested citizens. The options proposed in this section are focused on developing and implementing solutions to address the barriers and challenges that have surfaced as common denominators in this dialogue throughout the Basin. The possible solutions are complex, but the objective is to inform not only the jurisdictions in the Chesapeake Bay Watershed but the national TMDL and Stormwater Management programs, while simultaneously building a societal infrastructure where forestland retention becomes a priority in land use planning and decisions. It is a landscape-level challenge that requires landscape-level solution responses. 1. Factor Ecosystem Service Functions Into Conservation Easement Tax Credit Policy
Through the process of placing a permanent conservation easement on their property, landowners can secure both federal and state tax credits for placing a conservation easement on their land. Conservation easements (as an instrument of forest retention) may have greater environmental (and thus greater public) benefit when located strategically. It would be logical (and preferable) if the tax credit system could take into account the differential public benefit derived through the ecosystem service functions protected or enhanced by an area under conservation easement protection. Thus, landowners that might agree to conserve forested areas by conservation easement in areas that have been identified as being of high conservation value would realize a greater tax credit incentive than those conserving forestland in non-high conservation value areas. Localities too, could use such credits as incentives in proffer discussions with developers to encourage retention of high conservation value forest lands. Similarly, the LUVT-recommended use valuations only consider the value of the land to support the production of a specific use (i.e. agricultural, forestal, horticultural or open space), and not the natural capital value of the land use, particularly the diverse ecosystem services performed by forestland and wetlands. Considering natural capital values in the LUVT program would help elevate landowner interest in conserving these higher conservation value lands by conservation easement, while deriving greater economic benefit through natural capital credit trading programs. At the same time, these additional income streams derived from natural capital trading could supplement and replace local government revenue streams lost through the tax relief given under the LUVT and easement programs.
HEALTHY WATERS/FOREST RETENTION STUDY FINAL REPORT: JUNE 30, 2017 117
2. Recognize Natural Capital as a Resource and Taxable Asset Carbon “cap and trade” systems are being used in the Far West, Northeast and Midwest parts of the nation, and could be applied in the Chesapeake Bay watershed as well, coupled with water quality components driven by TMDL and/or stormwater management credits to create multiple potential markets. Under such a system, contaminant emissions are capped at an established level and the companies responsible for the emissions are assigned an emission allowance. To meet the reduced emission allowances over time, individual companies can either reduce their own emissions to meet the new cap or trade (i.e. buy) emission permits from other companies that have more allowances than they need. A water quality credit trading mechanism between jurisdictions could be structured in much the same manner and if a carbon credit market opportunity was added, it could bring in much needed private capital as well. The following concept is modeled after GreenTrees61, currently the largest carbon reforestation project in North America. That project is focused on reforesting one million acres in the Mississippi Alluvial Valley. The area is a flyway for 60 percent of all birds on the North American continent, drains 41 percent of the United States and is a major commercial artery. It is financed through carbon credit purchases made by the Norfolk Southern Corporation and Duke Power. Healthy Watersheds Forest team members met with the project sponsors and asked them for suggestions on how a similar model could be designed and employed in the Rappahannock River basin, and more broadly in the Chesapeake Bay Watershed. Background The first step requires establishing a quantitative value for forestland ecosystem services values and treating standing forests as natural capital or assets beyond their traditional harvest board and fiber values. This has become easier to do since the carbon market emerged. However, these values include not only carbon, but also water and biodiversity. The Green Tree project sponsors cite information from the International Panel on Climate Change (IPCC) that, since 1750, nearly one third of all the carbon emissions that have been put into the atmosphere have come from land-use change, predominately deforestation. They further note statistics estimating that 50-60 percent of all clean drinking water comes from forested ecosystems. With a majority of Virginia’s population living within the Potomac/Shenandoah, Rappahannock, and James River basins, investing in green infrastructure offers the potential for substantial future savings, protecting the health of Virginians, the economy and the environment. System Design Challenges For any market-based-mechanism to have broad impact and adoption, the key design elements must be compelling to the participants, straight-forward and scalable. While environmental commodity markets have a role to play, often it takes upfront capital and expertise to navigate. Further, it takes
61 See: https://www.green-trees.com/

HEALTHY WATERS/FOREST RETENTION STUDY FINAL REPORT: JUNE 30, 2017 118
time to match a willing buyer with a willing seller. For example, not every company in the US is a carbon buyer. Some have internal targets, some do not. Some like projects to be near their company footprint, some have vintage requirements (carbon is sold in vintage or years), some prefer one project type to another one.
The key design question to ask is who is the broadest buyer and how can that buyer help drive scale? For Virginia, the broadest possible buyer is the Virginia taxpayer, as this group covers a majority of the population. All taxpayers are interested in the same thing – tax efficiency. A good proxy example would be the Land Preservation Tax Credit. The downside to the Land Preservation Tax Credit is that state officials need to limit taxpayer participation to limit loss state revenue and any subsequent negative budgetary impact. This is ultimately a design flaw. The objective of a market based credit trading mechanism would be to create a positive revenue center for the Commonwealth, localities and the forestland owner. In any tax credit mechanism involving landowners, the three participants would be the State, the tax credit buyer and the landowner. The tax credit buyer does not have to align his or her interest with the practice being implemented but rather to the question, does this make good sense from a tax efficiency perspective. From the landowner point of view, he or she is creating new income streams. As long as the dollars per acre are compelling, landowners will participate, assuming the process is straightforward. This result can be something that is scalable.
The Key The key comes down to what makes it a win/win proposition for all parties? As an example for how a program to incentivize forestland retention could be structured, Assume the established credit price for a metric ton of carbon was $25 with a per year inflation escalator equal to and tied to the Consumer Price Index (CPI). The Federal Carbon Sequestration Tax Credit is roughly $22 per metric ton.62 . The value of that sequestration credit could be distributed as follows: Fifty percent of the carbon sequestered could be monetized by the landowner and sold to tax credit buyers and the other fifty percent could go into a “Green Infrastructure Bank” owned and operated by the Commonwealth. This Green Infrastructure Bank would insure the long-term permanence of the market and could use the credits to 1) conserve more forestland; 2) buffer the state against the federal clean power plan or its successor efforts; or 3) entice new businesses to locate to Virginia or 4) monetize proceeds for financial and budgetary reasons.
62 See https://www.irs.gov/pub/irs-access/f8933_accessible.pdf

HEALTHY WATERS/FOREST RETENTION STUDY FINAL REPORT: JUNE 30, 2017 119
A Precautionary Note Credit trading, while an attractive option has some downsides that should be considered. The Extension Office at the University of Tennessee has done research on the potential of carbon credit trading for forest owners and in one of its publications begins with the precautionary statement (see text box at right) that bears repeating.63
3. Provide Enhanced SWM Credit for High Conservation Value Forestland Buffers - A Model Spotsylvania County in Virginia has adopted an innovative comprehensive stormwater management plan (SWM) that incorporates credit trading concepts and quantifies the water quality enhancement values of various plant species used in BMP implementation. The principal components of the plan cover:
1. Mussel farming 2. Intra-County trading among developers and existing BMP’s with known credits 3. Promoting retrofitting older developments with BMP’s through VCAP (the Virginia
comprehensive assistance program) 4. Existing County lands to be used for pollutant load credits.
Many of the County’s existing SWM BMP’s that were originally placed for flood control had to provide a safety shelf as part of their design to avoid the need for fencing around the entire pond. These shelves over time have developed wetland vegetation and increased their water quality pollutant removal rates to the point that they now exceed the minimum required to meet Virginia Code. The vegetation has subsequently been identified in Spotsylvania’s stormwater management comprehensive plan, and they have become a trading facility for development projects within the locality. These wetland vegetation offset credits will be used by the development community when they cannot treat the pollutant loads from their site. New development must meet the water quantity criteria and keep the stormwater from flowing offsite first before credits will be entertained.
Healthy Watershed/Forest TMDL project members met with a Spotsylvania County representative to discuss whether the model they used to establish a basis for credit trading could incorporate trees
63 Mercker, David, “The Business of Carbon Credit Trading For Forest Owners”, University of Tennessee Institute of Agriculture Extension W217
“Precautionary statement: Only those landowners with a serious and lasting commitment to long-term sustainable forest management should consider enrolling in a carbon credit trading program. It is a contractual agreement, lasting several years, with initial costs that may not be suited for all ownerships. Removing timber during the contract period will affect carbon sequestration rates, potentially resulting in a penalty. This program is funded by private investors, not the government, and these investors are counting on participating landowners to deliver a product: ‘sequestered carbon’. And like the stock market, prices paid in sequestered carbon fluctuate daily, with no minimum guarantees. Participants should seek full disclosure from their carbon aggregator of all potential benefits and risks prior to enrolling”

HEALTHY WATERS/FOREST RETENTION STUDY FINAL REPORT: JUNE 30, 2017 120
and forestland as well and further discussions have begun between the County and the Department of Forestry to define what would be required. Discussions are currently centered on establishing the water uptake of state specific trees that can help meet the potential pollutant loads for the preservation of forest buffers (based on age, foliage spread, size, etc.); air quality: determining how much air is treated per tree, (based on age, foliage spread, size, etc.); and establishing the minimum pad site or vegetation density established for the specific rates in responses, for example: 10’x10’ or 100’x100’.
The County has also identified several County-owned parcels that could be used for strategic BMP’s that will help with pollutant loads for County-specific projects. These sites could benefit from stream restoration and reforestation to create wetlands. Each one is on a parcel that is not anticipating new development/construction and will be used to help with the restoration of the Bay.
This model offers potential for quantifying pollution reduction values on a per tree basis. This quantification in turn could be used to establish the monetary credit value of a given forestland parcel based on its pollution uptake capability.
4. Further Incentivizing Expansion of Riparian Forest Buffers and Forest Retention Scattered throughout the Code of Virginia are several financial incentives that serve to advance the role of riparian forest buffers and forest retention. Virginia Code Sections §58.1-339.10 & §58.1-439.12 provide a tax credit for riparian forest buffer protection for waterways where the waterway is abutting land on which timber is harvested. The “waterway” must have an existing riparian forest buffer. The tax credit is applied at a rate of 25 percent of the value of riparian buffer timber retained. This policy is enacted as an incentive for landowners to conserve and protect forest buffers for the water quality and nutrient reduction benefits they provide.
Section §58.1-512 Land preservation tax credits for individuals and corporations tax credits for conserved lands provides a tax credit for a conservation easement on land located in Virginia which is conveyed for the purpose of agricultural and forestal use, open space, natural resource, and/or biodiversity conservation or agricultural, watershed and/or historic preservation.
Considered together, these two sections can serve as guidance for creating the baseline needed to establish a quantifiable Code that can incorporate all aspects of potential stream and wetland buffer preservation.
The category could be referenced as “Stream, Shore and Wetland Buffer Preservation”. The rationale would be to promote water quality pollution removal through enhanced creation and/or preservation of minimal buffers. The buffer features would be predicated on the potential impacts of the upland nutrient loading activity to the receiving water feature. Appropriate buffer width and vegetation including trees required for optimum pollutant removal efficiency would be guided by accepted scientific practices and detailed studies.
HEALTHY WATERS/FOREST RETENTION STUDY FINAL REPORT: JUNE 30, 2017 121
A 100’ maximum buffer width would generally be appropriate unless the specific soils and/or slope require an increase in the protective buffer width. The potential pollutant loads should be based on the current Total Phosphorous (TP), Total Nitrogen (TN) and Total Suspended Solids (TSS) to the receiving waterway. Other potential pollutant reductions resulting from buffer preservation and conservation are metals, petroleum base products, as well as carbon based air pollutants and regional temperature moderation.
Under VA Code §10.1-2132 Nonpoint source pollution funding; conditions for approval, the Virginia Department of Conservation and Recreation (DCR) and the Virginia Department of Environmental Quality (DEQ) work together to utilize federal Water Quality Improvement (WQI) Grant funds that have historically been available to local governments, soil and water conservation districts, institutions of higher education and individuals who propose specific initiatives that are clearly demonstrated as likely to achieve reductions in nonpoint source pollution, including, but not limited to, excess nutrients and suspended solids, to improve the quality of state waters. Under this particular code, local governments can be reimbursed for tax credits and tax relief given as incentives for water quality protection. Priority is given to agriculture proposals with a cap of 60 percent of the state WQI funds for use in the Chesapeake Bay watershed.
Virginia Code § 62.1-44.15:23.1. Wetland and Stream Replacement Fund established a non-reverting fund known as the “Wetland and Stream Replacement Fund”. The intention of this legislation is “to achieve no net loss of Wetlands acreage and functions”. One of the key items these DEQ administered mitigation funds can be used for is the “preservation, enhancement, or restoration of upland buffers adjacent to wetlands or other state waters when used in conjunction with creation or restoration of wetlands and streams”. The replacement rate for impacts to forested wetlands is calculated at a 2:1 ratio. This supports the exceptional benefits that forested riparian buffers have for water quality protection. Local governments are eligible to receive funds for the activities covered by § 62.1-44.15:23.1
A Stormwater Local Assistance Fund is also established under §62.1-44.15:29.1 pertaining to stormwater regulations item “B”. The purpose of the Fund is to provide matching grants to local governments for the planning, design, and implementation of stormwater best management practices”. It includes in the list of considerations: (e) buffer restoration.
Finally, under §62.1-44.15:48 Stormwater Management, Chesapeake Bay Act and §62.1-44.15:63 Erosion and Sediment control - Penalties, injunctions, and other legal actions buffer restoration is an item that a civil penalty can be used by local Municipal Separate Storm Sewer System (MS4), Virginia Stormwater Management Program (VSMP) authority and/or Virginia Erosion Control Program (VESCP) authorities to help the mitigation for the impacts.
A. Potential Conservation/Preservation Area Restrictions
All of the riparian buffers provided for in the Code of Virginia and the Virginia Administrative Code were established in response to U.S. Clean Water Act requirements to protect and promote the quality of the waters of the Commonwealth.

HEALTHY WATERS/FOREST RETENTION STUDY FINAL REPORT: JUNE 30, 2017 122
Uses and Limits
Virginia Code §62.1-44.15:21 addresses impacts to wetlands, requiring their avoidance and minimization. Its purpose is to: (1) encourage avoidance of unnecessary impacts, (2) minimize any unavoidable impacts, and (3) compensate/mitigate for even minimal impacts. Preservation and restoration of buffers is one of the approved options to be considered as mitigation for impacts to the wetland that could impair state waters or fish and wildlife resources. The insert box (at right) explains the different buffer widths currently focused on for this report. It can be updated with the cooperation of other agencies and entities for specific buffer used widths and types for each of the current lists of BMP’s.
Figure 12. Riparian Forest Buffer Benefits vs. Buffer Widths
Source: Prepared by Judith. A. Okay, PhD. for Chesapeake Bay Forestry Work Group
All of the widths and associated benefits shown above in Figure 12 are supported by scientific studies. The factors that influence ideal forest buffer widths are site-specific and related to topography, soil, geography, sociology and political characteristics of the target sites. Characteristics such as stream order, stream stability may require a wider buffer to get maximum function. It can be conceptualized from the graph in the above figure that a 75 – 100 ft. width encompasses most of the desired benefits that can be obtained from a forest buffer. Building consensus around a single width is a process involving negotiation.
0 35 70 105 140 175 210 245 280 315 350 385 420 455 490 525 560 595 630 665 700
SedimentAir Temp
Rel.HumidityHabitat
ChanstabilityFlpl stabilityP reductionN reduction
Buffer Width in Feet
Ben
efit
s
Riparian Forest Buffer Benefits vs Buffer Width
<35 to > 100 ft
> 35ft
Currently Used Buffer Widths
The minimum stream and wetland buffer for the select timber harvesting of property recognized by the Virginia Department of Forestry (VDOF) is 25 feet. Note VDOF Streamside Management Zone (SMZ) has buffer widths based on and slopes adjacent to the water features.
The Virginia Department of Conservation and Recreation (VDCR) identifies 35 feet as a minimum buffer for agricultural uses in accordance with the USDA Natural Resources Conservation Service (NRCS) minimum buffer limits dependent on use.
Virginia’s Chesapeake Bay Preservation Act (CBPA) established 50 feet as the Resource Protection Area (RPA) limit for a “no impact zone” designated as the waterside of the overall RPA limit. Minimal impacts are allowed for water dependent uses and utilities.
CBPA established 100 feet as the RPA limit for no increase in impervious surfaces, and DMME regulations (4VAC25-130-816.57. Hydrologic Balance;

HEALTHY WATERS/FOREST RETENTION STUDY FINAL REPORT: JUNE 30, 2017 123
B. Riparian Forest Buffer Restoration As Compensatory Mitigation for Stormwater Management Violations
Under Virginia Code §62.1-44.15:48 Stormwater Management and §62.1-44.15:63 Erosion and Sediment Control64 which both provide inspection and civil penalties for land disturbance without a permit, buffer restoration is allowed to compensate for a civil penalty by local MS4 and/or VSMP authorities and to help with the mitigation of the land disturbance impacts.
Table 18 below and Figure 15 describe and illustrate, respectively, the three zone buffer system that has been promoted by the USDA Forest Service and provide a framework to explain the connection between location and expected function of riparian forest buffers.
Table 18. Description of Three-Zone Riparian Forest Buffer Design
Zone Recommended Minimum Width
Recommended Vegetation Expected Benefits
Zone 1 4.5 m = 15 ft. Mature tree cover
-Control physical, chemical and trophic status of stream - Aid in de-nitrification process -Contribute organic matter (litter and woody debris) -Temperature and relative humidity moderation
Zone 2 18m = 60 ft. Trees and Shrubs
-Block transport of nutrients and chemical from upland areas to adjacent aquatic ecosystems. -Runoff infiltration -Contact area for soil layers and groundwater for microbial uptake -Sequester, transform and remove pollutants -Support Zone 1 functions.
Zone 3 6m = 20 ft. Grasses and Forbs -Remove sediment (deposition)-Spread surface flow -Infiltration of surface flow
64 For effective date, see Acts 2016, cc. 68 and 758) Penalties, injunctions, and other legal actions
Figure 13. Three-Zone Buffer Design
HEALTHY WATERS/FOREST RETENTION STUDY FINAL REPORT: JUNE 30, 2017 124
5. Promote Forested Stream Buffer Protection and Reforestation Under Virginia’s Chesapeake Bay Preservation Act and the regulations promulgated thereunder, agricultural activities can encroach into the 100 foot Resource Protection Area buffers if the operation employs appropriate BMPs. The encroachment can be 50’ if the operation utilizes one BMP that addresses the major pollutant. For example, no-till planting or planting a winter cover crop address the sediment loss problem. The encroachment can be 75’ (or within 25’ of the water feature) with BMPs that address erosion, nutrient management, and pest chemical controls. For example, no-till or cover crops + nutrient management plan + integrated pest management plan (or private applicator licenses). Agricultural ditches do not require a buffer if at least one BMP is employed, addressing the major issue which is typically erosion and/or nutrients. It should also be noted that federal agricultural programs require at least a 35’ buffer. Consequently at least some Soil and Water Conservation Districts use the 35’ buffer in most situations. Sorting out these conflicts and inconsistencies and recommending actions to be taken could be an assignment the HB 1774 workgroup may wish to take on. The HWF/TMDL project final report will also be recommending to the Chesapeake Bay Program partnership that it address the issue.
6. Expand Tree Protection under Code of Virginia (§ 15.2-961.1) Section 15.2-961.1 of the Code of Virginia authorizes local governments in Northern Virginia (i.e. Planning District 8) to conserve trees in the land development process as an ozone non-attainment mitigation measure. However, this statute could be amended to promote tree canopy and forest retention for water quality improvement throughout the Commonwealth and the Chesapeake Bay, as well as the Commonwealth’s air quality as follows:
a) Expand Geographic Coverage. Given the importance placed on trees and natural vegetation proximate to perennial streams and tidal wetlands and waters to be protected in defined Resource Protection Areas (RPAs), the provisions of §15.2-961.1 for tree protection authority could be extended to local governments in other portions of the Commonwealth (e.g. the Chesapeake Bay watershed).
b) Expand the Purpose of Tree Protection. The justification for tree conservation under this
statute could be broadened from the limited focus on air quality ozone non-attainment mitigation to include broader support for Chesapeake Bay water quality enhancement and TMDL goal reductions, along with ozone non-attainment mitigation.
§15.2-961.1 allows local ordinances enacted under this statute to require tree planting where the tree conservation/preservation targets for a development cannot practically be met, and further allows the local ordinance to provide for developer contributions to a local tree canopy bank or fund to allow other tree planting or conservation efforts undertaken by the locality to offset the unmet on-site stormwater requirements for any development.
a) Promote Regional Economies of Scale and Flexibility. To maximize greater efficiency and cost-savings resulting from establishing a regional tree canopy bank or fund to serve multiple local governments, add enabling language as an amendment to §15.2-961.1 to authorize local

HEALTHY WATERS/FOREST RETENTION STUDY FINAL REPORT: JUNE 30, 2017 125
government(s) to establish and operate such a regional program on their own, or to allow an existing non-profit regional entity) or perhaps through the local regional planning district commission to do so. This could foster more strategic tree replanting and/or tree conservation efforts within a multi-jurisdictional sub-watershed area where larger regional environmental and landscape enhancement benefits might accrue from coordinated regional tree planting and conservation efforts in support of local government land and forest conservation and TMDL BMP actions.
c) Enabling a Regional Trading Aggregator Function. In the event that local or regional non-
point nutrient or carbon sequestration credit trading programs become established, the potential for such entities to also support local needs for a local or regional tree canopy bank or fund also could be recognized under this section.
d) Encouraging Precision Conservation Practices. Amend §15.2-961.1 to encourage that local ordinances adopted under this authority encourage tree planting efforts (e.g. riparian forest buffers) to consider on-site soil conditions to promote conservation of forest and tree canopy on more permeable class A and B soils (per USDA-NRCS). Areas with these soil types are more conducive to healthy tree and plant growth. This could be one criterion for locally-defining high conservation value forestland. Moreover, conservation of trees in areas with these highly-infiltrative soils will help retain such soils (by stabilizing the soils through the tree root systems) and promote groundwater recharge, thereby supporting the replenishment of Virginia’s aquifers with storm water rather than adding flow to stormwater management surface retention structures and surface flow through the natural tributary system.
7. Expanded Use of One Meter Land Cover Imagery and LIDAR Elevation Data VIRGINIA The one-meter imagery data used in the Virginia Department of Forestry’s Urban Tree Canopy study program (using USDA’s National Agricultural Imagery Program (NAIP) data) were found to be a valuable dataset for validating and correcting land cover estimates for the City of Fredericksburg for the Chesapeake Bay TMDL model alternative growth scenarios developed and tested under Phase I of this project. Now that Virginia has one-meter imagery available throughout the Chesapeake Bay watershed and should soon have it throughout the entire Commonwealth, building a comparable dataset for all Bay localities would lend more credibility to the Bay model and the relative non-point contributions of urban and suburban non-point pollution versus rural, non-point agricultural pollution detected from water quality sampling stations throughout the Bay watershed. These high-resolution land cover data are hosted on a web server by the Virginia Geographic Information Network (VGIN) as a mosaic of tiled image files which require significant technical capability to create more useful locality-specific datasets for the 134 independent cities and counties and 190 independent towns of the Commonwealth. The Virginia HWF/TMDL project team recommends that the Commonwealth pre-process such large spatial datasets to create downloadable files at the independent city, county and town level, providing more “user-friendly” data better
HEALTHY WATERS/FOREST RETENTION STUDY FINAL REPORT: JUNE 30, 2017 126
related to the political geographies that make land use and stormwater management decisions. It should be noted that this was done in Pennsylvania at the county level.
Moreover, by providing quite accurate land cover data (i.e. 90+ percent accuracy) in locality-specific vector data files, it is easier to delineate specific public and private land cover inventories (and contributing sources of stormwater runoff to determine management responsibilities). This would be helpful for developing watershed implementation plans by overlaying tax parcel boundary files, public rights of way boundary files and other vector layers useful for public policy analysis to describe the land cover under different ownership and management practices. Furthermore, an accumulation of such high-definition imagery over time facilitates consistent change analysis over time and enables more efficient monitoring of conservation easements, preservation of riparian buffers and other monitoring required by public policy which may be prohibitively expensive through traditional on-site field inspection. Additionally, the new availability of LIDAR data over much of Virginia’s Chesapeake Bay watershed area that was used to interpret and enhance the high-resolution land cover imagery represents a significant tool useful for land and water resource management and conservation planning. Due to the complexity of these data (along with the high-resolution land cover data), Virginia could increase its return on this technology investment by offering technical training seminars for localities, SWCDs, PDCs, NGOs, etc. on how to access, manage, and apply these data to a variety of public and private natural resource, land management and planning uses. Changes in forest land cover are the easiest to detect and, assuming the continuation of past federal funding priorities for the annual creation of the USDA-NAIP dataset, this federally-funded resource provides suitable interim data for land cover change and riparian buffer gap detection (albeit with an approximate data production lag of one year) to supplement what may be captured periodically in the future by the Commonwealth or the Bay program. This capability applied across the Chesapeake Bay watershed could be used to help build the scientific basis within the TMDL model to provide a forestland retention BMP credit to localities. PENNSYLVANIA Now that PA has one-meter imagery available throughout the Chesapeake Bay watershed, building a comparable dataset for all Bay localities would lend more credibility to the Bay model and the relative non-point contributions of urban and suburban non-point pollution versus rural, non-point agricultural pollution detected from water quality sampling stations throughout the Bay watershed.
8. Link Multi-Year LUVT Program with Term Easements and AFDs With appropriate enabling legislation to allow localities the flexibility of implementing a non-mandatory, multi-year LUVT application (perhaps limited to forest lands) and possible amendments to the Virginia land use valuation methodology to continue local COR flexibility in setting the local use value or to provide a reasonable multi-year valuation for forest lands; forest land-owners and localities would be relieved of the requirement of annually applying for LUVT and local COR staff
HEALTHY WATERS/FOREST RETENTION STUDY FINAL REPORT: JUNE 30, 2017 127
would be less burdened with the annual application workload. If structured for a defined term such a modified LUVT program could significantly expand the amount of forested land cover considered and reported to the Chesapeake Bay program as “conserved” under a form of “term” easement corresponding to the term of the multi-year LUVT application. Alternatively, localities and forest landowners could make greater use of the existing agricultural-forestal district (AFDs) statute which provides multi-year coverage and additional protections to the landowner for lands in an AFD. However, it should be noted that the AFD option does depend on both the voluntary action of the landowner and the local governing body’s passage of the district ordinance to create the AFD district. Moreover, the acreage eligibility threshold for a general AFD is 200 acres vs. a 20 acre threshold for forests utilizing use value taxation.
However, select localities65 can, by ordinance, establish an agricultural-forestal district of local significance with a minimum parcel or contiguous acreage size of 20 acres. The smaller, local districts may have a term of 4 to 8 years, while the larger, general AFDs may have a term of 4 to 10 years. Either district designation may be renewed by the governing body at the request of the landowner upon completion of a statutorily-mandated review process for the renewal application and governing body approval of an ordinance renewing the district. Other localities could seek General Assembly approval to extend enabling authority under the Local Agricultural and Forestal Districts Act, § 15.2-4400 of the Code of Virginia to include their locality among those listed as participating localities under this Act so that smaller parcels (between 20 and 200 acres) of land could participate in this multi-year farm and forest conservation program.
For this additional “protected” acreage, with the establishment of a Chesapeake Bay TMDL credit for “forest retention”, localities may benefit by avoiding other possible stormwater management investments. The local reporting of the forest land acreage under LUVT (and all forms of Agricultural-Forestal districts) could be reported through either: a) the annual data collected by the LUVT program for market valuation calculations, b) through the locality’s annual local financial statement filed with the Virginia Auditor of Public Accounts or c) by annual survey conducted by an appropriate state agency. With specific annual certification requirements required under carbon sequestration credit trading, developing a consistent, multi-purpose certification process that meets the needs of LUVT, conservation easements, agricultural/forestal districts and carbon credit trading would be useful and an important topic for dialogue between SLEAC and the Virginia Association of Commissioners of Revenue, in consultation with experts in the carbon trading arena, and forest landowners.
9. Achieving a Balanced Investment Portfolio Strategies Approach
a) Leverage public investments, such as QWIP, federal, state and local funding with private equity and NGO investments in forest and green infrastructure (GI) conservation.
65 Counties of Albemarle, Augusta, Fairfax, Hanover, James City, Loudoun, Prince William, Roanoke, and Rockingham.

HEALTHY WATERS/FOREST RETENTION STUDY FINAL REPORT: JUNE 30, 2017 128
b) Optimize financial, ecological, and social returns from a portfolio of pools of natural and built
Chesapeake Bay related infrastructure. Optimization would consider infrastructure investment goals and definitions of success, infrastructure return time horizons, risk tolerance, and cost effectiveness.
c) Develop low cost regional or watershed-wide mitigation credit bank protocols including forest retention, nutrient, wetland, stream restoration – that are more flexible and less tied to simple geographic watershed nomenclature with the objective being that all such efforts benefit the Chesapeake Bay’s overall recovery.
d) Coordinate among Commissioners of Revenue (VA)/municipal and county tax assessors (PA) at the local level and their counterparts at the state level to move the “metrics” of Land Use Valuation and easement methodologies to consider multi-year program application and ecosystem service benefits of forestland, combined with term easements to affect reductions in valuation assessment and encourage forest retention.
e) Evaluate a sponsorship program concept to use State water quality improvement revolving loan funds to incentivize forest retention actions at the local level.
f) Link both upstream and downstream forestland retention to MS4 jurisdictions’ needs for TMDL compliance and forest loss mitigation based on a conceptual model that all jurisdictions are upstream of the Chesapeake Bay.
g) Research and assist localities in redesigning and adopting model conservation/cluster development ordinances (forestland/high conservation value (HCV) retention) that instill a market appropriate component to foster conservation site planning and promote the use of incentive zoning to encourage HCV forest retention.
h) Examine rural development growth areas, develop volume (stormwater) credit programs, and the payment of fees to support regional best management practices.
i) Work with localities to structure extended term Land Use Valuation Tax (LUVT) assessments for timber lands and term easements so that shorter-term water quality impacts can be calculated in and credited through the Bay TMDL model.
PENNSYLVANIA Due to Pennsylvania’s late entry into the Healthy Waters/Forest Retention project in Phase 2, as well as the aforementioned challenges in getting results from Pennsylvania’s Phase I peer-to-peer evaluation of the economic and environmental benefits of forest retention as a watershed management practice, the DCNR staff have not been able to garner as much feedback from municipalities and other stakeholders as the Virginia project team. Nevertheless, PA DCNR staff did

HEALTHY WATERS/FOREST RETENTION STUDY FINAL REPORT: JUNE 30, 2017 129
meet with quite a few local government personnel in the early months of the project, and 2 public meetings were held at locations in Cumberland and York counties (as well as at two other professional conference meetings) to provide interested persons an opportunity to learn about the project and provide feedback and suggestions. The notes and comment cards from these sessions are summarized in Appendix D. Provided below are ideas of where Pennsylvania’s planning and conservation tools and incentives could be enhanced to foster more forest conservation.
1. Promoting Forest Retention via Incentives for MS4 Communities Because MS4 communities must meet specific TMDLs, they are “low hanging fruit” for conservation efforts that would reduce nutrient loading. Keeping forests in place helps meet TMDLs and is much less expensive than building grey infrastructure. Trees are currently being considered as BMPs to meet TMDLs; however, the current BMPs focus on tree planting instead of forest retention. Communities are looking for affordable ways to meet TMDL requirements, and are eager to have forest retention considered as a BMP within the Bay model. Future phases of this project can be used to explore the potential of forest retention as a BMP.

HEALTHY WATERS/FOREST RETENTION STUDY FINAL REPORT: JUNE 30, 2017 130
IMPLEMENTATION PATH(S) Virginia and Pennsylvania have numerous planning, fiscal, conservation and other tools to promote forest retention and healthy waters. Like other complicated public policy decisions, it comes down to laying out a path toward a goal, educating the public and elected officials as to why the goal is worthwhile, reaching consensus and then doing it. A principal goal of this report has been to enable that decision process to reach its conclusion. Setting out down the path will be worth the effort. Through the modeling study findings in both Commonwealths, this project has demonstrated the compelling cost-savings of a forest conservation and retention approach for managing stormwater and other water quality impacts. For Pennsylvania, more discovery efforts to identify constraints and opportunities to advance the forest retention agenda are needed. This is evidenced by the Pennsylvania team recommendations:
PENNSYLVANIA (PHASE II) 1. DCNR should proceed with further project phases. The objective should be to work closely with
municipal governments, other State departments, and non-governmental organizations to take a detailed look at municipal ordinances, land management, and land development practices. The next phase should involve working directly with municipal governments using the toolbox ideas identified in this report to empower local leaders and assist them in retaining forestland in their communities. Identifying and promoting existing effective local ordinances and policies are vital to this effort.
2. A phase III effort in Pennsylvania should focus on evaluating forest loss patterns at the municipal scale to determine if there are forest loss “hot spots”. In communities where forest loss is predicted, additional investments should be considered to determine the characteristics and policies resulting in that trend.
3. DCNR could partner with the Pennsylvania Department of Economic and Community Development (DECD) and the PA State Association of Township Supervisors (PSATS) to reach out to municipalities to understand their planning, zoning, subdivision and planned development ordinances and to introduce them to the benefits of forest retention strategies.
VIRGINIA Provided below is an outline for implementation guided by a driving goal to efficiently conserve high conservation value forestland to help improve and protect the water quality of the Chesapeake Bay and its tributaries, and preserve the most ecologically-valuable landscapes for future generations to appreciate and enjoy. This outline is intended to help guide public officials, forest landowners and other interested parties in Virginia, Pennsylvania and anywhere else that places priority on retaining forest resources to sustain healthy waters for future generations.
Embarking on a Precision Conservation Strategy for Virginia and Pennsylvania 1. Following an Existing Natural Resource Assessment Plan
To be efficient and have greater value, locality-based initiatives designed to address land and forest conservation should, where practical, use existing State, regional or watershed, or local plan or

HEALTHY WATERS/FOREST RETENTION STUDY FINAL REPORT: JUNE 30, 2017 131
mapping resources which may have identified high conservation value forests, wetlands, and other green infrastructure network assets. Moreover, local efforts should become familiar with the Plans and environmental conservation efforts as generated by neighboring localities. The following is a list of resources which are currently available.
a) Existing Resources (VA): • Virginia DOF, High Conservation Value (HCV) Forest Land Map (2010) • Virginia DOF, Urban Tree Canopy Studies • Virginia DCR, Va. Natural Lands Assessment (“VNLA”), Natural Heritage data • Virginia DEQ, Coastal GEMS environmental GIS portal • Regional Green Infrastructure (GI) Plans/Maps (e.g. PDs 8, 9, 16, 15, 19 and 23) • Local Comprehensive Plans, Environmental/Open Space Elements • Inventory of lands under Agricultural/Forestal Districts, Forest Land Use, Federal, State
and Local parklands, conservation and open space easements b) Existing Resources (PA):
• DCNR GIS archive of spatial data • State and Local Greenways Plans
c) New Resources: update existing or build new GI/HCV maps, using: • 2013 High Resolution Land Cover imagery • LIDAR data • ESRI, free Green Infrastructure Initiative (see: http://www.esri.com/about-
esri/greeninfrastructure)
2. Assess current local planning efforts and policies a) Comprehensive Plan –
i. Do you have an Environmental Assessment Chapter in your Comprehensive Plan? ii. If so, are your land use ordinances (zoning and subdivision, etc.) carrying out the
environmental public policy directives featured in the Plan? • Zoning & Planned Development Ordinances: do they place a premium on forest and
tree retention in defining the standards for development? iii. Do your land use ordinances (zoning and subdivision, etc.) place a premium on open
space and forest conservation? iv. Does your Plan place a value on open space conservation, especially high conservation
value forest land and wetlands? v. Does your Plan provide or permit the establishment of sending and receiving zones to
guide TDR and PDR actions? vi. Does your Plan follow your public water and sewer master plans, and do these plans
guide development where the Comp Plan proposes urban growth? In other words is there clear linkage from the Comp Plan to these utility master plans?
vii. Does your Plan identify and define where urban growth or urban service areas will be located?

HEALTHY WATERS/FOREST RETENTION STUDY FINAL REPORT: JUNE 30, 2017 132
b) Land Development Ordinances-
i. Consider creating a forest retention overlay zoning district, using defined VDOF HCV map and/or regional or local green infrastructure plans, to set development standards, which might include the limited application of a tree protection ordinance as allowed under § 15.2-961
ii. Use the overlay district as the area for TDR and PDR application. iii. Natural Resource Protection Overlay Ordinance (e.g. Virginia’s Chesapeake Bay RPAs)
• How do established RPA areas coincide with defined forest and woody wetland and other wetland (e.g. NWI) boundaries?
• Consider possible amendment of RPA boundaries based on hi-resolution land cover, and LIDAR data to better delineate RPA.
iv. TDR & PDR Ordinance(s) – • Has your community developed and/or adopted either a TDR or PDR ordinance? • Do these ordinances define HCV forestland or green infrastructure cores and
corridors as sending zones, allowing landowners to sell-off and retire (PDR) or sell-off and transfer (TDR) the by-right development units allowed under current zoning?
• Has your community considered holding easements or have you identified a local land trust or other entity to work with to help implement your TDR/PDR programs?
• Do these ordinances define Urban Development Areas where developers are encouraged to “park” their transferred development rights?
v. Tree Protection Ordinance – • Does the community have a tree protection ordinance? • If one exists, is it followed and enforced? • Does regionalization of a local tree bank program make sense?
3. Role of Soil & Water Conservation Districts (VA) & County Conservation Districts (PA)
a) Coordination with local governments and regional planning district commissions to report progress and coordinate efforts
b) Joint adoption of local/regional conservation/forest retention/green infrastructure plans
c) Work with Farm Bureau, farm and forest landowners in understanding opportunities behind public conservation/forest retention efforts.
d) Work with Departments of Forestry to provide technical and monitoring assistance to the farm community that is interested in establishing and maintaining riparian forested buffers on their owned or leased land.
e) Collaborate locally & regionally to pursue: i. Increased funding requests of State WQIF funds to facilitate:
• Promotion of TDR program with forest landowners • Targeting forest cost-share efforts

HEALTHY WATERS/FOREST RETENTION STUDY FINAL REPORT: JUNE 30, 2017 133
• Prioritization of riparian forest buffer protection and restoration, stream restoration and livestock exclusion
ii. Establish forest management programs to advise forest landowners on available BMPs for forests • Set up local certification agent(s) to assist with development of forest management
plans • Work with local and regional planning commissions to revise Green Infrastructure
plans where available to consider carbon stock inventory and nutrient credit offset potential
• Establish regional professional forester position as regional technical resource to conduct forest inventories and project forest growth
• Identify Chicago Climate Exchange (CCX)-approved auditor to verify estimated sequestration credit levels
• Work with VDEQ to enroll eligible forestland properties in Virginia’s nutrient credit trading program
iii. Coordinate with Virginia’s Agricultural/Forestal District guidelines to develop model sequestration trade contract to assure forest sustainability for a minimum 15 year term (although 20 year more ideal for TMDL credit benefit)
4. Coordinated State & Local Policy and Administrative Action Agenda
a) Effected State agencies, SWCDs (VA)/CCDs (PA), Commissioners of Revenue/Local tax assessors and land trust organizations research and develop a multi-purpose annual forest re-certification process that provides the necessary continued use validation for conservation easement holders, lands under use valuation taxation programs, agricultural/forestal district designation and either carbon sequestration or non-point nutrient credit trading programs.
b) Effected State agencies, SWCDs (VA)/CCDs (PA), Commissioners of Revenue (VA)/Local Tax Assessors (PA) and land trust organizations evaluate and make recommendations on how strategic State and local investments in technical assistance and elected and appointed official and staff training programs can facilitate successful carbon sequestration and non-point nutrient trading programs which could be leveraged to foster voluntary forest and wetland landowners participation in these emerging natural capital markets, thereby promoting high conservation value forest and wetland conservation and enhancement.
c) Local government Comprehensive Plan, Zoning and Subdivision/PUD ordinance review and amendment to recognize the following:
i. Policy statements supporting protection of high conservation value forestland and green infrastructure network.
ii. Development and adoption of PDR and TDR ordinances in support of HCV forest conservation.
iii. Environmental assessment of community to identify areas of high priority streambank restoration, and riparian forest buffer protection and restoration

HEALTHY WATERS/FOREST RETENTION STUDY FINAL REPORT: JUNE 30, 2017 134
iv. Designation of urban development areas appropriate to receive development rights purchased and transferred to increase density in designated areas.
v. Enactment of a local tree protection ordinance under amended authority for water quality enhancement under
vi. Enhancement of PUD district requirements under Zoning Ordinance to promote and incentivize forest conservation and natural wetland areas in lieu of other constructed stormwater BMPs.
vii. Review of requirements in Subdivision Ordinance to encourage conservation subdivision design by providing density bonuses for protecting HCV forest and wetlands and open space, adding requirements for: • tree inventory and tree protection plan submitted with subdivision site plan. • Add soil analysis and submittal of soil amendment plan which specifies use of
organic compost material (e.g. leaves, food waste, animal manure and other natural substances) as soil enhancement to a depth recommended based on original soil type and site slope anywhere that turf grass will be added to the man-made landscape. This requirement will dramatically reduce future demand for lawn irrigation as well as the use synthetic fertilizers to sustain turf grass areas.
d) Collaboration between VDOT and localities and soil and water conservation districts to
identify and implement opportunities to handle stormwater run-off from State-maintained ROW in adjoining wetland areas, using VDOT stormwater conveyance ditches, under public or private ownership.
e) Amend regional, MPO-adopted long-range transportation plans to reflect local changes to by-right development through the implementation of TDR programs and designation, through local comprehensive plan amendments, of urban development areas as receiving zones for transferred development rights.
5. Virginia General Assembly Legislative Action Agenda a) Consider amendment of § 58.1-3233., paragraph 3 as follows or with the same effect:
“Determine further that real estate devoted to open-space use is (i) within an agricultural, a forestal, or an agricultural and forestal district entered into pursuant to Chapter 43 (§ 15.2-4300 et seq.) of Title 15.2, or (ii) subject to a recorded perpetual (or term) easement that is held by a public body, and promotes the open-space (or forest) use classification, as defined in § 58.1-3230, or (iii) subject to a recorded commitment entered into by the landowners with the local governing body, or its authorized designee, not to change the use to a non-qualifying use for a time period stated in the commitment of not less than four five years nor more than 10 (20) years.” Existing districts of lesser duration would be subject to the revised minimum and maximum duration terms upon application for renewal of the district.
b) Consider amendment of § 10.1-1801.1. Open Space Lands Preservation Trust Fund to allow for
providing financial assistance for term easements of no less than 20 years.

HEALTHY WATERS/FOREST RETENTION STUDY FINAL REPORT: JUNE 30, 2017 135
c) Consider amendment of “§ 10.1-2202.2. Preservation Easement Fund established; uses.” as
follows or with the same effect:
“…Moneys in the Fund shall be used solely for the purposes of: (i) supporting and promoting a broad-based easement program and (ii) providing grants in accordance with this section to persons who convey a perpetual easement or term easement for a duration of no less than 20 years to the Board pursuant to the Open-Space Land Act (§ 10.1-1700 et seq.) and, if applicable, the Virginia Conservation Easement Act (§ 10.1-1009 et seq.) for the purposes of preserving real property which is important for its historical, ecological, architectural or archaeological aspects.”
d) Consider amendment of “§ 10.1-651. Establishment and administration of Program” as follows
or with the same effect: “The Stream Restoration Assistance Program is continued to protect the natural streams of the Commonwealth. The Program shall aid in the stabilization and protection of natural streams which have been severely damaged by naturally occurring flooding events or which have been identified as deficient in riparian forest buffer in a resource management plan prepared pursuant to § 10.1-104.8 by the soil and water conservation district or by a locality operating a VSMP pursuant to § 62.1-44.15:27. ….”.
e) Consider amendment of “§ 10.1-652. Program applicability.” as follows or with the same effect:
“The Stream Restoration Assistance Program shall apply only to natural non-tidal streams which have been damaged as a result of naturally occurring flooding events or which have been identified as deficient in riparian forest buffer in a resource management plan prepared pursuant to § 10.1-104.8 by the soil and water conservation district or by a locality operating a VSMP pursuant to § 62.1-44.15:27.….”
f) Consider amendment of “§ 62.1-44.19:12. Legislative findings and purposes.” as follows or
with the same effect: “The 2000 Chesapeake Bay Agreement and related multistate cooperative and regulatory initiatives (i) establish allocations for nitrogen and phosphorus delivered to the Chesapeake Bay and its tidal tributaries to meet applicable water quality standards and (ii) place caps on the loads of these nutrients that may be discharged into the Chesapeake Bay watershed. These initiatives will require public and private point and non-point source dischargers of nitrogen and phosphorus to achieve significant additional reductions of these nutrients to meet the cap load allocations under the Commonwealth’s Phase III Watershed Implementation Plan for 2025. The General Assembly finds and determines that adoption and utilization of a watershed general permit and market-based point and non-point source nutrient credit trading program between and among localities, soil and

HEALTHY WATERS/FOREST RETENTION STUDY FINAL REPORT: JUNE 30, 2017 136
water conservation districts, landowners and other interested parties within the Chesapeake Bay watershed area of the Commonwealth will assist in (a) meeting these cap load allocations cost-effectively and as soon as possible in keeping with the 2010 timeline and objectives of the Chesapeake 2000 and subsequent Bay Agreement(s), (b) accommodating continued growth and economic development in the Chesapeake Bay watershed, and (c) providing a foundation for establishing market-based incentives to help achieve the Chesapeake Bay Program's non-point source reduction goals.”
g) Consider amendment of “§ 62.1-44.19:20 Nutrient Credit Certification” as follows or with the
same effect: “A. The Board may adopt regulations for the purpose of establishing procedures for the certification of point and non-point source nutrient credits except that no certification shall be required for point source nitrogen and point source phosphorus credits generated by point sources regulated under the Watershed General Virginia Pollutant Discharge Elimination System Permit issued pursuant to § 62.1-44.19:14. The Board shall adopt regulations for the purpose of establishing procedures for the certification of non-point source nutrient credits provided such credits are generated, traded and applied solely within the Chesapeake Bay watershed area of the Commonwealth.
h) Consider amendment of Ҥ15.2-961.1 Conservation of trees during land development process
in localities belonging to a nonattainment area for air quality standards” as follows or with the same effect:
“§15.2-961.1 Conservation of trees during land development process in localities belonging to a nonattainment area for air and water quality standards within the Chesapeake Bay watershed”… “B. Any locality within Planning District 8 that meets the population density criteria of subsection A of § 15.2-961 and is classified as an eight-hour nonattainment area for ozone under the federal Clean Air Act and Amendments of 1990, in effect as of July 1, 2008 the Chesapeake Bay watershed, may adopt an ordinance providing for the conservation of trees during the land development process pursuant to the provisions of this section. In no event shall any local tree conservation ordinance adopted pursuant to this section also impose the tree replacement provisions of § 15.2-961.”
Amend paragraph G.1 as follows or with the same effect:
“1. A tree canopy bank may be established in order for the locality to facilitate off-site tree preservation, tree planting, stream bank, and riparian restoration projects. Banking efforts shall provide tree canopy that is preserved either in perpetuity or a minimum term of 20 years through conservation or term easements, deed restrictions, or similar protective

HEALTHY WATERS/FOREST RETENTION STUDY FINAL REPORT: JUNE 30, 2017 137
mechanisms acceptable to the locality or regional tree bank entity created pursuant to paragraph 3 below. Projects used in off-site banking will meet the same ordinance standards established for on-site tree canopy; however, the locality or regional tree bank entity created pursuant to paragraph 3 below may also require the submission of five-year management plans and funds to ensure the execution of maintenance and management obligations identified in those plans. Any such bank off-site projects shall occur within the same nonattainment the same major watershed basin of the Chesapeake Bay area in which the locality approving the tree banking is situated. Inter-basin off-site projects may be implemented where a regional tree bank entity deems it most advantageous to further local and regional tree canopy and forest retention program objectives.
Add Paragraph G, item 3 as follows or with the same effect:
3. Any ordinance adopted under the authority granted under this section may provide for the establishment of a regional tree bank entity which is classified as a non-profit entity under § 501(c)(3) of the Internal Revenue Code or a program operated under one or more local soil and water conservation districts or planning district commissions supported by any of the participating localities. Any such regional tree bank entity so established may receive and accept financial contributions made by developers that cannot meet full canopy requirements of a local ordinance on-site and shall use said contributions to facilitate off-site tree and forest retention, tree planting, stream bank and riparian forest buffer restoration projects in a manner supportive of local and regional urban tree canopy and forest conservation and enhancement objectives.
Add Paragraph G, item 4 as follows or with the same effect:
Any local ordinance adopted under the authority granted under this section to designate a regional tree bank entity shall make said regional tree bank eligible to participate in Virginia’s nutrient credit trading program established under § §62.1-44.19:12 and be subject to the same certification standards.
i) Consider amendment of “§ 15.2-961. Replacement of trees during development process in certain localities.”
“A. Any locality with a population density of at least 75 persons per square mile as well as all localities in the Chesapeake Bay watershed may adopt an ordinance providing for the planting and replacement of trees during the development process pursuant to the provisions of this section. Population density shall be based upon the latest population estimates of the Cooper Center for Public Service of the University of Virginia.”

HEALTHY WATERS/FOREST RETENTION STUDY FINAL REPORT: JUNE 30, 2017 138
Note: the 75 persons per sq. mile density threshold currently eliminates the following cities and counties in Virginia’s Chesapeake Bay watershed, based on 2016 Cooper Center population estimates (see following table).
Source: Compiled by Regional Decision Systems from 2016 Local Population Estimates produced by the UVa., Weldon Cooper Center and areal data for Virginia city and county polygons from Caliper, Maptitude GIS.
j) Consider amendment of “§ 58.1-512.1. Determination of fair market value of donation” as
follows or with same effect:
“C. The fair market value of any property with respect to a qualified donation shall not exceed the value for the highest and best use (i) that is consistent with existing zoning requirements; (ii) for which the property was adaptable and needed or likely to be needed in the reasonably near future in the immediate area in which the property is located; (iii) that considers factors such as, by way of illustration and not limitation, slopes, flood plains, and soil conditions of the property; and (iv) the ecosystem service value of the land with consideration of carbon sequestration and nutrient credit trading values of any forest or wetland on the property; (v) whether the land is under a permanent conservation easement; and (iv vi) for which existing roads serving the property are sufficient to support commercial or residential development in the event that is the highest and best use proposed for the property. Any appraisal submitted in support of an application for a credit under this article shall include an affidavit by the appraiser that to the best of his knowledge and belief the valuation complies with this section and shall set forth in the affidavit or refer to the specific portion of the appraisal setting forth the facts and basis for this knowledge and belief.
k) Consider amendment of Ҥ 58.1-512. Land preservation tax credits for individuals and
corporations” as follows or with the same effect:
A. For taxable years beginning on or after January 1, 2000, there shall be allowed as a credit against the tax liability imposed by §§ 58.1-320 and 58.1-400, an amount equal to 50 percent of the fair market value of any land or
FIPS Code Locality 2010
Census July 1, 2016
Estimate Square Miles
2016 Population
Density 1 Accomack County 33,164 33,330 449.5 74.15
109 Louisa County 33,153 34,316 496.3 69.14 133 Northumberland County 12,330 12,089 191.3 63.20 101 King William County 15,935 16,333 273.94 59.62 131 Northampton County 12,389 12,139 211.61 57.36
33 Caroline County 28,545 29,704 527.51 56.31 53 Dinwiddie County 28,001 28,363 503.72 56.31
159 Richmond County 9,254 9,029 191.49 47.15 57 Essex County 11,151 10,792 257.12 41.97
113 Madison County 13,308 13,099 320.68 40.85 36 Charles City County 7,256 7,253 182.82 39.67
125 Nelson County 15,020 14,835 470.86 31.51 157 Rappahannock County 7,373 7,308 266.23 27.45 181 Surry County 7,058 6,743 278.95 24.17 183 Sussex County 12,087 11,745 490.22 23.96
97 King and Queen County 6,945 7,156 315.14 22.71

HEALTHY WATERS/FOREST RETENTION STUDY FINAL REPORT: JUNE 30, 2017 139
interest in land located in Virginia which is conveyed for the purpose of agricultural and forestal use, open space, natural resource, and/or biodiversity conservation, or land, agricultural, watershed and/or historic preservation, as an unconditional donation by the landowner/taxpayer to a public or private conservation agency eligible to hold such land and interests therein for conservation or preservation purposes. For such conveyances made on or after January 1, 2007, the tax credit shall be 40 percent of the fair market value of the land or interest in land so conveyed. Said market valuation of the land shall take into consideration the value of ecosystems service functions performed by the land and associated water quality benefits derived from the natural ecosystem services performed by forest and wetlands on the property.
l) Consider amendment of Ҥ 58.1-3237. Change in use or zoning of real estate assessed
under ordinance; roll-back taxes.” Discussion: In the event that a property participates in carbon sequestration or nutrient trading credit programs that generate additional annual income for the landowner, this change in “use” could be reported through the local annual re-certification or re-validation process and SLEAC-recommended valuations should consider this additional use value in the computation of recommended values, particularly for forested lands. The locality may be authorized to apply a roll-back tax on the increased value derived from the landowner’s participation in nutrient or carbon sequestration trading programs. Such reporting of changes in use would probably also require a companion amendment to “§ 58.1-3238. Failure to report change in use; misstatements in applications”
m) Consider amendment of Ҥ 58.1-3239. State Land Evaluation Advisory Committee continued as
State Land Evaluation Advisory Council; membership; duties; ordinances to be filed with Council.” as follows or with the same effect:
“….The Advisory Council, in determining such ranges of values, shall base the determination on productive earning power to be determined by capitalization of warranted cash rents or by the capitalization of incomes of like real estate in the locality or a reasonable area of the locality. Moreover, the Advisory Council shall consider the added use value to forestland and wetlands from participating in nutrient and carbon sequestration credit trading markets.
6. Coordinated Chesapeake Bay Partnership Policy and Administrative Action Agenda Direct the Water Quality Goal Implementation Team, the Healthy Watersheds Goal Implementation Team, the Forestry Workgroup, the Land Use Planning Workgroup and other teams and workgroups as required to begin working with the Chesapeake Bay jurisdictions on how a forestland retention TMDL credit would be created and structured and what type of monitoring infrastructure would be required to support its implementation. The goal should be to have a recommendation available for consideration by the Chesapeake Bay Executive Council in time to allow implementation in the next update of the TMDL model.

HEALTHY WATERS/FOREST RETENTION STUDY FINAL REPORT: JUNE 30, 2017 140
APPENDICES APPENDIX A-1:
VIRGINIA LOCALITY-SPECIFIC TMDL RESULTS (Phase I)
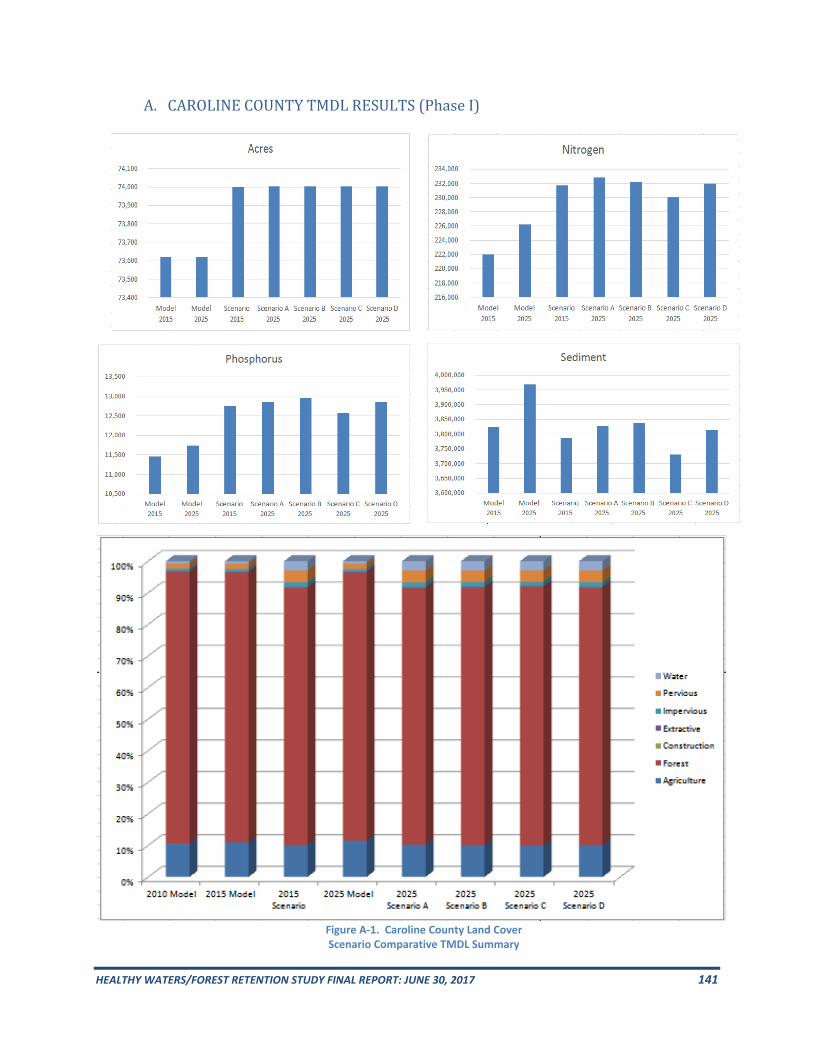
HEALTHY WATERS/FOREST RETENTION STUDY FINAL REPORT: JUNE 30, 2017 141
A. CAROLINE COUNTY TMDL RESULTS (Phase I)
Figure A-1. Caroline County Land Cover Scenario Comparative TMDL Summary

HEALTHY WATERS/FOREST RETENTION STUDY FINAL REPORT: JUNE 30, 2017 142
B. KING GEORGE COUNTY TMDL RESULTS (Phase I)
Figure A-2. King George County Land Cover Scenario Comparative TMDL Summary

HEALTHY WATERS/FOREST RETENTION STUDY FINAL REPORT: JUNE 30, 2017 143
C. SPOTSYLVANIA COUNTY TMDL RESULTS (Phase I)
Figure A-3. Spotsylvania County Land Cover Scenario Comparative TMDL Summary

HEALTHY WATERS/FOREST RETENTION STUDY FINAL REPORT: JUNE 30, 2017 144
D. STAFFORD COUNTY TMDL RESULTS (Phase I)
Figure A-4. Stafford County Land Cover Scenario Comparative TMDL Summary

HEALTHY WATERS/FOREST RETENTION STUDY FINAL REPORT: JUNE 30, 2017 145
E. CITY OF FREDERICKSBURG TMDL RESULTS (Phase I)
Figure A-5. City of Fredericksburg Land Cover Scenario Comparative TMDL Summary

HEALTHY WATERS/FOREST RETENTION STUDY FINAL REPORT: JUNE 30, 2017 146
Impact of Offsetting Loads Using BMPs
The results were further evaluated to estimate the load differential between the Scenario 2025 A: “Business as Usual/Decentralized Growth” and the Scenario C: “Greenprint/Forest Retention” Scenario. The result represents the load reduction that can be achieved by changing development patterns to retain more forest. Inversely, it is the load that would need to be offset through the implementation of additional BMPs if decentralized growth, with continued forest loss at historical rates of conversion to urban land covers, was allowed to continue through 2025.
Nitrogen Phosphorus SedimentCaroline
Scenario A 2025 232,874 12,847 3,828,179 Scenario C 2025 230,072 12,574 3,731,666
2,802 273 96,513 Spotsylvania
Scenario A 2025 349,411 32,394 41,115,038 Scenario C 2025 340,870 31,903 40,662,860
8,541 491 452,178 Stafford
Scenario A 2025 289,969 24,754 29,762,356 Scenario C 2025 279,452 23,323 27,834,942
10,516 1,431 1,927,414 King George
Scenario A 2025 127,050 14,450 2,650,778 Scenario C 2025 120,351 13,357 2,414,850
6,699 1,093 235,928 Fredericksburg
Scenario A 2025 64,671 5,039 4,275,837 Scenario C 2025 62,972 4,800 4,054,348
1,700 239 221,489
Load Differential between Scenarios A and C

HEALTHY WATERS/FOREST RETENTION STUDY FINAL REPORT: JUNE 30, 2017 147
Economic Value of Land Conservation BMPs in Pilot Area
BayFAST, and the BMP cost estimates in the tool, were then used to estimate the cost of implementing those additional BMPs. The exact mix of BMPs that might actually be used was impossible to forecast, so a standard mix consisting of wet ponds, extended dry detention ponds, and stream restoration was used for all localities. The BayFAST default cost values were used to estimate the costs.
BMPs Needed to Offset Loads
Caroline
BMPs Needed to Offset Loads Extent Units
Wet Ponds and Wetlands 1140 Acres Treated
Dry Extended Detention Ponds 1140 Acres Treated
Urban Stream Restoration 5700 Feet
Spotsylvania
BMPs Needed to Offset Loads Extent Units
Wet Ponds and Wetlands 2485 Acres Treated
Dry Extended Detention Ponds 2485 Acres Treated
Urban Stream Restoration 12450 Feet
Stafford
BMPs Needed to Offset Loads Extent Units
Wet Ponds and Wetlands 2765 Acres Treated
Dry Extended Detention Ponds 2765 Acres Treated
Urban Stream Restoration 13850 Feet
King George
BMPs Needed to Offset Loads Extent Units
Wet Ponds and Wetlands 2010 Acres Treated
Dry Extended Detention Ponds 2010 Acres Treated
Urban Stream Restoration 10025 Feet
Fredericksburg
BMPs Needed to Offset Loads Extent Units
Wet Ponds and Wetlands 325 Acres Treated
Dry Extended Detention Ponds 325 Acres Treated
Urban Stream Restoration 1650 Feet
BayFAST Installation Cost Estimates BMP Full Name Capital Capital Unit Opportunity Opportunity Unit Urban Stream Restoration 645 $/feet 0 $/feet/year Wet Ponds and Wetlands 4556 $/acres treated 523 $/acre treated Dry Extended Detention Ponds 4223 $/acres treated 1309 $/acre treated
BMPs Needed to Offset Loads by Locality
BayFAST BMP Installation Cost Estimates

HEALTHY WATERS/FOREST RETENTION STUDY FINAL REPORT: JUNE 30, 2017 148
BayFAST default values were also used to estimate the recurring annual operations and maintenance costs for each BMP.
BayFAST O&M Cost Estimates BMP Full Name OandM OandMUnit Urban Stream Restoration 9 $/feet/year Wet Ponds and Wetlands 65 $/acre treated/year Dry Extended Detention Ponds 56 $/acre treated/year
The resulting cost estimates by locality to offset the additional loads if decentralized growth (Scenario A) was allowed to continue through 2025 are summarized in the table below.
BMP Costs Caroline
Install Costs $ 15,773,040 Annual Maintenance $ 189,240
Spotsylvania Install Costs $ 34,398,585 Annual Maintenance $ 412,735
Stafford Install Costs $ 38,272,665 Annual Maintenance $ 459,215
King George Install Costs $ 27,794,235 Annual Maintenance $ 333,435
FredericksburgInstall Costs $ 4,512,825 Annual Maintenance $ 54,175
BayFAST BMP Annual O&M Cost Estimates
Projected Offset Costs by Locality Under Decentralized Growth through 2025

HEALTHY WATERS/FOREST RETENTION STUDY FINAL REPORT: JUNE 30, 2017 149
APPENDIX A-2: Detailed Land Cover Data (Phase 1) Land Cover Acreage by County Portion, By Scenario
Locality, Landriversegment & Land Cover Estimates
2025 2025 2025 2025 2015 Estimate Scenario A Scenario B Scenario C Scenario D
Caroline Co. Study Area Total 74,002 74,002 74,002 74,002 74,002 RPPTF 74,002 74,002 74,002 74,002 74,002
A51033RL5_6070_0000 25,510 25,510 25,510 25,510 25,510Agriculture 7,368 7,454 7,368 7,296 7,368Forest 13,016 12,887 13,016 13,235 13,016Urban Runoff 2,973 3,017 2,974 2,827 2,974
Construction 0 0 0 0 0Extractive 153 164 249 153 201Impervious 626 634 626 591 626Pervious 2,194 2,220 2,099 2,072 2,147
Water 2,152 2,152 2,152 2,152 2,152F51033RL5_6070_0000 48,492 48,492 48,492 48,492 48,492
Agriculture 89 89 89 82 89Forest 47,301 47,301 47,301 47,403 47,301Urban Runoff 1,099 1,099 1,099 1,004 1,099
Construction 0 0 0 0 0Extractive 0 0 0 0 0Impervious 486 486 486 445 486Pervious 613 613 613 560 613
Water 3 3 3 3 3Caroline County Study Area 74,002 74,002 74,002 74,002 74,002
Agriculture 7,457 7,543 7,457 7,378 7,457Forest 60,317 60,188 60,317 60,638 60,317Urban Runoff 4,072 4,116 4,073 3,831 4,073
Construction 0 0 0 0 0Extractive 153 164 249 153 201Impervious 1,112 1,120 1,112 1,036 1,112Pervious 2,807 2,833 2,712 2,632 2,760
Water 2,155 2,155 2,155 2,155 2,155

HEALTHY WATERS/FOREST RETENTION STUDY FINAL REPORT: JUNE 30, 2017 150
Land Cover Acreage by County Portion, By Scenario
Locality, Landriversegment & Land Cover Estimates
2015 Estimate
2025 2025 2025 2025
Scenario A Scenario B Scenario C Scenario D King George Co. Study Area Total 43,017 43,015 43,015 43,015 43,015
RPPTF 43,017 43,015 43,015 43,015 43,015A51099RL5_6070_0000 42,577 42,577 42,577 42,577 42,577
Agriculture 11,503 5,131 11,224 4,783 11,364Forest 27,037 32,178 26,982 32,994 27,009Urban Runoff 3,639 4,871 3,973 4,402 3,806
Construction 26 26 60 24 43Extractive 417 467 417 435 417Impervious 733 928 824 865 779Pervious 2,462 3,450 2,671 3,216 2,567
Water 398 398 398 398 398F51099RL5_6070_0000 440 438 438 440 438
Agriculture 74 74 74 30 74Forest 334 333 333 379 333Urban Runoff 0 0 0 0 0
Construction 0 0 0 0 0Extractive 0 0 0 0 0Impervious 0 0 0 0 0Pervious 0 0 0 0 0
Water 31 31 31 31 31King George County Study Area Total 43,017 43,015 43,015 43,015 43,015
Agriculture 11,577 5,205 11,298 4,813 11,438Forest 27,371 32,511 27,315 33,373 27,342Urban Runoff 3,639 4,871 3,973 4,402 3,806
Construction 26 26 60 24 43Extractive 417 467 417 435 417Impervious 733 928 824 865 779Pervious 2,462 3,450 2,671 3,216 2,567
Water 429 429 429 429 429

HEALTHY WATERS/FOREST RETENTION STUDY FINAL REPORT: JUNE 30, 2017 151
Land Cover Acreage by County Portion, By Scenario
Locality, Landriversegment & Land Cover Estimates
2015 Estimate
2025 2025 2025 2025 Scenario A Scenario B Scenario C Scenario D
Spotsylvania Co. Study Area Portion Total 44,406 44,406 44,406 44,406 44,405
RPPTF 44,406 44,406 44,406 44,406 44,405A51177RL5_6070_0000 32,371 32,371 32,372 32,371 32,370
Agriculture 2,602 1,884 2,373 1,824 2,487Forest 11,647 10,549 10,799 11,235 11,223Urban Runoff 17,840 19,655 18,905 19,030 18,372
Construction 131 78 39 76 85Extractive 0 0 0 0 0Impervious 5,859 6,465 6,559 6,260 6,209Pervious 11,850 13,112 12,307 12,694 12,078
Water 282 282 295 282 288A51177RU4_6040_6030 12,035 12,035 12,034 12,035 12,035
Agriculture 593 568 411 359 502Forest 7,498 6,362 6,991 6,924 7,245Urban Runoff 3,782 4,943 4,468 4,590 4,125
Construction 0 19 0 0 0Extractive 0 0 0 0 0Impervious 795 279 1,083 886 939Pervious 2,987 4,645 3,385 3,704 3,186
Water 162 162 164 162 163A51177RU5_6030_0001 12,527 12,527 12,527 12,527 12,527
Agriculture 608 395 608 376 608Forest 7,270 6,272 7,225 6,567 7,248Urban Runoff 4,485 5,696 4,527 5,420 4,506
Construction 4 0 0 2 0Extractive 0 0 0 0 0Impervious 1,237 1,506 1,267 1,430 1,254Pervious 3,244 4,190 3,260 3,989 3,252
Water 164 164 167 164 165F51177RL5_6070_0000 1,249 1,249 1,249 1,249 1,250
Agriculture 125 125 125 83 126Forest 1,089 1,089 1,089 1,133 1,089Urban Runoff 35 35 35 33 35
Construction 0 0 0 0 0Extractive 0 0 0 0 0Impervious 13 13 13 12 13Pervious 23 23 23 21 23
Water 0 0 0 0 0

HEALTHY WATERS/FOREST RETENTION STUDY FINAL REPORT: JUNE 30, 2017 152
Land Cover Acreage by County Portion, By Scenario (Spotsylvania County – continued)
Locality, Landriversegment & Land Cover Estimates
2015 Estimate
2025 2025 2025 2025 Scenario A Scenario B Scenario C Scenario D
F51177RU4_6040_6030 2,438 2,438 2,438 2,438 2,438Agriculture 489 489 489 353 489Forest 1,226 1,226 1,226 1,363 1,226Urban Runoff 663 663 663 663 663
Construction 0 0 0 0 0Extractive 0 0 0 0 0Impervious 94 94 94 94 94Pervious 569 569 569 569 569
Water 59 59 59 59 59F51177RU5_6030_0001 461 461 461 461 461
Agriculture 105 105 105 75 105Forest 313 313 313 335 313Urban Runoff 42 42 42 48 42
Construction 0 0 0 0 0Extractive 0 0 0 0 0Impervious 9 9 9 10 9Pervious 33 33 33 38 33
Water 2 2 2 2 2Spotsylvania County Study Area Total 61,081 61,080 61,081 61,080 61,081
Agriculture 4,522 3,566 4,111 3,070 4,317Forest 29,043 25,811 27,643 27,557 28,344Urban Runoff 26,847 31,034 28,640 29,784 27,743
Construction 135 97 39 78 85Extractive 0 0 0 0 0Impervious 8,007 8,366 9,025 8,692 8,518Pervious 18,706 22,572 19,577 21,015 19,141
Water 669 669 687 669 677

HEALTHY WATERS/FOREST RETENTION STUDY FINAL REPORT: JUNE 30, 2017 153
Land Cover Acreage by County Portion, By Scenario
Locality, Landriversegment & Land Cover Estimates
2015 Estimate
2025 2025 2025 2025 Scenario A Scenario B Scenario C Scenario D
Stafford Co. Study Area Total 52,159 52,158 52,159 52,158 52,159RPPTF 52,159 52,158 52,159 52,158 52,159
A51179RL5_6070_0000 27,486 27,486 27,486 27,486 27,486Agriculture 2,782 1,450 2,535 1,401 2,782Forest 9,818 9,545 9,666 10,146 9,818Urban Runoff 14,763 16,368 15,127 15,816 14,763
Construction 61 21 74 21 61Extractive 30 31 30 29 30Impervious 3,093 3,403 3,172 3,288 3,093Pervious 11,579 12,913 11,851 12,477 11,579
Water 123 123 158 123 123A51179RU4_5640_6030 13,157 13,157 13,157 13,157 13,158
Agriculture 358 187 343 172 354Forest 11,616 11,345 11,588 11,480 11610Urban Runoff 1,053 1,495 1,096 1,376 1,064
Construction 0 0 0 0 0Extractive 0 0 0 0 0Impervious 286 366 302 336 289Pervious 767 1,130 794 1,039 775
Water 130 130 130 130 130A51179RU5_6030_0001 11,433 11,433 11,434 11,433 11,433
Agriculture 472 231 430 215 438Forest 6,807 5,657 6,112 5,795 6,278Urban Runoff 4,063 4,835 4,182 4,713 4,007
Construction 0 0 53 0 26Extractive 0 0 0 0 0Impervious 893 1,080 1,089 1,006 963Pervious 3,170 3,980 3,040 3,706 3,018
Water 91 710 710 710 710F51179RL5_6070_0000 82 82 82 82 82
Agriculture 32 32 32 18 32Forest 37 37 37 50 37Urban Runoff 13 13 13 14 13
Construction 0 0 0 0 0Extractive 0 0 0 0 0Impervious 4 4 4 4 4Pervious 9 9 9 10 9
Water 0 0 0 0 0

HEALTHY WATERS/FOREST RETENTION STUDY FINAL REPORT: JUNE 30, 2017 154
Land Cover Acreage by County Portion, By Scenario (Stafford County – continued)
Locality, Landriversegment
& Land Cover Estimates 2015
Estimate 2025 2025 2025 2025
Scenario A Scenario B Scenario C Scenario D Stafford Co. Study Area Total 52,158 52,158 52,159 52,158 52,159
Agriculture 3,644 1,900 3,340 1,806 3,606Forest 28,278 26,584 27,403 27,471 27,743Urban Runoff 19,892 22,711 20,418 21,919 19,847
Construction 61 21 127 21 87Extractive 30 31 30 29 30Impervious 4,276 4,853 4,567 4,634 4,349Pervious 15,525 18,032 15,694 17,232 15,381
Water 344 963 998 963 963

HEALTHY WATERS/FOREST RETENTION STUDY FINAL REPORT: JUNE 30, 2017 155
Land Cover Acreage by County Portion, By Scenario Locality, Landriversegment
& Land Cover Estimates 2015
Estimate 2025 2025 2025 2025
Scenario A Scenario B Scenario C Scenario DCity of Fredericksburg 6,952 6,952 6,952 6,952 6,952RPPTF 6,952 6,952 6,952 6,952 6,952
A51630RL5_6070_0000 6,417 6,417 6,417 6,417 6,417Agriculture 61 61 38 67 50Forest 2,669 1,888 2,627 2,033 2,648Urban Runoff 3,571 4,353 3,635 4,202 3,603
Construction 0 0 0 0 0Extractive 0 0 0 0 0Impervious 2,208 2,691 2,319 2,632 2,264Pervious 1,363 1,662 1,315 1,627 1,339
Water 115 115 116 115 116A51630RU5_6030_0001 368 368 368 368 368
Agriculture 0 0 0 0 0Forest 253 219 253 236 253Urban Runoff 107 141 107 124 107
Construction 0 22 0 0 0Extractive 0 0 0 0 0Impervious 33 38 36 39 34Pervious 74 82 71 86 73
Water 8 8 8 8 8F51630RL5_6070_0000 167 167 167 167 167
Agriculture 0.0 0 0 0 0Forest 129.3 129 129 129 129Urban Runoff 37.6 38 38 38 38
Construction 0.0 0 0 0 0Extractive 0.0 0 0 0 0Impervious 4.5 4 4 4 4Pervious 33.1 33 33 33 33
Water 0.0 0 0 0 0Fredericksburg City Total 6,785 6,952 6,952 6,952 6,952
Agriculture 61 61 38 67 50Forest 2,922 2,236 3,010 2,398 3,030Urban Runoff 3,678 4,532 3,779 4,363 3,748
Construction 0 22 0 0 0Extractive 0 0 0 0 0Impervious 2,241 2,733 2,359 2,676 2,302Pervious 1,437 1,777 1,420 1,746 1,445
Water 123 123 125 123 124PD 16 Study Area Total 237,042 237,208 237,209 237,209 237,209
Agriculture 27,261 18,275 26,244 17,134 26,868Forest 147,931 147,330 145,688 151,437 146,776Urban Runoff 58,128 67,264 60,883 64,299 59,217
Construction 222 166 226 123 215Extractive 600 662 696 617 648Impervious 16,369 18,000 17,887 17,903 17,060Pervious 40,937 48,664 42,074 45,841 41,294
Water 3,720 4,339 4,394 4,339 4,348

HEALTHY WATERS/FOREST RETENTION STUDY FINAL REPORT: JUNE 30, 2017 156
APPENDIX B: SUMMARY OF LITERATURE REVIEW FINDINGS ON FORESTLAND ECOSYSTEM SERVICES APPLICABLE TO THE PROJECT ABSTRACT: Ecosystem services, such as provision of timber, sediment filtration, and aesthetics, are broadly defined as the benefits human populations derive, directly or indirectly, from ecosystem functions. Historically, in places such as the Chesapeake Bay Watershed, the benefits or values associated with these services have not been fully accounted for in resource decision making. Although the continued need to preserve undeveloped lands in the Bay Watershed has gained gradual recognition, emphasis by local jurisdictions and those responsible for achieving reductions in water pollution loads has focused on urban stormwater permitting, agricultural BMPs, and wastewater treatment. Consequently, less consideration both by local land-use decision makers and within the context of the TMDL modeling and accounting framework has been given to the role and value that natural landscapes have in protecting and improving water quality within the Chesapeake Bay Watershed. The literature review conducted by the VWRRC summarizes the scientific underpinnings of ecosystem services provided by forests relative to provision of ample, clean water and the key watershed attributes to consider in prioritizing conservation efforts. In addition, the report provides discussion on valuation of forest ecosystem services. This information is provided to inform further discussions regarding local land-use decisions and programmatic efforts to incentivize conservation of private forests within the Chesapeake Bay Watershed. The water-quality benefits, or watershed services, provided by forests stem from three primary processes in the form of flow management, sediment retention, and nutrient uptake. It is important to consider the specific conditions and attributes of forests that have the highest potential to provide watershed services when establishing values and payments for these services. For example, spatial location within the watershed is a critical consideration as to the degree to which a forest area will contribute to pollutant reductions. Forest soil characteristics are also a critical consideration because of the role of soil properties for controlling surface water infiltration, runoff, and nutrient and sediment retention in watersheds. In general, riparian forests located along stream corridors provide the most effective conditions for protecting water quality. With increased interest in quantifying and valuing ecosystem services, a considerable number of modeling efforts have been developed, each with varying degrees of complexity, specificity, scale, and policy objectives. Most ecosystem service models have been developed for large landscapes and broad applications, relying on simplified simulations of watershed processes and economic dynamics. The most appropriate application of these landscape-scale models are in the context of understanding trade-offs between ecosystem service decisions and comparing relative water-quality outcomes of watershed-scale land-use-change scenarios. Once it is recognized that resources such as forests have value in terms of providing ecosystem services, it is often desired to translate this information into incentives or payment for the continuation of those services.
A complete copy of the literature review conducted by the Water Resources Research Center at Virginia Tech follows as part of Appendix B (Pages 158 - 174).

HEALTHY WATERS/FOREST RETENTION STUDY FINAL REPORT: JUNE 30, 2017 157
Literature Review of Forestland Ecosystem Services
for Chesapeake Bay
Healthy Watersheds Forestry/TMDL (GIT-4)
Pilot Project
Neil Crescenti
Stephen H. Schoenholtz
Virginia Water Resources Research Center
Virginia Tech
8 October 2015

HEALTHY WATERS/FOREST RETENTION STUDY FINAL REPORT: June 30, 2017 158
Literature Review of Forestland Ecosystem Services
for Chesapeake Bay Healthy Watersheds Forestry/TMDL (GIT-4) Pilot Project
Introduction
Ecosystem services, such as provision of timber, sediment filtration, and aesthetics, are broadly defined as the
benefits human populations derive, directly or indirectly, from ecosystem functions (Costanza et al. 1997). Historically,
in places such as the Chesapeake Bay Watershed (CBW), the benefits or values associated with these services have not
been fully accounted for in resource decision making. As a result, the Chesapeake Bay has experienced significant
resource degradation and scarcity (Chesapeake Bay Commission 1987).
Initiation of the Chesapeake Bay Program in the early 1980s marked formal recognition of degraded resource
conditions within the Bay. Resulting agreements and restoration plans have begun to recognize the value of the CBW’s
ecosystem services and importance in achieving desired ecological, economic, and cultural conditions. As evidence,
conservation of undeveloped landscapes has been a priority strategy throughout the history of the Bay Program
(Chesapeake Bay Commission 2013).
In response to continued degradation of water quality, the U.S. Environmental Protection Agency (EPA), under
Presidential Executive Order, established a Total Maximum Daily Load (TMDL) in 2010, which set and assigned specific
pollutant-load reduction targets for sediment and nutrients to the Bay (EPA 2010). With establishment of a structured
TMDL implementation plan, some concern has been expressed regarding potential over-emphasis on a smaller suite
of remediation practices (Blankenship 2011). Although the Executive Order does call for the continued need to
preserve undeveloped lands in the Bay Watershed, emphasis by local jurisdictions and those responsible for achieving
reductions has focused on urban stormwater permitting, agricultural best management practices (BMPs), and
wastewater treatment infrastructure (Gilbert, et al. 2012). As a result, less consideration both by local land-use
decision makers and within the context of the TMDL modeling and accounting framework, has been given to the role
and value that natural landscapes have in protecting and improving water quality within the CBW (Gilbert et al 2012,
STAC 2012, Chesapeake Bay Program 2015a).

HEALTHY WATERS/FOREST RETENTION STUDY FINAL REPORT: JUNE 30, 2017 159
In 2012, at the request of the Maintain Healthy Watersheds Goal Implementation Team (GIT4 team), the Bay
Program’s Science and Technical Advisory Committee (STAC) convened a workshop to discuss whether sufficient
scientific information existed to support adjusting the Bay TMDL model nutrient and sediment processing rates
assigned to natural landscapes. Workshop participants came to a consensus that a “sufficient scientific basis exists”
and recommended several modifications to the Watershed Model as part of the 2017 Midpoint Assessment, including
new land use classifications and loading rates for such land classes (STAC 2012).
Of particular interest in the STAC discussions was the role of forests in reducing pollutant loads and therefore
enhancing water quality. The Chesapeake Bay Program Healthy Watersheds Goal Implementation Team funded the
current Healthy Watersheds Forest/TMDL project in Virginia to test and assess the water quality management role of
forests and determine the economic value of that ecosystem service benefit within the context of the Chesapeake Bay
TMDL. Specifically, the pilot study sponsored by the Virginia Departments of Forestry and Environmental Quality, The
Nature Conservancy, the Chesapeake Bay Commission, the Rappahannock River Basin Commission, the George
Washington Regional Commission and the Virginia Water Resources Center at Virginia Tech examines whether effects
of private forest conservation and new public policy action, along with requiring urban BMPs on all new development,
result in sufficient forecasted pollutant load reductions to meet required targets. An intended outcome is to explore
the potential of forestland conservation as a cost-effective “green” infrastructure alternative for local governments to
consider in-lieu of more traditional and costly “grey” infrastructure projects. In doing so, the implementation team
desires to bridge the gap between historical objectives of land conservation and the more structured water quality
goals of the Bay TMDL.
In support of the modeling efforts of the Healthy Watersheds Forest Retention Project, this report is intended
to provide the scientific underpinnings of ecosystem services provided by forests and the key watershed attributes to
consider in prioritizing conservation efforts. In addition, the report provides discussion on valuation of forest
ecosystem services. This information is provided to inform further discussions regarding local land-use decisions and
programmatic efforts to incentivize conservation of private forests within the CBW.

HEALTHY WATERS/FOREST RETENTION STUDY FINAL REPORT: JUNE 30, 2017 160
Attributes and Services
The water-quality benefits, or watershed services, provided by forests stem from three primary processes in
the form of flow management, sediment retention, and nutrient uptake (Todd 1993). Professional publications,
particularly those focused on payment for ecosystem service (PES) schemes often cite these watershed services
provided by forests in general terms, without details of specific, necessary conditions (Hanson et al. 2011, Barnes et al.
2010, Majanen et al. 2011). Although the academic literature has demonstrated these processes in various locations,
the universality of their application has also been questioned (Neary, et al. 2009, Johnson et al. 2012, Calder 2002, Lele
2009). Therefore in the context of establishing values and payments for service, it is important to consider the specific
conditions and attributes of forests that have the highest potential to provide watershed services.
Spatial location within the watershed is a critical consideration as to the degree to which a forest area will
contribute to pollutant reductions. Riparian forests have been noted to have the most potential for nutrient and
sediment filtration relative to upland forests (Lele 2009). However, because a forest is in a riparian location does not
mean it will abate nutrient and sediment loading to nearby watercourses (Johnson et al. 2012). Although upland
forests may occur in close proximity to stream channels in headwater streams, they also tend to have higher gradients
and erosion potential (Norton and Fisher 2000). Forests located along higher-order streams with low gradients tend
to have the greatest potential for erosion control and sediment retention given slow flow regimes and potential for
groundwater absorption (Anbumozhi et al. 2005). Furthermore, many studies have examined forests in relation to
their impacts on water quality at relatively small spatial scales. Although some inferences have been made regarding
the location of forests in a watershed with respect to impacts on watercourses, it is recognized that knowledge gaps
remain concerning the role of forests in determining the extent of connective hydrological and biogeochemical
processes in larger river basins (Lorz et al. 2007).
Forest soils are a critical component for infiltration and sediment retention in watersheds containing forest
cover. In a study of two coastal watersheds within the CBW, it was noted that soil characteristics can completely over-
ride landcover effects (Norton and Fischer 2000). Forest soils are important in both their ability to influence surface
flows or runoff, and their ability to filter sediment and nutrients (Todd 1993). In several studies, well-drained forest

HEALTHY WATERS/FOREST RETENTION STUDY FINAL REPORT: JUNE 30, 2017 161
soils, typically those characterized by sandy texture, tend to have greater potential for facilitating nitrogen uptake from
rapid infiltration and subsurface flows and from retention of phosphorus through minimization of surface flows (Weller
et al. 1994, Norton and Fischer 2000). In addition, those forests that have more hydric soil conditions were found to
have greater potential for denitrification (Johnson et al. 2012). As with other variables, the potential contributions of
forest soils are highly dependent on their interactions with other ecological, hydrologic, and geomorphic conditions
(Weller et al. 1994).
Nitrogen transport from agricultural lands tends to occur via groundwater and therefore the potential for
forests to uptake these nutrients will depend on soil properties and the groundwater depth underlying forested areas.
Under baseflow conditions, groundwater with shallow water tables tends to hold more potential for nitrogen uptake
than deeper groundwater, where flows may bypass root zones in riparian areas and discharge directly to the streambed
with minimal plant uptake (Reilly et al. 1994). The depth of groundwater can fluctuate over time and is highly
dependent upon interactions with other factors such as soil texture and depth, geology, topography, and vegetation.
A significant number of studies have examined watersheds specifically within the Chesapeake Bay region.
Lowrance et al. (1997) provide a comprehensive review of these studies, specifically reviewing the function of riparian
forests across the various Physiographic regions of the CBW (Figure 1). Although the meta-analysis of Lowrance et al.
(1997) was concerned specifically with forested riparian buffers, it is very relevant to this report, as other literature
points to riparian forests as having the greatest potential among land uses for nutrient and sediment reductions
(Anbumozhi et al. 2005, Corbett et al. 1997, Hively et al. 2011). Lawrance et al. (1997) also make several general
conclusions regarding characteristics of forests that provide the greatest potential for providing watershed services.
With respect to sediment retention, natural riparian forests are particularly effective in filtering fine sediments with
the main limiting factors being slope and flow concentration. As with other studies, the meta-analysis found that
nitrate removal was most effective in shallow groundwater settings, where water moves in short, shallow flow paths
and is accessible for maximum root uptake. Conversely, nitrogen removal was found to be less effective in areas where
groundwater is deeper and more regionalized. Control of dissolved phosphorus was found to be the least generalizable

HEALTHY WATERS/FOREST RETENTION STUDY FINAL REPORT: JUNE 30, 2017 162
function of riparian forests and was closely linked to filtration of fine
sediments. The authors note that riparian forests appear to have
very low net dissolved phosphorus retention, but may have
increased effectiveness when coupled with vegetation that has
greater potential for phosphorus uptake.
In addition to generalized conclusions, the Lowrance et al.
(1997) meta-analysis offers summarized characteristics of the
various Physiographic regions of the CBW (Figure 1)66.
For nitrogen removal from groundwater, the Inner Coastal Plain region of the Atlantic Coastal Plan Province
and Piedmont regions characterized by thin soils and shales have the greatest potential. For the Piedmont region, it
was noted that much of the potential will be determined by topography of the valleys, which will control connectivity
of nitrogen sources to riparian forests and surface water courses. Those regions with high infiltration, such as well-
drained uplands in the Outer Coastal Plain and those with deep groundwater or connections to regional aquifers, such
as the Valley and Ridge have the lowest potential for groundwater nitrogen removal. All regions were determined to
have a medium-to-high expected level of sediment removal. However, it was noted that the extent of sediment
removal was dependent upon the concentration of sediment in the flow and degree of slope. All regions were also
determined to have medium-to-low expected levels for removing dissolved phosphorus. Most phosphorus removal
was associated with surface sediment retention rather than uptake by tree root systems, which may have limited
capacity for additional phosphorus absorption.
66 Source: http://www.chesapeakebay.net/images/maps/cbp_19637.pdf
Figure 1. Chesapeake Bay Watershed Physiography.

HEALTHY WATERS/FOREST RETENTION STUDY FINAL REPORT: JUNE 30, 2017 163
As with previously cited research, Lowrance et al. (1997) noted that watershed systems are highly dynamic,
making generalization across Physiographic regions difficult. The authors remarked that upstream activities that may
alter hydrologic or pollutant dynamics will alter effectiveness of riparian forests in their ability to control nutrients and
sediment. Lowrance et al. (1997) stated that those riparian forests closest to or mimicking natural states will increase
long-term effectiveness in terms of protecting water quality. The extent to which disturbances such as timber
harvesting and road development can be minimized and land conservation can be maximized will ensure that
watershed services are sustained in the long term.
Valuing Forest Watershed Services
Ecosystem goods (e.g., provision of timber) and services (e.g., waste assimilation) represent the benefits
human populations derive, directly or indirectly, from ecosystem functions (Costanza et al. 1997). Ecosystem goods
have been valued throughout history, typically in the form of commodities or other tangible production inputs.
Ecosystem services, which are often less tangible, have only recently been recognized as having economic value within
the context of natural resource decision making (Daily et al. 2009, Millenium Assessment 2005). Although it is often
desired to formulate a single economic value for a particular service, valuation is not as straightforward as traditional
(commodity) goods and is an evolving branch of science that includes contributions from multiple social and natural
science fields (Farber et al. 2006).
In establishing value for ecosystem services, it is important to identify the type or classification of service
provided. A general consensus has been accepted that services can be grouped into three broad categories: 1)
provisioning, 2) regulating, or 3) cultural (Table 1). Unfortunately, less consensus has been reached as to which
category services derived from forests for water quality or watershed services should be categorized (Ojea et al. 2012).
Although forests provide regulation of sediment and nutrient flow, they have also been considered to provide
(provisioning service) clean water (Millenium Assessment 2005). The need for making this distinction is that in
calculating total economic values there exists the potential for double counting (Boyd and Banzhaf 2007).
In determining values it is also important to make a clear distinction of what is being valued. With respect to
forests and water quality or what is often termed “watershed services” this can be challenging, as there is not always

HEALTHY WATERS/FOREST RETENTION STUDY FINAL REPORT: JUNE 30, 2017 164
a clear distinction between the structure of the ecosystem, the relevant ecosystem process, and the impact that the
ecosystem produces (Ojea et al. 2012). For example, land classification is often used as a proxy for watershed
Table 2. Ecosystem Service Categories and Examples.1
Provisioning Regulating Cultural
Products obtained from ecosystems
Benefits obtained from regulation of ecosystem processes
Nonmaterial benefits obtained from ecosystems
• Fruits and Vegetables • Fresh water • Fiber • Fuelwood
• Climate • Water Quality • Pollination
• Recreation • Aesthetics • Sense of place • Cultural, religious,
historical significance
Supporting Services Services necessary for the production of all other ecosystem services
• Soil formation • Nutrient cycling • Primary production
1Millennium Assessment Chapter 2 (2005). condition, with more forestland representing a desired structure. However, it is the filtration properties of forest soils
that are the provisioning element, but the impact or outcome is the level of water quality. As Ojea et al. (2012) explain
the focus should be on the outcome, not the process for the purposes of valuation, as this is what has economic value.
Various methods have been developed for determining the value of non-market goods and services. These
methods can be broadly categorized as 1) revealed willingness to pay, 2) expressed willingness to pay, 3) cost analysis,
and 4) benefit transfer (Table 2).
Table 3. Valuation Methodologies.1
Category Method Description
Revealed Willingness to Pay
Hedonic Pricing Determining the value of a commodity’s characteristics both internal and external based on actual market prices.
Travel Cost A location’s value based on the time and expenditures spent by individuals to arrive at the location.
Expressed Willingness to Pay
Contingent Valuation
Survey-based valuation in which individuals directly express how much they would be willing to pay for a good or service.
Contingent Choice Survey-based valuation in which individuals are asked to choose among several options from which willingness to pay is inferred.

HEALTHY WATERS/FOREST RETENTION STUDY FINAL REPORT: JUNE 30, 2017 165
Category Method Description
Cost Analysis
Cost Avoidance The total cost necessary to avoid an impact. May also be calculated as the total cost of the impact if it were to occur.
Replacement Cost The cost to replace the benefit or service of study. Often called the mitigation cost.
Substitute Cost The cost or value of an alternative choice, which provides the same level of service or benefit.
Benefit Transfer
Estimate value by transferring available information from existing studies to subject location or context.
1. Farber et al. (2006). In the context of examining forest conservation as an alternative strategy to reduce pollutant loads delivered
to the CBW, cost-analysis methodology may be the most relevant, particularly the substitute-cost method. Advantages
to cost-analysis methods are that it is often easier to determine the costs of producing benefits rather than measuring
the value of the benefit itself. Disadvantages of this methodology are that it does not provide information regarding
social preferences and may not necessarily represent the full value of the resource (Farber et al. 2006). However, in
the context of our ongoing Healthy Watersheds Forest Retention Project these are of less concern because a primary
objective is to demonstrate the benefits and cost-effectiveness of forest conservation compared with more
infrastructure-intensive alternatives to pollutant reduction.
Recognition of watershed services and use of forest conservation as a strategy to protect water has gained
significant interest (Bertule et al. 2014, Gartner et al. 2013, Firehock and Kline 2013, Burke and Dunn 2010). In these
studies, natural landscapes are often referred to as green infrastructure and the substitution-valuation analysis as a
green vs grey cost analysis. Such studies aim to demonstrate the cost savings associated with preserving existing
landscapes rather than constructing additional infrastructure such as stormwater systems and water-filtration
facilities. The most famous of these case studies is New York State, which in the early 1990s established a significant
forest and riparian conservation program to which the Department of Environmental Protection (DEP) has committed
$1.5 billion to protect source water for the City of New York. Although these costs are significant, the DEP has
estimated that its efforts have avoided $10 billion in filtration plants and other hard infrastructure costs (NYEP 2010).

HEALTHY WATERS/FOREST RETENTION STUDY FINAL REPORT: JUNE 30, 2017 166
Since the implementation of this program other cities have followed suite with similar analyses of green vs. grey
infrastructure costs (Table 3).
Table 4. Grey vs Green Costs Savings for Water Quality ($millions).
Community Grey Infrastructure
Costs
Green Infrastructure
Costs Estimated
Savings Lancaster, PA1 $120 $94.5 $25.5 Fort Collins and Greeley, CO2 $25 $9.6 $15.4
Tualatin River, OR3 $60-150 $4.6 $50.4 - $145.4 Philadelphia, PA3 $25.4 – $58.4 $19.4 - $44.5 $6 - $14 Montgomery County, MD4 - - $55.5 - $240.4
Washington D.C.4 - - $7.7 - $26.7 Prince George’s County, MD4 - - $.019-.255
Milwaukee, WI5 - - $2.8 - $8.5 Ann Arbor, MI5 - - $53.2 - $184.6
1Mittman and Kloss (2014), 2Talberth et al. (2013), 3Bertule et al. (2014), 4Buckley et al. (2011a), 5Buckley et al. (2011b).
Although the above-cited studies are attractive for their ability to produce a tangible value, they should be
reviewed with significant caution. Cost-valuation studies often generalize the potential pollutant reductions or
services, such as assuming uniform conditions across an entire watershed (Farber et al 2006). As discussed in previous
sections, spatial location and connectivity to other elements of a watershed are important factors in understanding
the service potential of a watershed. In addition, as watersheds are highly dynamic systems, structural changes such
as precipitation rates and groundwater levels vary over time making the flow of benefits highly variable (Lele 2009).
By assuming a constant flow of benefits in order to determine a net present value, a valuation can significantly
misrepresent the quantity of service within a watershed.
Models to Quantify and Value Ecosystem Services
With increased interest in quantifying and valuing ecosystem services a considerable number of modeling
efforts have been developed, each with varying degrees of complexity, specificity, scale, and policy objectives (Bagstad
et al. 2013a, Volk 2013). Several ecosystem service models including Invest, maintained by the Natural Capital

HEALTHY WATERS/FOREST RETENTION STUDY FINAL REPORT: JUNE 30, 2017 167
Project67, and ARIES, developed by a consortium of academic68institutions are intended for large landscape application
and publicly available for use. In order to allow for broad application, such models tend to rely on simplified natural
systems modules that do not account for dynamic processes or dynamic interrelationships (Volk 2013). The most
appropriate application of these landscape-scale models are in the context of understanding trade-offs between
ecosystem service decisions and understanding watershed-scale land-use change scenarios (Vigerstol and Aukema
2011).
Development of markets or PES schemes that commoditize ecosystem services requires robust measurement
of the stock and flow of services (Crossman et al. 2013). More traditional hydrologic models, such as the Soil and Water
Assessment Tool (SWAT) developed by the USDA and the Variable Infiltration Capacity (VIC) model were developed to
examine more specific hydrologic functions, such as flow management and BMP effectiveness in reducing nutrient
loads. The challenge with such models, however, is integration with economic models to understand complex coupled
human and natural systems (Burkhard et al. 2013). Given increased interest in such studies, efforts such as the
Multiscale Integrated Model of Ecosystem Services (MIMES) have been developed (Boumans et al. 2015). Such models
are more robust and able to capture ecosystem service flows over time, but require a considerable amount of resources
and expertise.
The field of ecosystem service quantification and valuation is still fairly new. With time and continued interest,
additional research will become available to calibrate large landscape models to incorporate higher sensitivities of
more complex ecological processes (Sanchez-Canales et al. 2015, Hamel et al. 2015, Bagstad et al. 2013a). Similarly
complex coupled systems such as MIMES will continue to develop and allow for broader applications (Boumans et al
2015). With respect to the most appropriate of these models, Volk (2013) noted that a deficit currently exists in the
research to provide guidelines or protocols for model selection. Lacking a more structured approach, modeling
67 Natural Capital Project is a partnership between Stanford University, University of Minnesota, the Nature Conservancy and World Wildlife Federation. 68 ARIES is a collaboration of UNEP, WCMC, University of Vermont, Conservation International, Earth Economics, Basque Centre for Climate Change and Instituto De Ecologia A.C.

HEALTHY WATERS/FOREST RETENTION STUDY FINAL REPORT: JUNE 30, 2017 168
decisions are likely to be driven by the management question to be answered, resource availability, expertise, and time
constraints (Bagstad et al. 2013b, Boumans et al. 2015, Crossman et al. 2013).
Payments for Ecosystem Services
Once it is recognized that resources such as forests have value in terms of providing ecosystem services it often
desired to translate this information into incentives or payment for the continuation of those services. Payment for
ecosystem services schemes are generally defined as:
a voluntary transaction in which a well-defined environmental service (ES), or a form of land use likely to secure that service is bought by at least one ES buyer from a minimum of one ES provider if and only if the provider continues to supply service (conditionality). (Wunder 2005).
Payment for ecosystem services schemes typically occur in one of three categories of: 1) public payment, 2) self-organized deals, and 3) trading markets (Table 4).
Table 5. Types of Payment for Ecosystem Services Schemes. PES scheme type Definition Example
Public Payment Direct payments from government agencies or public institutions directly to landowners/managers
USDA Conservation Reserve Program pays landowners annual rental payments to remove high priority lands from production and enhance for wildlife habitat.
Self-organized private deals
Individual beneficiaries contract directly with providers of ecosystem services
In the 1990s Perrier Vittel entered into long-term contracts with farmland owners surrounding their aquifers and provided payments for less intensive dairy farming, implementation of BMPs and reforestation of buffer zones.
Trading Markets
Formal market in which buyers and sellers voluntarily engage in monetary transactions for specific unitized service. Although program is voluntary, trading may be used to meet regulatory requirements
California Air Resources Board Cap-and-Trade Program allows carbon emitters to purchase “credits” from suppliers in order to meet cap requirements.
Public payment programs for water quality and pollution reduction have existed for decades and have
been available at both the federal and state level (Tomer and Locke 2011). These programs often provide
cost-share or compensation for landowners to take measures to reduce nutrient loading, such as
conservation easements for riparian buffers or instillation of BMPs to reduce runoff. Public payments are

HEALTHY WATERS/FOREST RETENTION STUDY FINAL REPORT: JUNE 30, 2017 169
the least complex of PES schemes, but rely on the voluntary action of landowner participation and consistent
funding from public agencies (Forest Trends et al. 2008).
Self-organized private deals are transactions or programs initiated by private entities and provide
compensation in the form of rental payments and easements for ecosystem service providers. As listed in
Table 4, one of the earliest and most-noted programs was Perrier Vittel, which provided rental payments to
farmers in their watersheds for BMPs and reduced nutrient loading (Perrot-Maitre 2006). In more recent
years, non-government organizations such as Environmental Defense Fund (EDF) and The Nature
Conservancy have been working with corporate partners to reduce environmental impacts through supply-
chain management. For example, EDF has partnered with Walmart to reduce its food suppliers’ fertilizer
applications in efforts to improve water quality (Environmental Defense Fund 2014). For corporations
adopting environmental programs, such private deals can also provide production cost savings and reduce
risks to variables such as drought.
Ecosystem Service trading markets have garnered considerable attention in recent years as a cost-
effective alternative to achieving regulatory requirements, such as those associated with EPA’s Total
Maximum Daily Load program. Payment for ecosystems services trading markets have been considered and
currently exist in the CBW in Maryland, Virginia, and Pennsylvania. Although attractive from a financial
standpoint, trading markets are often more complex and require considerable dynamics in terms of having a
sufficient number of trades, transaction costs, and institutional constraints (Forest Trends 2008). Most
trading markets are for point-source pollution, as the regulatory requirement on identifiable entities provides
the demand basis for the market. However, in the Lake Tahoe Basin, pollutant loads for stormwater have
been delegated to local jurisdictions and state highway departments. The credit accounting is calculated on
a catchment basis and can be accomplished through a number of technology and BMP strategies. Based on
HEALTHY WATERS/FOREST RETENTION STUDY FINAL REPORT: JUNE 30, 2017 170
achievements in reducing loadings, jurisdictions can buy and sell credits amongst themselves in order to
achieve load reduction requirements for the entire Lake Tahoe Basin (Lahontan Water Quality Control Board
2011).
Conclusions
The literature discussed in this report demonstrates the potential of forests to provide water quality
regulating services both generally and specifically to the CBW. However, in assessing, valuing, and developing
formal programs pertaining to watershed services, the scientific community has not yet reached consensus
as to conditions and characteristics that can be generalized across large landscapes. Although valuation of
ecosystem services, such as those provided by forests, can be a powerful policy decision-making tool, the
dynamics associated with whole- and sub-watersheds makes quantification, and therefore valuation,
challenging. Continued development of more detailed and integrated models will improve the ability to
quantify watershed services provided by forests. In light of these caveats and challenges, it remains true that
forests are an important ecological element of the CBW and undoubtedly play a valuable role in managing
and reducing non-point source pollution to the Bay.
References
Anbumozhi, V., Radhakrishnan, J., Yamaji, E. 2005. Impact of riparian buffer zones on water quality and associated management considerations. Ecological Engineering. 24-5: 517-523.
Bagstad, K.J., Semmens, D.J., Waage, S., Winthrop, R. 2013a. A comparative assessment of decision-support tools for ecosystem services quantification and valuation. Ecosystem Services 5: 27-39.
Bagstad, K.J., Semmens, D.J., Waage, S., Winthrop, R. 2013b. Comparing approaches to spatially explicit ecosystem service modeling: A case study from the San Pedro River, Arizona. Ecosystem Services. 5: 40-50.
Barnes, M.C., Todd, A.H., Whitney L., Rebecca, B., Paul K. 2009. Forests, Water and People. United States Forest Service. Newtown Square, PA. NA-FR-01-08.
Bertule, M., Lloyd, G.J., Korsgaard, L. Dalton, J., Welling, R., Barchiesi, S., Smith, M., Opperman, J. Gray, E., Gartner, T., Mulligan J., Cole, R. 2014. Green Infrastructure: Guide For Water Management. United Nations Environment Programme. DEP/1837/NA.

HEALTHY WATERS/FOREST RETENTION STUDY FINAL REPORT: JUNE 30, 2017 171
Blankenship, K. 2011. After TMDL process, Bay Program finds itself at a crossroads. Bay Journal May. Seven Valleys, PA. Boyd J. and Banzhal, S. 2007. What are ecosystem services? The need for standardized environmental accounting units.
Ecological Economics 63: 616-626.
Boumans, R., Roman J., Altman, A., Kaufman, L. 2015. The Multiscale Integrated Model of Ecosystem Services (MIMES): Simulating the interactions of coupled human and natural systems. Ecosystem Services 12: 30-41.
Buckley, M., Souhlas, T., Hollingshead, A., 2011a. Economic Benefits of Green Infrastructure Chesapeake Bay Region. Final Report. ECONorthwest. Eugene, OR.
Buckley, M., Souhlas, T., Hollingshead, A., 2011b. Economic Benefits of Green Infrastructure Great Lakes Region. Final Report. ECONorthwest. Eugene, OR.
Burke, D.G., and Dunn, J.E. 2010. A sustainable Chesapeake: Better Models for Conservation. The Conservation Fund, Arlington, VA.
Burkhard, B., Crossman, N., Nedkov, S., Petz, K., Alkemade, R., 2013. Mapping and modelling ecosystem services for science, policy and practice. Ecosyst. Serv. 4, 1–3.
Calder, I.R. 2002. Forests and Hydrological Services: Reconciling public and science perceptions. Land Use and Water Resources Research. 2: 1-12.
Chesapeake Bay Commission 1987. Chesapeake Bay Agreement. Retrieved from http://www.chesapeakebay.net/content/publications/cbp_12510.pdf.
Chesapeake Bay Commission. 2013. Crediting Conservation: Accounting for the Water Quality Value of Conserved Lands Under the Chesapeake Bay TMDL. White Paper. Annapolis, MD.
Chesapeake Bay Program. 2015a. Tracking the Progress: Protected Lands. Retrieved from http://www.chesapeakebay.net/indicators/indicator/preserving_lands.
Chesapeake Bay Program 2015b. Executive Summary of Management Strategies: Conserved Lands. Backgrounder. Annapolis MD.
Corbett, C.W., Wahl, M., Porter, D.E., Edwards, D., Moise, C. 1997. Nonpoint source runoff modeling: A comparison of a forested watershed and an urban watershed on the South Carolina Coast. Journal of Experimental Marine Biology and Ecology. 231-1: 133-149.
Costanza R., d'Arge, R., de Groot, R.S., Farber S., Grasso M., Hannon B., Limburg K., Naeem S., O'Neill R.V., Paruelo J., Raskin R.G., Sutton P., van den Belt M. 1997. The value of the world's ecosystem services and natural capital. Nature, 387: 253–260.
Crossman N.D., Burkhard B., Nedkov, S., Willemen, L., Petz, K., Palomo, I., Drakou, E.G., Martin-Lopez, B., McPhearson, T., Boyanova, K., Alkemade, R., Egoh, B., Dunbar, M.B.,
Maes, J. 2013. A blueprint for mapping and modeling ecosystem services. Ecosystem Services. 4: 4-14.
Daily G.C., Polasky S., Goldstein J., Kareiva P.M., Mooney H.A., Pejchar L., Ricketts T.H., Salzman J., Shallenberger R., 2009. Ecosystem services in decision making: time to deliver. Frontiers in Ecology and the Environment 7: 21–28.
Environmental Defense Fund 2014. EDF launches initiative to reduce fertilizer pollution from commodity grain crops. Retrieved from: http://www.edf.org/media.
Environmental Protection Agency. 2010. Chesapeake Bay Total Maximum Daily Load for Nitrogen, Phosphorus and Sediment. Final Report. Washington D.C.

HEALTHY WATERS/FOREST RETENTION STUDY FINAL REPORT: JUNE 30, 2017 172
Farber, S., Costanza, R., Childers, D.L., Erickson, J., Gross, K., Grove, M., Hopkinson C.S., Kahn J., Pincetl S., Troy, A., Warren, P., Wilson, M. 2006. Linking Ecology and Economics for Ecosystem Management. BioScience. 56-2: 121-133.
Firehock, K. and Kline C. 2013. Evaluating and conserving green infrastructure across the landscape. The Green Infrastructure Center Inc. Charlottesville, VA.
Forest Trends and the Katoomba Group 2008. Payments for Ecosystem Services. A primer. Washington D.C. DEP/1051/NA/
Gartner, T., Mulligan, J., Schmidt, R. 2013. Natural Infrastructure: Investing in Forested Landscapes for Source Water Protection in the United States. 2013 World Resources Institute. Washington D.C.
Gilbert, D., Kyle, P., McCoy, A., 2012. Tracking Healthy Waters Protections in the Chesapeake Bay Watershed. Report presented to The Nature Conservancy. Thomas Jefferson Program in Public Policy at the College of William & Mary. Williamsburg, VA.
Hamel, P., Chaplin-Kramer, R., Sim, S., Mueller, C., 2015. A new approach to modeling the sediment retention service (InVEST 3.0): Case study of the Cape Fear catchment, North Carolina, USA. Science of The Total Environment 524-525: 166-177.
Hanson, C., Talberth, J., Yonavjak, L. 2011. Forests for Water: Exploring Payments for Watershed Services in the U.S. South. World Resources Institute Issue Brief #2. Washington DC.
Hively, W.D., Hapeman, J.C., McConnell, L.L., Fisher, T.R., Rice, C.P., McCarty, G.W., Sadeghi, A.M., Whithall, D.R., Downey, P.M., Nino de Guzman, G.T., Bialek-Kalinski, K., Lang, M.W., Gustafson, A.B., Sutton, A.J., Sefton, K.A., Harman Fetcho, J.A. 2011. Relating nutrient and herbicide fate with landscape features and characteristics of 15 subwatersheds in the Choptank River watershed. Science of the Total Environment. 409: 3866-3878.
Johnson, S.R., Burchell II, M.R., Evans, R.O., Osmond, D.L., Gilliam, W.J. 2012. Riparian buffer located in an upland landscape position doesnot enhance nitrate-nitrogen removal. 52: 252-261.
Lahontan Water Quality Control Board and Nevada Division of Environmental Protection. 2011. Lake Clarity Crediting Program Handbook for Lake Tahoe TMDL Implementation v0.99 Prepared by Environmental Incentives, LLC. South Lake Tahoe, CA.
Lele, Sharachcharndra. 2009. Watershed services of tropical forests: from hydrology to economic valuation to integrated analysis. Current Opinion in Environmental Sustainability. 1: 148-155.
Lorz, C., Volk, M. and Schmidt, G. 2007. Considering spatial distribution and functionality of forests in a modeling framework for river basin management. Forest Ecology and Management 248:17-25.
Lowrance R., Altier L.S., Newbold D.J., Schabel R.R., GRoffman P.M., Denver J.N., Corell D.L., Gilliam J.W., Robinson J.L., Brinsfield R.B., Staver K.W., Lucas W., Todd A.H. 1997. Water quality functions of riparian forest buffers in Chesapeake Bay watersheds. Environmental Management 21: 687-712.
Majanen, T., Friedman, R., Milder J. C., 2011. Innovations in Market-Based Watershed Conservation in the United States. Eco-agriculture Partners Washington D.C.
MA, 2005. MA, Millennium Ecosystem Assessment. Ecosystems and human wellbeing: current state and trends. Island Press, Washington DC.
Mittman, T., Kloss, C. 2014. The Economic Benefits of Green Infrastructure: A Case Study of Lancaster, PA. Environmental Protection Agency. EP-C-11-009.
Neary, D.G., Ice, G.G., Jackson, R.C. 2009. Linkages between forest soils and water quality and quantity. Forest Ecology and Management. 258: 2269-2281.
Norton, M.M. and Fisher, T.R. 2000. The effects of forest on stream water quality in two coastal plain watersheds of the Chesapeake Bay. Ecological Engineering 14: 337-362.
NYC Environmental Protection 2010. Green Infrastructure Plan. New York Department of Environmental Protection. New York, NY.

HEALTHY WATERS/FOREST RETENTION STUDY FINAL REPORT: JUNE 30, 2017 173
Ojea, E., Ortega, J.M., Chiabai, A. 2012. Defining and classifying ecosystem services for economic valuation: The case of forest water services. Environmental Science and Policy 19: 1-15.
Perrot-Maitre, D. 2006. The Vittel payments for ecosystem services: a “perfect” PES case? International Institute for Environment and Development, London, UK.
Reilly, T.E., Plummer, L.N., Phillips, P.J. and Busenburg, E. 1994. The use of simulation and multiple environmental tracers to quantify ground water flow in a shallow aquifer. Water Resources Research 30: 421-433.
Sanchez-Canales, M., Lopez, Benito, A., Passuello, A., Terrado, M., Ziv, G., Acuna, V.,Schumacher, M., and Elorza, F.J. 2015. Sensitivity analysis of a sediment dynamics model applied in a Mediterranean river basin: Global change and management implications. Science of the Total Environment. 502: 602-610.
STAC (Chesapeake Bay Program Scientific and Technical Advisory Committee). 2012. The role of natural landscape features in the fate and transport of nutrients and sediment. STAC Rtp. 12-04, Edgewater, MD. 27 pp.
Talberth, J., Mulligan J., Bird, B., Gartner, T., 2013. A Preliminary Green-Gray Analysis for the Cache la Poudre and Big Thompson Watersheds of Colorado’s Front Range. Final Report. Center for Sustainable Economy.
Todd, Albert H. 1993. The Role and Function of Forest Buffers For Nonpoint Source Management in the Chesapeake Bay Basin. Chesapeake Bay Program White Paper Annapolis MD.
Tomer, M.D, Locke M.A. 2011. The challenge of documenting water quality benefits of conservation practices: a review of USDA-ARS’s conservation effects assessment project watershed studies. Water Science and Technology. 64.1: 300-310.
Vigerstol, K.L., Aukema, J.E. 2011. A comparison of tools for modeling freshwater ecosystem services. Journal of Environmental Management. 92: 2403-2409.
Volk, M. 2013. Modeling ecosystem service-Challenges and promising future directions. Sustainability of Water Quality and Ecology. 1-2: 3-9.
Weller, D.E., Correll, D.L. and Jordan, T.E. 1994. Denitrification in riparian forests receiving agricultural discharges. Global Wetlands: Old World and New. 117-131.
Wunder, Sven 2005. Payments for environmental services: Some nuts and bolts. Center for International Forestry Research. Occasional Paper No. 42. Jakarta Indonesia.

HEALTHY WATERS/FOREST RETENTION STUDY FINAL REPORT: JUNE 30, 2017 174
APPENDIX C. PENNSYLVANIA LOCALITY-SPECIFIC TMDL RESULTS PENNSYLVANIA (PHASE II)
Land Cover Acreage by County Portion by Scenario
County Portion Model 5.3.2 Scenario A Scenario B Scenario C* Scenario D Scenario D**Cumberland Co. 2010 2025 2010 2025 2025 2010 2025 2010 2025Agriculture 30,280.34 29,557.12 29,190.33 28,084.49 27,944.88 30,072.53 16,006.26Forest 57,341.93 55,889.32 58,153.23 56,322.00 56,565.68 56,527.84 1,486.88Construction 402.04 305.16 355.78 317.75 303.56 388.38 205.54Extractive 679.46 680.30 689.37 664.95 650.76 666.74 177.29Impervious 5,993.06 6,550.00 5,439.98 6,118.94 6,085.58 5,773.00 4,446.58Pervious 15,333.44 17,053.00 14,314.61 16,636.71 16,594.37 14,863.00 12,728.37Water 396.67 395.55 385.50 384.37 384.37 390.30 186.53TOTAL 110,426.95 110,430.46 108,528.79 108,529.21 108,529.21 108,681.80 35,237.45**York Co. 2010 2025 2010 2025 2025 2010 2025 2010 2025Agriculture 7,418.62 5,479.71 7,220.15 5,280.35 5,278.51 7,433.25 5,261.61Forest 12,794.15 13,262.14 11,539.42 11,527.71 11,530.29 12,794.15 11,372.17Construction 125.31 123.85 103.11 118.36 118.17 125.31 117.84Extractive 22.24 22.24 20.86 22.24 22.06 22.24 22.06Impervious 1,499.00 1,773.00 1,295.68 1,656.63 1,656.44 1,499.00 1,644.14Pervious 5,153.00 6,366.00 4,497.45 6,073.42 6,073.23 5,153.00 6,041.82Water 151.67 151.67 56.87 56.85 56.85 151.67 48.82TOTAL 27,163.99 27,178.62 24,733.54 24,735.54 24,735.54 27,178.62 24,508.45YBC Watershed 2010 2025 2010 2025 2025 2010 2025 2010 2025Agriculture 37,698.97 35,036.84 36,410.48 33,364.84 33,223.39 37,505.78 21,267.87Forest 70,136.08 69,151.46 69,692.66 67,849.71 68,095.97 69,321.99 12,859.05Construction 527.35 429.01 458.88 436.11 421.74 513.69 323.38Extractive 701.70 702.54 710.23 687.19 672.82 688.98 199.34Impervious 7,492.06 8,323.00 6,735.66 7,775.56 7,742.02 7,272.00 6,090.71Pervious 20,486.44 23,419.00 18,812.05 22,710.12 22,667.60 20,016.00 18,770.18Water 548.34 547.22 442.37 441.22 441.22 541.97 235.35TOTAL 137,590.94 137,609.07 133,262.33 133,264.75 133,264.75 135,860.42 59,745.90
* See Table 24 and discussion of Scenario C for land cover input for this scenario involving 3 municipalities. ** CWP’s BayFAST modelling consultant was unable to explain missing data for riversegmentsheds in Cumberland Co. summary data table provided RDS, LLC which prevents accurate comparison in this table for Scenario D 2025 scenario with 2010.

HEALTHY WATERS/FOREST RETENTION STUDY FINAL REPORT: JUNE 30, 2017 175
1. Scenario A: Modified 2025 TMDL 5.3.2 and B: Forest Retention The 2025 land cover projections provided by DCNR to CWP forecast that 4 of the 7 land-river segmentshed in the Yellow Breeches watershed would gain forest land. These projections are shown in Table 19. As a result, these land-river segmentshed were not modified to reduce the rate of forest loss since there was no forest loss predicted.
Table 19. 2010-2025 Land Cover Data, Scenarios A & B
County Land Use
5.3.2 Acreage Scenario A Scenario B Acreage Difference
% Difference
2010
2010 Adjusted
Acres
2025 Adjusted
Acres
2025 Adjusted
Acres
Scenario A-B 2025 A-B 2025
Cumberland
Agriculture 14,749.97 15,986.42 16,145.87 16,006.26 -139.61 -0.87% Forest 1,200.14 3,727.22 1,243.21 1,486.88 243.68 6.54% Urban 17,561.46 15,337.28 17,661.97 17,557.77 -104.19 -0.68% Water 186.62 186.53 186.53 186.53 0.00 0.00% Sub-total 33,698.19 35,237.46 35,237.57 35,237.45 -0.12 0.00%
York
Agriculture 4,240.93 7,197.65 5,263.45 5,261.61 -1.84 -0.03% Forest 10,391.09 11,382.21 11,369.59 11,372.17 2.57 0.02% Urban 6,338.95 5,879.78 7,826.58 7,825.85 -0.74 -0.01% Water 52.04 48.82 48.82 48.82 0.00 0.00% Sub-total 21,023.01 24,508.47 24,508.45 24,508.45 0.00 0.00%
YBC TOTAL
Agriculture 18,990.90 23,184.07 21,409.32 21,267.87 -141.45 -0.66% Forest 11,591.23 15,109.44 12,612.80 12,859.05 246.25 1.95% Urban 23,900.41 21,217.07 25,488.55 25,383.62 -104.93 -0.41% Water 238.66 235.35 235.35 235.35 0.00 0.00%
Sub-total 54,721.20 59,745.93 59,746.02 59,745.90 -0.13 0.00% Source: Data compiled by DCNR staff from CB TMDL 5.3.2 dataset by riversegmentshed. See narrative for adjustment notes.
Table 20 provides a summary of land-river segmentshed modifications.
Table 20. 2010-2025 Forest Trend Summary Riversegmentshed Forest Trend Result A4204SL3_2400_2440 2010 to 2025 acreage decreased Rate of Forest Loss adjusted (-10%) A42041SL3_2400_2380 2010 to 2025 acreage decreased Rate of Forest Loss adjusted (-10%) A42133SL3_2400_2380 2010 to 2025 acreage decreased Rate of Forest Loss adjusted (-10%) A42133SL3_2440_2380 2010 to 2025 acreage increased No Change A42133SL9_2380_2310 2010 to 2025 acreage increased No Change B42041SL3_2400_2440 2010 to 2025 acreage increased No Change…not included in acreage in Table 16. F42041SL3_2400_2440 2010 to 2025 acreage increased No Change…not included in acreage in Table 16.

HEALTHY WATERS/FOREST RETENTION STUDY FINAL REPORT: JUNE 30, 2017 176
Table 21. Comparison of Scenario A & B Pollutant Loadings
County Portion Pollutant Loadings
Nitrogen (lbs./ac./yr.)
Phosphorus(lbs./ac./yr.)
Sediment(lbs./ac./yr.)
Cumberland Co. Scenario A 2025 2,556,942.8 55,001.4 106,576,623.0 Scenario B 2025 2,497,051.0 48,566.0 105,805,112.8
Difference 59,891.8 6,435.5 771,510.2 York Co. Scenario A 2025 570,888.9 11,652.7 25,595,030.2 Scenario B 2025 569,865.8 11,542.5 25,589,607.2
Difference 1,023.1 110.2 5,422.9 YBC Watershed Total Scenario A 2025 3,127,831.7 66,654.1 132,171,653.2 Scenario B 2025 3,066,916.8 60,108.4 131,394,720.0
Difference 60,914.9 6,545.7 776,933.2
Table 22. BMPs Needed to Offset Loads by County
Table 23. Scenario B Off-Set Savings
BMP Extent Units Cumberland County
Stream Restoration 17,191 Feet York County
Stream Restoration 120 Feet YBC Watershed
Stream Restoration 17,311 Feet
BMP Costs to Off-set Scenario B Forest Loss
Cumberland County (YBC Part) Summary Implementation Costs $ 11,088,195.00 Annual Maintenance $ 147,842.60 Extended O & M (7.5 years) $ 1,108,819.50 Total Cost $ 12,197,014.50
York County (YBC Part) Summary Implementation Costs $ 77,400.00 Annual Maintenance $ 1,032.00 Extended O & M (7.5 years) $ 7,740.00 Total Cost $ 85,140.00
Total YBC Watershed Implementation Costs $ 11,165,595.00 Annual Maintenance $ 148,874.60 Extended O & M (7.5 years) $ 1,116,559.50 Total Cost $ 12,282,154.50
Based on BayFAST default pollution loadings by land cover type, rainfall patterns, and the comparative reduction in loadings resulting from the “saved” forest under Scenario B, the avoided off-set BMP is 17,311 feet (or 3.28 miles) of restored stream channels throughout the YBC watershed (see Table 22).
As shown in Table 23 to the left, the avoided stream restoration BMP costs resulting from forest retention equal to a 10 percent reduction in the rate of forest loss is $12.28 million from 2010 through 2025. No inflation cost has been applied to estimated costs over the 15 year project term.
The avoided off-set cost of BMP implementation in the YBC watershed is approximately 10 percent of the level calculated in the related Phase I study in Virginia. This great difference is largely explained by three primary factors:
1) The YBC watershed is much smaller than the Rappahannock River watershed (i.e. roughly 55 percent of the Rappahannock basin’s area)
2) The TMDL Model 5.3.2 forest land cover projections for 2025 showed increased forest acreage, so these riversegmentsheds were excluded from the application of the forest retention assumption which was applied only to areas which showed projected forest acreage losses; thus, the retention scenario was not applied universally as it was in the Virginia Phase I project, and
3) CWP BayFAST modelers used a cost-effective
BMP (stream restoration), rather than using a mix which included other measures with higher implementation costs which would be more representative of average avoided BMPs implementation costs.

HEALTHY WATERS/FOREST RETENTION STUDY FINAL REPORT: JUNE 30, 2017 177
2. Scenario (C) 2025: Urban Forest Retention Scenario
The Urban Forest Retention Scenario describes a future land cover pattern for a selected subset of municipalities (i.e. Upper Allen and Lower Allen Townships in Cumberland County, and Fairview Township in York County) in the study area that assumes local implementation of policies which are anticipated to encourage urban forest and tree canopy retention, as well as both afforestation and reforestation of vacant urban landscapes. Under this scenario (like Scenario B), a case study was developed to reflect possible implementation of forest and tree canopy retention programs by local municipalities, particularly in the urban-dominated municipalities within the YBC watershed. Past population data is also used to determine possible future trends in population growth in these urban areas, and assumes local governments have already, or will implement forest retention policies. Similar to Virginia’s assumptions, Federal, State, and local government parks or other conserved, forested lands are assumed to remain standing and not harvested. This scenario applies the stream restoration BMP strategy within a selected group of municipalities to calculate the off-set savings associated the projected amount of lost forest lands (i.e. as reflected under Scenario A 2025 in Table 14). Like Scenario D, this scenario only covers portions of the two counties in the YBC watershed and is not directly comparable to either Scenarios A, B or D.
Table 24. Scenario C Municipalities' Simplified Land Cover
Scenario C Simplified Municipal Land Cover Trends
Municipality Land Use 2010 Acres
2025 Acres Difference % Change
Lower Allen Forest 889.7 786.9 -102.8 -11.55% Urban 2,871.1 2,768.4 -102.8 -3.58% Subtotal 3,760.8 3,555.3 -205.5 -5.46%
Upper Allen Forest 1,126.7 1,036.7 -90.0 -7.99% Urban 2,877.9 2,787.9 -90.0 -3.13% Subtotal 4,004.6 3,824.6 -180.0 -4.49%
Fairview Forest 805.9 753.1 -52.8 -6.55% Urban 2,877.9 2,825.1 -52.8 -1.83% Subtotal 3,683.8 3,578.3 -105.5 -2.86%
Scenario C Total Forest 2,822.3 2,576.8 -245.5 -8.70% Urban 8,626.9 8,381.4 -245.5 -2.85% Total 11,449.2 10,958.2 -491.0 -4.29%
Source: Compiled by CWP from NLCD land cover estimates provided by DCNR. Tabulated by RDS, L.L.C.
Figure 14. Scenario C: Forest Loss & Population Trends
2,200.0
2,400.0
2,600.0
2,800.0
3,000.0
0
20,000
40,000
60,000
80,000
2000 2010 2014 2020 2025 2030
Scenario C: Forest and Population Trends
Population Forest Acreage

HEALTHY WATERS/FOREST RETENTION STUDY FINAL REPORT: JUNE 30, 2017 178
For this analysis, only the selected urban portion of the study area for Scenario C was investigated. This consisted of both land cover development trends and population trends over time, as well as future estimations of land cover change and population growth to produce overall projections of forest retention and run off.
DCNR provided CWP with a list of jurisdictions considered by DCNR to be predominantly urban or urbanizing, along with population estimates for 2000 and 2010 as well as projections for 2014, 2020, 2025 and 2030. Of these three jurisdictions (i.e. Upper Allen Township, Lower Allen Township, and Fairview Township) were selected for scenario development based on their level of predicted forest loss (See Figure 15 for scenario C and D jurisdictions location map). Additionally, DCNR provided CWP with land cover data for 2001, 2006, and 2011 for each jurisdiction. Population estimates that fell between 2000 and 2014 aligned well with the forest estimate timeline between 2001 and 2011. A linear trend was fit between forest data points and the trend line was applied to the 2000 to 2014 time grid to align with population estimates.
To develop nutrient and sediment loading estimates, BayFAST (Facility Assessment and Scenario Tool) was used to establish loading rates for each land use category in each jurisdiction. Using the BayFAST tool, CWP identified the jurisdiction by using the polygon tool to identify an area that roughly matched the municipal boundary. Next CWP individually edited each of the land use data table categories based on the “Enhanced 2010 Land Cover” data provided by DCNR. For each “Facility”, a scenario was run in a “no action” state, meaning it assumes no BMPs were present to develop baseline total loads for each jurisdiction. Using Edge-of-Stream (EOS) total loads and the adjusted land use acres provided by DCNR, CWP calculated the loading rate (lbs./ac./yr.) for each land use category in each jurisdiction. This loading rate was then applied to forest and urban lands to determine the baseline loads for the jurisdictions in Scenario C.
Figure 15. YBC Scenarios C and D Municipality Groups

HEALTHY WATERS/FOREST RETENTION STUDY FINAL REPORT: JUNE 30, 2017 179
Table 27 (at right) summarizes the implementation, operation and maintenance costs to restore approximately 1 mile of stream channel in the scenario jurisdictions to off-set the forest loss forecast for this scenario. No inflation multiplier was applied to any default costs over the project term.
Table 27. Estimated BMP Implementation and O & M Costs
Stream Restoration BMP Costs Lower Allen Summary
Implementation Costs $ 1,742,145 Annual Maintenance $ 23,229 O & M (7.5 Years) $ 174,215 Total Cost $ 1,916,360
Upper Allen Summary Implementation Costs $ 1,065,168 Annual Maintenance $ 14,202 O & M (7.5 Years) $ 106,517 Total Cost $ 1,171,685
Fairview Summary Implementation Costs $ 622,651 Annual Maintenance $ 8,302 O & M (7.5 Years) $ 62,265 Total Cost $ 684,916
Total Costs Implementation Costs $ 3,429,964 Annual Maintenance $ 45,733 O & M (7.5 Years) $ 342,996 Total Cost $ 3,772,961
Table 26. Stream Restoration BMP Extent Required to Offset Forest Loss
Scenario C Pollutant Loadings
Jurisdiction Pollutant Loadings
Nitrogen (lbs./ac./yr.)
Phosphorus (lbs./ac./yr.)
Sediment (lbs./ac./yr.)
Lower Allen Scenario C 2010 77,741.1 1,680.0 3,464,766.4 Scenario C 2025 79,664.7 1,731.4 3,557,742.6
Difference 1,923.7 51.4 92,976.2 Upper Allen Scenario C 2010 79,641.2 1,715.4 3,221,157.2 Scenario C 2025 81,335.8 1,761.0 3,295,273.1
Difference 1,694.6 45.6 74,115.9 Fairview Scenario C 2010 76,474.4 1,606.4 2,466,835.5 Scenario C 2025 77,436.8 1,631.5 2,510,160.5
Difference 962.3 25.1 43,324.9 Scenario C Total Scenario C 2010 233,856.7 5,001.8 9,152,759.1 Scenario C 2025 238,437.3 5,123.9 9,363,176.2
Difference 4,580.6 122.1 210,417.0 Source: Calculated by CWP from land cover data provided by DCNR.
BMPs Needed to Offset Loads by Jurisdiction
BMP Extent Units Lower Allen
Stream Restoration 2,701 Feet Upper Allen
Stream Restoration 1,651 Feet Fairview
Stream Restoration 965 Feet Scenario C Total 5,318 Feet
Table 25. Scenario C Pollutant Loadings The 2025 forest cover for each of the three selected jurisdictions was forecast using the trend line of forest loss and population growth. This scenario, like the Chesapeake Bay TMDL model, assumes that forest loss is a result of urban growth. Therefore the nutrient and sediment loading rates (from BayFAST) for urban and forest lands were applied to the 2010 and 2025 acres, respectively. The difference between the loading rates represents the new load associated with forest conversion to urban land specific to that jurisdiction No additional data related to how the land cover should be modified from baseline conditions was provided to CWP; therefore, no additional analysis could be performed.
Table 26 below illustrates the amount of stream restoration BMP implementation necessary to offset the pollutant load reductions necessary to cover the projected forest loss.

HEALTHY WATERS/FOREST RETENTION STUDY FINAL REPORT: JUNE 30, 2017 180
3. Scenario (D) 2025: Rural Riparian Buffer Restoration Scenario
Table 29. Scenario D Rural Municipalities, by County
Table 28. Scenario D. Land Cover Summary
Municipality Land Use Baseline
Acres Scenario D
Acres Difference % Change
Cumberland Co Scenario D
Area
Agriculture 22,016.76 20,940.50 -1,076.26 -4.9%Forest 54,826.70 56,637.80 1,811.10 3.3%Urban 13,297.06 12,562.22 -734.84 -5.5%Water 296.01 296.01 0.00 0.0%Sub-Total 90,436.53 90,436.53 0.00 0.0%
York Co Scenario D
Area
Agriculture 7,174.02 6,337.89 -836.13 -11.7%Forest 12,281.66 13,716.81 1,435.15 11.7%Urban 6,426.54 5,827.52 -599.02 -9.3%Water 61.40 61.40 0.00 0.0%Sub-Total 25,943.62 25,943.62 0.00 0.0%
Scenario D Total Area
Agriculture 29,190.78 27,278.39 -1,912.39 -6.6%Forest 67,108.36 70,354.61 3,246.25 4.8%Urban 19,723.60 18,389.74 -1,333.86 -6.8%Water 357.41 357.41 0.00 0.0%Sub-Total 116,380.15 116,380.15 0.00 0.0%
Source: Compiled by CWP from NLCD data provided by DCNR, tabulated by RDS, LLC.
County Municipality Acreage Percent (%) of Scenario Area
Cumberland Cooke 11,904.0 10.39 Cumberland Dickinson 21,121.6 18.43 Cumberland Monroe 11,371.4 9.92 Cumberland Penn 7,083.7 11.02 Cumberland Southampton 7,083.7 6.18 Cumberland South Middleton 20,590.2 17.96 Cumberland South Newton 5,738.7 5.01
Cumberland Sub-Total 90,436.5 78.90 York Carroll 8,754.6 7.64 York Fairview 8,043.9 7.02 York Franklin 1,757.91 1.53 York Monaghan 7,387.3 6.44
York Co. Sub-Total 24,185.7 22.63 Scenario D Total Area 114,622.2 100.00
See Figure 10 for location of the listed municipalities under this Scenario. Source: Provided by PA DCNR, from National Land Cover Data, tabulated by RDS, LLC.
This scenario required an estimate of the existing land cover for a defined target buffer area where riparian forest buffer would be tested as the BMP strategy to offset the impact of projected forest loss. DCNR’s Aquatic Habitat Buffer Guidelines contain varying buffer distances, depending on the stream type and include inner zones and outer zones that contribute to the entire buffer size. Due to the variance in the buffer distances in the guidelines, a 200 ft. buffer distance was chosen as an average constant. This 200 ft. buffer was chosen because it falls in the middle of smaller buffer requirements (100 ft.) and PA’s larger buffer requirements (300 ft.). The adjusted 2011 land cover was extracted from these buffer areas to determine the acreage gaps of forest cover along waterways. DCNR provided CWP with a spreadsheet identifying the acres of each land cover category within the 200-foot stream buffer area for the following jurisdictions, listed by County (See Table 28). These data were then summarized into forest, agriculture, and urban land cover classes. CWP further divided urban land into urban pervious and urban impervious by using the impervious to pervious ratio assumption from BayFAST to determine the amount of impervious acres associated with the “Developed” land cover categories in NLCD (i.e. High Density, Medium Density, and Low Density) in the buffer area. The remaining pervious acres from the “Developed” land cover categories were combined with the “Developed Open Space” acres to determine the number of urban pervious acres in the buffer area. CWP also further categorized agricultural land into Crop and Hay/Pasture by separating Cultivated Crops and Hay/Pasture. Total acreage for Scenario D by Municipality is shown in Table 29.

HEALTHY WATERS/FOREST RETENTION STUDY FINAL REPORT: JUNE 30, 2017 181
Using BayFAST, CWP developed the Riparian Forest Buffer scenario using the unique facilities developed for each jurisdiction. To develop the Forest Buffer scenarios, CWP implemented riparian forest buffer BMPs on both the urban acres and agricultural acres within the buffer zone. To implement forest buffers on urban land, CWP implemented the impervious removal BMP equal to the amount of impervious acres identified in the data provided by DCNR. CWP then implemented the forest buffer BMP on acres equal to the amount of urban pervious and impervious acres identified in the buffer zone data provided by DCNR. To implement forest buffers on agricultural land, CWP implemented forest buffers on hay and pasture land and on crop land equal to the acreages identified in the data provided by DCNR. The BayFAST model was then run to determine the new nutrient and sediment loads as a result of the forest buffer BMP implementation (see Table 30).
Table 30. Scenario D Pollutant Loading Results, By County
Table 31. Scenario D Riparian Buffer BMP by County
Table 32. Scenario D BMP Implementation Costs
The overall cost of implementation by 2025 of Scenario D, the rural forest riparian buffer off-set strategy (see Table 32 at left) throughout the selected rural municipalities is projected to be $5.25 million, assuming 7.5 years of project operation and maintenance cost over the 15 year term from 2010 to 2015, based on the assumption that project implementation would be evenly spread over the 15 year period, thus O & M costs would average out over this period. No inflation multiplier was applied to any default costs over the project term.
County Jurisdiction
Pollutant LoadingsNitrogen
(lbs./ac./yr.) Phosphorus(lbs./ac./yr.)
Sediment (lbs./ac./yr.)
Cumberland Co. Sub-Total
Rural MunicipalitiesScenario D Baseline 1,780,704.8 33,961.8 66,941,798.9 Scenario D 1,658,371.2 32,566.8 63,059,056.8
Difference 122,333.6 1,395.0 3,882,742.1
York Co. Sub-Total
Rural MunicipalitiesScenario D Baseline 642,909.8 13,315.5 27,767,740.5 Scenario D 533,351.5 11,975.9 23,601,856.8
Difference 109,558.3 1,339.7 4,165,883.8
YBC Watershed
Rural MunicipalitiesScenario D Baseline 2,423,614.6 47,277.3 94,709,539.5 Scenario D 2,191,722.7 44,542.7 86,660,913.6
Difference 231,891.9 2,734.7 8,048,625.9 Source: Calculated by CWP from land cover data using BayFAST default pollutant runoff loads by land cover type. Data tabulated by RDS, LLC.
Forest Riparian Buffer BMPs by CountyBMP Extent Units
Cumberland Co - Rural ComponentUrban Buffers 825 acresImpervious Removal 54 acresAgriculture Buffers 1,063 acres
York Co - Rural Component Urban Buffers 599 acresImpervious Removal 17 acresAgriculture Buffers 835 acres
YBC Watershed Urban Buffers 1,424 acresImpervious Removal 71 acresAgriculture Buffers 1,899 acresSource: Calculated by CWP from BayFAST model and tabulated by RDS, L.L.C.
BMP Implementation Costs Cumberland Co Rural Sub-Total
Implementation Costs $ 1,186,453 Annual Maintenance $ 264,380 O & M (7.5 years) $ 1,982,852 Total Cost $ 3,169,304
York Co Rural Sub-Total Implementation Costs $ 576,564 Annual Maintenance $ 200,820 O & M (7.5 years) $ 1,506,152 Total Cost $ 2,082,715
YBC Watershed Rural Scenario D Total Implementation Costs $ 1,763,017 Annual Maintenance $ 465,200 O & M (7.5 years) $ 3,489,003 Total Cost $ 5,252,020 Source: Calculated by CWP from BayFAST model and tabulated by RDS, L.L.C.
CWP then calculated the acreage of riparian buffer BMP implementation needed to off-set the projected difference in forest loss under Scenarios A and B 2025 and the resulting change in pollutant loads in the rural scenario study area (see Table 31 at right).

HEALTHY WATERS/FOREST RETENTION STUDY FINAL REPORT: JUNE 30, 2017 182
PENNSYLVANIA SUMMARY:
1. The comparative analysis of Scenario A 2025 and Scenario B 2025 shows that the value of the assumed level of forest retention effort would be equivalent to the off-set stream restoration BMP project implementation, operation and maintenance cost for 17,311 feet of restored stream channel at $12.28 million dollars through 2025.
2. To place this value in context with the Virginia Phase I study, the Virginia study found the forest retention strategy off-set cost savings in a portion of the Rappahannock River watershed to be $125+ million. For the reviewer of this report, the nearly 10:1 difference in the potential off-set savings between the two studies can be explained largely by three factors:
a. The Yellow Breeches Creek watershed in Pennsylvania is roughly 55 percent of the land area of the middle
basin portion of the Rappahannock River watershed in Virginia, thus the two study areas were not of the same geographic scale,
b. While the Chesapeake Bay Model 5.3.2 projections for forest loss in the Virginia study area showed a consistent pattern of forest loss across all riversegmentsheds through 2025, the same projections for the Yellow Breeches Creek watershed in Pennsylvania showed 5 out of 7 riversegmentsheds in the study area with projected increases in forest cover. Consequently, the impact of the forest retention scenario was limited to those 2 riversegmentsheds with projected forest losses, rather than being applicable throughout the entire watershed, and
c. The Pennsylvania BayFAST modeler did not copy Virginia’s blend of BMP practices to make the two studies
as comparable as possible in determining the BMP off-set cost-savings of forest retention. The CWP staff only applied the most cost-effective BMP strategy (i.e. stream restoration) to determine the off-set savings achievable through forest retention (Scenario B), rather than using the more costly mix of BMPs applied in the Virginia study (which included stream restoration, along with wetponds and wetlands, and dry extended retention ponds) to represent a better average off-set cost savings calculation across a diverse, developing landscape.
3. The reviewer should understand that these four scenarios in the Pennsylvania study do not cover the same
geographic area, nor do they apply the same off-set BMP strategy to consistently measure, in equivalent off-set cost savings, the benefit of the forest retention strategy (using the assumed 10 percent reduction in the rate of forest loss over the 15 year modeling period). a) The comparative analysis of Scenario A 2025 and Scenario C 2025 for the 3 urban municipalities included in
this urban case study shows that the value of the forest retention effort is equal to the off-set urban stream restoration BMP project implementation, operation and maintenance cost for 5,381 feet of restored stream channel of $3.77 million dollars through 2025. The reviewer should note this cost estimate represents part of the $12.28 million off-set cost savings described above, as the Scenario C project area is a subset of the entire watershed tested under Scenario B using the same BMP for determining the off-set cost-savings of forest retention.

HEALTHY WATERS/FOREST RETENTION STUDY FINAL REPORT: JUNE 30, 2017 183
b) The comparative analysis of Scenario A 2025 and Scenario D 2025 for the 11 rural municipalities included shows that the value of the forest retention effort in this rural portion of the YBC watershed is equal to the off-set riparian forest buffer restoration BMP project implementation, operation and maintenance cost (for conversion of 1,424 acres of urban land cover, 71 acres of impervious area and 1,899 acres of agricultural land in the YBC watershed to riparian forest buffer) of $5.25 million dollars through 2025. This estimated cost (which does not assume any land acquisition or other costs to accommodate the land cover conversions), while based on a different BMP practice (i.e. riparian forest buffer restoration instead of urban stream restoration) might be thought of as an alternate off-set cost estimate for the rural portions of the YBC watershed which overlap the Scenario B analysis.
4. As Scenarios A and B are derivatives of the Chesapeake Bay Model 5.3.2 land cover projections by riversegmentshed, it is important to note that these original projections, unlike the projections used in the Virginia Phase I case study, anticipated actual forest acreage increases for some riversegmentsheds, rather than projecting a uniform trend of forest loss throughout the watershed as was the case in the Virginia proof-of-concept study. Still, once adjusting the 2010 base year to better estimate the baseline acreage of forest in the watershed and applying the 5.3.2 model assumptions of forest cover change, Scenario B ‘s 2025 forecast of retained forest cover in the YBC watershed was 246.25 acres higher than the adjusted Model 5.3.2 forest cover projection.
The comparative results of acreage, pollutant loadings and land cover trends across all modeled scenarios are provided on the next three pages of Appendix C for the Cumberland Co. and York Co. portions of the study area and for the total adjusted area of the Yellow Breeches Creek watershed.

HEALTHY WATERS/FOREST RETENTION STUDY FINAL REPORT: JUNE 30, 2017 184
4. CUMBERLAND CO. PORTION OF YBC WATERSHED TMDL RESULTS
0.0010,000.0020,000.0030,000.0040,000.0050,000.0060,000.00
Phosphorus
0.00500,000.00
1,000,000.001,500,000.002,000,000.002,500,000.003,000,000.00
Nitrogen
0.0020,000.0040,000.0060,000.0080,000.00
100,000.00120,000.00
Acres
0.00
10,000.00
20,000.00
30,000.00
40,000.00
50,000.00
60,000.00
70,000.00
Model 5.3.22010
Model 5.3.22025
Scenario A2010
Scenario A2025
Scenario B2025
Scenario C2010
Scenario C2025
Scenario D2010
Scenario D2025
Cumberland Co. Portion of YBC Watershed: Land Cover Acreage by Scenario
Agriculture Forest Construction Extractive Impervious Pervious Water
020,000,00040,000,00060,000,00080,000,000
100,000,000120,000,000
Sediment

HEALTHY WATERS/FOREST RETENTION STUDY FINAL REPORT: JUNE 30, 2017 185
5. YORK COUNTY PORTION OF YBC WATERSHED TMDL RESULTS
0100,000200,000300,000400,000500,000600,000700,000
Nitrogen
0.005,000.00
10,000.0015,000.0020,000.0025,000.0030,000.00
Acres
02,0004,0006,0008,000
10,00012,00014,00016,000
Phosphorus
05,000,000
10,000,00015,000,00020,000,00025,000,00030,000,00035,000,000
Sediment
0.00
2,000.00
4,000.00
6,000.00
8,000.00
10,000.00
12,000.00
14,000.00
Model 5.3.22010
Model 5.3.22025
Scenario A2010
Scenario A2025
Scenario B2025
Scenario C2010
Scenario C2025
Scenario D2010
Scenario D2025
York Co. Portion of YBC Watershed: Land Cover Acreage by Scenario
Agriculture Forest Construction Extractive Impervious Pervious Water

HEALTHY WATERS/FOREST RETENTION STUDY FINAL REPORT: JUNE 30, 2017 186
6. YELLOW BREECHES CREEK WATERSHED TMDL RESULTS
0.00
50,000.00
100,000.00
150,000.00
Acres
0500,000
1,000,0001,500,0002,000,0002,500,0003,000,0003,500,000
Nitrogen
0.0010,000.0020,000.0030,000.0040,000.0050,000.0060,000.0070,000.00
Phosphorus
020,000,00040,000,00060,000,00080,000,000
100,000,000120,000,000140,000,000
Sediment
0.00
10,000.00
20,000.00
30,000.00
40,000.00
50,000.00
60,000.00
70,000.00
80,000.00
Model 5.3.22010
Model 5.3.22025
Scenario A2010
Scenario A2025
Scenario B2025
Scenario C2010
Scenario C2025
Scenario D2010
Scenario D2025
YBC Watershed: Land Cover Acreage by Scenario
Agriculture Forest Construction Extractive Impervious Pervious Water

HEALTHY WATERS/FOREST RETENTION STUDY FINAL REPORT: JUNE 30, 2017 187
7. Detailed Municipality Population Data
Census: April 1, Population 2000 2010 2000-2010 Change Estimate Projections
County Geographic Area Population Population Change Percent Scenarios 2014 2020 2025 2030Cumberland Camp Hill borough 7,636 7,888 252 3.3% A & B only 7,888 7,885 7,956 8,027 Cumberland Cooke township 117 179 62 53.0% A, B & D 179 211 230 248 Cumberland Dickinson township 4,702 5,223 521 11.1% A, B & D 5,223 5,922 6,221 6,519 Cumberland East Pennsboro township 18,254 20,228 1,974 10.8% A & B only 21,384 22,026 22,976 23925 Cumberland Hampden township 24,135 28,044 3,909 16.2% A & B only 28,044 31,863 33,798 35,733 Cumberland Lemoyne borough 3,995 4,553 558 14.0% A & B only 4,553 4,813 5,195 5,576 Cumberland Lower Allen township 17,437 17,980 543 3.1% A, B & C 17,980 19,460 20,558 21,655 Cumberland Mechanicsburg borough 9,042 8,981 -61 -0.7% A & B only 8,981 8,721 8,648 8,574 Cumberland Monroe township 5,530 5,823 293 5.3% A, B & D 5,823 5,984 6,102 6,220 Cumberland Mount Holly Springs borough 1,925 2,030 105 5.5% A & B only 2,030 2,075 2,115 2,154 Cumberland Penn township 2,807 2,924 117 4.2% A, B & D 2,924 3,192 3,283 3,374 Cumberland Shiremanstown borough 1,521 1,569 48 3.2% A & B only 1,569 1,563 1,576 1,588 Cumberland South Middleton township 12,939 14,663 1,724 13.3% A, B & D 14,663 16,887 17,856 18,825 Cumberland South Newton township 1,290 1,383 93 7.2% A, B & D 1,383 1,501 1,553 1,605 Cumberland Southampton township 4,787 6,359 1,572 32.8% A, B & D 6,359 7,481 8,141 8,801 Cumberland Upper Allen township 15,338 18,059 2,721 17.7% A, B & C 18,059 20,363 21,634 22,905 York Carroll township 4,715 5,939 1,224 26.0% A, B & D 5,939 6,987 7,562 8,136 York Dillsburg borough 2,063 2,563 500 24.2% A & B only 2,563 2,856 3,062 3,267 York Fairview township 14,321 16,668 2,347 16.4% A, B & C 16,668 18281 19,298 20,314 York Franklin township 4,515 4,678 163 3.6% A, B & D 4,678 5,127 5,270 5,412 York Franklintown borough 532 489 -43 -8.1% A & B only 487 561 565 568 York Monaghan township 2,132 2,630 498 23.4% A, B & D 2,630 2,914 3,117 3,320 York Warrington township 4,435 4,532 97 2.2% A & B only 4,577 4,665 4,721 4,777 Cumberland Scenario A & B Sub-Total 131,455 145,886 14,431 11.0% A & B 147,042 159,947 167,838 175,729 York Scenario A & B Sub-Total 32,713 37,499 4,786 14.6% A & B 37,542 41,391 43,593 45,794 Both YBC Watershed Basin Total 164,168 183,385 19,217 11.7% 184,584 201,338 211,431 221,523 Scenario C Sub-Total 47,096 52,707 5,611 11.9% C 52,707 58,104 61,489 64,874 Scenario D Sub-Total 43,534 49,801 6,267 14.4% D 49,801 56,206 59,333 62,460
Source: U.S. Bureau of Census, Decennial Population, 2000, 2010; PSU, Penn State Data Center, Pennsylvania Subcounty 2014 Estimates & Percent Change, May 21, 2015; PA Dept. of Environmental Protection, Municipal Population Projections (2010-2040) for State Water Supply Planning, 2009.

HEALTHY WATERS/FOREST RETENTION STUDY FINAL REPORT: JUNE 30, 2017 188
8. Detailed 2013 Land Cover by Municipality for Yellow Breeches Creek Watershed
Urban/ Rural County Municipality
Tree Canopy
Emergent Wetlands
Forests & Wetlands Sub-Total Water Grand Total
Rural Cumberland Cooke 11,151.455 0.758 11,152.213 30.058 12,633.664
Rural Cumberland Dickinson 14,469.792 2.398 14,472.190 73.237 27,714.290
Rural Cumberland Monroe 3,965.343 6.699 3,972.042 51.796 18,724.787
Rural Cumberland Penn 6,567.726 8.818 6,576.544 28.979 18,655.348
Rural Cumberland So. Middleton 12,242.293 9.492 12,251.784 99.726 28,846.352
Rural Cumberland So. Newton 3,222.962 3.526 3,226.488 11.999 8,241.475
Rural Cumberland Southampton 5,880.602 0.331 5,880.933 4.297 8,296.761
Rural York Carroll 4,609.329 2.630 4,611.959 24.437 12,886.346
Rural York Fairview 3,432.860 2.597 3,435.457 19.504 6,040.449
Rural York Franklin 1,494.191 0.064 1,494.255 10.270 2,009.985
Rural York Monaghan 4,187.164 2.572 4,189.737 21.003 10,574.437
Rural York Warrington 23.352 0.275 23.628 0.000 24.058
Rural Cumberland Sub-Total 57,500.173 32.021 57,532.194 300.092 123,112.676
Rural York Sub-Total 13,746.896 8.139 13,755.036 75.215 31,535.275
Rural YBC Watershed TOTAL 71,247.069 40.160 71,287.229 375.307 154,647.952
Urban Cumberland Camp Hill 256.891 0.055 256.946 0.231 1,662.998
Urban Cumberland East Pennsboro 8.419 0.000 8.419 0.000 112.950
Urban Cumberland Hampden 226.527 0.000 226.527 0.692 2,381.117
Urban Cumberland Lower Allen 2,062.089 1.198 2,063.286 77.300 10,552.154
Urban Cumberland Mechanicsburg 73.000 0.000 73.000 0.000 568.002
Urban Cumberland Mt Holly Springs 569.758 0.903 570.661 34.002 1,254.593
Urban Cumberland New Cumberland 27.220 0.000 27.220 0.000 69.817
Urban Cumberland Shiremanstown 48.140 0.000 48.140 332.112
Urban Cumberland Upper Allen 2,357.462 21.340 2,378.802 32.499 11,896.199
Urban York Dillsboro 153.747 0.000 153.747 0.093 871.833
Urban York Fairview 1,144.287 0.866 1,145.152 6.501 2,013.483
Urban Cumberland Sub-Total 5,629.507 23.497 5,653.003 144.725 28,829.940
Urban York Sub-Total 1,298.033 0.866 1,298.899 6.594 2,885.316
Urban YBC Watershed Sub-Total 6,927.540 24.362 6,951.902 151.320 31,715.256
TOTAL YBC Watershed TOTAL 78,174.609 64.523 78,239.131 526.626 186,363.208

HEALTHY WATERS/FOREST RETENTION STUDY FINAL REPORT: JUNE 30, 2017 189
Urban/ Rural County Municipality Barren
Low Vegetation Scrub/Shrub
Pervious Surface
Sub-Total Grand Total
Rural Cumberland Cooke 13.162 305.939 295.984 615.085 12,633.664
Rural Cumberland Dickinson 194.358 5,718.249 135.931 6,048.539 27,714.290
Rural Cumberland Monroe 16.171 6,764.859 6.633 6,787.663 18,724.787
Rural Cumberland Penn 21.658 5,503.875 84.559 5,610.092 18,655.348
Rural Cumberland So. Middleton 60.461 7,206.491 51.243 7,318.195 28,846.352
Rural Cumberland So. Newton 10.183 2,228.057 38.650 2,276.890 8,241.475
Rural Cumberland Southampton 88.501 990.939 34.718 1,114.158 8,296.761
Rural York Carroll 30.190 3,393.003 44.845 3,468.038 12,886.346
Rural York Fairview 19.906 1,874.256 50.322 1,944.483 6,040.449
Rural York Franklin 0.295 178.139 5.325 183.759 2,009.985
Rural York Monaghan 12.447 2,752.397 108.999 2,873.843 10,574.437
Rural York Warrington 0.000 0.000 0.000 0.000 24.058
Rural Cumberland Sub-Total 404.495 28,718.409 647.718 29,770.622 123,112.676
Rural York Sub-Total 62.837 8,197.795 209.491 8,470.123 31,535.275
Rural YBC Watershed TOTAL 467.332 36,916.204 857.209 38,240.746 154,647.952
Urban Cumberland Camp Hill 11.692 192.540 88.206 292.438 1,662.998
Urban Cumberland East Pennsboro 7.066 10.667 0.000 17.733 112.950
Urban Cumberland Hampden 25.223 306.735 0.280 332.238 2,381.117
Urban Cumberland Lower Allen 75.460 2,174.041 34.530 2,284.030 10,552.154
Urban Cumberland Mechanicsburg 2.289 176.312 0.751 179.353 568.002
Urban Cumberland Mt Holly Springs 3.435 144.366 1.580 149.381 1,254.593
Urban Cumberland New Cumberland 0.000 5.919 0.000 5.919 69.817
Urban Cumberland Shiremanstown 0.341 45.587 0.000 45.928 332.112
Urban Cumberland Upper Allen 111.613 3,202.941 29.747 3,344.301 11,896.199
Urban York Dillsboro 3.190 182.466 2.470 188.127 871.833
Urban York Fairview 6.635 624.752 16.774 648.161 2,013.483
Urban Cumberland Sub-Total 237.119 6,259.108 155.094 6,651.321 28,829.940
Urban York Sub-Total 9.826 807.218 19.244 836.288 2,885.316
Urban YBC Watershed Sub-Total 246.944 7,066.326 174.338 7,487.609 31,715.256
TOTAL YBC Watershed TOTAL 714.277 43,982.530 1,031.548 45,728.355 186,363.208
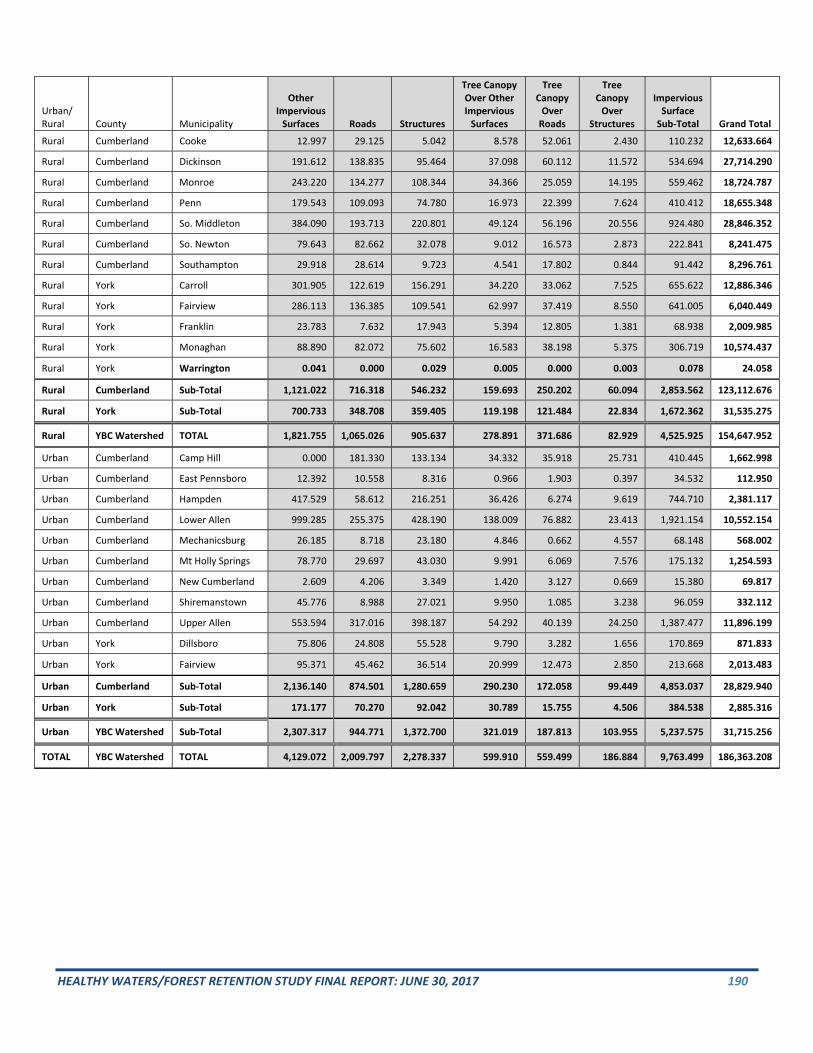
HEALTHY WATERS/FOREST RETENTION STUDY FINAL REPORT: JUNE 30, 2017 190
Urban/ Rural County Municipality
Other Impervious
Surfaces Roads Structures
Tree Canopy Over Other Impervious
Surfaces
Tree Canopy
Over Roads
Tree Canopy
Over Structures
Impervious Surface
Sub-Total Grand Total
Rural Cumberland Cooke 12.997 29.125 5.042 8.578 52.061 2.430 110.232 12,633.664
Rural Cumberland Dickinson 191.612 138.835 95.464 37.098 60.112 11.572 534.694 27,714.290
Rural Cumberland Monroe 243.220 134.277 108.344 34.366 25.059 14.195 559.462 18,724.787
Rural Cumberland Penn 179.543 109.093 74.780 16.973 22.399 7.624 410.412 18,655.348
Rural Cumberland So. Middleton 384.090 193.713 220.801 49.124 56.196 20.556 924.480 28,846.352
Rural Cumberland So. Newton 79.643 82.662 32.078 9.012 16.573 2.873 222.841 8,241.475
Rural Cumberland Southampton 29.918 28.614 9.723 4.541 17.802 0.844 91.442 8,296.761
Rural York Carroll 301.905 122.619 156.291 34.220 33.062 7.525 655.622 12,886.346
Rural York Fairview 286.113 136.385 109.541 62.997 37.419 8.550 641.005 6,040.449
Rural York Franklin 23.783 7.632 17.943 5.394 12.805 1.381 68.938 2,009.985
Rural York Monaghan 88.890 82.072 75.602 16.583 38.198 5.375 306.719 10,574.437
Rural York Warrington 0.041 0.000 0.029 0.005 0.000 0.003 0.078 24.058
Rural Cumberland Sub-Total 1,121.022 716.318 546.232 159.693 250.202 60.094 2,853.562 123,112.676
Rural York Sub-Total 700.733 348.708 359.405 119.198 121.484 22.834 1,672.362 31,535.275
Rural YBC Watershed TOTAL 1,821.755 1,065.026 905.637 278.891 371.686 82.929 4,525.925 154,647.952
Urban Cumberland Camp Hill 0.000 181.330 133.134 34.332 35.918 25.731 410.445 1,662.998
Urban Cumberland East Pennsboro 12.392 10.558 8.316 0.966 1.903 0.397 34.532 112.950
Urban Cumberland Hampden 417.529 58.612 216.251 36.426 6.274 9.619 744.710 2,381.117
Urban Cumberland Lower Allen 999.285 255.375 428.190 138.009 76.882 23.413 1,921.154 10,552.154
Urban Cumberland Mechanicsburg 26.185 8.718 23.180 4.846 0.662 4.557 68.148 568.002
Urban Cumberland Mt Holly Springs 78.770 29.697 43.030 9.991 6.069 7.576 175.132 1,254.593
Urban Cumberland New Cumberland 2.609 4.206 3.349 1.420 3.127 0.669 15.380 69.817
Urban Cumberland Shiremanstown 45.776 8.988 27.021 9.950 1.085 3.238 96.059 332.112
Urban Cumberland Upper Allen 553.594 317.016 398.187 54.292 40.139 24.250 1,387.477 11,896.199
Urban York Dillsboro 75.806 24.808 55.528 9.790 3.282 1.656 170.869 871.833
Urban York Fairview 95.371 45.462 36.514 20.999 12.473 2.850 213.668 2,013.483
Urban Cumberland Sub-Total 2,136.140 874.501 1,280.659 290.230 172.058 99.449 4,853.037 28,829.940
Urban York Sub-Total 171.177 70.270 92.042 30.789 15.755 4.506 384.538 2,885.316
Urban YBC Watershed Sub-Total 2,307.317 944.771 1,372.700 321.019 187.813 103.955 5,237.575 31,715.256
TOTAL YBC Watershed TOTAL 4,129.072 2,009.797 2,278.337 599.910 559.499 186.884 9,763.499 186,363.208
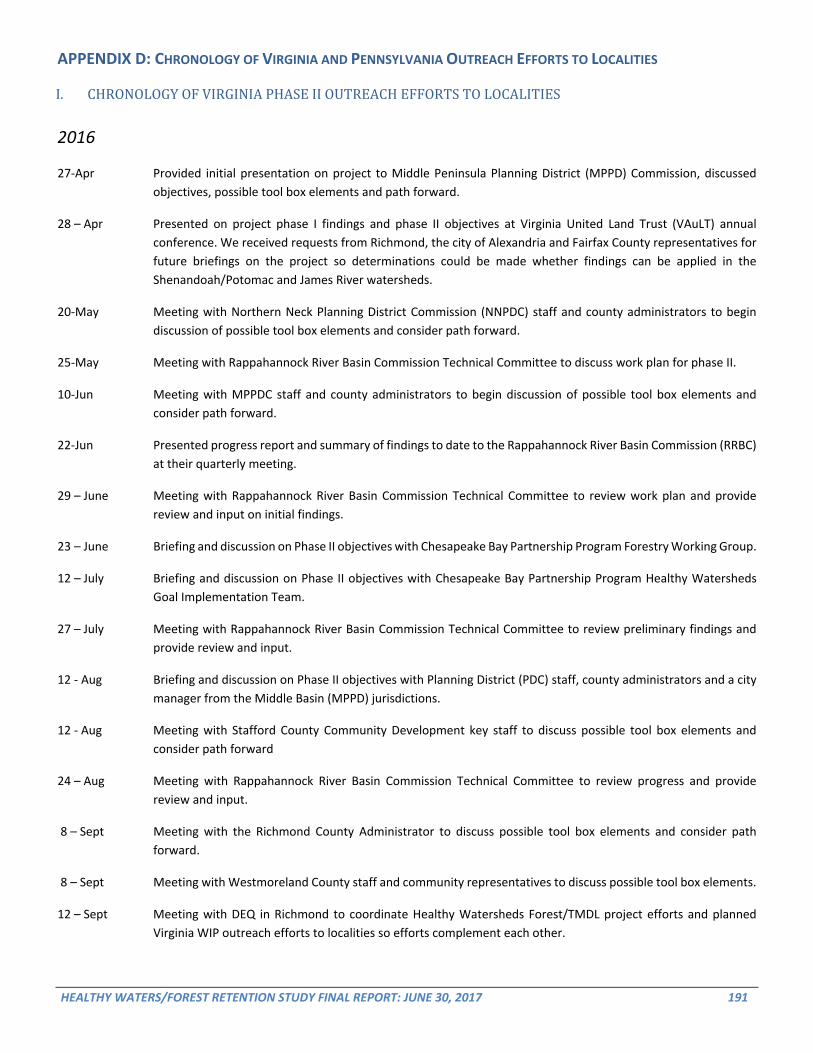
HEALTHY WATERS/FOREST RETENTION STUDY FINAL REPORT: JUNE 30, 2017 191
APPENDIX D: CHRONOLOGY OF VIRGINIA AND PENNSYLVANIA OUTREACH EFFORTS TO LOCALITIES I. CHRONOLOGY OF VIRGINIA PHASE II OUTREACH EFFORTS TO LOCALITIES
2016
27-Apr Provided initial presentation on project to Middle Peninsula Planning District (MPPD) Commission, discussed objectives, possible tool box elements and path forward.
28 – Apr Presented on project phase I findings and phase II objectives at Virginia United Land Trust (VAuLT) annual conference. We received requests from Richmond, the city of Alexandria and Fairfax County representatives for future briefings on the project so determinations could be made whether findings can be applied in the Shenandoah/Potomac and James River watersheds.
20-May Meeting with Northern Neck Planning District Commission (NNPDC) staff and county administrators to begin discussion of possible tool box elements and consider path forward.
25-May Meeting with Rappahannock River Basin Commission Technical Committee to discuss work plan for phase II.
10-Jun Meeting with MPPDC staff and county administrators to begin discussion of possible tool box elements and consider path forward.
22-Jun Presented progress report and summary of findings to date to the Rappahannock River Basin Commission (RRBC) at their quarterly meeting.
29 – June Meeting with Rappahannock River Basin Commission Technical Committee to review work plan and provide review and input on initial findings.
23 – June Briefing and discussion on Phase II objectives with Chesapeake Bay Partnership Program Forestry Working Group.
12 – July Briefing and discussion on Phase II objectives with Chesapeake Bay Partnership Program Healthy Watersheds Goal Implementation Team.
27 – July Meeting with Rappahannock River Basin Commission Technical Committee to review preliminary findings and provide review and input.
12 - Aug Briefing and discussion on Phase II objectives with Planning District (PDC) staff, county administrators and a city manager from the Middle Basin (MPPD) jurisdictions.
12 - Aug Meeting with Stafford County Community Development key staff to discuss possible tool box elements and consider path forward
24 – Aug Meeting with Rappahannock River Basin Commission Technical Committee to review progress and provide review and input.
8 – Sept Meeting with the Richmond County Administrator to discuss possible tool box elements and consider path forward.
8 – Sept Meeting with Westmoreland County staff and community representatives to discuss possible tool box elements.
12 – Sept Meeting with DEQ in Richmond to coordinate Healthy Watersheds Forest/TMDL project efforts and planned Virginia WIP outreach efforts to localities so efforts complement each other.

HEALTHY WATERS/FOREST RETENTION STUDY FINAL REPORT: JUNE 30, 2017 192
12 - Sept Telephone meeting with the Lancaster County Administrator to discuss possible tool box elements and consider path forward.
21 – Sept Meeting with Rappahannock River Basin Commission Technical Committee to review progress and provide review and input.
28 – Sept Provided update on project progress at quarterly meeting of Rappahannock River Basin Commission in Warrenton and following meeting met with General Assembly representatives to discuss the challenges identified by localities to-date and what legislative remedies might be possible.
4 - Oct Participated in joint presentation with Delegate Keith Hodges before newly-appointed Essex County Agriculture and Forestal Economic Development Advisory Board on “blue/green" infrastructure ideas for Rural Coastal Virginia with principal focus on project phase II objectives.
17 – Oct Meeting with Lancaster County Focus Group selected by County Administrator to discuss possible tool box elements and consider path forward.
18 – Oct Meeting with Essex County Planning Commission in follow-up to October 4 joint presentation with Delegate Keith Hodges for in-depth discussion on forestland retention challenges and possible tool box elements.
26 – Oct Meeting with Rappahannock River Basin Commission Technical Committee to review progress and provide review and input.
2 – Nov Meeting of combined VA/PA project team with Chesapeake Bay Partners Program Forestry Workgroup on project status and preliminary findings and challenges. Forestry Workgroup offered to begin working on the mechanics of a TMDL credit for forestland retention.
4 – Nov Meeting with Rappahannock-Rapidan Regional Commission members to discuss forestland retention challenges and possible tool box elements.
8 – Nov Meeting with planning officials from the City of Alexandria who had heard of the project and wanted to learn more about it for possible application in the Shenandoah/Potomac watershed. Briefed them on project objectives and findings to-date.
17 – Nov Briefing on Healthy Watersheds/Forest TMDL Phase II project objectives and discussion with Rappahannock-Rapidan Regional Commission Land Use and Environment Committee.
18 – Nov Joint PA/VA team briefing in Harrisburg, PA to Chesapeake Bay Healthy Watersheds Goal Implementation Team on project status in both Commonwealths.
22 – Nov Meeting with Rappahannock River Basin Commission Technical Committee to review progress and provide review and input.
30 – Nov Presented on project objectives and findings to-date to the Great Valley Stormwater Forum, a regional stormwater practitioner forum focused on meeting the needs and challenges of communities in the Great Valley of the Bay watershed, which included portions of WV, VA, MD and PA. Audience consisted of approximately 80 planning and natural resource agency representatives from those jurisdictions.
7 – Dec Provided project update briefing to the members of the Rappahannock River Basin Commission in Richmond at their quarterly meeting.
13 - Dec Meeting with King George County Focus Group selected by County leaders to discuss forestland retention challenges and possible tool box elements.

HEALTHY WATERS/FOREST RETENTION STUDY FINAL REPORT: JUNE 30, 2017 193
14 – Dec Meeting with Stafford County Focus Group selected by County leaders to discuss forestland retention challenges and possible tool box elements.
2017
3 – Jan Meeting with Caroline County planning, finance and environmental agency representatives along with external stakeholders selected by County leaders to discuss forestland retention challenges and possible tool box elements.
8 – Jan Meeting with collaboration partner team working with the George Washington Regional Commission (GWRC), City of Fredericksburg and surrounding counties to identify high conservation value forestland meriting retention to enable the GWRC sustainable land use plan to be implemented and the potential offset savings recognized in HWF/TMDL phase I to be realized.
30 – Jan Invited by Virginia Department of Environmental Quality (VDEQ) to participate in two WIP III regional meetings with local officials in northern Virginia to brief participants on HWF/TMDL project objectives and major challenges identified to-date. Because the HWF/TMDL project team has already been in the field talking to local officials since April 2016, HWF/TMDL project findings and recommendations will be used to inform 2017 DEQ WIP III local engagement activities.
30 – Jan Briefed Citizens’ Advisory Committee to the Chesapeake Bay Council (CAC) Land Use subcommittee on the project findings to-date and recommended subject areas for CAC consideration. The CAC subcommittee concurred with the recommendations.
1 – Feb Briefed the Chesapeake Bay Partners Program Land Use Workgroup on project findings to-date that are relevant to TMDL model assumptions.
6 – Feb Meeting with representatives from the Real Estate industry to understand their perspectives on what the most effective forestland retention incentives are and how those incentives should be structured.
8 – Feb Meeting with Spotsylvania County planning, environmental and finance staff to discuss forestland retention challenges and possible tool box elements.
9 – Feb Teleconference meeting with Pennsylvania partners and their new team member, the Center for Watershed Protection, to share what Virginia had been learning from its discussions with localities and to discuss Pennsylvania’s approach.
21 – Feb Participated in VDEQ WIP III engagement meetings with local elected officials in Woodbridge, Virginia and briefed participants on findings of the HWF/TMDL project.
2/3 – Mar Briefed forestry representatives from Chesapeake Bay jurisdictions on major project findings to-date at regional riparian forest buffers conference sponsored by USFS, NRCS and the Chesapeake Bay Partners program
13 – Mar Briefed the Chair of the Virginia Chamber of Commerce and Virginia Naturally on project findings and discussed possible industry support for “tool box elements” to address major barriers and challenges identified to-date through the discussions with localities. Received commitment of support for project objectives and offer to assist in building industry support.
15 – Mar Meeting with Rappahannock River Basin Commission Technical Committee to review progress and provide review and input.

HEALTHY WATERS/FOREST RETENTION STUDY FINAL REPORT: JUNE 30, 2017 194
15 – Mar Meeting with Chair of the Chesapeake Bay Partners Program Forestry Workgroup to discuss project findings to-date and to discuss options for structuring a forestland retention TMDL that could be integrated into the Chesapeake Bay TMDL model.
21 – Mar Participated on a panel focused on quantifying the benefits of source water protection and presented on the HWF/TMDL project at an American Water Works Association Sustainable Water Management Conference in New Orleans. Presentation was well attended and requests for follow-up to learn more about what VA and PA are doing were received from water utility in West Virginia, the Department of Natural Resources in Georgia and the Southeastern Forests and Water Initiative.
22 – Mar Briefed Rappahannock River Basin Commission on progress and findings to date. This led to an extensive discussion with feedback from both state and local elected officials on topics including state and local tax policy, fee simple acquisition versus conservation easements, term versus perpetual easements, and non-point nutrient trading up and down the river basin.
23 – Mar Briefed members of the Caroline County Farm Bureau on project progress and findings to date and discussed how possible land use value taxation and easement changes aimed at prioritizing forestland retention may also be applicable to agricultural lands and in incentivizing more riparian forest buffer actions.
27 – Mar Briefed representative from the Chesapeake Conservancy on lessons learned to-date from working with localities and other stakeholders to assist Conservancy in preparing, at request of EPA Chesapeake Bay Program office management, talking points to be used with localities and others to promote a change in the TMDL model from a 2010 baseline to a 2025 baseline.
5 – April Meeting with Rappahannock River Basin Commission Technical Committee to review progress and provide review and input.
5 – April Meeting with Stafford County planning, finance and environmental agency representatives along with external stakeholders selected by County leaders to discuss forestland retention challenges and possible tool box elements. Also met with Stafford County’s Commissioner of Revenue to discuss forest retention project and preliminary findings from other meetings.
21 – April Updated members of the Chesapeake Bay Partnership Healthy Watersheds Goal Implementation Team on Phase II findings, challenges and potential recommendations
24 – April Meeting with Culpeper County planning, finance and environmental agency representatives along with external stakeholders selected by County leaders to discuss forestland retention challenges and possible tool box elements.
28 – April Meeting with Rappahannock River Basin Commission Technical Committee to review progress and provide review and input.
24 – April Meeting with Orange County planning, finance and environmental agency representatives along with external
stakeholders selected by County leaders to discuss forestland retention challenges and possible tool box elements.
16 – May Meeting with City of Fredericksburg planning, finance and environmental agency representatives along with external stakeholders selected by County leaders to discuss forestland retention challenges and possible tool box elements.
16 – May Meeting with EPA Chesapeake Bay officials in Annapolis to discuss crediting conservation in the Bay TMDL

HEALTHY WATERS/FOREST RETENTION STUDY FINAL REPORT: JUNE 30, 2017 195
22 – May Presentation on HWF/TMDL project findings to Maryland state forestry advisory board and discussion on VA/MD collaboration working with EPA to structure TMDL forestland retention credit
24 – May Meeting with Rappahannock River Basin Commission Technical Committee to review progress and provide review and input
24 – May Meeting with Tax Commissioners and other finance officials to discuss options for changing the Virginia tax code to further incentivize forestland retention actions
Remaining Scheduled Meetings as of this writing:
7 – June Meeting of Joint Chesapeake Bay Program Land Use Work-group/Local Government Advisory Committee “Forum on Land Use Growth” in Annapolis to discuss the potential use of future land use scenarios to inform local restoration and conservation actions, explore possible scenario narratives and assumptions, and build consensus around a subset of scenarios to inform Phase III WIP development.
22 – June Presentation on project findings and recommendations at quarterly meeting of Rappahannock River Basin Commission II. CHRONOLOGY OF PENNSYLVANIA PHASE II OUTREACH EFFORTS TO LOCALITIES
1. DCNR staff conversations with municipal and state agency and conservation/environmental stakeholders throughout the YBC watershed, and elsewhere in Pennsylvania, throughout the Phase II project.
2. A DCNR project presentation on October 13th, 2016 to the Yellow Breeches Creek Watershed Association
(Cumberland Co.), followed by discussion, questions, and comments raised by the audience. 3. A project presentation on May 10, 2017 to local audience at Fairview Twp. Community Hall (York Co.), followed
by discussion, questions and comments raised by the audience. (See Comment Summary on next page.) 4. A project presentation on June 1, 2017 to local audience at Cumberland Co. Planning Office (Carlisle, PA),
followed by discussion, questions and comments raised by the audience. (See Comment Summary on next page.) 5. PA Department of Environmental Protection, Pennsylvania Phase III Watershed Improvement Plan (WIP), Open
Space Forum, June 5, 2017

HEALTHY WATERS/FOREST RETENTION STUDY FINAL REPORT: JUNE 30, 2017 196
PA Forest Retention/Healthy Waters Project Workshop Public Comment Themes/Issues LEGEND: Fairview Town Hall Discussion Points: 10 May 2017 / Carlisle Outreach Mtg. 6/1/2017
1. Incentives • What works in one region of PA, might not work in another, provide options (i.e. a competitive program to get
communities to meet TMDL goals/incentives by a certain timeframe within a county to receive a title “Clean Water Community” or something)
• Competitive funding available through the Federal Forest Legacy Program • Are all incentives financial? • Municipalities need incentives to offer to forest landowners • Challenges: CREP doesn’t pay enough for maintenance if the landowner can’t conduct maintenance themselves
o Issues with invasives o Requires lots of people resources/leg work
• SW fee credit for forest covered open space vs. lawn covered open space • Why not preserve forests like we preserve prime Ag. land? Why not classify forest as automatic “prime Ag. land”? • Reference: PennDOT/DEP Collaboration in York Co.
o DEP/PennDOT funds to help install BMPs in York = saves them money to join onto York’s PRP instead of creating their own = win win!
• Municipalities say (there are) no incentives? So they cut the forests down and they pay to replant saplings? 2. Engaging Partners
• Municipal governments already overworked and focusing on MS4’s, working on this additional project may overstretch folks= need to emphasize that it is NOT doing additional work; it’s just keeping status quo and building smarter
• DEP- partner to send our project message to municipalities? • Need to map High conservation value forest at micro level, • Need to encourage folks to retain their high value forest • Lack of cooperation between governments in PA, in this region especially; we need to think about how to get the
message out to each jurisdiction effectively • Attract USDA and NRCS as future partners • People like to hear stories; recommend case studies or includes a few good stories and a few horror stories • Final report presentation-use this group to call up supervisors to ensure they are here; demand supervisors participation • As a society, we are building too much and need to care more about land ethic! • Cooperative efforts are difficult with too many players at the table • Need an incentive from the state to municipalities who are cooperating regionally • Non-MS4 communities are not cooperating (local planner observation) • Water purveyors: potential partner • Possible partners (economic)—water suppliers, because forests protect their source water • Chesapeake Bay Foundation: 10 Million Tree Initiative • Chesapeake Bay Program is “Sector”-oriented, focusing on urban and Ag land. Need to switch to holistic watershed
orientation incorporating forest land. • Regional intergov. cooperation in York Co. is a little more than a “handful’ of municipalities… it is 72 municipalities.
3. Maintaining Viewsheds • Many landowners want a clear view of river/stream frontage
4. Credit Trading • Nutrient trading
o Does it relate to carbon trading? o New concept? o Happening in PA? Primarily (seen) between wastewater treatment plants o Any non-point to point or non-point to non-point? ….Being intently studied
• Forestland equivalent of wetland banking; but no forestland banking program • Supports Kevin’s ideas of supporting Forest Retention
5. State Fiscal & Environmental Policies
• (Question of:) Prioritizing where to direct limited funds: preservation or restoration (?)

HEALTHY WATERS/FOREST RETENTION STUDY FINAL REPORT: JUNE 30, 2017 197
• Taxing land in PA is issue, too costly, would like to see state support for tax incentives • Looked at Clean & Green program…didn’t like the State telling me what I can do with my land. • Perhaps on the farm utilize (forest retention) as a BMP • Streams should be fenced off from livestock • Doesn’t make sense for Regulators to give credit for planting trees and NOT credit for NOT cutting trees down (AKA
Retaining trees). • Cannot have continued growth/development without “spending” out natural resources • Why not allow detention basins revert back to trees? Trees are water pumps. • Why not utilize forest land to treat s/w runoff as BMP? • “…We don’t value forests like we do farmlands.” • “Everyone is essentially preserving the “problem” being the agricultural lands (aka primary polluters to the bay)”
6. State Land Management Practices • Gravel roads are a cause run-off concern in Michaux section (historical and in current use) • ATV and dirt bike activity on dirt roads in state forests cause further erosion effects on unpaved roads • Excessive gravel roads and road breaks are a major contributor to run-off in forested settings • Development: Turnpike, Sunoco, I-83 are all potential limitations • GIS web-based system that shows a public viewer of current contracted projects and completed projects in PA-both dirt
and gravel and low volume roads. • 2 current projects within Michaux- DCNR has 1 and Dickinson Twp has an on-going 4 Phase project on Cold Springs Rd. • No mitigation is completed other than what is disturbed by turnpike commission, PennDOT, Pipelines.
o Municipalities can get credit for the original disturbance area (Apparent loophole in PA PRP accounting) • Forested watersheds are the healthiest watersheds.
7. Education & Training • Set up tactical assistance program to provide technical assistance • Providing assistance in estate planning process for private landowners
8. Technical & Modeling Questions • Macro level modeling limiting factor in effort • What is the timeframe modeled for land use change? • How does model project forest regrowth after harvest (timeframe for model calibration)?
9. Local Zoning & Development Controls • Most zoning ordinances have a max. lot coverage percentage
o Impervious /developed v. open space • Fairview Township ordinance: buffer of 100 ft. (or 150 ft.) off YBC to developers • Potential to expand beyond the Yellow Breeches Creek Watershed?
o More impairment south of the watershed, Southern York County o Goal of project is to be able to replicate and utilize its results elsewhere
10. Conservation Easements • No apprehension to put conservation easements by agricultural landowners….“life altering” sums of money to conserve
prime soils. • Easements don’t seem to be a problem for York Co. farmers… long waiting list for agricultural preservation • Get IRS to look at selling easement as a donation and not income
LEGEND: Fairview Town Hall Discussion Points: 10 May 2017 Carlisle Outreach Mtg. 6/1/2017

HEALTHY WATERS/FOREST RETENTION STUDY FINAL REPORT: JUNE 30, 2017 198
APPENDIX E: PROJECT TEAM MEMBERS AND PERSONNEL VIRGINIA A. Virginia Department of Forestry (VDOF)
• Gregory Evans, Project Manager, Mitigation Program Manager/Chesapeake Bay Program Lead, Phase I & II
B. Rappahannock River Basin Commission (RRBC) • Eldon James, Coordinator - Phase I and II
C. Virginia Department of Environmental Quality (VDEQ)
• James Davis-Martin, Chesapeake Bay Program Manager, Phase I and II
D. George Washington Regional Commission (GWRC) • Tim Ware, Executive Director – Phase I • Doug Pickford, Conservation Concepts, LLC. – Phase I • Darren Coffey, AICP, CZM; - The Berkley Group, Inc. – Phase II • Kevin F. Byrnes, AICP - Regional Decision Systems, LLC – Phases I and II
E. Virginia Tech Water Resources Research Center (VTWRC)
• Stephen H. Schoenholtz, PhD., Director, Virginia Water Resources Research Center and Professor, Department of Forest Resources and Environmental Conservation, Virginia Tech - Phase I
• Neil Crescenti, Graduate student, Department of Forest Resources and Environmental Conservation, Virginia Tech - Phase I
F. Virginia Tech Land Use Education Program (LUEP)
• R. Michael Chandler, PhD., Director of Education - Phase II
G. The Nature Conservancy (TNC) • Mark Bryer, Chesapeake Bay Program Director – Phase I
H. The Chesapeake Bay Commission (CBC)
• Jack Frye, Virginia Director – Phase I • Ann Jennings, Virginia Director – Phase II
PENNSYLVANIA A. Pennsylvania Department of Conservation and Natural Resources
Bureau of Forestry, Rural & Community Forestry Section • Su Ann Shupp, Land Conservation Coordinator, Project Manager, Phase II • Mark Hockley, Urban Tree Canopy Coordinator, Phase II • Teddi Stark, Riparian Forest Buffer Coordinator, Phase II • Rachel Reyna, Chief, Phase II
Bureau of Forestry, Geospatial Applications Section • John Smoluk, Natural Resource Specialist, Phase II Bureau of Forestry, Executive Staff • Matt Keefer, Assistant State Forester Bureau of Forestry, State Lands Management • Roy Brubaker, District Forester

HEALTHY WATERS/FOREST RETENTION STUDY FINAL REPORT: JUNE 30, 2017 199
Office of Policy and Planning • Sara J. Nicholas, Director
B. Cumberland County Planning Department
• Kirk D. Stoner, Director C. Center for Watershed Protection
• Bryan Seipp, Watershed Manager, Phase II D. Regional Decision Systems, L.L.C.
• Kevin F. Byrnes, AICP, Owner/Principal, Phase II