Embed Size (px)
Citation preview

1 HEALTHY LIVING &
NUTRACEUTICALS
M A R K E T M O N I T O R
S P R I N G 2 0 1 5
Healthy Living & Nutraceuticals

2 HEALTHY LIVING &
NUTRACEUTICALS
Contents Industry Update
Public Stock Performance & Valuations
M&A Activity & Valuations
Public Offerings & Capital Raises
Moss Adams Overview
Selected Moss Adams Capital Transactions
Contact Information
3
4
8
11
13
17
18

3 HEALTHY LIVING &
NUTRACEUTICALS
Healthy Living Manufacturers & Products Spur Growth
Healthy Products Manufacturers Continue to be Prime Acquisition Targets. In January, Post Holdings, Inc, acquired MOM Brands,
the largest family owned breakfast foods company in the country. The acquisition valuation multiple of 9.6x EBITDA represents
another strong comp for “Healthy Living” Manufacturers.
Transaction activity is robust. In particular, nutritional supplements and Nutraceuticals companies continue to see measurable
private placement and M&A activity, as both domestic and international buyers have increased interest in partaking in the growing
domestic demand for “Healthy Living” products
The Manufacturers index finished 2014 strong and is off to a positive start in 2015. The growth has primarily been led by functional
food and beverage companies. This, in connection with a strong M&A environment for healthy product manufactures, is resulting
in relatively high transaction multiples.
Retailers & Distributors: In response to consumers shying away from high prices, Healthy Living retailers – in particular Whole
Foods – have cut price in order to be more competitive with mass retailers expanding their organic offerings. As a result, retailers
are becoming leaner on cost structure in order to maintain margins, and invest in new growth initiatives that will expand margins.
One key example here is Whole Foods’ partnership with Instacart, in an effort for Whole Foods to bring grocery delivery to its
stores. Other partnerships, including partnerships with Apple Pay and applications that make the shopping experience easier for
the consumer, will be important priorities for retailers in 2015.
Source: IBIS Industry Analysis, Wall Street Journal, Nutrition Business Journal , USDA, National Center for Health Statistics, Moss Adams Capital analysis.

4 HEALTHY LIVING &
NUTRACEUTICALS
Healthy Living Retailers & Distributors Bottom in 2014 • Held back by Herbalife’s continued battles with activist investors, the Retailers & Distributors index bottomed out in late 2014 and has
since recovered to some degree. The Retailers & Distributors index is down 1% over the past three years; however, after removing Herbalife, the index is up 30% over the past three years.
• Manufacturers index: Functional beverage companies have helped increase the three year return of the Manufacturers Index to 16% above that of the S&P 500.
Source: CapitalIQ.
(1) Healthy Living Manufacturers index, and Healthy Living Retailers & Distributors index comprised of companies on page 5 and 6.
Indexed(1) Stock Price Performance – Last Three Years
Manufacturers
71%
S&P 500
55%
Retailers &
Distributors
-1%
-50%
-25%
0%
25%
50%
75%
Ma
rk
et
Pe
rfo
rm
an
ce

5 HEALTHY LIVING &
NUTRACEUTICALS
Source: CapitalIQ.
Note: Not meaningful (NM) if EV/Sales is greater than 10x, or EV/EBITDA is greater than 40x. NA if denominator is 0, for percentages and multiples, or if estimates are not available. NTM figures are based on the median estimate of Wall St. analysts.
Public Company Valuations: Manufacturers
Manufacturers
($US in millions, except where noted and per share amounts) TTM Data EV Multiple
2/25/15 52 week Market Enterprise EBITDA TTM TTM NTM
Company Name Sh. Price High/Low Cap Value Sales EBITDA Margin Sales EBITDA Sales EBITDA EBITDA
Perrigo Company $158.00 $172.00 / $125.37 $22,246 $23,437 $4,172 $1,187 28.4% 10.4% 30.4% 5.6x 19.8x 15.1x
Mead Johnson Nutrition 102.85 105.45 / 80.86 20,807 21,093 4,409 1,068 24.2% 3.3% 14.9% 4.8x 19.8x 17.2x
Monster Beverage Corporation 139.54 143.90 / 63.00 23,724 22,573 2,465 771 31.3% 18.2% 29.9% 9.2x 29.3x 22.5x
The WhiteWave Foods Company 42.48 41.78 / 25.82 7,410 8,908 3,437 389 11.3% 10.3% 24.9% 2.6x 22.9x 18.3x
The Hain Celestial Group, Inc. 62.77 62.90 / 40.84 6,384 7,124 2,469 295 11.9% 13.1% 32.3% 2.9x 24.2x 18.3x
Nu Skin Enterprises Inc. 53.76 97.49 / 38.12 3,196 3,142 2,569 407 15.8% (1.5%) 7.3% 1.2x 7.7x 7.2x
USANA Health Sciences Inc. 100.00 118.84 / 63.22 1,231 1,120 790 125 15.8% 8.0% 10.1% 1.4x 9.0x 8.1x
SunOpta Inc. 9.95 16.22 / 10.40 667 987 1,243 66 5.3% 8.5% 20.1% 0.8x 14.9x 12.4x
Boulder Brands, Inc. 10.63 18.46 / 7.77 651 926 517 59 11.5% 7.1% 35.9% 1.8x 15.6x 11.5x
Inventure Foods, Inc. 10.51 14.50 / 9.60 205 290 286 25 8.6% 5.9% 9.8% 1.0x 11.8x 10.8x
Nature's Sunshine Products 12.72 18.37 / 12.66 237 180 366 25 6.7% 4.4% 6.1% 0.5x 7.3x 6.9x
Nutraceutical International 17.18 29.15 / 16.28 166 204 216 38 17.4% 3.5% (3.6%) 0.9x 5.4x 5.6x
Median $2,131 $1,854 $210 13.9% 7.6% 17.5% 1.6x 15.2x 11.9x
Average $7,499 $1,912 $371 15.7% 7.6% 18.2% 2.7x 15.6x 12.8x
NTM Est. Growth
Strong NTM EBITDA growth projections.
6 HEALTHY LIVING &
NUTRACEUTICALS
Source: CapitalIQ.
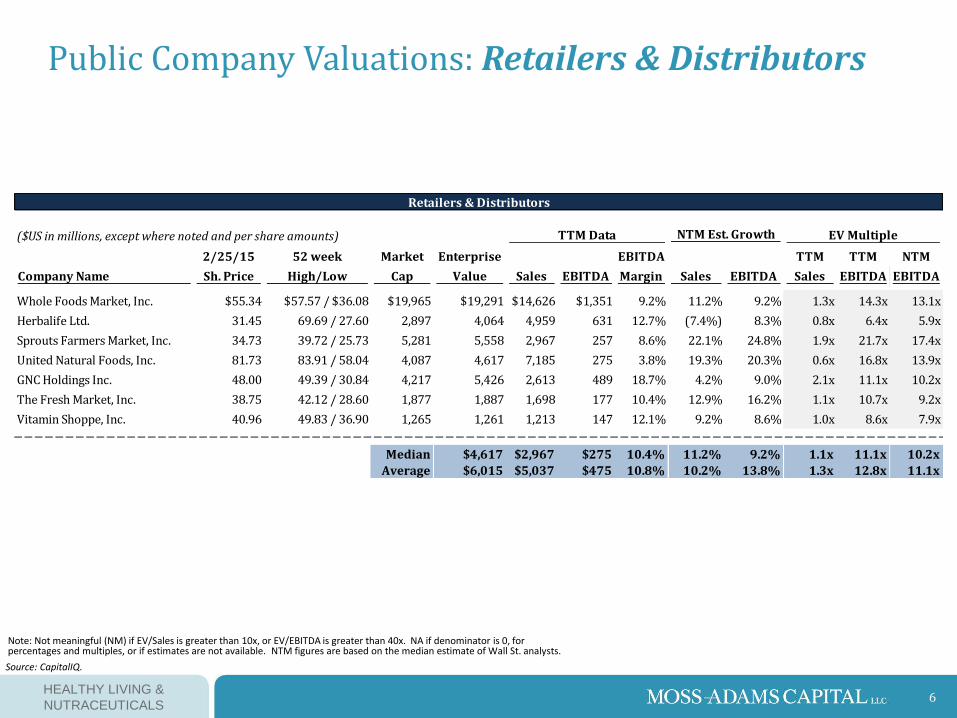
Note: Not meaningful (NM) if EV/Sales is greater than 10x, or EV/EBITDA is greater than 40x. NA if denominator is 0, for percentages and multiples, or if estimates are not available. NTM figures are based on the median estimate of Wall St. analysts.
Public Company Valuations: Retailers & Distributors
Retailers & Distributors
($US in millions, except where noted and per share amounts) TTM Data EV Multiple
2/25/15 52 week Market Enterprise EBITDA TTM TTM NTM
Company Name Sh. Price High/Low Cap Value Sales EBITDA Margin Sales EBITDA Sales EBITDA EBITDA
Whole Foods Market, Inc. $55.34 $57.57 / $36.08 $19,965 $19,291 $14,626 $1,351 9.2% 11.2% 9.2% 1.3x 14.3x 13.1x
Herbalife Ltd. 31.45 69.69 / 27.60 2,897 4,064 4,959 631 12.7% (7.4%) 8.3% 0.8x 6.4x 5.9x
Sprouts Farmers Market, Inc. 34.73 39.72 / 25.73 5,281 5,558 2,967 257 8.6% 22.1% 24.8% 1.9x 21.7x 17.4x
United Natural Foods, Inc. 81.73 83.91 / 58.04 4,087 4,617 7,185 275 3.8% 19.3% 20.3% 0.6x 16.8x 13.9x
GNC Holdings Inc. 48.00 49.39 / 30.84 4,217 5,426 2,613 489 18.7% 4.2% 9.0% 2.1x 11.1x 10.2x
The Fresh Market, Inc. 38.75 42.12 / 28.60 1,877 1,887 1,698 177 10.4% 12.9% 16.2% 1.1x 10.7x 9.2x
Vitamin Shoppe, Inc. 40.96 49.83 / 36.90 1,265 1,261 1,213 147 12.1% 9.2% 8.6% 1.0x 8.6x 7.9x
Median $4,617 $2,967 $275 10.4% 11.2% 9.2% 1.1x 11.1x 10.2x
Average $6,015 $5,037 $475 10.8% 10.2% 13.8% 1.3x 12.8x 11.1x
NTM Est. Growth

7 HEALTHY LIVING &
NUTRACEUTICALS
Source: Capital IQ.
Public Market EV / EBITDA Multiples(1)
Strong Growth and Valuation Multiples for Manufacturers • Manufacturers index continues to make strides, supported by
strong jumps in valuation for Monster Beverage Company, WhiteWave, and Hain Celestial Group.
• Retailers & Distributors index recovers as a result of strong performance by Whole Foods and United Natural Foods.
Next 12 Months: Estimated Sales Growth
• Growth expectations are strong for many of the manufacturers and retailers in our universe. in the sector, as evidenced by NTM (Next Twelve Months) forecasts below.
• With Whole Foods turning the corner on gross margins and forecasting 9-10% growth for 2015, we expect the Retailers & Distributors Index to recover in 2015.
(1) 200-day moving average used, and market-weighted index: ending values will not match page 5 and 6 .Healthy Living Manufacturers index, and Healthy Living Retailers & Distributors index comprised of companies on page 5 and page 6.
Manufacturers
19.7x
S&P 500
12.2x
Retailers &
Distributors
11.8x
0
5
10
15
20
25
Ma
rk
et
Pe
rfo
rm
an
ce

8 HEALTHY LIVING &
NUTRACEUTICALS
U.S. middle market M&A deal volumes grew 17% in 2014; Q4 2014 grew 9% over Q4 2013.
U.S. middle market M&A activity, measured by deal values, increased 27% in 2014; Q4 2014 grew 18% over Q4 2013.
2) Middle market M&A includes transactions with disclosed EBITDA, where EV < $500 million and EV/EBITDA < 10x. Note: transactions with disclosed EBITDA represent <5% of all transactions
1) Middle market M&A includes transactions with undisclosed values, and disclosed values where EV < $500 million
Source: CapitalIQ
Middle Market M&A Activity is Up Overall
EBITDA multiples of middle market transactions in Q4 2014 reached a four-year high at 7.6x, well above the four year average of 6.5x.
Q4 2014 EBITDA margins of reportable transactions dipped slightly from Q3 2014, regressing to levels seen in 1H 2014.
2,855
2,953
2,927
3,080
2,984
3,682 3,681
3,852
3,539 3,453
3,622
3,986
3,134
3,319
4,092 4,054
3,997 4,095
4,608
4,410
$32
$43
$56 $55
$47
$71 $72$70
$52$56
$52
$66
$44
$50
$65
$71
$55
$70
$84 $83
$0
$20
$40
$60
$80
$100
$120
$140
0
500
1,000
1,500
2,000
2,500
3,000
3,500
4,000
4,500
5,000
Q1 Q2 Q3 Q4 Q1 Q2 Q3 Q4 Q1 Q2 Q3 Q4 Q1 Q2 Q3 Q4 Q1 Q2 Q3 Q4
2010 2011 2012 2013 2014
Tran
saction
Valu
e ($b
n)N
um
ber
of
Tra
nsa
ctio
ns
Number Value
4.8x
6.7x
6.4x
7.0x
6.7x6.8x 6.8x
6.9x
5.9x
6.4x6.2x 6.2x
6.4x
6.0x6.2x
7.2x7.0x
6.1x5.9x
7.6x
15.0%14.2%
15.3%14.5%
16.7%16.6%16.9%
15.0%
12.4%13.0%
14.6%
16.7%
15.3%14.8%
13.7%
10.6%
17.0%17.0%
19.1%
17.2%
0%
5%
10%
15%
20%
25%
30%
35%
40%
0.0 x
1.0 x
2.0 x
3.0 x
4.0 x
5.0 x
6.0 x
7.0 x
8.0 x
Q1 Q2 Q3 Q4 Q1 Q2 Q3 Q4 Q1 Q2 Q3 Q4 Q1 Q2 Q3 Q4 Q1 Q2 Q3 Q4
2010 2011 2012 2013 2014
EB
ITD
A M
argin
EV
/Tra
ilin
g E
BIT
DA
Mu
ltip
le
EV/EBITDA EBITDA Margin
U.S. MIDDLE MARKET M&A VALUATIONS 2 U.S. MIDDLE MARKET M&A 1
9 HEALTHY LIVING &
NUTRACEUTICALS
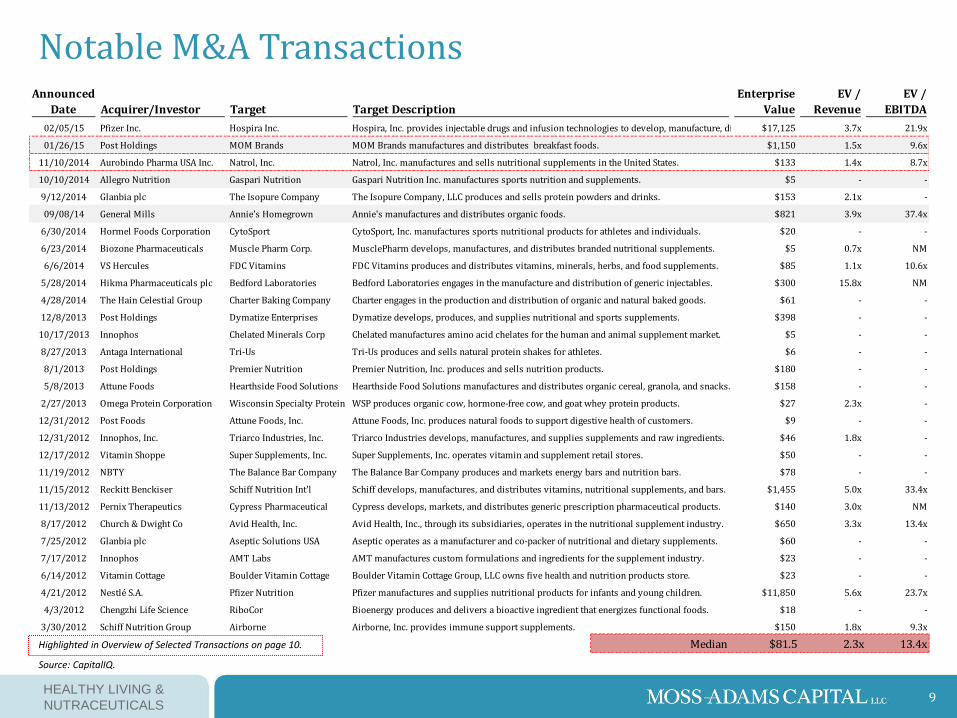
Source: CapitalIQ.
Notable M&A Transactions
Highlighted in Overview of Selected Transactions on page 10.
Announced Enterprise EV / EV /
Date Acquirer/Investor Target Target Description Value Revenue EBITDA
02/05/15 Pfizer Inc. Hospira Inc. Hospira, Inc. provides injectable drugs and infusion technologies to develop, manufacture, distribute, and market products worldwide.$17,125 3.7x 21.9x
01/26/15 Post Holdings MOM Brands MOM Brands manufactures and distributes breakfast foods. $1,150 1.5x 9.6x
11/10/2014 Aurobindo Pharma USA Inc. Natrol, Inc. Natrol, Inc. manufactures and sells nutritional supplements in the United States. $133 1.4x 8.7x
10/10/2014 Allegro Nutrition Gaspari Nutrition Gaspari Nutrition Inc. manufactures sports nutrition and supplements. $5 - -
9/12/2014 Glanbia plc The Isopure Company The Isopure Company, LLC produces and sells protein powders and drinks. $153 2.1x -
09/08/14 General Mills Annie's Homegrown Annie's manufactures and distributes organic foods. $821 3.9x 37.4x
6/30/2014 Hormel Foods Corporation CytoSport CytoSport, Inc. manufactures sports nutritional products for athletes and individuals. $20 - -
6/23/2014 Biozone Pharmaceuticals Muscle Pharm Corp. MusclePharm develops, manufactures, and distributes branded nutritional supplements. $5 0.7x NM
6/6/2014 VS Hercules FDC Vitamins FDC Vitamins produces and distributes vitamins, minerals, herbs, and food supplements. $85 1.1x 10.6x
5/28/2014 Hikma Pharmaceuticals plc Bedford Laboratories Bedford Laboratories engages in the manufacture and distribution of generic injectables. $300 15.8x NM
4/28/2014 The Hain Celestial Group Charter Baking Company Charter engages in the production and distribution of organic and natural baked goods. $61 - -
12/8/2013 Post Holdings Dymatize Enterprises Dymatize develops, produces, and supplies nutritional and sports supplements. $398 - -
10/17/2013 Innophos Chelated Minerals Corp Chelated manufactures amino acid chelates for the human and animal supplement market. $5 - -
8/27/2013 Antaga International Tri-Us Tri-Us produces and sells natural protein shakes for athletes. $6 - -
8/1/2013 Post Holdings Premier Nutrition Premier Nutrition, Inc. produces and sells nutrition products. $180 - -
5/8/2013 Attune Foods Hearthside Food Solutions Hearthside Food Solutions manufactures and distributes organic cereal, granola, and snacks. $158 - -
2/27/2013 Omega Protein Corporation Wisconsin Specialty Protein WSP produces organic cow, hormone-free cow, and goat whey protein products. $27 2.3x -
12/31/2012 Post Foods Attune Foods, Inc. Attune Foods, Inc. produces natural foods to support digestive health of customers. $9 - -
12/31/2012 Innophos, Inc. Triarco Industries, Inc. Triarco Industries develops, manufactures, and supplies supplements and raw ingredients. $46 1.8x -
12/17/2012 Vitamin Shoppe Super Supplements, Inc. Super Supplements, Inc. operates vitamin and supplement retail stores. $50 - -
11/19/2012 NBTY The Balance Bar Company The Balance Bar Company produces and markets energy bars and nutrition bars. $78 - -
11/15/2012 Reckitt Benckiser Schiff Nutrition Int'l Schiff develops, manufactures, and distributes vitamins, nutritional supplements, and bars. $1,455 5.0x 33.4x
11/13/2012 Pernix Therapeutics Cypress Pharmaceutical Cypress develops, markets, and distributes generic prescription pharmaceutical products. $140 3.0x NM
8/17/2012 Church & Dwight Co Avid Health, Inc. Avid Health, Inc., through its subsidiaries, operates in the nutritional supplement industry. $650 3.3x 13.4x
7/25/2012 Glanbia plc Aseptic Solutions USA Aseptic operates as a manufacturer and co-packer of nutritional and dietary supplements. $60 - -
7/17/2012 Innophos AMT Labs AMT manufactures custom formulations and ingredients for the supplement industry. $23 - -
6/14/2012 Vitamin Cottage Boulder Vitamin Cottage Boulder Vitamin Cottage Group, LLC owns five health and nutrition products store. $23 - -
4/21/2012 Nestlé S.A. Pfizer Nutrition Pfizer manufactures and supplies nutritional products for infants and young children. $11,850 5.6x 23.7x
4/3/2012 Chengzhi Life Science RiboCor Bioenergy produces and delivers a bioactive ingredient that energizes functional foods. $18 - -
3/30/2012 Schiff Nutrition Group Airborne Airborne, Inc. provides immune support supplements. $150 1.8x 9.3x
Median $81.5 2.3x 13.4x
10 HEALTHY LIVING &
NUTRACEUTICALS
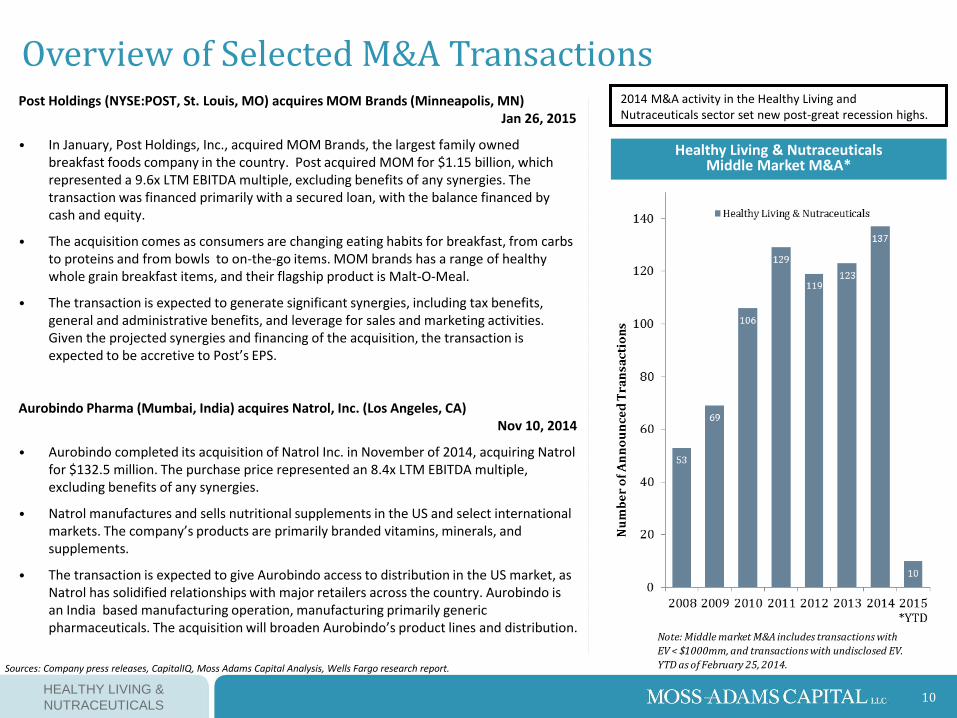
Overview of Selected M&A Transactions
Sources: Company press releases, CapitalIQ, Moss Adams Capital Analysis, Wells Fargo research report.
Post Holdings (NYSE:POST, St. Louis, MO) acquires MOM Brands (Minneapolis, MN) Jan 26, 2015
• In January, Post Holdings, Inc., acquired MOM Brands, the largest family owned breakfast foods company in the country. Post acquired MOM for $1.15 billion, which represented a 9.6x LTM EBITDA multiple, excluding benefits of any synergies. The transaction was financed primarily with a secured loan, with the balance financed by cash and equity.
• The acquisition comes as consumers are changing eating habits for breakfast, from carbs to proteins and from bowls to on-the-go items. MOM brands has a range of healthy whole grain breakfast items, and their flagship product is Malt-O-Meal.
• The transaction is expected to generate significant synergies, including tax benefits, general and administrative benefits, and leverage for sales and marketing activities. Given the projected synergies and financing of the acquisition, the transaction is expected to be accretive to Post’s EPS.
Aurobindo Pharma (Mumbai, India) acquires Natrol, Inc. (Los Angeles, CA) Nov 10, 2014
• Aurobindo completed its acquisition of Natrol Inc. in November of 2014, acquiring Natrol for $132.5 million. The purchase price represented an 8.4x LTM EBITDA multiple, excluding benefits of any synergies.
• Natrol manufactures and sells nutritional supplements in the US and select international markets. The company’s products are primarily branded vitamins, minerals, and supplements.
• The transaction is expected to give Aurobindo access to distribution in the US market, as Natrol has solidified relationships with major retailers across the country. Aurobindo is an India based manufacturing operation, manufacturing primarily generic pharmaceuticals. The acquisition will broaden Aurobindo’s product lines and distribution.
Healthy Living & Nutraceuticals Middle Market M&A*
2014 M&A activity in the Healthy Living and Nutraceuticals sector set new post-great recession highs.
Note: Middle market M&A includes transactions with
EV < $1000mm, and transactions with undisclosed EV.
YTD as of February 25, 2014.
*YTD

11 HEALTHY LIVING &
NUTRACEUTICALS
Notable Public Offerings & Private Placements
U.S. Public equity offerings and Private Placements in the Healthy Living & Nutraceuticals sector in the past year that are > $5 million. Source: CapitalIQ
Transactions Represented 30
Median $22.0
Mean $50.8
Summary
Date Type Issuer Issuer Description Deal Size
02/10/2015 Public Offering TherapeuticsMD, Inc. TherapeuticsMD, Inc. operates as a women’s health care product company. $55
01/30/2015 Private Placement Pronutria, Inc. Pronutria, Inc. develops pharmacologically active protein nutrients. $28
1/28/2015 Private Placement CannaVEST Corp. CannaVEST develops, produces, markets, and distributes hemp-based consumer products. $24
01/26/2015 Public Offering Post Holdings, Inc. Post Holdings manufactures, markets, and sells refrigerated and private label food products. $309
12/31/2014 Private Placement SoZo Global, Inc. SoZo Global manufactures and distributes brewable coffee and functional beverage products. $6
12/30/2014 Private Placement Youngevity International Youngevity develops and distributes health and nutrition related products. $5
11/17/2014 Public Offering Rockwell Medical, Inc. Rockwell Medical is an integrated biopharmaceutical company in the United States. $59
11/17/2014 Private Placement Benesol Inc. Benesol Inc. creates Vitamin D Supplement system. $5
11/07/2014 Public Offering Pernix Therapeutics Pernix develops, manufactures, and markets branded pharmaceutical products. $100
10/2/2014 Private Placement Rockwell Medical, Inc. Rockwell Medical operates as an integrated biopharmaceutical company. $15
9/30/2014 Private Placement RiceBran Technologies RiceBran is engaged in the processing and marketing of healthy and natural rice products. $8
9/5/2014 Private Placement CCA Industries Inc. CCA Industries manufactures and distributes health and beauty aid products. $6
8/21/2014 Private Placement The Honest Company The Honest Company designs and manufactures bundles, baby, bath and body products. $70
7/31/2014 Private Placement Youngevity International Youngevity develops and distributes health and nutrition related products. $5
07/29/2014 Public Offering TherapeuticsMD, Inc. TherapeuticsMD operates as a women’s health care product company. $40
07/16/2014 Public Offering Tyra Tech Inc TyraTech develops, manufactures, and markets proprietary insecticide products. $66/26/2014 Private Placement Nature's Sunshine Nature’s Sunshine manufacture's and sells nutritional and personal care products. $46
06/19/2014 Public Offering RiceBran Technologies RiceBran is engaged in the processing and marketing of healthy and natural rice products. $85/20/2014 Private Placement Sancilio & Company, Inc. Sancilio & Company develops, manufactures, and distributes biopharmaceutical products. $20
05/19/2014 Public Offering Post Holdings, Inc. Post Holdings manufactures, markets, and distributes ready-to-eat cereals and snacks. $2624/16/2014 Private Placement Probiotic Holdings, LLC Probiotic researches, develops, and manufactures natural probiotic products. $53/20/2014 Private Placement RiceBran Technologies RiceBran is engaged in the processing and marketing of healthy and natural rice products. $5
03/18/2014 Public Offering TherapeuticsMD, Inc. TherapeuticsMD, Inc. operates as a women’s health care product company. $643/14/2014 Private Placement BioPharmX Corporation BioPharmX develops novel delivery mechanisms for known drugs and tissues. $8
03/10/2014 Public Offering Post Holdings, Inc. Post Holdings manufactures, markets, and sells refrigerated and private label food products. $2752/13/2014 Private Placement Pronutria, Inc. Pronutria, Inc. develops pharmacologically active protein nutrients. $122/4/2014 Private Placement Pernix Therapeutics Pernix Therapeutics develops, manufactures, and sells branded pharmaceutical products. $65
1/31/2014 Private Placement Kemin Health, L.C. Kemin Health, L.C. provides ingredients for supplemental manufacturers. $251/31/2014 Private Placement Kemin Industries, Inc. Kemin Industries manufactures specialty ingredients for global feed and food industries. $251/27/2014 Private Placement MYOS Corporation MYOS develops and commercializes nutritional supplements products. $61/24/2014 Private Placement Ehouse Global, Inc. Ehouse Global develops nutraceutical vitamins, supplements, and beverage products. $10

12 HEALTHY LIVING &
NUTRACEUTICALS
Source: Company press releases, CapitalIQ, Wall Street Journal.
RiceBran Technologies (Scottsdale, AZ) Sep 30, 2014
• RiceBran Technologies, a food ingredients manufacturer that specializes in using rice bran in its products, raised nearly $8 million in a private placement to expand into nutraceuticals products. RiceBran is a publicly traded Company, and the transaction was structured as a private investment in a public company (PIPE).
• The transaction was completed at a ~$47 million enterprise value, representing a 1.25x TTM revenue multiple. RiceBran has not generated positive EBITDA since its inception.
• The Company has been struggling as of late, and has raised $255 million in equity capital since the Company’s inception. RiceBran plans to use the proceeds to establish manufacturing operations in Texas for its nutraceuticals products, which the Company has recently seen improving demand.
TherapeuticsMD (Los Angeles, CA) Feb 10, 2015
• TherapeuticsMD, a healthcare company focused on developing and commercializing products exclusively for women, priced a $55 million follow-on public offering on February 10th, 2015.
• The follow-on public offering was priced at a ~$687 million enterprise valuation, and the proceeds are expected to be used for continued development of the Company’s primary product platform, “SYMBODA.”
• The Company has raised over $135 million since its inception in 2008.
2014 Public Offering and Private Placement activity is on pace to exceed 2013 levels.
Healthy Living & Nutraceuticals Middle Market Public Offerings & Capital Raises*
Overview of Selected Public & Private Offerings
Note: Middle market Public Offerings and Private Placements includes transactions with EV < $1000mm, and transactions with undisclosed EV.YTD as of February 25, 2015."
13 HEALTHY LIVING &
NUTRACEUTICALS
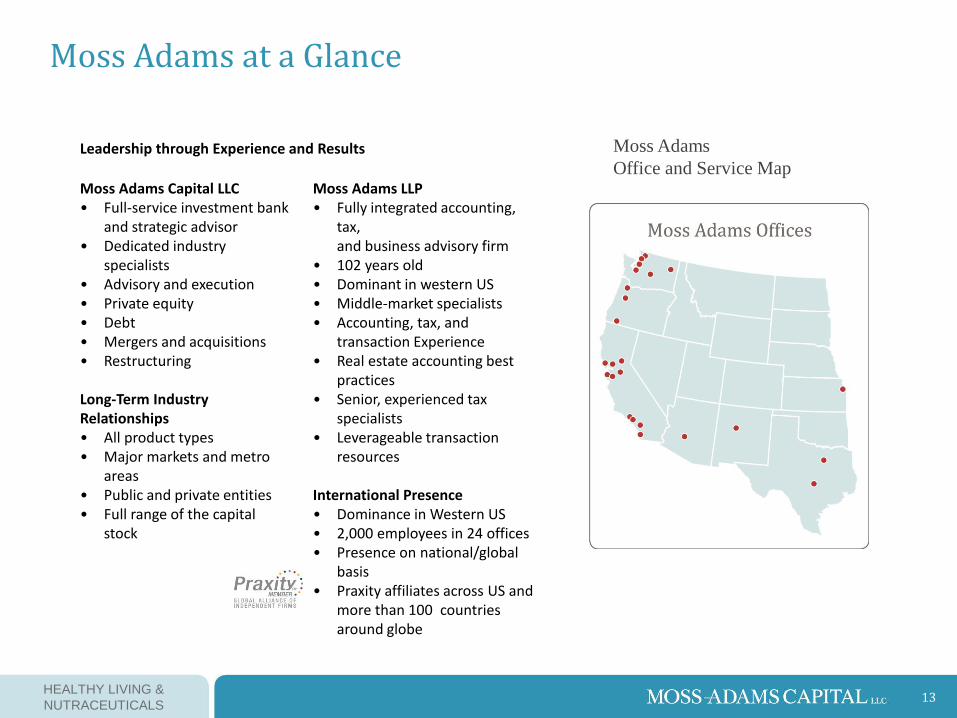
Moss Adams
Office and Service Map Moss Adams Capital LLC • Full-service investment bank
and strategic advisor • Dedicated industry
specialists • Advisory and execution • Private equity • Debt • Mergers and acquisitions • Restructuring Long-Term Industry Relationships • All product types • Major markets and metro
areas • Public and private entities • Full range of the capital
stock
Moss Adams LLP • Fully integrated accounting,
tax, and business advisory firm
• 102 years old • Dominant in western US • Middle-market specialists • Accounting, tax, and
transaction Experience • Real estate accounting best
practices • Senior, experienced tax
specialists • Leverageable transaction
resources International Presence • Dominance in Western US • 2,000 employees in 24 offices • Presence on national/global
basis • Praxity affiliates across US and
more than 100 countries around globe
Leadership through Experience and Results
Moss Adams at a Glance

14 HEALTHY LIVING &
NUTRACEUTICALS
I N D U ST R Y K N O W L ED G E M AT C H E D
W I T H AN EXPER I E N C E D T EAM
• Senior Level Attention
• Commitment to our Clients
• Professional Excellence
• Objective & Independent Advice
• Creating Value for Owners
• Global Presence & Capabilities
Premier accounting and financial
services advice for middle market
healthy living & nutraceuticals
companies.
Expert Teams: Healthy Living & Nutraceuticals Knowledge

15 HEALTHY LIVING &
NUTRACEUTICALS
Moss Adams is a founding member of Praxity, a global alliance of independent financial firms, giving you access to trusted expertise in over 100 countries and territories around the world.
Latin America and Caribbean Argentina, Brazil, Cayman islands, Chile, Colombia, Mexico, Puerto Rico, Uruguay, Venezuela
Europe Austria, Belgium, Croatia, Cyprus, Czech Republic, Denmark, Estonia, Finland, France, Germany, Hungary, Ireland, Italy, Jersey, Latvia, Lithuania, Luxembourg, Malta, Monaco, Netherlands, Norway, Poland, Portugal, Romania, Russia, Slovakia, Spain, Sweden, Switzerland, Turkey, United Kingdom , Ukraine
Asia China, Indonesia, Japan, South Korea, Malaysia, Singapore, Taiwan, Thailand, Vietnam
Africa Algeria, Angola, Benin, Botswana, Cameroon, Cape Verde, Djibouti, Egypt, Ghana, Ivory Coast, Lesotho, Madagascar, Mauritius, Morocco, Senegal, South Africa, Tunisia, Zambia
Middle East and Indian Subcontinent India, Israel, Lebanon, Pakistan, United Arab Emirates
Australasia Australia, New Zealand
North America United States, Canada
Global Reach

16 HEALTHY LIVING &
NUTRACEUTICALS
CFxBorder- Global M&A Reach Through Local Relationships
Our Affiliation with CFxB consists of 150+ M&A Professionals in more than 25 countries
Mazars Africa
40 offices
Mazars Asia
25 offices
Mazars Middle East
15 offices
Mazars Europe 140 offices
Mazars M&A 20 offices
Mazars South America
20 offices
Moss Adams Capital 3 offices
Moss Adams LLP 24 offices
MNP Corporate Finance 10 offices
MNP LLP 70 offices
BKD Corporate Finance 4 offices
BKD LLP 33 offices
William Buck CAA
6 offices
Weiser Mazars
6 offices
Mazars Canada
1 office CH Reynolds CF
1 office
17 HEALTHY LIVING &
NUTRACEUTICALS
Selected Healthy Living & Nutraceuticals Transactions and Mandates
* Services for the foregoing provided by Moss Adams , its affiliates, and/or its principals.

18 HEALTHY LIVING &
NUTRACEUTICALS
Contact Us Moss Adams Capital LLC
2030 Main Street
Suite 1400
Irvine, CA 92614
10960 Wilshire Blvd
Suite 1100
Los Angeles, CA 90024
999 Third Avenue
Suite 2800
Seattle, WA 98104
Burr Dalton
Director
(310) 295-3771
Geoffrey Haydon
Director
(949) 221-4085
Tyler Dale
Vice President
(949) 221-4030
Harman Wales
Managing Director
(206) 302-6770
Richard Anderson
Managing Director
(949) 221-4006
Wiley Kitchell
Managing Director
(206) 302-6780
Robert Miranda
Vice President
(949) 221-4021
James Rothenberger
Associate
(206) 302-6777