Embed Size (px)
Citation preview
Healthy Food and Drink
School Principal Survey Report 2019
Final report, revised April 2021
2
Prepared by the Chronic Disease Prevention Directorate
Public and Aboriginal Health Division
Western Australian Department of Health
This document has been corrected on:
Pages: 5, 14, 15, 21, 22; and Table: 3 (page15).
June 2021
3
Table of Contents
Executive Summary 4 Key findings 4 Recommendations 6
Background 8
Methods 10 Survey 10 Data analysis 11
Results 12 School type and location 12 Written policy for the provision of healthy food and drinks 12 Schools with canteens/food services that meet the HFD Policy traffic light criteria 14 Schools that meet canteen/food service HFD Policy requirements 16 Activities conducted by schools to promote healthy eating 19
Discussion 21 School type 21 School location 22 2018-19 Achievements 23 Limitations 24 Summary 24 Recommendations 25
4
Executive Summary
The Western Australian School Canteen Association (Inc.) (WASCA) is funded by
the Department of Health to provide support to schools to implement the Department
of Education’s Healthy Food and Drink (HFD) Policy (the ‘Policy’), through the
Healthy Food and Drink project.
Principals of all public schools, including Independent Public Schools, are required to
implement the HFD Policy, which applies to all school settings including
canteens/food services, classroom rewards, and classroom cooking activities, school
camps and excursions.
Part of each school’s reporting to the Department of Education is a short survey
comprising of six questions relating to the HFD Policy. The main objective for
incorporating the HFD survey is to evaluate the Policy and provide critical
information about the return on investment of the HFD project, as well as guide the
WASCA’s activities and services provided to schools.
In October 2019, the Department of Education sent an electronic communication to
794 Western Australian (WA) public schools advising them of the requirement to
complete an online survey relating to the HFD Policy and food service practices in
their schools.
Key findings
A total of 450 schools completed the 2019 HFD survey (56.7% response rate).
Schools with a Healthy Food and Drink Policy
• The majority of schools (68.7%) reported having a HFD Policy, 17.3% were in
the process of developing a Policy, and 11.1% of schools did not have a
Policy.
• Schools with a canteen/food service were significantly more likely to have a
HFD Policy in place compared to schools with no food service (75.1%
compared to 62.8% respectively).
• The majority of metropolitan (71.2%) and regional schools (69.8%) that
responded currently had a HFD Policy in place.
5
Provision of food and drink
• 57.0% of schools with canteens/food services met all policy requirements
related to the menu. K-12 schools and Primary schools reporting the highest
levels of compliance with all policy requirements, 100% (2) and 62.6% (122)
respectively.
• Primary schools were significantly more likely to meet all four traffic light
criteria than high schools (secondary and district schools) (62.6% compared
to 46.7%)
• Almost all schools reported their canteen/food service menu consisted of a
minimum of 60% green food and drinks (95.2%) and a maximum of 40%
amber food and drinks (95.1%), with no significant differences between
primary schools, high schools and other schools.
• Compliance was slightly lower for offering savoury commercial amber
products no more than two days per week (84.3% of all schools with a
canteen / food service).
• High schools (secondary and district high schools) were significantly more
likely to have red food and drinks on their canteen/food service menu than
primary schools (36.1% compared to 15.7%).
• There were no significant differences in reported compliance between
metropolitan and regional schools for the canteen/food service menu:
o consisting of a minimum of 60% green food and drinks (95.9% and
93.6% respectively);
o consisting of a maximum of 40% amber food and drinks (95.8% and
93.5% respectively);
o offering savoury commercial amber products, no more than two days
per week (83.4% and 86.4% respectively);
o containing red food and drinks, even on an occasional basis (21.4%
and 24.7% respectively).
Promoting healthy eating in schools
• The most popular strategy used to promote healthy eating by all schools
except secondary schools, was to ‘run healthy eating programs such as
Crunch&Sip® and school kitchen gardens’ (80.2% of all schools).
6
• In secondary schools, the most popular strategy was to ‘work with the school
canteen to adopt the Health Promoting Schools framework’ (80.3% of
secondary schools).
Staff training
• Completed traffic light training was lower among canteen/food service
employers compared to canteen/food service supervisors (80.9% compared
to 93.1%).
• Significantly more canteen supervisors were traffic light trained in metropolitan
schools (96.2%) than in regional schools (85.7%).
• FoodSafe training was completed by 98.9% of canteen/food service
supervisors, compared to 80.2% of canteen/food service volunteers.
Recommendations
Overall, the 2019 survey results are encouraging, and reflect the support being
provided to schools by the WASCA to encourage HFD Policy compliance and
implementation. However, there remains room for improvement in regard to:
• removing red food and drink items from canteens/food services, particularly
in high schools;
• supporting high schools to meet the other policy criteria requirements
(canteen having at least 60% green foods, no more than 40% amber foods,
and no more than 2 days per week of savoury commercial amber foods); and
• increasing the number of regional canteen/food service supervisors who
complete traffic light training.
The 2019 survey results and identified areas for improvement are consistent with the
2018 survey and reflect the ongoing challenges of implementing the Policy.
Continued monitoring of the HFD environment in schools is essential to assist in
addressing the following recommendations for the Department of Education and
Department of Health:
1. The Department of Education continues to administer the annual HFD Policy
implementation survey of public schools and invite the Department of Health
to analyse the results.
7
2. The Department of Education continues to implement strategies designed to
increase the response rate for future HFD School Principal Surveys (e.g.
follow up reminder emails, ensure survey is open for appropriate amount of
time, ensure links are working correctly, ensure respondents are aware of
how long the survey will take to complete, ensure respondents are aware of
the purpose and significance of the survey, etc). In addition, it is
recommended that strategies are implemented to attract new schools to
complete the survey in 2020.
3. The Department of Education and the WASCA continue to make the survey
results publicly available (e.g. on the Department of Education HFD web page
and the WASCA webpage) as was done in 2018.
4. Continuation of quarterly HFD Reference Group meetings to ensure the
Department of Education, Department of Health and the WASCA are kept
informed and updated on the status of the HFD Policy progress throughout
the school year. In addition, the Reference Group continues to:
a. work with the WASCA to provide targeted support to high schools to
meet HFD policy criteria, (particularly to remove red items from
canteen menus), for example:
i. Tailored training sessions for secondary schools only to ensure
relevance of topics and networking opportunities
ii. WASCA to develop marketing messages and fact sheets
specifically focussing on red food and drinks; reminding schools red
items are ‘off the menu’; WASCA to consider distribution pathways
iii. Develop marketing materials (e.g. posters) suitable for high schools
promoting healthy eating
b. work with the WASCA to provide targeted support to all schools to
increase traffic light training (particularly in regional schools); for
example, WASCA to increase engagement with health professionals in
regional WA to promote HFD policy compliance and support such as
the traffic light training; including promoting training opportunities via
social media pages (e.g. My Healthy Kimberley).
c. work with WASCA to provide targeted support to all schools, i.e. those
with and without canteens, to increase the number of schools with a
written Policy for the provision of healthy food and drinks.
8
Background
Schools play a key role in introducing, supporting, and teaching children about
healthy eating. The World Health Organization’s Report of the Commission on
Ending Childhood Obesity1 highlights schools as an important setting for creating a
healthy food environment. The Department of Education’s mandatory Healthy Food
and Drink (HFD) Policy2 applies to all WA public schools (including Independent
Public Schools) and utilises a traffic light system to classify food and
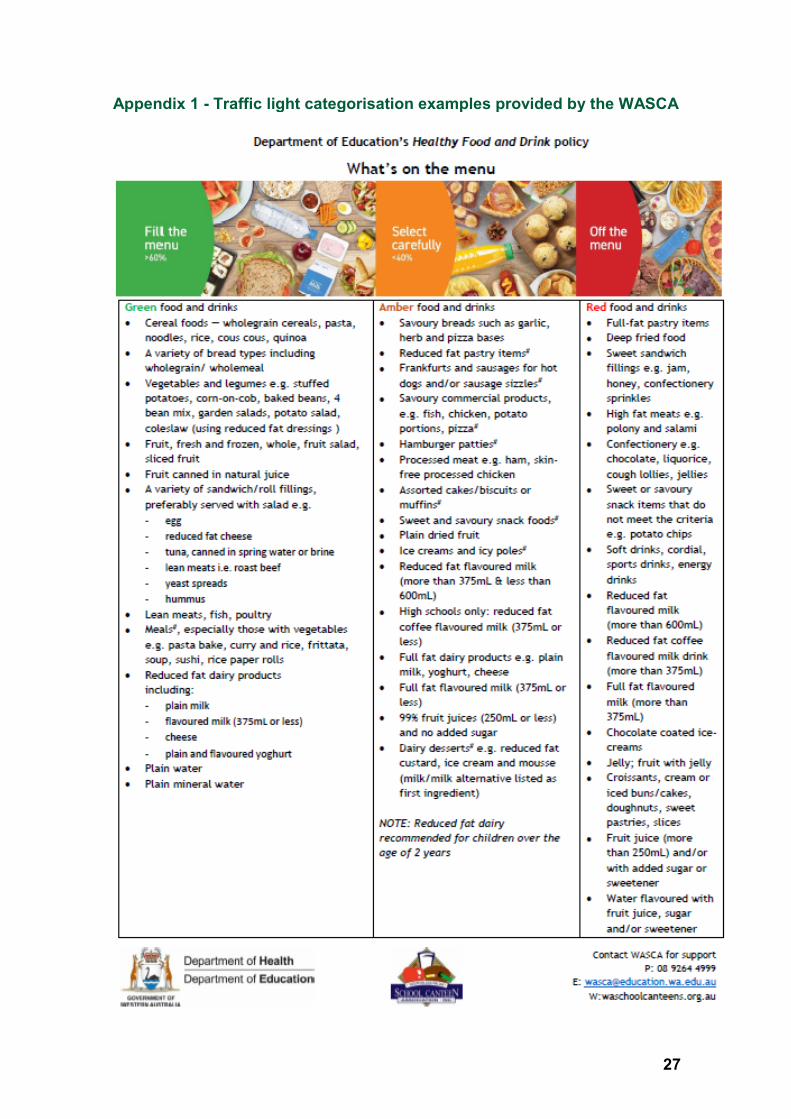
drinks (Appendix 1):
• Green food and drinks are an excellent source of nutrients, contain less
saturated fat and/or sugar and/or salt and help to avoid intake of excess
energy (kJ) and must comprise at least 60% of the menu.
• Amber food and drinks have some nutritional value but also contain
moderate levels of salt, sugar and/or saturated fat. Amber foods should be
eaten in moderation and must comprise no more than 40% of the menu.
Savoury commercial amber products must not be offered more than twice a
week.
• Red food and drinks lack adequate nutritional value, are high in saturated
fat and/or added sugar and/or salt and contribute to excess energy and
must not be offered on canteen and food service menus.
Red categorised food and drinks will not be provided to students unless
essential to learning programs.
The Department of Health funded HFD Project aims to assist schools in maintaining
and strengthening policies and practices that support the provision and promotion of
healthy food and drinks, particularly in canteens/food services. The WASCA have
been contracted to deliver the HFD Project by either the Department of Health or
Department of Education since 2006. For the period 2007 to 2015, there was a
Memorandum of Understanding (MOU) between the Department of Education and
1 World Health Organization (2016). Healthy Food and Drink Policy, [Available from: https://www.who.int/end-childhood-obesity/publications/taking-action-childhood-obesity-report/en/ ] 2 Department of Education (2018). Healthy Food and Drink in Public Schools Policy, [Available from: http://det.wa.edu.au/policies/detcms/policy-planning-and-accountability/policies-framework/policies/healthy-food-and-drink-policy.en?cat-id=3457102 ]
9
the Department of Health. In 2015, the HFD Reference Group was established to
facilitate information sharing and discussions amongst the key stakeholders for this
project.
As part of the Department of Education’s reporting systems, an annual survey
relating to the canteen/food service and the HFD Policy has been conducted since
2012. Following consultation with the HFD Reference Group and a formal request
from the Department of Health, the survey questions were updated for the 2016
survey, and the same questions have been utilised for the 2017, 2018 and 2019
surveys. Information from the survey is an integral component of the evaluation of
the HFD Project, providing critical information about the return on investment as well
as guiding the WASCA’s services and key areas for the Department of Education
and the WASCA to focus.
10
Methods
Survey
Consistent with the previous School Principal Surveys, an electronic communication
was sent by the Department of Education to 794 WA public schools in late October
2019. All principals have responsibility for the implementation of the HFD Policy in
the provision of healthy food and drinks and ensuring that the canteen/food service
menu complies with Policy requirements. The survey contained six questions relating
to the HFD Policy and food service practices in the school:
1. Does your school have a written policy for the provision of healthy food and
drinks?
• No, our school does not have a policy • Our school is in the process of developing a policy • Yes, our school has a policy • Unsure
2. What, if anything, does your school do to promote healthy eating? (check all that
apply)
• Include nutrition advice or information in the school newsletter at least once per term
• Conduct healthy P&C fundraising events (i.e. do not use ‘red’ items such as chocolates)
• Organise whole school events such as a health/nutrition campaign/event, theme day etc.
• Run healthy eating programs such as Crunch&Sip® or a school kitchen garden
• Invite qualified guest speakers to address students, parents and/or staff about healthy eating
• Work with the school canteen to adopt the Health Promoting Schools framework
• Not a priority, do nothing specific • Other, please specify
3. Does your school operate a canteen/food service?
• Yes • No
11
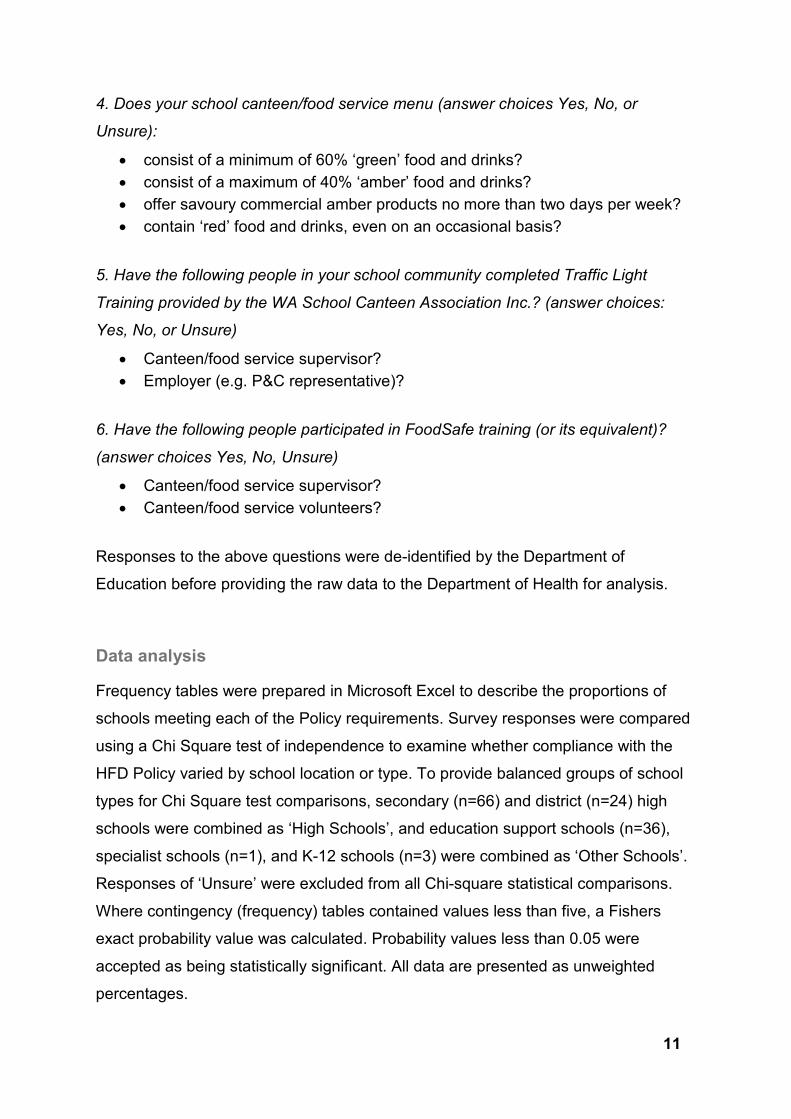
4. Does your school canteen/food service menu (answer choices Yes, No, or
Unsure):
• consist of a minimum of 60% ‘green’ food and drinks? • consist of a maximum of 40% ‘amber’ food and drinks? • offer savoury commercial amber products no more than two days per week? • contain ‘red’ food and drinks, even on an occasional basis?
5. Have the following people in your school community completed Traffic Light
Training provided by the WA School Canteen Association Inc.? (answer choices:
Yes, No, or Unsure)
• Canteen/food service supervisor? • Employer (e.g. P&C representative)?
6. Have the following people participated in FoodSafe training (or its equivalent)?
(answer choices Yes, No, Unsure)
• Canteen/food service supervisor? • Canteen/food service volunteers?
Responses to the above questions were de-identified by the Department of
Education before providing the raw data to the Department of Health for analysis.
Data analysis
Frequency tables were prepared in Microsoft Excel to describe the proportions of
schools meeting each of the Policy requirements. Survey responses were compared
using a Chi Square test of independence to examine whether compliance with the
HFD Policy varied by school location or type. To provide balanced groups of school
types for Chi Square test comparisons, secondary (n=66) and district (n=24) high
schools were combined as ‘High Schools’, and education support schools (n=36),
specialist schools (n=1), and K-12 schools (n=3) were combined as ‘Other Schools’. Responses of ‘Unsure’ were excluded from all Chi-square statistical comparisons.
Where contingency (frequency) tables contained values less than five, a Fishers
exact probability value was calculated. Probability values less than 0.05 were
accepted as being statistically significant. All data are presented as unweighted
percentages.
12
Results
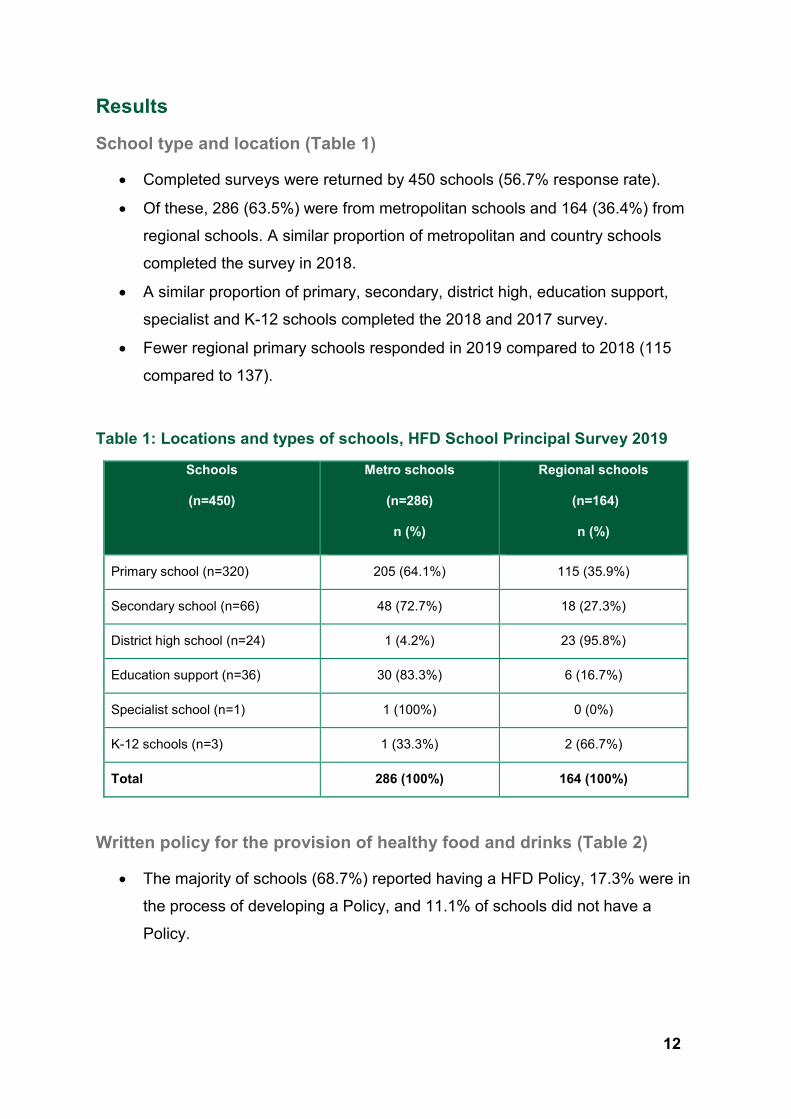
School type and location (Table 1)
• Completed surveys were returned by 450 schools (56.7% response rate).
• Of these, 286 (63.5%) were from metropolitan schools and 164 (36.4%) from
regional schools. A similar proportion of metropolitan and country schools
completed the survey in 2018.
• A similar proportion of primary, secondary, district high, education support,
specialist and K-12 schools completed the 2018 and 2017 survey.
• Fewer regional primary schools responded in 2019 compared to 2018 (115
compared to 137).
Table 1: Locations and types of schools, HFD School Principal Survey 2019
Schools
(n=450)
Metro schools
(n=286)
n (%)
Regional schools
(n=164)
n (%)
Primary school (n=320) 205 (64.1%) 115 (35.9%)
Secondary school (n=66) 48 (72.7%) 18 (27.3%)
District high school (n=24) 1 (4.2%) 23 (95.8%)
Education support (n=36) 30 (83.3%) 6 (16.7%)
Specialist school (n=1) 1 (100%) 0 (0%)
K-12 schools (n=3) 1 (33.3%) 2 (66.7%)
Total 286 (100%) 164 (100%)
Written policy for the provision of healthy food and drinks (Table 2)
• The majority of schools (68.7%) reported having a HFD Policy, 17.3% were in
the process of developing a Policy, and 11.1% of schools did not have a
Policy.
13
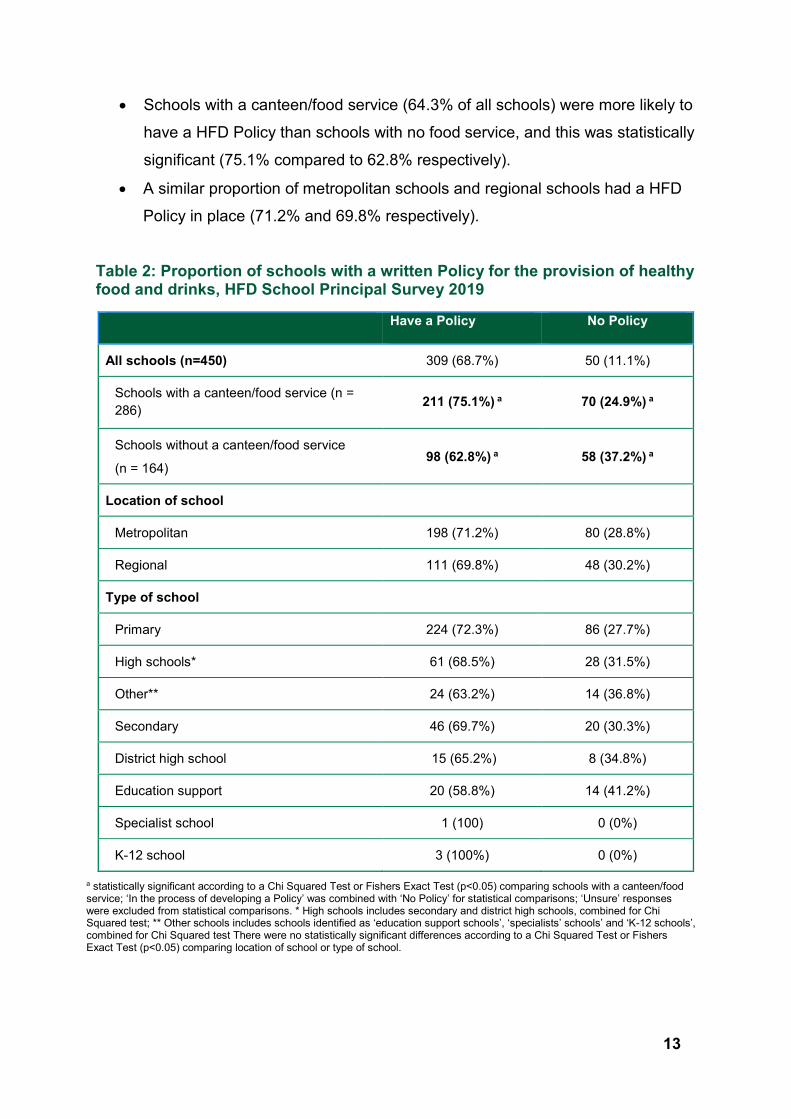
• Schools with a canteen/food service (64.3% of all schools) were more likely to
have a HFD Policy than schools with no food service, and this was statistically
significant (75.1% compared to 62.8% respectively).
• A similar proportion of metropolitan schools and regional schools had a HFD
Policy in place (71.2% and 69.8% respectively).
Table 2: Proportion of schools with a written Policy for the provision of healthy food and drinks, HFD School Principal Survey 2019
Have a Policy
No Policy
All schools (n=450) 309 (68.7%) 50 (11.1%)
Schools with a canteen/food service (n = 286) 211 (75.1%) a 70 (24.9%) a
Schools without a canteen/food service (n = 164)
98 (62.8%) a 58 (37.2%) a
Location of school
Metropolitan 198 (71.2%) 80 (28.8%)
Regional 111 (69.8%) 48 (30.2%)
Type of school
Primary 224 (72.3%) 86 (27.7%)
High schools* 61 (68.5%) 28 (31.5%)
Other** 24 (63.2%) 14 (36.8%)
Secondary 46 (69.7%) 20 (30.3%)
District high school 15 (65.2%) 8 (34.8%)
Education support 20 (58.8%) 14 (41.2%)
Specialist school 1 (100) 0 (0%)
K-12 school 3 (100%) 0 (0%)
a statistically significant according to a Chi Squared Test or Fishers Exact Test (p<0.05) comparing schools with a canteen/food service; ‘In the process of developing a Policy’ was combined with ‘No Policy’ for statistical comparisons; ‘Unsure’ responses were excluded from statistical comparisons. * High schools includes secondary and district high schools, combined for Chi Squared test; ** Other schools includes schools identified as ‘education support schools’, ‘specialists’ schools’ and ‘K-12 schools’, combined for Chi Squared test There were no statistically significant differences according to a Chi Squared Test or Fishers Exact Test (p<0.05) comparing location of school or type of school.
14
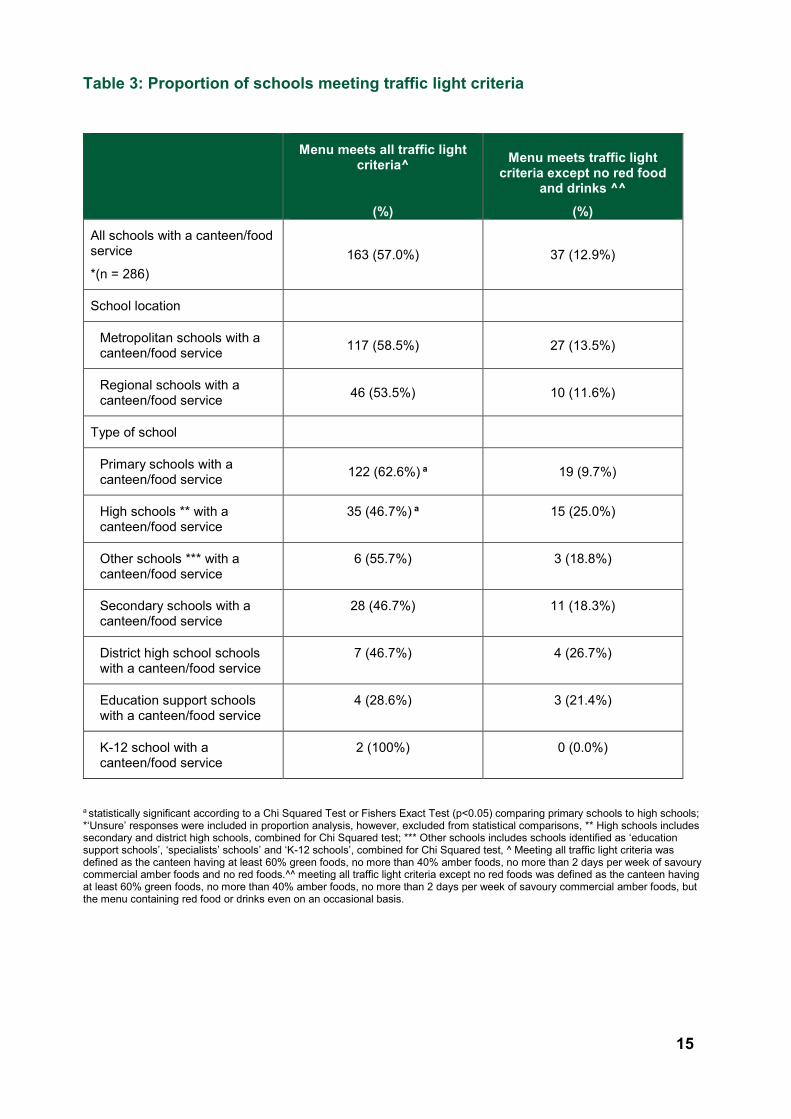
Schools with canteens/food services that meet the HFD Policy traffic light criteria (Table 3)
• 57.0% of all schools with canteens / food services met all HFD Policy
requirements (canteen having at least 60% green foods, no more than 40%
amber foods, no more than 2 days per week of savoury commercial amber
foods and no red foods or drinks).
• Primary schools were significantly more likely to meet all four HFD traffic light
Policy requirements (63.6%), compared to high schools (46.7%)
15
Table 3: Proportion of schools meeting traffic light criteria
Menu meets all traffic light criteria^
(%)
Menu meets traffic light criteria except no red food
and drinks ^^ (%)
All schools with a canteen/food service *(n = 286)
163 (57.0%) 37 (12.9%)
School location
Metropolitan schools with a canteen/food service 117 (58.5%) 27 (13.5%)
Regional schools with a canteen/food service 46 (53.5%) 10 (11.6%)
Type of school
Primary schools with a canteen/food service 122 (62.6%) a 19 (9.7%)
High schools ** with a canteen/food service
35 (46.7%) a 15 (25.0%)
Other schools *** with a canteen/food service
6 (55.7%) 3 (18.8%)
Secondary schools with a canteen/food service
28 (46.7%) 11 (18.3%)
District high school schools with a canteen/food service
7 (46.7%) 4 (26.7%)
Education support schools with a canteen/food service
4 (28.6%) 3 (21.4%)
K-12 school with a canteen/food service
2 (100%) 0 (0.0%)
a statistically significant according to a Chi Squared Test or Fishers Exact Test (p<0.05) comparing primary schools to high schools; *‘Unsure’ responses were included in proportion analysis, however, excluded from statistical comparisons, ** High schools includes secondary and district high schools, combined for Chi Squared test; *** Other schools includes schools identified as ‘education support schools’, ‘specialists’ schools’ and ‘K-12 schools’, combined for Chi Squared test, ^ Meeting all traffic light criteria was defined as the canteen having at least 60% green foods, no more than 40% amber foods, no more than 2 days per week of savoury commercial amber foods and no red foods.^^ meeting all traffic light criteria except no red foods was defined as the canteen having at least 60% green foods, no more than 40% amber foods, no more than 2 days per week of savoury commercial amber foods, but the menu containing red food or drinks even on an occasional basis.
16
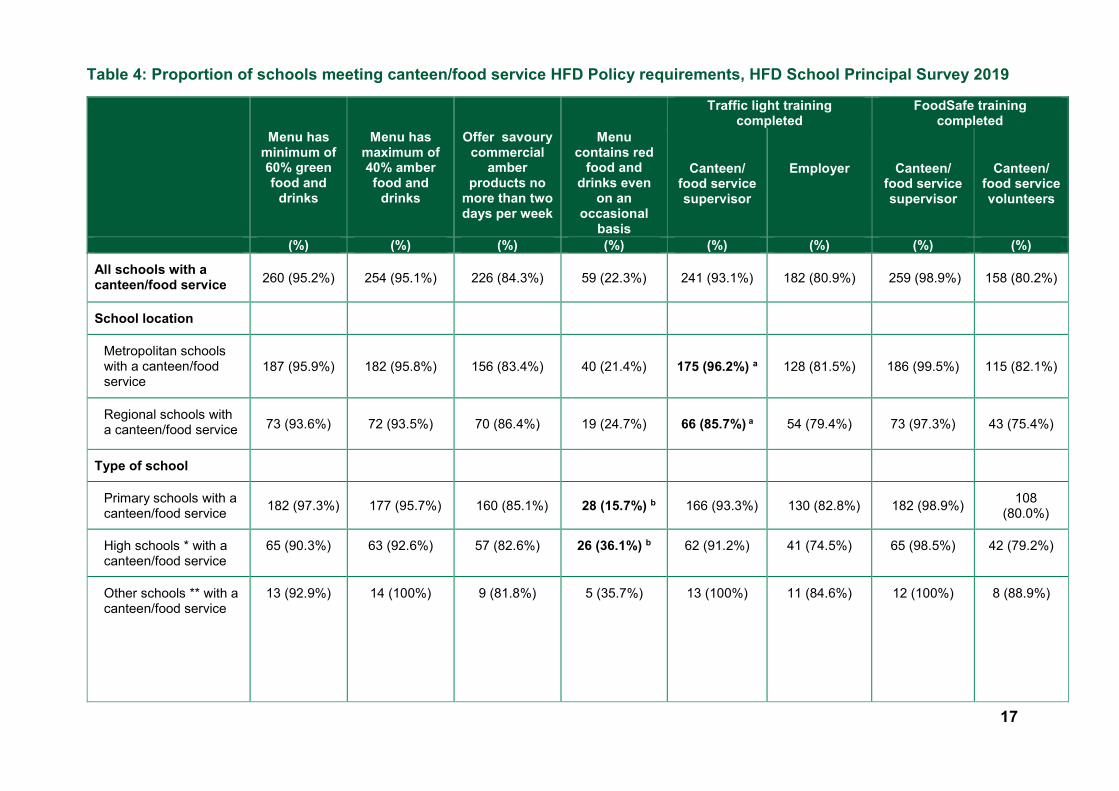
Schools that meet canteen/food service HFD Policy requirements (Table 4)
Provision of food and drink
• A large majority of schools reported their canteen/food service menu consisted of
a minimum of 60% green food and drinks (95.2%) and a maximum of 40% amber
food and drinks (95.1%), with no significant differences between primary schools,
high schools and other schools.
• High schools (secondary and district high schools) were more likely (36.1%) to
have red food and drinks on their canteen/food service menu than primary
schools (15.7%); this difference was statistically significant (p= 0.0004).
• There were no significant differences in reported compliance between
metropolitan and regional schools, for the canteen/food service menu:
o consisting of a minimum of 60% green food and drinks (95.9% and 93.6%
respectively);
o consisting of a maximum of 40% amber food and drinks (95.8% and 93.5%
respectively);
o offering amber savoury commercial amber products, no more than two
days per week (83.4% and 86.4% respectively);
o containing red food and drinks, even on an occasional basis (21.4% and
24.7% respectively).
Staff training
• There were high levels of completed traffic light training (93.1% canteen/food
service supervisors and 80.9% employers) and FoodSafe training (98.9%
canteen/food service supervisors and 80.2% canteen/food service volunteers).
• A greater proportion of metropolitan schools (96.2%) reported having
canteen/food service supervisors who had completed traffic light training
compared to regional schools (85.7%); this difference was statistically significant
(p-value 0.0025).
17
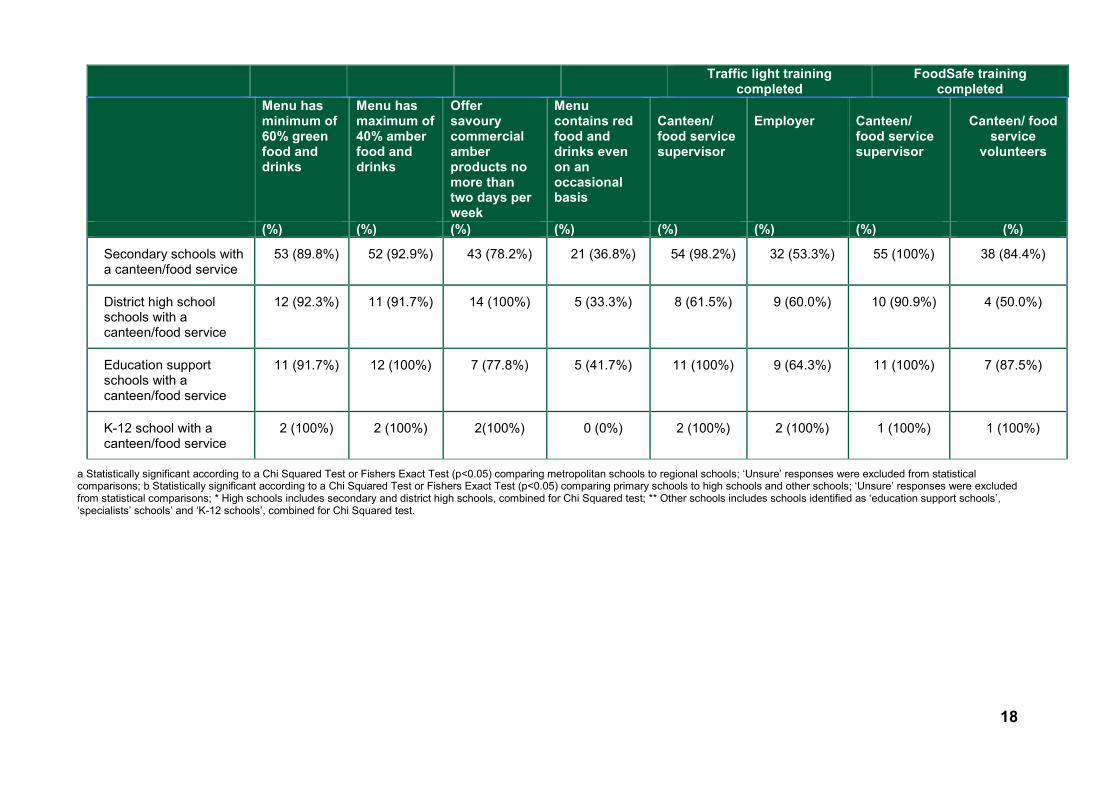
Table 4: Proportion of schools meeting canteen/food service HFD Policy requirements, HFD School Principal Survey 2019
Traffic light training
completed FoodSafe training
completed Menu has
minimum of 60% green food and
drinks
Menu has maximum of 40% amber food and
drinks
Offer savoury commercial
amber products no
more than two days per week
Menu contains red
food and drinks even
on an occasional
basis
Canteen/
food service supervisor
Employer
Canteen/
food service supervisor
Canteen/
food service volunteers
(%) (%) (%) (%) (%) (%) (%) (%)
All schools with a canteen/food service 260 (95.2%) 254 (95.1%) 226 (84.3%) 59 (22.3%) 241 (93.1%) 182 (80.9%) 259 (98.9%) 158 (80.2%)
School location
Metropolitan schools with a canteen/food service
187 (95.9%) 182 (95.8%) 156 (83.4%) 40 (21.4%) 175 (96.2%) a 128 (81.5%) 186 (99.5%) 115 (82.1%)
Regional schools with a canteen/food service 73 (93.6%) 72 (93.5%) 70 (86.4%) 19 (24.7%) 66 (85.7%) a 54 (79.4%) 73 (97.3%) 43 (75.4%)
Type of school
Primary schools with a canteen/food service 182 (97.3%) 177 (95.7%) 160 (85.1%) 28 (15.7%) b 166 (93.3%) 130 (82.8%) 182 (98.9%) 108
(80.0%)
High schools * with a canteen/food service
65 (90.3%) 63 (92.6%) 57 (82.6%) 26 (36.1%) b 62 (91.2%) 41 (74.5%) 65 (98.5%) 42 (79.2%)
Other schools ** with a canteen/food service
13 (92.9%) 14 (100%) 9 (81.8%) 5 (35.7%) 13 (100%) 11 (84.6%) 12 (100%) 8 (88.9%)
18
Traffic light training
completed FoodSafe training
completed Menu has
minimum of 60% green food and drinks
Menu has maximum of 40% amber food and drinks
Offer savoury commercial amber products no more than two days per week
Menu contains red food and drinks even on an occasional basis
Canteen/ food service supervisor
Employer
Canteen/ food service supervisor
Canteen/ food
service volunteers
(%) (%) (%) (%) (%) (%) (%) (%)
Secondary schools with a canteen/food service
53 (89.8%) 52 (92.9%) 43 (78.2%) 21 (36.8%) 54 (98.2%) 32 (53.3%) 55 (100%) 38 (84.4%)
District high school schools with a canteen/food service
12 (92.3%) 11 (91.7%) 14 (100%) 5 (33.3%) 8 (61.5%) 9 (60.0%) 10 (90.9%) 4 (50.0%)
Education support schools with a canteen/food service
11 (91.7%) 12 (100%) 7 (77.8%) 5 (41.7%) 11 (100%) 9 (64.3%) 11 (100%) 7 (87.5%)
K-12 school with a canteen/food service
2 (100%) 2 (100%) 2(100%) 0 (0%) 2 (100%) 2 (100%) 1 (100%) 1 (100%)
a Statistically significant according to a Chi Squared Test or Fishers Exact Test (p<0.05) comparing metropolitan schools to regional schools; ‘Unsure’ responses were excluded from statistical comparisons; b Statistically significant according to a Chi Squared Test or Fishers Exact Test (p<0.05) comparing primary schools to high schools and other schools; ‘Unsure’ responses were excluded from statistical comparisons; * High schools includes secondary and district high schools, combined for Chi Squared test; ** Other schools includes schools identified as ‘education support schools’, ‘specialists’ schools’ and ‘K-12 schools’, combined for Chi Squared test.
19
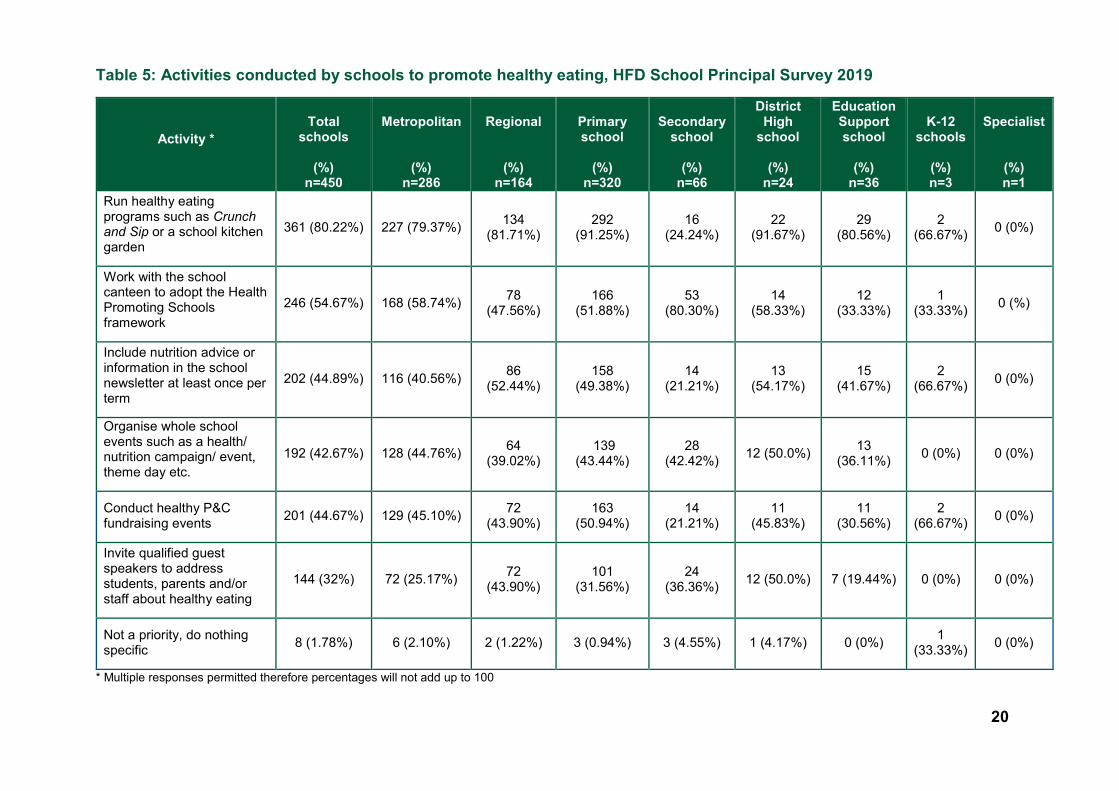
Activities conducted by schools to promote healthy eating (Table 5)
• The majority of schools utilised multiple strategies to promote healthy eating.
Less than 2% of schools claimed that it was not a priority to promote healthy
eating.
• The most popular strategy to promote healthy eating used by all schools,
except secondary schools, was to ‘run healthy eating programs such as
Crunch&Sip® and school kitchen gardens’ (80.2% of all schools). 80.3% of
secondary schools ‘worked with the school canteen to adopt the Health
Promoting Schools framework’ (in which health is integrated into the school
curriculum as well as school policies, and which recognises the importance of
links with health services and partnerships between the school, families and
community). These results are consistent with 2018 survey results.
• Similar proportions of metropolitan and regional schools ‘ran healthy programs
such as Crunch and Sip® or a school kitchen garden’ (79.4% and 81.7%
respectively), ‘organised whole school events such as health/nutrition
campaign/event, theme days’ (44.8% and 39.0% respectively), and
‘conducted healthy P&C fundraising events’ (45.1% and 43.9% respectively).
• ‘Inviting qualified guest speakers to address students, parents and/or staff
about healthy eating’ was the strategy least used by schools (32% of all
schools), consistent with 2018 survey results.
20
Table 5: Activities conducted by schools to promote healthy eating, HFD School Principal Survey 2019
Activity * Total
schools
(%) n=450
Metropolitan
(%) n=286
Regional
(%) n=164
Primary school
(%)
n=320
Secondary school
(%)
n=66
District High
school
(%) n=24
Education Support school
(%)
n=36
K-12 schools
(%) n=3
Specialist
(%) n=1
Run healthy eating programs such as Crunch and Sip or a school kitchen garden
361 (80.22%) 227 (79.37%) 134 (81.71%)
292 (91.25%)
16 (24.24%)
22 (91.67%)
29 (80.56%)
2 (66.67%) 0 (0%)
Work with the school canteen to adopt the Health Promoting Schools framework
246 (54.67%) 168 (58.74%) 78 (47.56%)
166 (51.88%)
53 (80.30%)
14 (58.33%)
12 (33.33%)
1 (33.33%) 0 (%)
Include nutrition advice or information in the school newsletter at least once per term
202 (44.89%) 116 (40.56%) 86 (52.44%)
158 (49.38%)
14 (21.21%)
13 (54.17%)
15 (41.67%)
2 (66.67%) 0 (0%)
Organise whole school events such as a health/ nutrition campaign/ event, theme day etc.
192 (42.67%) 128 (44.76%) 64 (39.02%)
139 (43.44%)
28 (42.42%) 12 (50.0%) 13
(36.11%) 0 (0%) 0 (0%)
Conduct healthy P&C fundraising events 201 (44.67%) 129 (45.10%) 72
(43.90%) 163
(50.94%) 14
(21.21%) 11
(45.83%) 11
(30.56%) 2
(66.67%) 0 (0%)
Invite qualified guest speakers to address students, parents and/or staff about healthy eating
144 (32%) 72 (25.17%) 72 (43.90%)
101 (31.56%)
24 (36.36%) 12 (50.0%) 7 (19.44%) 0 (0%) 0 (0%)
Not a priority, do nothing specific 8 (1.78%) 6 (2.10%) 2 (1.22%) 3 (0.94%) 3 (4.55%) 1 (4.17%) 0 (0%) 1
(33.33%) 0 (0%)
* Multiple responses permitted therefore percentages will not add up to 100
21
Discussion The HFD Policy aims to increase the capacity of WA public schools and key school
stakeholders to establish, maintain and strengthen policies and practices that
support the provision and promotion of healthy food and drinks in schools.
The results of the 2019 HFD School Principal Survey indicate that just over two-
thirds (68.7%) of schools have a HFD Policy, around 17.3% are in the process of
developing a Policy, and 11.1% of schools do not have a Policy. These findings are
consistent with the survey results of the last three years.
School type
Primary schools (62.6%) were significantly more likely to meet all four traffic light
policy criteria (defined as the canteen menu having at least 60% green foods, no
more than 40% amber foods, no more than two days per week of savoury amber
foods, and no red food or drinks), than high schools (secondary and district high
schools) (46.7%).
When comparing high schools and primary schools, 25% of high schools, compared
to 9.7% of primary schools meet all criteria except for not offering red food and
drinks. High schools (36.1%) were significantly more likely to offer red food and
drinks than primary schools (15.7%). This difference was also statistically significant
in 2018 (35.3% of high schools compared to 20.2% of primary schools). This finding
demonstrates that offering no red food and drinks on the menu is the most
challenging criteria of the Policy for high schools, which is consistent with past years’
survey results.
According to the WASCA, common barriers to implementing/complying with the HFD
Policy identified by secondary schools include: concerns regarding profit/loss; time
taken for new foods to gain interest (thus managing potential wastage); lack of
volunteers; and secondary schools being less likely to colour code their canteen
menu.3 In addition, food advertising near schools can impact students’ lunch choices
with students at some high schools and other schools being allowed to go off
campus to purchase food, therefore the canteen is trying to compete with outside
commercial businesses. This result demonstrates that high schools should continue
3 Western Australian School Canteen Association Inc (2019). Annual Report 2018-19, [Available from: https://www.waschoolcanteens.org.au/wp-content/uploads/2019/10/2019-WASCA-Annual-Report.pdf]
22
to be supported to remove red food and drinks. Potential strategies to address this
include:
• WASCA to continue to provide tailored training sessions for secondary
schools only to ensure relevance of topics and networking opportunities
• WASCA to develop marketing messages, posters and fact sheets specifically
focusing on red food and drinks, also reminding schools red items are ‘off the
menu’; WASCA to consider distribution pathways
• Advocating for a duty of care approach, encouraging Principals to restrict
students leaving school grounds during school ours
Running ‘healthy eating programs such as Crunch&Sip® and school kitchen gardens’
was the most popular strategy used by all schools (80.2% of schools), except
secondary schools. Of secondary schools, 80.3% reported ‘working with the school
canteen to adopt the Health Promoting Schools framework’. The reason for this may
be due to limited number of healthy eating programs that are tailored for secondary
students, as well as difficulty implementing these programs in typically a larger
school setting. These results were also consistent with the 2018 survey.
School location
While the level of completed traffic light training is high, significantly more
metropolitan schools reported having canteen/food service supervisors who had
completed traffic light training compared to regional schools. This is consistent with
the previous three years of survey results. These differences may be a consequence
of fewer face-to-face training sessions being conducted by the WASCA in regional
locations due to reduced funding since 2015. However, training is made available to
regional schools online and via video conference, and the WASCA provide support
via phone, email, website and Facebook. There may be opportunities to increase
promotion of these training opportunities to regional schools to increase uptake.
There were no other significant differences between metropolitan and regional
schools.
23
2018-19 Achievements
The 2019 survey results reflect the support being provided to schools by the WASCA
to encourage Policy compliance and implementation. Some specific examples of
WASCA’s activities and achievements in 2018-19 include (but are not limited to):
• 52 new tools and resources developed to support schools to implement the
policy, including a new traffic light poster translated into 17 languages;
• 565 people completed training, including online (n=99) and face to face
(n=466) during 33 training and capacity building sessions
• tailored support and advice provided to 228 schools; and
• the Action on Nutrition (AON) project (February – July 2019), which aimed to
investigate barriers, enablers and support strategies for implementing the
HFD Policy in secondary and regional schools. One of the key activities from
AON was conducting menu assessments with regional and secondary
schools; and implementing a new strategy conducting follow-up phone calls to
schools that received a menu assessment. Findings showed schools removed
red items and increased fruit and vegetables on the menu as a result of
receiving the menu assessment. This is now standard protocol for WASCA.
In 2018- 2019, WASCA also provided advice and support to the DoE to inform a
review of the HFD Policy, which is likely to be incorporated into the broader Student
Health Care Policy in 2021. While the HFD Policy itself will remain unchanged,
combining policies may strengthen the HFD Policy and reinforce a whole school
approach to healthy eating, while promoting the link between nutrition and learning. If
this change is made, it will be important to monitor its impact on compliance with the
HFD Policy.
24
Limitations
Some limitations of this survey include:
• The response rate to this survey has declined since 2016, having dropped
from 88.5% in 2016 to 50.1% in 2017, 57.3% in 2018 and 56.7% in 2019.
This reduces the ability to generalise these findings to all schools across WA
and may result in a selective sample of schools and overestimation of
compliance. A strong response rate to this survey is critical for a reliable
evaluation of the HFD Project.
• The survey relies on self-reported compliance, and there may be a
substantial gap between self-reported and independent, objectively
measured compliance.
Summary
Currently in WA, almost one quarter of children aged 5 to 15 years of age are
overweight or obese. Schools are extremely well positioned to support healthy eating
behaviours, and play a crucial role, as part of a comprehensive public health approach,
in preventing childhood obesity. Canteen/food services are an integral part of the
school environment and can assist in establishing children’s healthy eating behaviours
whilst at school and subsequently throughout adulthood.
The administration of the HFD School Principal Survey and dissemination of results
is important to assist schools to remain focussed on HFD Policy compliance and
implementation, encourage information sharing across jurisdictions and promote
open and accountable reporting. In 2017, the Global Obesity Centre at Deakin
University led an assessment of the extent to which governments in Australia are
implementing globally recommended policies for tackling obesity and creating
healthier food environments (the Food Policy Index). As part of this assessment, it
was recommended that Western Australia improve awareness and compliance with
the HFD Policy in all schools, by extending reporting mechanisms, incentives and
support systems.
The HFD Policy and monitoring of the Policy through the HFD School Principal
Survey, also support the national and Western Australian agendas for obesity
prevention and is in alignment with the WA Health Promotion Strategic Framework
25
2017-2021, and the Sustainable Health Review’s recommendation to halt the rise in
obesity in WA by July 2024.
Overall, the 2019 survey results are encouraging, and compliance with the HFD
Policy remains high. However, the results demonstrate the need for further
improvement in the following areas:
• supporting all schools (and particularly high schools) to remove red food and
drink items from canteens/food services;
• supporting high schools to meet the remaining policy criteria requirements
that relate to the menu (canteen having at least 60% green foods, no more
than 40% amber foods, and no more than 2 days per week of savoury
commercial amber foods); and
• increasing the number of regional canteen/food service supervisors who
complete traffic light training.
Continued monitoring of the HFD environment in schools is therefore essential to
assist in addressing these areas of priority for the Department of Education and
Department of Health.
Recommendations
1. The Department of Education continues to administer the annual HFD Policy
implementation survey of public schools and invite the Department of Health
to analyse the results.
2. The Department of Education continues to implement strategies designed to
increase the response rate for future HFD School Principal Surveys (e.g.
follow up reminder emails, ensure survey is open for appropriate amount of
time, ensure links are working correctly, ensure respondents are aware of
how long the survey will take to complete, ensure respondents are aware of
the purpose and significance of the survey, etc). In addition, it is
recommended that strategies are implemented to attract new schools to
complete the survey in 2020.
3. The Department of Education and the WASCA continue to make the survey
results publicly available (e.g. on the Department of Education HFD web page
and the WASCA webpage) as was done in 2018.
26
4. Continuation of quarterly HFD Reference Group meetings to ensure the
Department of Education, Department of Health and the WASCA are kept
informed and updated on the status of the HFD Policy progress throughout
the school year. In addition, the Reference Group continues to:
a. work with the WASCA to provide targeted support to high schools to
meet HFD policy criteria, (particularly to remove red items from
canteen menus), for example:
i. Tailored training sessions for secondary schools only to ensure
relevance of topics and networking opportunities
ii. WASCA to develop marketing messages and fact sheets
specifically focussing on red food and drinks; reminding schools red
items are ‘off the menu’; WASCA to consider distribution pathways
iii. Develop marketing materials (e.g. posters) suitable for high schools
promoting healthy eating;
b. work with the WASCA to provide targeted support to all schools to
increase traffic light training (particularly in regional schools); for
example, WASCA to increase engagement with health professionals in
regional WA to promote HFD policy compliance and support such as
the traffic light training; including promoting training opportunities via
social media pages (e.g. My Healthy Kimberley).
c. work with the WASCA to provide targeted support to all schools, i.e.
those with and without canteens, to increase the number of schools
with a written Policy for the provision of healthy food and drinks.
27
Appendix 1 - Traffic light categorisation examples provided by the WASCA
This document can be made available in alternative formats on request for a person with disability.
© Department of Health 2021
Copyright to this material is vested in the State of Western Australia unless otherwise indicated. Apart from any fair dealing for the purposes of private study, research, criticism or review, as permitted under the provisions of the Copyright Act 1968, no part may be reproduced or re-used for any purposes whatsoever without written permission of the State of Western Australia.