Embed Size (px)
Citation preview

HEALTHY DOSE:A TOOLKIT FOR BOOSTING THE IMPACT OF COMMUNITY HEALTH STRATEGIES
Version 1.0
AUGUST 2015
Center for Community Health and Evaluationwww.cche.org
2
What you’ll find inside the toolkit
?

3
ABOUT THE TOOLKIT
ACKNOWLEDGEMENTS AND SUGGESTED CITATION
How to use this toolkitWhether your focus is active lifestyles or reducing neighborhood violence, chances are you’re trying to improve health for as many people as possible. That is why we’ve created this toolkit—to help you choose strategies that lead to meaningful population health outcomes.
Our experiences with communities across the country has taught us that strategies can be designed and implemented in ways to increase their reach and strength—their dose—and thereby the likelihood of seeing health improvements at a population level. Dose matters because it holds the promise of helping us reach that goal faster, more efficiently, and with more lasting results than we would without the insights dose offers about what does and does not work. It is a tool that complements qualitative methods to better understand the impact of strategies on commmunity health.
This toolkit it is intended to make it easy to apply dose for both planning and evaluating your health promotion efforts that focus on healthy eating and active living, but the potential for expanding these concepts is great. The toolkit includes detailed instructions on how to calculate the dose of selected strategies, including an interactive dose “calculator.” We also provide resources that help you introduce dose to different audiences, including community organizations and coalition members.
4
ABOUT THE TOOLKIT
HOW TO USE THIS TOOLKIT
AcknowledgementsThe dose toolkit is a product of years of collaboration between Kaiser Permanente, the Center for Community Health and Evaluation (CCHE), and the Nutrition Policy Institute (NPI) at the University of California. We would like to recognize and thank those who contributed greatly to this toolkit:
• The developers of the dose concept: Loel Solomon—who first coined the term dose—and Pamela Schwartz (Kaiser Permanente); Allen Cheadle, Emily Bourcier, Sandra Senter, Elena Kuo, and Ama Atiedu (CCHE); and Suzanne Rauzon and Rebecca Spring (NPI)
• Nicole Lezin for contributions to writing and the EAGLES team at Group Health Research Institute for editorial and design advice
• Our community, evaluation, and Kaiser Permanente colleagues for helping us to operationalize the dose methodology
• The individuals who pilot tested the toolkit and provided invaluable feedback
We would like to give special thanks to Suzanne Rauzon and her team (NPI) and Lisa Harner (Kaiser Permanente Evaluation Team) for their contribution building out and testing the dose concept.
This toolkit was produced by Elena Kuo, Carol Cahill, and Emily Bourcier (CCHE) and funded by Kaiser Permanente.
Suggested citationHealthy Dose: A Toolkit for Boosting the Impact of Community Health Strategies; version 1.0. Seattle: Center for Community Health and Evaluation, July 2015
The Center for Community Health and Evaluation (CCHE) designs and provides evaluation services for health-related programs and initiatives throughout the United States. CCHE is part of Group Health Research Institute in Seattle, Washington.

5
ASKING & ANSWERING “WHAT WORKS?” ?
The case for doseWhere did the term “dose” come from?When people hear the word “dose” they usually think of medicine. For this reason, we tested the term with a number of groups, including public health leaders, community groups, funders, and researchers. Most felt that in ordinary usage dose means the amount of an ‘‘active’’ ingredient in a medication, hence a higher dose results in a greater impact on an individual’s health. Dose is a simple term that practitioners and community members can easily understand. In this case, the active ingredient is the community strategy being implemented that is applied to an entire population rather than one person.
In school and community wide initiatives a population can be defined in any way that is meaningful—whether it be hospital, school, workplace, housing residents, or more. Our experience with dose is in the context of obesity prevention, but our hope is that the dose concept and methods will expand into other health areas.
A common yardstick to compare apples with orangesDose methods give us a way to add and compare different kinds of community strategies using a common yardstick to estimate impacts. For example, using dose we can compare a strategy like building more sidewalks to increase walkability (a high reach, but low intensity strategy) to a strategy like a walking group that meets every day (low reach, but high intensity). Dose lets us add up the impact of different strategies that target the same outcome and group of people. And it gives us a way of talking about how to increase the impact of our strategies—increasing the number of people reached and/or finding ways to make them stronger.
Veteran practitioners and savvy evaluators understand that dose matters, but they often lack the tools to account for its effects. Kaiser Permanente’s team has devised a practical way to reveal whether our efforts do, in fact, have enough reach and strength to make a difference. This pioneering work challenges us all to step up and enact changes that are both as inclusive and as influential as possible. We cannot counter the powerful forces that threaten our health—or harness the abundant opportunities to create thriving communities—with small steps on the sidelines. Understanding the dose of an intervention makes public health science more precise and it ought to catapult the next generation of health improvement initiatives to another level of scale and success.
– Researcher

6
ASKING & ANSWERING “WHAT WORKS?” ?
How one health system is using doseDose emerged over the first 10 years of Kaiser Permanente’s Community Health Initiative (CHI), a place-based obesity prevention effort. CHI is focused on increasing opportunities for healthy eating and safe, active living in schools, workplaces, health care, and neighborhoods. In 2009, with hundreds of different strategies and combinations of strategies deployed over five years across the country, it was time to ask: Is CHI making a difference in people’s health? Are these strategies, singly or in combination, strong enough to have an effect?
Kaiser Permanente’s team and evaluators designed an ongoing, multi-method evaluation. The preliminary results suggested that in many cases, the community strategies were not strong enough to have the expected impact. This insight led to some mid-course adjustments.
The team learned that strategies need to touch more people in a given place, and that touch must be strong enough to have a realistic chance to change behavior and have a measurable impact. This idea—that there is an intensity of “dose” underlying measurable changes, and that it is a function of both the number of people touched as well as the strength of that touch—became the concept of “population dose.”
Kaiser Permanente is now using dose to plan which combination of strategies to invest in and to provide technical assistance to grantees to build stronger and more effective strategies. Dose allows the CHI evaluation team to capture multiple strategy “apples and oranges” with a common metric that estimates population health improvement.
More information about the origins of dose and how Kaiser Permanente is using dose in its CHI is on the web and in the evaluation team’s article in the American Journal of Evaluation.

7
ASKING & ANSWERING “WHAT WORKS?” ?
Dose in communitiesDose is an estimate of the impact of community strategies on an average resident’s behavior. The dose score of a strategy is calculated by multiplying together two elements: reach—the percentage of people in your target population who are touched by a strategy and strength—the degree to which those people change their behavior to make healthy choices as a result of the strategy. Reach, strength, and dose formulas are explained in detail in the section on calculating dose.
Click on the red circles on the map to see examples of how dose could be used in a community. The population of this community is 25,400, with 6,500 school age children.

8
ASKING & ANSWERING “WHAT WORKS?” ?
Using dose for planningOne of the most powerful ways to use the dose approach is in the earliest phases of planning, when strategies are still being designed and before they are implemented. Asking explicit questions about a strategy’s (or cluster of strategies’) potential reach and strength—how each of these might be increased and how strategies can be combined to boost dose—could help agencies and coalitions select strategies that have a higher likelihood of achieving health outcomes. The Strategy Selection Checklist includes questions to consider when selecting community health promotion strategies.
Hypothetically almost any strategy could be implemented in such a way as to achieve anywhere from a very low to a very high dose. The reality, of course, is that achieving a high dose with every strategy would be impossible because of time, resource, and other limitations. Especially during the planning phase, considering the costs/benefits of implementing strategies in different ways is a useful exercise when determining how best to conduct the work.
The example below shows how an active transport to school strategy could be implemented with varying combinations of reach and strength.
Highest dose
Lowest dose
High Medium Low MinimalHigh Daily
walking school busAll bus routes
Daily walking school bus1/2 bus routes
Daily walking school bus1/4 bus routes
Daily walking school bus1 bus route
Medium Walk to School Mondays & FridaysAll schools
Walk to School Mondays & FridaysHalf of schools
Walk to School Mondays & Fridays1 school
Walk to School Mondays & Fridays1 class
Low Walk to School FridaysHalf of schools
Walk to School FridaysHalf of schools
Walk to School Fridays1 school
Walk to School Fridays1 school
Minimal Monthly Walk to School DayHalf of schools
Monthly Walk to School DayHalf of schools
Monthly Walk to School Day1 school
Monthly Walk to School Day1 school
REACH
STRENGTH
9
ASKING & ANSWERING “WHAT WORKS?” ?
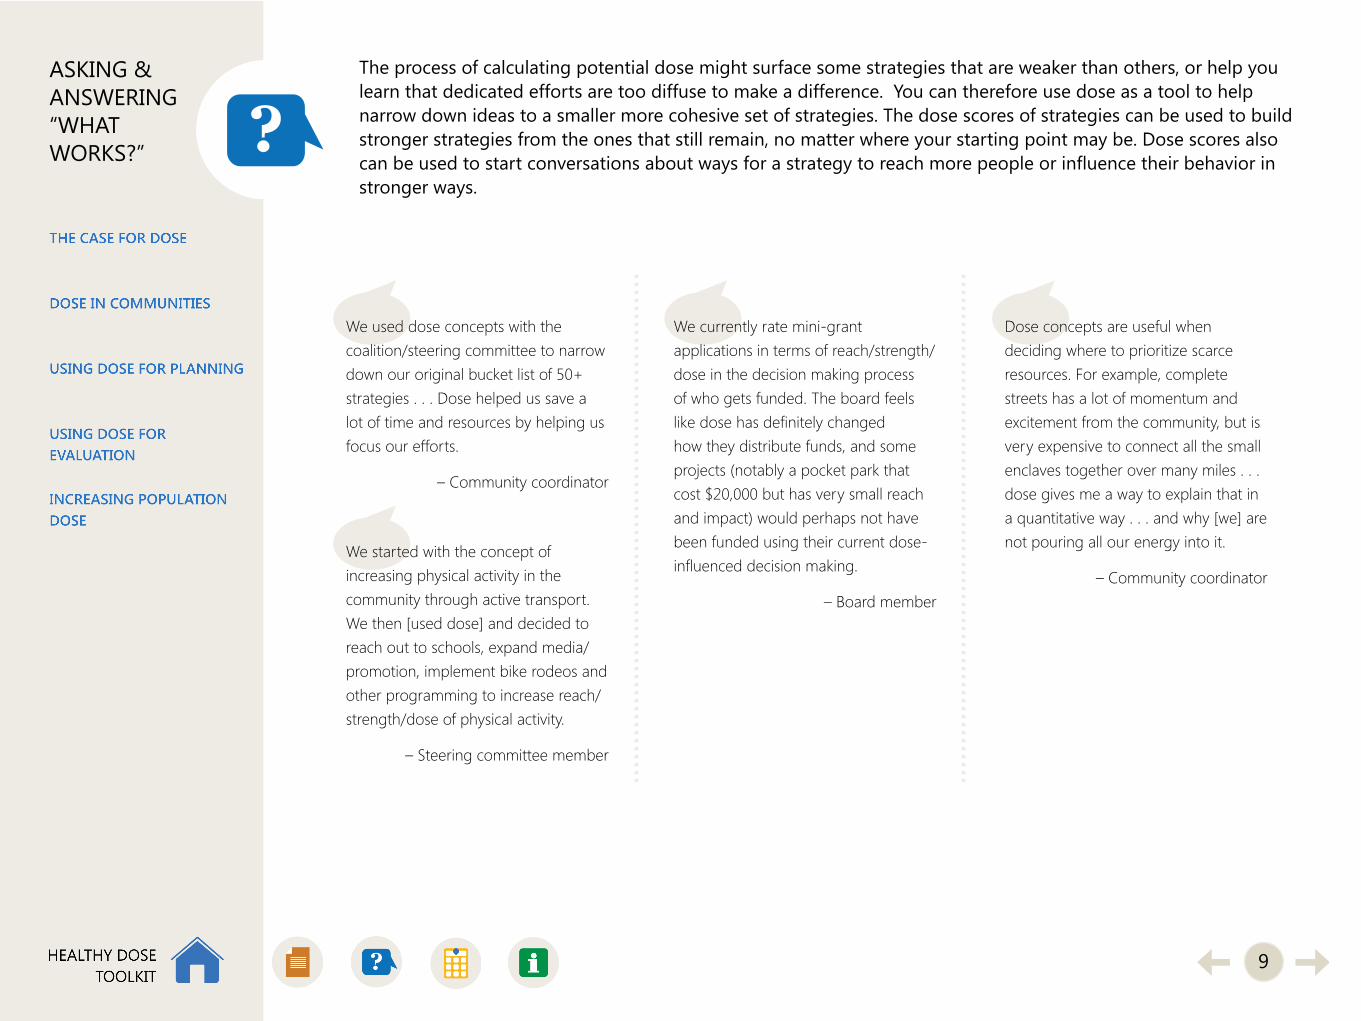
The process of calculating potential dose might surface some strategies that are weaker than others, or help you learn that dedicated efforts are too diffuse to make a difference. You can therefore use dose as a tool to help narrow down ideas to a smaller more cohesive set of strategies. The dose scores of strategies can be used to build stronger strategies from the ones that still remain, no matter where your starting point may be. Dose scores also can be used to start conversations about ways for a strategy to reach more people or influence their behavior in stronger ways.
We used dose concepts with the coalition/steering committee to narrow down our original bucket list of 50+ strategies . . . Dose helped us save a lot of time and resources by helping us focus our efforts.
– Community coordinator
We started with the concept of increasing physical activity in the community through active transport. We then [used dose] and decided to reach out to schools, expand media/promotion, implement bike rodeos and other programming to increase reach/strength/dose of physical activity.
– Steering committee member
We currently rate mini-grant applications in terms of reach/strength/dose in the decision making process of who gets funded. The board feels like dose has definitely changed how they distribute funds, and some projects (notably a pocket park that cost $20,000 but has very small reach and impact) would perhaps not have been funded using their current dose-influenced decision making.
– Board member
Dose concepts are useful when deciding where to prioritize scarce resources. For example, complete streets has a lot of momentum and excitement from the community, but is very expensive to connect all the small enclaves together over many miles . . . dose gives me a way to explain that in a quantitative way . . . and why [we] are not pouring all our energy into it.
– Community coordinator

10
ASKING & ANSWERING “WHAT WORKS?” ?
Using dose for evaluationDose is also useful for evaluation of strategies once they are implemented. Dose can help you track progress over time by estimating how many people have been reached to date and how strongly their behaviors are being influenced. You can use dose to estimate the population health improvement resulting from your community strategies. You can even conduct outcome evaluations to learn if your estimates of impact are accurate. Using dose for evaluation in some contexts can be challenging, so we recommend talking with an evaluator before diving into an actual evaluation (see the toolkit section on how to seek more support for using dose).
We review dose information at each strategic planning meeting. We were already in implementation when we first started hearing about dose. We wish we had thought of it this way earlier—we would likely not have funded as many small isolated strategies and [instead] focused on strategies in clusters where there was momentum and greater potential for impact earlier in the process. We’ve used it mostly as a confirmatory indicator of which strategies are going well and which aren’t gaining traction so that we can help make a stronger case for dropping strategies and focusing our last few years on other efforts.
– Community coordinator
We look for and discuss change over time. It’s particularly helpful when we review the data with principals each summer and plan for the next school year’s healthy eating and active living work. It helps [the principals and administrative committee] see where changes are occurring, and where they can put resources . . . if the changes aren’t being sustained.
– Local evaluator
11
ASKING & ANSWERING “WHAT WORKS?” ?
Increasing population doseIf dose matters and high-dose strategies matter even more, how can we systematically and intentionally increase dose? How can we build dose into planning, strategy selection, and evaluation? In part, we do so by asking: “Can we reach more people, more times, more often, for a longer period, throughout the year, and across sectors?”
Increasing dose by increasing reachIncreasing reach requires spreading changes to more people—more neighborhoods, more facilities, or in the example above, more students or more schools. Perhaps a Zumba program currently reaching 50 students or a nutrition education program in one school could be expanded to include more students.
Increasing dose by increasing strengthIncreasing strength means increasing the frequency, duration, and nature of the strategy. Perhaps students can be encouraged to use the playground more through promotion and structured recess activities, or perhaps a school cafeteria could offer 1-2 extra servings of fruits and vegetables instead of just ½ serving. Or maybe the school cafeteria can promote themselves more and attempt increase participation in its programs.
Increasing dose by adding another strategyOftentimes, adding another strategy targeting the same outcome is useful, either because it can affect an as yet unreached segment of the target population, or it can build momentum. Perhaps a school might be interested in revamping the PE curriculum or simply adding minutes of PE into the day to increase overall activity of all students. Perhaps a school district would add a salad bar to their cafeteria offerings.
Increasing dose by removing some strategiesThis might seem counterintuitive, but once communities begin to implement strategies, some may fail to gain momentum or encounter significant roadblocks. It is important to revisit the strategic plan periodically to determine if dropping one or more strategies might be beneficial to free up resources that might be better spent elsewhere. Perhaps the after school Zumba classes with 1% dose or the cooking matters classes with 0.1% dose are eating up resources to pay for instructors with fairly low attendance, and instead that money could go towards an instructor to provide structured recess or someone to provide nutrition education classes to a larger group of students instead.

12
CALCULATING DOSE
Calculating dosePopulation dose is a way to describe and compare the relative impact of different health promotion strategies. A strategy is considered high-dose if its implementation results in many people in the community changing their lifestyles in significant ways.
People in the community who are touched = Reach
Change in behavior = Strength
Reach x Strength = Population Dose
This part of the toolkit details how to calculate reach, strength, and dose for individual strategies and clusters of strategies that target the same outcome. We have developed an interactive dose calculator so you can try it for yourself.
DOSE = XREACH STRENGTH

13
CALCULATING DOSE
ReachReach is defined as the number of people from a target population who are touched by or exposed to a strategy. It is expressed as a percentage of the target population.
REACH = (# people exposed) / (total # in target population)
Denominator: total number in target population. First we need to define who is (and is not) included in a target population. This definition helps us understand what an “average” resident might experience, since some people will be exposed to a strategy and some will not. The target population could be defined as a county, a town, a school district or individual school, a neighborhood, a worksite, and more. This is the population whose behaviors and ultimately health you would like to improve.
Numerator: total number exposed/participating. Next we need to estimate who within the target population we expect to reach. The trick here is to be realistic about actual exposure. For example, we might wish that 100% of our target population would all use the new park or bike lanes that we build, or with that everyone would choose to eat the new healthier cafeteria offerings, but the reality is that reach is often much lower than 100%.

14
CALCULATING DOSE
Cautions and caveats when calculating reach Programs such as Zumba and cooking classes are easier to implement and perhaps make a big difference for those students reached, but only reach a small number of students. Even if the school district were to offer five classes per week, the reach would still be low, because the number of people attending is expressed as a percentage of the total target population.
The entire elementary school population is reached with playground improvements and educational programs so it’s tempting to state “100% of students were reached.” However, the total target population includes secondary school students, so population reach is 50%. Similarly it is tempting to say that all students in the district are exposed to Safe Routes to School or to cafeteria changes. However, these strategies only reach students who actually choose them— students who don’t start walking to school don’t change daily physical activity and students who don’t eat at the cafeteria are not going to increase their fruit and vegetable consumption.
Two weekly afterschool Zumba classes, 25 students per class
Reach = 25 people x 2 classes/1,000 in target population = 5%
Cooking Matters classes offered to 50 high school students per yearReach = 50 students in class/1,000 in target population = 5%
Playground renovation/improvement at elementary school with 500 studentsReach = 500 students/1,000 in target population = 50%
Harvest of the Month tastings and nutrition education for 500 elementary studentsReach = 500 students/1,000 in target population = 50%
Safe Routes to School media/promotion/education for all students, causes 250 students to begin to use active transport to/from schoolReach = 250 who change behavior/1,000 in target population = 25%
Cafeteria offerings at all schools add 1/2 serving of fruits/vegetables per lunch
Reach = 800 students who eat school lunch/1,000 in target population = 80%
Examples of calculating reach for a school district with 1,000 students (the target population)
PHYSICAL ACTIVITY STRATEGIES FRUIT & VEGETABLE STRATEGIES

15
CALCULATING DOSE
StrengthStrength estimates the degree to which people change a health behavior as a result of exposure to a strategy. Strength is also known as effect size, average percent change, or individual level impact. Strength is expressed as an average percent change in behavior for each person exposed.
STRENGTH = (% expected or actual change in behavior over baseline) x (frequency) x (duration)
We know that strength can be influenced by:
• The frequency of someone’s exposure (e.g., all days, most days, or only occasionally)
• The duration of exposure (e.g., 15 minutes of physical activity or an hour)
• The degree to which a healthy choice is the only choice (e.g., only healthy vending choices vs. some healthy, some unhealthy choices)
Strength can be determined in three ways (described in more detail on pages 14 and 15):
• Using default strengths, which are based on literature and prior evaluation evidence
• Using implementation data to assign a strength level based on estimated change in behavior
• Using quantitative data to calculate a more precise estimate of change in behavior from baseline
Regardless of how we estimate strength, we realize that these estimates are quite imprecise and somewhat subjective. However, we can still use them to determine relative strength within categories: minimal, low, medium, or high. Knowing relative strength of multiple strategies in turn allows us to calculate relative dose, and make broad predictions about population level impact.

16
CALCULATING DOSE
Rating category
Behavior change assigned value
Interpretation
Example: Active transport to school
No effect 0% No lasting effect on behavior One time Walk to School Day
Minimal 0.5% Minimal effect on behavior Monthly Walk to School Day
Low 2% Small but measurable effect Walk to School Fridays
Medium 5% Moderate effect Walk to School Mondays & Fridays
High 10% Strong effect on behavior Daily walking school bus plus promotion
Using default strengthEspecially when still in the planning phase, strength can be assigned a default estimate, which is the average strength we’ve seen in the literature and in our prior evaluation data. See the Strength Rating Guide for strength defaults by theme.
Example: We are planning for a youth physical activity initiative, and plan to include safe routes to school, but have still not determined the exact details of implementation. Using the strength rating guide, we assign it a default of “low” strength.
Using implementation data to assign strength ratingAs planning takes shape, or once actual implementation has begun, we can often refine strength ratings based on how the strategy is being implemented, using benchmarks of change in a behavior. We’ve found that most strategies for which we have strong evaluation data fall into five general categories. These categories are empirically grounded, in rough groupings of the median effect sizes of strategy level evaluations. Generally we have found that higher reach environmental strategies are lower strength, and smaller reach programmatic strategies tend to be higher strength. See the dose calculator for examples of how to assign a strength based on implementation information.
Example: We have been implementing a fairly strong safe routes to school program that includes twice weekly walk to school days. Using the dose calculator benchmarks for strength, we assign a medium strength to all students who are walking or biking.

17
CALCULATING DOSE
Using quantitative data to calculate strengthRather than use defaults or assigned ratings, we can instead calculate a more precise strength and use that estimate in our dose calculations. Often, this requires collecting much more in-depth evaluation data through observations, surveys, or interviews, and is typically not feasible for many strategies. The default strengths and the benchmarks included in the dose calculator are based on these more precise calculations. To help evaluators get started in making their own estimates, we are happy to provide a free consultation.
Example: Students at a middle school are surveyed pre/post implementation of a safe routes to school strategy. Data indicate that 40% of students started walking or biking to and from school an average of two days a week, and the average travel time was 15 minutes each way (30 minutes total). Data from a national CDC survey tells us that the average middle school student gets 35 minutes of exercise per day.
Strength = (% reached impacted by strategy) x (% increase in physical activity minutes) x (frequency of exposure) = (40% of students) X (30 minutes/35 baseline minutes) X (2/7 days a week for 36/52 weeks a year) = 6.8%
Our strength defaults and estimates are continually being refined as more strategy level evaluations are conducted. We look forward to collaborating with others to continue to build the evidence base.

18
CALCULATING DOSE
Examples of calculating strength for the school district with 1,000 students
FRUIT & VEGETABLE STRATEGIES
PHYSICAL ACTIVITY STRATEGIES
Playground renovation/improvement at elementary school with 500 students; recess is 45 minutes a dayDefault: Using the strength rating guide defaults for playground improvements (based on literature and other evaluations), we estimate this strategy to be low ≈ 2%
Implementation data: Based on published literature and fidelity to improvements evaluated in other communities, we estimate strength to be low ≈ 2%
Quantitative data: Observational data revealed 60% students were nonsedentary before the improvements compared with 75% after the renovation (15% increase). National surveys of elementary physical activity provide a baseline average of 85 minutes a day. Strength= 15% impacted * 45 min recess / 85 min baseline daily PA * 5/7 days a week * 8/12 months a year = 3.8% (low)
Cafeterias at all schools add fruits and vegetables to lunchesDefault: Using the strength rating guide defaults for school cafeterias (based on literature and other evaluations), we estimate this strategy to be low ≈ 2%
Implementation data: Based on conversations with the food service coordinator and data indicating 60% of students eat school lunches we estimate strength to be low ≈ 2%
Quantitative data: Based on menu analysis of cafeteria offerings coupled with observational data, we learn that before making the change students consumed an average of 1.5 servings of fruits and vegetables during lunch, and afterward they consumed 2.1 servings (increase of 0.6 servings). National survey data indicates that youth eat an average of 4.2 servings of fruits and vegetables per day, which provides a baseline. Strength = 60% impacted * 0.6 F&V servings increase / 4.2 baseline servings * 5/7 days a week * 8/12 months a year
= 2.7% (low)

19
CALCULATING DOSE
Cautions and caveats when calculating strengthBased on data regarding planned or actual implementation, we can estimate strength and use our best guess in cases where we don’t have quantitative data. For example, we can plan to add a serving of fruits and vegetables to cafeteria offerings, and we have implementation data from interviewing a food service coordinator, so we can estimate impact without observing students in the cafeteria to quantify actual increase in fruit/vegetable servings.
The entire elementary school population is reached with playground improvements and educational programs, but overall strength is fairly low. Policy and environmental strategies often have high reach, but it can be very difficult to deliver a high strength intervention to a large population. In cases where we have actual data collected on behavior, such as with a youth survey or through observations, we can calculate strength more precisely, but it’s still an estimate.
Common stumbling blocks when calculating strength include:
• Depending on how reach is defined, strength needs to take into account that not every “reached” person was impacted. For example, if reach of a cafeteria program is defined as the whole school, then strength needs to take into account that perhaps only 60% of students eat school lunch.
• Strength is expressed as change over baseline, not absolute change. So if during recess 15% more kids are engaged in active play, that is not a 15% strength. Rather, it means that 15% of students are getting 45 more minutes of physical activity during recess time, for a much lower impact on overall population level daily physical activity.
• Strength needs to take into account frequency and duration. For example, a school-based program at most affects youth 5 of 7 days a week, 36 of 52 months a year, and often less. Therefore overall strength is lower than if you just look at the school year.
These estimates are just that—estimates—and should not be interpreted as precise; the goal is to determine relative strength: minimal, low, medium, or high. As we’ll see in the next section, we can determine relative dose and estimate population level effect of a strategy.
The Strength Rating Guide provides default estimates of strength of several healthy eating/active living strategies based on typical implementation.
The dose calculator provides evidence-based estimates of strength of a number of healthy eating/active living strategies if they are implemented in different ways.

20
CALCULATING DOSE
Calculating population doseWhen we combine the number of people exposed (reach) and the estimated impact or change in lifestyle for each person reached (strength), we get population dose.
Most strategies can be implemented along a continuum from minimal to high reach and strength to calculate a range of dose.
Calculating dose: a physical activity exampleA neighborhood park has added walking trails and a playground in an effort to increase physical activity levels for the neighborhood’s residents—those living within a quarter-mile radius of the park. The entire community has about 10,000 residents.What is the strength formula for physical activity strategies?Physical activity strategy strength = (% impacted by the intervention) x (% increase in physical activity minutes) x (frequency of exposure)
What do we know?An evaluator observed that an average of 10 people used the park per day at baseline, and 50 people used it every day after improvements. The park can be used comfortably about 9 months out of the year due to weather.
An additional intercept survey indicated that users averaged about 30 minutes of physical activity per visit, and average about 30 minutes physical activity per day in general.
What can we safely assume?Estimates from the National Health and Nutrition Examination Survey and other surveys suggest that average physical activity for adults is 28 minutes per day, consistent with the intercept survey.Census data and mapping software indicate about 500 people live within ¼ mile of the park, and an intercept survey further confirms that 90% of users live this close.
Doing the mathReach: People living within ¼ mile of the park divided by the number of people in the whole community = 500/10,000 = 5.0%
Strength: 40 new users after the improvements x 30/28 minutes increase in physical activity per day per user x 9 of 12 months per year of park use = (40/500) x (30/28) x (9/12) = 6.4%
Dose = Reach x Strength = 5.0% x 6.4% = 0.3%
DOSE = XREACH STRENGTH

21
CALCULATING DOSE
Two weekly afterschool Zumba classes, 25 students per class
Reach = 5% Strength = 10% Dose = 0.5%
Cooking Matters classes offered to 50 high school students per yearReach = 5% Strength = 5% Dose = 0.25%
Playground renovation/improvement at elementary school with 500 studentsReach = 50% Strength = 2% Dose = 1%
Harvest of the Month tastings and nutrition education for 500 elementary studentsReach = 50% Strength = 2% Dose = 1%
Safe routes to school media/promotion/education for all students, causes 250 students to begin to use active transport to/from schoolReach = 20% Strength = 5% Dose = 1%
Cafeteria offerings at all schools add ½ serving of fruits/vegetables per lunch
Reach = 80% Strength = 5% Dose = 4%
Calculating dose for the school district with 1,000 students
PHYSICAL ACTIVITY STRATEGIES FRUIT & VEGETABLE STRATEGIES

22
CALCULATING DOSE
Calculating dose for combinations or clusters of strategiesIn order to increase the likelihood of population level change in behaviors and health, many multi-sector, place-based initiatives combine multiple strategies that collectively target the same outcome. Adding together the doses of several strategies focused on the same behavioral outcome is a way to estimate overall impact. Kaiser Permanente’s Community Health Initiative has grouped all strategies into dose clusters according to the main behavioral change targeted, and for each of these, we calculate dose separately for youth in school and for the community as a whole. While these measurements of dose are imprecise, they are useful for understanding big picture: is the dose high enough that we’d expect population level change to happen?
Dose is well suited for clustering and combining strategies because the formula—reach x strength—has universal units and we can therefore compare and combine programs, policies, and environmental changes. We add the dose of individual strategies to estimate a cluster of strategies is low, medium, or high dose to help evaluate relative impact. One limitation of this method is that any synergy among strategies will not be captured in the calculation.
PHYSICAL ACTIVITY
DOSE CLUSTERS
FRUIT & VEGETABLES
HEALTHY FOOD
SUGAR SWEETENED BEVERAGES
23
CALCULATING DOSE
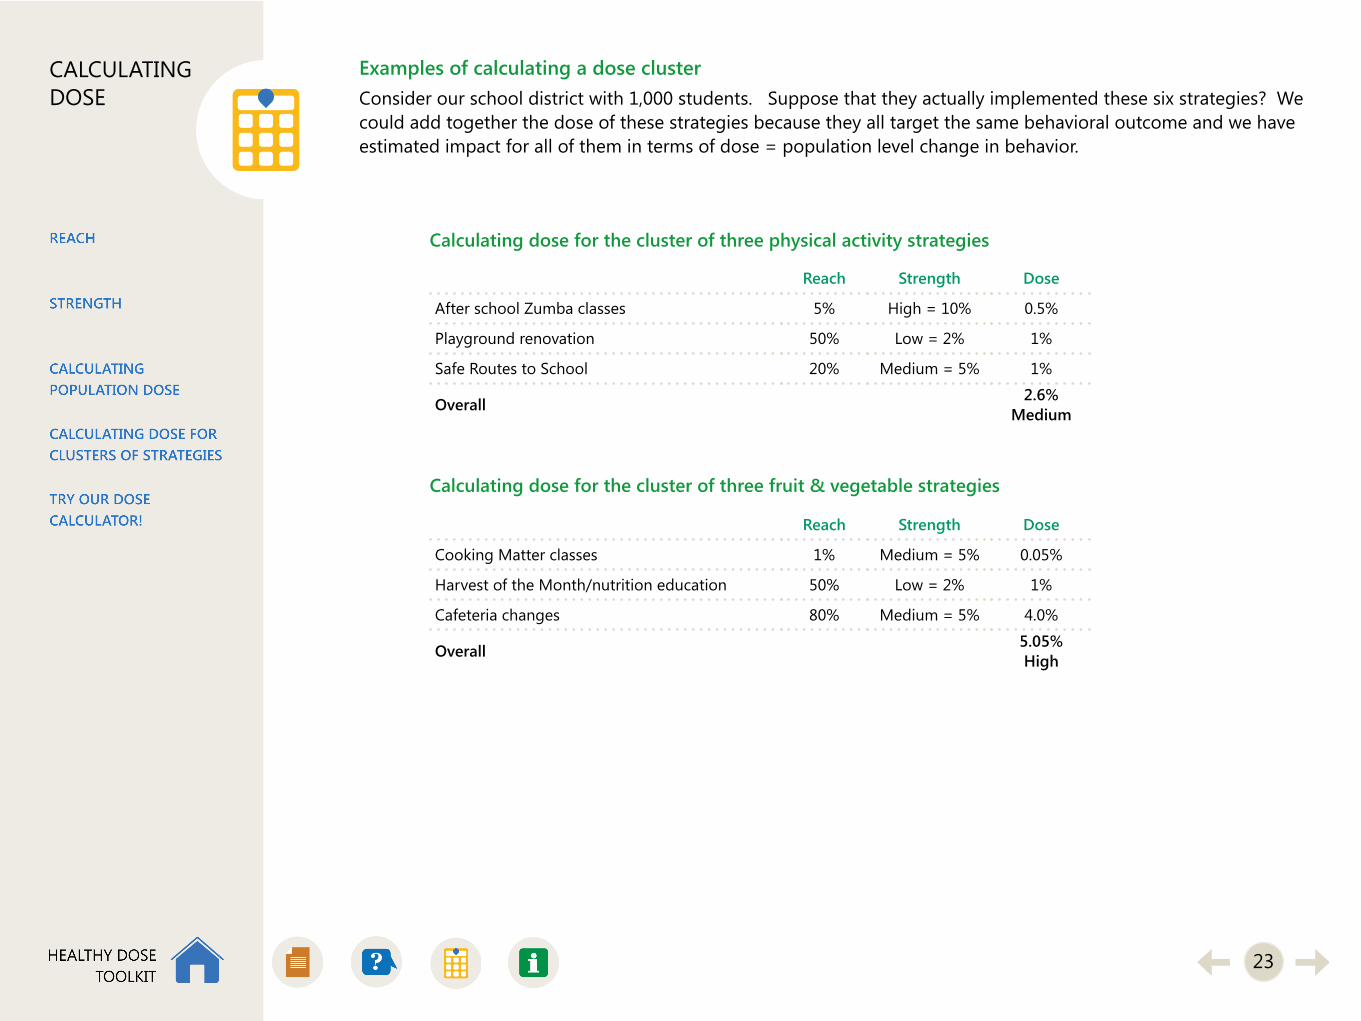
Examples of calculating a dose clusterConsider our school district with 1,000 students. Suppose that they actually implemented these six strategies? We could add together the dose of these strategies because they all target the same behavioral outcome and we have estimated impact for all of them in terms of dose = population level change in behavior.
Reach Strength Dose
After school Zumba classes 5% High = 10% 0.5%
Playground renovation 50% Low = 2% 1%
Safe Routes to School 20% Medium = 5% 1%
Overall 2.6%Medium
Reach Strength Dose
Cooking Matter classes 1% Medium = 5% 0.05%
Harvest of the Month/nutrition education 50% Low = 2% 1%
Cafeteria changes 80% Medium = 5% 4.0%
Overall 5.05%High
Calculating dose for the cluster of three physical activity strategies
Calculating dose for the cluster of three fruit & vegetable strategies

24
CALCULATING DOSE
Interpretation of dose cluster rangesDose clusters help estimate whether combinations of strategies are changing behaviors on a population level.
We classify dose estimates as follows, based on literature review of impact and typical margins of error in population level surveys:
• A dose of less than 2% is considered low impact; we would not expect a significant effect on behavior• A dose between 2% and 5% could yield a significant impact, but not large enough to measure with a population-
level survey (which has limited ability to detect small changes)• A dose above 5% would be both significant and measurable, detectable through a population survey
Low dose groups of strategies should not automatically assumed to be not working or not worth implementing. They might be catalysts for more change as time goes on or they might be impacting the community in other important ways, such as enhancing community cohesion, improving safety, and increasing economic opportunities. Dose should not be used in isolation when determining overall impact of an initiative.
In the examples we’ve used throughout this section, the youth physical activity strategy cluster reached 2.1% dose. We don’t believe that there was a precise population level 2.1% change in youth physical activity—rather, based on this estimate, we do believe that there has been significant impact likely not measurable on a population level yet. Similarly, the youth fruit/vegetable cluster dose was 5.05%, which we do not take to mean that exactly 5.05% change occurred. Rather, that estimate implies a significant impact occurred that was large enough that if we did a population survey, we’d expect to see measurable change.
For a more detailed discussion of how we classify dose, please see our overview of dose.
Cautions and caveats when calculating doseDose cannot be added across clusters that target different behavior. While we are confident that this methodology will allow one to compare apples to oranges, such as the relative impact of a PE curriculum change to playground improvements on minutes of physical activity, we don’t know how the relative impact of that PE curriculum change compares to adding ½ serving of fruits to school lunches. We do not yet have a conversion factor to compare percentage change in physical activity to percentage increase in fruits to percentage increase in food healthfulness, but we can safely assume that it is not a 1:1:1 ratio that would allow for directly adding doses from different clusters.
25
CALCULATING DOSE
Try out our dose calculator!The Excel file contains an interactive exercise so you can try estimating reach, strength, and dose for yourself!
First, you will define your target population
Second, select a target behavior for your strategies. If a strategy impacts more than one behavioral outcome, it might fall into multiple dose clusters.
Third, for each individual strategy, estimate reach and strength. Once all strategies in this cluster have been entered, you can review the estimated dose of each individual strategy and the cluster as a whole. Then try manipulating reach and strength or adding and removing different strategies to see how you might increase dose.
You can use the dose calculator:
For planningWhen your coalition is creating a strategic plan, this calculator can help you estimate potential reach/strength/dose of your strategies, alone and together. You can use this information to help focus efforts and decide where to invest you resources for maximal impact.
For implementation evaluationWhen you are in the midst of implementation of your strategic plan, this calculator can help estimate current vs. projected impact of strategies. You can use this information to understand where you have momentum, where you are meeting goals, and where you are struggling. You might decide to stop working on strategies that aren’t coming together, and might decide to add another strategy in an area where you are starting to gain traction.
For final outcome evaluationWhen an initiative is coming to a close, dose is one useful tool to describe overall impact of a fully implemented set of strategies. Especially in situations where an expensive population level survey is not feasible, dose is very useful as a less precise measure of impact in your population.
Learn more about our dose methods.

26
MORE INFORMATION & RESOURCES
Talking about dose: Consider your audienceThe concept of dose falls into the category of “simple, but not easy.” That’s because it makes intuitive sense, but can get tricky in its application. Different audiences can and should take different learnings and insights from exposure to the dose concept. To help them do so, you can calibrate your communications about dose for different audiences.
Let’s consider two general levels: 1) practitioners, planners, and coalition members who are interested in matching their scarce resources to the best evidence of what works for healthy eating and active living, and 2) evaluators who want to assess these efforts. It’s important to keep these two groups in mind in communicating about dose, so that everyone can get the most of this useful but often unfamiliar concept.
Practitioners, planners, and coalition members looking for big pictureThe first group is a larger and more common audience. With little prior exposure to dose and perhaps less comfort with statistics and quantitative analysis, this group may benefit the most from using the population dose concept for planning, quality improvement, and focusing their choices of interventions and strategies. They may still want to go to another, deeper level of analysis (involving the actual calculations), but they don’t have to in order to benefit from understanding dose.
EvaluatorsThe second group might include outside evaluators who are responsible for facilitating dose discussions, in order to predict and then assess what worked, and to what degree, for an agency, coalition, or community. For this group, the nuts and bolts of dose formulas— such as calculating effect sizes and strength of interventions, using existing population health surveys or data and estimating dose for comparisons to survey data— will be more relevant.
Even though these two groups may have different interests and comfort levels with various components of the population dose concept, they still need to communicate with their stakeholders. Understanding dose at any level can help frame evaluation questions and suggest interpretations of findings, no matter who does the actual calculations.
Resources you can use to talk about doseA guide that provides an overview of dose
A PowerPoint slide deck you can use to introduce dose to community stakeholders
27
MORE INFORMATION & RESOURCES
Dose glossaryAbsolute change—the numerical difference in values associated with a change in behavior after implementing a strategy (e.g., 2.0 servings of fruits and vegetables pre vs. 2.5 servings post—absolute difference is 0.5 servings); see also relative change.
Denominator—the bottom number in a fraction. For reach, the denominator is # of people in the target population. For strength, the denominator is the baseline level of a target behavior.
Dose—see population dose.
Dose cluster—a group of strategies targeting the same population and attempting to change the same behavior, e.g., all strategies targeting youth physical activity in a school district.
Duration—Part of a strength formula; describes how long an activity takes place (15 minutes, 1 hour, etc.)
Effect size—see strength.
Exposure—see reach.
Frequency—Part of a strength formula; describes how often an activity is taking place (daily for 3 months, weekly for a whole school year, etc.)
Fruit & vegetable (FV) strategy—a strategy designed to increase consumption of fruits and vegetables.
HEAL—an abbreviation for Healthy Eating Active Living, which describes groups of behaviors that can reduce obesity.
Healthy food strategy—a strategy designed to increase the overall healthfulness of food, in terms of decreasing salt/fat content, decreasing consumption of processed foods, creating proper portions of various food groups, decreasing refined sugar content, and increasing use of whole grains.
Impact—see strength.
Intervention—see strategy.
Moderate/vigorous physical activity (MVPA)—activity that increases the heart rate and leads to at least some change in breathing from resting sedentary levels.
Numerator—the top number in a fraction. For reach, the numerator is the number of people touched or exposed. For strength, the numerator is the increase in a behavior.

28
MORE INFORMATION & RESOURCES
Outcome—the behavior that a strategy or set of strategies seeks to change. With regard to obesity, the four outcomes in the dose toolkit are fruit/vegetable consumption, healthier food consumption, sugar sweetened beverage consumption, and physical activity.
Physical activity (PA) strategy—a strategy that is designed to increase physical activity behaviors in the target population.
Population dose—or dose, is a way to describe and compare the relative impact of different health promotion strategies. A strategy is considered high-dose if its implementation results in many people in the community changing their lifestyles in significant ways.
Reach—the number of people from a target population “touched by” or “exposed to” a strategy. It is expressed as a percentage of the target population. Example: a school district with 1,000 students offers an education program for students at one school with 200 students. Reach = 200/1000 = 20%.
Relative change—the percent change in a behavior after implementing a strategy (e.g., 2.0 servings of fruits and vegetables pre vs. 2.5 servings post—relative change is 0.5/2.0 = 25%); see also absolute change.
Serving—when evaluating a fruit/vegetable strategy, 1 serving is typically defined as ½ cup fruit or non-leafy vegetable, 1 cup leafy vegetables, or 1 medium sized piece of fruit.
Sugar sweetened beverage (SSB) strategy—a program or campaign or environmental change designed to decrease consumption of drinks that have added sugar.
Strategy—a program, policy, or environmental change targeting a behavioral outcome of interest.
Strength—also known as effect size, average percent change, or individual level impact—describes change in health behavior as a result of being exposed to a strategy. Strength is expressed as an average percent change in behavior for each person exposed.
Target population—the group of people that a set of strategies is trying to reach. This can be a community, a workplace, a school or school district, or a geographic area. Each individual strategy might not reach the whole target population, but the combined dose of all strategies will be interpreted as the average amount of impact on an individual in the target population.
Touch—see reach.
Dose glossary (continued)

29
MORE INFORMATION & RESOURCES
How to seek more supportAre you a practitioner?Using dose for evaluation can be challenging, so we recommend talking with an evaluator before diving into an actual evaluation. CCHE would be pleased to work with you on using dose in your community health improvement efforts. At CCHE we offer a range of dose technical support, including a free 1-hour consultation. Please contact Allen Cheadle, [email protected].
Are you an evaluator?There is a lot of “behind the scenes” work to arrive at dose calculations. It is based on many years and data from hundreds of strategy level evaluations to establish formulas for estimating strength. If you are an evaluator or interested in learning more about our methods, please contact Allen Cheadle, [email protected].
More information about doseA guide that provides an overview of dose
PowerPoint slide deck for introducing dose to community stakeholders
American Journal of Evaluation article on population dose in obesity obesity prevention initiatives
Dose in Kaiser Permanente’s Community Health Initiatives
Information on choosing community strategiesStrategy Selection Checklist
Strength Rating Guide
Community Health Improvement Navigator (Centers for Disease Control and Prevention)


![Delta Boosting Machine and its Application in Actuarial ... · (MARS), regression trees [22] and boosting. 1.1. The Boosting Algorithms. Boosting methods are based on an idea of com-bining](https://img.dokumen.tips/doc/110x75/5f39fd86e92ad51969114a8c/delta-boosting-machine-and-its-application-in-actuarial-mars-regression-trees.jpg)