Embed Size (px)
Citation preview

HealthChoices RISK-ADJUSTED RATES MANUAL – VERSION 2.4 COMMONWEALTH OF PENNSYLVANIA FEBRUARY 8, 2013

HealthChoices RISK-ADJUSTED RATES MANUAL V2.4 COMMONWEALTH OF PENNSYLVANIA
MERCER
i
CONTENTS
1. Introduction ............................................................................................................... 1
2. CDPS+Rx Model Background ................................................................................... 3 • Model Components ............................................................................................. 3 • Populations Evaluated......................................................................................... 7 • Relative Cost Weights ......................................................................................... 8
3. Pennsylvania-Specific Cost Weights ......................................................................... 9 • Determine Relative Individual Managed Care Costs............................................ 9 • Classify Individuals into CDPS+Rx Categories .................................................. 10 • Determine How Each Category Influences Costs .............................................. 10
4. Capitation Rates and Other Reimbursement Arrangements.................................... 12 • Geographic Regions.......................................................................................... 12 • Rating Groups ................................................................................................... 13 • Supplemental Maternity Care Payment ............................................................. 13 • Risk-Sharing and Risk-Pool Arrangements........................................................ 13 • Pay-for-Performance (P4P) ............................................................................... 14
5. Data Collection, Validation and Processing ............................................................. 15 • Data Elements................................................................................................... 15 • Data Validation .................................................................................................. 18 • Data Processing for Risk Scoring ...................................................................... 19 • PH-MCO Encounter Data Monitoring and Management .................................... 20
6. Individual Risk Score Development ......................................................................... 22 • Data Collection and Validation........................................................................... 22 • Scoring Criteria.................................................................................................. 22 • CDPS+Rx Processing ....................................................................................... 23 • Prevalence Report............................................................................................. 23 • Estimated Financial Impact Report .................................................................... 25

HealthChoices RISK-ADJUSTED RATES MANUAL V2.4 COMMONWEALTH OF PENNSYLVANIA
MERCER
ii
7. PH-MCO Risk Score Development.......................................................................... 26 • Recipient Assignment and Acuity Factor Selection............................................ 26 • Unscored Assumed Risk Score ......................................................................... 26 • Final Unadjusted Plan Factor Development....................................................... 30 • Budget Neutrality Adjustment ............................................................................ 31 • Plan Factor and Risk-Adjusted Rates Reporting................................................ 32
8. Newborn Process.................................................................................................... 33 • Acuity Factor Development................................................................................ 33 • Plan Factor Development .................................................................................. 34 • Newborn Plan Factor Reports ........................................................................... 35 • Newborn Acuity Factor File................................................................................ 36 • New PH-MCO and HealthChoices Expansion Considerations........................... 36
Appendix A: Historical Perspective
Appendix B: Glossary
Appendix C: Pennsylvania-Specific Cost Weights
Appendix D: Sample Reports
Appendix E: Potential Data Improvement Activities
Appendix F: PH-MCO Risk Score Credibility Grid

HealthChoices RISK-ADJUSTED RATES MANUAL V2.4 COMMONWEALTH OF PENNSYLVANIA
MERCER
iii
Note to the Reader This manual provides background information regarding the HealthChoices risk-adjustment policies and procedures. Updates to the manual are made occasionally to account for significant methodological changes. Changes from Version 2.3 There were no methodological changes in the risk-adjustment processes from Version 2.3 to Version 2.4. The main update to the manual was done to reflect updates to the HealthChoices expansion and to address the elimination of the Federal General Assistance (GA) rate cell effective July 2012. The majority of the members formerly in the Federal GA rating group were moved to the Supplemental Security Income (SSI) and Healthy Horizons rating group, while the remaining members were moved to the Temporary Assistance for Needy Families (TANF) and Healthy Beginnings (HB) rating groups. In the event that a recipient was still in the Federal GA rating group during an application month following this change, the recipient was mapped to the SSI and Healthy Horizons rating group for risk scoring purposes.

HealthChoices RISK-ADJUSTED RATES MANUAL V2.4 COMMONWEALTH OF PENNSYLVANIA
MERCER
1
1 Introduction In 1997, the Commonwealth of Pennsylvania (Commonwealth) implemented the HealthChoices program, a managed care program for Medical Assistance recipients. The goals of the HealthChoices program are to improve access to and the quality of care provided to the Commonwealth’s vulnerable, low-income population, while stabilizing public health care spending. The Commonwealth’s Department of Public Welfare (DPW) oversees the physical health component of the HealthChoices program and is responsible for the continued pursuit of these goals in the ever-changing environment of health care. The physical health component of HealthChoices is administered through contracts between the Commonwealth and several different physical health managed care organizations (PH-MCOs). In return for a predefined payment amount (i.e., capitation rate), these PH-MCOs enter into agreements that cover the terms for delivery of services, recipient rights, reporting requirements, and the overall operation of the physical health component of the HealthChoices program. The PH-MCOs choose to take on the financial risk of delivering health care services to their HealthChoices members and manage their members’ care using tools and approaches they deem effective. Medical Assistance recipients who are eligible for the HealthChoices program either voluntarily select or are assigned to one of these different PH-MCOs serving the particular geographic area in which the recipient lives. With multiple PH-MCO choices available to HealthChoices members, variations in health risk among the participating PH-MCOs are unavoidable. As a prudent health care purchaser, DPW continues to look for innovative ways to effectively use the Commonwealth’s public resources to pay for the HealthChoices program. In 2003, with input from the PH-MCOs and other stakeholders, DPW introduced a Medicaid-based risk-assessment tool to further achieve the goal of matching payment to risk. This is accomplished by using the health risk for each member, as measured by the risk-assessment tool, to determine the health risk of the population enrolled in each PH-MCO and then adjusting the capitation rates based on the PH-MCO’s measured health risk. This process results in capitation rates that vary for each PH-MCO to account for the underlying health risk of the enrolled population. This process results in PH-MCOs receiving higher payments when the enrolled population is expected to be higher risk than the average population. Similarly, PH-MCOs will receive lower payments when the enrolled population is expected to be lower risk than average. Recognizing that member risk attraction patterns can change over time, PH-MCO health risk is updated frequently. Currently, this is done on a monthly basis. This manual provides background information regarding risk-adjustment policies and procedures that were the most up-to-date in effect at the time the manual was released. Any expected or known changes are referenced within the manual. Although this manual attempts to define and describe the overall development of the risk-adjustment process, specific application may vary depending on the available data, changes to the covered population and benefits, PH-MCO participation in HealthChoices and any other process refinements. Additional details regarding the specific data and technical processes used to develop the individual risk scores, which are

HealthChoices RISK-ADJUSTED RATES MANUAL V2.4 COMMONWEALTH OF PENNSYLVANIA
MERCER
2
currently updated on a semi-annual basis, are shared with the PH-MCOs in a methodology letter. This letter also describes the intended process that will be used to calculate the PH-MCO risk scores for the corresponding period. For significant changes and where practical, the PH-MCOs will be notified in advance and their feedback will be considered prior to application. The risk-adjustment approach used to adjust the capitation payments has been refined over time to incorporate changes in risk-adjustment practices and to address feedback collected on the process. Appendix A provides a historical perspective on the HealthChoices risk-adjustment process, which includes a summary of the implementation process and the major changes that have been made since 2003. To help readers less familiar with risk adjustment, a glossary of terms has been provided in Appendix B.

HealthChoices RISK-ADJUSTED RATES MANUAL V2.4 COMMONWEALTH OF PENNSYLVANIA
MERCER
3
2 CDPS+Rx Model Background To measure the risk associated with each PH-MCO, DPW evaluated possible risk-assessment models that measure health risk using demographic indicators in addition to disease history. While many risk-assessment models exist, DPW elected to implement the only model that was specifically designed for Medical Assistance populations. The Chronic Illness and Disability Payment System (CDPS) is a diagnostic classification system that Medicaid programs can use to make health-based capitated payments for Temporary Assistance for Needy Families (TANF) and Disabled Medicaid individuals. The CDPS model was designed by the University of California, San Diego (UCSD) in conjunction with clinical consultants and was used to risk adjust HealthChoices capitation payments from 2003 through 2008. In 2008, UCSD performed a comprehensive review of the existing CDPS model using updated data. While most of the framework remains the same, the model update released in November 2008 includes a reevaluation of model components and updates to several disease classifications. As part of this update, UCSD also created a diagnostic and pharmacy combined model which uses CDPS in conjunction with UCSD’s pharmacy-based risk-assessment model, which is referred to as Medicaid Rx. Beginning in 2009, the combined CDPS and Medicaid Rx (CDPS+Rx) risk-assessment model has been used to adjust capitation payments for HealthChoices. This section outlines the major components of the CDPS+Rx model. More information regarding any of the UCSD models can be found at the UCSD website (http://cdps.ucsd.edu/). Model Components The CDPS+Rx model was designed using 2001–2002 data from 30+ Medicaid programs. The intent of the model was to include readily available demographic and disease characteristics that were valid and accurate estimators of current and future health care expenditures. As many services require the provision of diagnoses or a valid national drug code (NDC) in order to receive payment for services rendered, electronic claims information is a viable method of collecting diagnostic and drug data for risk-assessment purposes. For diagnoses reporting, UCSD staff, along with their clinical consultants, reviewed the ICD-91 diagnoses manual to determine which diagnoses were ill-defined and inappropriate for risk assessment. Many diagnoses are indicative of symptoms rather than a specific disease condition which is likely to persist. For example, a diagnosis of chest pain can be indicative of many conditions and is most likely not a good estimator or predictor of health care expense. Once the ill-defined conditions were isolated, the remaining diagnoses were placed into 19 major categories. Some are representative of specific body systems (e.g., cardiovascular or pulmonary) and others fall into a group of illnesses that affect multiple systems (e.g., infectious disease or diabetes). For diagnosis-based conditions, these major categories are further delineated into subcategories based on their perceived medical intensity.
1 International Classification of Diseases, 9th Revision

HealthChoices RISK-ADJUSTED RATES MANUAL V2.4 COMMONWEALTH OF PENNSYLVANIA
MERCER
4
To determine which NDCs were appropriate to supplement the CDPS risk-assessment model for the identification of chronic conditions, UCSD staff and clinical consultants reviewed both the current listing of NDCs and the current 45 disease condition groupings within the Medicaid Rx model. The result of this review is the Restricted Version of the Medicaid Rx model which includes 15 disease conditions. These Medicaid Rx conditions are linked to a specific subcategory within the CDPS model corresponding to the appropriate chronic disease condition and perceived medical intensity. Table 2.1 provides a listing of the major categories, medical intensity subcategories/pharmacy categories, and sample conditions within each classification. The 15 categories within the Restricted Version of the Medicaid Rx model are identified by MRX and appear with the CDPS-linked subcategory. Table 2.1 – The CDPS+Rx Categories with Sample Conditions Disease category Sample conditions Cardiovascular
Very high Heart transplant status or artificial heart replacement Medium and MRX Anti-Coagulants Congestive heart failure, primary pulmonary hypertension or
cardiomyopathy Low Heart valve transplant, atrial fibrillation or angina Extra low and MRX Cardiac Hypertension Psychiatric
High Schizophrenia Medium Bipolar affective disorder or hallucinations Medium low Major depression or impulse control disorder Low and MRX Depression/Psychosis/Bipolar
Other depression, obsessive-compulsive disorder or antisocial disorder
Skeletal and connective
Medium Aseptic necrosis of bone, anomalies of spine or kyphosis Low Ankylosis of joint, cyst of bone or traumatic amputation of
arm/hand Very low and MRX Inflammatory/Autoimmune
Kissing spine, claw toe, anomaly of the spleen or conjoined twins
Central nervous system High Quadriplegia, Werdnig-Hoffmann disease or other motor neuron
disease Medium and MRX Multiple Sclerosis/Paralysis
Primary cerebellar degeneration, multiple sclerosis or Schilder's disease
Low; MRX Parkinson's/Tremor and MRX Seizure Disorders
Coma, Pick's disease or Parkinson's disease
Pulmonary Very high Cystic fibrosis, lung transplant or tracheostomy complications High Respiratory arrest or selected pneumonias Medium Pulmonary collapse, acute respiratory failure or congenital cystic
lung

HealthChoices RISK-ADJUSTED RATES MANUAL V2.4 COMMONWEALTH OF PENNSYLVANIA
MERCER
5
Disease category Sample conditions
Low and MRX Tuberculosis Chronic bronchitis, asthma or mass in chest Gastrointestinal High Celiac disease or liver transplant status Medium Alcoholic fatty liver, chronic hepatitis or regional enteritis Low Ulcer of the esophagus, umbilical hernia or chronic pancreatitis Diabetes Type 1 Type 1 diabetes Type 2 and MRX Diabetes Type 2 or unspecified diabetes Skin High Skin transplant status or chronic ulcer of skin Low Ulcer of lower limbs, except pressure ulcer Very low Cellulitis or burn Renal Extra high Renal dialysis status Very high and MRX ESRD/Renal Chronic kidney disease Medium Nephrotic syndrome or kidney transplant status Low Kidney infection, kidney stones or urinary incontinence Substance abuse Low Drug withdrawal, drug psychoses or cocaine dependence Very low Alcohol abuse, dependence or psychosis Cancer Very high Malignant neoplasm of pancreas or secondary malignant
neoplasm of respiratory and digestive systems High Malignant neoplasm of stomach, trachea, bronchus, lung or brain Medium and MRX Malignancies Malignant neoplasm of colon, thymus, heart or Hodgkin's disease Low Malignant neoplasm of lip, tongue, breast or malignant melanoma
of skin Developmental disabilities
Medium Severe or profound mental retardation Low Mild/moderate mental retardation or Down syndrome Genital Extra low Uterine and pelvic inflammatory disease Pregnancy Complete/Incomplete Normal pregnancy, complications of pregnancy or multiple
delivery Metabolic High Lipidoses or non-HIV immunity deficiencies Medium Cushing's syndrome, Kwashiorkor or other autoimmune disease Very low Other pituitary disorders or gout
HealthChoices RISK-ADJUSTED RATES MANUAL V2.4 COMMONWEALTH OF PENNSYLVANIA
MERCER
6
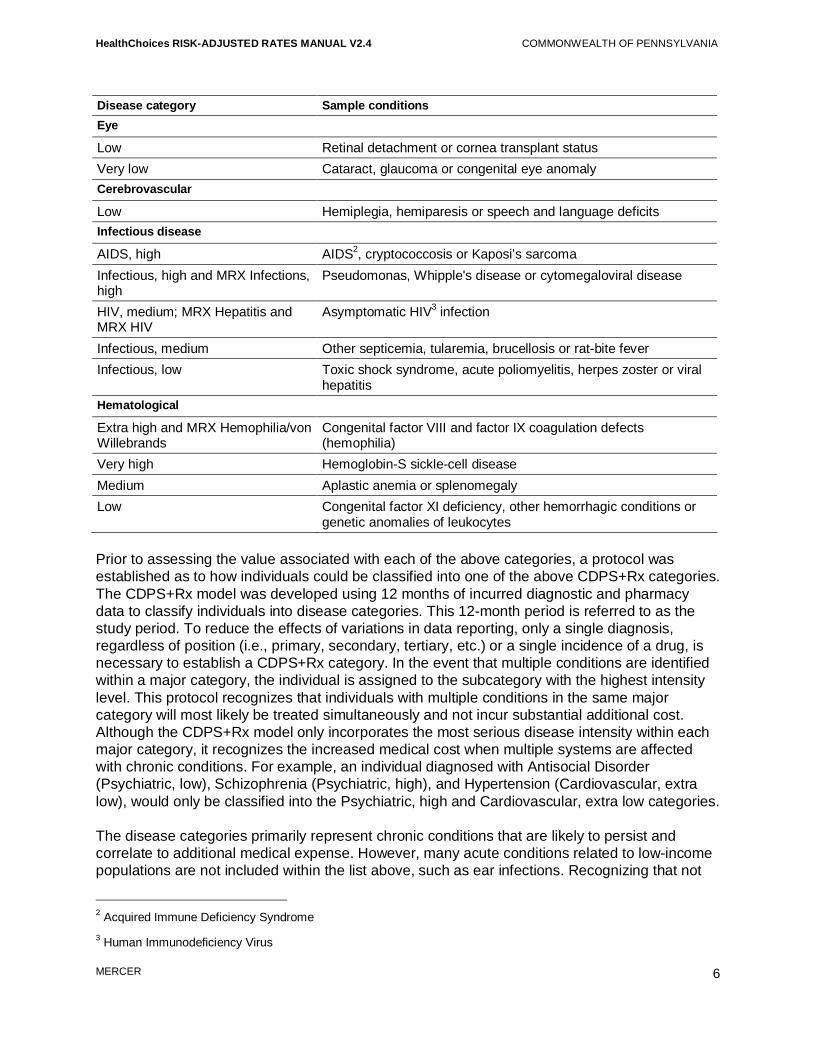
Disease category Sample conditions Eye Low Retinal detachment or cornea transplant status Very low Cataract, glaucoma or congenital eye anomaly Cerebrovascular Low Hemiplegia, hemiparesis or speech and language deficits Infectious disease AIDS, high AIDS2, cryptococcosis or Kaposi’s sarcoma Infectious, high and MRX Infections, high
Pseudomonas, Whipple's disease or cytomegaloviral disease
HIV, medium; MRX Hepatitis and MRX HIV
Asymptomatic HIV3 infection
Infectious, medium Other septicemia, tularemia, brucellosis or rat-bite fever Infectious, low Toxic shock syndrome, acute poliomyelitis, herpes zoster or viral
hepatitis Hematological Extra high and MRX Hemophilia/von Willebrands
Congenital factor VIII and factor IX coagulation defects (hemophilia)
Very high Hemoglobin-S sickle-cell disease Medium Aplastic anemia or splenomegaly Low Congenital factor XI deficiency, other hemorrhagic conditions or
genetic anomalies of leukocytes Prior to assessing the value associated with each of the above categories, a protocol was established as to how individuals could be classified into one of the above CDPS+Rx categories. The CDPS+Rx model was developed using 12 months of incurred diagnostic and pharmacy data to classify individuals into disease categories. This 12-month period is referred to as the study period. To reduce the effects of variations in data reporting, only a single diagnosis, regardless of position (i.e., primary, secondary, tertiary, etc.) or a single incidence of a drug, is necessary to establish a CDPS+Rx category. In the event that multiple conditions are identified within a major category, the individual is assigned to the subcategory with the highest intensity level. This protocol recognizes that individuals with multiple conditions in the same major category will most likely be treated simultaneously and not incur substantial additional cost. Although the CDPS+Rx model only incorporates the most serious disease intensity within each major category, it recognizes the increased medical cost when multiple systems are affected with chronic conditions. For example, an individual diagnosed with Antisocial Disorder (Psychiatric, low), Schizophrenia (Psychiatric, high), and Hypertension (Cardiovascular, extra low), would only be classified into the Psychiatric, high and Cardiovascular, extra low categories. The disease categories primarily represent chronic conditions that are likely to persist and correlate to additional medical expense. However, many acute conditions related to low-income populations are not included within the list above, such as ear infections. Recognizing that not
2 Acquired Immune Deficiency Syndrome 3 Human Immunodeficiency Virus

HealthChoices RISK-ADJUSTED RATES MANUAL V2.4 COMMONWEALTH OF PENNSYLVANIA
MERCER
7
all risk is explained through the chronic disease categories, the CDPS+Rx model incorporates additional demographic factors to estimate the medical resources not contained in one of the conditions listed in Table 2.1. There are 11 demographic classifications within this component of the CDPS+Rx model, which are listed below. For the demographic category determination, the exact age (not rounded) of each individual at the end of the study period is used: • Under age 1 • Age 1 to 4 • Male age 5 to 14 • Female age 5 to 14 • Male age 15 to 24 • Female age 15 to 24 • Male age 25 to 44 • Female age 25 to 44 • Male age 45 to 64 • Female age 45 to 64 • Age 65 and over Populations Evaluated During the CDPS and CDPS+Rx model development, significant cost variation was measured among the TANF and Disabled populations. In order to maintain the cost variation and reflect that Medicaid programs typically have separate capitation rates for these two populations, separate models were developed for the TANF and Disabled populations. In addition to recognizing the cost differences associated with the TANF and Disabled populations, UCSD explored the possibility of separate models for adults and children. For the TANF population, significant amounts of data were available to develop a TANF adult model and a TANF child model. Despite the variance in disease prevalence among adults and children, the Disabled population did not have sufficient membership to provide separate models for the adult and children populations. To reflect that certain conditions have additional costs when they are attributable to children, the CDPS+Rx Disabled model contains add-on values for children with certain disease conditions. These factors, referred to as child interaction factors, are incorporated in the risk assessment for any Disabled child. There are 10 classifications within this component of the Disabled CDPS+Rx model, which are listed below: • Cardiovascular, very high • Cardiovascular, medium • Central nervous system, medium • Pulmonary, very high • Pulmonary, high • Gastrointestinal, high • Metabolic, high • HIV, medium • Infectious, medium • Hematological, extra high

HealthChoices RISK-ADJUSTED RATES MANUAL V2.4 COMMONWEALTH OF PENNSYLVANIA
MERCER
8
Relative Cost Weights The CDPS+Rx categories provide a demographic and disease description of the Medicaid population studied. However, to best utilize the CDPS+Rx model to predict future expenditures, the relative cost associated with each CDPS+Rx model component needs to be known. Medical cost information is collected by individual and compared to their CDPS+Rx categories (disease, including any child interaction factors and demographic). Medical costs are then assigned to each CDPS+Rx category using a statistical analysis4. The estimated medical costs from the analysis are translated into a relative cost weight by comparing the costs attributable to each category to the average cost of the total population. For example, if the average expenditures for a TANF child are $1,800 per year and the costs attributable to the CDPS+Rx category Gastrointestinal, low are $3,600 for the same year, the resulting TANF child model relative cost weight for Gastrointestinal, low is 2.0 ($3,600/$1,800). Therefore, a TANF child classified into the Gastrointestinal, low category would be approximately two times more expensive than the average TANF child (without taking into account the member’s demographic and additional disease conditions, if any). An additional consideration when developing relative cost weights is the relationship between incurred medical costs to the classified CDPS+Rx categories. There are two primary methods of correlating disease and cost data: the prospective method and the concurrent method. Under the prospective approach, disease conditions collected in one year are compared to the incurred medical costs in the subsequent year. Since this method utilizes first year diagnoses to “predict” the second year’s health costs, there is a lesser reliance on disease conditions and a greater reliance on demographic categories. Under the concurrent approach, disease conditions collected in one year are compared to the medical costs within the same year. Since the disease and cost information for the same time period are used in this method, there is a greater reliance on disease conditions and a lesser reliance on demographic categories. The CDPS+Rx logic available on the UCSD web-site contains the relative costs weights associated with each category from the national data set used to develop the CDPS+Rx model. Since cost weights are used to estimate relative expenditures within a specific Medicaid program, the cost weights should reflect the expenditures associated with the program’s benefit package. As such, several versions of published cost weights are available based on different benefit packages and are provided separately for prospective and concurrent approaches. Cost weights for the HealthChoices program were developed by Mercer using Pennsylvania-specific data and are discussed in the next section. The design of the CDPS+Rx model and the resulting relative cost weights assumes that the effects of diseases in different major categories are additive. To arrive at the estimated relative expenditure for an individual, the sum of the relative costs weights for each individual’s CDPS+Rx categories (disease, including any child interaction factors and demographic) is calculated. This relative expenditure value is known as a CDPS+Rx risk score, or an acuity factor. With the release of Version 5.3 (and subsequent versions) of the CDPS+Rx model, the national cost weights that are published on the UCSD website were developed using 2003 through 2007 data from 30+ Medicaid programs. 4 A standardized statistical multiple regression analysis was used.

HealthChoices RISK-ADJUSTED RATES MANUAL V2.4 COMMONWEALTH OF PENNSYLVANIA
MERCER
9
3 Pennsylvania-Specific Cost Weights As discussed in the prior section, the relative costs, referred to as cost weights, posted on the UCSD web-site were based on national experience from over 30+ Medicaid programs. Since more recent and complete data was available through the HealthChoices encounter submissions, a decision was made to develop cost weights directly from this Pennsylvania data. As a result, the relative costs associated with each CDPS+Rx category were derived from calendar (CY) 2005 and 2006 HealthChoices experience, which reflects regional and managed care medical practices. This section describes the various steps used to calculate the Pennsylvania-specific cost weights. The cost weight development process includes three main steps: determine relative individual managed care per member per month (PMPM) costs, classify individuals into CDPS+Rx categories and determine how each CDPS+Rx category influences costs. This process produces additive relative cost weight factors for each CDPS+Rx category. A separate set of cost weights was developed for each of the CDPS+Rx models: TANF adult, TANF child, and Disabled (referred to as the SSI model within the HealthChoices program). For the development of the Pennsylvania-specific weights, the TANF and Healthy Beginnings populations were used to develop the TANF weights and the SSI without Medicare and Federal General Assistance (GA) populations were used to develop the SSI weights. To be consistent with the HealthChoices risk-assessment process, individuals with both Medicare and Medicaid coverage (dual eligibles) were excluded from the cost weight development. Determine Relative Individual Managed Care Costs To perform this step, CY 2005 and CY 2006 approved managed care encounter data were prepared for the cost analysis and adjustments were made to be consistent with the managed care program. The pharmacy costs within the encounter data were reduced to account for the pharmacy rebates that were collected by the PH-MCOs during CY 2005 and CY 2006. Costs and/or services reimbursed through special risk-sharing and risk-pool arrangements, which are described in greater detail within Section 4, were removed from the CY 2005 and CY 2006 base data. Prior to finalizing the individual costs, select services were shadow priced, where a standard unit cost amount was used to replace outlier unit costs or to address variations in inpatient contracting and to price subcapitated services. For both subcapitated and inpatient services, a schedule was developed using the average PH-MCO paid amount once outliers had been removed. For outlier unit cost pricing, the reported cost was raised to the lowest acceptable value (25th percentile) or reduced to the highest acceptable value (75th percentile). Prior to using the shadow-priced data within the cost weight development, the results of the shadow-pricing methodology were shared with the PH-MCOs giving them an opportunity to comment on the methodology and the overall results.

HealthChoices RISK-ADJUSTED RATES MANUAL V2.4 COMMONWEALTH OF PENNSYLVANIA
MERCER
10
Using these data, a PMPM cost was determined for each member for CY 2005 and CY 2006, respectively. Finally, individual relative costs to be used in the development of the cost weights for each member were determined as the ratio of that member’s average PMPM to the CDPS+Rx model population’s average PMPM by each calendar year. Classify Individuals into CDPS+Rx Categories Diagnostic data and pharmacy data were collected from CY 2005 and CY 2006 claims and encounter data, including all appropriate managed care carve-out services. Since the goal of this step was to determine CDPS+Rx disease classifications only (not health care costs), all available data were used for disease classification. This included fee-for-service (FFS) claims and encounters from both the PH-MCOs, as well as the behavioral health MCOs (BH-MCOs). Laboratory and radiology services with questionable diagnostic validity were excluded from the risk assessment. To determine disease flagging, individuals are first assigned an appropriate CDPS+Rx model (TANF adult, TANF child or SSI) based on their eligibility at the end of each year. Only those individuals with at least six months of Medicaid eligibility (not necessarily continuous) during the base year were classified into CDPS+Rx categories. Determine How Each Category Influences Costs The concurrent CDPS+Rx model is used for the HealthChoices program. With a concurrent model, demographic and disease categories flagged in one year are compared to the same year’s managed care health costs. In order to have ample observations, Mercer used a two-year approach. CY 2005 CDPS+Rx demographic and disease categories were paired with CY 2005 managed care costs. Likewise, CY 2006 CDPS+Rx categories were paired with CY 2006 managed care costs. This process could result in an individual contributing two observations for the cost weight development, if they met the six-month Medicaid eligibility requirement for each calendar year. Using both years of data, the cost weights were developed using a statistical analysis on each of the three population groups (TANF adult, TANF child and SSI). As part of the statistical analysis, a stable demographic group was chosen as the baseline for each population group for which costs are compared against. For both the TANF adult and SSI populations, males age 25–44 were chosen, and males age 15–245 were used as the baseline for the TANF child population. These baseline selections are consistent with those used by UCSD within the CDPS+Rx model development. Pregnancy cost weights were removed from the model to exclude maternity-related costs, since maternity delivery payments are made outside of the risk-adjustment process using a supplemental payment. When the number of observations was low and/or when the cost weights did not fit the expected hierarchy disease progression, some conditions were combined. In most cases, the same categories were consolidated within the national cost weights developed by UCSD. In some instances, the national cost weights were used as a proxy to smooth the Pennsylvania results where appropriate. One such situation was the Hematological category for the TANF adult model, where the Hematological, medium category had a higher cost weight than the Hematological, extra high category. Rather than rely on the weight that was produced from the 47 observations for the Hematological, extra high category, the results from the Pennsylvania data were adjusted to reflect the national relationships. This resulted in a Hematological, extra
5 Since population is limited to individuals under age 18, the actual baseline for the TANF child population only consists of males age 15 to 18, but the referenced CDPS+Rx category is labeled 15 to 24.

HealthChoices RISK-ADJUSTED RATES MANUAL V2.4 COMMONWEALTH OF PENNSYLVANIA
MERCER
11
high cost weight that is 2.45 times higher than the Hematological, medium category for the TANF adult model. Although the TANF adult and TANF child cost weights are developed separately, these weights are used in combination to adjust the TANF and Healthy Beginnings capitation rates. In order to use both sets of cost weights and maintain the relativities between disease categories and overall health care costs, the cost weights must be placed on the same basis prior to application. An adjustment was made to ensure that resulting risk scores are indicative of the cost differential between TANF adults and TANF children. The SSI weights created some unique challenges. The child interaction factors produced from the Pennsylvania statistical analysis were inconsistent with the national experience, which is likely due to the small number of observations within the Pennsylvania data. Since the national experience was based on 30+ Medicaid programs, the national child interaction factors6 were deemed more credible and were utilized in place of the child interaction factors produced from the Pennsylvania data. Additionally, the Pennsylvania-specific cost weights resulted in negative demographic factors that could produce a negative risk score for individuals that are not flagged with any CDPS+Rx categories. Rather than introduce the possibility of negative risk scores for an individual, the Pennsylvania-specific demographic factors from the statistical analysis were replaced with the national demographic factors6 that produce only positive value risk scores. Appendix C contains the Pennsylvania-specific cost weights that were developed using the process described in this section. These cost weights were in effect at the time this manual was written.
6 Based on the 2001–2002 national experience available at the time the Pennsylvania-specific cost weights were developed.

HealthChoices RISK-ADJUSTED RATES MANUAL V2.4 COMMONWEALTH OF PENNSYLVANIA
MERCER
12
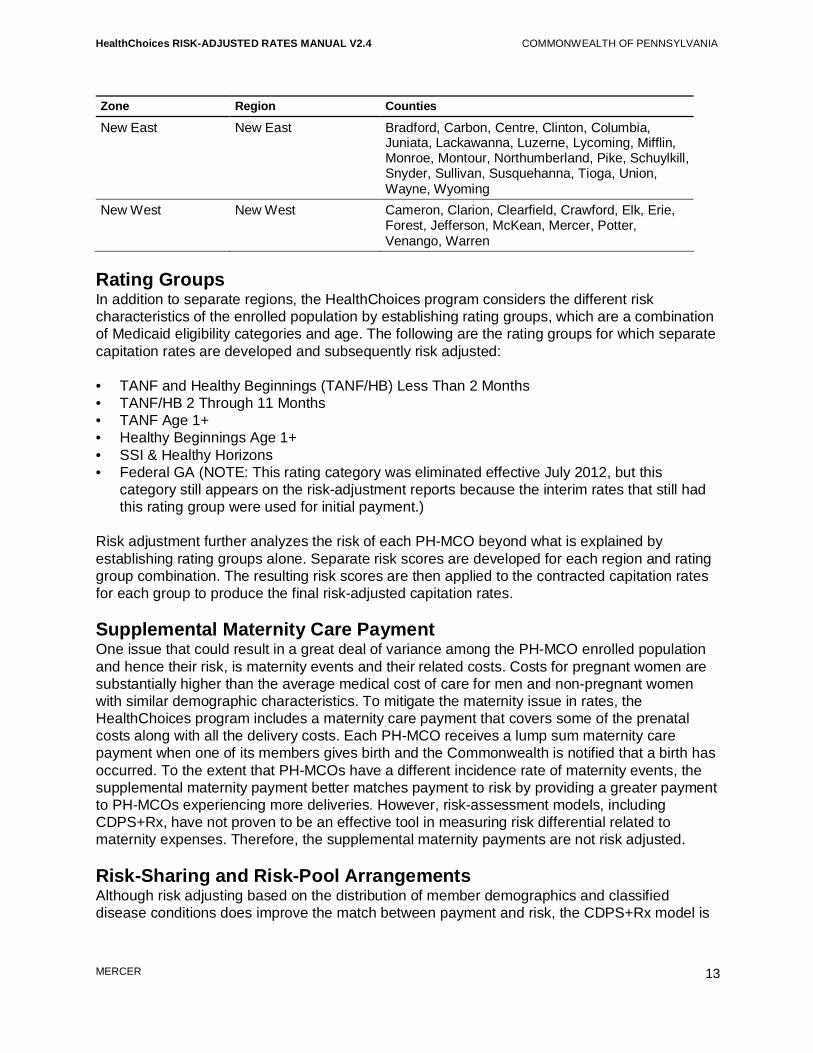
4 Capitation Rates and Other Reimbursement Arrangements With each contract, a schedule of capitation rates that meets the requirements established by CMS is agreed upon between the Commonwealth and each PH-MCO. These rates vary by geographic region and rating group, and include a supplemental maternity payment that is paid for each delivery incurred by the PH-MCO. This section describes each of these components and how the risk-adjustment process is applied to the rates. Capitation rates are not the only form of reimbursement for the HealthChoices program. This section also describes additional funding streams, which include risk-sharing, risk-pool and pay-for-performance arrangements. Geographic Regions Separate contracts are established for a geographic area that is referred to as a zone. As a result, a separate schedule of rates is developed for each zone. In some situations, the rates are further geographically divided into regions to recognize the variation in medical expenses associated with recipients living in different areas within a zone. Currently, the Commonwealth is planning to expand the HealthChoices program to all counties in Pennsylvania. Prior to this expansion, 25 of the 67 counties in Pennsylvania were a part of the HealthChoices program. The transition of the remaining 42 counties to the HealthChoices program will be phased in over a period of time. Once this expansion is fully implemented, there will be five zones in the HealthChoices program: Southeast (SE), Southwest (SW), Lehigh/Capital (L/C), New East (NE) and New West (NW). The SE, SW and L/C zones are composed of multiple regions, whereas the NE and NW zones only have a single region. Table 4.1 below illustrates the composition of each zone and region. This composition is subject to change, and stakeholders will be notified of any changes prior to implementation. Table 4.1 – HealthChoices Zones, Regions and Counties Zone Region Counties
Southeast Philadelphia County Philadelphia 4 Surrounding Counties Bucks, Chester, Delaware, Montgomery Southwest Allegheny County Allegheny 9 Surrounding Counties Armstrong, Beaver, Butler, Fayette, Greene,
Indiana, Lawrence, Washington, Westmoreland Southwest Expansion Bedford, Blair, Cambria, Somerset Lehigh/Capital Lehigh/Capital Adams, Berks, Cumberland, Dauphin, Lancaster,
Lebanon, Lehigh, Northampton, Perry, York Lehigh/Capital
Expansion Franklin, Fulton, Huntingdon
HealthChoices RISK-ADJUSTED RATES MANUAL V2.4 COMMONWEALTH OF PENNSYLVANIA
MERCER
13
Zone Region Counties
New East New East Bradford, Carbon, Centre, Clinton, Columbia, Juniata, Lackawanna, Luzerne, Lycoming, Mifflin, Monroe, Montour, Northumberland, Pike, Schuylkill, Snyder, Sullivan, Susquehanna, Tioga, Union, Wayne, Wyoming
New West New West Cameron, Clarion, Clearfield, Crawford, Elk, Erie, Forest, Jefferson, McKean, Mercer, Potter, Venango, Warren
Rating Groups In addition to separate regions, the HealthChoices program considers the different risk characteristics of the enrolled population by establishing rating groups, which are a combination of Medicaid eligibility categories and age. The following are the rating groups for which separate capitation rates are developed and subsequently risk adjusted: • TANF and Healthy Beginnings (TANF/HB) Less Than 2 Months • TANF/HB 2 Through 11 Months • TANF Age 1+ • Healthy Beginnings Age 1+ • SSI & Healthy Horizons • Federal GA (NOTE: This rating category was eliminated effective July 2012, but this
category still appears on the risk-adjustment reports because the interim rates that still had this rating group were used for initial payment.)
Risk adjustment further analyzes the risk of each PH-MCO beyond what is explained by establishing rating groups alone. Separate risk scores are developed for each region and rating group combination. The resulting risk scores are then applied to the contracted capitation rates for each group to produce the final risk-adjusted capitation rates. Supplemental Maternity Care Payment One issue that could result in a great deal of variance among the PH-MCO enrolled population and hence their risk, is maternity events and their related costs. Costs for pregnant women are substantially higher than the average medical cost of care for men and non-pregnant women with similar demographic characteristics. To mitigate the maternity issue in rates, the HealthChoices program includes a maternity care payment that covers some of the prenatal costs along with all the delivery costs. Each PH-MCO receives a lump sum maternity care payment when one of its members gives birth and the Commonwealth is notified that a birth has occurred. To the extent that PH-MCOs have a different incidence rate of maternity events, the supplemental maternity payment better matches payment to risk by providing a greater payment to PH-MCOs experiencing more deliveries. However, risk-assessment models, including CDPS+Rx, have not proven to be an effective tool in measuring risk differential related to maternity expenses. Therefore, the supplemental maternity payments are not risk adjusted. Risk-Sharing and Risk-Pool Arrangements Although risk adjusting based on the distribution of member demographics and classified disease conditions does improve the match between payment and risk, the CDPS+Rx model is

HealthChoices RISK-ADJUSTED RATES MANUAL V2.4 COMMONWEALTH OF PENNSYLVANIA
MERCER
14
not a perfect indicator of health risk. To address specific situations that have been identified as costly and not effectively accounted for through the CDPS+Rx model, the Commonwealth has utilized risk-sharing and risk-pool arrangements. Under a risk-sharing arrangement, the Commonwealth shares a portion of the PH-MCOs’ expenses that are beyond a certain level (i.e., deductible). To fund this risk-sharing program, a withhold amount is calculated based on historical experience for those populations and corresponding expenses that would have been the Commonwealth’s responsibility. Currently, the HealthChoices program has one risk-sharing program to mitigate large swings in annual home nursing expenses and to direct home nursing-related funding more equitably based on the enrolled home nursing risk. Risk-sharing programs and their underlying components (deductibles and the amount above the threshold that is the Commonwealth’s responsibility) will be evaluated and possibly revised each contract year. Under a risk-pool arrangement, the Commonwealth withholds from the capitation rates a percentage of the expenses that exceed a certain threshold for a specific targeted population or service. The pool of funds generated from the capitation withhold is then redistributed among the participating PH-MCOs based on each PH-MCO’s portion of the reported medical expenses associated with the targeted population or services. Since the risk-pool arrangement redistributes capitation revenue across the PH-MCOs, it does not increase or decrease the overall payments to the HealthChoices program. Currently, the HealthChoices program has one risk-pool program to improve the distribution of available funds among the participating PH-MCOs for high cost recipients. Risk-pool programs and their underlying components (threshold and the portion above the threshold that is used to calculate the withhold amount) will be evaluated and possibly revised each contract year. Payouts to the PH-MCOs for the risk-pool arrangement are done quarterly and are based on a 12-month moving claims payment snapshot. Specifically, the withhold amounts for a given quarter are pooled together and re-distributed to the PH-MCOs based on their claims experience from the prior 12-month time period. Therefore, for the first year only, no risk-pool arrangement withholds will be withheld from capitation payments made to PH-MCOs that enter a new region within the HealthChoices program and the PH-MCOs in expansion counties. Starting in year two, withhold amounts will be applied to capitation payments to the new PH-MCOs and the PH-MCOs operating in the expansion counties. Pay-for-Performance (P4P) The Commonwealth operates a P4P program in which each PH-MCO is eligible to earn additional revenue based on improved and continued high performance in targeted areas identified by the Commonwealth. If the P4P program is fully funded, PH-MCOs can earn up to 5% of approved capitation payments. The design elements associated with the P4P are subject to change with each contract year. The above rating group structure and other reimbursement arrangements were carefully considered in the design and application of the HealthChoices risk-adjustment process.

HealthChoices RISK-ADJUSTED RATES MANUAL V2.4 COMMONWEALTH OF PENNSYLVANIA
MERCER
15
5 Data Collection, Validation and Processing The cornerstone of the risk-adjustment process is the assessment of member demographics along with their diagnostic and pharmacy history through collected data. After the data is collected, it must be validated for completeness and accuracy before it can be analyzed for risk adjustment. In addition, the data must meet certain criteria, which determine whether it is included or excluded from the risk-adjustment process. This section describes the methodology behind the collection and validation of the data used specifically to support the risk-adjustment process. Data Elements The HealthChoices risk-adjustment process requires numerous files that are used to classify members into disease categories, determine each recipient’s demographic category, assess whether sufficient experience exists to measure an individual’s health risk and assign each recipient to a PH-MCO, region, rating group and selection category (auto-assignee and chooser7). The details of each collected file, the required elements, and manipulation of the data required for the risk-adjustment processing is described in the following subsections. Required Enrollment Elements Plan risk scores used to adjust capitation payments are updated on a monthly basis. To accomplish this, enrollment data is received at the beginning of each month to be used within the monthly risk scoring process. This information is provided by the Commonwealth to the PH-MCOs to document the members that have enrolled in the PH-MCO for the month and to assess monthly PH-MCO capitation payments. The following elements are used for the risk-adjustment process: • Recipient Medicaid ID number • PH-MCO code • Date of birth • Gender • Category of assistance • Program status code • Payment begin date • Payment end date • Auto assignment indicator
7 A recipient’s selection category is determined monthly using the enrollment data provided by DPW. For purposes of risk adjustment, auto-assignees are recipients with an auto-assign indicator of A for all rating groups or M for all rating groups except for Healthy Beginnings. All other recipients are choosers. This process was modified slightly for the HealthChoices expansion as described in Appendix A.
HealthChoices RISK-ADJUSTED RATES MANUAL V2.4 COMMONWEALTH OF PENNSYLVANIA
MERCER
16
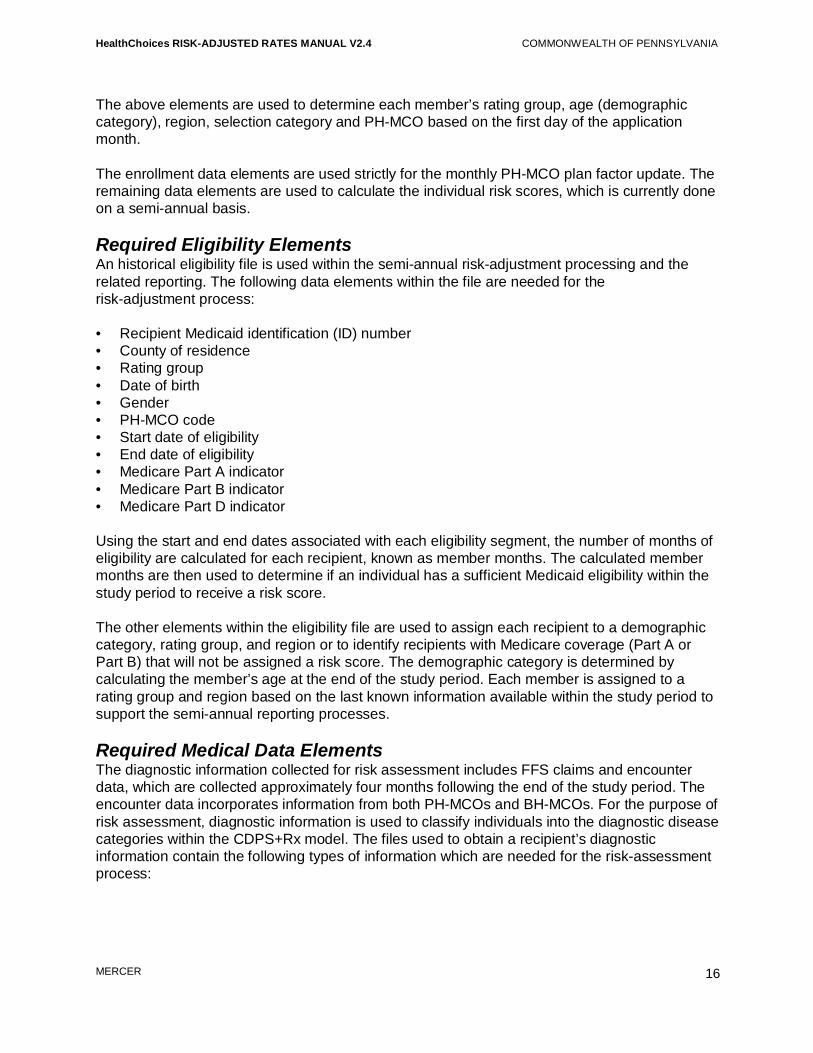
The above elements are used to determine each member’s rating group, age (demographic category), region, selection category and PH-MCO based on the first day of the application month. The enrollment data elements are used strictly for the monthly PH-MCO plan factor update. The remaining data elements are used to calculate the individual risk scores, which is currently done on a semi-annual basis. Required Eligibility Elements An historical eligibility file is used within the semi-annual risk-adjustment processing and the related reporting. The following data elements within the file are needed for the risk-adjustment process: • Recipient Medicaid identification (ID) number • County of residence • Rating group • Date of birth • Gender • PH-MCO code • Start date of eligibility • End date of eligibility • Medicare Part A indicator • Medicare Part B indicator • Medicare Part D indicator Using the start and end dates associated with each eligibility segment, the number of months of eligibility are calculated for each recipient, known as member months. The calculated member months are then used to determine if an individual has a sufficient Medicaid eligibility within the study period to receive a risk score. The other elements within the eligibility file are used to assign each recipient to a demographic category, rating group, and region or to identify recipients with Medicare coverage (Part A or Part B) that will not be assigned a risk score. The demographic category is determined by calculating the member’s age at the end of the study period. Each member is assigned to a rating group and region based on the last known information available within the study period to support the semi-annual reporting processes. Required Medical Data Elements The diagnostic information collected for risk assessment includes FFS claims and encounter data, which are collected approximately four months following the end of the study period. The encounter data incorporates information from both PH-MCOs and BH-MCOs. For the purpose of risk assessment, diagnostic information is used to classify individuals into the diagnostic disease categories within the CDPS+Rx model. The files used to obtain a recipient’s diagnostic information contain the following types of information which are needed for the risk-assessment process:

HealthChoices RISK-ADJUSTED RATES MANUAL V2.4 COMMONWEALTH OF PENNSYLVANIA
MERCER
17
• Recipient Medicaid ID number • PROMISeTM Internal Control Number (ICN) • PROMISe disposition (whether the record passed or failed required edits) • Detail line number (non-inpatient services only) • Begin date of service • Diagnostic (ICD-9) codes • Procedure (CPT-4 or HCPCS) code and modifiers • Revenue code(s) Only those records with a beginning date of service (header or detail record) within the selected 12-month study period are incorporated into the analysis. The identification of the CDPS+Rx diagnostic disease conditions is based on the ICD-9 codes present in the data (claims and encounters), where each record can have multiple ICD-9 diagnosis codes. Prior to November 2008, the data extracts provided to support the risk-adjustment process, contained up to nine ICD-9 diagnosis codes. In November 2008, the number of diagnostic positions collected within the data extracts was increased to 25 for facility records. As a result of this change, the number of diagnoses used in the current risk assessment can include up to nine diagnosis codes for professional services and 25 diagnosis codes for facility records. The CDPS+Rx software only uses the primary and secondary diagnoses to classify individuals into chronic disease categories. To allow for additional diagnoses into the CDPS+Rx analysis, records are created where all fields have the same values as the initial record, except for the diagnostic codes, which now represent the diagnoses in the third and fourth position. This process is continued until all available diagnoses are included in the claims/encounter data. Table 5.1 is a simplified illustration of a record with seven diagnoses (Diag) prior to reformatting: Table 5.1 – Sample Encounter Record Medicaid ID Diag1 Diag2 Diag3 Diag4 Diag5 Diag6 Diag7
00001 4101 2550 78343 7825 V8553 40201 98981 Below is an illustration of the modification necessary to use all the available diagnostic information for the record in Table 5.1: Table 5.2 – Sample Encounter Record (Reformatted)
Medicaid ID Diag1 Diag2
00001 4101 2550 00001 78343 7825 00001 V8553 40201 00001 98981
Note that the actual position of the diagnosis is irrelevant to the CDPS+Rx model. Using the above methodology, as illustrated in Table 5.2, all available diagnostic information will be used regardless of the position a diagnosis originally held.

HealthChoices RISK-ADJUSTED RATES MANUAL V2.4 COMMONWEALTH OF PENNSYLVANIA
MERCER
18
Required Pharmacy Data Elements Pharmacy data are used to classify individuals into the pharmacy disease categories within the CDPS+Rx model. These data are collected simultaneously with the other record types. The identification of pharmacy disease categories is based on the NDCs present in the pharmacy encounters. Starting July 2012, pharmacy claims were incorporated into the disease classification process. The pharmacy data used to obtain a recipient’s pharmacy usage contain the following types of information, which are needed for the risk-assessment process: • Recipient Medicaid ID number • PROMISe ICN • PROMISe disposition • Date of service • NDC Similar to the diagnostic data processing, only a single occurrence of a NDC is required to classify a person into a pharmacy disease category. Also, only records with a date of service within the selected 12-month study period are included in the risk-assessment analysis. Data Validation Prior to processing the data through the risk-adjustment process, each source of data is reviewed and validated. The following subsections describe the various components of the data validation process. Control Total Verification Upon receipt of the data, the record counts for each file are compared to the control totals submitted by the Commonwealth. Control totals are necessary to determine that a complete transfer of the data has been achieved. Frequency Validations A frequency analysis is performed on each file for the fields used in the risk-adjustment processing to provide a listing of unique values associated with each variable and the presence of each value. This can be used to indicate if critical information is missing or yields invalid results. For a field with a large number of values (i.e., diagnosis codes), an evaluation is performed on how often the field is populated and the volume of invalid values. This includes an evaluation of diagnosis codes by position prior to the reformatting of the data for CDPS+Rx processing. The results of the analyses are then compared to results from prior risk assessments for reasonableness. Volume Charts Shortly after the study period concludes and before the finalization of the data collection, the volume of the PH-MCO encounter data is reviewed on a per recipient basis. This information is then incorporated into charts which show each PH-MCO’s encounter volume by month for each record type (inpatient, outpatient, professional and pharmacy), which are referred to as the interim encounter volume charts. In addition to producing the charts, observations about the charts are also provided that indicate possible deficiencies in the encounter data. The interim volume charts, record counts and observations are sent to the PH-MCOs to review and address any potential issues. This process of producing interim volume charts before final data

HealthChoices RISK-ADJUSTED RATES MANUAL V2.4 COMMONWEALTH OF PENNSYLVANIA
MERCER
19
submissions was introduced to give each PH-MCO a chance to address any data deficiencies before the data are finalized, thereby improving the data submissions used for the risk-assessment process. Once the encounter data submission deadline has passed, the final data is validated and the volume of PH-MCO encounter data is reviewed again. Final volume charts and record counts are produced and distributed to the PH-MCOs for informational purposes. A sample volume chart is provided in Appendix D.1. Feedback Files After the data submission cut-off date for the risk-assessment process, each PH-MCO is provided with a copy of encounter records received by Mercer to ensure that all data submitted to PROMISe by the cut-off date are contained within the file. Once the PH-MCOs receive the data, they are given ten business days to analyze and confirm that the risk-assessment data has no deficiencies. If a PH-MCO identifies any deficiencies in the data, the PH-MCOs are instructed to contact the Commonwealth about the issue with specific information regarding its findings, including record counts and a file containing the PROMISe ICNs for the records in question. These records are then reviewed and a determination is made regarding the inclusion of these records within the risk-assessment process. Data Processing for Risk Scoring Prior to each risk assessment, a decision is made regarding the types of data that will be used for disease condition identification. As a result, some data have been excluded from risk scoring because the diagnostic information contained is questionable or because more recent information is available regarding the provided service. The following subsections describe the data exclusions that have evolved over time. Laboratory and Radiology Exclusion Laboratory and radiology data may not be appropriate for disease classification. Often times, diagnoses submitted on laboratory and radiology claims are indicative of the condition being tested rather than the member’s diagnosis, thus producing a false positive disease classification. To reduce the number of chronic conditions being falsely identified, diagnostic laboratory and radiology services rendered in a non-inpatient setting are removed from disease classification. A list of procedure codes and revenue codes used for these exclusions is provided within the methodology letter that accompanies each individual risk score update. Newborn Records Under the Mother’s Medicaid ID Newborn claims and encounters are a challenge for the PH-MCOs because the newborns are not assigned a Medicaid ID until approximately 30 days after the birth event. The PH-MCOs have implemented various methods to handle these situations, including the use of the mother’s Medicaid ID as a temporary solution. Encounters are supposed to be held by the PH-MCO until receipt of the newborn’s Medicaid ID, which is not always the case. In order to avoid incorrectly assigning the disease condition to the mother instead of the child, all encounters with live birth diagnosis codes of V30 through V37.9 or V39 and age of the recipient less than 1 as of the date of service are removed from risk scoring processing.

HealthChoices RISK-ADJUSTED RATES MANUAL V2.4 COMMONWEALTH OF PENNSYLVANIA
MERCER
20
Voided and Adjusted Records An original encounter that was submitted to DPW could be retracted or voided by MCOs for multiple reasons. To void an encounter, the MCOs submit the encounter with an adjustment code of “8”, which is tied to the original encounter. During the void removal process, both the original and the voided encounter are removed from the risk-assessment data. In some cases, the original encounter is adjusted because of a subsequent change identified in the encounter. To adjust an encounter, the MCOs submit the encounter with an adjustment code of “7” tied to the original encounter. During the adjustment process, the new adjusted encounter replaces the original encounter. Accepted Only Records Currently, only PH-MCO encounter records that pass the required PROMISe edits (DPW-accepted records) are included in the risk assessment process. This refinement was introduced to encourage PH-MCOs to improve the quality of their encounter submissions, thus allowing the encounter data to be used to support other HealthChoices initiatives. Prior to implementing this policy, encounter volume charts were provided to the PH-MCOs that contained the results when all records were used in comparison to when only those records that passed the required PROMISe edits, referred to as accepted records, were used. PH-MCO Encounter Data Monitoring and Management In addition to reviewing the encounter volume charts and the feedback files, the PH-MCOs should be proactively monitoring encounter submissions and evaluating the quality and completeness of data. The following are some recommendations regarding encounter data management for PH-MCO consideration. Encounter Data Onsites DPW and Mercer conducted on-site reviews of the MCOs in January 2010 and May 2011 to evaluate overall encounter data operations. Encounter data is used by DPW for various projects including risk adjustment and it is critical that MCOs appropriately report the services rendered. A byproduct of these reviews was a summarized list of the potential data improvement opportunities, which is provided in Appendix E. This list may be helpful as PH-MCOs develop or review a strategic plan for improving encounter submissions. PROMISe Response Files After a PH-MCO submits a data file to the PROMISe data system, the HP Enterprise Services (HP) data system will either accept or reject the submitted file. Once the file is accepted or rejected, a HIPAA8 transaction 997 is sent directly to the PH-MCO indicating whether the file was accepted or not. The accepted files pass through to PROMISe. PH-MCOs should monitor these transaction records to correct and resubmit non-accepted files. Once the encounters are successfully loaded, they are processed by PROMISe using modified FFS edits to accommodate encounter data processing. The PH-MCOs receive 277u response files on a weekly basis, which contains the PROMISe ICN for each encounter. This identifies whether an individual encounter was accepted, denied, or suspended by PROMISe. The
8 Health Insurance Portability and Accountability Act

HealthChoices RISK-ADJUSTED RATES MANUAL V2.4 COMMONWEALTH OF PENNSYLVANIA
MERCER
21
PH-MCO is then required to correct any identified issues with the denied and suspended records and resubmit the encounters. This process should be repeated until the encounter is placed into an accepted status. The PH-MCOs should track responses and should consistently load the PROMISe ICNs into the data warehouse. Such tracking will help the PH-MCO identify any issues with encounter submissions and ensure that all appropriate data were submitted to the Commonwealth to support risk assessment and other analyses. This also expedites the resolution of any issues by giving the Commonwealth, the PH-MCO and Mercer a common claim identifier.
HealthChoices RISK-ADJUSTED RATES MANUAL V2.4 COMMONWEALTH OF PENNSYLVANIA
MERCER
22
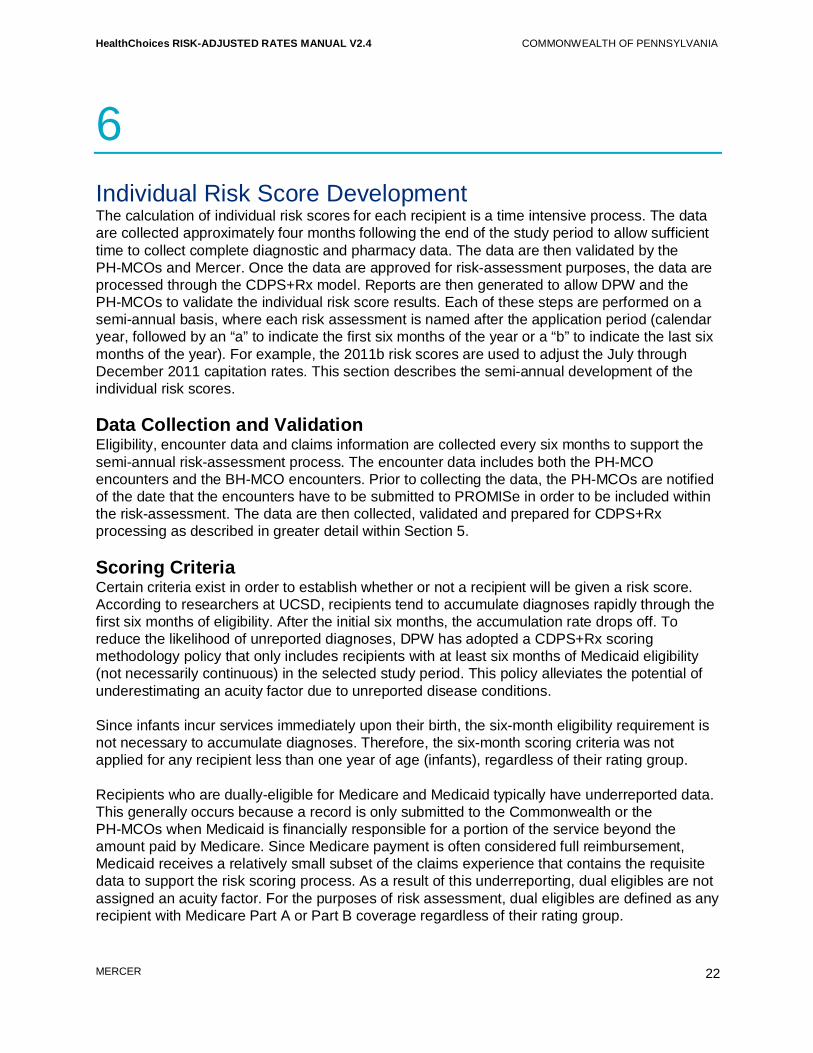
6 Individual Risk Score Development The calculation of individual risk scores for each recipient is a time intensive process. The data are collected approximately four months following the end of the study period to allow sufficient time to collect complete diagnostic and pharmacy data. The data are then validated by the PH-MCOs and Mercer. Once the data are approved for risk-assessment purposes, the data are processed through the CDPS+Rx model. Reports are then generated to allow DPW and the PH-MCOs to validate the individual risk score results. Each of these steps are performed on a semi-annual basis, where each risk assessment is named after the application period (calendar year, followed by an “a” to indicate the first six months of the year or a “b” to indicate the last six months of the year). For example, the 2011b risk scores are used to adjust the July through December 2011 capitation rates. This section describes the semi-annual development of the individual risk scores. Data Collection and Validation Eligibility, encounter data and claims information are collected every six months to support the semi-annual risk-assessment process. The encounter data includes both the PH-MCO encounters and the BH-MCO encounters. Prior to collecting the data, the PH-MCOs are notified of the date that the encounters have to be submitted to PROMISe in order to be included within the risk-assessment. The data are then collected, validated and prepared for CDPS+Rx processing as described in greater detail within Section 5. Scoring Criteria Certain criteria exist in order to establish whether or not a recipient will be given a risk score. According to researchers at UCSD, recipients tend to accumulate diagnoses rapidly through the first six months of eligibility. After the initial six months, the accumulation rate drops off. To reduce the likelihood of unreported diagnoses, DPW has adopted a CDPS+Rx scoring methodology policy that only includes recipients with at least six months of Medicaid eligibility (not necessarily continuous) in the selected study period. This policy alleviates the potential of underestimating an acuity factor due to unreported disease conditions. Since infants incur services immediately upon their birth, the six-month eligibility requirement is not necessary to accumulate diagnoses. Therefore, the six-month scoring criteria was not applied for any recipient less than one year of age (infants), regardless of their rating group. Recipients who are dually-eligible for Medicare and Medicaid typically have underreported data. This generally occurs because a record is only submitted to the Commonwealth or the PH-MCOs when Medicaid is financially responsible for a portion of the service beyond the amount paid by Medicare. Since Medicare payment is often considered full reimbursement, Medicaid receives a relatively small subset of the claims experience that contains the requisite data to support the risk scoring process. As a result of this underreporting, dual eligibles are not assigned an acuity factor. For the purposes of risk assessment, dual eligibles are defined as any recipient with Medicare Part A or Part B coverage regardless of their rating group.
HealthChoices RISK-ADJUSTED RATES MANUAL V2.4 COMMONWEALTH OF PENNSYLVANIA
MERCER
23
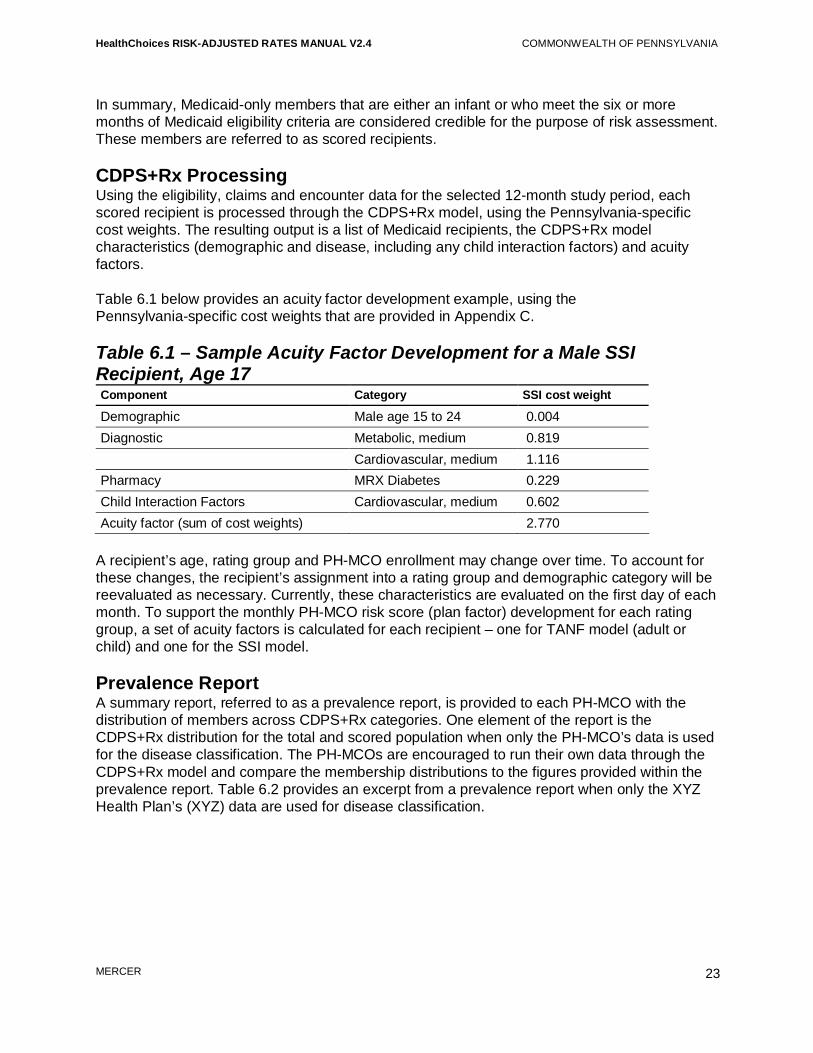
In summary, Medicaid-only members that are either an infant or who meet the six or more months of Medicaid eligibility criteria are considered credible for the purpose of risk assessment. These members are referred to as scored recipients. CDPS+Rx Processing Using the eligibility, claims and encounter data for the selected 12-month study period, each scored recipient is processed through the CDPS+Rx model, using the Pennsylvania-specific cost weights. The resulting output is a list of Medicaid recipients, the CDPS+Rx model characteristics (demographic and disease, including any child interaction factors) and acuity factors. Table 6.1 below provides an acuity factor development example, using the Pennsylvania-specific cost weights that are provided in Appendix C. Table 6.1 – Sample Acuity Factor Development for a Male SSI Recipient, Age 17 Component Category SSI cost weight
Demographic Male age 15 to 24 0.004 Diagnostic Metabolic, medium 0.819 Cardiovascular, medium 1.116 Pharmacy MRX Diabetes 0.229 Child Interaction Factors Cardiovascular, medium 0.602 Acuity factor (sum of cost weights) 2.770
A recipient’s age, rating group and PH-MCO enrollment may change over time. To account for these changes, the recipient’s assignment into a rating group and demographic category will be reevaluated as necessary. Currently, these characteristics are evaluated on the first day of each month. To support the monthly PH-MCO risk score (plan factor) development for each rating group, a set of acuity factors is calculated for each recipient – one for TANF model (adult or child) and one for the SSI model. Prevalence Report A summary report, referred to as a prevalence report, is provided to each PH-MCO with the distribution of members across CDPS+Rx categories. One element of the report is the CDPS+Rx distribution for the total and scored population when only the PH-MCO’s data is used for the disease classification. The PH-MCOs are encouraged to run their own data through the CDPS+Rx model and compare the membership distributions to the figures provided within the prevalence report. Table 6.2 provides an excerpt from a prevalence report when only the XYZ Health Plan’s (XYZ) data are used for disease classification.

HealthChoices RISK-ADJUSTED RATES MANUAL V2.4 COMMONWEALTH OF PENNSYLVANIA
MERCER
24
Table 6.2 – Sample Prevalence Report Excerpt – Only XYZ’s Data
CDPS+Rx category
Count of total recipients (A1)
Percent of total recipients (A2)
Count of scored recipients (B1)
Percent of scored recipients (B2)
Age subtotal 35,000 100.0% 30,000 100.0% Psychiatric High 71 0.2% 70 0.2% Medium 206 0.6% 203 0.7% Medium low 884 2.5% 854 2.8% Low 1,251 3.6% 1,216 4.1% MRX Depression/ Psychosis/Bipolar
2,668 7.6% 2,539 8.5%
To help the PH-MCOs understand how its population compares to the overall population for the zone, the prevalence report also contains CDPS+Rx membership distributions when all data are used in the risk-scoring process. This additional data could include FFS claims, BH-MCO encounters, and PH-MCO encounters submitted from a different PH-MCO. The CDPS+Rx membership distributions are provided separately for the PH-MCO and for the total zone. Table 6.3 provides an excerpt from a prevalence report when data from all sources are used for disease classification. Table 6.3 – Sample Prevalence Report Excerpt – All Data Sources
CDPS+Rx category
Count of XYZ scored recipients (C1)
Percent of XYZ scored recipients (C2)
Count of zone-wide scored recipients (D1)
Percent of zone-wide scored recipients (D2)
Age subtotal 30,000 100.0% 126,696 100.0% Psychiatric High 211 0.7% 786 0.6% Medium 518 1.7% 2,104 1.7% Medium low 2,178 7.3% 9,056 7.1% Low 1,266 4.2% 5,165 4.1% MRX Depression/ Psychosis/Bipolar
1,642 5.5% 6,309 5.0%
Based on the figures in the above example, 23.7% of the zone-wide scored population (30,000/126,696) was enrolled with XYZ for at least one month. The disease condition prevalence reported in Column C2 for XYZ has changed substantially from the values reported in Column B2 of Table 6.2. An increase is occurring for the Psychiatric categories that rely on diagnoses for disease classification because the diagnoses from the BH-MCO encounters, in addition to FFS claims and encounters from the other PH-MCOs, are being used to identify additional Psychiatric conditions in the above table. The MRX Depression/Psychosis/Bipolar category that uses pharmacy data to supplement the diagnostic classification process is decreasing with the use of all data sources because more recipients are being identified with a Psychiatric condition based on the diagnoses. This relationship is expected since a recipient can

HealthChoices RISK-ADJUSTED RATES MANUAL V2.4 COMMONWEALTH OF PENNSYLVANIA
MERCER
25
only be classified into a single Psychiatric category. The data in Table 6.3 also indicates that XYZ has a higher prevalence of overall Psychiatric conditions than the zone-wide population (19.4% compared to 18.5%). For prevalence reporting purposes, age and model assignment are determined at the end of the study period. For each zone, the PH-MCO receives three prevalence reports containing the results by CDPS+Rx model: TANF Adult, TANF Child and SSI. A sample prevalence report is provided in Appendix D.2. Estimated Financial Impact Report The estimated financial impact report is distributed on a semi-annual basis for PH-MCOs to better understand the implications of the updated acuity factors. The updated risk-assessment process could result in plan factor changes due to the addition of acuity factors for newly scored recipients, changes in measured risk for previously scored recipients and the incorporation of process revisions. To better understand the financial implications of the risk score update, plan factors are calculated using the prior period’s acuity factors and the upcoming period’s acuity factors for the same enrollment month. A summary of the results are distributed to the PH-MCOs for informational purposes. Actual changes in plan factors will vary each month as enrollment patterns change. A sample estimated financial impact report is provided in Appendix D.3.

HealthChoices RISK-ADJUSTED RATES MANUAL V2.4 COMMONWEALTH OF PENNSYLVANIA
MERCER
26
7 PH-MCO Risk Score Development Unlike the individual acuity factor development, the calculation of PH-MCO plan factors is not a time-intensive process, which allows for more frequent updates. Currently, the plan factors that are used to adjust the HealthChoices capitation rates are updated monthly, which accounts for any shifts in enrollment between PH-MCOs that occur on a monthly basis. The goal of the plan factor development is to calculate final plan factors to apply to the base capitation rates by PH-MCO, region and rating group. The resulting capitation rates are then used to compensate each PH-MCO based on the overall health risk of their population. The following is the process used to calculate PH-MCO plan factors: • Assign recipients to a PH-MCO, region, rating group and selection category • Assign appropriate acuity factor to each recipient who has an acuity factor • Make assumptions about the acuity of the unscored recipients • Calculate each PH-MCO’s unadjusted plan factor by combining scored and unscored
recipient risk scores for each PH-MCO by region and rating group • Adjust each PH-MCO’s resulting unadjusted plan factor for budget neutrality by region and
rating group This section describes the plan factor development and the corresponding reports that are shared with the PH-MCOs, which includes any new PH-MCOs who enter the HealthChoices program and the PH-MCOs operating in the expansion counties. Recipient Assignment and Acuity Factor Selection Using the provided enrollment data, each recipient is assigned to a rating group, region, selection category and PH-MCO based on the first day of the enrollment month. After assigning the recipients to the appropriate PH-MCO, each recipient who has an acuity factor from the individual acuity factor development is assigned an acuity factor based on their rating group. If the recipient’s rating group is TANF or Healthy Beginnings on the first day of the enrollment month, the TANF acuity factor is applied. Otherwise, the SSI acuity factor is applied. Since a recipient’s age may change in any given month, the demographic component of the acuity factor is updated to reflect the recipient’s age on the first day of the month. Once completed, the demographic component of the acuity factor is added to the other model components for each recipient, which includes diagnostic disease categories, pharmacy disease categories and child interaction factors. Unscored Assumed Risk Score During the PH-MCO risk score development process, not all recipients have an individual acuity factor. These recipients can include recipients new to Medicaid, dual eligibles and recipients with less than six months of eligibility within the historical study period (except for infants). To measure the health risk of each PH-MCO, an assumption about these unscored recipients is

HealthChoices RISK-ADJUSTED RATES MANUAL V2.4 COMMONWEALTH OF PENNSYLVANIA
MERCER
27
required. This subsection describes the various unscored assumptions and the applicability of each approach. Selection Category To assign risk scores to the unscored recipients, each PH-MCO’s population is split into recipients who actively choose a PH-MCO (choosers) and those recipients that were auto-assigned to a PH-MCO (auto-assignees) because the underlying health risk of these two populations are significantly different. Within each of the chooser and auto-assignee subpopulations for a PH-MCO, there are scored and unscored recipients. If the PH-MCO’s scored population is sufficiently credible, an assumption is made that the PH-MCO’s unscored members have the same health risk as the PH-MCO’s scored members within each selection category (choosers and auto-assignees). Specifically, a PH-MCO’s unscored recipients are assigned the average risk score of the PH-MCO’s scored recipients, separately by auto-assignees and choosers. Splitting the population out by auto-assignees and choosers takes into account and adjusts for potential differences in the mix of auto-assignees and choosers between the scored and unscored populations for a PH-MCO. Also, since a PH-MCO’s unscored recipients receive the average risk score for that PH-MCO’s appropriate scored recipients, this assumption implies that PH-MCOs attract recipients with similar types of health risk in its population over time. This assumption is made for each PH-MCO at the region, rating group and selection category level. Table 7.1 provides an example of the unscored assumption when each PH-MCO’s scored population is fully credible. Table 7.1 – Sample Unscored Plan Factor Assumption – Full Credibility Auto-assignee Chooser
Scored Unscored Scored Unscored
Recipients XYZ Health Plan 10,000 1,200 25,000 3,800 ABC Health Care 34,000 8,734 99,142 7,000 Average risk scores XYZ Health Plan 1.2750 1.2750 1.3236 1.3236 ABC Health Care 1.0305 1.0305 1.2193 1.2193
In Table 7.1 above, each PH-MCO’s population is split into the four possible categories (scored auto-assignees, unscored auto-assignees, scored choosers and unscored choosers). In each case for all PH-MCOs, the PH-MCO’s scored population is credible enough to use for the unscored acuity factor assumption. All unscored recipients in this example receive the average risk score developed from the PH-MCO’s scored population, separately by auto-assignees and choosers. The assumed plan factors for the unscored recipients are listed in bold. Low Credibility Situations In some cases, the scored population is not sufficiently credible to use as a predictor of the health risk for the unscored population. These situations occur when the scored population has limited months of eligibility within the study period or when the scored population represents a

HealthChoices RISK-ADJUSTED RATES MANUAL V2.4 COMMONWEALTH OF PENNSYLVANIA
MERCER
28
small proportion of the total population. To account for these low credibility situations, a determination is made regarding the credibility of the PH-MCO’s scored population. When a PH-MCO’s scored population is deemed to be 100% credible, the unscored recipients are assigned the average risk score calculated from the PH-MCO’s scored recipients as described previously. When a PH-MCO’s scored population is deemed to be 0% credible, the unscored recipients are assigned the average risk score from the region-wide (All PH-MCOs’) scored recipients. When a PH-MCO’s scored population is deemed to be between 0% and 100% credible, the unscored recipients are assigned a blend of the PH-MCO’s average risk score and the region-wide average risk score. The credibility determination and unscored risk score assumption is evaluated for each PH-MCO, region, rating group and selection category combination. To determine the amount of credibility to assign the PH-MCO’s scored population in a given month, the following metrics are used: • Number of months a PH-MCO’s scored population was eligible for during the study period
(referred to as scored member months) • A member month weighted scored percentage calculated by dividing the scored member
months by the PH-MCO’s total population (scored and unscored recipients) multiplied by 12. This value is referred to as the member month scored percentage
Using these metrics, the credibility percentages can be found in the PH-MCO risk score credibility grid (found in Appendix F). The following table outlines the specific criteria used to determine the credibility of a scored population: Table 7.2 – Credibility Criteria Scored population risk score credibility Scored population criteria
0% Credible 611 scored member months OR 25% member month scored percentage 100% Credible 1,200 scored member months AND 50% member month scored percentage Found in credibility table All other scenarios
It should be noted that the PH-MCO risk score credibility grid indicates the credibility percentage or proportion of the PH-MCO’s average risk score that is used to determine the assumed risk score for the unscored population. The remaining credibility is given to the region-wide scored recipients’ aggregate plan factor. Both credibility percentages sum to 100%. Table 7.3 (on the following page) illustrates the unscored assumption calculation when the scored population is not 100% credible to be used as the basis for the unscored assumption.
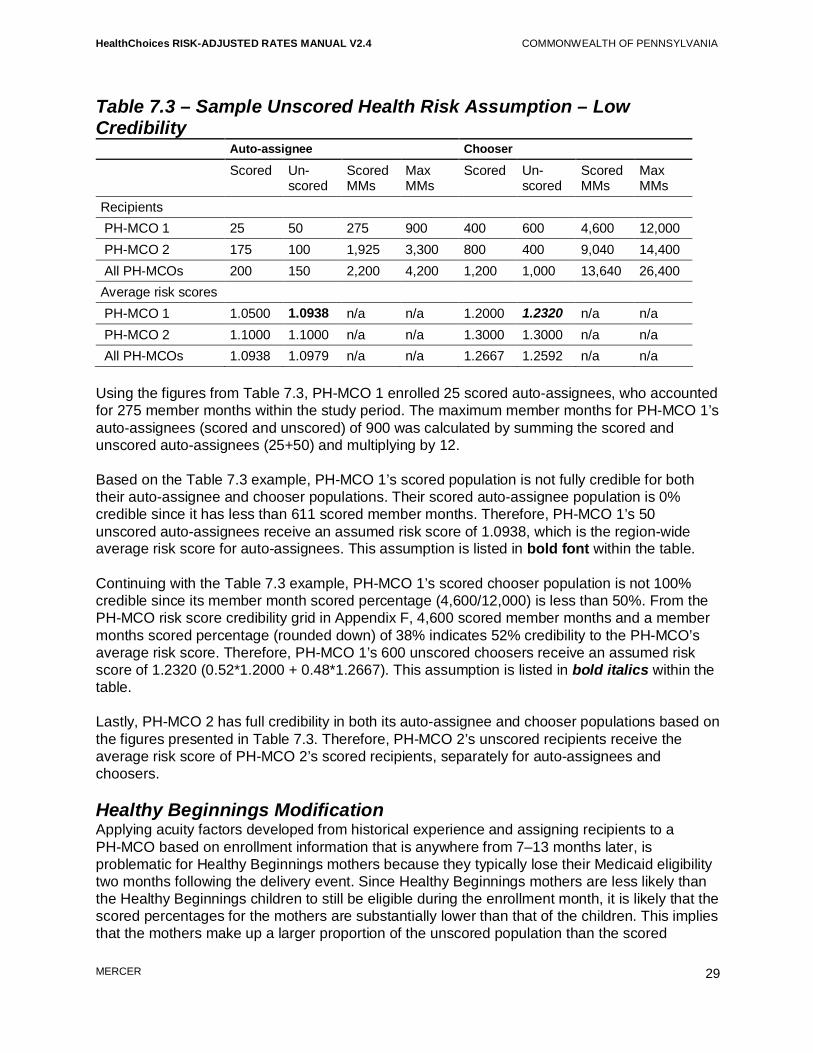
HealthChoices RISK-ADJUSTED RATES MANUAL V2.4 COMMONWEALTH OF PENNSYLVANIA
MERCER
29
Table 7.3 – Sample Unscored Health Risk Assumption – Low Credibility Auto-assignee Chooser
Scored Un-scored
Scored MMs
Max MMs
Scored Un-scored
Scored MMs
Max MMs
Recipients PH-MCO 1 25 50 275 900 400 600 4,600 12,000 PH-MCO 2 175 100 1,925 3,300 800 400 9,040 14,400 All PH-MCOs 200 150 2,200 4,200 1,200 1,000 13,640 26,400 Average risk scores PH-MCO 1 1.0500 1.0938 n/a n/a 1.2000 1.2320 n/a n/a PH-MCO 2 1.1000 1.1000 n/a n/a 1.3000 1.3000 n/a n/a All PH-MCOs 1.0938 1.0979 n/a n/a 1.2667 1.2592 n/a n/a
Using the figures from Table 7.3, PH-MCO 1 enrolled 25 scored auto-assignees, who accounted for 275 member months within the study period. The maximum member months for PH-MCO 1’s auto-assignees (scored and unscored) of 900 was calculated by summing the scored and unscored auto-assignees (25+50) and multiplying by 12. Based on the Table 7.3 example, PH-MCO 1’s scored population is not fully credible for both their auto-assignee and chooser populations. Their scored auto-assignee population is 0% credible since it has less than 611 scored member months. Therefore, PH-MCO 1’s 50 unscored auto-assignees receive an assumed risk score of 1.0938, which is the region-wide average risk score for auto-assignees. This assumption is listed in bold font within the table. Continuing with the Table 7.3 example, PH-MCO 1’s scored chooser population is not 100% credible since its member month scored percentage (4,600/12,000) is less than 50%. From the PH-MCO risk score credibility grid in Appendix F, 4,600 scored member months and a member months scored percentage (rounded down) of 38% indicates 52% credibility to the PH-MCO’s average risk score. Therefore, PH-MCO 1’s 600 unscored choosers receive an assumed risk score of 1.2320 (0.52*1.2000 + 0.48*1.2667). This assumption is listed in bold italics within the table. Lastly, PH-MCO 2 has full credibility in both its auto-assignee and chooser populations based on the figures presented in Table 7.3. Therefore, PH-MCO 2’s unscored recipients receive the average risk score of PH-MCO 2’s scored recipients, separately for auto-assignees and choosers. Healthy Beginnings Modification Applying acuity factors developed from historical experience and assigning recipients to a PH-MCO based on enrollment information that is anywhere from 7–13 months later, is problematic for Healthy Beginnings mothers because they typically lose their Medicaid eligibility two months following the delivery event. Since Healthy Beginnings mothers are less likely than the Healthy Beginnings children to still be eligible during the enrollment month, it is likely that the scored percentages for the mothers are substantially lower than that of the children. This implies that the mothers make up a larger proportion of the unscored population than the scored

HealthChoices RISK-ADJUSTED RATES MANUAL V2.4 COMMONWEALTH OF PENNSYLVANIA
MERCER
30
population. Therefore, if no modification were made to the unscored risk score assumption for this rating group, it is possible that the risk score assigned to the unscored recipients would be weighted too heavily on the children’s health risk. Recognizing that mothers and children likely have significantly different health risk or attraction patterns, the Healthy Beginnings Age 1+ rating group is split into mothers and children. The unscored recipients are then assigned risk scores separately for these two groups. Risk scores are assigned to the unscored Healthy Beginnings children using the exact same approach as the other rating groups, where different assumptions are used for auto-assignees and choosers. Low credibility blending is used when applicable. To assign risk scores to the unscored Healthy Beginnings mothers, the selection category distinction is not used. This is done because Healthy Beginnings mothers are a small population and separating them out by selection category could potentially create subpopulations that may not be credible on a region-wide basis. However, when the Healthy Beginnings mothers’ scored population for a PH-MCO is not fully credible, the low credibility blending approach is used to assign risk scores to the unscored Healthy Beginnings mothers. Final Unadjusted Plan Factor Development Once risk scores have been assigned to the unscored recipients, final unadjusted plan factors are calculated by PH-MCO, region and rating group. To calculate the final unadjusted plan factors for all non-newborn rating groups except Healthy Beginnings Age 1+, a weighted average of the risk scores for each subpopulation (scored auto-assignees, unscored auto-assignees, scored choosers and unscored choosers) is calculated by weighting each subpopulation by the total number of recipients in each group. Table 7.4 is a continuation of Table 7.1 and provides an example of the final unadjusted plan factor calculation for a rating group other than Healthy Beginnings Age 1+. Table 7.4 – Sample Unadjusted Plan Factor Calculations Auto-assignee Chooser Composite
Scored Unscored Scored Unscored All Recipients XYZ Health Plan 10,000 1,200 25,000 3,800 40,000 ABC Health Care 34,000 8,734 99,142 7,000 148,876 All PH-MCOs 44,000 9,934 124,142 10,800 188,876 Risk scores XYZ Health Plan 1.2750 1.2750 1.3236 1.3236 1.3100 ABC Health Care 1.0305 1.0305 1.2193 1.2193 1.1651 All PH-MCOs 1.0861 1.0600 1.2403 1.2560 1.1958
In Table 7.4 above, each PH-MCO’s final unadjusted plan factor is calculated by averaging the risk scores for the scored auto-assignees, unscored auto-assignees, scored choosers and unscored choosers weighted by the number of recipients in each group. All final unadjusted plan factors are listed in bold.

HealthChoices RISK-ADJUSTED RATES MANUAL V2.4 COMMONWEALTH OF PENNSYLVANIA
MERCER
31
To calculate the final unadjusted plan factors for the Healthy Beginnings Age 1+ rating group, the risk scores for Healthy Beginnings children and mothers are calculated separately, and then combined into a single plan factor. This is accomplished by weighting each of the subpopulations together: children (scored auto-assignees, unscored auto-assignees, scored choosers and unscored choosers) and mothers (scored and unscored recipients). Budget Neutrality Adjustment The CDPS+Rx model does not necessarily produce a population average CDPS+Rx factor of 1.0000. Deviations from a 1.0000 population occur because the weights were calibrated using the entire HealthChoices experience based on a combination of rating groups and the population experience changes with each risk-adjustment update. To simplify the interpretation and application of the plan factor results, the final unadjusted plan factors are adjusted by the population average. The intent of this adjustment is to recalibrate all plan factors to produce a population average of 1.0000. This adjustment yields the following results: • Adjusted plan factors of 1.0000 have average selection • Adjusted plan factors greater than 1.0000 have adverse selection • Adjusted plan factors less than 1.0000 have positive selection This adjustment is referred to as the budget neutrality adjustment because this step ensures that the risk-adjustment methodology does not result in unintended reductions or increases in total capitation payments across the HealthChoices program. To calculate the population average for all PH-MCOs combined, a weighted average is calculated where each PH-MCO’s final unadjusted plan factors are weighted by their number of total recipients. Table 7.5 provides an example of the budget neutrality adjustment and the resulting final plan factors. Table 7.5 – Sample Final (Budget Neutral) Plan Factors
PH-MCO Total recipients
Final unadjusted plan factor
Final (budget neutral) plan factor
XYZ Health Plan 40,000 1.3100 1.0955 ABC Health Care 148,876 1.1651 0.9743 All PH-MCOs 188,876 1.1958 1.0000
In the example above, the health risk prior to the budget neutrality adjustment is 1.1958 for the overall population (all PH-MCOs), which was calculated by weighting each PH-MCO final unadjusted plan factor by the total recipients in the second column of Table 7.5. To calculate the final (budget neutral) plan factors, each final unadjusted plan factor is divided by the overall (All PH-MCOs) plan factor of 1.1958. Once the budget neutrality adjustment has been applied, the resulting plan factor is then applied to the capitation rates for the appropriate contract year, creating rates that compensate the PH-MCOs based on the health risk of the enrolled population.

HealthChoices RISK-ADJUSTED RATES MANUAL V2.4 COMMONWEALTH OF PENNSYLVANIA
MERCER
32
Plan Factor and Risk-Adjusted Rates Reporting The PH-MCOs receive three reports that summarize the components of its plan factor development and resulting risk-adjusted rates for each region and rating group combination. The first report shows the development of the PH-MCO’s unadjusted plan factors for each region and rating group. This report lists the count of recipients, average risk score for the scored population, count of scored member months, member month scored percentage, credibility percentages, and region-wide average risk score separately by selection category (where applicable), region and rating group. This report also shows the calculation of the assumed risk score for the unscored recipients and combines these with the average risk scores for the scored recipients to arrive at the final unadjusted plan factors. This report is referred as the unadjusted plan factor development report. A sample unadjusted plan factor development report is provided in Appendix D.4. The second report is referred to as the risk-adjustment results summary and includes the count of total recipients, count of scored recipients, unadjusted plan factors and final (budget neutral) plan factors by region and rating group. These values are provided for the PH-MCO and for the overall population (All PH-MCOs). This report is not split out by selection category. A sample risk-adjustment results summary report is provided in Appendix D.5. The third report is the capitation rate summary that lists the contracted capitation rates. These capitation rates and the final (budget neutral) plan factors from the risk-adjustment results summary are multiplied producing the risk-adjusted rates, which are then converted into a daily rate by dividing by the number of days within the month the risk-adjusted rates are effective. This report also contains any applicable risk-sharing, risk-pool, and/or provider pass through pay-for-performance values that are outside of the risk-adjustment process. All values are provided separately for each rating group and region combination. A sample capitation rate summary report is provided in Appendix D.6. In addition to these reports, each PH-MCO receives an electronic file that contains the individual acuity factors for each recipient that contributed to the PH-MCO’s plan factor development. Below is a listing of the fields that are contained within each acuity factor file: • Recipient Medicaid ID number • Rating group • Model • Region • Age • Gender • Acuity factor • Selection category • Member months The PH-MCOs are encouraged to use this file to validate their plan factors.

HealthChoices RISK-ADJUSTED RATES MANUAL V2.4 COMMONWEALTH OF PENNSYLVANIA
MERCER
33
8 Newborn Process While individual risk scores are updated every six months, the PH-MCO plan factors are updated monthly to reflect the most recent enrollment attraction patterns. This process generally results in members being assigned to a PH-MCO anywhere from 7–13 months after the end of the study period. This lag is problematic for the newborn rating groups (TANF/HB Less Than 2 Months and TANF/HB 2 Through 11 Months) because most (if not all) of the population has aged out of the newborn rating groups. Additionally, remaining newborns would have acuity factors based on a limited amount of data. To avoid this situation, the newborn plan factors are calculated semi-annually based on historical attraction patterns. The resulting plan factors are then applied to the capitation rates for the entire six-month application period under the premise that the historical risk attraction patterns for newborns are comparable to the risk attraction patterns for the application period. This section describes the methodology differences between the semi-annual development of the newborn plan factors and the monthly development of all other rating groups plan factors (non-newborns). Acuity Factor Development Within the CDPS+Rx processing, infants are defined as individuals under one year old at the end of the study period, which results in recipients who are born within the study period being classified as infants9. Using the standard risk-assessment processing approach described in the prior sections, infants would have anywhere between 1–12 months of data contributing to the individual risk score development. Since the inclusion of more data can improve risk measurements, newborns are captured from an earlier period (six months prior to the time period used for the non-newborn rating groups) and individual study periods are developed for each newborn to maximize the amount of data used within the acuity factor development. The individual study period starts with the birth month. The ending month is either eleven months after the birth month or the last month of available data, which is defined as the last month of data used to measure the risk scores for non-newborn rating groups. For the 2011b risk adjustment, newborns were identified as those born within June 2009 through May 2010. The individual study periods from the 2011b newborn risk adjustment were developed using a full twelve months of data starting with the birth month or a partial year of data starting with the birth month and ending with November 2010, which is the last month of incurred data collected to support the 2011b risk adjustment. The following table contains the schedule of individual study periods for the 2011b newborn risk adjustment.
9 Recipients who are exactly one year old (first birthday on the last day of the study period) are also classified as infants.

HealthChoices RISK-ADJUSTED RATES MANUAL V2.4 COMMONWEALTH OF PENNSYLVANIA
MERCER
34
Table 8.1 – 2011b Newborn Individual Study Periods Birth month and start of study period End of study period Number of months used
June 2009 May 2010 12 July 2009 June 2010 12 August 2009 July 2010 12 September 2009 August 2010 12 October 2009 September 2010 12 November 2009 October 2010 12 December 2009 November 2010 12 January 2010 November 2010 11 February 2010 November 2010 10 March 2010 November 2010 9 April 2010 November 2010 8 May 2010 November 2010 7
Once the individual study periods are selected for the newborns, the FFS claims and the PH-MCO encounters are used in combination with the TANF Child CDPS+Rx model to calculate an acuity factor for each newborn. Since newborns have virtually no utilization of BH-MCO services, the BH-MCO encounter data is not used in the newborn risk scoring. Plan Factor Development Using the newborn acuity factors developed in the prior step, separate plan factors were developed for the two newborn capitation rates: TANF/HB Less Than 2 Months and TANF/HB 2 Through 11 Months. While the same acuity factors are used for the development of both newborn rating group plan factors, the approach used to assign and weight members to a PH-MCO is different. For the TANF/HB Less Than 2 Months rating group, each newborn and their acuity factor are assigned to the PH-MCO that was responsible for the recipient at birth since the majority of the costs associated with this rating group occur during the birth month. The results are then aggregated, where each newborn is counted once, to calculate the unadjusted plan factors. These factors are then adjusted to maintain budget neutrality by dividing the unadjusted plan factors by the population average. The population average is developed using member months provided by DPW, which typically represent the most recent data available for newborns during the first two months of life. A different approach is used to calculate the plan factors that are used to adjust the TANF/HB 2 Through 11 Months capitation rates. First, the member months associated with ages 2 through 11 months old within the study period are calculated. These member months are then distributed among the PH-MCOs based on the newborn’s enrollment. The results are aggregated (weighted by the calculated member months) to produce the unadjusted plan factors. These factors are then adjusted to maintain budget neutrality by dividing the unadjusted plan factors by the population average. The population average is developed using member months provided by DPW, which typically represent the most recent data available associated

HealthChoices RISK-ADJUSTED RATES MANUAL V2.4 COMMONWEALTH OF PENNSYLVANIA
MERCER
35
with newborns age 2 through 11 months old. The table below provides a sample TANF/HB 2 Through 11 Months plan factor development for XYZ Health Plan. Table 8.2 – Sample TANF/HB 2 Through 11 Months Plan Factor Development
Recipient Study period member months
Age 2–11 months XYZ Health Plan member months Acuity factor
Newborn #1 12 10 4.0650 Newborn #2 12 8 7.4090 Newborn #3 7 5 3.3070 Newborn #4 12 10 5.9780 Newborn #5 9 7 3.3070 Unadjusted plan factor (weighted average of acuity factors)
40 4.9847
The study period member months in the above table show the number of months included within the individual study period for each newborn regardless of age (less than two months or two through 11 months). These figures are generally two months higher than the Age 2–11 Months enrolled in XYZ Health Plan. The only exception is Newborn #2, where the newborn had either been in FFS or another PH-MCO for two months. Newborn Plan Factor Reports Semi-annual reports containing the CDPS+Rx plan factors on both an unadjusted and final basis along with the CDPS+Rx population distributions for the newborn rating groups are produced. The population distributions for the TANF/HB Less Than 2 Months rating group are based on eligible recipients, where the distributions for the TANF/HB 2 Through 11 Months rating group are based on eligible member months. A separate report is provided for each region and newborn rating group. Table 8.3 provides an excerpt from a TANF/HB 2 Through 11 Months prevalence report. Table 8.3 – Sample TANF/HB 2 Through 11 Months Prevalence Report Excerpt XYZ Health Plan All PH-MCOs CDPS+Rx category
TANF child weight
Disease impact rank
Number of eligible months
Percent of eligible months
Number of eligible months
Percent of eligible months
(A) (B) (C1) (C2) (D1) (D2)
Age subtotal 3.307 N/A 30,000 100.00% 136,443 100.00% Pulmonary High 10.747 14 126 0.42% 504 0.37% Medium 5.680 3 987 3.29% 3,972 2.91% Low 0.850 4 2,961 9.87% 14,425 10.57% MRX Tuberculosis 0.850 56 3 0.01% 19 0.01%

HealthChoices RISK-ADJUSTED RATES MANUAL V2.4 COMMONWEALTH OF PENNSYLVANIA
MERCER
36
To better understand the significance of specific conditions in the risk-adjustment process, these reports include the disease impact rank (column B) associated with each disease category. The magnitude of the CDPS+Rx category weight, in conjunction with the portion of the population presenting with the chronic condition, determines the impact that a particular disease category will have on the development of the plan factors. The lower the disease impact rank, the greater the category’s impact on the plan factor (one equals the greatest impact). Conversely, the higher the disease impact rank, the less impact on the plan factor. The disease impact rank is a quick resource for determining the disease categories that have a substantial influence on PH-MCO risk scores. Using the sample above, the Pulmonary, high category has a disease impact rank of 14. Even though this category has a significantly higher cost weight, Pulmonary, high only represents 0.37% of the overall population. Taking into consideration both the cost weight and overall population prevalence, the Pulmonary, medium category has the greatest influence on the risk-adjustment results of the shown categories. The PH-MCOs are encouraged to run their own claims data through the CDPS+Rx model and compare results to the figures provided within the newborn prevalence reports. A sample newborn prevalence report is provided in Appendix D.7. Newborn Acuity Factor File Each PH-MCO receives an electronic file that contains the individual risk scores for each newborn that contributed to the PH-MCO’s plan factor development. Separate files are provided for each newborn rating group. Below is a listing of the fields that are contained within each acuity factor file: • Recipient Medicaid ID number • Region • Date of birth • Begin date of the individual study period • End date of the individual study period • Member months (TANF/HB 2 Through 11 Months file only) • Acuity factor The PH-MCOs are encouraged to use these files to validate the plan factors for each newborn rating group. New PH-MCO and HealthChoices Expansion Considerations When a PH-MCO enters a new region within the HealthChoices program or when the HealthChoices program is expanded to all counties in Pennsylvania, PH-MCOs in this situation will receive newborn plan factors of 1.0000 for both newborn rating groups until enough historical experience is available and deemed appropriate to use for newborn risk scoring. Some of the things to consider when determining whether to include these PH-MCOs in newborn risk scoring are the length of time the PH-MCO has been in the program, whether the PH-MCO has enough newborn recipients within the historical newborn study period to use for a future application period, and the quality of the PH-MCOs’ data for risk scoring purposes.

HealthChoices RISK-ADJUSTED RATES MANUAL V2.4 COMMONWEALTH OF PENNSYLVANIA
MERCER
Appendix A
Appendix A
Historical Perspective Since 2000, DPW has been developing and refining the risk-adjustment process used to adjust HealthChoices capitation payments. During this time, DPW has collected and acted on input from stakeholders. As a result, major policy changes have been implemented and the risk-adjustment process has been refined to reflect improvements in the risk-adjustment marketplace. This appendix of the manual provides the historical context for the decisions that have been made and outlines the collaboration that has occurred with the PH-MCOs throughout the years. Risk-Assessment Model Selection Prior to the implementation of risk-adjustment techniques, DPW evaluated possible risk-assessment models that could measure health risk using demographic indicators in addition to disease history. While many risk-assessment models exist, DPW elected to implement the only risk-assessment model that was specifically designed for Medical Assistance populations. CDPS is a diagnostic classification system that is available to Medicaid programs to make health-based capitated payments for TANF and Disabled Medicaid recipients. In 2007, DPW reevaluated its original decision to use the CDPS model to risk adjust the PH-MCO capitation payments. As part of this reevaluation, DPW collected input from the PH-MCOs and compared the CDPS model to the other risk-assessment models that were being used to risk-adjust capitation payments for government programs. After reviewing the collected information, the CDPS model was selected once again on the basis that the tool is publicly available without cost for all parties, it was developed specifically for low income and disabled populations and the model is the most commonly used in Medicaid. During the 2007 evaluation of risk-assessment models, DPW and the PH-MCOs expressed an interest in using a combined model that incorporates both diagnoses and pharmacy utilization into the disease classification process. To support the development of a combined model, the Commonwealth contributed funding to UCSD that led to the creation of the CDPS+Rx model, which was used to risk adjust HealthChoices capitation payments starting in 2009. In addition to model selection, DPW and Mercer evaluated aspects of the model to determine their appropriate application to the HealthChoices population, benefit package, and rate-setting environment. Adjustments to the CDPS and CDPS+Rx models have been made over time to address HealthChoices specific concerns, such as applying an additional process when a subset of data is not available or supplementing the data to better capture the prevalence of an AIDS/HIV diagnosis. Current refinements and adjustments are outlined throughout the manual and semi-annual methodology letters.
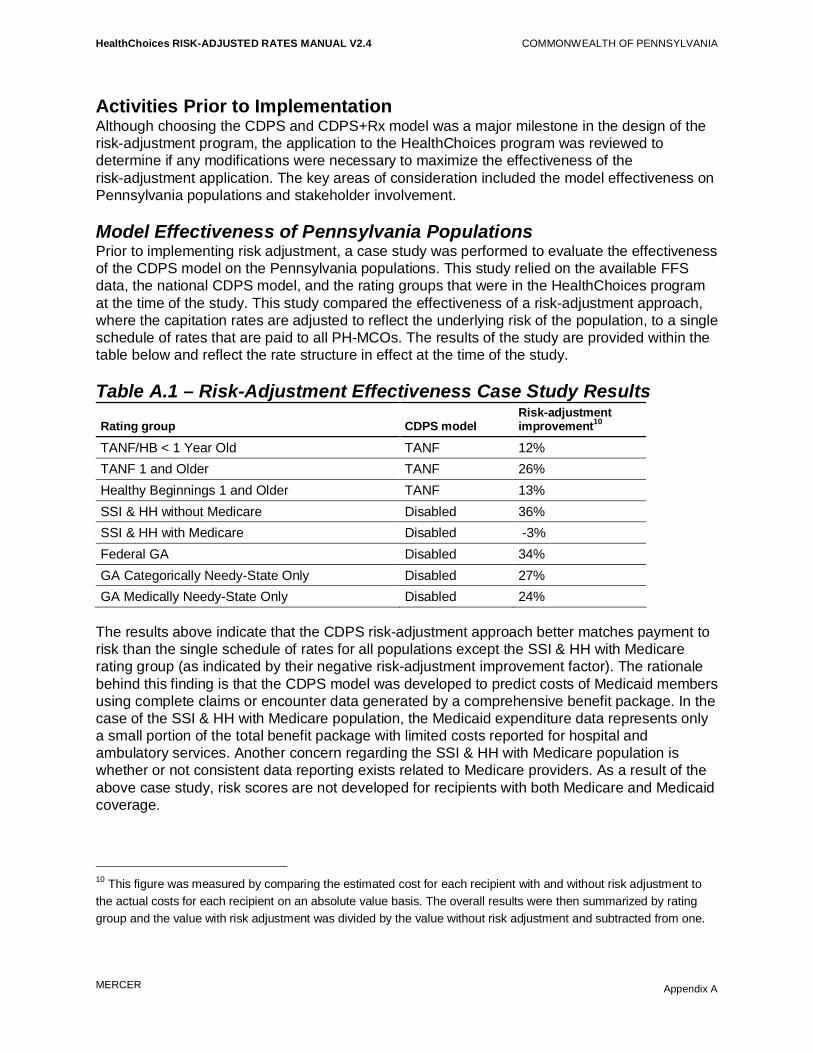
HealthChoices RISK-ADJUSTED RATES MANUAL V2.4 COMMONWEALTH OF PENNSYLVANIA
MERCER
Appendix A
Activities Prior to Implementation Although choosing the CDPS and CDPS+Rx model was a major milestone in the design of the risk-adjustment program, the application to the HealthChoices program was reviewed to determine if any modifications were necessary to maximize the effectiveness of the risk-adjustment application. The key areas of consideration included the model effectiveness on Pennsylvania populations and stakeholder involvement. Model Effectiveness of Pennsylvania Populations Prior to implementing risk adjustment, a case study was performed to evaluate the effectiveness of the CDPS model on the Pennsylvania populations. This study relied on the available FFS data, the national CDPS model, and the rating groups that were in the HealthChoices program at the time of the study. This study compared the effectiveness of a risk-adjustment approach, where the capitation rates are adjusted to reflect the underlying risk of the population, to a single schedule of rates that are paid to all PH-MCOs. The results of the study are provided within the table below and reflect the rate structure in effect at the time of the study. Table A.1 – Risk-Adjustment Effectiveness Case Study Results
Rating group CDPS model Risk-adjustment improvement10
TANF/HB < 1 Year Old TANF 12% TANF 1 and Older TANF 26% Healthy Beginnings 1 and Older TANF 13% SSI & HH without Medicare Disabled 36% SSI & HH with Medicare Disabled -3% Federal GA Disabled 34% GA Categorically Needy-State Only Disabled 27% GA Medically Needy-State Only Disabled 24%
The results above indicate that the CDPS risk-adjustment approach better matches payment to risk than the single schedule of rates for all populations except the SSI & HH with Medicare rating group (as indicated by their negative risk-adjustment improvement factor). The rationale behind this finding is that the CDPS model was developed to predict costs of Medicaid members using complete claims or encounter data generated by a comprehensive benefit package. In the case of the SSI & HH with Medicare population, the Medicaid expenditure data represents only a small portion of the total benefit package with limited costs reported for hospital and ambulatory services. Another concern regarding the SSI & HH with Medicare population is whether or not consistent data reporting exists related to Medicare providers. As a result of the above case study, risk scores are not developed for recipients with both Medicare and Medicaid coverage.
10 This figure was measured by comparing the estimated cost for each recipient with and without risk adjustment to the actual costs for each recipient on an absolute value basis. The overall results were then summarized by rating group and the value with risk adjustment was divided by the value without risk adjustment and subtracted from one.
HealthChoices RISK-ADJUSTED RATES MANUAL V2.4 COMMONWEALTH OF PENNSYLVANIA
MERCER
Appendix A
Implementation Protocol The Commonwealth commenced preparation for risk-adjustment implementation in 2000. To maintain an open process, DPW held several stakeholder sessions with the PH-MCOs, encouraging them to comment and provide their questions on the process. In addition to providing technical assistance to the PH-MCOs, DPW scheduled two separate passes (dry runs) through the risk-adjustment process prior to the January 1, 2003, risk-adjusted rates implementation date for the SE and SW zones. Mercer performed the first dry run to identify any data or application concerns that might have existed. It was performed a year in advance of implementation, which allowed ample time to make corrections to the data or application if necessary. Based on the first dry run results and the input collected from the PH-MCOs, refinements were made to the process regarding the treatment of behavioral health conditions within the CDPS model. The intent of the second dry run was to apply all the final policy decisions, data collection procedures, and CDPS model adjustments to give an early indication of the possible financial impact that the PH-MCOs could experience. The two dry runs, beginning a year in advance of the SE and SW zones implementation date, provided the PH-MCOs with additional time to make any necessary changes to their management, financial operations and encounter data collection. Risk-adjustment was implemented in the L/C zone on July 1, 2007. Since the L/C PH-MCOs were already familiar with the risk-adjustment process due to their experience with risk adjustment in the SE or SW zones, the level of effort to implement risk adjustment in the L/C zone was less involved. Six months prior to implementing risk adjustment into the L/C zone, a dry run of the risk-adjustment results and the corresponding reports were provided to the PH-MCOs. Process Refinements Over Time The risk-adjustment process is continually being reviewed and refined. This is accomplished through various workgroups, annual strategy meetings, and input from the PH-MCOs. Prior to making any substantial change to the process, the PH-MCOs are presented with either the available options or the proposed process and are then given the opportunity to comment prior to the implementation of the change. Where applicable, the resulting decision and/or methodology associated with the process refinement is also presented to the PH-MCOs providing an opportunity to ask questions or provide feedback on the new approach. The following is a summary of the more substantial methodology changes that have been applied since the implementation of the HealthChoices risk-adjustment program. Data Lag In order to allow for data runout, analysis of the risk scores, and the PH-MCO’s review of the final results, there is a lag between the study period used to develop the individual risk scores and the application period. The initial risk assessments were based on a data lag of twelve months, which allowed for the collection of the claims and encounter data six months after the study period.

HealthChoices RISK-ADJUSTED RATES MANUAL V2.4 COMMONWEALTH OF PENNSYLVANIA
MERCER
Appendix A
To address the PH-MCO concerns that the underlying data used within the risk assessment should be closer to the application period, the data lag was reduced to seven months. This was accomplished by collecting the claims and encounter data approximately four months following the end of the study period and allowing less time for analysis and review of the risk-adjustment results. Frequency of Plan Factor Updates The initial risk adjustments assumed that the historical member attraction patterns within the study period would be representative of the member attraction patterns within the application period. Under this approach, both the individual risk scores and the PH-MCO plan factors were updated on a semi-annual basis. Changes to the PH-MCO provider networks resulted in shifts of enrollees among the PH-MCOs and required a refinement to the plan factor development. To address these underlying member shifts, a more recent point in time was used to assign recipients to a PH-MCO and calculate the corresponding plan factors. The plan factors are currently updated on a monthly basis and utilize the enrollment from the first day of the application month to assign members to a PH-MCO. Newborn Scoring Methodology With the implementation of risk adjustment, the newborn rate was eliminated and newborn costs were incorporated into the TANF/HB capitation rates. Based on PH-MCO feedback, DPW subsequently decided to reinstate the newborn rate cell to address concerns regarding the disproportionate distribution of newborns among the PH-MCOs. Over time, the risk-adjustment application for newborns has been modified to enhance the process for this unique population. The initial newborn risk scores were developed using a single, 12-month study period, where a newborn could have a risk score that was based on data with 1–12 months of disease experience. In an effort to utilize more data for the development of newborn risk scores, individual study periods were created for each newborn that provided for 7–12 months of disease experience. This approach is described in greater detail within Section 8. Another aspect of newborn risk scoring that has changed over time is the method used to assign the newborn experience to the PH-MCOs. Historically, the PH-MCO assignment has been based on the distribution of member months within the study period or a hybrid approach using the birth PH-MCO and historical member month enrollment. With the introduction of the two separate newborn rates (TANF/HB Less Than 2 Months and TANF/HB 2 Through 11 Months), the PH-MCO assignment approach changed again. The plan factor to support the TANF/HB Less Than 2 Months rate is based solely on the birth PH-MCO assignment. The plan factor to support the TANF/HB 2 Through 11 Months rate is based on the distribution of member months by PH-MCO when the newborns are 2 through 11 months old. Cost Weights The initial risk assessments relied on “national” experience for the relative costs associated with each CDPS category. The national experience, which was based on seven Medicaid programs from the early 1990s, was used because the encounter data that was available prior to the

HealthChoices RISK-ADJUSTED RATES MANUAL V2.4 COMMONWEALTH OF PENNSYLVANIA
MERCER
Appendix A
risk-adjustment implementation was insufficient to support the development of Pennsylvania-specific cost weights. With the introduction of the CDPS+Rx model and the collection of robust encounter data for CY 2005 and CY 2006, Pennsylvania-specific weights were developed and have been used in the risk-adjustment process. Use Only DPW-Accepted Records Risk-assessment techniques rely heavily upon the diagnoses reported on the encounter data to identify the disease conditions associated with each recipient. Since the HealthChoices program uses the risk-assessment results to adjust the capitation rates paid to the PH-MCOs, there is a strong incentive for the PH-MCOs to submit encounter data that meet the risk-adjustment requirements. Initially this meant that the PH-MCOs submitted the encounter data prior to the established data cut-off. This policy resulted in significant improvements in encounter volume and diagnostic reporting, but less improvement on the other encounter data components. Recognizing the strong data reporting incentives associated with risk adjustment, DPW decided to leverage the risk-adjustment process to improve the overall quality of the encounter data by only using those records that pass the required PROMISe edits (DPW-accepted records) within the risk-assessment process. This policy change has resulted in a significant increase in the proportion of encounter records that meet the data quality requirements established by DPW. This improved data quality was observed from all PH-MCOs and will ultimately allow DPW to rely more heavily on the encounter data to support other HealthChoices initiatives beyond risk adjustment. MCO Altered Record Policy During the 2010 encounter on-site reviews, it was discovered that some PH-MCOs were creating new encounter records for services that were never submitted by the provider or modifying records submitted by providers to include “missing” diagnoses based on medical chart review findings from the PH-MCOs representatives. As part of their process, the PH-MCOs never received approval from the providers regarding the medical chart review findings and specifically the encounter data creation/modification. At the time of the encounter on-site review, there was no specific policy from DPW that precluded this type of activity from the PH-MCOs. Subsequent to the on-site reviews, an official policy was released stating that DPW does not accept records that have been altered, adjusted or submitted by an MCO without supporting documentation in the form of a claim or encounter (paper or electronic) from the submitting provider who originated the medical service. New PH-MCO Considerations Every few years, DPW reevaluates the contractors that provide services for the HealthChoices program against the Commonwealth’s goals. This can result in some PH-MCOs exiting a zone and/or the addition of new PH-MCOs into a zone. Changes to the participating PH-MCOs often alter the choices made by recipients regarding their PH-MCO selection. These attraction patterns will generally take a while to stabilize as Medicaid recipients become more familiar with the new PH-MCOs. As a result of this phenomenon, PH-MCOs’ plan factors should be measured frequently (e.g., monthly) to account for the changes in risk attraction patterns that are occurring over time as membership in the new PH-MCOs increases.
HealthChoices RISK-ADJUSTED RATES MANUAL V2.4 COMMONWEALTH OF PENNSYLVANIA
MERCER
Appendix A
Effective April 1, 2010, new PH-MCOs entered the Southeast11 and Lehigh/Capital12 zones. To help these new PH-MCOs establish its HealthChoices membership, DPW has historically assigned the vast majority of the auto-assignee recipients to a new PH-MCO for a period of time. Since recipients who do not choose a PH-MCO are generally lower risk than recipients who actively choose a PH-MCO, the mix of auto-assignee and chooser recipients can significantly impact the health risk of each PH-MCO. Recognizing this, the health risk assumption used for unscored recipients was refined to account for each PH-MCOs mix of auto-assignees and choosers. The unscored assumption was further refined to address low credibility situations where a PH-MCO’s scored population was small and/or the scored recipients represented a small portion of the overall population. In these low credibility situations, the unscored assumption was either the region-wide risk score or a blend of the PH-MCO’s risk score and the region-wide risk score. This low credibility application was later updated prior to the release of the 2011b risk-adjustment results. This update was implemented to place a lower credibility percentage on the new MCOs’ risk scores when assigning risk to their unscored populations, and thereby making the process of attaining full credibility for their risk scores a more gradual process. Additionally, to aid PH-MCOs new to HealthChoices, DPW provided technical assistance sessions and documentation regarding the capitation rate development and risk-adjustment processes prior to implementation. Following the implementation of new PH-MCOs into a HealthChoices zone, a special file was provided to the new PH-MCOs that contained the CDPS+Rx categories (group of disease conditions) associated with each of its enrolled recipients. This special file was provided during the PH-MCO’s initial six months of operation within a HealthChoices zone to help them understand the disease characteristics of its enrollees better. Effective April 1, 2012, a new PH-MCO entered the Southwest zone13. The same approach processes will be used for this PH-MCO that were used for the PH-MCOs that entered the program in April 2010. HealthChoices Expansion The Commonwealth is expanding the HealthChoices program to all counties in Pennsylvania. Prior to this expansion, 25 of the 67 counties in Pennsylvania were in the HealthChoices program. The remaining 42 counties will be phased into the HealthChoices program over a period of time. This expansion will create two new zones (New East and New West) for 35 of the 42 counties and the remaining seven counties were added to the legacy Southwest and Lehigh/Capital zones. More details for the zone and region structure including the county assignments to the different zones and regions can be found in Section 4 (Capitation Rates and Other Reimbursement Arrangements).
11 Aetna Better Health, Inc and HealthAmerica Pennsylvania, Inc. 12 Aetna Better Health, Inc and UPMC for You, Inc. 13 HealthAmerica Pennsylvania, Inc.

HealthChoices RISK-ADJUSTED RATES MANUAL V2.4 COMMONWEALTH OF PENNSYLVANIA
MERCER
Appendix A
As part of this expansion, the Commonwealth intends to risk adjust capitation payments made to the PH-MCOs in these expansion counties from day one of implementation. The methodology and processes used for the 25 legacy HealthChoices counties will carry over and be used for the expansion counties. This includes the same data collection, individual risk score development and PH-MCO risk score development methodologies and processes utilized in the legacy HealthChoices counties. One modification was required to appropriately classify members into their selection category. The enrollment file traditionally used for this process, contains a chooser value for all enrollees at the beginning of the HealthChoices expansion. Fortunately, DPW maintained a list of members who were auto-assigned into a MCO at the start of the expansion. This conversion file was used in conjunction with the monthly enrollment file to determine each recipient’s selection status. The logic used to define recipients as an auto-assignee or chooser follows the following hierarchical steps: • Recipients who were enrolled in a voluntary MCO prior to expansion were classified as a
chooser. • Recipients who were identified as an auto-assignee in the traditional enrollment file (referred
to as the AMC file) were classified as an auto-assignee. • Recipients who were enrolled in different MCOs in the conversion file versus the traditional
AMC file were classified as a chooser. • Recipients who were enrolled in the same MCO between the two files were classified as an
auto-assignee. • Recipients who were not in the conversion file were classified as a chooser. The newborn rating groups will not be risk adjusted during the initial part of the expansion, but will be subject to risk adjustment once the PH-MCOs in the expansion counties have sufficient experience for newborn risk scoring purposes. Application of Limits to Risk Score Changes Subsequent to the implementation of the risk-adjustment process, the Commonwealth changed its Medicaid Management Information System (MMIS). The collection of encounter data was disrupted, which led to alternative methods for either collecting data and/or addressing missing data. During this period of transition, a limit was applied to the risk-adjustment process to avoid any overall plan factor changes (across all regions and rating groups) in excess of 2.5% between semi-annual risk adjustments. At this time, there is no limit on the risk score changes that can occur between risk adjustments.

HealthChoices RISK-ADJUSTED RATES MANUAL V2.4 COMMONWEALTH OF PENNSYLVANIA
MERCER
Appendix B
Appendix B
Glossary Accepted record Encounter record that passed all of the required PROMISe edits as
determined by DPW. Also referred to as a DPW-accepted record. Acuity factor Measurement of relative health care needs based on the CDPS+Rx
model and a recipient’s demographic, diagnostic information and pharmacy usage. Also referred to as an individual risk score.
Adverse selection Indicates that a PH-MCO has enrolled sicker-than-average recipients. This condition can be identified when budget neutral plan factors exceed 1.0000.
Application period The time period the plan factors will be used to adjust the capitation rates. For example, the 2009b risk-adjustment results will be used to adjust the July 1, 2009 through December 31, 2009, capitation rates. In this example, the application period is July 1, 2009 through December 31, 2009.
Auto-assignee A HealthChoices member who does not make an active PH-MCO selection. These members are automatically assigned to a PH-MCO based on the Commonwealth’s criteria. Generally, the auto-assignee population tends to have lower health risk than the average population based on the premise that members without impending health care needs are less likely to make an active PH-MCO selection.
Average selection Indicates that a PH-MCO has enrolled recipients with average health risk. This condition can be identified when budget neutral plan factors are equal to 1.0000.
Budget neutrality adjustment
The final step in the risk-adjustment process, where the PH-MCO plan factors are adjusted to ensure that no unintended reductions or overages in total capitation payments will occur.
Capitation rates Pre-determined payments to PH-MCOs for each member they enroll. The dollar amount, per-member-per-month, is based on the regional and rating group status of the member.
CDPS The Chronic Illness and Disability Payment System (CDPS) is a diagnostic classification system that estimates health risk using demographic and diagnostic characteristics. The design and values associated with this model were developed specifically by the UCSD for TANF and Disabled Medicaid recipients. This was the risk-assessment model that was used to risk adjust HealthChoices capitation rates from 2003 through 2008.
CDPS+Rx The CDPS+Rx model is a combined diagnosis and pharmacy model that was developed specifically by UCSD for TANF and Disabled Medicaid recipients. This model uses both the CDPS and the Restricted Version of the Medicaid Rx models to classify people in disease conditions. A hierarchy is then applied to ensure that a person can only be classified once into a major category. This is the risk-assessment model that has been used to risk adjust HealthChoices capitation rates since 2009. Additional information regarding this model is provided in Section 2.
Child interaction factors
Component of the CDPS+Rx Disabled model that recognizes that additional costs are generally attributed to children with certain

HealthChoices RISK-ADJUSTED RATES MANUAL V2.4 COMMONWEALTH OF PENNSYLVANIA
MERCER
Appendix B
disease conditions. The child interaction factors are add-on weights that represent the difference in treating children compared to adults for certain conditions.
Choosers A HealthChoices member who makes an active PH-MCO selection. In relation to risk scoring, choosers include the population that selects a PH-MCO upon entrance into the HealthChoices program, the population that makes a PH-MCO change at any time, and the population whose PH-MCO status is unknown. Generally, the chooser population tends to have higher health risk than the average population based on the premise that members with impending health care needs are more likely to make an active PH-MCO selection based on provider networks or physician referrals.
Concurrent model This model measures existing conditions and their ability to measure existing risk. This is the model used to assess health risk in the HealthChoices program.
Control totals Used in the process of data validation, comparison of record counts of files sent by one entity versus files received by another entity to ensure complete file transfer. This validation step occurs whenever Mercer receives data from the Commonwealth. This validation step is highly recommended when data are sent to the PH-MCOs. As a result, control totals are sent along with each file transfer.
Cost weight A numeric value that is an estimate of health risk of a disease or demographic category. A cost weight is derived from comparing the relative cost associated with each CDPS+Rx category to the average cost of the population.
Demographic factors Demographic factors are incorporated into the CDPS+Rx model to estimate the medical resources not contained within the disease categories. Demographic factors are segregated by gender and age ranges.
Diagnostic data Data that contains a recipient’s diagnoses, which may be provided in FFS claims or MCO encounter data. This data (claims and encounter) classifies members into specific disease conditions, which then renders classification into CDPS+Rx categories.
Disease impact rank Measurement of the impact that a particular disease category may have on the development of the plan factors. This measurement takes into account the magnitude of the CDPS+Rx category weight in conjunction with the portion of the population presenting with the chronic condition. The lower the disease impact rank, the greater the category’s impact on the plan factor (one equals the greatest impact). Conversely, the higher the disease impact rank, the less impact on the plan factor. The disease impact rank is a quick resource for determining the disease categories that have the greatest influence when measuring the risk of the underlying population.
DPW Department of Public Welfare (DPW) manages the HealthChoices program.
Dual eligibles Recipients who qualify for both Medicare and Medicaid benefits. Data associated with these recipients are typically underreported because a record is only submitted to the Commonwealth or the PH-MCOs when Medicaid is financially responsible for a portion of the service beyond the amount paid by Medicare. Since Medicare payment is often considered full reimbursement, Medicaid only receives a relatively small subset of the claims experience that contains the requisite data to support the risk-assessment process. As a result of this

HealthChoices RISK-ADJUSTED RATES MANUAL V2.4 COMMONWEALTH OF PENNSYLVANIA
MERCER
Appendix B
underreporting, dual eligibles are not assigned a risk score. Eligibility file Data that contains historical demographic information used to classify
each recipient into a rating group, region and CDPS+Rx demographic category. The eligibility data also contains Medicaid eligibility and PH-MCO enrollment segments used to determine whether the recipient has sufficient experience to receive a CDPS+Rx acuity factor. These data are used within the semi-annual risk-adjustment processes.
Enrollment file Data that contains current demographic information used to assign a recipient to a rating group, region and CDPS+Rx demographic category. These data are used within the monthly risk-adjustment processes.
Frequency analysis Process to identify the unique values present within eligibility, claims, and encounter data submitted for risk adjustment. This analysis indicates whether any expected values are missing, invalid, or present in unexpected levels, and whether there is any significant change from prior experience.
ICD-9 codes International Classification of Diseases, 9th Revision (ICD-9) is the input used in the CDPS+Rx model to assess a member’s health risk based on historical chronic conditions. These chronic conditions are identified using the provider-submitted ICD-9 diagnosis codes. Also referred to as diagnosis codes.
Low credibility situations
During the monthly plan factor development, low credibility situations occur when a PH-MCO’s scored population is not fully used to assign plan factors to that PH-MCO’s unscored recipients. Specifically, when a PH-MCO’s scored population has less than 100 recipients or less than 50% of its population has an acuity factor for a given region and rating group, it is referred to as a low credibility situation.
Major categories The CDPS+Rx model classifies disease conditions into major categories. These categories are representative of body systems (e.g., cardiovascular or pulmonary) or illnesses that affect multiple systems (e.g., infectious disease or diabetes).
MCO altered record Encounter records that have been altered, adjusted or submitted by an MCO without supporting documentation in the form of a claim or encounter (paper or electronic) from the submitting provider who originated the medical service. Effective with the release of MCOPS Memo #06/2010-011, these records are disallowed.
Medicaid Rx
Medicaid Rx is a disease classification system that estimates health risk using demographic and pharmacy usage. The design and values associated with this model were developed specifically by the UCSD for TANF and Disabled Medicaid recipients. Two versions of the model exist. The full model contains 45 categories that are designed to measure a population’s health risk independent of any diagnostic data. The Restricted Version of the model was specifically designed to be used in combination with diagnosis data as part of the CDPS+Rx model and includes 15 categories.
Medical intensity subcategories
The CDPS+Rx model further classifies the conditions within a major category into medical intensity subcategories based on their estimated medical intensity (e.g., high, medium or low).
Member month Unit of coverage defined as one member being covered for one month. A member covered for one year constitutes 12 member months. This is also referred to as eligible months.

HealthChoices RISK-ADJUSTED RATES MANUAL V2.4 COMMONWEALTH OF PENNSYLVANIA
MERCER
Appendix B
Member month scored percentage
The number of months that a PH-MCO’s scored population was eligible for during the study period divided by that PH-MCO’s total recipients (scored and unscored) multiplied by 12. This metric is used monthly as a component of the PH-MCO risk score credibility grid when assigning the credibility percentage to the PH-MCO’s risk score within the unscored population’s risk assumption.
NDC
National drug code (NDC) is an input used in the Medicaid Rx and CDPS+Rx models to assess a member’s health risk based on their pharmacy usage. The NDC on the claims and encounters indicate the drug that was filled.
Pharmacy usage
Data that contains the prescriptions that a member had filled during the study period, which may be provided in FFS claims or MCO encounter data. This data (claims and encounter) classifies members into specific disease conditions, which then renders classification into the Medicaid Rx and CDPS+Rx categories.
Plan factor (unadjusted)
Estimated PH-MCO health risk as measured prior to budget neutrality.
Population statistics At the bottom of each prevalence report are statistics on the recipients that were not classified into a disease category from the CDPS+Rx model. The first statistic measures the portion of the population that did not have any data to contribute to the risk scoring process. The second statistic measures the portion of the population that did have data, but did not have a CDPS+Rx weighted disease condition. These two population statistics are mutually exclusive. For the purpose of creating these statistics, a person is considered as having data if they had any inpatient, outpatient or professional records within the study data period or were classified into one of the Restricted Medicaid Rx categories.
Positive selection Indicates that a PH-MCO has enrolled healthier-than-average recipient. This condition can be identified when budget neutral plan factors are less than 1.0000.
Prevalence reports This report compares the PH-MCO population characteristics (as measured by CDPS+Rx) to the characteristics of the entire population. The prevalence reports also provide the interim steps used to develop the final plan factors. A separate prevalence report is provided for each CDPS+Rx model (TANF adult, TANF child and SSI) and each newborn rating group.
Prospective model This model measures existing conditions and their ability to predict future health care costs.
Rating group Each rating group considers the eligibility criteria necessary for the recipient to receive Medicaid coverage. This distinction generally considers the income, age, and medical status of the recipients. To recognize the variation in health risk based on the recipient’s eligibility status, separate capitation rates are developed by rating group.
Read me Within the risk-adjustment process, there are a series of reports that are distributed to the PH-MCOs. Included along with the reports, is a “read me” document that describes the content of the reporting package along with the control totals for any data files.
Risk adjustment Adjustment of PH-MCO capitation revenue based on health risk associated with enrolled members, as measured based on demographic characteristics and prevalence of chronic disease conditions. The intent of this approach is to provide higher

HealthChoices RISK-ADJUSTED RATES MANUAL V2.4 COMMONWEALTH OF PENNSYLVANIA
MERCER
Appendix B
reimbursement to those PH-MCOs experiencing adverse selection and lower reimbursement to those PH-MCOs experiencing positive selection.
Risk assessment Measurement of individual health risk based on the recipient’s age, gender and chronic disease history.
Risk pool A separate pool of funds that is distributed among PH-MCOs using a mechanism other than CDPS+Rx.
Risk sharing Arrangement where the Commonwealth and the PH-MCOs share the expenses associated with certain high-risk recipients who incur a certain level of health care expenses.
Scored member months
The number of months that a PH-MCO’s scored population was eligible for during the study period. This metric is used monthly as a component of the PH-MCO risk score credibility grid when assigning the credibility percentage to the PH-MCO’s risk score within the unscored population’s risk assumption.
Scored recipients Newborns or recipients with six or more months of Medicaid eligibility during the study period. Excludes recipients who have both Medicare and Medicaid coverage, commonly referred to as dual eligibles.
Shadow pricing An approach used to assign a standard unit cost amount to records with invalid or unreasonable unit costs created by subcapitation arrangements or varied inpatient contracting.
Subcapitation A financial arrangement between a PH-MCO and a provider, where the provider receives an agreed upon monthly fee regardless of the number of services that are rendered. Data for subcapitated providers generally does not contain any financial information and can be incomplete because providers do not have a financial incentive to submit records to the PH-MCO.
Supplemental maternity care payment
To compensate PH-MCOs for each delivery they incur, the Commonwealth pays the PH-MCOs a supplemental maternity payment. To the extent that PH-MCOs have a different incidence rate of maternity events, the supplemental maternity payment better matches payment to risk by providing a greater payment to PH-MCOs experiencing more deliveries, without the application of CDPS+Rx risk adjustment.
Study period Represents the 12-month time period that data were collected for risk assessment. There is generally a seven-month gap between the study period and the first month the acuity factors are used to adjust capitation rates. For example, the 2009b risk-adjustment analysis used December 1, 2007 through November 30, 2008 data to apply to the July 1, 2009 through December 31, 2009 capitation rates. In this example, the study period is December 1, 2007 through November 30, 2008.
UCSD University of California San Diego (UCSD) staff developed the CDPS, CDPS+Rx and Medicaid Rx models. Their web-site can be found at the following address: http://cdps.ucsd.edu/. To access any of the model software, a license agreement must be completed.
Unscored Recipients Recipients who do not meet the scoring criteria used to determine if a recipient has sufficient experience to receive an acuity factor within the semi-annual risk assessment. An assumption is made about the health risk of unscored recipients in order to assess the overall health risk for each PH-MCO within the monthly plan factor development.
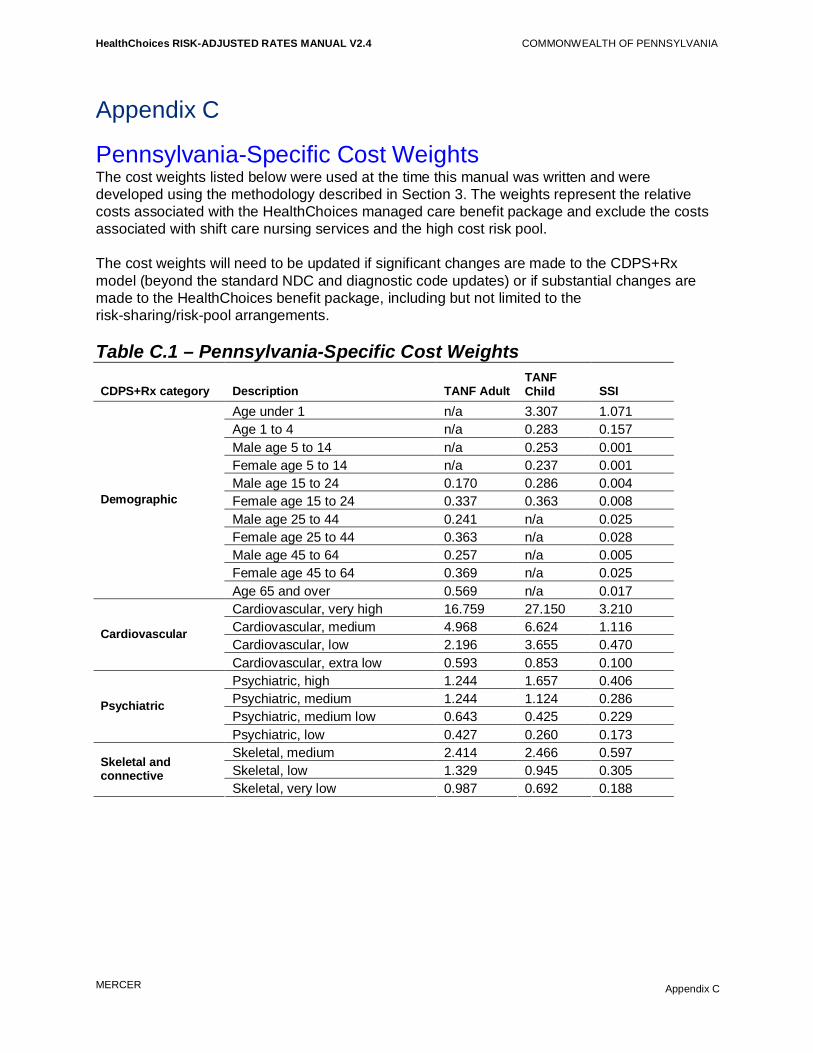
HealthChoices RISK-ADJUSTED RATES MANUAL V2.4 COMMONWEALTH OF PENNSYLVANIA
MERCER
Appendix C
Appendix C
Pennsylvania-Specific Cost Weights The cost weights listed below were used at the time this manual was written and were developed using the methodology described in Section 3. The weights represent the relative costs associated with the HealthChoices managed care benefit package and exclude the costs associated with shift care nursing services and the high cost risk pool. The cost weights will need to be updated if significant changes are made to the CDPS+Rx model (beyond the standard NDC and diagnostic code updates) or if substantial changes are made to the HealthChoices benefit package, including but not limited to the risk-sharing/risk-pool arrangements. Table C.1 – Pennsylvania-Specific Cost Weights
CDPS+Rx category Description TANF Adult TANF Child
SSI
Age under 1 n/a 3.307 1.071 Age 1 to 4 n/a 0.283 0.157 Male age 5 to 14 n/a 0.253 0.001 Female age 5 to 14 n/a 0.237 0.001 Male age 15 to 24 0.170 0.286 0.004 Female age 15 to 24 0.337 0.363 0.008 Male age 25 to 44 0.241 n/a 0.025 Female age 25 to 44 0.363 n/a 0.028 Male age 45 to 64 0.257 n/a 0.005 Female age 45 to 64 0.369 n/a 0.025
Demographic
Age 65 and over 0.569 n/a 0.017 Cardiovascular, very high 16.759 27.150 3.210 Cardiovascular, medium 4.968 6.624 1.116 Cardiovascular, low 2.196 3.655 0.470
Cardiovascular
Cardiovascular, extra low 0.593 0.853 0.100 Psychiatric, high 1.244 1.657 0.406 Psychiatric, medium 1.244 1.124 0.286 Psychiatric, medium low 0.643 0.425 0.229
Psychiatric
Psychiatric, low 0.427 0.260 0.173 Skeletal, medium 2.414 2.466 0.597 Skeletal, low 1.329 0.945 0.305
Skeletal and connective
Skeletal, very low 0.987 0.692 0.188

HealthChoices RISK-ADJUSTED RATES MANUAL V2.4 COMMONWEALTH OF PENNSYLVANIA
MERCER
Appendix C
CDPS+Rx category Description TANF Adult TANF Child
SSI
CNS, high 7.696 10.256 0.681 CNS, medium 3.772 3.419 0.454
Central nervous system (CNS)
CNS, low 1.671 2.096 0.312 Pulmonary, very high n/a n/a 2.752 Pulmonary, high 9.566 10.747 1.341 Pulmonary, medium 5.164 5.680 1.318
Pulmonary
Pulmonary, low 0.835 0.850 0.261 Gastrointestinal, high 9.071 13.654 1.458 Gastrointestinal, medium 3.815 4.634 0.602 Gastrointestinal Gastrointestinal, low 1.430 2.016 0.369 Diabetes, type 1 high 3.138 n/a 0.581 Diabetes, type 1 medium 3.138 n/a 0.581 Diabetes, type 2 medium 0.967 n/a 0.229
Diabetes
Diabetes, type 2 low 0.967 2.238 0.229 Skin, high 6.732 6.835 0.937 Skin, low 2.237 1.365 0.450 Skin Skin, very low 0.644 0.656 0.183 Renal, extra high 13.908 6.995 2.543 Renal, very high 6.756 6.995 1.087 Renal, medium 3.745 4.102 0.617
Renal
Renal, low 2.080 0.898 0.227 Substance abuse, low 0.430 0.839 0.117 Substance abuse Substance abuse, very low 0.403 0.184 0.084 Cancer, very high 21.510 25.559 2.992 Cancer, high 10.133 8.510 1.453 Cancer, medium 2.916 2.597 0.561
Cancer
Cancer, low 1.855 0.790 0.346 DD, medium n/a 4.499 0.096 Developmental
disabilities (DD) DD, low 1.612 1.605 0.067 Genital Genital, extra low 1.266 1.375 0.272
Metabolic, high 2.747 3.910 0.819 Metabolic, medium 2.747 2.951 0.819 Metabolic Metabolic, very low 2.247 1.185 0.352 Eye, low 1.008 n/a 0.281 Eye Eye, very low 0.718 1.931 0.150
Cerebrovascular Cerebrovascular, low 3.578 2.671 0.652 AIDS, high 6.128 8.002 1.754 Infectious, high 6.128 6.411 1.754 HIV, medium 5.113 5.632 1.341 Infectious, medium 5.113 5.632 0.974
Infectious disease
Infectious, low 0.716 0.758 0.137

HealthChoices RISK-ADJUSTED RATES MANUAL V2.4 COMMONWEALTH OF PENNSYLVANIA
MERCER
Appendix C
CDPS+Rx category Description TANF Adult TANF Child
SSI
Hematological, extra high 8.373 16.597 7.801 Hematological, very high 5.089 5.189 1.916 Hematological, medium 3.420 2.553 1.333
Hematological
Hematological, low 2.317 2.553 0.667 Anti-coagulants 4.968 6.624 1.116 Cardiac 0.593 0.853 0.100 Depression/Psychosis/Bipolar 0.427 0.260 0.173 Diabetes 0.967 2.238 0.229 ESRD/Renal 6.756 6.995 1.087 Hemophilia/von Willebrands 8.373 16.597 7.801 Hepatitis 5.113 5.632 1.341 HIV 5.113 5.632 1.341 Infections, high 6.128 6.411 1.754 Inflammatory/Autoimmune 0.987 0.692 0.188 Malignancies 2.916 2.597 0.561 Multiple Sclerosis/Paralysis 3.772 3.419 0.454 Parkinson’s/Tremor 1.671 2.096 0.312 Seizure Disorders 1.671 2.096 0.312
Restricted Medicaid Rx categories
Tuberculosis 0.835 0.850 0.261 Cardiovascular, very high n/a n/a 0.339 Cardiovascular, medium n/a n/a 0.602 Central Nervous System, high n/a n/a 0.179 Pulmonary, very high n/a n/a 0.427 Pulmonary, high n/a n/a 0.605 Gastrointestinal, high n/a n/a 0.397 Metabolic, high n/a n/a 0.552 HIV, medium n/a n/a 0.321 Infectious, medium n/a n/a 1.419
Child interaction factors
Hematological, extra high n/a n/a 1.751

HealthChoices RISK-ADJUSTED RATES MANUAL V2.4 COMMONWEALTH OF PENNSYLVANIA
MERCER
Appendix D
Appendix D
Sample Reports Several sample reports were referenced throughout the manual, all of which are included within this Appendix. Subsequent versions of this manual will be updated to reflect the elimination of the Federal GA rate cell.

HealthChoices RISK-ADJUSTED RATES MANUAL V2.4 COMMONWEALTH OF PENNSYLVANIA
MERCER Appendix D
0
0.5
1
1.5
2
2.5
Dec-09 Jan-10 Feb-10 Mar-10 Apr-10 May-10 Jun-10 Jul-10 Aug-10 Sep-10 Oct-10 Nov-10
Month of Service within the Study Period
Det
ail E
ncou
nter
s pe
r Rec
ipie
nt
SE: MCO A
SE: MCO B
SE: MCO F
SW: MCO D
SW: MCO E
SW: MCO F
LC: MCO G
LC: MCO H
LC: MCO I
Appendix D.1 – Encounter volume chart
PH-MCO
• Based on records that were submitted to PROMISe by the risk adjustment cutoff date.• Duplicate professional records were removed.

HealthChoices RISK-ADJUSTED RATES MANUAL V2.4 COMMONWEALTH OF PENNSYLVANIA
Appendix D.2 – Prevalence report2011b Risk Adjustment
Risk Category Distribution XYZ Health PlanStudy Period: Southeast Zone
December 1, 2009 through November 30, 2010 CDPS+Rx Model: TANF Adult
Only PH-MCO Data (XYZ Health Plan) All Data Sources†Count of Total
Recipients1Percent of Total
Recipients1Count of Scored
Recipients2Percent of Scored
Recipients2Count of PH-MCO
Scored Recipients3Percent of PH-MCO Scored Recipients3
Count of Zone-Wide Scored Recipients
Percent of Zone-Wide Scored Recipients
CDPS+Rx Category (A1) (A2) (B1) (B2) (C1) (C2) (D1) (D2)Demographic CategoriesAge Under 1 - 0.0% - 0.0% - 0.0% - 0.0%Age 1 to 4 - 0.0% - 0.0% - 0.0% - 0.0%Male Age 5 to 14 - 0.0% - 0.0% - 0.0% - 0.0%Female Age 5 to 14 - 0.0% - 0.0% - 0.0% - 0.0%Male Age 15 to 24 4,745 13.6% 3,892 13.0% 3,892 13.0% 17,042 13.5%Female Age 15 to 24 10,257 29.3% 9,032 30.1% 9,032 30.1% 38,920 30.7%Male Age 25 to 44 2,310 6.6% 1,798 6.0% 1,798 6.0% 7,057 5.6%Female Age 25 to 44 14,785 42.2% 12,789 42.6% 12,789 42.6% 54,170 42.8%Male Age 45 to 64 852 2.4% 697 2.3% 697 2.3% 2,473 2.0%Female Age 45 to 64 2,048 5.9% 1,789 6.0% 1,789 6.0% 7,024 5.5%Age 65 and Over 3 0.0% 3 0.0% 3 0.0% 10 0.0%Age Subtotal 35,000 100.0% 30,000 100.0% 30,000 100.0% 126,696 100.0%
Diagnostic CategoriesCardiovascular, very high 25 0.1% 13 0.0% 16 0.1% 70 0.1%Cardiovascular, medium 266 0.8% 266 0.9% 301 1.0% 1,049 0.8%Cardiovascular, low 1,111 3.2% 1,085 3.6% 1,207 4.0% 4,530 3.6%Cardiovascular, extra low 2,116 6.0% 2,057 6.9% 2,182 7.3% 8,381 6.6%Psychiatric, high 71 0.2% 70 0.2% 211 0.7% 786 0.6%Psychiatric, medium 206 0.6% 203 0.7% 518 1.7% 2,104 1.7%Psychiatric, medium low 884 2.5% 854 2.8% 2,178 7.3% 9,056 7.1%Psychiatric, low 1,251 3.6% 1,216 4.1% 1,266 4.2% 5,165 4.1%Skeletal medium 480 1.4% 473 1.6% 530 1.8% 1,821 1.4%Skeletal, medium 480 1.4% 473 1.6% 530 1.8% 1,821 1.4%Skeletal, low 971 2.8% 955 3.2% 1,027 3.4% 3,977 3.1%Skeletal, very low 1,087 3.1% 1,072 3.6% 1,173 3.9% 4,478 3.5%Central nervous system, high 16 0.0% 16 0.1% 16 0.1% 52 0.0%Central nervous system, medium 117 0.3% 117 0.4% 125 0.4% 411 0.3%Central nervous system, low 844 2.4% 840 2.8% 937 3.1% 3,216 2.5%Pulmonary, very high - 0.0% - 0.0% - 0.0% - 0.0%Pulmonary, high 49 0.1% 44 0.1% 51 0.2% 163 0.1%Pulmonary, medium 217 0.6% 208 0.7% 235 0.8% 848 0.7%Pulmonary, low 2,961 8.5% 2,940 9.8% 3,219 10.7% 12,800 10.1%Gastrointestinal, high 46 0.1% 43 0.1% 51 0.2% 135 0.1%Gastrointestinal, medium 228 0.7% 221 0.7% 244 0.8% 895 0.7%Gastrointestinal, low 1,765 5.0% 1,750 5.8% 1,908 6.4% 7,331 5.8%Diabetes, type 1 high 12 0.0% 12 0.0% 12 0.0% 54 0.0%Diabetes, type 1 medium 208 0.6% 208 0.7% 228 0.8% 839 0.7%Diabetes, type 2 medium 70 0.2% 67 0.2% 73 0.2% 301 0.2%Diabetes, type 2 low 770 2.2% 738 2.5% 764 2.5% 2,877 2.3%Skin, high 9 0.0% 8 0.0% 12 0.0% 46 0.0%Skin, low 58 0.2% 56 0.2% 58 0.2% 206 0.2%Skin, very low 1,424 4.1% 1,414 4.7% 1,574 5.2% 6,686 5.3%Renal, extra high 2 0.0% 2 0.0% 3 0.0% 28 0.0%Renal, very high 76 0.2% 76 0.3% 84 0.3% 299 0.2%Renal, medium 35 0.1% 34 0.1% 38 0.1% 135 0.1%Renal, low 213 0.6% 212 0.7% 226 0.8% 763 0.6%Substance abuse, low 552 1.6% 541 1.8% 1,523 5.1% 5,829 4.6%Substance abuse, very low 145 0.4% 143 0.5% 305 1.0% 1,303 1.0%Cancer, very high 11 0.0% 8 0.0% 10 0.0% 56 0.0%Cancer, high 48 0.1% 47 0.2% 54 0.2% 189 0.1%Cancer, medium 44 0.1% 44 0.1% 43 0.1% 150 0.1%Cancer, low 100 0.3% 100 0.3% 105 0.4% 301 0.2%Developmental disabilities, medium - 0.0% - 0.0% - 0.0% - 0.0%Developmental disabilities, low 12 0.0% 12 0.0% 19 0.1% 112 0.1%Genital, extra low 1,108 3.2% 1,093 3.6% 1,224 4.1% 4,969 3.9%Metabolic, high 93 0.3% 91 0.3% 97 0.3% 334 0.3%Metabolic, medium 97 0.3% 94 0.3% 109 0.4% 421 0.3%Metabolic, very low 300 0.9% 300 1.0% 353 1.2% 1,379 1.1%
MERCER Appendix D

HealthChoices RISK-ADJUSTED RATES MANUAL V2.4 COMMONWEALTH OF PENNSYLVANIA
Appendix D.2 – Prevalence report2011b Risk Adjustment
Risk Category Distribution XYZ Health PlanStudy Period: Southeast Zone
December 1, 2009 through November 30, 2010 CDPS+Rx Model: TANF Adult
Only PH-MCO Data (XYZ Health Plan) All Data Sources†Count of Total
Recipients1Percent of Total
Recipients1Count of Scored
Recipients2Percent of Scored
Recipients2Count of PH-MCO
Scored Recipients3Percent of PH-MCO Scored Recipients3
Count of Zone-Wide Scored Recipients
Percent of Zone-Wide Scored Recipients
CDPS+Rx Category (A1) (A2) (B1) (B2) (C1) (C2) (D1) (D2)Eye, low 40 0.1% 39 0.1% 41 0.1% 131 0.1%Eye, very low 148 0.4% 147 0.5% 157 0.5% 585 0.5%Cerebrovascular, low 76 0.2% 76 0.3% 93 0.3% 354 0.3%AIDS, high 240 0.7% 237 0.8% 252 0.8% 589 0.5%Infectious, high 2 0.0% 2 0.0% 3 0.0% 16 0.0%HIV, medium 71 0.2% 69 0.2% 86 0.3% 373 0.3%Infectious, medium 56 0.2% 51 0.2% 69 0.2% 255 0.2%Infectious, low 396 1.1% 387 1.3% 422 1.4% 1,526 1.2%Hematological, extra high 9 0.0% 9 0.0% 9 0.0% 21 0.0%Hematological, very high 11 0.0% 11 0.0% 13 0.0% 64 0.1%Hematological, medium 234 0.7% 231 0.8% 257 0.9% 1,081 0.9%Hematological, low 266 0.8% 263 0.9% 315 1.1% 1,245 1.0%
Pharmacy CategoriesAnti-coagulants 130 0.4% 126 0.4% 125 0.4% 462 0.4%Cardiac 991 2.8% 915 3.1% 857 2.9% 3,474 2.7%Depression / Psychosis / Bipolar 2,668 7.6% 2,539 8.5% 1,642 5.5% 6,309 5.0%Diabetes 185 0.5% 163 0.5% 145 0.5% 610 0.5%ESRD / Renal 5 0.0% 5 0.0% 5 0.0% 23 0.0%Hemophilia / von Willebrands - 0.0% - 0.0% - 0.0% 2 0.0%Hepatitis 25 0.1% 25 0.1% 25 0.1% 74 0.1%HIV 16 0.0% 14 0.0% 9 0.0% 71 0.1%Infections, high 11 0.0% 11 0.0% 11 0.0% 42 0.0%Inflammatory / Autoimmune 28 0.1% 28 0.1% 28 0.1% 123 0.1%y % % % %Malignancies 74 0.2% 70 0.2% 70 0.2% 301 0.2%Multiple Sclerosis / Paralysis 1 0.0% 1 0.0% 1 0.0% 4 0.0%Parkinson's / Tremor 88 0.3% 87 0.3% 85 0.3% 329 0.3%Seizure disorders 151 0.4% 144 0.5% 141 0.5% 603 0.5%Tuberculosis 57 0.2% 56 0.2% 56 0.2% 242 0.2%
Child Interaction FactorsCardiovascular, very high n/a n/a n/a n/a n/a n/a n/a n/aCardiovascular, medium n/a n/a n/a n/a n/a n/a n/a n/aCentral nervous system, high n/a n/a n/a n/a n/a n/a n/a n/aPulmonary, very high n/a n/a n/a n/a n/a n/a n/a n/aPulmonary, high n/a n/a n/a n/a n/a n/a n/a n/aGastrointestinal, high n/a n/a n/a n/a n/a n/a n/a n/aMetabolic, high n/a n/a n/a n/a n/a n/a n/a n/aHIV, medium n/a n/a n/a n/a n/a n/a n/a n/aInfectious, medium n/a n/a n/a n/a n/a n/a n/a n/aHematological, extra high n/a n/a n/a n/a n/a n/a n/a n/a
Population StatisticsNo Data (FFS/Encounter) 8,266 23.6% 5,541 18.5% 4,322 14.4% 19,631 15.5%No Classified Disease Categories 12,073 34.5% 11,134 37.1% 10,847 36.2% 47,355 37.4%
†This includes all encounters (Physical Health MCO and Behavioral Health MCO) and Fee-For-Service (FFS) claims.
Notes: • For more detail regarding the acuity factor calculations, see the 2011b Risk-Adjustment Methodology letter.• Recipients are assigned to a HealthChoices zone, CDPS+Rx demographic category, and CDPS+Rx model based on their classification at the end of the study period (December 1, 2009 through November 30, 2010).• The TANF Adult Model includes recipients age 18 or older whose last known rating group in the study period was either TANF Age 1+ or Healthy Beginnings Age 1+.
¹Total recipients include all individuals within the 12 month study period, regardless of Medicaid eligibility duration.²Scored recipients include eligible newborns or individuals that had six or more months of Medicaid eligibility within the 12 month study period.³PH-MCO-scored recipients include all scored recipients who had at least one month of Medicaid eligibility in XYZ Health Plan.
MERCER Appendix D

HealthChoices RISK-ADJUSTED RATES MANUAL V2.4 COMMONWEALTH OF PENNSYLVANIA
Appendix D.3 – Estimated financial impact report
2011b Risk AdjustmentFinancial Impact Report Southeast Zone: XYZ Health Plan
Philadelphia County
Estimated Financial Impact
Rating Group 2011a Applied Plan Factor¹ 2011b Estimated Plan Factor² Estimated Plan Factor Change³(A) (B) (C)
TANF/HB Less Than 2 Months 1.0589 1.0547 -0.4%TANF/HB 2 Through 11 Months 1.0422 1.0481 0.6%TANF Age 1+ 1.0814 1.0916 0.9%Healthy Beginnings Age 1+ 1.1141 1.1026 -1.0%SSI and Healthy Horizons 1.0980 1.1118 1.3%Federal GA 1.0555 1.0333 -2.1%Composite † 1.0853 1.0937 0.8%
4 Surrounding Counties
Estimated Financial Impact
Rating Group 2011a Applied Plan Factor¹ 2011b Estimated Plan Factor² Estimated Plan Factor Change³(A) (B) (C)
TANF/HB Less Than 2 Months 1.0589 1.0653 0.6%TANF/HB 2 Through 11 Months 1.0664 1.0690 0.2%TANF Age 1+ 1.1089 1.0874 -1.9%Healthy Beginnings Age 1+ 1.0333 0.9936 -3.8%SSI and Healthy Horizons 1.0528 1.0613 0.8%Federal GA 1.0160 1.0370 2.1%Composite † 1 0642 1 0619 0 2%
Plan Factor Comparison: 2011a to 2011b
Composite † 1.0642 1.0619 -0.2%
Zone-Wide
Estimated Financial Impact
Rating Group 2011a Applied Plan Factor¹ 2011b Estimated Plan Factor² Estimated Plan Factor Change³(A) (B) (C)
Composite † 1.0763 1.0801 0.4%
† The composite factors were developed using June 1, 2011, enrollment and the contracted base rates. The composite factors were based on TANF/HB Less Than 2 Months, TANF/HB 2 Through 11 Months, TANF Age 1+, Healthy Beginnings Age 1+, SSI and Healthy Horizons, and Federal GA rating groups.
¹Except for the TANF/HB Less Than 2 Months and TANF/HB 2 Through 11 Months rating groups, the 2011a Applied Plan Factor is calculated using June 1, 2011 enrollment and the 2011a acuity factors.²Except for the TANF/HB Less Than 2 Months and TANF/HB 2 Through 11 Months rating groups, the 2011b Estimated Plan Factor is calculated using June 1, 2011 enrollment and the 2011b acuity factors.³Estimated Plan Factor Change is the anticipated financial impact due to the scheduled acuity factor update. This measures the risk changes in the previously measured population, influence of newly scored recipients, data reporting changes, and risk-scoring policy changes (including model and cost weight updates).
NOTE: The newborn monthly eligibility counts used in the calculation of the composite plan factors were adjusted to account for the anticipated number of missing births in May and June 2011 and to separate the experience into the new rating group.
MERCER Appendix D

HealthChoices RISK-ADJUSTED RATES MANUAL V2.4 COMMONWEALTH OF PENNSYLVANIA
Appendix D.4 – Unadjusted plan factor development2011b Risk Adjustment
Unadjusted Plan Factor Development Southeast Zone: XYZ Health PlanApplication Period:
July 2011 Philadelphia County
TANF Age 1+ HB Children HB Mothers7 SSI and Healthy Horizons Federal GAAuto-assignees5 Choosers6 Auto-assignees5 Choosers6 All Recipients Auto-assignees5 Choosers6 Auto-assignees5 Choosers6
Scored Recipients1 10,000 25,000 101 9,866 324 1,900 15,000 319 1,500 Unscored Recipients2 1,200 3,800 15 1,924 270 50 839 46 560 Scored Member Months3 115,000 292,500 1,182 115,432 3,402 21,850 175,500 3,669 17,550 Maximum Member Months4 134,400 345,600 1,392 141,480 7,128 23,400 190,068 4,380 24,720 Member Month Scored Percentage* 85% 84% 84% 81% 47% 93% 92% 83% 70%MCO Credibility Percentage 100% 100% 96% 100% 88% 100% 100% 100% 100%Scored Average Risk Score 1.2750 1.3236 0.9281 0.9985 1.0022 0.9828 1.1953 0.8358 1.0122 Region-wide Average Risk Score 1.1371 1.2285 0.8702 0.9742 0.9990 0.9421 1.0968 0.8129 1.0081 Unscored Assumed Risk Score 1.2750 1.3236 0.9258 0.9985 1.0018 0.9828 1.1953 0.8358 1.0122
Recipients Risk Score Recipients Risk Score Risk Score Recipients Risk Score Recipients Risk ScoreScored Auto-assignees 10,000 1.2750 101 0.9281 n/a 1,900 0.9828 319 0.8358 Unscored Auto-assignees 1,200 1.2750 15 0.9258 n/a 50 0.9828 46 0.8358 Scored Choosers 25,000 1.3236 9,866 0.9985 n/a 15,000 1.1953 1,500 1.0122 Unscored Choosers 3,800 1.3236 1,924 0.9985 n/a 839 1.1953 560 1.0122 Final Unadjusted Plan Factor 40,000 1.3100 11,906 0.9978 1.0020 17,789 1.1720 2,425 0.9857
4 Surrounding Counties
TANF Age 1+ HB Children HB M th 7 SSI and Healthy Horizons Federal GATANF Age 1+ HB Children HB Mothers7 SSI and Healthy Horizons Federal GAAuto-assignees5 Choosers6 Auto-assignees5 Choosers6 All Recipients Auto-assignees5 Choosers6 Auto-assignees5 Choosers6
Scored Recipients1 4,000 10,027 103 6,599 230 1,503 7,020 69 482 Unscored Recipients2 973 1,900 32 1,672 342 97 850 8 172 Scored Member Months3 46,000 115,311 1,185 75,889 2,415 17,285 80,730 794 5,543 Maximum Member Months4 59,676 143,124 1,620 99,252 6,864 19,200 94,440 924 7,848 Member Month Scored Percentage* 77% 80% 73% 76% 35% 90% 85% 85% 70%MCO Credibility Percentage 100% 100% 96% 100% 40% 100% 100% 32% 100%Scored Average Risk Score 1.2008 1.3362 0.7938 0.8679 0.8314 0.9530 0.9223 0.8737 1.0655 Region-wide Average Risk Score 1.1163 1.2975 0.6983 0.8527 0.8535 0.8561 0.9127 0.8947 1.0129 Unscored Assumed Risk Score 1.2008 1.3362 0.7900 0.8679 0.8447 0.9530 0.9223 0.8880 1.0655
Recipients Risk Score Recipients Risk Score Risk Score Recipients Risk Score Recipients Risk ScoreScored Auto-assignees 4,000 1.2008 103 0.7938 n/a 1,503 0.9530 69 0.8737 Unscored Auto-assignees 973 1.2008 32 0.7900 n/a 97 0.9530 8 0.8880 Scored Choosers 10,027 1.3362 6,599 0.8679 n/a 7,020 0.9223 482 1.0655 Unscored Choosers 1,900 1.3362 1,672 0.8679 n/a 850 0.9223 172 1.0655 Final Unadjusted Plan Factor 16,900 1.2964 8,406 0.8667 0.8393 9,470 0.9275 731 1.0454
¹ Scored Recipients are the count of individuals that are eligible as of July 1, 2011 that were assigned an acuity factor in the 2011b risk assessment.² Unscored Recipients are the count of individuals that are eligible as of July 1, 2011 that were not assigned an acuity factor in the 2011b risk assessment.³ Scored Member Months represent the total number of member months that the scored recipients in XYZ Health Plan accounted for during the 2011b study period.⁴ Maximum Member Months are calculated by multiplying the total recipient count by 12.⁵ Auto-assignees are recipients who were assigned to a PH-MCO. Using the AMC file, they are individuals with an auto-assign indicator of A for all rating groups or M for all rating groups except for Healthy Beginnings.⁶ Choosers are recipients who actively selected a PH-MCO or changed PH-MCOs at some point during their eligibility span. Any individual who is not an Auto-assignee is a Chooser.⁷ Healthy Beginnings Mothers are not subject to the auto-assignee/chooser refinement. However, the assumed risk score for unscored recipients is subject to the blending process for low credibility situations.* Member Month Scored Percentages are calculated by dividing the Scored Member Months by the Maximum Member Months and are rounded down to the nearest whole percentage.
NOTE: MCO Credibility Percentage can be determined using the Credibility Table provided within the 2011b (July through December 2011) Risk-Adjustment Methodology letter.
MERCER Appendix D

HealthChoices RISK-ADJUSTED RATES MANUAL V2.4 COMMONWEALTH OF PENNSYLVANIA
Appendix D.5 – Risk-adjustment results summary
2011b Risk AdjustmentMonthly Report Southeast Zone: XYZ Health Plan
Application Period: July 2011 Philadelphia County
Eligibility Plan FactorsTotal Population Membership PH-MCO Assigned Membership All MCOs Plan Factors/Rates PH-MCO-Specific Plan Factors/Rates
Scored Recipients¹ Total Recipients²Percent of
Population Scored3 Scored Recipients¹ Total Recipients²Percent of
Population Scored3Unadjusted Plan
FactorsBudget Neutral
Plan FactorsUnadjusted Plan
FactorsBudget Neutral
Plan Factors
Rating Group (A) (B) (C) (D) (E) (F) (G) (H) (I) (J)TANF Age 1+ 168,142 188,876 89% 35,000 40,000 87% 1.1958 1.0000 1.3100 1.0955 Healthy Beginnings Age 1+ 45,570 55,118 82% 10,291 12,500 82% 0.9089 1.0000 0.9980 1.0981 SSI and Healthy Horizons 76,047 80,861 94% 16,900 17,789 95% 1.0537 1.0000 1.1720 1.1123 Federal GA 9,434 12,124 77% 1,819 2,425 75% 0.9532 1.0000 0.9857 1.0340 Composite 299,193 336,979 88% 64,010 72,714 88% 1.0000 1.1021
4 Surrounding Counties
Eligibility Plan FactorsTotal Population Membership PH-MCO Assigned Membership All MCOs Plan Factors/Rates PH-MCO-Specific Plan Factors/Rates
Scored Recipients¹ Total Recipients²Percent of
Population Scored3 Scored Recipients¹ Total Recipients²Percent of
Population Scored3Unadjusted Plan
FactorsBudget Neutral
Plan FactorsUnadjusted Plan
FactorsBudget Neutral
Plan Factors
Rating Group (A) (B) (C) (D) (E) (F) (G) (H) (I) (J)TANF Age 1+ 55 942 67 602 82% 14 027 16 900 83% 1 1932 1 0000 1 2964 1 0865TANF Age 1+ 55,942 67,602 82% 14,027 16,900 83% 1.1932 1.0000 1.2964 1.0865 Healthy Beginnings Age 1+ 27,209 35,913 75% 6,932 8,978 77% 0.8701 1.0000 0.8650 0.9941 SSI and Healthy Horizons 33,156 37,879 87% 8,523 9,470 90% 0.8745 1.0000 0.9275 1.0606 Federal GA 2,167 2,925 74% 551 731 75% 1.0088 1.0000 1.0454 1.0363 Composite 118,474 144,319 82% 30,033 36,079 83% 1.0000 1.0600
3Scored percentages are rounded down to the nearest whole percentage.
¹Scored recipients is the count of individuals that are eligible as of July 1, 2011 that were assigned an acuity factor in the 2011b risk assessment.²Total recipients is the count of individuals based on their July 1, 2011 enrollment.
MERCER Appendix D

HealthChoices RISK-ADJUSTED RATES MANUAL V2.4 COMMONWEALTH OF PENNSYLVANIA
Appendix D.6 – Capitation rate summary
Southeast Zone: XYZ Health Plan Capitation Rates - For the Month of July 2011
Philadelphia County Maternity Care Payment
Base Capitation Rate
Risk AdjustedRate
Capitation Payment Rate
DPW Payment Rate Obligation, Per
Member Per Day
Risk Sharing Withhold Risk Pool Provider Pay for
Performance
TANF/HB Less Than 2 Months $3,800.00 $4,007.86 $4,007.86 $129.286 $1.40 $13.00 $1.00
TANF/HB 2 Through 11 Months $350.00 $366.84 $366.84 $11.834 $1.40 $13.00 $1.00
TANF Age 1+ $175.00 $191.71 $191.71 $6.184 $1.40 $13.00 $1.00
Healthy Beginnings Age 1+ $125.00 $137.26 $137.26 $4.428 $1.40 $13.00 $1.00
SSI and Healthy Horizons $975.00 $1,084.49 $1,084.49 $34.984 $30.00 $60.00 $1.00
Federal GA $900.00 $930.60 $930.60 $30.019 $1.40 $13.00 $1.00
Maternity Care $11,850.00
4 Surrounding Counties Maternity Care Payment
Base Capitation Rate
Risk AdjustedRate
Capitation Payment Rate
DPW Payment Rate Obligation, Per
Member Per Day
Risk Sharing Withhold Risk Pool Provider Pay for
Performance
TANF/HB Less Than 2 Months $3,350.00 $3,568.76 $3,568.76 $115.121 $1.40 $13.00 $1.00
TANF/HB 2 Through 11 Months $275.00 $293.98 $293.98 $9.483 $1.40 $13.00 $1.00
Capitation Payment Rate Calculation Applicable Withhold Amounts
TANF Age 1+ $200.00 $217.30 $217.30 $7.010 $1.40 $13.00 $1.00
Healthy Beginnings Age 1+ $125.00 $124.26 $124.26 $4.008 $1.40 $13.00 $1.00
SSI and Healthy Horizons $875.00 $928.03 $928.03 $29.936 $30.00 $60.00 $1.00
Federal GA $1,050.00 $1,088.12 $1,088.12 $35.101 $1.40 $13.00 $1.00
Maternity Care $11,550.00
*These rates were developed using Rate Setting Methodology #2 - Use of Managed Care Data. An overview of this methodology is found in the HealthChoices Agreement.
MERCER Appendix D

HealthChoices RISK-ADJUSTED RATES MANUAL V2.4 COMMONWEALTH OF PENNSYLVANIA
Appendix D.7 – Newborn prevalence report2011b Risk Adjustment
Risk Category Distribution XYZ Health PlanNewborn Selection Period†: Southeast Zone
June 1, 2009 through May 30, 2010 Philadelphia CountyTANF/HB 2 Through 11 Months
XYZ Health Plan All MCOs
TANF Child Weight
Diagnostic Impact Rank
Number of Eligible Months With CDPS+Rx
Category¹
Percent of Eligible Months With CDPS+Rx
Category
Number of Eligible Months With CDPS+Rx
Category¹
Percent of Eligible Months With CDPS+Rx
CategoryCDPS+Rx Category (A) (B) (C1) (C2) (D1) (D2)Demographic CategoriesAge Under 1 3.307 n/a 30,000 100.00% 136,443 100.00%
Diagnostic CategoriesCardiovascular, very high 27.150 19 30 0.10% 147 0.11%Cardiovascular, medium 6.624 9 300 1.00% 1,078 0.79%Cardiovascular, low 3.655 2 1,500 5.00% 6,198 4.54%Cardiovascular, extra low 0.853 43 33 0.11% 121 0.09%Psychiatric, high 1.657 61 - 0.00% - 0.00%Psychiatric, medium 1.124 54 15 0.05% 33 0.02%Psychiatric, medium low 0.425 48 27 0.09% 135 0.10%Psychiatric, low 0.260 51 42 0.14% 171 0.13%Skeletal, medium 2.466 12 672 2.24% 2,361 1.73%Skeletal, low 0.945 15 1,383 4.61% 5,344 3.92%Skeletal, very low 0.692 7 3,000 10.00% 11,124 8.15%Central nervous system, high 10.256 24 54 0.18% 187 0.14%Central nervous system, medium 3.419 29 51 0.17% 243 0.18%Central nervous system, low 2.096 8 987 3.29% 3,636 2.66%Pulmonary, very high - n/a - 0.00% - 0.00%Pulmonary, high 10.747 14 126 0.42% 504 0.37%Pulmonary, medium 5.680 3 987 3.29% 3,972 2.91%Pulmonary, low 0.850 4 2,961 9.87% 14,425 10.57%Gastrointestinal, high 13.654 17 60 0.20% 305 0.22%Gastrointestinal, medium 4.634 21 135 0.45% 582 0.43%Gastrointestinal, low 2.016 1 6,000 20.00% 22,062 16.17%Diabetes, type 1 high - n/a - 0.00% - 0.00%Diabetes, type 1 medium - n/a - 0.00% - 0.00%Diabetes, type 2 medium - n/a - 0.00% - 0.00%Diabetes, type 2 low 2.238 36 27 0.09% 147 0.11%Skin, high 6.835 39 9 0.03% 26 0.02%Skin, low 1.365 42 18 0.06% 81 0.06%Skin, very low 0.656 13 1,800 6.00% 8,278 6.07%Renal, extra high 6.995 46 3 0.01% 10 0.01%Renal, very high 6.995 35 15 0.05% 52 0.04%Renal, medium 4.102 40 18 0.06% 42 0.03%Renal, low 0.898 37 78 0.26% 292 0.21%Substance abuse, low 0.839 31 159 0.53% 615 0.45%Substance abuse, very low 0.184 59 3 0.01% 30 0.02%, yCancer, very high 25.559 61 - 0.00% - 0.00%Cancer, high 8.510 30 9 0.03% 65 0.05%Cancer, medium 2.597 45 12 0.04% 27 0.02%Cancer, low 0.790 53 15 0.05% 50 0.04%Developmental disabilities, medium 4.499 50 - 0.00% 10 0.01%Developmental disabilities, low 1.605 32 72 0.24% 277 0.20%Genital, extra low 1.375 18 789 2.63% 2,908 2.13%Metabolic, high 3.910 28 90 0.30% 293 0.21%Metabolic, medium 2.951 16 285 0.95% 1,476 1.08%Metabolic, very low 1.185 5 2,172 7.24% 7,917 5.80%Eye, low - n/a - 0.00% - 0.00%Eye, very low 1.931 23 336 1.12% 1,315 0.96%Cerebrovascular, low 2.671 38 18 0.06% 86 0.06%AIDS, high 8.002 27 27 0.09% 150 0.11%Infectious, high 6.411 33 24 0.08% 65 0.05%HIV, medium 5.632 22 117 0.39% 478 0.35%Infectious, medium 5.632 10 276 0.92% 1,204 0.88%Infectious, low 0.758 6 2,945 9.82% 12,062 8.84%Hematological, extra high 16.597 34 3 0.01% 22 0.02%Hematological, very high 5.189 20 129 0.43% 586 0.43%Hematological, medium 2.553 11 711 2.37% 2,599 1.90%Hematological, low 2.553 25 138 0.46% 617 0.45%
Pharmacy CategoriesAnti-coagulants 6.624 47 3 0.01% 10 0.01%Cardiac 0.853 57 6 0.02% 12 0.01%Depression / Psychosis / Bipolar 0.260 60 8 0.03% 17 0.01%Diabetes 2.238 55 - 0.00% 9 0.01%ESRD / Renal 6.995 52 2 0.01% 6 0.00%Hemophilia / von Willebrands 16.597 61 - 0.00% - 0.00%Hepatitis 5.632 61 - 0.00% - 0.00%HIV 5.632 26 39 0.13% 225 0.16%Infections, high 6.411 41 6 0.02% 25 0.02%Inflammatory / Autoimmune 0.692 61 - 0.00% - 0.00%Malignancies 2.597 49 3 0.01% 20 0.01%Multiple Sclerosis / Paralysis 3.419 61 - 0.00% - 0.00%Parkinson's / Tremor 2.096 58 - 0.00% 3 0.00%Seizure disorders 2.096 44 9 0.03% 40 0.03%Tuberculosis 0.850 56 3 0.01% 19 0.01%
Population StatisticsNo Claims (FFS/Encounter) Data 315 1.05% 2,293 1.68%No Classified Disease Categories 13,815 46.05% 65,149 47.75%
Member Months² Plan Factor Member Months² Plan Factor
Risk-Adjustment Results (E) (F) (G) (H)Unadjusted 35,000 5.1321 162,072 4.8966 Budget Neutral 1.0481 1.0000
†For more details regarding the Newborn Selection Period, see the 2011b Risk-Adjustment Methodology letter.¹Eligible member months are based on monthly member enrollment from 2 through 11 months of life.²Estimated by annualizing the actual first quarter 2011 member months.
MERCER Appendix D

HealthChoices RISK-ADJUSTED RATES MANUAL V2.4 COMMONWEALTH OF PENNSYLVANIA
MERCER
Appendix E
Appendix E Potential Data Improvement Activities On-site reviews were held with each PH-MCO contractor to evaluate the contractor’s overall operations that could influence the encounter data reporting to the Commonwealth and the resulting risk scores. A byproduct of these reviews was a summarized list of the potential data improvement opportunities. This list may be helpful as PH-MCOs develop or review their strategic plan for improving encounter submissions. While evaluating improvement opportunities, the PH-MCOs should verify that none of the selected strategies violate the rule established in MCOPS Memo #06/2010-011, which disallows any records that were altered, adjusted or submitted by an MCO without supporting documentation from the submitting provider who originated the medical service. Data Case Studies to Identify Areas of Data Loss or Inaccuracies • Evaluate sources (providers) submitting invalid or generic (e.g., 799.9) diagnoses • Measure changes in member disease conditions over time • Compare pharmaceutical utilization to reported medical diagnoses • Assess consistency with medical management information such as:
Disease management rosters Health risk-assessment surveys Application of other risk-assessment tool(s)
• Perform medical chart reviews to assess data completeness and/or validate diagnoses • Audit diagnoses and/or records from claim receipt to encounter submission • Compare encounters to financial reports for consistency • Identify services that should have been accompanied by an office or physician visit such as:
Ancillary service Inpatient stay Emergency room visit Specialist visit Prescription filled
Provider Education and Assistance • Educate providers on the importance of diagnostic reporting and encounter submissions • Share study findings and rank performance • Form provider workgroups to identify encounter submittal barriers • Provide standardized claim forms with chronic condition focus • Institute a corrective action plan for poor diagnostic reporters • Enhance provider profiling applications to include a risk measurement component • Distribute a mailing with helpful clinical and encounter information • Provide access to a web-based encounter portal for easier data submission • Provide member outreach assistance for patients that are not accessing preventative services
or scheduling annual appointments for individuals with chronic conditions • Develop a recognition program that rewards providers for meeting established goals, which
can be measured using claims/encounter data

HealthChoices RISK-ADJUSTED RATES MANUAL V2.4 COMMONWEALTH OF PENNSYLVANIA
MERCER
Appendix E
Reimbursement-Related Strategies • Implement incentive payments for each encounter submission, which are generally more
effective when payments are made at intervals throughout the year rather than with each encounter
• Impose sanctions to sub-par encounter submitters • Move sub-par capitated providers to FFS • Discontinue contracts with sub-par encounter submitters • Risk adjust provider payments • As a short term incentive, payments may be made to providers that revisit medical charts for
potentially incorrect or missing diagnoses, when the payment is not contingent upon the identification of additional diagnoses
PH-MCO Operations • Impose stricter edits on diagnostic reporting • Ensure acceptance/transfer of all available diagnostic positions • Implement audit procedures to compare claims and encounters on a regular basis • Submit header-level diagnoses • Track encounters against transactional reports from the Commonwealth • Create a suite of reports for regular encounter submittal monitoring • Strengthen vendor contracts for improved encounter submissions • Ensure all valid services are being submitted as encounters such as:
Capitated services Records where another entity is entirely responsible for the service PH-MCO determined edit failures awaiting correction from providers Other reasons for non-submittal
• Submit voids and adjustment to ensure accurate information exists within PROMISe • Perform targeted audits to identify situations more likely to have inaccurate data
(i.e., handwritten claims) • Strengthen vendor oversight by reviewing vendor data for accuracy prior to PROMISe
submission • Utilize software to customize pre-claim edits that can be used to identify data anomalies Long-Term Management Strategies Review emerging patterns from case studies to develop a strategy • Measure effectiveness of initiatives by updating case studies • Create a long term strategy/workplan (3–5 years) • Form an encounter workgroup comprised of management, claims and encounter staff • Develop a “sign off” process for data users to agree to data accuracy • Offer a suggestion box to share ideas throughout the organization • Assess new strategies on a pilot basis to understand reporting and financial ramifications • Create a workgroup to prepare for system changes and track progress using a work plan

HealthChoices RISK-ADJUSTED RATES MANUAL V2.4 COMMONWEALTH OF PENNSYLVANIA
MERCER
Appendix F
Appendix F PH-MCO Risk Score Credibility Grid The grid on the following page is used to assign assumed risk scores to a PH-MCO’s unscored population in situations where the PH-MCO’s scored population is between 0% and 100% credible. The assumed risk score for the unscored population is calculated by blending the average risk score of the PH-MCO’s scored recipients with the average risk score of the region-wide scored recipients. To use the grid, locate the cell that corresponds to the row with the appropriate count of scored member months and the column with the appropriate member month scored percentage (rounded down) for the population. The resulting percentage is the percentage to apply to the average risk score of the PH-MCO’s scored recipients. The remaining percentage is applied to the average risk score of the region-wide scored recipients. Both percentages sum to 100%.

HealthChoices RISK-ADJUSTED RATES MANUAL V2.4 COMMONWEALTH OF PENNSYLVANIA
Appendix F - PH-MCO risk score credibility gridMember Month Scored Percentage
≤ 25% 26% 27% 28% 29% 30% 31% 32% 33% 34% 35% 36% 37% 38% 39% 40% 41% 42% 43% 44% 45% 46% 47% 48% 49% ≥ 50%< 612 0% 0% 0% 0% 0% 0% 0% 0% 0% 0% 0% 0% 0% 0% 0% 0% 0% 0% 0% 0% 0% 0% 0% 0% 0% 0%
612-623 0% 0% 0% 0% 0% 0% 0% 0% 0% 0% 0% 0% 0% 1% 1% 1% 1% 1% 1% 1% 1% 1% 1% 1% 1% 2%624-635 0% 0% 0% 0% 0% 0% 0% 1% 1% 1% 1% 1% 1% 2% 2% 2% 2% 2% 2% 3% 3% 3% 3% 3% 3% 4%636-647 0% 0% 0% 0% 0% 1% 1% 1% 1% 2% 2% 2% 2% 3% 3% 3% 3% 4% 4% 4% 4% 5% 5% 5% 5% 6%648-659 0% 0% 0% 0% 1% 1% 1% 2% 2% 2% 3% 3% 3% 4% 4% 4% 5% 5% 5% 6% 6% 6% 7% 7% 7% 8%660-671 0% 0% 0% 1% 1% 2% 2% 2% 3% 3% 4% 4% 4% 5% 5% 6% 6% 6% 7% 7% 8% 8% 8% 9% 9% 10%672-683 0% 0% 0% 1% 1% 2% 2% 3% 3% 4% 4% 5% 5% 6% 6% 7% 7% 8% 8% 9% 9% 10% 10% 11% 11% 12%684-695 0% 0% 1% 1% 2% 2% 3% 3% 4% 5% 5% 6% 6% 7% 7% 8% 8% 9% 10% 10% 11% 11% 12% 12% 13% 14%696-707 0% 0% 1% 1% 2% 3% 3% 4% 5% 5% 6% 7% 7% 8% 8% 9% 10% 10% 11% 12% 12% 13% 14% 14% 15% 16%708-719 0% 0% 1% 2% 2% 3% 4% 5% 5% 6% 7% 7% 8% 9% 10% 10% 11% 12% 12% 13% 14% 15% 15% 16% 17% 18%720-731 0% 0% 1% 2% 3% 4% 4% 5% 6% 7% 8% 8% 9% 10% 11% 12% 12% 13% 14% 15% 16% 16% 17% 18% 19% 20%732-743 0% 0% 1% 2% 3% 4% 5% 6% 7% 7% 8% 9% 10% 11% 12% 13% 14% 14% 15% 16% 17% 18% 19% 20% 21% 22%744-755 0% 0% 1% 2% 3% 4% 5% 6% 7% 8% 9% 10% 11% 12% 13% 14% 15% 16% 17% 18% 19% 20% 21% 22% 23% 24%756-767 0% 1% 2% 3% 4% 5% 6% 7% 8% 9% 10% 11% 12% 13% 14% 15% 16% 17% 18% 19% 20% 21% 22% 23% 24% 26%768-779 0% 1% 2% 3% 4% 5% 6% 7% 8% 10% 11% 12% 13% 14% 15% 16% 17% 19% 20% 21% 22% 23% 24% 25% 26% 28%780-791 0% 1% 2% 3% 4% 6% 7% 8% 9% 10% 12% 13% 14% 15% 16% 18% 19% 20% 21% 22% 24% 25% 26% 27% 28% 30%792-803 0% 1% 2% 3% 5% 6% 7% 8% 10% 11% 12% 14% 15% 16% 17% 19% 20% 21% 23% 24% 25% 26% 28% 29% 30% 32%804-815 0% 1% 2% 4% 5% 6% 8% 9% 10% 12% 13% 14% 16% 17% 19% 20% 21% 23% 24% 25% 27% 28% 29% 31% 32% 34%816-827 0% 1% 2% 4% 5% 7% 8% 10% 11% 12% 14% 15% 17% 18% 20% 21% 23% 24% 25% 27% 28% 30% 31% 33% 34% 36%828-839 0% 1% 3% 4% 6% 7% 9% 10% 12% 13% 15% 16% 18% 19% 21% 22% 24% 25% 27% 28% 30% 31% 33% 34% 36% 38%840-851 0% 1% 3% 4% 6% 8% 9% 11% 12% 14% 16% 17% 19% 20% 22% 24% 25% 27% 28% 30% 32% 33% 35% 36% 38% 40%852-863 0% 1% 3% 5% 6% 8% 10% 11% 13% 15% 16% 18% 20% 21% 23% 25% 26% 28% 30% 31% 33% 35% 36% 38% 40% 42%864-875 0% 1% 3% 5% 7% 8% 10% 12% 14% 15% 17% 19% 21% 22% 24% 26% 28% 29% 31% 33% 35% 36% 38% 40% 42% 44%876-887 0% 1% 3% 5% 7% 9% 11% 12% 14% 16% 18% 20% 22% 23% 25% 27% 29% 31% 33% 34% 36% 38% 40% 42% 44% 46%M
onth
s
888-899 0% 1% 3% 5% 7% 9% 11% 13% 15% 17% 19% 21% 23% 24% 26% 28% 30% 32% 34% 36% 38% 40% 42% 44% 46% 48%900-911 0% 2% 4% 6% 8% 10% 12% 14% 16% 18% 20% 22% 24% 26% 28% 30% 32% 34% 36% 38% 40% 42% 44% 46% 48% 50%912-923 0% 2% 4% 6% 8% 10% 12% 14% 16% 18% 20% 22% 24% 27% 29% 31% 33% 35% 37% 39% 41% 43% 45% 47% 49% 52%924-935 0% 2% 4% 6% 8% 10% 12% 15% 17% 19% 21% 23% 25% 28% 30% 32% 34% 36% 38% 41% 43% 45% 47% 49% 51% 54%936-947 0% 2% 4% 6% 8% 11% 13% 15% 17% 20% 22% 24% 26% 29% 31% 33% 35% 38% 40% 42% 44% 47% 49% 51% 53% 56%948-959 0% 2% 4% 6% 9% 11% 13% 16% 18% 20% 23% 25% 27% 30% 32% 34% 37% 39% 41% 44% 46% 48% 51% 53% 55% 58%960-971 0% 2% 4% 7% 9% 12% 14% 16% 19% 21% 24% 26% 28% 31% 33% 36% 38% 40% 43% 45% 48% 50% 52% 55% 57% 60%972-983 0% 2% 4% 7% 9% 12% 14% 17% 19% 22% 24% 27% 29% 32% 34% 37% 39% 42% 44% 47% 49% 52% 54% 57% 59% 62%984-995 0% 2% 5% 7% 10% 12% 15% 17% 20% 23% 25% 28% 30% 33% 35% 38% 40% 43% 46% 48% 51% 53% 56% 58% 61% 64%
996-1007 0% 2% 5% 7% 10% 13% 15% 18% 21% 23% 26% 29% 31% 34% 36% 39% 42% 44% 47% 50% 52% 55% 58% 60% 63% 66%1008-1019 0% 2% 5% 8% 10% 13% 16% 19% 21% 24% 27% 29% 32% 35% 38% 40% 43% 46% 48% 51% 54% 57% 59% 62% 65% 68%1020-1031 0% 2% 5% 8% 11% 14% 16% 19% 22% 25% 28% 30% 33% 36% 39% 42% 44% 47% 50% 53% 56% 58% 61% 64% 67% 70%1032-1043 0% 2% 5% 8% 11% 14% 17% 20% 23% 25% 28% 31% 34% 37% 40% 43% 46% 48% 51% 54% 57% 60% 63% 66% 69% 72%1044-1055 0% 2% 5% 8% 11% 14% 17% 20% 23% 26% 29% 32% 35% 38% 41% 44% 47% 50% 53% 56% 59% 62% 65% 68% 71% 74%1056-1067 0% 3% 6% 9% 12% 15% 18% 21% 24% 27% 30% 33% 36% 39% 42% 45% 48% 51% 54% 57% 60% 63% 66% 69% 72% 76%1068-1079 0% 3% 6% 9% 12% 15% 18% 21% 24% 28% 31% 34% 37% 40% 43% 46% 49% 53% 56% 59% 62% 65% 68% 71% 74% 78%1080-1091 0% 3% 6% 9% 12% 16% 19% 22% 25% 28% 32% 35% 38% 41% 44% 48% 51% 54% 57% 60% 64% 67% 70% 73% 76% 80%1092-1103 0% 3% 6% 9% 13% 16% 19% 22% 26% 29% 32% 36% 39% 42% 45% 49% 52% 55% 59% 62% 65% 68% 72% 75% 78% 82%1104-1115 0% 3% 6% 10% 13% 16% 20% 23% 26% 30% 33% 36% 40% 43% 47% 50% 53% 57% 60% 63% 67% 70% 73% 77% 80% 84%1116-1127 0% 3% 6% 10% 13% 17% 20% 24% 27% 30% 34% 37% 41% 44% 48% 51% 55% 58% 61% 65% 68% 72% 75% 79% 82% 86%1128-1139 0% 3% 7% 10% 14% 17% 21% 24% 28% 31% 35% 38% 42% 45% 49% 52% 56% 59% 63% 66% 70% 73% 77% 80% 84% 88%1140-1151 0% 3% 7% 10% 14% 18% 21% 25% 28% 32% 36% 39% 43% 46% 50% 54% 57% 61% 64% 68% 72% 75% 79% 82% 86% 90%1152-1163 0% 3% 7% 11% 14% 18% 22% 25% 29% 33% 36% 40% 44% 47% 51% 55% 58% 62% 66% 69% 73% 77% 80% 84% 88% 92%1164-1175 0% 3% 7% 11% 15% 18% 22% 26% 30% 33% 37% 41% 45% 48% 52% 56% 60% 63% 67% 71% 75% 78% 82% 86% 90% 94%1176-1187 0% 3% 7% 11% 15% 19% 23% 26% 30% 34% 38% 42% 46% 49% 53% 57% 61% 65% 69% 72% 76% 80% 84% 88% 92% 96%1188-1199 0% 3% 7% 11% 15% 19% 23% 27% 31% 35% 39% 43% 47% 50% 54% 58% 62% 66% 70% 74% 78% 82% 86% 90% 94% 98%≥ 1200 0% 4% 8% 12% 16% 20% 24% 28% 32% 36% 40% 44% 48% 52% 56% 60% 64% 68% 72% 76% 80% 84% 88% 92% 96% 100%
Scor
ed M
embe
r
MERCER Appendix F
Services Provided by Mercer Health & Benefits LLC.
Mercer (US) Inc. 2325 East Camelback Road, Suite 600 Phoenix, AZ 85016 +1 602 522 6500