Embed Size (px)
Citation preview
Healthcare Systems and Services Practice
Provider scale strategies: A 2018 update on the evolving landscapeScott Lichtenberger, MD; Rupal Malani, MD; Neha Patel; and Saum Sutaria, MD
April 2018

1
is delivered. Today’s health systems recognize
a growing need for network adequacy if they
are to capture greater share in a risk-based
world, and are beginning to appreciate that
they cannot rely solely on traditional economies
of scale if they are to withstand the pressures
on their profitability and balance sheets.
However, a comprehensive analysis of recent
provider deals reveals that the landscape
is evolving in several important ways, with
important implications for the future of health
system M&A. In particular, three trends have
emerged from the most recent wave of
consolidation:
• Midsize systems—those with $1 billion to
$5 billion in revenues—are now in the lead
as both buyers and targets, and they are
focusing significantly on in-market scale.
• The number of small health systems
(those with less than $1 billion in revenues)
is dwind ling, and most that remain are not
ideal acqui sition targets.
• Health systems are becoming increas-
ingly deliberate about what they hope to
achieve through M&A and have pursued
strategic and opportunistic acquisition
patterns that go beyond just adding more
acute care beds.
In this article, we discuss these trends,
their implications for health systems, and key
issues provider executives should consider.
Although proposed mergers involving large
health insurers have garnered most of the
headlines last year, provider M&A deal volume
remains strong. On average, in the past five
years, more than 70 deals were struck annually
(Exhibit 1), up from about 60 per year in the
previous five years.
Although deal volumes have decreased
slightly, deal value has increased (Exhibit 2).
Average annual revenues per acquired hospi-
tal also grew, from $99 million to $168 million.
The growth in deal value reflects the overall
increase in provider consolidation, not just
the impact of a few especially large deals.
The three large provider mergers that occurred
in 2016 and 2017 accounted for less than 25%
of the aggregate revenues ($89 billion) of all
health systems targeted for M&A between
2014 and 2017.1
In the past several years, health systems have
also been growing through non-M&A deals
such as joint ventures and partnerships. These
capital-light deals are often struck not only to
achieve scale benefits but also to improve care
coordination, attract and retain physicians, or
better position the organization for value-based
contractual arrangements (e.g., accountable
care organizations).
The increase in provider deal activity has been
prompted by a range of industry changes, in-
cluding payer consolidation, the emergence of
narrow networks, rising regulatory pressures
and compliance costs, and shifts in where care
Provider scale strategies: A 2018 update on the evolving landscapeM&A remains an important option for health systems, but targets and strategies are shifting. While traditional economies of scale will continue to be a strong stimulus for M&A, providers will likely seek and achieve value creation much differently in the future.
Scott Lichtenberger, MD; Rupal Malani, MD; Neha Patel; and Saum Sutaria, MD
1 The mergers between Dignity and CHI, Kennedy Health and Jefferson Health, and Aurora Health and Advocate Health had aggregate target rev-enues of about $22 billion.
2McKinsey & Company Healthcare Systems and Services Practice
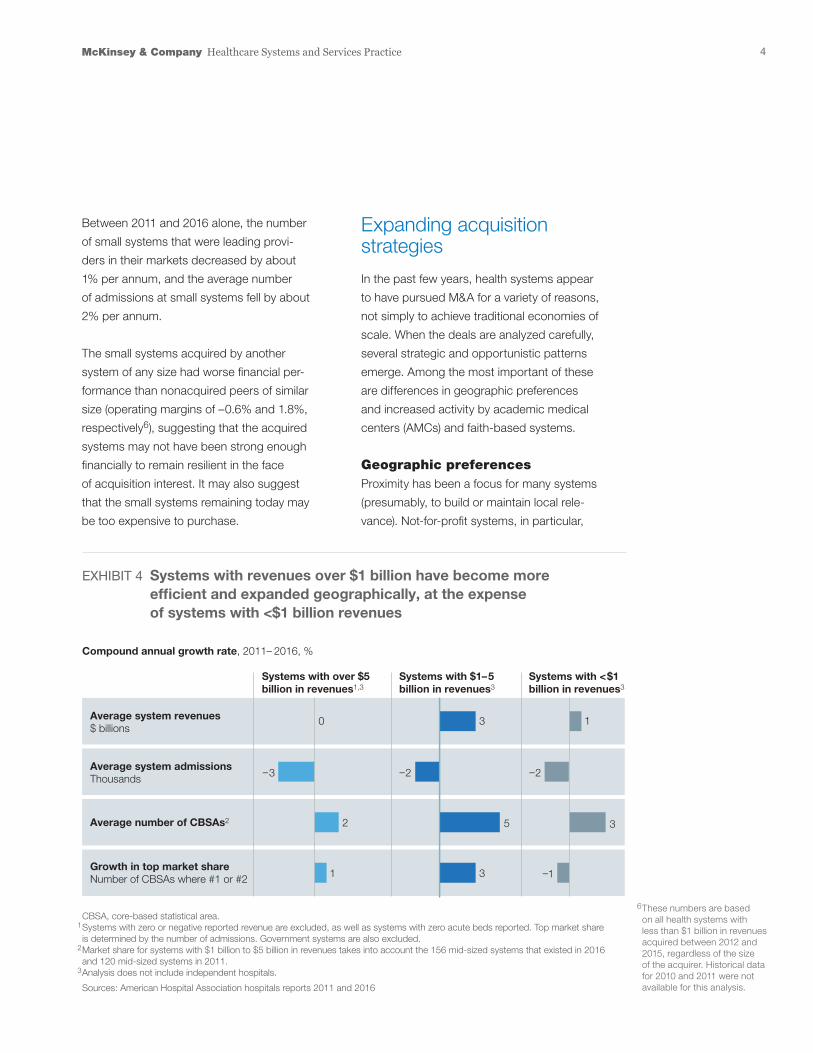
Midsize systems were either the first- or second-
largest care provider in 444 core-based statisti-
cal areas (CBSAs) in 2011 but in 521 CBSAs in
2016 (Exhibit 4). On average, midsize systems
today operate in three markets and have a 36%
share of inpatient admissions within those mar-
kets; the com parable figures for large systems
are 17 markets and 36% share.
In the past five years, midsize systems have
been more active as buyers than large sys-
tems, and have been acquisition targets more
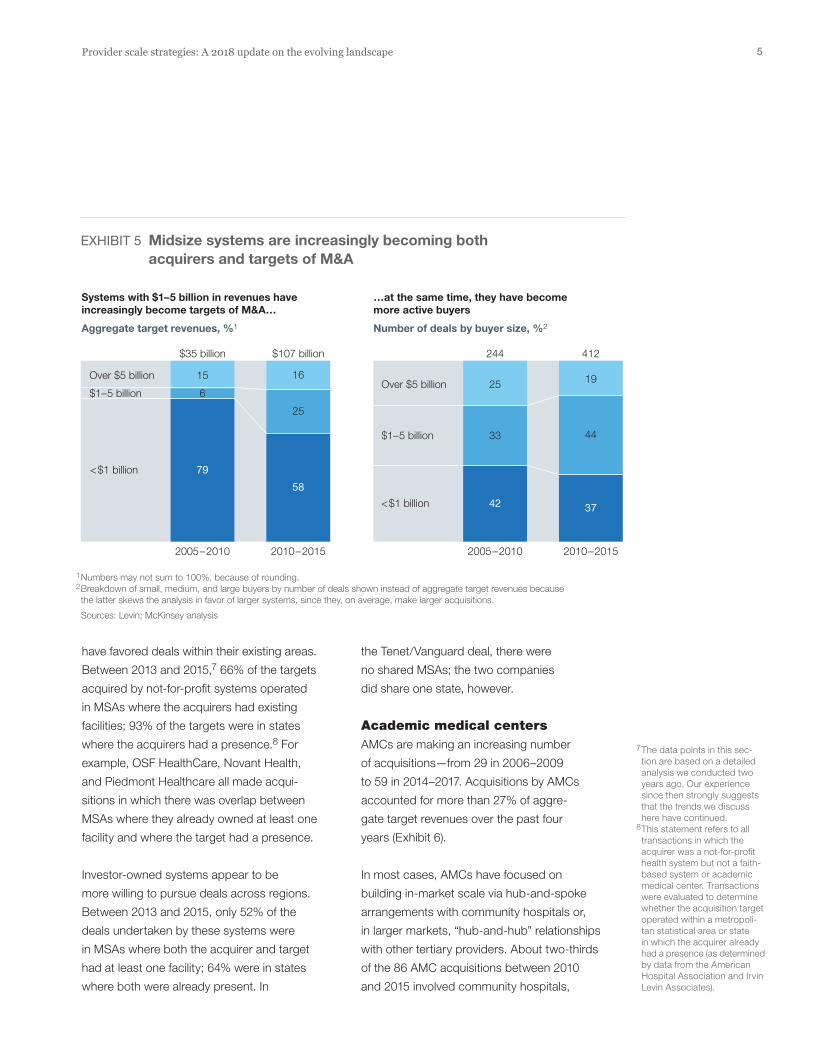
often than small systems (Exhibit 5). The shift
may reflect a change in strategy at some mid-
size systems. Rather than acquiring relatively
underperforming smaller assets as a way to
add acute care beds, some midsize systems
may be pursuing M&A with similarly sized play-
ers to improve their scale and performance.
Rise of the midsize systems
Despite the increase in deal activity, the provider
landscape remains comparatively fragmented,
especially when compared to other segments of
the healthcare industry. The top 20 health systems’
share of overall admissions rose only from 24%
to 28% between 2011 and 2016 (Exhibit 3).
Part of the reason the provider industry remains
fragmented is that most deals in recent years—
especially since 2013—have involved small or
midsize health systems. Between 2011 and
2016, the number of midsize systems increased
by about 30%,2 and these systems now account
for about 42% of all US health systems. Although
some midsize systems have expanded their
geographic reach,3 much of the consolidation
has been within existing and adjacent markets.
Provider Scale Strategies — 2018 Provider Compendium
Exhibit 1 of 7
Number of deals1
2006 2007 2008 2009 2010 2011 2012 2013 2014 2015 2016 2017
44
5147
41
53
76
91
71
8379
6966
EXHIBIT 1 M&A hospital deal volumes are slowing slightly
1 Only deals involving a hospital or health system target are included. Acquirer is either a private equity investor or hospital/health system; private equity investments are either buy-outs or add-on investments. Does not include joint ventures and partnerships, or deals involving specialty hospitals (e.g., behavioral, rehab, inpatient cancer facilities etc.). Each can include more than one hospital but is counted as a single instance.
Sources: CapitalIQ; Dealogic; Levin; McKinsey analysis
2 Analysis does not include independent hospitals (those not part of a health system).
3 Midsize systems covered 445 core-based statistical areas (CBSAs) in 2016, compared with 380 CBSAs in 2011.
3Provider scale strategies: A 2018 update on the evolving landscape
Dwindling number of attractive small systems
In the past decade, the number of small
health systems has dropped,5 and those that
do remain cover fewer geographic areas and
are less likely to be market leaders (Exhibit 4).
The midsize systems acquired during the past
three years had an average operating margin
of 3.8%,4 close to the average of nonacquired
peers of similar size. By contrast, the average
operating margin was –2.1% among the small
systems acquired by midsize players and 1.8%
among their nonacquired peers.
Provider Scale Strategies — 2018 Provider Compendium
Exhibit 2 of 7
Aggregate revenues of M&A targets
$ billions
Total number of hospitals acquired
Number
Average revenue/hospital acquired
$ millions
2006to
2009
2010to
2013
2014to
2017
2006to
2009
2010to
2013
2014to
2017
2006to
2009
2010to
2013
2014to
2017
90
78
28
568
288
168
134
99
EXHIBIT 2 The size of deals have grown significantly
Note: Does not include specialty hospitals (e.g., behavioral, rehabilitation, inpatient cancer facilities). Revenue numbers are in nominal dollars. Medical cost inflation grew by a 3% compound annual growth rate during the 10 years evaluated.
Sources: CapitalIQ; Dealogic; Levin; McKinsey analysis
+69%+97%3.1x
529
Provider Scale Strategies — 2018 Provider Compendium
Exhibit 3 of 7
EXHIBIT 3 Segments across the continuum remain consolidated at varied rates
Sources: American Hospital Association hospitals reports 2011 and 2016; Interstudy 2011 and 2016; Press
Top 4 urgent care players’ market share continued to account for1% from 2011 to 2016
Urgent care
Top 20 health systems’ share of admissions increased 24% to 28% from 2011 to 2016
Hospitals
Top 10 players’ com-mercial market share increased 65% to 67% from 2011 to 2016
Payers
Top 2 players’ market share increased 65% to 84% from 2011 to 2016
Dialysis
Consolidated
Fragmented4 Historical five-year operating-margin data are not available.
5 This statement applies to health systems, not to indivi-dual facilities.
4McKinsey & Company Healthcare Systems and Services Practice
Expanding acquisition strategies
In the past few years, health systems appear
to have pursued M&A for a variety of reasons,
not simply to achieve traditional economies of
scale. When the deals are analyzed carefully,
several strategic and opportunistic patterns
emerge. Among the most important of these
are differences in geographic preferences
and increased activity by academic medical
centers (AMCs) and faith-based systems.
Geographic preferencesProximity has been a focus for many systems
(presumably, to build or maintain local rele-
vance). Not-for-profit systems, in particular,
Between 2011 and 2016 alone, the number
of small systems that were leading provi-
ders in their markets decreased by about
1% per annum, and the average number
of admissions at small systems fell by about
2% per annum.
The small systems acquired by another
system of any size had worse financial per-
formance than nonacquired peers of similar
size (operating margins of –0.6% and 1.8%,
respectively6), suggesting that the acquired
systems may not have been strong enough
financially to remain resilient in the face
of acquisition interest. It may also suggest
that the small systems remaining today may
be too expensive to purchase.
EXHIBIT 4 Systems with revenues over $1 billion have become more efficient and expanded geographically, at the expense of systems with <$1 billion revenues
CBSA, core-based statistical area.1 Systems with zero or negative reported revenue are excluded, as well as systems with zero acute beds reported. Top market share is determined by the number of admissions. Government systems are also excluded.2 Market share for systems with $1 billion to $5 billion in revenues takes into account the 156 mid-sized systems that existed in 2016 and 120 mid-sized systems in 2011.3 Analysis does not include independent hospitals.
Sources: American Hospital Association hospitals reports 2011 and 2016
Provider Scale Strategies — 2018 Provider Compendium
Exhibit 4 of 7
Average system revenues$ billions
Systems with over $5 billion in revenues1,3
Systems with $1–5 billion in revenues3
Systems with <$1 billion in revenues3
Average system admissionsThousands
Growth in top market shareNumber of CBSAs where #1 or #2
Average number of CBSAs2
Compound annual growth rate, 2011– 2016, %
–2
3
–3
–1
2
0 3 1
1 3
–2
5
6 These numbers are based on all health systems with less than $1 billion in revenues acquired between 2012 and 2015, regardless of the size of the acquirer. Historical data for 2010 and 2011 were not available for this analysis.
5Provider scale strategies: A 2018 update on the evolving landscape
the Tenet/Vanguard deal, there were
no shared MSAs; the two companies
did share one state, however.
Academic medical centersAMCs are making an increasing number
of acquisitions—from 29 in 2006–2009
to 59 in 2014–2017. Acquisitions by AMCs
account ed for more than 27% of aggre-
gate target revenues over the past four
years (Exhibit 6).
In most cases, AMCs have focused on
building in-market scale via hub-and-spoke
arrangements with community hospitals or,
in larger markets, “hub-and-hub” relationships
with other tertiary providers. About two-thirds
of the 86 AMC acquisitions between 2010
and 2015 involved community hospitals,
have favored deals within their existing areas.
Between 2013 and 2015,7 66% of the targets
acquired by not-for-profit systems operated
in MSAs where the ac quirers had existing
facilities; 93% of the targets were in states
where the acquirers had a presence.8 For
example, OSF HealthCare, Novant Health,
and Piedmont Healthcare all made acqui-
sitions in which there was overlap between
MSAs where they already owned at least one
facility and where the target had a presence.
Investor-owned systems appear to be
more willing to pursue deals across regions.
Between 2013 and 2015, only 52% of the
deals undertaken by these systems were
in MSAs where both the acquirer and target
had at least one facility; 64% were in states
where both were already present. In
EXHIBIT 5 Midsize systems are increasingly becoming both acquirers and targets of M&A
1 Numbers may not sum to 100%, because of rounding.2 Breakdown of small, medium, and large buyers by number of deals shown instead of aggregate target revenues because the latter skews the analysis in favor of larger systems, since they, on average, make larger acquisitions.
Sources: Levin; McKinsey analysis
Number of deals by buyer size, %2
42 37
Aggregate target revenues, %1
79
58
Provider Scale Strategies — 2018 Provider Compendium
Exhibit 5 of 7
Over $5 billion
2005–2010 2010–2015
$1–5 billion
<$1 billion
244 412
19
44
25
33
2005–2010 2010–2015
Over $5 billion
$1–5 billion
<$1 billion
…at the same time, they have become more active buyers
Systems with $1–5 billion in revenues have increasingly become targets of M&A…
6
15
25
16
$35 billion $107 billion
7 The data points in this sec- tion are based on a detailed analysis we conducted two years ago. Our experience since then strongly suggests that the trends we discuss here have continued.
8 This statement refers to all transactions in which the acquirer was a not-for-profit health system but not a faith-based system or academic medical center. Transactions were evaluated to determine whether the acquisition target operated within a metropoli-tan statistical area or state in which the acquirer already had a presence (as determin ed by data from the American Hospital Association and Irvin Levin Associates).

6McKinsey & Company Healthcare Systems and Services Practice
In 2015, for example, ten of the 14 acquisitions
made by these systems were secular. Recent
examples of faith-based/secular deals include
the St. Mary’s Health Care System acquisition
of Ty Cobb Regional Medical Center in Georgia
and Mercy Medical Center’s acquisition of Skiff
Medical Center in Iowa. A recent example of a
deal involving two faith-based systems is Trinity
Health System’s acquisition of St. Joseph’s
Hospital Health Center in New York.
Implications for providers
Evolution of the M&A landscape has important
implications for provider executives. Here, we
describe the four decisions that are most im-
portant for them to make, as well as the ratio-
nale for each recommendation. Once these
decisions are made, provider executives should
be well positioned to identify appropriate tar-
gets for acquisition.
and about 70% of the acquisitions operated
within 50 miles of their acquirers, which sug-
gests the AMCs are making a network and
referral management play. Recent examples of
AMCs creating in-market scale through acqui-
sitions include the Northwestern/Cadence deal
in Illinois, the Penn Medicine/Lancaster General
Health deal in the Phila delphia area, and Jeffer-
son Health’s multiple acquisitions in that area.
In 13 cases, AMCs targeted other AMCs.
Faith-based systemsFaith-based systems, too, are showing growing
interest in M&A. Acquisitions by faith-based
systems accounted for 25% of aggregate target
revenues from hospital M&A deals between
2014 and 2017, up from 22% in the 2006–2009
period.
Although most faith-based systems are
Catholic, they often acquire secular targets.
Provider Scale Strategies — 2018 Provider Compendium
Exhibit 6 of 7
EXHIBIT 6 AMC and faith-based systems have recently become more acquisitive
AMC, academic medical center.
Sources: CapitalIQ; Dealogic; Levin; McKinsey analysis
Acquisitions by system type, %
Aggregate target revenue
AMC
2006–2009 2010–2013 2014–2017
Religious
Other
$28 billion $78 billion $90 billion
16
29
13
22
6555
27
25
48

7Provider scale strategies: A 2018 update on the evolving landscape
were in the past, given the existing debt on their
balance sheets (they have three times or more the
level of debt of a typical midsize system), as well
as their need to protect cash reserves and, in
some cases, continue integrating existing assets.
Be bolder in realizing synergiesThe imperative to realize value will become increasingly important
The targets’ size and multiples (enterprise
value to revenue) are rising. Because the need
to achieve greater value creation has become
more pressing, provider executives will be
increasingly compelled to identify potential
syn ergies, articulate a deal’s rationale to justify
the purchase price, and then realize the syner-
gies once the deal is completed. Two factors
may hamper their efforts, though. As health
systems grow larger, there are fewer traditional
synergies to capture and more organizational
complexities to deal with.
• Fewer traditional synergies. Many health
systems have realized value from acqui sitions
through traditional synergies (e.g., back-office
administration). Once a health system reaches
scale, however, traditional synergies will deliver
at best only marginal returns, and the remaining
value-creation opportunities will be in areas
more difficult to capture—in particular, those
more clinical in nature. Greater emphasis will
thus need to be placed on clinical integration
of assets to improve care coordination, physi-
cian alignment, and growth, as well as to de-
crease variability in clinical decision making.
• Organizational complexities. A multitude of
challenges are inherent in all large integra-
tions, but the challenges are especially acute
when the integration involves a health system,
rather than a single hospital. Among the
Define your role in the midmarket battleground Consolidation will likely continue, but the players will change
Although the regulatory environment may be-
come increasingly challenging (as the Federal
Trade Commission’s objections to the North-
Shore/Advocate merger suggest), deal activity
will likely continue. We believe three major ac-
quirer archetypes are emerging:
Super-regionals (e.g., Carolinas, Baylor Scott
& White) will continue to expand within existing
and adjacent markets to increase local rele-
vance. Much of the deal activity in the past
few years supports this hypothesis. A number
of midsize systems began to pursue M&A only
recently and have yet to unlock the full benefit
of scale. As a result, a growing number of
super-regionals could emerge.
Academic aggregators (e.g., Partners) will con-
tinue to build on their hub-and-spoke models.
In some cases, the expansion will come in the
form of partnerships, but many AMCs appear
to have a clear preference for full integration to
achieve economies of scale across a larger set
of assets and to gain other benefits. About 100
US AMCs have revenues between $1 billion and
$5 billion. Of these, about 60 currently have limi-
ted networks (zero to two hospitals) beyond their
main teach ing hospital. In all but a single case,
these AMCs have at least one community hospi-
tal within 50 miles they could potentially target.
Nationals (e.g., Tenet, HCA, Ascension, Catholic
Health Initiatives) will likely continue to make
acquisitions within their existing markets and
expand into new markets when it makes sense
to do so. However, these organizations may be
more cautious in pursuing M&A now than they
8McKinsey & Company Healthcare Systems and Services Practice
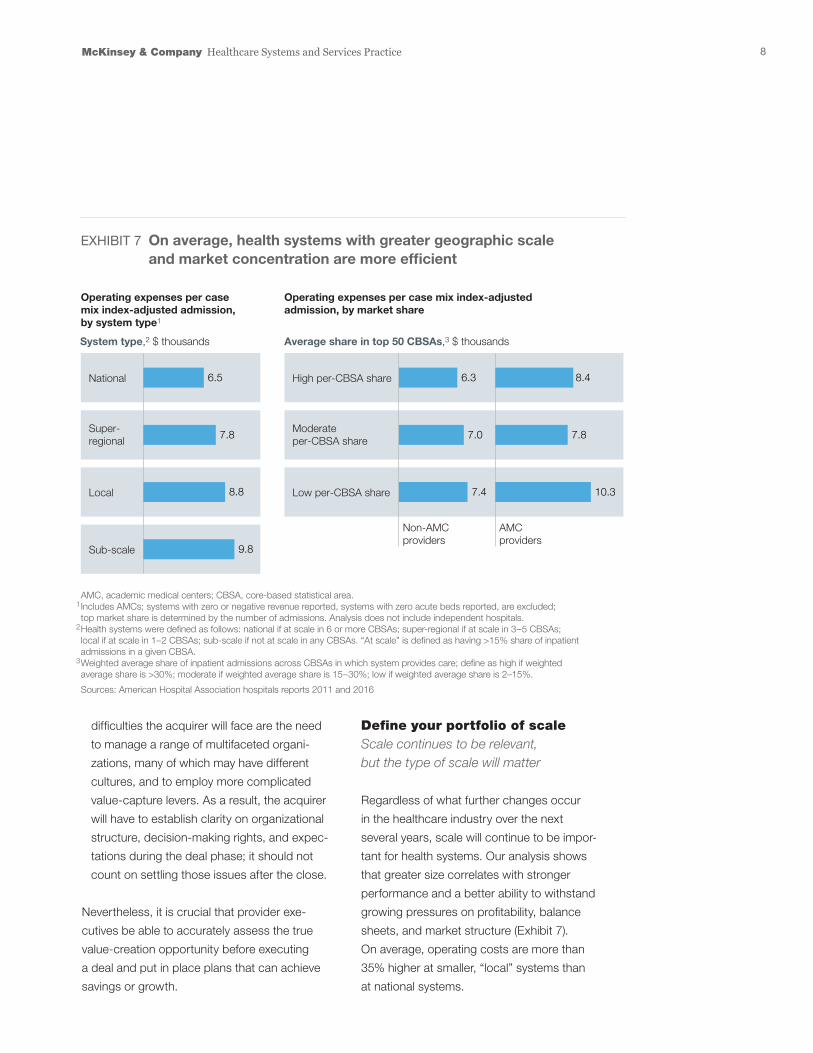
Define your portfolio of scaleScale continues to be relevant, but the type of scale will matter
Regardless of what further changes occur
in the healthcare industry over the next
several years, scale will continue to be impor-
tant for health systems. Our analysis shows
that greater size correlates with stronger
performance and a better ability to withstand
growing pressures on profitability, balance
sheets, and market structure (Exhibit 7).
On average, operating costs are more than
35% higher at smaller, “local” systems than
at national systems.
difficulties the acquirer will face are the need
to manage a range of multi faceted organi-
zations, many of which may have different
cultures, and to employ more complicated
value-capture levers. As a result, the acquirer
will have to establish clarity on organizational
structure, decision-making rights, and expec-
tations during the deal phase; it should not
count on settling those issues after the close.
Nevertheless, it is crucial that provider exe-
cutives be able to accurately assess the true
value-creation opportunity before executing
a deal and put in place plans that can achieve
savings or growth.
Provider Scale Strategies — 2018 Provider Compendium
Exhibit 7 of 7
EXHIBIT 7 On average, health systems with greater geographic scale and market concentration are more efficient
AMC, academic medical centers; CBSA, core-based statistical area.1 Includes AMCs; systems with zero or negative revenue reported, systems with zero acute beds reported, are excluded; top market share is determined by the number of admissions. Analysis does not include independent hospitals.2 Health systems were defined as follows: national if at scale in 6 or more CBSAs; super-regional if at scale in 3–5 CBSAs; local if at scale in 1–2 CBSAs; sub-scale if not at scale in any CBSAs. “At scale” is defined as having >15% share of inpatient admissions in a given CBSA.3 Weighted average share of inpatient admissions across CBSAs in which system provides care; define as high if weighted average share is >30%; moderate if weighted average share is 15–30%; low if weighted average share is 2–15%.
Sources: American Hospital Association hospitals reports 2011 and 2016
National
System type,2 $ thousands
Non-AMCproviders
AMCproviders
Average share in top 50 CBSAs,3 $ thousands
Super-regional
Sub-scale
Local
High per-CBSA share
Moderate per-CBSA share
Low per-CBSA share
Operating expenses per case mix index-adjusted admission, by system type1
Operating expenses per case mix index-adjusted admission, by market share
10.37.4
7.87.0
6.3 8.4
8.8
7.8
6.5
9.8
9Provider scale strategies: A 2018 update on the evolving landscape
Although many health systems have already
achieved scale, they may want to consider
new consolidation opportunities. As they do
so, they should be thoughtful about where to
invest. Acquiring facilities in disparate markets
provides limited additional value once minimum
effective scale has been reached. It is often
wiser to focus on gaining local market leader-
ship (i.e., first or second position in share) and
integrating care delivery more effectively. Our
analysis of 50 MSAs shows that health systems
with high market share are, on average, about
20% more efficient on a cost basis than those
with low share for non-AMCs and 38% for
AMCs. Interestingly, the majority of the high-
market-share systems are midsize.
In the future, however, traditional economies
of scale such as improved cost management
will not be sufficient to enable health systems
to compete effectively, so health systems must
seek other advantages that scale can bring.
For example, greater size can provide better
access for patients and broader networks
of coordinated care that lead to improved
outcomes.
Scale can also help build brand
value and consumer loyalty. Employers also
gain value from scale: they can develop agree-
ments with a health system to reduce costs,
but only if the system has a network large
enough to cover all of their employees.
Key insights about provider M&A
• The total volume and value of provider deals remain
high—and not just because of a few megadeals.
• Midsize systems, which now account for more
than one-third of all US health systems, are
playing an increasingly prominent role in deal
activity. These systems are currently more active
as buyers than large systems, and are acqui-
sition targets more often than small systems.
We expect this trend to continue, especially
because the number of high-performing small
systems is dwindling.
• Many acquirers, especially not-for-profit health
systems, are focusing on geographic proxi mity,
not expansion to new markets. However, inves-
tor-owned systems appear to be more willing
to pursue deals across regions.
• Academic medical centers and faith-based
health systems are making an increasing
number of acquisitions. Together, they now
account for more than half of aggregate
target revenues.
• Scale matters. Our analyses show that systems
with higher local market concentration are
more cost-efficient. Furthermore, the imperative
to achieve cost synergies will only increase,
given the size, complexity, and multiples of likely
future deals.
• When contemplating acquisitions, provider
executives need to think beyond the traditional
economies of scale. They should carefully
define their strategic approach to M&A (espe-
cially in the mid market battleground), be bolder
and more aggressive in realizing synergies,
consider the other advantages scale can bring,
and use consolidation to build or obtain the
advanced capabilities needed to compete
in the future.
10McKinsey & Company Healthcare Systems and Services Practice
(e.g., disease prevalence analysis, readmissions
prevention tools), precision medicine, digital
technology to improve patient engagement
and care coordination, and more sophisticated
management tools. By using scale to gain these
capabilities, health systems put themselves
in a better position to succeed in an increasingly
complex environment.
. . .Although provider M&A deal volume remains
strong, the nature of the deals and the strategic
intentions are evolving. When considering future
acquisitions, provider executives should think
beyond traditional synergies; they deliver at best
only modest returns once minimal efficient scale
is reached. Instead, provider executives should
ground future deals in a clear strategy and focus
on identifying and extracting value from econo-
mies of scope and skill. In that way, they can
create significant value and compete more effec-
tively in this dynamic healthcare environment.
Scott Lichtenberger, MD (Scott_Lichtenberger @McKinsey.com), is a partner in McKinsey’s Denver office. Rupal Malani, MD (Rupal_Malani @McKinsey.com), is a partner in the Cleveland office. Neha Patel ([email protected]) is a partner in the New Jersey office. Saum Su-taria, MD ([email protected]), is a senior partner in the Silicon Valley office.
The authors wish to thank Nithya Vinjamoori, Manuel
Valverde, and Alex Hirschhorn for their contributions
to this article.
For health systems that have not yet reached mini-
mum effective scale, aggregating facilities in ex-
isting or adjacent markets is likely to be another
wise move. Aggregation will not only enable the
systems to reach sufficient scale, but also allow
them to afford the corporate capability building
required to succeed in a value-based environment.
The health systems operating on a national scale
appear to have grasped this point. Their actions
suggest they believe that success within markets
requires share leadership; they focus on building
local market scale and exit a market when this
is not possible. If they continue on this path, they
will likely make additional investments in existing
markets—for example, to acquire ambulatory
facilities.
Enhance capabilities along the wayEconomies of scope and skill become more relevant
Consolidation can also allow health systems
to acquire or develop economies of scope and
skill. Greater scale can help them avoid what
would otherwise be duplicate investments, such
as spending on patient engagement platforms.
Perhaps more important, it can establish a more
robust asset base to support next-generation
strategies. For instance, greater scale can permit
health systems to acquire new capabilities that
provide a near-term com petitive advantage and
may become table stakes in the near future.
Examples include advanced analytics to identify
trends that could influence clinical interventions
Editor: Ellen Rosen
For media inquiries, contact Julie Lane ([email protected]).
For other inquiries, contact the authors.
Copyright © 2018 McKinsey & Company
Any use of this material without specific permission of McKinsey & Company is strictly prohibited.
www.healthcare.mckinsey.com


![Consultative Group on Intemational Agricultura] Re~.!.'..!ciat-library.ciat.cgiar.org/Articulos_Ciat/2015/DINTER... · 2014-09-13 · less favored ones. Focusing on less favored areas](https://img.dokumen.tips/doc/110x75/5f42ece13a3c3b16ed03092b/consultative-group-on-intemational-agricultura-reciat-2014-09-13-less.jpg)


![THE BOUNDARIES OF MOST FAVORED NATION TREATMENT IN … · 2012. 6. 20. · Cole FTP4 B.doc 5/22/2012 4:28 PM Spring 2012] Boundaries of Most Favored Nation Treatment 539 Most Favored](https://img.dokumen.tips/doc/110x75/60655e14395193516d0256e6/the-boundaries-of-most-favored-nation-treatment-in-2012-6-20-cole-ftp4-bdoc.jpg)