Embed Size (px)
DESCRIPTION
Citation preview
Leveraging BI and Predictive Analytics to deliver Real time forecasting
Shyam Desigan
CFO & Sr. VP of IT
American Academy of Physician Assistants
CIO Healthcare Summit, Dallas, TX February 2013

86,500Number of certified PAs in 2012, according to the
National Commission on Certification of Physician Assistants
83,600Employment in 2010
108,300Projected employment in 2020
The second-fastest-growing health profession in the next decade

43,495Number of AAPA Members
31,756PA Members
11,739PA Student Members
Membership
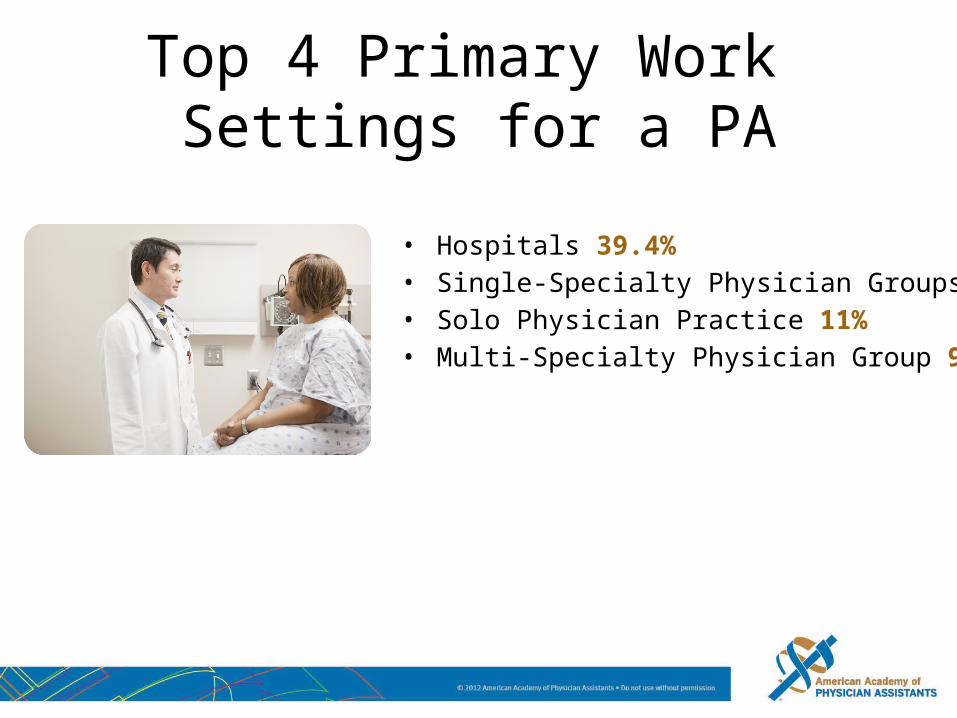
Top 4 Primary Work Settings for a PA
• Hospitals 39.4%• Single-Specialty Physician Groups 19.7%• Solo Physician Practice 11%• Multi-Specialty Physician Group 9.5%
Top 3 Primary PA Specialties
• Family medicine 24.8%• Other Surgical sub specialties 23.2%• Internal Medicine sub specialties 10.3%
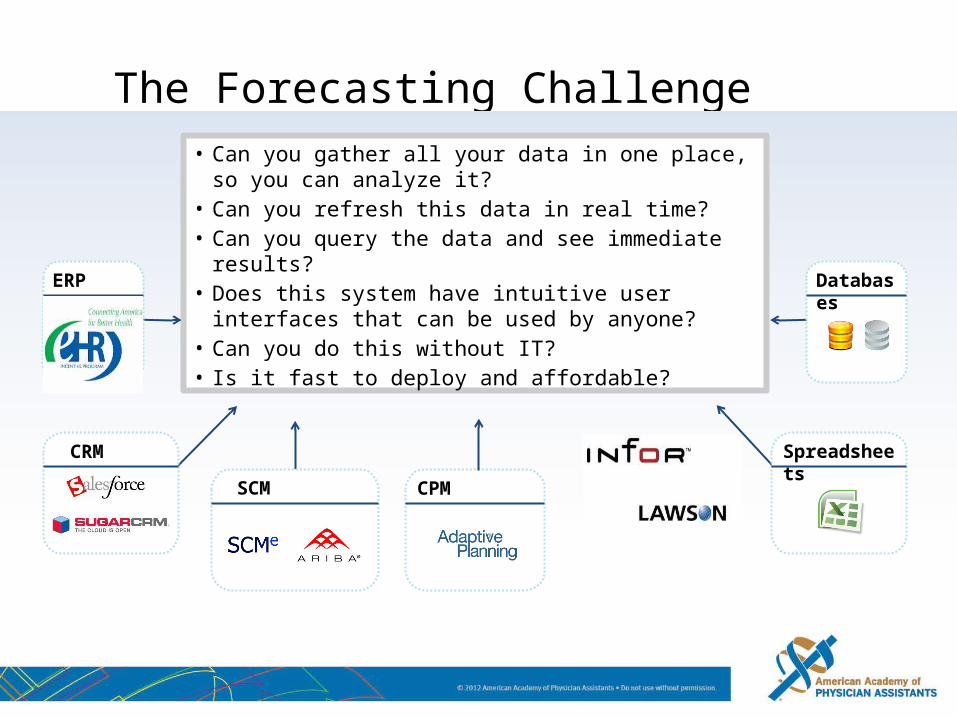
The Forecasting Challenge• Can you gather all your data in one place, so you can
analyze it?• Can you refresh this data in real time?• Can you query the data and see immediate results?• Does this system have intuitive user interfaces that can
be used by anyone?• Can you do this without IT?• Is it fast to deploy and affordable?
ERP
CRM
SCM CPM
Spreadsheets
Databases
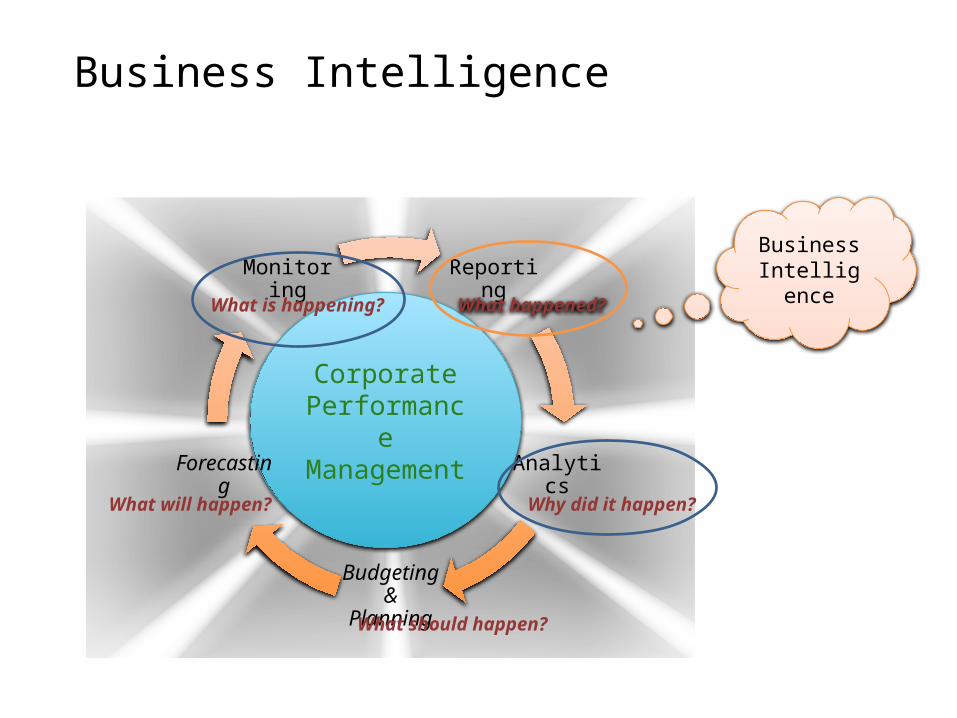
CorporatePerformance Management
Business Intelligence
Reporting
Analytics
Budgeting & Planning
Forecasting
MonitoringWhat happened?
Why did it happen?
What should happen?
What will happen?
What is happening?
Business Intelligence
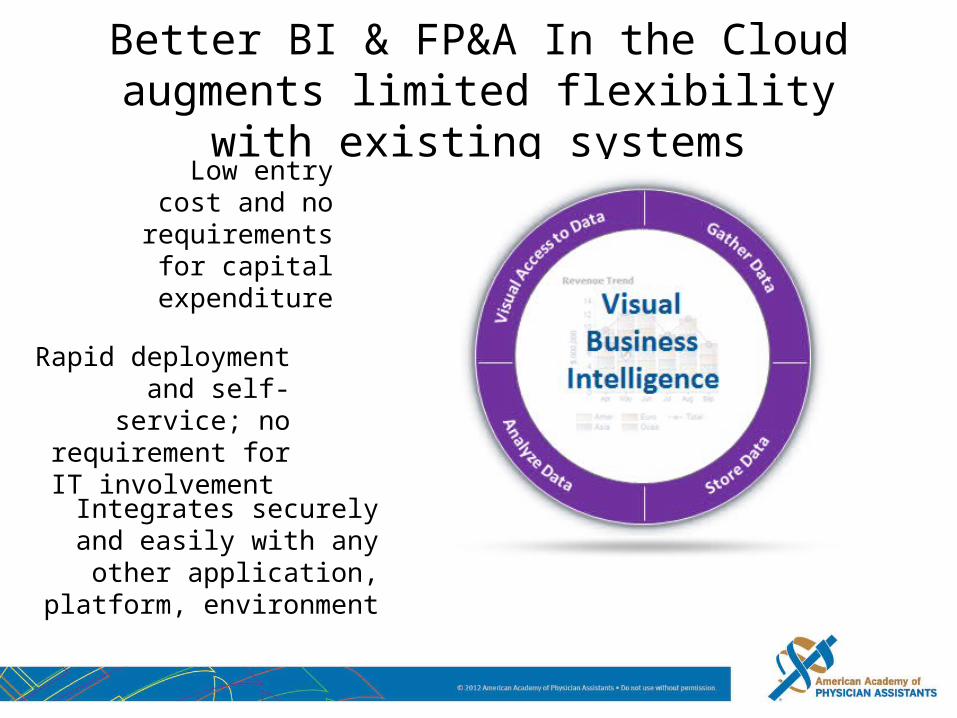
Better BI & FP&A In the Cloud augments limited flexibility with existing systemsLow entry cost and
no requirements for capital
expenditure
Rapid deploymentand self-service; no requirement for IT
involvement
Integrates securely and easily with any other application,
platform, environment
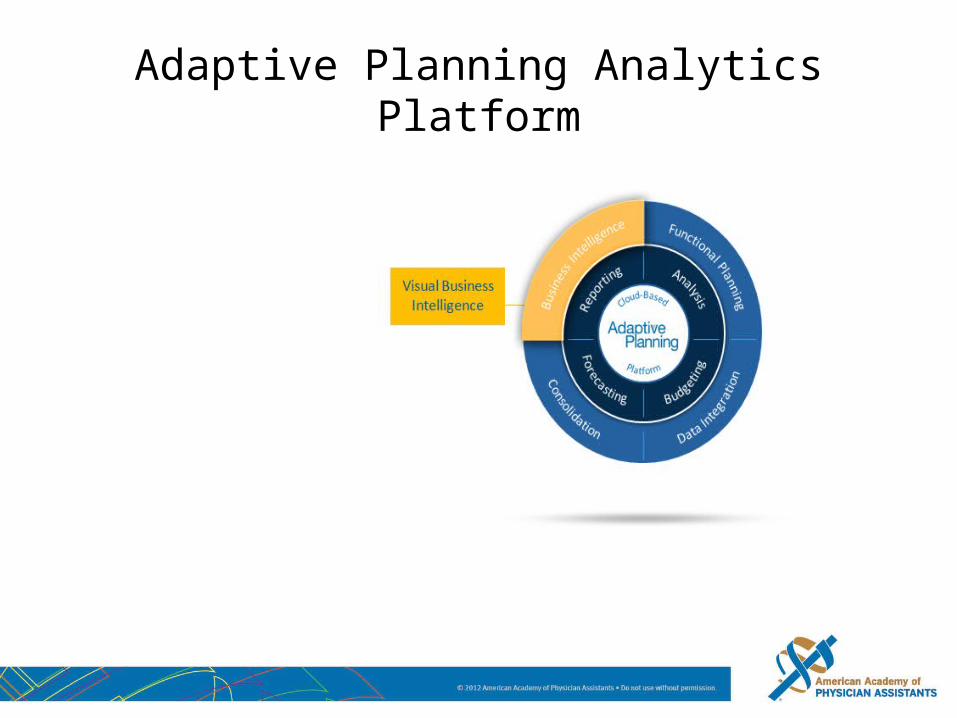
Adaptive Planning Analytics Platform
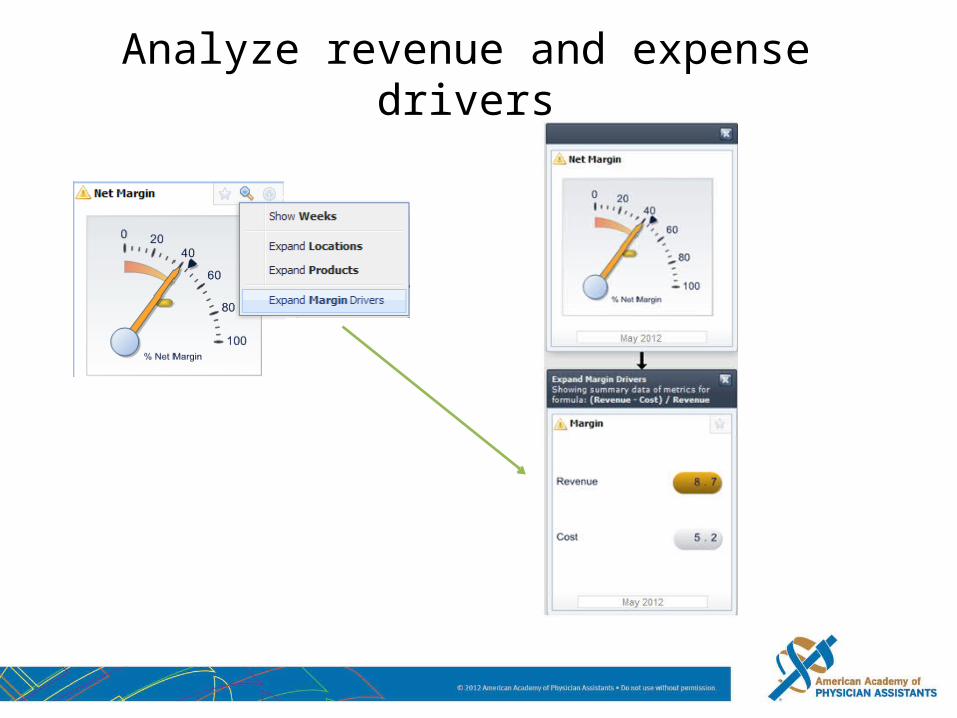
Analyze revenue and expense drivers

Drill-Down into KPIs
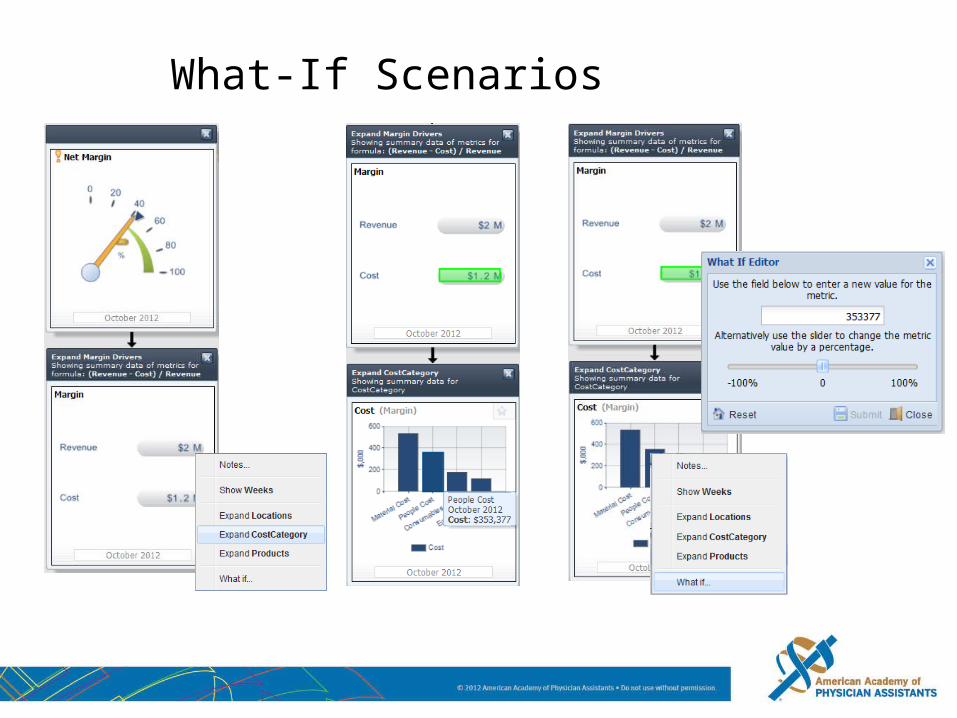
What-If Scenarios

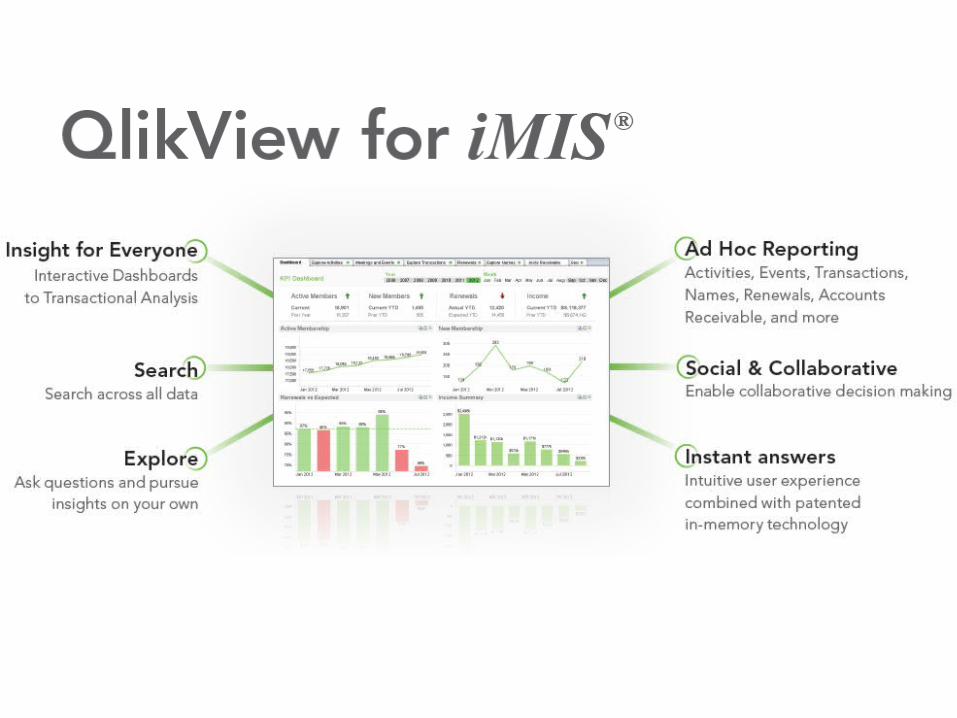
Why Visualization?
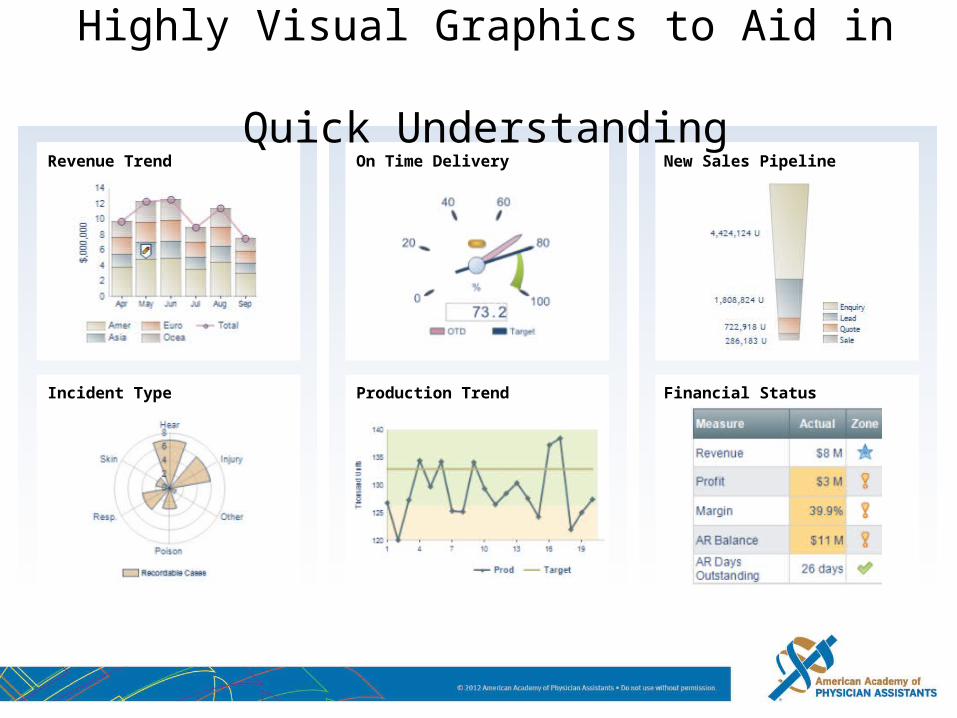
Highly Visual Graphics to Aid in Quick Understanding
Revenue Trend On Time Delivery New Sales Pipeline
Incident Type Production Trend Financial Status
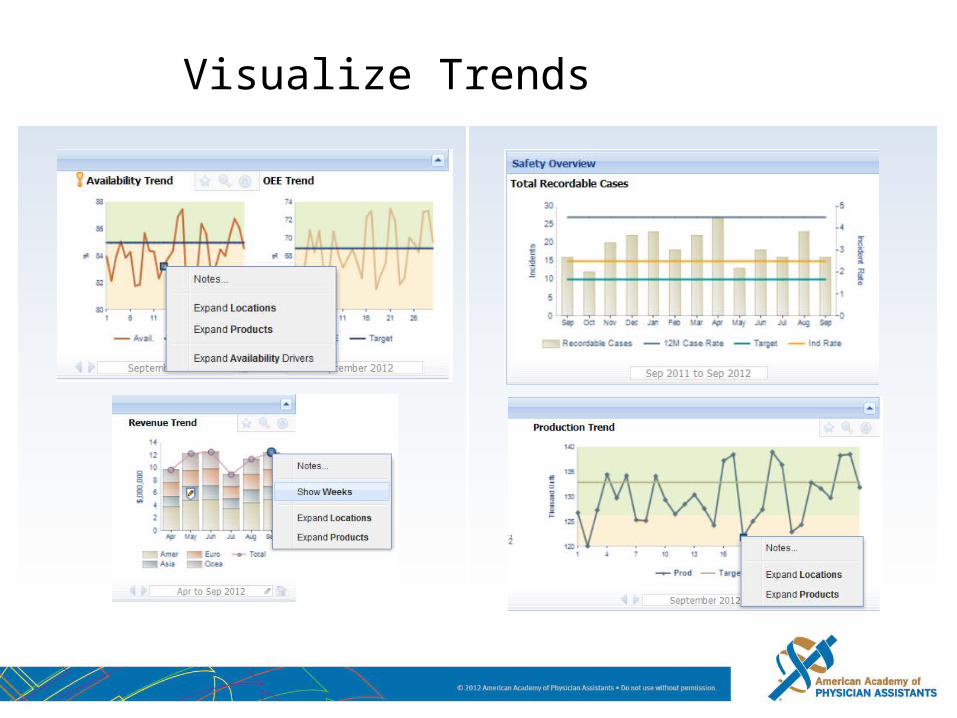
Visualize Trends

• Visualize KPIs• Get Visual & Email Alerts• Analyze & Perform What-If
Scenarios• Collaborate• Personalize
Glean Insights from Dashboards
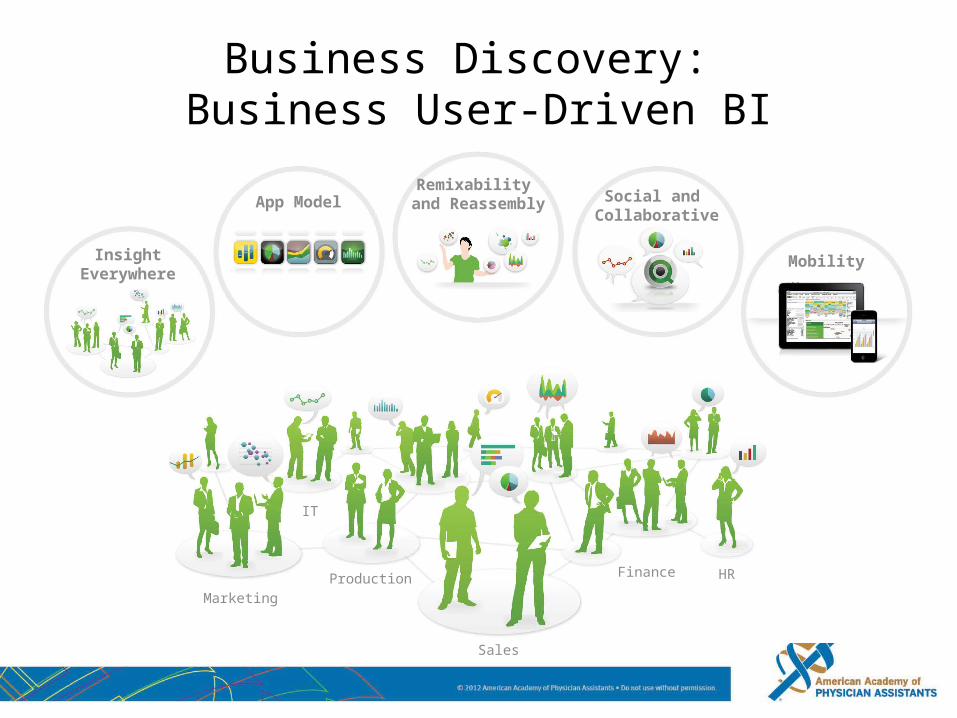
Business Discovery: Business User-Driven BI
InsightEverywhere
App ModelRemixability
and Reassembly Social and Collaborative
Mobility
Finance HR
Sales
Marketing
IT
Production
EXCEL SQL SAP ERP
ORACLE SALESFORCEDATA
WAREHOUSEINFORMATICA
FinanceMarketing
Sales
Operations
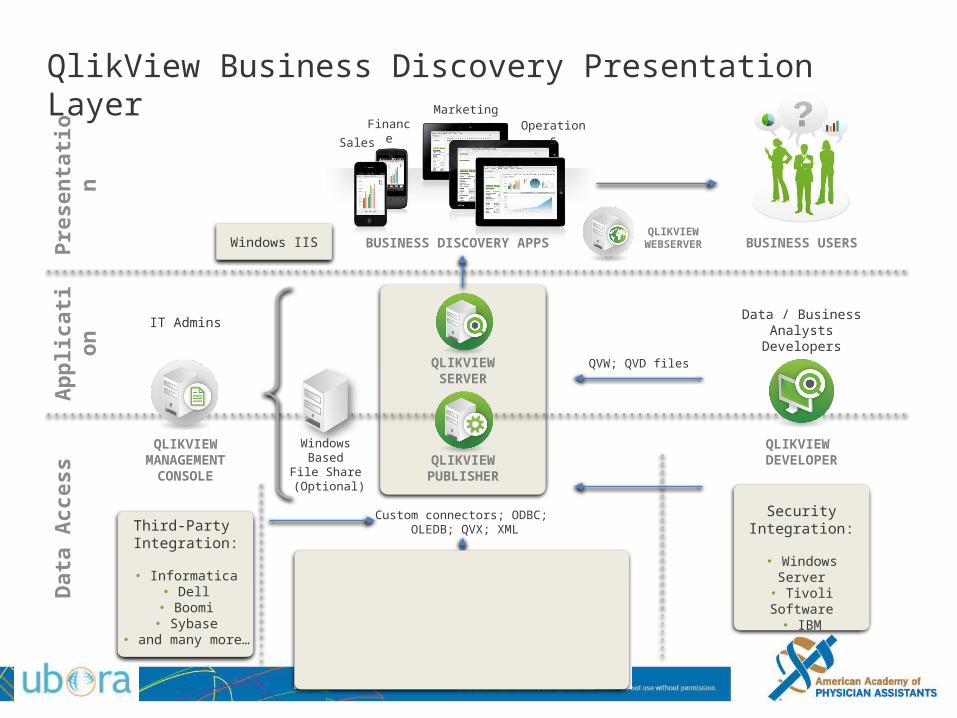
Pre
sen
tati
on
QLIKVIEW WEBSERVERBUSINESS DISCOVERY APPS
Ap
plic
atio
n
QLIKVIEWPUBLISHER
BUSINESS USERS
IT Admins
QVW; QVD files
Windows Based
File Share (Optional)
Custom connectors; ODBC; OLEDB; QVX; XMLThird-Party
Integration:
• Informatica• Dell
• Boomi• Sybase
• and many more…
Security Integration:
• Windows Server• Tivoli Software
• IBM
OPERATIONAL DATA SOURCES
Dat
a A
cces
sQlikView Business Discovery Presentation Layer
QLIKVIEWSERVER
Data / Business Analysts Developers
QLIKVIEW MANAGEMENT
CONSOLE
QLIKVIEW DEVELOPER
Windows IIS
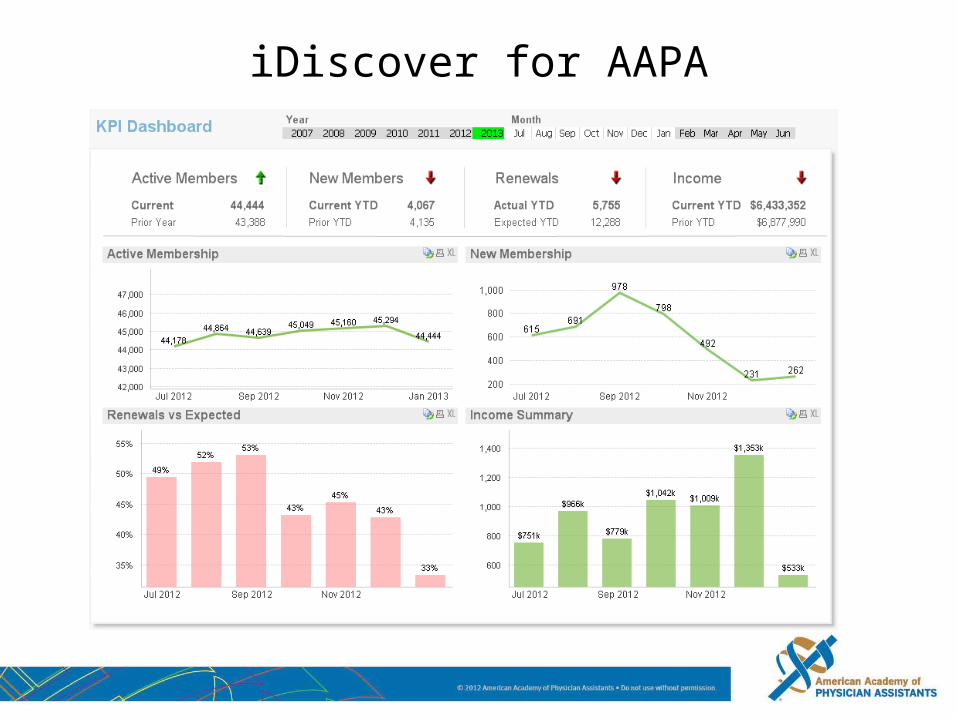
iDiscover for AAPA
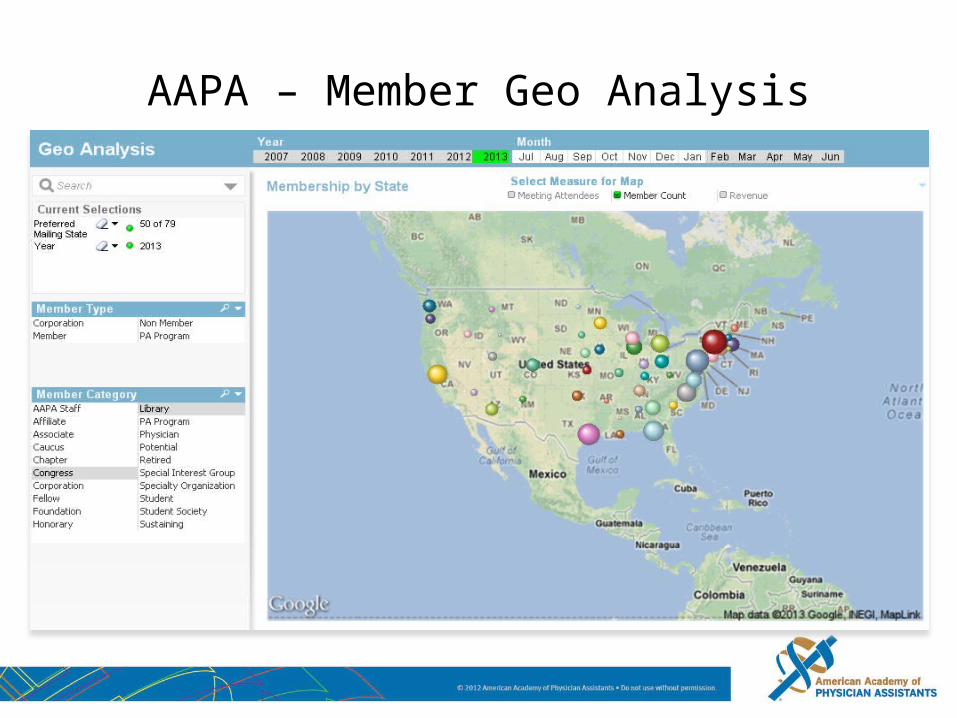
AAPA – Member Geo Analysis
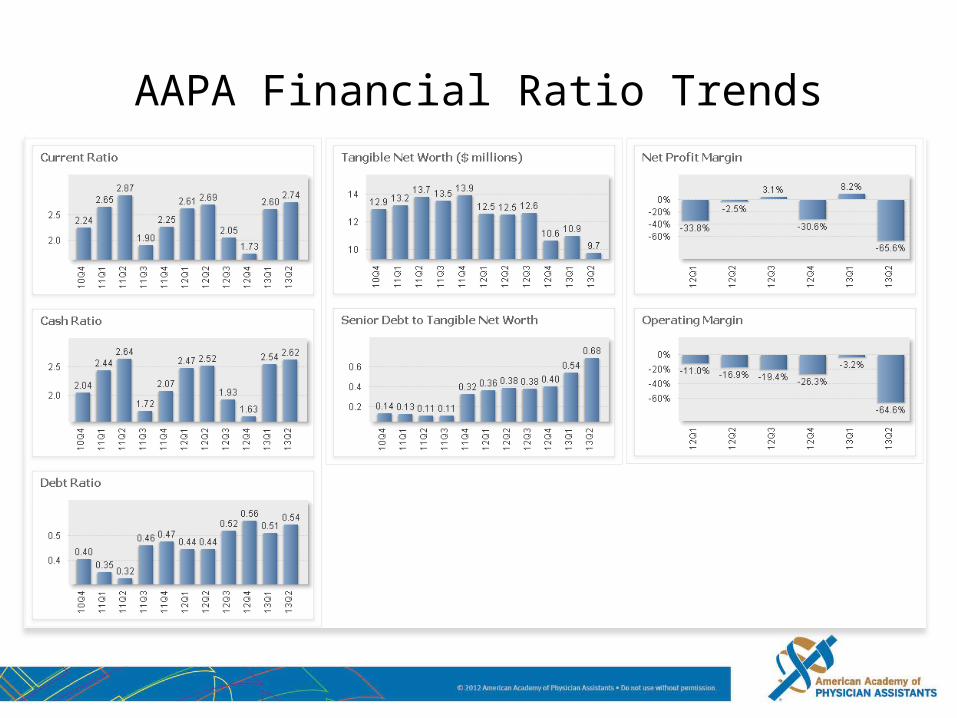
AAPA Financial Ratio Trends

SPSS Modeler for predictive analytics
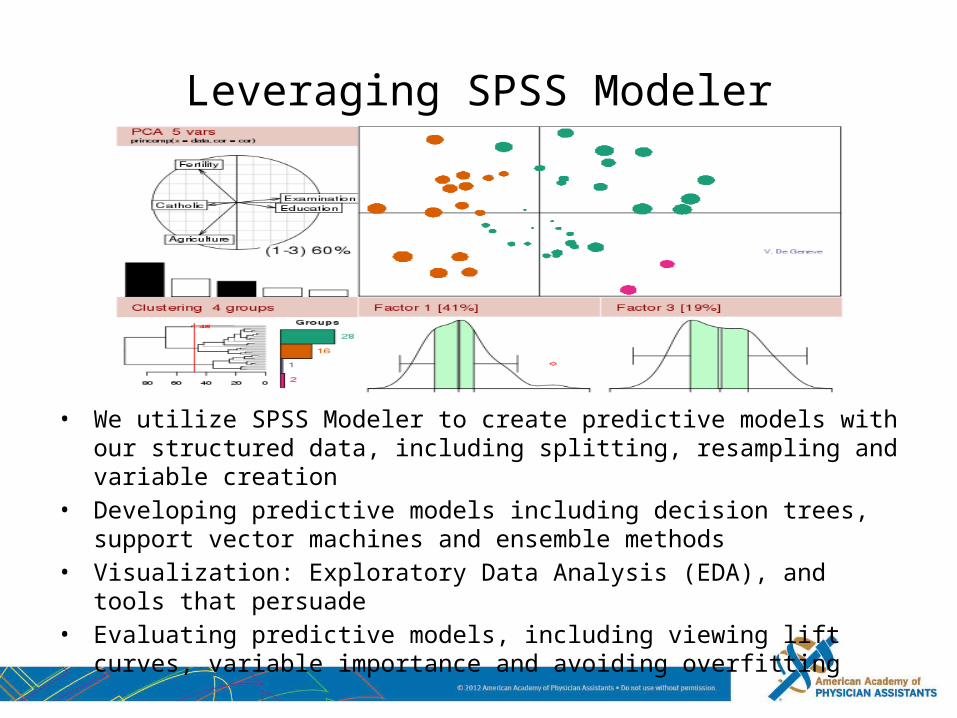
Leveraging SPSS Modeler
• We utilize SPSS Modeler to create predictive models with our structured data, including splitting, resampling and variable creation
• Developing predictive models including decision trees, support vector machines and ensemble methods
• Visualization: Exploratory Data Analysis (EDA), and tools that persuade• Evaluating predictive models, including viewing lift curves, variable
importance and avoiding overfitting
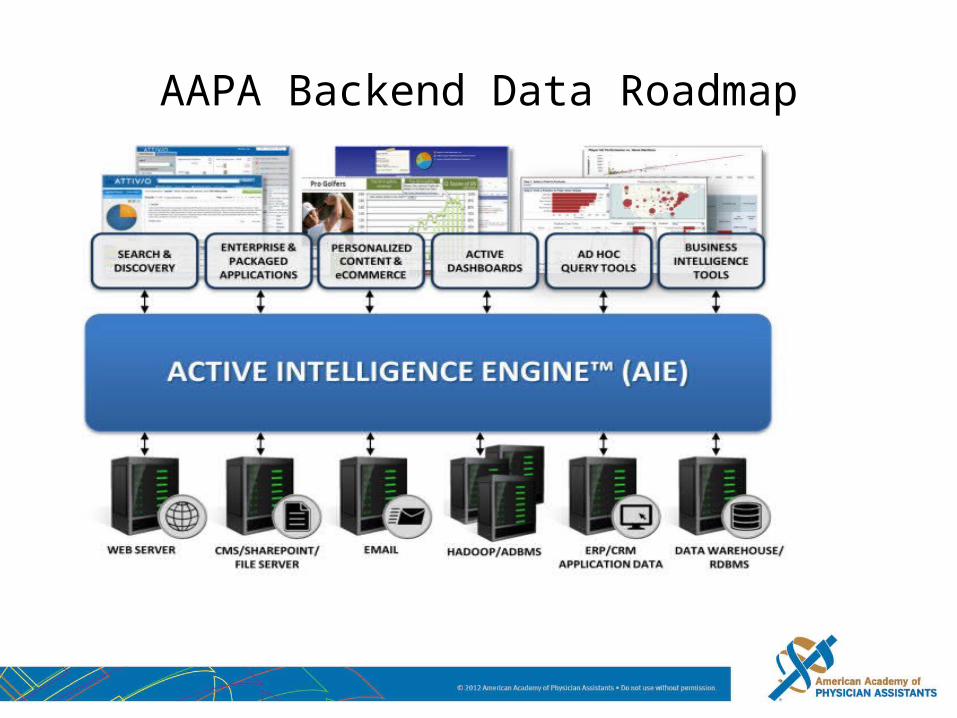
AAPA Backend Data Roadmap