Embed Size (px)
Citation preview

HEALTHCARE
INDUSTRY PROFILEHealthcare
for Arapahoe & Douglas Counties

HEALTHCAREThe health care and wellness cluster includes a dynamic and growing group of companies that provide preventive, curative, and rehabilitative services offered by health care providers, medical and specialty hospitals, kidney dialysis centers, nutrition and weight loss facilities, fitness centers, medical spas and massage facilities, public health and education and other health care and wellness organizations. Extending beyond health care delivery, the cluster represents a continuum of businesses ranging from treating disease to a multidimensional and holistic approach that focuses on complete physical and mental health, social well-being and disease prevention.
The nine-county Metro Denver and Northern Colorado1 region is a leading healthcare and wellness hub. The region’s health services industries are truly regional, serving not only surrounding areas of Colorado but several western states ranging from Montana to New Mexico. The region has a large concentration of healthcare and wellness facilities with more than 192,290 healthcare and wellness workers in nearly 18,160 companies across the region. The healthcare and wellness cluster propels the region’s economy forward by attracting substantial resources and promoting company expansions from which patients, educational and research institutions, companies, research and development, and the community all derive significant benefits.
One of the key characteristics of the healthcare and wellness industry is its resiliency to economic cycles, which continues to drive job growth as a result of several key trends. Colorado’s health insurance landscape is undergoing rapid change, and the pace accelerated in 2014. An estimated 500,000 Coloradans are expected to gain insurance through the Affordable Care Act, driven by private insurance enrollment through Connect for Health Colorado, public insurance enrollment in Medicaid, and the expanding health benefits in both. This will also drive further collaboration and cooperation among various healthcare and wellness facilities across the region for specialized services, research, workforce, and facilities.
Another contributing factor is increasing demand for healthcare services, largely due to an aging and growing population. By 2040, Colorado’s population ages 65 and older is projected to double to 1.5 million. This demographic shift toward an older population with the aging of the baby boomer generation will generate economic activity based on increased demand for hospital and nursing care, medical services, and long-term and at-home services.
In addition, the digital healthcare infrastructure, created by electronic health records and software solutions, has greatly improved the way patient care is delivered and compensated. Improvements in the digital healthcare infrastructure have also provided the ability to share patient records with other providers. Lastly, providers are moving toward integrated healthcare to increase efficiencies and mitigate risks by establishing continuity of care. The integrated healthcare approach is changing the way individuals prevent illness and treat diseases. Improved medical practices, holistic approaches, and new intellectual and spiritual philosophies have fostered the movement toward an integrated approach to healthcare. Courtesy of Metro Denver Economic Development Corporation
National Health Rankings
Background
#8
Source: United Health Foundation

HEALTHCARE
Top Employment Concentrations by County
County 2014 JobsAverage Worker
Earnings
Denver County, CO 24,350 $62,772 0.70
Adams County, CO 19,211 $70,039 1.34
Arapahoe County, CO 18,389 $57,215 0.67
Jefferson County, CO 13,856 $53,103 0.79
Douglas County, CO 6,015 $56,986 0.67
Broomfield County, CO 932 $42,059 0.33
Clear Creek County, CO 94 $34,118 0.19
Elbert County, CO 94 $31,972 0.17
Park County, CO 47 $28, 103 0.13
Gilpin County, CO 13 $19,907 0.04
National Location Quotient
Employment Concentrations
Source: QCEW Employees, Non-QCEW Employees, Self-Employed & Extended Proprietors - EMSI 2014.2 Class of Worker
This map show where the highest concentration of employment are in the healthcare sector, by county, within the metro Denver area.
2

HEALTHCARE HEALTHCARECompetitive Wage AnalysisThis table shows employment within metro Denver in the top 20 occupations in the sector. Regional wage ranges and the median wage are shown, with yellowed cells indicating where wage offers may have to land to attract and retain qualified candidates based on labor supply (applicants per job opening).
Description
Physicians & Surgeons, All Other
Clinical, Counseling & School Psychologists
Physical Therapists
Family & General Practitioners
Dental Hygienists
Registered Nurses
Dentists, General
Radiologic Technologists
Nursing Assistants
Secretaries & Admin Assistant, Except Legal, Medical & Executive
Home Heath Aides
Licensed Practical & Licensed Vocational Nurses
Medical & Clinical Lab Technologists
Personal Care Aides
Medical & Health Services Managers
Medical Secretaries
Food Servers, Non Restaurant
Dental Assistants
Medical Assistants
Receptionist & Information Clerks
SOCCode
29-1069
19-3031
29-1123
29-1062
29-2021
29-1141
29-1021
29-2034
31-1014
43-6014
31-1011
29-2061
29-2011
39-9021
11-9111
43-6013
35-3041
31-9091
31-9092
43-4171
2014Jobs
3,134
4,475
2,445
1,744
2,100
24,413
1,520
1,871
9,570
35,812
10,776
3,537
2,095
13,441
2,164
4,692
3,562
3,417
4,976
11,699
Average Wage
$84.02
$29.66
$34.64
$77.39
$39.53
$33.97
$71.64
$29.47
$13.90
$17.74
$11.07
$22.72
$27.76
$10.00
$48.31
$16.69
$10.81
$19.23
$17.07
$15.02
AvailableApplicants
10
24
21
17
31
316
26
29
276
552
400
155
66
500
168
346
247
234
729
2,008
Annual Openings
159
242
154
72
126
1,239
79
82
530
980
673
248
105
750
142
258
179
159
291
529
ApplicantsPer Job
Openings
0.06
0.10
0.14
0.24
0.25
0.26
0.33
0.35
0.52
0.56
0.59
0.63
0.63
0.67
1.18
1.34
1.38
1.47
2.51
3.80
MedianWage
$88.75
$28.95
$33.86
$75.30
$41.00
$33.63
$70.23
$29.16
$13.56
$17.46
$10.65
$22.61
$27.81
$9.88
$45.94
$16.45
$10.25
$19.66
$16.67
$14.56
10th Percentile
Wage
$43.22
$21.46
$24.86
$35.99
$31.57
$24.51
$36.49
$20.05
$11.24
$11.49
$8.47
$18.08
$17.89
$8.32
$31.44
$12.42
$8.10
$12.71
$12.59
$9.60
25thPercentile
Wage
$62.81
$24.44
$28.97
$47.87
$37.85
$28.28
$52.56
$23.43
$12.23
$14.08
$9.52
$20.10
$22.40
$8.94
$37.38
$14.18
$8.80
$15.89
$14.42
$11.76
75thPercentile
Wage
$94.14
$35.08
$40.32
$86.83
$44.02
$40.03
$84.01
$35.20
$15.45
$21.37
$11.74
$25.86
$33.31
$10.99
$55.73
$18.57
$12.28
$22.53
$18.82
$17.72
90thPercentile
Wage
$121.44
$39.30
$47.98
$112.82
$45.84
$44.58
$98.27
$41.31
$17.40
$25.04
$15.09
$28.21
$37.04
$11.71
$66.94
$21.87
$14.18
$26.10
$22.25
$21.33
Source: QCEW Employees, Non-QCEW Employees, Self-Employed & Extended Proprietors - EMSI 2014.2 Class of Worker 4
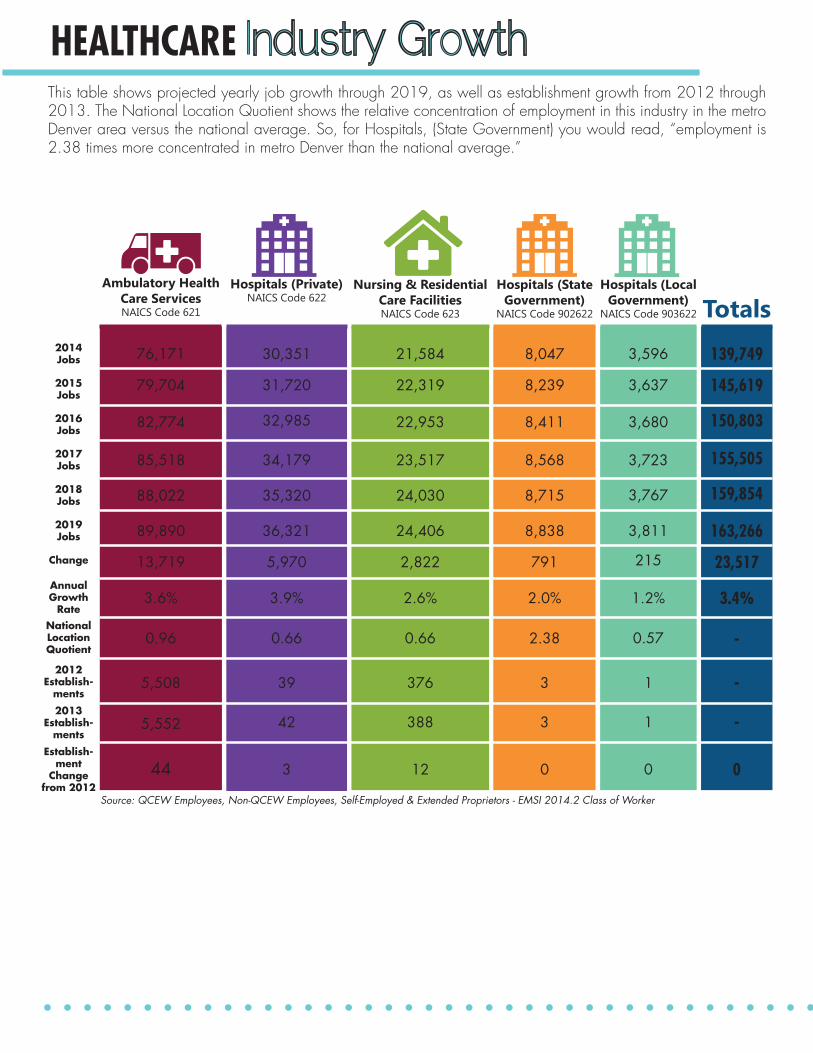
HEALTHCARE Industry Growth
Source: QCEW Employees, Non-QCEW Employees, Self-Employed & Extended Proprietors - EMSI 2014.2 Class of Worker
2014 Jobs
AnnualGrowth
Rate
2015 Jobs
2016 Jobs
2017 Jobs
2018 Jobs
2019 Jobs
Change
NationalLocationQuotient
2012Establish-
ments
2013Establish-
ments
Establish-ment
Changefrom 2012
Ambulatory Health Care ServicesNAICS Code 621
76,171
3.6%
79,704
82,774
85,518
88,022
89,890
13,719
0.96
5,508
5,552
44
Hospitals (Private)NAICS Code 622
30,351
3.9%
31,720
32,985
34,179
35,320
36,321
5,970
0.66
39
42
3
Nursing & Residential Care FacilitiesNAICS Code 623
21,584
2.6%
22,319
22,953
23,517
24,030
24,406
2,822
0.66
376
388
12
Hospitals (State Government)
NAICS Code 902622
8,047
2.0%
8,239
8,411
8,568
8,715
8,838
791
2.38
3
3
0
Hospitals (Local Government)
NAICS Code 903622
3,596
1.2%
3,637
3,680
3,723
3,767
3,811
215
0.57
1
1
0
Totals
139,749
3.4%
145,619
150,803
155,505
159,854
163,266
23,517
0
-
-
-
This table shows projected yearly job growth through 2019, as well as establishment growth from 2012 through 2013. The National Location Quotient shows the relative concentration of employment in this industry in the metro Denver area versus the national average. So, for Hospitals, (State Government) you would read, “employment is 2.38 times more concentrated in metro Denver than the national average.”

HEALTHCARE Hidden Job Market
Weak Medium Strong
Occupation (SOC)
Avg Monthly Postings (Nov
2011 - Jan 2015
Medical & Health Services Managers 374 131 0.35
Family & General Practitioners 88 79 0.90
Registered Nurses 1,576 1,635 1.04
Dentists, General 47 65 1.38
Physical Therapists 121 168 1.39
Medical Secretaries 145 281 1.94
Radiologic Technologists 63 123 1.95
Physicians & Surgeons, All Other 65 135 2.08
Medical Assistants 140 298 2.13
Licensed Practical & Vocational Nurses 114 268 2.35
Hires Per Listing
Medical & Clinical Lab Technologists 57 142 2.49
Dental Assistants 40 197 4.93
Clinical, Counseling & School Psychologists 43 268 6.23
Secretaries & Administrative Assistants, Except Legal, Medical & Executive
373 2,356 6.32
Dental Hygienists 17 121 7.12
Receptionists & Information Clerks 117 845 7.22
Nursing Assistants 79 663 8.39
Food Servers, Non Restaurant 31 315 10.16
Home Health Aides 72 915 12.71
Personal Care Aides 63 1,210 19.21
Avg Monthly Hires (Nov 2011
- Jan 2015
This chart shows the relationship between the number of job listings versus the number of hires for each of the top occupations in the sector.
If there are more listings than hires, it suggests that the job requires specific skills and credentials, and so most openings for that occupation are listed. An example is the intensive care registered nurse. Thus, it is more important for a candidate to have the required skills, credentials and experience than merely being an effective personal networker, and the hidden job market is weak.
If there are more hires than listings, it suggests that most people in those occupations are finding jobs through networking rather than looking at job listings. These are occupations where people with effective personal networking skills have the edge and the hidden job market is strong.
Occupations with MEDIUM strength of hidden job market require both the necessary skills and credentials, and effective personal networking on the part of the job seeker.
6

HEALTHCARE Top JobsTop Jobs Currently Listed in the Metro Denver, Last 120 Days
Registered NursesOccupation Code
29114100Volume
2346Volume Prior Year
2237
Medical & Healthcare Services Managers
Occupation Code11911100Volume
540Volume Prior Year
2237
Licensed Practical & Licensed Vocational Nurses
Occupation Code29206100Volume
525Volume Prior Year
190
Medical SecretariesOccupation Code
43601300Volume
343Volume Prior Year
194
Nursing AssistantsOccupation Code
31101400Volume
316Volume Prior Year
231
Social & Human Services Assistants
Occupation Code21109300Volume
196Volume Prior Year
101
Medical AssistantsOccupation Code
31909200Volume
316Volume Prior Year
248
Surgical Technologist Occupation Code
29205500Volume
152Volume Prior Year
98
Radiologic Technologist Occupation Code
29203400Volume
143Volume Prior Year
76
Home Health AidesOccupation Code
31101100Volume
138Volume Prior Year
120
Mental Health & Substance Abuse Social WorkersOccupation Code
21102300Volume
130Volume Prior Year
45
Critical Care NursesOccupation Code
29114103Volume
129Volume Prior Year
176
Computer Systems Analyst
Occupation Code15112100Volume
122Volume Prior Year
132
Physical TherapistsOccupation Code
29112300Volume
117Volume Prior Year
154
Medical Records & Health Information Technicians
Occupation Code29207100Volume
108Volume Prior Year
111
First-Line Supervisors of Office & Administrative
Support WorkersOccupation Code
43101100Volume
103Volume Prior Year
84
Occupational TherapistsOccupation
Code29112200Volume
92Volume Prior
Year144
Emergency Medical Technicians & Paramedics
Occupation Code29204100Volume
90Volume Prior Year
42
Family & General PractitionersOccupation Code
29106200Volume
81Volume Prior Year
88
Physician AssistantOccupation Code
29107100Volume
79Volume Prior Year
76
Source: Wanted Analytics

HEALTHCARE Staffing Patterns
Postsecondarynon-degree
Nursing AssistantsSOC Code: 31-1014
2014 Jobs: 8,2472019 Jobs: 9,688Change: 1,441%Change: 17%
%of Industry: 5.9%2013 Median Hourly
Earnings: $13.56
Medical AssistantsSOC Code: 31-9092
2014 Jobs: 4,5892019 Jobs: 5,438
Change: 849%Change: 19%
%of Industry: 3.3%2013 Median Hourly
Earnings: $16.67
Dental AssistantsSOC Code: 31-9091
2014 Jobs: 3,2652019 Jobs: 3.663
Change: 398%Change: 12%
%of Industry: 2.3%2013 Median Hourly
Earnings: $19.66
Licensed Practical & Vocational NursesSOC Code: 29-2061
2014 Jobs: 2,7102019 Jobs: 3,348
Change: 638%Change: 24%
%of Industry: 1.9%2013 Median Hourly
Earnings: $22.61
High School or equivalent
Medical SecretariesSOC Code: 43-6013
2014 Jobs: 4,3902019 Jobs: 5,309
Change: 919%Change: 21%
%of Industry: 3.1%2013 Median Hourly
Earnings: $16.45
Receptionists & Information Clerks
SOC Code: 43-41712014 Jobs: 4,2562019 Jobs: 4,935
Change: 679%Change: 16%
%of Industry: 3%2013 Median Hourly
Earnings: $14.56
Secretaries & Administrative
Assistants, Except Legal, Medical & Executive
SOC Code: 43-60142014 Jobs: 2,4602019 Jobs: 2,785
Change: 325%Change: 13%
%of Industry: 1.8%2013 Median Hourly
Earnings: $17.46
Less than high school
Home Health AidesSOC Code: 31-1011
2014 Jobs: 7,0322019 Jobs: 8,420Change: 1,388%Change: 20%
%of Industry: 5%2013 Median Hourly
Earnings: $10.65
Personal Care AidesSOC Code: 39-9021
2014 Jobs: 3,8462019 Jobs: 4,747
Change: 901%Change: 23%
%of Industry: 2.8%2013 Median Hourly
Earnings: $9.88
Food Servers, Nonrestaurant
SOC Code: 35-30412014 Jobs: 1,7762019 Jobs: 2,058
Change: 282%Change: 16%
%of Industry: 1.3%2013 Median Hourly
Earnings: $10.25
Bachelor’sDegree
Medical & Clinical Lab Technologists
SOC Code: 29-20112014 Jobs: 1,9052019 Jobs: 2,118
Change: 213%Change: 11%
%of Industry: 1.4%2013 Median Hourly
Earnings: $27.81
Medical & Health Services Managers
SOC Code: 11-91112014 Jobs: 1,7502019 Jobs: 2,117
Change: 367%Change: 21%
%of Industry: 1.3%2013 Median Hourly
Earnings: $45.94
Associate’s Degree
Registered NursesSOC Code: 29-11412014 Jobs: 20,1342019 Jobs: 23,344
Change: 3,210%Change: 16%
%of Industry: 14.4%2013 Median Hourly
Earnings: $33.63
Dental HygienistsSOC Code: 29-2021
2014 Jobs: 2,0592019 Jobs: 2,387
Change: 328%Change: 16%
%of Industry: 1.5%2013 Median Hourly
Earnings: $41.00
Radiologic Technologists
SOC Code: 29-20342014 Jobs: 1,7482019 Jobs: 2,000
Change: 252%Change: 14%
%of Industry: 1.3%2013 Median Hourly
Earnings: $29.16
Doctoral or Professional
Degree
Clinical, Counseling & School Psychologists
SOC Code: 19-30312014 Jobs: 3,4362019 Jobs: 3,862
Change: 426%Change: 12%
%of Industry: 2.5%2013 Median Hourly
Earnings: $28.95
Physicians & Surgeons, All Other
SOC Code: 29-10692014 Jobs: 2,7542019 Jobs: 3,089
Change: 335%Change: 12%
%of Industry: 2%2013 Median Hourly
Earnings: $88.75
Physical TherapistsSOC Code: 29-1123
2014 Jobs: 2,1682019 Jobs: 2,555
Change: 387%Change: 18%
%of Industry: 1.6%2013 Median Hourly
Earnings: $33.86
Family & General Practitioners
SOC Code: 29-10622014 Jobs: 1,6452019 Jobs: 1,756
Change: 111%Change: 7%
%of Industry: 1.2%2013 Median Hourly
Earnings: $75.30
Dentists, GeneralSOC Code: 29-1021
2014 Jobs: 1,4882019 Jobs: 1,668
Change: 180%Change: 12%
%of Industry: 1.1%2013 Median Hourly
Earnings: $70.23
This shows growth/decline for the top 20 occupations within the industry, sorted by educational level, as well as the percent of total employment within the industry represented by each occupation. The thing to be mindful of is that the change by occupation merely reflects the total number of jobs at the beginning and end of the period. Even if a job may decline by 100 positions between 2014 and 2019, there may be a much larger number of annual openings, based on retirements, career changes and so forth.
Source: QCEW Employees, Non-QCEW Employees, Self-Employed & Extended Proprietors - EMSI 2014.2 Class of Worker8

HEALTHCARE Top Ten
Skills1 Critical Care
2 Pediatrics
3 Geriatrics
4 Bilingual
5 Behavioral Health
6 Cardiac Care
7 Quality Assurance (QA)
8 Emergency Room
9 Patient Electronic Medical Records
10 Quality Control
Certifications1 Certified Registered Nurse (RN)
2 Basic Life Support (BLS)
3 Advanced Cardiac Life Support (ACLS)
4 Cardiopulmonary Resuscitation (CPR)
5 Licensed Practical Nurse (LPN)
6 Occupational Safety & Health Administration (OSHA)
7 Certified in Nursing Administration (CNA)
8 Pediatric Advanced Life Support (PALS)
9 American Nurses Credentialing Center (ANCC)
10 Certified Practical Nurse, Long-term care (CPNL, LTC)
Companies1 Centura Health
2 HCA-The Healthcare Company
3 SCL Health System, Inc.
4 Denver Health
5 PSA Healthcare
6 Catholic Health Initiatives
7 Health One
8 Life Care Centers of Amercia
9 DaVita, Inc.
10 Banner Health
Online Listing Sources1 US.jobs
2 Jobing
3 JobNetwork
4 CareerBoard
5 CareerBuilder
6 HealthJobsNationwide
7 JobMonkey
8 TweetMyJobs
9 Nurse.com
10 CareerLink
Below are the top ten skills, certifications, companies and online listing resources in the healthcare industry.
Source: Wanted Analytics

HEALTHCARE
25-34 23.4%
4.4%14-18
19-24 18.4%
35-44 23.4%
45-54 23.2%
55-64 6.7%
65+ 0.6%
This age band graph shows the percentage of each age group currently in the healthcare industry workforce.
Age Bands & Volume
Listing
Age Bands
This graph shows the week over week volume of listings in Metro Denver
Source: EMSI Complete Employment 2014.2
Source: Wanted Analytics
0100200300400500600700800900
10

HEALTHCARE
Scan code to view report online
www.adworks.org