Embed Size (px)
Citation preview

DRAFT
H E A L T H W E A L T H C A R E E R
P O R T F O L I O C A R B O NF O O T P R I N T A N A LY S I SL O N D O N B O R O U G H O FI S L I N G T O N P E N S I O N F U N D( “ T H E F U N D ” )
June 2016
Aled JonesPrincipal, Responsible Investment

DRAFT© MERCER 2016 2
C O N T E N T S
1. Executive Summarya. Findings and recommendations
2. Carbon footprint of the Fund’s listed equity assetsa. Outline of analysisb. High level resultsc. Summary comments
3. Overviewa. Climate change risks and opportunities
4. Managing climate riska. Options available to the Fundb. Alternative portfolio structurec. Concluding remarks
5. Appendix 1: Background to portfolio carbon footprinting.6. Appendix 2: Detailed carbon footprint results for the Fund.7. Appendix 3: Overview of low carbon and sustainability-themed investments.

DRAFT© MERCER 2016 3(C) MERCER 2016 3
EXECUTIVE SUMMARYFINDINGS ANDRECOMMENDATIONS

DRAFT© MERCER 2016 4
E X E C U T I V E S U M M A R YF I N D I N G S A N D R E C O M M E N D A T I O N S
• The Fund’s carbon footprint (CF) results – shown on slide 10 and in more detail inAppendix 2 – show that the aggregate listed equity portfolio has a CF that isapproximately 30% lower than the FTSE All World.
• This aggregate CF result reflects two things:
1. The relatively high CF of the UK passive equity assets (50% of the aggregateportfolio) is driven by the overweight exposure in the UK to the Energy andUtilities sectors, and
2. The very low CF of the Fund’s two active equity mandates (40% of the aggregateportfolio) which have a moderating effect on the overall CF.
• Although the LGIM portfolio has a very high CF – driven by the EM and RAFIcomponents – it accounts for a minority (approx. 10%) of the aggregate portfolio andtherefore does not significantly influence the overall CF result.
• A key question when presented with CF data is: What steps should the investortake? To help the Fund address this question we provide suggestions for next steps,which we summarise below and set out in more detail on slides 20 to 28.

DRAFT© MERCER 2016 5
E X E C U T I V E S U M M A R YF I N D I N G S A N D R E C O M M E N D A T I O N S
• On the basis of our analysis, we provide the Pensions Sub-Committee (theCommittee) with four options for it to consider, covering a range of measures toaddress climate risk more explicitly in its listed equity portfolio:
1. Include climate risk within the broader manager due diligence in the ongoingactive EM equity search process e.g. by asking specific questions of shortlistedmanagers.
2. Allocate some of the Fund’s UK passive equity assets to a lower carbon UKpassive equity fund.
3. Allocate assets to an active Global equity strategy with a thematic sustainabilityfocus.
4. As an alternative to point 3, allocate assets to a lower carbon Global passiveequity fund.

DRAFT© MERCER 2016 6
E X E C U T I V E S U M M A R YF I N D I N G S A N D R E C O M M E N D A T I O N S
• It is important to note that Mercer does not recommend that the Fund focuses onreducing its CF purely for the sake of having a lower number.
• We believe that it is useful to know what the Fund’s CF is, and in particular what isdriving the number, as it can inform a broader perspective on risk. However, actionsto manage portfolio climate risk should be based on a clear objective which shouldconsider aspects other than just the CF.
• For example, an allocation to a sustainability-themed equity strategy would mostlikely produce a lower CF over time but would not necessarily actively target aspecific reduction in a given time frame.
• We have provided the Committee with an alternative portfolio structure (forillustrative purposes) to highlight what would happen to the Fund’s aggregate CF if itmade allocations to:– A low carbon UK passive equity index, and– A global active sustainability-themed strategy (Ownership Capital).

DRAFT© MERCER 2016 7
E X E C U T I V E S U M M A R YF I N D I N G S A N D R E C O M M E N D A T I O N S
• Alternative portfolio structure results in an 8% reduction in total CF versus thecurrent aggregate equity portfolio.
132.5122.2
10.2
23.530.0
133.4
163.8
187.5
44.3
0.0
20.0
40.0
60.0
80.0
100.0
120.0
140.0
160.0
180.0
200.0
Islington EquityPortfolio
AlternativePortfolioStructure
OwnershipCapital
Allianz – ActiveGlobal Equities
Newton – ActiveGlobal Equities
All Share CarbonOptimised
FTSE All Share FTSE All World MSCI Low CarbonTarget
Nor
mal
ised
Carb
onEm
issi
ons(
tons
CO2e
/$M
inve
sted
)
NORMALISED CARBON EMISSIONS (tons CO2e / $M invested)
-8%
-20%
-80%
©2016 MSCI ESG Research Inc. Reproduced by permission.

DRAFT© MERCER 2016 8(C) MERCER 2016 8
CARBON FOOTPRINT OFTHE FUND’S L ISTEDEQUITY ASSETS

DRAFT© MERCER 2016 9
• Mercer has undertaken carbon footprinting analysis for the Fund. The analysis wasconducted using MSCI ESG Analytics and focused on the following listed equity portfoliosand benchmarks:
• Analysis is based on holdings data as at 30 November 2015 (prior to London CIVpooling).
• The Fund’s aggregate asset allocation has been based on information as at 31 December2015 (provided by State Street), with the exception of the LGIM regional fund allocationswhich have been pro rated based on LGIM’s valuation as at 30 November 2015.
C A R B O N F O O T P R I N T A N A L Y S I SO U T L I N E O F A N A L Y S I S
Portfolio Benchmark(s)In-house UK passive equity FTSE All Share
LGIM Global (ex-UK) passiveequity
FTSE North AmericaFTSE Europe ex-UKFTSE Developed Asia ex-JapanFTSE JapanFTSE Emerging MarketsFTSE RAFI 3000
Allianz active Global equity FTSE All World
Newton active Global equity FTSE All World
Total equity portfolio

DRAFT© MERCER 2016 10
C A R B O N F O O T P R I N T A N A L Y S I SH I G H L E V E L R E S U L T S
©2016 MSCI ESG Research Inc. Reproduced by permission.
132.5
23.5 30.0
370.2
163.8
187.5
0.0
50.0
100.0
150.0
200.0
250.0
300.0
350.0
400.0
Islington Equity Portfolio Allianz – Active GlobalEquities
Newton – Active GlobalEquities
LGIM Portfolio FTSE All Share FTSE All World
Nor
mal
ised
Carb
onEm
issio
ns(t
onsC
O2e
/$M
inve
sted
)
NORMALISED CARBON EMISSIONS (tons CO2e / $M invested)

DRAFT© MERCER 2016 11
C A R B O N F O O T P R I N T A N A L Y S I SS U M M A R Y C O M M E N T S
• A portfolio level carbon footprint is driven by significant over or underweight positionsin companies or sectors with higher carbon emissions.
• The impact of sector exposure on a portfolio carbon footprint can be demonstratedwith the two charts overleaf. These charts show the sector weights of the FTSE AllWorld vs the carbon emissions of each sector.
• The three largest contributors in terms of carbon emissions at the sector level are:– Utilities: 40%– Materials: 26%– Energy: 17%
• An interesting point is that the Energy sector – despite being in the top three – hasless than half of the carbon emissions compared to the Utilities sector. However, it isimportant to note that MSCI only considers Scope 1 and 2 emissions in its carbonfootprint tool (Appendix 1 provides an overview of carbon footprinting).

DRAFT© MERCER 2016 12
C A R B O N F O O T P R I N T A N A L Y S I SS U M M A R Y C O M M E N T S
13.00%
10.08%
6.69%
21.63%11.99%
10.73%
14.39%
4.77%3.63%
3.11% 2.8%2.5%
17.1%
2.1%
0.8%
7.8%
1.7%
25.5%0.7%
39.1%
FTSE All World – Sector weights FTSE All World – Sector carbon emissions
Utilities
©2016 MSCI ESG Research Inc. Reproduced by permission.

DRAFT© MERCER 2016 13
C A R B O N F O O T P R I N T A N A L Y S I SS U M M A R Y C O M M E N T S
3. The LGIM Portfolio has the highest carbon footprint. This results from theallocations to the LGIM FTSE RAFI 3000 and LGIM FTSE Emerging Marketspassive portfolios, which have the highest carbon footprints of all the indicesanalysed (see Appendix 2 for additional detail).
- Of the 15 companies with the largest carbon footprint in the FTSE EmergingMarkets index, 11 are in the Energy and Utilities sectors.
- A similar picture is evident in the RAFI 3000 portfolio i.e. 13 out of the 15companies with the largest carbon footprint are in the Energy and Utilitiessectors.
• Options available to the Fund for managing or reducing exposure to carbon riskwithin its equity portfolios are addressed in the next section.

DRAFT© MERCER 2016 14(C) MERCER 2016 14
OVERVIEWCLIMATE CHANGE RISKSAND OPPORTUNITIES

DRAFT© MERCER 2016 15
O V E R V I E WC L I M AT E C H A N G E R I S K S A N D O P P O R T U N I T I E S
• This document provides the Committee with summary information of the CF of theFund’s listed equity investments, using the MSCI ESG Analytics platform.
• Carbon footprinting has become a popular means of identifying exposure to ‘highcarbon’ companies i.e. those with higher levels of carbon emissions.
• Whilst CF data comes with a number of caveats (see Appendix 1) it is one of the fewtools currently available to investors that can provide a snapshot of their exposure tocompanies that are exposed to policy risk with regards to climate change.
• All else equal, investors should expect to see increasing policy measures, in particular inDeveloped Markets, to reduce carbon emissions and adapt the economy and society tothe expected physical impacts of a changing global climate.

DRAFT© MERCER 2016 16
O V E R V I E WC L I M AT E C H A N G E R I S K S A N D O P P O R T U N I T I E S
• These policy measures will likely have implications for investors. Indeed, Mercer’sown research indicates that under a ‘2 degree scenario’ – whereby efforts are madeto keep the average global temperature increase to 2 degrees above pre-industriallevels – sectors with higher carbon intensity and/or exposure to fossil fuels mayexperience a significant reduction in annual returns due largely to climate policymeasures.
• Specifically, our study suggests that Coal and Oil sector returns could be eroded by-2.0% per annum (p.a.) and -0.7% p.a. respectively. Further, returns from Utilitiescould fall by approximately 4% p.a. under the same scenario.

DRAFT© MERCER 2016 17
O V E R V I E WC L I M AT E C H A N G E R I S K S A N D O P P O R T U N I T I E S
• From a portfolio perspective, investors have two broad options:
1. Low carbon or fossil fuel free equity indices: These can be defined as equitybenchmarks that reduce or remove exposure to high carbon and/or fossil fuel(i.e. Energy) companies. Low carbon index strategies have a risk managementfocus i.e. they aim to provide a ‘hedge’ against the risk of carbon pricing and/orother policy measures aimed at reducing carbon emissions (see example ofMSCI Low Carbon index on slide 18, below). Fossil fuel free approaches arelikely to be more attractive to investors concerned about ‘stranded assets’ and/orthe reputational risks of holding oil, gas or coal producing companies.Implementation of this approach is via passive equity allocations.
2. Sustainability-themed investments: For the purposes of this report, these aredefined as active strategies that provide exposure to sustainability themes (suchas low carbon energy, energy efficiency, health and water). These strategiesfocus on solutions to broad environmental and social challenges and aregenerally growth-oriented investments.
• Summary risk and return information on selected low carbon indices andsustainability-themed global equity strategies is provided in Appendix 3.

DRAFT© MERCER 2016 18
O V E R V I E WP A S S I V E E Q U I T Y E X A M P L E – M S C I
Passive Investment approachescan be used as a ‘hedge’ againstfuture carbon pricing.• Carbon pricing adds a cost per
unit of carbon emitted bycompanies.
• Polluters either purchase carbonpermits sufficient to offset theiremission levels or invest in waysto reduce emissions.
Current innovation abounds inconsidering low-carbon alternativesin RAFI, Low-Volatility, Smart Betastrategies and across asset classes(e.g. green infrastructure).
Low carbon indices cansignificantly reduce exposure toemissions and reserves (see tablefor MSCI example).
MSCI WORLD MSCI WORLD LOWCARBON TARGET
Total Return (%) 12.7 13.1
Total Risk (%) 10.0 10.1
Realised TrackingError (%) 0.0 0.4
Carbon emissions(Gt) 5.5 1.1
Carbon reserves(Gt) 108 12
80% R E D U C T I O NI N C AR B O NE M I S S I O N S
90% R E D U C T I O NI N C AR B O NR E S E R V E S
Source: MSCI, data for the period from November 2010 to May 2015 (annualised)
MSCI Low Carbon Target Index vs. MSCI World

DRAFT© MERCER 2016 19(C) MERCER 2016 19
MANAGING CLIMATERISKOPTIONS AVAILABLE TOTHE FUND

DRAFT© MERCER 2016 20
M A N A G I N G C L I M AT E R I S KO P T I O N S AV A I L A B L E T O T H E F U N D
• Investors interested in managing their exposure to higher carbon assets have tendedto consider the following options:1. Excluding or divesting fossil fuel assets from their portfolio – in practice this tends
to be companies involved in the extraction of coal, gas, oil and tar sands.2. Employing some form of alternative index construction for passive equities – to
reduce portfolio weightings to higher carbon companies.3. Investing in sustainability-themed strategies in order to generate returns from the
long-term shift to a lower carbon economy and the growth in products andservices that this shift results in.
• Selective divestment of individual companies can be problematic from animplementation perspective, especially within passive portfolios. It also raises widerissues about the use of ‘exclusion’ policies which the Fund has not adopted in recentyears.
• Engagement with companies is another option often employed by investors, inparticular to encourage greater disclosure of climate risks facing a company and itsmeasures to understand and mitigate those risks.

DRAFT© MERCER 2016 21
M A N A G I N G C L I M AT E R I S KO P T I O N S AV A I L A B L E T O T H E F U N D
• Mercer encourages asset owners to adhere to principles of good stewardship (e.g.as outlined in the UK Stewardship Code). However, we do not consider engagementin detail on this occasion, other than in relation to the ongoing EM equity search.
• The options we discuss further in this section are as follows:1. Include climate risk within the broader manager due diligence in the ongoing
active EM equity search process e.g. by asking specific questions of shortlistedmanagers.
2. Allocate some of the Fund’s UK passive equity assets to a lower carbon UKpassive equity fund.
3. Allocate assets to an active Global equity strategy with a thematic sustainabilityfocus.
4. As an alternative to point 3, allocate assets to a lower carbon Global passiveequity fund.
• The remainder of this section explores these options in more detail. We also provideadditional CF analysis for an alternative scenario for the Fund (for illustrativepurposes) – incorporating points two and three.

DRAFT© MERCER 2016 22
M A N A G I N G C L I M AT E R I S KO P T I O N S AV A I L A B L E T O T H E F U N D
• It is important to note that Mercer does not recommend that the Fund focuses onreducing its CF purely for the sake of having a lower number.
• We believe that it is useful to know what the Fund’s CF is, and in particular what isdriving the specific number. However, actions to manage portfolio climate risk shouldbe based on a clear objective which should consider broader aspects of this risk.
• In our view, this objective should comprise the following elements:– Identify portfolio exposure to climate risk (e.g. at the sector or stock level) – CF
analysis can be helpful in this regard.– Reduce or ‘hedge’ some of that risk e.g. using a low carbon index approach.– Consider the investment opportunities arising from climate risk via sustainability-
themed equity strategies.
• The third point above (an allocation to a sustainability-themed strategy) would mostlikely produce a lower CF over time but would not necessarily actively target aspecific reduction in a given time frame.
DRAFT© MERCER 2016 23
M A N A G I N G C L I M AT E R I S KO P T I O N S AV A I L A B L E T O T H E F U N D
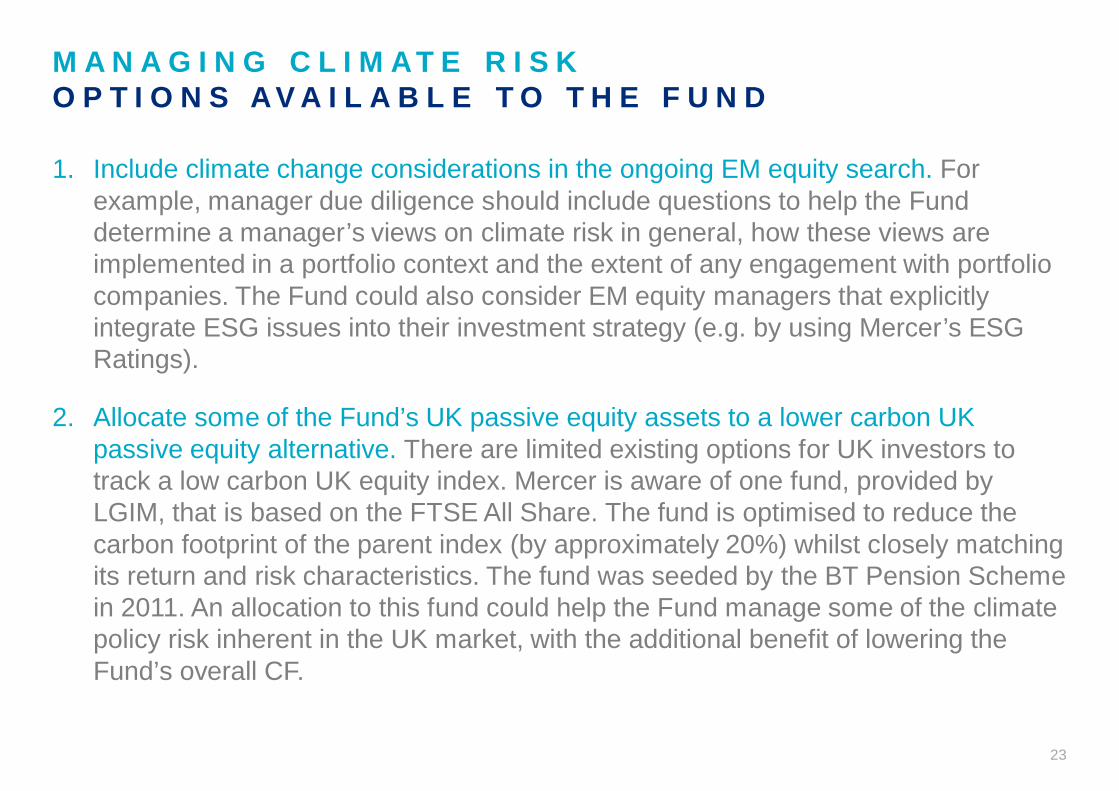
1. Include climate change considerations in the ongoing EM equity search. Forexample, manager due diligence should include questions to help the Funddetermine a manager’s views on climate risk in general, how these views areimplemented in a portfolio context and the extent of any engagement with portfoliocompanies. The Fund could also consider EM equity managers that explicitlyintegrate ESG issues into their investment strategy (e.g. by using Mercer’s ESGRatings).
2. Allocate some of the Fund’s UK passive equity assets to a lower carbon UKpassive equity alternative. There are limited existing options for UK investors totrack a low carbon UK equity index. Mercer is aware of one fund, provided byLGIM, that is based on the FTSE All Share. The fund is optimised to reduce thecarbon footprint of the parent index (by approximately 20%) whilst closely matchingits return and risk characteristics. The fund was seeded by the BT Pension Schemein 2011. An allocation to this fund could help the Fund manage some of the climatepolicy risk inherent in the UK market, with the additional benefit of lowering theFund’s overall CF.

DRAFT© MERCER 2016 24
M A N A G I N G C L I M AT E R I S KO P T I O N S AV A I L A B L E T O T H E F U N D
– Mercer conducted CF analysis on the LGIM fund (based on holdings data as at30 November 2015)– the result confirmed that this fund has a CF approximately20% lower than the FTSE All Share. The impact of incorporating an allocation of10% to this index on the Fund’s overall CF of aggregate portfolio is shown onslide 28.
– Further analysis would be required to determine whether the LGIM fund wouldbe suitable for Fund in terms of its risk/return characteristics, fees etc.
3. Allocate assets to an active Global equity strategy with a thematic sustainabilityfocus. An additional approach is to consider an active, global mandate that targetsspecific sustainability themes. This is a more positive approach in that it aims tobenefit from the shift to a lower carbon economy and the broader growth in demandfor sustainable products and services. Strategies in this universe generally do nothave explicit policies to reduce their carbon footprint or exposure to fossil fuels.However, they implicitly tend to avoid these sectors.

DRAFT© MERCER 2016 25
M A N A G I N G C L I M AT E R I S KO P T I O N S AV A I L A B L E T O T H E F U N D
– In order to highlight the CF characteristics of sustainability-themed strategies, wealso conducted CF analysis of Ownership Capital (OC) (based on holdings dataas at 31 March 2016) – a highly rated strategy from Mercer’s research database(GIMD).
– The results show that the OC portfolio has a significantly lower CF versus theFund’s existing active equity managers – approximately one third of the CFachieved by Newton.
– Slide 28 shows the CF impact – at the aggregate Fund level – of switching 5% ofthe Newton assets into the OC strategy (alongside the allocation to the UK lowcarbon index).

DRAFT© MERCER 2016 26
M A N A G I N G C L I M AT E R I S KO P T I O N S AV A I L A B L E T O T H E F U N D
4. Allocate assets to a lower carbon Global passive equity alternative. A further optionfor the Fund to consider is an allocation to a fund tracking a low carbon globalpassive equity index. This approach is presented as an alternative to an activesustainability-themed allocation.
– The availability of funds tracking a low carbon global index is also limited.Coincidentally, LGIM also manages one of the few funds available in this market.This particular fund tracks the MSCI Low Carbon Target index. This index aimsto reduce the CF (measured as carbon emissions relative to sales) and itsexposure to carbon reserves versus the parent index whilst targeting 30bps oftracking error. This LGIM fund was seeded in 2015 by the Environment AgencyActive Pension Fund.
– Our analysis of the CF of this fund (slide 28) shows that the LGIM fund has a CFapproximately 80% lower than the FTSE All World index. Note: the LGIM fundtracks the MSCI World (rather than All Country World) – although a similarreduction in CF is achieved vs that index.

DRAFT© MERCER 2016 27
M A N A G I N G C L I M AT E R I S KA L T E R N A T I V E P O R T F O L I O S T R U C T U R E
• In order to demonstrate the CF impact of the approaches discussed above, wecreated an alternative portfolio structure as set out below. Note: this is for illustrativepurposes only.
• Alternative portfolio structure– Reducing the current UK Passive portfolio by 10% and allocating this amount to
the LGIM UK carbon optimised fund.– Reducing the current allocation to Newton by 5% and allocating this amount to
Ownership Capital.
• The impact of this alternative structure on the CF of the Fund’s aggregate portfolio isshown in the chart on the following slide.

DRAFT© MERCER 2016 28
M A N A G I N G C L I M AT E R I S KA L T E R N A T I V E P O R T F O L I O S T R U C T U R E
• Alternative portfolio structure results in an 8% reduction in total CF.
132.5122.2
10.2
23.530.0
133.4
163.8
187.5
44.3
0.0
20.0
40.0
60.0
80.0
100.0
120.0
140.0
160.0
180.0
200.0
Islington EquityPortfolio
AlternativePortfolioStructure
OwnershipCapital
Allianz – ActiveGlobal Equities
Newton – ActiveGlobal Equities
All Share CarbonOptimised
FTSE All Share FTSE All World MSCI Low CarbonTarget
Nor
mal
ised
Carb
onEm
issi
ons(
tons
CO2e
/$M
inve
sted
)
NORMALISED CARBON EMISSIONS (tons CO2e / $M invested)
-8%
-20%
-80%
©2016 MSCI ESG Research Inc. Reproduced by permission.

DRAFT© MERCER 2016 29(C) MERCER 2016 29
APPENDIX 1BACKGROUND TOPORTFOLIO CARBONFOOTPRINT ANALYSIS

DRAFT© MERCER 2016 30
P O R T F O L I O C A R B O N F O O T P R I N T A N A L Y S I SW H A T I S I T ?
A measure of the carbon emissions “owned” by an investor i.e. the emissionsattributable to an investor’s portfolio.
The measure is based on:• Company-level carbon emissions, and• Portfolio weightings.
Portfolio carbon footprint is typically compared to the footprint of the relevantbenchmark (e.g. Portfolio vs. MSCI World).
Provides a basic measure of an investor’s exposure to ‘carbon risk’.
Carbon footprint data comes with a number of caveats – mostly over data quality andavailability.
Carbon footprint analysis is primarily a tool for listed equity portfolios.• Fixed income and Unlisted assets are more challenging.
Generates an aggregate measureof portfolio carbon emissions.

DRAFT© MERCER 2016 31
P O R T F O L I O C A R B O N F O O T P R I N T A N A L Y S I SH O W I S I T P R O D U C E D ?
Producing a portfolio carbon footprint requires the following steps:
Compare the portfolio and benchmark results.
Perform the same analysis for all companies in the relevant benchmark.
Normalise the data to allow for comparisons (e.g. by revenue; size).Creates a “carbon intensity” measure for each company / portfolio.
Calculate the “owned” percentage of absolute emissions using portfolioweightings.
Obtain absolute carbon emissions data for all portfolio companies.

DRAFT© MERCER 2016 32
P O R T F O L I O C A R B O N F O O T P R I N T A N A L Y S I SS T R E N G T H S A N D W E A K N E S S E S
Strengths• Useful starting point for carbon
exposure assessment.• Relatively simple measure of
“owned” portfolio emissions /intensity.
• Provides Management Information:• If “portfolio decarbonisation” is an
objective – progress can betracked.
• Enables sector- and benchmark-relative comparisons.
• Highlights areas for further analysisand engagement, with:• Investment managers.• Portfolio companies.
Weaknesses
• Disclosure risk i.e. inconsistentcompany disclosure of emissions :• Scope 1, 2, 3…• Comparability: CO2; CO2e; other
Greenhouse Gases (GHGs)• Bias towards Large Caps and DM
(EM data largely absent).• Limited data verification.
• Relevance risk• Scope 1+2 emissions may not
correlate to corporate policy risk.• Measurement risk
• Estimation is required to fill gaps(e.g. by data vendors).
• Methodologies (and results) vary.• Normalisation approaches (ratios)

DRAFT© MERCER 2016 33
P O R T F O L I O C A R B O N F O O T P R I N T A N A L Y S I SE M I S S I O N S C O P E S 1 - 3
• The GHG Protocol definesemissions as:– Scope 1: operational emissions– Scope 2: purchased electricity
– Scope 3: indirect emissions
• A significant proportion of emissionsfall within Scope 3 – data for whichis not widely reported.
• Carbon footprinting tools either:– Exclude Scope 3 by focusing on
Scopes 1 & 2 only, or– Use estimates and industry
averages to fill in data gaps.• Scope 3 data would help to form a
fuller picture of company exposureto future carbon pricing scenarios.
Source: UN PRI; South Pole Carbon

DRAFT© MERCER 2016 34(C) MERCER 2016 34
APPENDIX 2DETAILED CARBONFOOTPRINT RESULTS

DRAFT© MERCER 2016 35
C A R B O N F O O T P R I N T R E S U L T SS U M M A R Y O F R E S U L T S – A L L M A R K E T S
©2016 MSCI ESG Research Inc. Reproduced by permission.
MANAGER PORTFOLIO/ BENCHMARKANALYSED
COVERAGE NORMALISED CARBONEMISSIONS
Percentage of equityportfolio
(%) (tons CO2e / $M invested) (%)
Entire equity portfolio Portfolio Holdings 95.4 132.5 100.0In-House – PassiveUK Equities FTSE All Share 91.2 163.8 47.1
LGIM – PassiveGlobal Equities
LGIM Portfolio 97.3 370.2 11.8
FTSE North America 99.9 125.4 -FTSE Developed Europe ex-UK 98.1 198.7 1.4
FTSE Japan 99.4 348.9 0.2FTSE Developed Asia Pacificex-Japan 98.1 239.0 0.8
FTSE Emerging Markets 94.7 395.4 5.0
FTSE AW RAFI 3000 99.4 396.7 4.4Allianz – ActiveGlobal Equities Portfolio Holdings 100.0 23.5 13.7
Newton – ActiveGlobal Equities Portfolio Holdings 99.9 30.0 27.5
FTSE All World 99.0 187.5 -

DRAFT© MERCER 2016 36
132.5
23.5 30.0
370.2
163.8
187.5
125.4
198.7
348.9
239
395.4 396.7
0.0
50.0
100.0
150.0
200.0
250.0
300.0
350.0
400.0
450.0
IslingtonEquity
Portfolio
Allianz – ActiveGlobal Equities
Newton –Active Global
Equities
LGIM Portfolio FTSE All Share FTSE All World FTSE NorthAmerica
FTSEDeveloped
Europe ex-UK
FTSE Japan FTSEDeveloped
Asia Pacific ex-Japan
FTSE EmergingMarkets
FTSE AW RAFI3000
Nor
mal
ised
Carb
onEm
issio
ns(t
onsC
O2e
/$M
inve
sted
)
NORMALISED CARBON EMISSIONS (tons CO2e / $M invested)
C A R B O N F O O T P R I N T R E S U L T SS U M M A R Y O F R E S U L T S – A L L M A R K E T S
©2016 MSCI ESG Research Inc. Reproduced by permission.

DRAFT© MERCER 2016 37(C) MERCER 2016 37
APPENDIX 3LOW CARBON ANDSUSTAINABILITY-THEMED INVESTMENTS

DRAFT© MERCER 2016 38
L O W C A R B O N & F O S S I L F R E E P A S S I V E E Q U I T YO V E R V I E W
• The use of low carbon or fossil free indices is oneof many tools available for tackling climate changerisks. Low carbon and fossil free index strategiesdo not typically offer exposure to investmentopportunities aligned with a shift to a low-carboneconomy.
• The “premium” associated with these indices isreduced carbon exposure rather than performance.This reduced exposure may be rewarded infinancial terms, all else equal, as policy measuresdevelop to reward lower carbon activities.
• Investors need to be fully aware of the underlyingconstruction methodology – in particular, ‘fossilfree’ does not have one consistent definition’.
• The use of such indices should not be seen asequivalent to, or as a substitute for, activelymanaged equities with a high level of ESGintegration.
• Both low carbon and fossil free indices can serve tomeet external commitments to align with adecarbonising economy and help to send a strongsignal to stakeholders that they are proactivelymanaging climate risk.
•Mercer has reviewed the indices provided by the leading index providers and has assessed a number of thecurrent investment strategies available. This information is now available to support investor decision making.
• There are three broad categories of low-carbon indices:– Broad-market optimized: Does not exclude any
companies but tilts allocations to companies with lower-carbon intensities.
– Best-in-class: Typically involves screening out companieswith the highest carbon intensity. Maintains parent indexsector exposures but re-weights towards companies withthe lowest carbon intensity within each sector.
– Fossil free: Excludes fossil fuel companies (typicallycompanies who have fossil fuel reserves or are involved inthe extraction process).
• There are several questions for investors in determining themost appropriate approach, including:– What risks do low-carbon/fossil-free indices protect
against?– Are there any unexpected consequences from the
construction methodology?– Could an investor be taking unexpected biases as a result?– Which category of low-carbon index is most suitable for the
investor?

DRAFT© MERCER 2016 39
L O W C A R B O N & F O S S I L F R E E P A S S I V E E Q U I T YO V E R V I E W
• Performance of low carbon and ESG indices versus parent index (as at 31December 2015)
Source: Bloomberg, Thomson Reuters Datastream, Mercer

DRAFT© MERCER 2016 40
L O W C A R B O N & F O S S I L F R E E P A S S I V E E Q U I T YO V E R V I E W
• Performance of low carbon and ESG indices versus parent index (as at 31December 2015)
Source: Bloomberg, Thomson Reuters Datastream, Mercer
Index NameReturn Vol
1 year 3 year 5 year 3 year 5 year
FTSE4Good Global 5.5% 13.7% 9.6% 10.2% 10.5%
FTSE All World Developed 5.5% 13.6% 9.3% 10.2% 10.2%
FTSE All World ex Fossil Fuels 7.2% 15.1% 10.5% 10.2% 10.3%
FTSE All World 4.0% 11.9% 8.0% 10.1% 10.4%
MSCI ACWI ESG 4.0% 12.6% 8.5% 10.3% 10.2%
MSCI ACWI Low Carbon Target 6.6% 13.0% 9.1% 10.1% 10.5%
MSCI ACWI Low Carbon Leaders 4.1% 11.7% 8.0% 10.2% 10.6%
MSCI ACWI 3.8% 11.8% 8.0% 10.1% 10.3%

DRAFT© MERCER 2016 41
S U S T A I N A B I L I T Y - T H E M E D I N V E S T M E N T SO V E R V I E W
• Sustainability-themed investment strategies generally focus on a range of sectors orcompanies whose products and services are specifically aimed at contributing to positiveenvironmental and social development.
• Although sustainability themes are wide-ranging, and new themes are emerging, some of themost prevalent investment ideas include:– Environmental themes, focused on solutions to environmental problems, increasing
efficiency, and addressing resource scarcity: renewable energy; energy efficiency and cleantechnology; water and waste management; sustainable timber and agriculture.- Environmental themes can be accessed through either pure-play investment strategies
(which focus on one particular theme) or through blended investment products (capturinga number of themes concurrently).
– Social themes, encompassing demographic trends such as increasing and agingpopulations, consumption patterns for a rising middle class, investment in low-income areas(such as impact investing), and health issues. Opportunities are typically captured inhealthcare, education and sustainable goods and services.- Social themes are generally accessed through broad sustainability investment strategies
(which combine both environmental and social themes).

DRAFT© MERCER 2016 42
S U S T A I N A B I L I T Y - T H E M E D I N V E S T M E N T SO V E R V I E W
• Comparative return data for five Sustainability-themed Global Equity strategies (asat December 2015)
Source: Mercer Performance Analytics

DRAFT© MERCER 2016 43
S U S T A I N A B I L I T Y - T H E M E D I N V E S T M E N T SO V E R V I E W
• Additional performance characteristics of for five Sustainability-themed GlobalEquity strategies (as at December 2015)
Source: Mercer Performance Analytics

DRAFT© MERCER 2016 44