Embed Size (px)
Citation preview
2008 HEALTH DISPARITIES REPORT
OFFICE OF RURAL HEALTH AND PRIMARY CARE
Produced by the Arkansas Department of Health,
Office of Rural Health & Primary Care, and the Health Statistics Branch via funding provided by
the United States Department of Health and Human Services, Health Resources Services Administration,
Office of Shortage Designation, Grant # 2U68C500160.
Health Statistics Branch

A Look at Health Disparities in Arkansas
* Death Rates are Age-Adjusted Per 100,000 Population 2
2008 HEALTH DISPARITIES REPORT ................................................................................1 OFFICE OF RURAL HEALTH AND PRIMARY CARE ........................................................1
INTRODUCTION................................................................................................................................3 OFFICE OF RURAL HEALTH AND PRIMARY CARE – HEALTH DISPARITIES.................3 Figure 1: Arkansas Leading Causes of Death .................................................................................4 Figure 2: Map Identifying Rural Counties in Arkansas ..................................................................4
#1 HEART DISEASE – (Diseases of the Heart: ICD-10 Codes I00-I09, I11,I13 ,I20-I51) ..............5 Figure 3: 2006 Heart Disease Top Ten Counties ............................................................................5 Table 1: 2006 Race Disparities in Heart Disease.............................................................................5 Figure 4: 2006 Map of Heart Disease Death Rates* in Arkansas ...................................................6 Table 2: Heart Disease County Ranks.............................................................................................6
# 2 CANCER – (Malignant neoplasms: ICD-10 Codes (C00–C97)...................................................9 Figure 5: 2006 Cancer Top Ten Counties .......................................................................................9 Table 3: 2006 Race Disparities in Cancer.......................................................................................9 Figure 6: 2006 Map of Cancer Rate Deaths* in Arkansas ............................................................10 Table 4: 2006 Arkansas Cancer County Ranks..............................................................................10
#3 STROKE (Cerebrovascular diseases: ICD-10 Codes (I60–I69)).................................................13 Figure 7: 2006 Stroke Top Ten Counties .....................................................................................13 Table 5: 2006 Race Disparities in Stroke......................................................................................13 Figure 8: 2006 Map of Stroke Death Rates* in Arkansas.............................................................14 Table 6: 2006 Arkansas Stroke County Ranks..............................................................................14
#4 ACCIDENTS (Unintentional injuries ICD-10 Codes (V01-X59,Y85-Y86) ).............................17 Figure 9: 2006 Accidents (Unintentional Injuries) Top Ten Counties...........................................17 Table 7: 2006 Race Disparities in Accidents (Unintentional Injuries) Rates* .............................17 Figure 10: 2006 Map of Deaths due to Accidents (Unintentional Injuries) in Arkansas..............18 Table 8: 2006 Arkansas Accidents (Unintentional Injuries) Ranks by County ............................18
#5 CHRONIC LOWER RESPIRATORY DISEASE (CLRD): ICD-10 Codes (J40–J47)) .............21 Figure 11: 2006 CLRD Top Ten Counties....................................................................................21 Table 9: 2006 Race Disparities in CLRD......................................................................................21 Figure 12: 2006 Map of Chronic Lower Respiratory Disease Death Rates* in Arkansas............22 Table 10: 2006 CLRD County Ranks ...........................................................................................22
#6 DIABETES (Diabètes mellitus : ICD-10 Codes (E10–E14)) ......................................................25 Figure 13: 2006 Diabetes Top Ten Counties ................................................................................25 Table 11: 2006 Disparities in Race and Arkansas Diabetes Deaths..............................................25 Figure 14: 2006 Map of Arkansas Diabetes Death Rates* ............................................................26 Table 12: 2006 Arkansas Diabetes Ranks by County ...................................................................26
#7 Alzheimer’s disease (ICD-10 code G30) ......................................................................................29 Figure 15: 2006 Alzheimer ’s Disease Top Ten Counties .............................................................29 Table 13: 2006 Disparities in Race and Arkansas Alzheimer’s Disease Deaths ..........................29 Figure 16: 2006 Map of Arkansas Alzheimer’s disease Death Rates* ..........................................30 Table 14: 2004 Arkansas Alzheimer’s Disease Ranks..................................................................30
#8 INFLUENZA AND PNEUMONIA: ICD-10 Codes (J10–J18)....................................................33 Figure 17: 2006 Influenza and Pneumonia Top Ten Counties......................................................33 Table 15: 2006 Race Disparities in Influenza and Pneumonia .....................................................33 Figure 18: 2006 Map of Arkansas Influenza and Pneumonia Death Rates ..................................34 Table 16: 2006 Arkansas Influenza and Pneumonia County Ranks .............................................34
A Look at Health Disparities in Arkansas
* Death Rates are Age-Adjusted Per 100,000 Population 3
INTRODUCTION
OFFICE OF RURAL HEALTH AND PRIMARY CARE – HEALTH DISPARITIES “Healthy People 2010 is a comprehensive set of disease prevention and health promotion objectives for America. The national health objectives are designed to identify the most significant preventable threats to our health and to establish national goals to reduce those threats.
Healthy People 2010 is designed to achieve two overarching goals: Goal 1: Increase Quality and Years of Healthy Life
The first goal … is to help individuals of all ages increase life expectancy and improve their quality of life.1
Goal 2: Eliminate Health Disparities
The second goal … is to eliminate health disparities among different segments of the population.”2
Health disparities have been defined as differences in the incidence (new cases), prevalence (all existing cases), mortality (death), and burden of the disease in question and related adverse health conditions that exist among specific population groups in the United States." 3 This report measures age-adjusted cause of death by state, county, race and gender for the eight leading causes of death in Arkansas. Unless otherwise noted, all data reported are from 2006 mortality data from the Vital Statistics Section of the Health Statistics Branch at the Arkansas Department of Health. Sections follow for each leading cause of death beginning with number one, heart disease, and ending with the eighth, Influenza/Pneumonia. Alzheimer’s disease moved to #7 in front of Influenza/Pneumonia.
NOTE: In an effort to verify under-reporting of American Indians (i.e. Native Americans) on death certificates, the Indian Health Service (IHS) National Epidemiology Program completed a comprehensive linkage of state-provided death certificates to IHS patient records. Arkansas was one of the 14 participating states in the study. Findings determined that over half of the deaths reported as Native Americans by IHS (55%) were not reported as Native Americans on Arkansas death certificates. Until this under-reporting can be addressed at a state-wide level, it is impossible to determine accurate levels of health disparities from mortality data derived from Arkansas death certificates.”4
Countless studies, media reports, and newspaper articles have touted the importance high blood pressure, high blood cholesterol, diabetes, tobacco use, physical inactivity, poor nutrition, and being overweight or obese has on the overall health of individuals and society. By showing only the leading causes of death among Arkansans at a county level, policy-makers and civic leaders can address health issues specific to their communities.
Heart Disease, cancer and stroke (cerebrovascular disease) continue to be the top three leading causes of death nationally as well as for Arkansans. In Arkansas, Accidents (Unintentional Injuries) rates are higher than Chronic Lower Respiratory Disease (CLRD) rates and Alzheimer’s disease rates are higher than Influenza/Pneumonia rates, which is the reverse nationally.

A Look at Health Disparities in Arkansas
Figure 1: Arkansas Leading Causes of Death
23.90
23.92
26.81
47.38
49.09
58.71
195.95
232.71
Influenza/Pneumonia
Alzheimer's Disease
Diabetes
CLRD*
Injury
Stroke
Cancer
Heart Disease
*Chronic Lower Respiratory Disease
Figure 2: Map Identifying Rural Counties in Arkansas
YELL
LEE
WHITE
POLK
POPE
UNION
DREW
SCOTT
PIKE
CLARK
CLAY
DESHA
ASHLEY
BENTON
LOGAN
SALINE
IZARD
LONOKE
NEWTON
ARKANSAS
CROSS
PULASKI
STONE
MADISON
SHARP
GRANT
CHICOT
BOONE
DALLAS
MILLER
PERRY
SEARCY
PRAIRIE
MARION
PHILLIPS
FULTON
SEVIER
JEFFERSON
MISSISSIPPI
POINSETT
GARLAND
NEVADA
BAXTER
GREENE
COLUMBIA
MONROE
WASHINGTON
OUACHITA
JOHNSON
CARROLL
BRADLEY
JACKSON
HOWARD
CONWAY
LINCOLN
CALHOUN
FAULKNER
VAN BUREN
CRAIGHEAD
FRANKLIN
RANDOLPH
HEMPSTEAD
CLEBURNE
MONTGOMERY
LAWRENCE
CRAWFORD
WOODRUFF
ST. FRANCIS
HOT SPRING
INDEPENDENCE
CLEVELAND
CRITTENDENSEBASTIAN
LAFAYETTE
LITTLE RIVER LegendRural & Urban Arkansas Counties
Rural Designated Counties (Non-MSA)
Fayetteville-Springdale-Rogers - AR-MO MSA
Fort Smith - AR-OK MSA
Hot Springs - AR MSA
Jonesboro - AR MSA
Little Rock-North Little Rock-Conway - AR MSA
Memphis - TN-MS-AR MSA
Pine Bluff - AR MSA
Texarkana - TX-Texarkana - AR MSA
* Death Rates are Age-Adjusted Per 100,000 Population 4

A Look at Health Disparities in Arkansas
Fifty-five (73%) of the 75 Counties in Arkansas are considered rural. There were 27,865 resident Arkansas deaths in 2006.
o 50.6% were males and 49.4% were females #1 HEART DISEASE – (Diseases of the Heart: ICD-10 Codes I00-I09, I11,I13 ,I20-I51)
Figure 3: 2006 Heart Disease Top Ten Counties
Arkansas Counties w ith Highest Heart Disease Mortality Rates
395.04 375.66 360.86 354.51 348.25 338.95 328.34 326.63 315.45375.4
St. Francis Poinsett Mississippi Bradley Phillips Desha Woodruff Chicot Lincoln Polk
1 2 3 4 5 6 7 8 9 10
The number one killer of Arkansans is still heart disease. Research shows that 47% of heart attack victims die before emergency medical personnel arrive5 which means that good emergency infrastructure could have a huge impact on Arkansans given to date there is no state trauma network in place. As shown in the Table 1, black males have significantly higher mortality rates for heart disease than white males (356.26 vs. 276.16); black females have significantly higher mortality rates than white females (241.12 vs. 183.00). Overall, males still have a significantly higher mortality rate for heart disease than females.
Table 1: 2006 Race Disparities in Heart Disease Gender Race Deaths Population Death
Rate* 95% Confidence
Interval Males White 3,217 1,133,349 276.16 266.62 - 285.96
Black 498 214,655 356.26 324.45 - 390.25 Native American 10 11,756 95.64 42.74 - 177.25 Asian/Pacific Islander 14 16,254 200.10 96.69 - 362.52All Males 3,739 1,376,014 283.99 274.87 - 293.33
Females White 3,161 1,165,231 183.00 176.55 - 189.59 Black 507 238,250 241.12 220.21 - 263.47 Native American 6 12,080 69.11 24.53 - 152.00 Asian/Pacific Islander 7 17,536 72.14 25.89 - 154.26All Females 3,681 1,433,097 189.47 183.29 - 195.79All Genders All Races 7,420 2,809,111 232.71 227.41 - 238.09
* Death Rates are Age-Adjusted Per 100,000 Population 5
A Look at Health Disparities in Arkansas
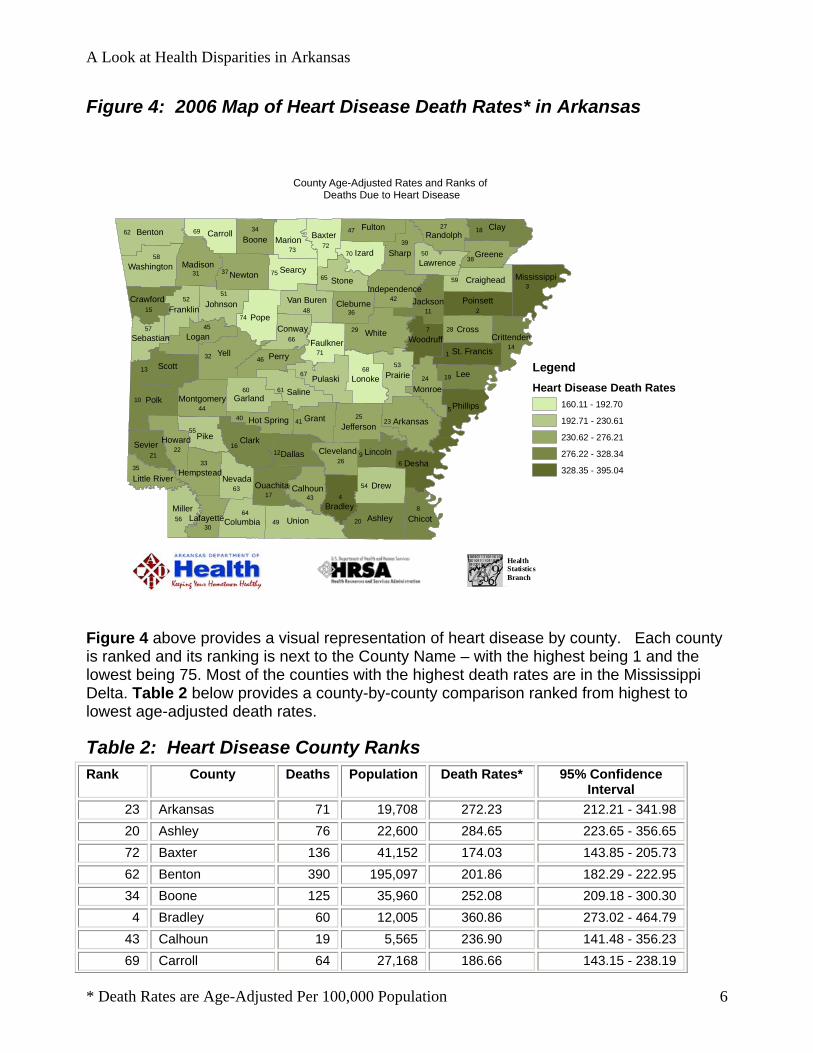
Figure 4: 2006 Map of Heart Disease Death Rates* in Arkansas
Yell
Polk
White
Union
Scott
Clark
Lee
Pope
Drew
Clay
Pike
Ashley
Benton
Desha
Izard
Logan
Miller
Saline
Grant
Pulaski
Arkansas
Newton
Lonoke
Cross
Chicot
Dallas
Stone
Perry
Prairie
Sharp
Phillips
Fulton
Madison
Jefferson
Carroll
Searcy
Marion
Poinsett
Boone Baxter
Garland
Sevier
Mississippi
Bradley
Washington
Monroe
Johnson
Lincoln
Columbia
Nevada
Greene
Faulkner
Calhoun
Conway
Van Buren
Craighead
Randolph
Crawford Cleburne
Montgomery
Lawrence
St. Francis
Cleveland
Little RiverOuachita
JacksonFranklin
Howard
Woodruff
Hempstead
Crittenden
Hot Spring
Lafayette
Sebastian
Independence 3
6
2
5
8
4
1
7
9
29
49
23
58
32
20
25
13
62
16
10
31
74
37
54
6768
44
42
64
45
60
33
48
17
61
59
11
51
75
53
27
71
12
18
73
69
14
47
41
56
28
52
43
24 19
40
65
39
34
63
15
55
5072
36
70
26
22
38
21
66
46
35
57
30
LegendHeart Disease Death Rates
160.11 - 192.70
192.71 - 230.61
230.62 - 276.21
276.22 - 328.34
328.35 - 395.04
County Age-Adjusted Rates and Ranks of Deaths Due to Heart Disease
Health
Statistics Branch
Figure 4 above provides a visual representation of heart disease by county. Each county is ranked and its ranking is next to the County Name – with the highest being 1 and the lowest being 75. Most of the counties with the highest death rates are in the Mississippi Delta. Table 2 below provides a county-by-county comparison ranked from highest to lowest age-adjusted death rates.
Table 2: Heart Disease County Ranks Rank County Deaths Population Death Rates* 95% Confidence
Interval 23 Arkansas 71 19,708 272.23 212.21 - 341.98 20 Ashley 76 22,600 284.65 223.65 - 356.65 72 Baxter 136 41,152 174.03 143.85 - 205.73 62 Benton 390 195,097 201.86 182.29 - 222.95 34 Boone 125 35,960 252.08 209.18 - 300.30
4 Bradley 60 12,005 360.86 273.02 - 464.79 43 Calhoun 19 5,565 236.90 141.48 - 356.23 69 Carroll 64 27,168 186.66 143.15 - 238.19
* Death Rates are Age-Adjusted Per 100,000 Population 6

A Look at Health Disparities in Arkansas
* Death Rates are Age-Adjusted Per 100,000 Population 7
Rank County Deaths Population Death Rates* 95% Confidence Interval
8 Chicot 54 12,532 328.34 246.19 - 425.89 16 Clark 81 23,478 298.03 235.14 - 370.96 18 Clay 73 16,360 288.04 224.15 - 361.50 36 Cleburne 98 25,235 245.82 198.64 - 297.96 26 Cleveland 27 8,690 265.76 174.40 - 386.70 64 Columbia 66 24,635 199.52 153.64 - 252.94 66 Conway 50 20,502 196.85 145.71 - 259.12 59 Craighead 184 89,736 209.84 180.42 - 242.64 15 Crawford 160 58,129 301.34 255.96 - 352.40 14 Crittenden 136 51,833 305.99 256.18 - 362.60 28 Cross 57 18,951 264.65 200.06 - 342.94 12 Dallas 36 8,372 312.87 216.85 - 432.19
6 Desha 60 14,079 348.25 264.43 - 448.10 54 Drew 45 18,786 218.70 159.17 - 292.34 71 Faulkner 150 102,189 184.70 156.16 - 216.92 52 Franklin 54 18,056 220.46 164.69 - 287.21 47 Fulton 45 11,623 235.55 170.19 - 309.35 60 Garland 317 95,253 208.81 185.80 - 233.25 41 Grant 42 17,421 238.87 171.70 - 323.21 38 Greene 109 39,928 240.89 197.64 - 290.53 33 Hempstead 67 23,156 256.03 197.93 - 325.35 40 Hot Spring 93 31,637 239.24 192.77 - 292.87 22 Howard 49 14,141 276.21 202.74 - 366.90 42 Independence 99 34,450 237.09 192.46 - 288.35 70 Izard 40 13,095 185.17 131.66 - 246.56 11 Jackson 65 17,313 314.37 241.66 - 400.47 25 Jefferson 233 80,293 266.88 233.43 - 303.64 51 Johnson 65 24,290 222.64 171.28 - 283.80 30 Lafayette 31 7,798 260.85 174.63 - 367.34 50 Lawrence 56 16,822 225.48 169.21 - 291.40 19 Lee 37 11,043 286.09 200.26 - 394.34
9 Lincoln 50 13,840 326.63 241.20 - 430.46 35 Little River 42 12,919 251.40 180.18 - 338.18 45 Logan 70 22,573 236.44 183.84 - 298.31 68 Lonoke 109 61,879 192.70 157.80 - 232.91 31 Madison 46 15,200 259.14 189.36 - 345.06 73 Marion 44 16,549 171.67 123.16 - 225.15 56 Miller 105 42,732 215.12 175.62 - 260.61
3 Mississippi 184 46,861 375.40 322.80 - 433.95

A Look at Health Disparities in Arkansas
* Death Rates are Age-Adjusted Per 100,000 Population 8
Rank County Deaths Population Death Rates* 95% Confidence Interval
24 Monroe 37 8,913 269.63 188.84 - 362.81 44 Montgomery 33 9,067 236.90 162.84 - 324.21 63 Nevada 26 9,446 201.58 129.72 - 295.76 37 Newton 28 8,372 243.46 160.49 - 342.98 17 Ouachita 106 26,344 296.80 242.19 - 358.42 46 Perry 31 10,246 235.72 159.87 - 332.82
5 Phillips 92 22,583 354.51 284.83 - 434.19 55 Pike 34 10,795 218.06 150.28 - 300.79
2 Poinsett 106 24,919 375.66 307.22 - 454.26 10 Polk 89 20,221 315.45 252.38 - 387.34 74 Pope 103 58,429 160.73 131.01 - 194.98 53 Prairie 27 8,854 219.28 143.95 - 312.35 67 Pulaski 731 372,548 196.08 182.03 - 210.93 27 Randolph 66 18,200 265.18 203.69 - 337.35
1 Saint Francis 110 27,146 395.04 324.13 - 476.62 61 Saline 193 93,109 203.01 175.20 - 233.95 13 Scott 41 11,211 308.07 219.89 - 418.27 75 Searcy 20 8,064 160.11 96.35 - 242.86 57 Sebastian 279 120,351 212.25 187.87 - 238.88 21 Sevier 49 16,220 282.19 208.31 - 373.27 39 Sharp 72 17,889 240.79 186.38 - 301.37 65 Stone 36 11,951 199.15 138.26 - 270.81 49 Union 134 43,580 228.41 190.60 - 270.90 48 Van Buren 65 16,424 230.61 175.61 - 290.87 58 Washington 316 190,432 210.03 187.29 - 234.75 29 White 221 72,621 263.87 229.97 - 301.16
7 Woodruff 37 7,865 338.95 236.45 - 464.94 32 Yell 68 21,677 257.46 199.29 - 326.58
Combined Counties
7,420 2,809,111 232.71 227.41 - 238.09

A Look at Health Disparities in Arkansas
# 2 CANCER – (Malignant neoplasms: ICD-10 Codes (C00–C97)
Figure 5: 2006 Cancer Top Ten Counties
Arkansas Counties w ith the Highest Death Rates for Cancer
269.14
285.63
268.13257.8 257.52 256.15 253.41
244.99 243.04 242.14
St.Francis
Cross Phillips Union Izard Sevier Perry Ouachita Prairie Logan
1 2 3 4 5 6 7 8 9 10
With the exception of Perry County, all of the top ten counties with the highest cancer mortality rates are in rural counties (see map on page 4)
Table 3: 2006 Race Disparities in Cancer Gender Race Deaths Population Death
Rates* 95%
Confidence Interval
Males White 2,925 1,133,349 241.82 233.06 - 250.83 Black 427 214,655 325.17 293.97 - 358.72 Native American 5 11,756 59.2 17.43 - 142.44 Asian/Pacific Islander 10 16,254 110.97 42.39 - 229.76All Males All Races 3,367 1,376,014 248.14 239.75 - 256.75
Females White 2,413 1,165,231 155.81 149.56 - 162.23 Black 373 238,250 187.26 168.48 - 207.54 Native American 6 12,080 62.84 21.77 - 139.46 Asian/Pacific Islander 14 17,536 127.74 66.90 - 211.37All Females All Races 2,806 1,433,097 158.86 152.96 - 164.91All Genders All Races 6,173 2,809,111 195.95 191.07 - 200.92
Cancer is the second leading cause of death in both the U.S. and Arkansas. Nationally there is a 23% higher rate for blacks than whites in the U.S. Diagnosis occurs at much later stages of disease for blacks than other races.6 This is important to note considering cancer follows the same trend as Heart Disease with significantly higher rates for black males over white males; significantly higher for all males than all females, and significantly higher for black females more than white females.
* Death Rates are Age-Adjusted Per 100,000 Population 9

A Look at Health Disparities in Arkansas
Figure 6: 2006 Map of Cancer Rate Deaths* in Arkansas
Yell
Polk
White
Union
Scott
Clark
Lee
Pope
Drew
Clay
Pike
Ashley
Benton
Desha
Izard
Logan
Miller
Saline
Grant
Pulaski
Arkansas
Newton
Lonoke
Cross
Chicot
Dallas
Stone
Perry
Prairie
Sharp
Phillips
Fulton
Madison
Jefferson
Carroll
Searcy
Marion
Poinsett
Boone Baxter
Garland
Sevier
Mississippi
Bradley
Washington
Monroe
Johnson
Lincoln
Columbia
Nevada
Greene
Faulkner
Calhoun
Conway
Van Buren
Craighead
Randolph
Crawford Cleburne
Montgomery
Lawrence
St. Francis
Cleveland
Little RiverOuachita
JacksonFranklin
Howard
Woodruff
Hempstead
Crittenden
Hot Spring
Lafayette
Sebastian
Independence
4
8
3
9
1
2
5
6
7
44
58
47
29
56
34
32
17
67
68
37
43
59
71
11
30
26
3653
52
39
22
10
61
14
64
55
51
33
15
42
57
50
21
24
23
40
66
70
20
18
25
38
46
75
13 54
27
19
31
45
28
62
73
6048
35
72
69
12
16
63
6549
41
74
LegendCancer Death Rates
125.70 - 165.18
165.19 - 191.65
191.66 - 219.21
219.22 - 244.99
245.00 - 285.63
County Age-Adjusted Rates of Deaths Due to Cancer
Health
Statistics Branch
Table 4: 2006 Arkansas Cancer County Ranks Rank County Deaths Population Death Rates* 95% Confidence
Interval 58 Arkansas 46 19,708 179.44 130.93 - 238.22 34 Ashley 54 22,600 204.75 153.40 - 267.28 48 Baxter 141 41,152 187.74 156.42 - 220.51 67 Benton 311 195,097 161.14 143.68 - 180.12 45 Boone 93 35,960 194.2 156.40 - 237.57 70 Bradley 24 12,005 149.46 95.37 - 219.84 75 Calhoun 8 5,565 125.7 53.20 - 243.62 40 Carroll 69 27,168 199.12 154.53 - 251.44 15 Chicot 36 12,532 230.68 160.71 - 318.30 68 Clark 40 23,478 156.68 111.26 - 213.09 24 Clay 48 16,360 208.68 152.46 - 276.75 35 Cleburne 79 25,235 203.55 160.20 - 252.42 69 Cleveland 16 8,690 153.07 87.02 - 248.02
* Death Rates are Age-Adjusted Per 100,000 Population 10

A Look at Health Disparities in Arkansas
* Death Rates are Age-Adjusted Per 100,000 Population 11
Rank County Deaths Population Death Rates* 95% Confidence Interval
22 Columbia 63 24,635 212.23 162.70 - 270.80 63 Conway 43 20,502 171.49 123.67 - 230.75 51 Craighead 163 89,736 185.46 157.92 - 216.39 62 Crawford 101 58,129 175.23 142.33 - 213.35 20 Crittenden 96 51,833 213.76 172.60 - 261.71 2 Cross 58 18,951 269.14 204.08 - 347.83 21 Dallas 25 8,372 212.37 136.28 - 310.17 26 Desha 35 14,079 208.15 144.50 - 288.21 30 Drew 42 18,786 207.13 148.88 - 279.85 50 Faulkner 156 102,189 186.24 157.89 - 218.19 46 Franklin 44 18,056 191.65 138.66 - 256.72 18 Fulton 38 11,623 219.21 152.76 - 298.76 61 Garland 253 95,253 176.27 154.68 - 199.49 25 Grant 38 17,421 208.58 146.84 - 287.06 16 Greene 97 39,928 221.96 179.82 - 270.81 14 Hempstead 60 23,156 231.86 176.60 - 298.45 27 Hot Spring 80 31,637 208.06 164.72 - 258.69 12 Howard 40 14,141 237.01 168.36 - 323.74 39 Independence 83 34,450 200.03 159.10 - 247.68 5 Izard 49 13,095 257.52 187.90 - 340.61 66 Jackson 35 17,313 161.17 111.98 - 222.48 32 Jefferson 176 80,293 205.53 176.08 - 238.39 33 Johnson 56 24,290 204.91 154.34 - 266.22 74 Lafayette 16 7,798 142.41 81.01 - 225.04 60 Lawrence 40 16,822 176.84 125.58 - 239.75 54 Lee 24 11,043 184.27 117.54 - 273.03 65 Lincoln 23 13,840 165.18 104.17 - 247.52 49 Little River 31 12,919 186.93 126.26 - 263.45 10 Logan 69 22,573 242.14 188.16 - 305.82 53 Lonoke 107 61,879 184.29 150.57 - 223.18 43 Madison 34 15,200 197.3 135.99 - 275.86 23 Marion 54 16,549 210.52 155.43 - 271.56 38 Miller 98 42,732 201.03 162.99 - 245.03 56 Mississippi 88 46,861 180.08 144.19 - 222.01 13 Monroe 32 8,913 232.8 158.37 - 319.64 52 Montgomery 25 9,067 184.83 118.91 - 266.41 28 Nevada 24 9,446 207.91 132.23 - 308.96 71 Newton 17 8,372 148.3 84.99 - 230.21 8 Ouachita 87 26,344 244.99 195.87 - 300.99
A Look at Health Disparities in Arkansas
* Death Rates are Age-Adjusted Per 100,000 Population 12
Rank County Deaths Population Death Rates* 95% Confidence Interval
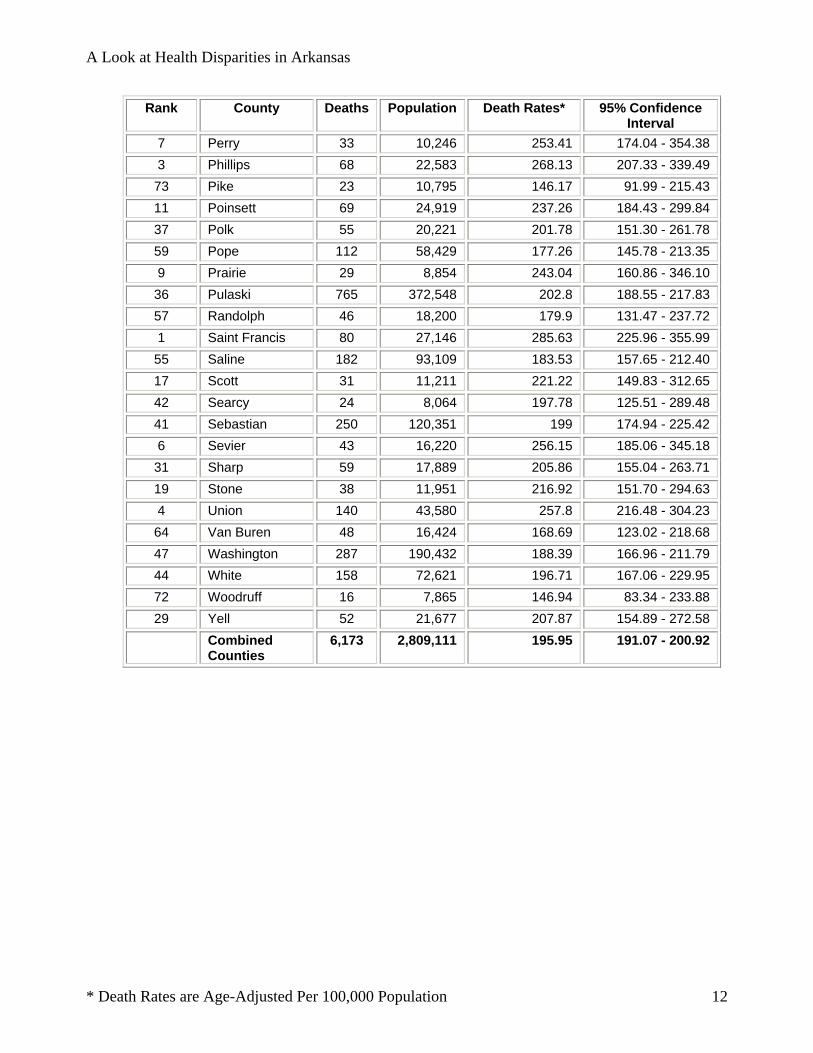
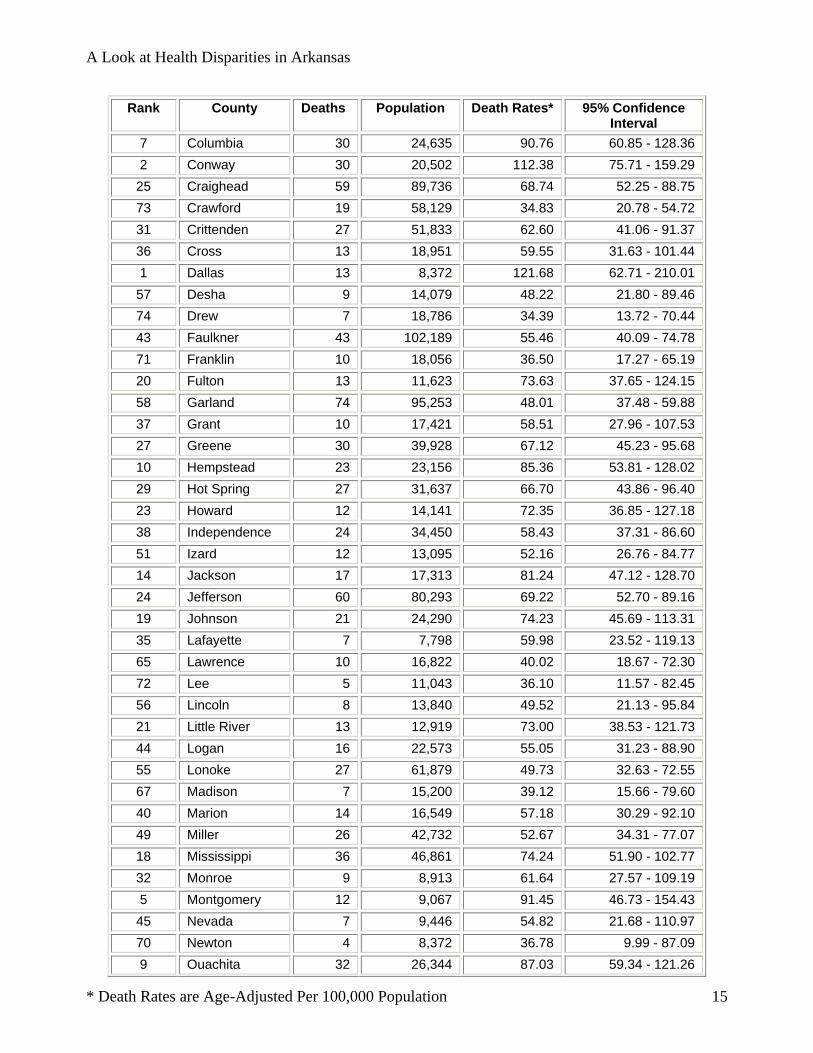
7 Perry 33 10,246 253.41 174.04 - 354.38 3 Phillips 68 22,583 268.13 207.33 - 339.49 73 Pike 23 10,795 146.17 91.99 - 215.43 11 Poinsett 69 24,919 237.26 184.43 - 299.84 37 Polk 55 20,221 201.78 151.30 - 261.78 59 Pope 112 58,429 177.26 145.78 - 213.35 9 Prairie 29 8,854 243.04 160.86 - 346.10 36 Pulaski 765 372,548 202.8 188.55 - 217.83 57 Randolph 46 18,200 179.9 131.47 - 237.72 1 Saint Francis 80 27,146 285.63 225.96 - 355.99 55 Saline 182 93,109 183.53 157.65 - 212.40 17 Scott 31 11,211 221.22 149.83 - 312.65 42 Searcy 24 8,064 197.78 125.51 - 289.48 41 Sebastian 250 120,351 199 174.94 - 225.42 6 Sevier 43 16,220 256.15 185.06 - 345.18 31 Sharp 59 17,889 205.86 155.04 - 263.71 19 Stone 38 11,951 216.92 151.70 - 294.63 4 Union 140 43,580 257.8 216.48 - 304.23 64 Van Buren 48 16,424 168.69 123.02 - 218.68 47 Washington 287 190,432 188.39 166.96 - 211.79 44 White 158 72,621 196.71 167.06 - 229.95 72 Woodruff 16 7,865 146.94 83.34 - 233.88 29 Yell 52 21,677 207.87 154.89 - 272.58 Combined
Counties 6,173 2,809,111 195.95 191.07 - 200.92

A Look at Health Disparities in Arkansas
#3 STROKE (Cerebrovascular diseases: ICD-10 Codes (I60–I69)) Stroke was the third leading cause of death in Arkansas. The age-adjusted mortality rate is about 31% higher than the U.S. rate. Cigarette smoking almost doubles a person's risk for ischemic stroke, independent of other risk factors. Nationally, twice as many blacks that have a stroke die from the event compared to whites.7
Figure 7: 2006 Stroke Top Ten Counties
Arkansas Counties with the Highest Death Rates* for Stroke
121.68 112.38 104.40 104.4091.45 91.31 90.76 87.93 87.03 85.36
Dallas Conway Arkansas Phillips M ontgomery Ashley Columbia Bradley Ouachita Hempstead
1 2 3 4 5 6 7 8 9 10
The trend continues with black males having significantly higher rates than white males and black females significantly higher than white females. However, the rates for all males vs. all females are not significantly different.
Table 5: 2006 Race Disparities in Stroke Gender Race Deaths Population Death
Rates* 95% Confidence
Interval Males White 587 1,133,349 51.98 47.83 - 56.39
Black 130 214,655 101.8 84.53 - 121.51 Native American 2 11,756 24.92 2.21 - 98.59 Asian/Pacific
Islander 3 16,254 40.01 4.39 - 147.97
All Males All Races 722 1,376,014 56.86 52.76 - 61.20Females White 961 1,165,231 55.04 51.56 - 58.66
Black 186 238,250 90.25 77.52 - 104.46 Native American 10 12,080 116.87 53.62 - 220.47 Asian/Pacific
Islander 3 17,536 34.71 7.00 - 97.74
All Females All Races 1,160 1,433,097 59.38 55.96 - 62.94All Genders All Races 1,882 2,809,111 58.71 56.07 - 61.43
* Death Rates are Age-Adjusted Per 100,000 Population 13

A Look at Health Disparities in Arkansas
Figure 8: 2006 Map of Stroke Death Rates* in Arkansas
Yell
Polk
White
Union
Scott
Clark
Lee
Pope
Drew
Clay
Pike
Ashley
Benton
Desha
Izard
Logan
Miller
Saline
Grant
Pulaski
Arkansas
Newton
Lonoke
Cross
Chicot
Dallas
Stone
Perry
Prairie
Sharp
Phillips
Fulton
Madison
Jefferson
Carroll
Searcy
Marion
Poinsett
Boone Baxter
Garland
Sevier
Mississippi
Bradley
Washington
Monroe
Johnson
Lincoln
Columbia
Nevada
Greene
Faulkner
Calhoun
Conway
Van Buren
Craighead
Randolph
Crawford Cleburne
Montgomery
Lawrence
St. Francis
Cleveland
Little RiverOuachita
JacksonFranklin
Howard
Woodruff
Hempstead
Crittenden
Hot Spring
Lafayette
Sebastian
Independence
3
6
5
7
9
4
1
8
217
16
52
15
18
24
66
62
33
60
67
47
70
74
57
4255
38
64
44
58
10
68
46
25
19
26
28
34
50
43
69
40
22
14
4131
11
20
37
49
36
71
75
32 72
29
59
53
39
45
73
13
6548
30
12
51
23
27
5456
63
21
61
35
LegendCLRD Death Rates
0.00 - 40.02
40.03 - 53.73
53.74 - 67.12
67.13 - 87.93
87.94 - 121.68
County Age-Adjusted Rates and Ranks of Deaths Due to Chronic Lower Respiratory Disease
Health
Statistics Branch
Table 6: 2006 Arkansas Stroke County Ranks
Rank County Deaths Population Death Rates* 95% Confidence Interval
3 Arkansas 26 19,708 104.40 67.49 - 152.79 6 Ashley 24 22,600 91.31 58.15 - 136.07
48 Baxter 47 41,152 53.73 38.95 - 68.09 62 Benton 85 195,097 44.14 35.25 - 54.58 39 Boone 29 35,960 57.42 38.27 - 81.78 8 Bradley 15 12,005 87.93 48.73 - 142.31
75 Calhoun 0 5,565 0.00 0.00 - 0.00 22 Carroll 25 27,168 72.77 46.87 - 106.74 26 Chicot 11 12,532 68.59 34.21 - 119.91 33 Clark 17 23,478 61.18 35.31 - 96.73 69 Clay 10 16,360 37.72 18.02 - 66.06 30 Cleburne 27 25,235 63.95 42.11 - 89.50 11 Cleveland 8 8,690 83.53 35.72 - 164.81
* Death Rates are Age-Adjusted Per 100,000 Population 14
A Look at Health Disparities in Arkansas
* Death Rates are Age-Adjusted Per 100,000 Population 15
Rank County Deaths Population Death Rates* 95% Confidence Interval
7 Columbia 30 24,635 90.76 60.85 - 128.36 2 Conway 30 20,502 112.38 75.71 - 159.29
25 Craighead 59 89,736 68.74 52.25 - 88.75 73 Crawford 19 58,129 34.83 20.78 - 54.72 31 Crittenden 27 51,833 62.60 41.06 - 91.37 36 Cross 13 18,951 59.55 31.63 - 101.44 1 Dallas 13 8,372 121.68 62.71 - 210.01
57 Desha 9 14,079 48.22 21.80 - 89.46 74 Drew 7 18,786 34.39 13.72 - 70.44 43 Faulkner 43 102,189 55.46 40.09 - 74.78 71 Franklin 10 18,056 36.50 17.27 - 65.19 20 Fulton 13 11,623 73.63 37.65 - 124.15 58 Garland 74 95,253 48.01 37.48 - 59.88 37 Grant 10 17,421 58.51 27.96 - 107.53 27 Greene 30 39,928 67.12 45.23 - 95.68 10 Hempstead 23 23,156 85.36 53.81 - 128.02 29 Hot Spring 27 31,637 66.70 43.86 - 96.40 23 Howard 12 14,141 72.35 36.85 - 127.18 38 Independence 24 34,450 58.43 37.31 - 86.60 51 Izard 12 13,095 52.16 26.76 - 84.77 14 Jackson 17 17,313 81.24 47.12 - 128.70 24 Jefferson 60 80,293 69.22 52.70 - 89.16 19 Johnson 21 24,290 74.23 45.69 - 113.31 35 Lafayette 7 7,798 59.98 23.52 - 119.13 65 Lawrence 10 16,822 40.02 18.67 - 72.30 72 Lee 5 11,043 36.10 11.57 - 82.45 56 Lincoln 8 13,840 49.52 21.13 - 95.84 21 Little River 13 12,919 73.00 38.53 - 121.73 44 Logan 16 22,573 55.05 31.23 - 88.90 55 Lonoke 27 61,879 49.73 32.63 - 72.55 67 Madison 7 15,200 39.12 15.66 - 79.60 40 Marion 14 16,549 57.18 30.29 - 92.10 49 Miller 26 42,732 52.67 34.31 - 77.07 18 Mississippi 36 46,861 74.24 51.90 - 102.77 32 Monroe 9 8,913 61.64 27.57 - 109.19 5 Montgomery 12 9,067 91.45 46.73 - 154.43
45 Nevada 7 9,446 54.82 21.68 - 110.97 70 Newton 4 8,372 36.78 9.99 - 87.09 9 Ouachita 32 26,344 87.03 59.34 - 121.26

A Look at Health Disparities in Arkansas
* Death Rates are Age-Adjusted Per 100,000 Population 16
Rank County Deaths Population Death Rates* 95% Confidence Interval
63 Perry 6 10,246 44.06 16.09 - 93.75 4 Phillips 28 22,583 104.40 69.26 - 148.75
13 Pike 13 10,795 81.70 43.14 - 135.36 64 Poinsett 12 24,919 43.58 22.40 - 75.96 60 Polk 14 20,221 45.91 24.89 - 74.77 47 Pope 35 58,429 54.29 37.73 - 75.42 34 Prairie 8 8,854 60.76 25.93 - 112.89 42 Pulaski 207 372,548 56.62 49.13 - 64.93 50 Randolph 14 18,200 52.19 28.41 - 84.98 41 Saint Francis 16 27,146 56.80 32.22 - 92.52 46 Saline 52 93,109 54.62 40.71 - 71.73 66 Scott 5 11,211 39.53 12.75 - 91.39 28 Searcy 9 8,064 66.76 30.32 - 118.62 61 Sebastian 60 120,351 44.82 34.12 - 57.75 54 Sevier 8 16,220 49.94 21.47 - 98.43 53 Sharp 16 17,889 50.95 28.31 - 79.71 59 Stone 9 11,951 47.65 21.78 - 83.37 16 Union 47 43,580 76.71 55.86 - 102.05 68 Van Buren 13 16,424 38.33 20.23 - 57.38 52 Washington 75 190,432 51.64 40.56 - 64.81 17 White 65 72,621 75.99 58.55 - 96.77 12 Woodruff 9 7,865 83.13 37.65 - 153.11 15 Yell 21 21,677 77.50 47.68 - 118.19 Combined
Counties 1,882 2,809,111 58.71 56.07 - 61.43

A Look at Health Disparities in Arkansas
#4 ACCIDENTS (Unintentional injuries ICD-10 Codes (V01-X59,Y85-Y86) )
Figure 9: 2006 Accidents (Unintentional Injuries) Top Ten Counties
Arkansas Counties w ith Highest Rates for Unintentional Injuries
130.88 126.56106.18 106.06 103.85 103.44 97.83 92.95 92.19 84.47
Nevada Dallas M ontgomery M adison Lafayette Jackson Lawrence Woodruff Perry Yell
1 2 3 4 5 6 7 8 9 10
Accidents (Unintentional injuries) accounted for slightly over five percent of the total 27,865 Arkansas deaths. Over half of these deaths were due to motor vehicle accidents. Though no race differences existed, males had a significantly higher rate of deaths than females.
Table 7: 2006 Race Disparities in Accidents (Unintentional Injuries) Rates*
Gender Race Deaths Population Death Rates*
95% Confidence
Interval Males White 783 1,133,349 69.27 64.47 - 74.32
Black 124 214,655 64.55 53.06 - 77.42 Native American 6 11,756 55.9 19.75 - 115.71 Asian/Pacific Islander 11 16,254 77.45 34.77 - 123.86All Males All Races 924 1,376,014 68.18 63.82 - 72.75
Females White 424 1,165,231 32.55 29.42 - 35.90 Black 58 238,250 26.96 20.36 - 35.00 Native American 1 12,080 8.37 0.21 - 43.98 Asian/Pacific Islander 3 17,536 22.51 3.53 - 67.02All Females All Races 486 1,433,097 31.04 28.28 - 33.99All Genders All Races 1,410 2,809,111 49.09 46.54 - 51.74
* Death Rates are Age-Adjusted Per 100,000 Population 17

A Look at Health Disparities in Arkansas
Figure 10: 2006 Map of Deaths due to Accidents (Unintentional Injuries) in Arkansas
Yell
Polk
White
Union
Scott
Clark
Lee
Pope
Drew
Clay
Pike
Ashley
Benton
Desha
Izard
Logan
Miller
Saline
Grant
Pulaski
Arkansas
Newton
Lonoke
Cross
Chicot
Dallas
Stone
Perry
Prairie
Sharp
Phillips
Fulton
Madison
Jefferson
Carroll
Searcy
Marion
Poinsett
Boone Baxter
Garland
Sevier
Mississippi
Bradley
Washington
Monroe
Johnson
Lincoln
Columbia
Nevada
Greene
Faulkner
Calhoun
Conway
Van Buren
Craighead
Randolph
Crawford Cleburne
Montgomery
Lawrence
St. Francis
Cleveland
Little RiverOuachita
JacksonFranklin
Howard
Woodruff
Hempstead
Crittenden
Hot Spring
Lafayette
Sebastian
Independence
4
3
2
6
1
7
8
9
5
46
31
66
48
10
21
29
56
65
61
34
33
67
47
53
19
5939
38
20
60
13
52
57
16
36
50
18
28
42
35
23
69
37
43
22
74
12
40
5141
71
64
63
49
73
32
15 72
30
75
27
25
44
70
11
17
14
68
54
26
24
45
55
58
62
LegendAccidents
21.63 - 30.18
30.19 - 48.17
48.18 - 65.94
65.95 - 92.95
92.96 - 130.88
County Age-Adjusted Rates and Ranks of Deaths Due to Accidents
Health
Statistics Branch
Table 8: 2006 Arkansas Accidents (Unintentional Injuries) Ranks by County
Rank County Deaths Population Death Rates* 95% Confidence
Interval 66 Arkansas 7 19,708 35.98 14.14 - 74.83 29 Ashley 15 22,600 59.36 32.75 - 98.64 17 Baxter 34 41,152 75.31 50.15 - 108.33 61 Benton 76 195,097 39.69 31.24 - 49.71 25 Boone 24 35,960 61.74 39.03 - 92.66 40 Bradley 7 12,005 51.69 20.25 - 106.95 32 Calhoun 3 5,565 57.39 11.61 - 166.34 12 Carroll 22 27,168 81.24 50.35 - 123.86 35 Chicot 8 12,532 54.14 23.12 - 105.58
* Death Rates are Age-Adjusted Per 100,000 Population 18
A Look at Health Disparities in Arkansas
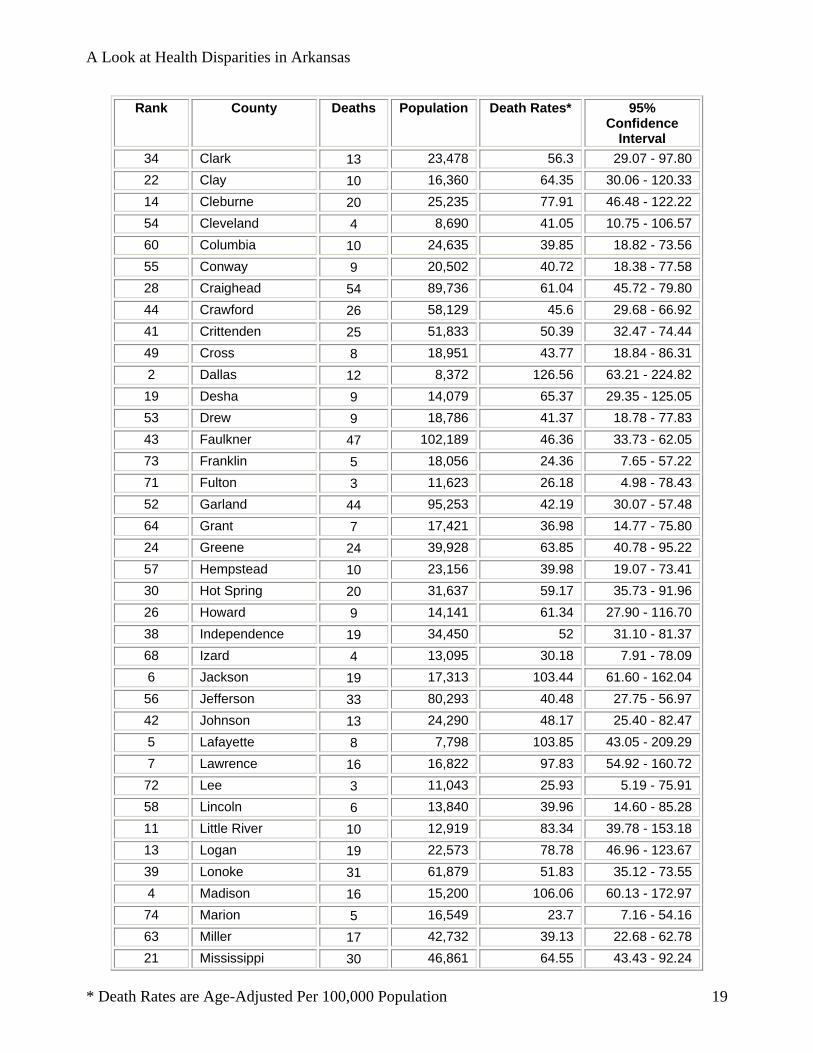
* Death Rates are Age-Adjusted Per 100,000 Population 19
Rank County Deaths Population Death Rates* 95% Confidence
Interval 34 Clark 13 23,478 56.3 29.07 - 97.80 22 Clay 10 16,360 64.35 30.06 - 120.33 14 Cleburne 20 25,235 77.91 46.48 - 122.22 54 Cleveland 4 8,690 41.05 10.75 - 106.57 60 Columbia 10 24,635 39.85 18.82 - 73.56 55 Conway 9 20,502 40.72 18.38 - 77.58 28 Craighead 54 89,736 61.04 45.72 - 79.80 44 Crawford 26 58,129 45.6 29.68 - 66.92 41 Crittenden 25 51,833 50.39 32.47 - 74.44 49 Cross 8 18,951 43.77 18.84 - 86.31 2 Dallas 12 8,372 126.56 63.21 - 224.82 19 Desha 9 14,079 65.37 29.35 - 125.05 53 Drew 9 18,786 41.37 18.78 - 77.83 43 Faulkner 47 102,189 46.36 33.73 - 62.05 73 Franklin 5 18,056 24.36 7.65 - 57.22 71 Fulton 3 11,623 26.18 4.98 - 78.43 52 Garland 44 95,253 42.19 30.07 - 57.48 64 Grant 7 17,421 36.98 14.77 - 75.80 24 Greene 24 39,928 63.85 40.78 - 95.22 57 Hempstead 10 23,156 39.98 19.07 - 73.41 30 Hot Spring 20 31,637 59.17 35.73 - 91.96 26 Howard 9 14,141 61.34 27.90 - 116.70 38 Independence 19 34,450 52 31.10 - 81.37 68 Izard 4 13,095 30.18 7.91 - 78.09 6 Jackson 19 17,313 103.44 61.60 - 162.04 56 Jefferson 33 80,293 40.48 27.75 - 56.97 42 Johnson 13 24,290 48.17 25.40 - 82.47 5 Lafayette 8 7,798 103.85 43.05 - 209.29 7 Lawrence 16 16,822 97.83 54.92 - 160.72 72 Lee 3 11,043 25.93 5.19 - 75.91 58 Lincoln 6 13,840 39.96 14.60 - 85.28 11 Little River 10 12,919 83.34 39.78 - 153.18 13 Logan 19 22,573 78.78 46.96 - 123.67 39 Lonoke 31 61,879 51.83 35.12 - 73.55 4 Madison 16 15,200 106.06 60.13 - 172.97 74 Marion 5 16,549 23.7 7.16 - 54.16 63 Miller 17 42,732 39.13 22.68 - 62.78 21 Mississippi 30 46,861 64.55 43.43 - 92.24

A Look at Health Disparities in Arkansas
* Death Rates are Age-Adjusted Per 100,000 Population 20
Rank County Deaths Population Death Rates* 95% Confidence
Interval 15 Monroe 7 8,913 77.91 29.82 - 163.91 3 Montgomery 9 9,067 106.18 46.75 - 206.10 1 Nevada 12 9,446 130.88 66.75 - 230.36 47 Newton 4 8,372 44.66 11.57 - 113.55 36 Ouachita 16 26,344 53.73 30.13 - 87.86 9 Perry 10 10,246 92.19 43.59 - 170.62 18 Phillips 14 22,583 65.94 35.12 - 112.21 70 Pike 3 10,795 27.46 5.47 - 80.75 20 Poinsett 16 24,919 64.81 36.74 - 105.71 33 Polk 13 20,221 57.31 29.87 - 98.80 67 Pope 21 58,429 35.06 21.62 - 53.65 69 Prairie 3 8,854 28.21 5.48 - 81.65 59 Pulaski 146 372,548 39.89 33.65 - 46.96 37 Randolph 9 18,200 53.68 24.06 - 103.10 51 Saint Francis 12 27,146 43.11 22.20 - 75.22 50 Saline 41 93,109 43.52 31.15 - 59.15 65 Scott 4 11,211 36.57 9.72 - 94.49 23 Searcy 7 8,064 64.11 24.02 - 134.57 62 Sebastian 47 120,351 39.21 28.74 - 52.23 45 Sevier 8 16,220 45.09 19.29 - 88.80 27 Sharp 11 17,889 61.14 29.29 - 112.08 75 Stone 2 11,951 21.63 2.57 - 78.55 31 Union 27 43,580 57.63 37.49 - 84.58 16 Van Buren 12 16,424 76.82 38.36 - 136.86 48 Washington 74 190,432 44 34.40 - 55.42 46 White 33 72,621 44.93 30.78 - 63.27 8 Woodruff 7 7,865 92.95 37.05 - 191.59 10 Yell 19 21,677 84.47 50.50 - 132.39 Combined
Counties 1,410 2,809,111 49.09 46.54 - 51.74

A Look at Health Disparities in Arkansas
#5 CHRONIC LOWER RESPIRATORY DISEASE (CLRD): ICD-10 Codes (J40–J47))
Figure 11: 2006 CLRD Top Ten Counties
Arkansas Counties w ith Highest Chronic Leading Respiratory Disease Death Rates*
89.3982.13 79.97 73.85 73.42 70.89 70.33 69.48 69.17 67.62
Jackson Polk Greene Union M iller Franklin Izard Hempstead Calhoun Pope
1 2 3 4 5 6 7 8 9 10
Nationally, chronic lower respiratory disease, which comprises bronchitis, emphysema, asthma, and chronic airway obstruction, is the fourth most common cause of death.8
Table 9: 2006 Race Disparities in CLRD Gender Race Deaths Population Death
Rates* 95%
Confidence Interval
Males White 741 1,133,349 63.29 58.78 - 68.05 Black 43 214,655 34.29 24.47 - 46.70 Native American 1 11,756 8.46 0.21 - 42.86 Asian/Pacific Islander 1 16,254 27.69 0.70 - 154.29All Males All Races 786 1,376,014 60.3 56.12 - 64.70
Females White 672 1,165,231 41.54 38.42 - 44.82 Black 36 238,250 17.04 11.86 - 23.69
Native American 3 12,080 48.39 9.98 - 141.42 Asian/Pacific Islander 1 17,536 5.9 0.15 - 27.94All Females All Races 712 1,433,097 38.75 35.92 - 41.72All Genders All Races 1,498 2,809,111 47.38 45.00 - 49.85
Unlike every other cause of death to this point, CLRD disproportionately affects whites in both genders. Both have significantly higher death rates than their black counterparts do.
* Death Rates are Age-Adjusted Per 100,000 Population 21

A Look at Health Disparities in Arkansas
Figure 12: 2006 Map of Chronic Lower Respiratory Disease Death Rates* in Arkansas
Yell
Polk
White
Union
Scott
Clark
Lee
Pope
Drew
Clay
Pike
Ashley
Benton
Desha
Izard
Logan
Miller
Saline
Grant
Pulaski
Arkansas
Newton
Lonoke
Cross
Chicot
Dallas
Stone
Perry
Prairie
Sharp
Phillips
Fulton
Madison
Jefferson
Carroll
Searcy
Marion
Poinsett
Boone Baxter
Garland
Sevier
Mississippi
Bradley
Washington
Monroe
Johnson
Lincoln
Columbia
Nevada
Greene
Faulkner
Calhoun
Conway
Van Buren
Craighead
Randolph
Crawford Cleburne
Montgomery
Lawrence
St. Francis
Cleveland
Little RiverOuachita
JacksonFranklin
Howard
Woodruff
Hempstead
Crittenden
Hot Spring
Lafayette
Sebastian
Independence
4
2
8
1
5
6
9
7 3
24
16
11
29
19
32
69
74
61
71
64
10
15
73
22
4521
39
70
18
33
65
37
28
51
50
14
25
47
59
48
72
42
31
17
43
62
66
67
3053
12
38
56
75 36
20
40
58
63
57
35
68
4441
27
13
52
4954
46
23
55
60
26
34
LegendCLRD Death Rates
5.72 - 18.50
18.51 - 37.64
37.65 - 50.16
50.17 - 64.53
64.54 - 89.39
County Age-Adjusted Rates* and Ranks of Deaths Due to Chronic Lower Respiratory Disease
Health
Statistics Branch
Table 10: 2006 CLRD County Ranks
Rank County Deaths Population Death Rates* 95% Confidence
Interval 16 Arkansas 16 19,708 61.40 35.00 - 97.94 32 Ashley 13 22,600 50.75 26.83 - 86.83 41 Baxter 36 41,152 43.16 29.94 - 56.28 61 Benton 67 195,097 34.97 27.09 - 44.42 63 Boone 17 35,960 34.11 19.76 - 53.88 67 Bradley 5 12,005 30.57 9.80 - 69.01
9 Calhoun 4 5,565 69.17 17.16 - 182.36 66 Carroll 11 27,168 30.70 15.29 - 53.71 59 Chicot 6 12,532 36.03 13.18 - 75.64 71 Clark 7 23,478 24.71 9.67 - 50.03
* Death Rates are Age-Adjusted Per 100,000 Population 22

A Look at Health Disparities in Arkansas
* Death Rates are Age-Adjusted Per 100,000 Population 23
Rank County Deaths Population Death Rates* 95% Confidence
Interval 43 Clay 11 16,360 42.52 21.14 - 72.99 27 Cleburne 21 25,235 52.77 32.13 - 79.09 52 Cleveland 4 8,690 37.64 10.07 - 95.80 33 Columbia 15 24,635 50.16 27.94 - 81.67 46 Conway 11 20,502 41.34 20.57 - 72.85 25 Craighead 47 89,736 54.62 40.06 - 72.70 35 Crawford 27 58,129 48.66 31.88 - 71.05 53 Crittenden 17 51,833 37.25 21.52 - 59.91 56 Cross 8 18,951 36.76 15.79 - 72.11 17 Dallas 7 8,372 58.32 22.88 - 117.06 22 Desha 9 14,079 56.11 25.49 - 105.38 73 Drew 4 18,786 18.50 4.99 - 46.67 31 Faulkner 41 102,189 51.87 37.13 - 70.51
6 Franklin 17 18,056 70.89 41.12 - 112.03 12 Fulton 12 11,623 64.53 32.99 - 106.20 37 Garland 72 95,253 47.06 36.61 - 58.88 38 Grant 8 17,421 46.84 19.99 - 92.69
3 Greene 35 39,928 79.97 55.62 - 111.13 8 Hempstead 17 23,156 69.48 40.41 - 111.04
20 Hot Spring 22 31,637 57.05 35.66 - 85.89 49 Howard 7 14,141 39.68 15.55 - 82.39 70 Independence 12 34,450 28.16 14.53 - 48.56
7 Izard 15 13,095 70.33 38.81 - 111.51 1 Jackson 20 17,313 89.39 54.42 - 136.04
69 Jefferson 26 80,293 29.74 19.36 - 43.57 47 Johnson 12 24,290 41.04 21.05 - 71.26 34 Lafayette 6 7,798 49.49 17.80 - 102.04 44 Lawrence 9 16,822 41.90 18.41 - 80.20 36 Lee 7 11,043 47.55 18.90 - 95.53 23 Lincoln 8 13,840 55.94 23.88 - 109.54 60 Little River 6 12,919 35.22 12.77 - 74.12 65 Logan 10 22,573 31.98 15.29 - 57.55 21 Lonoke 30 61,879 56.56 37.95 - 81.06 64 Madison 6 15,200 32.89 11.97 - 70.69 62 Marion 9 16,549 34.21 15.41 - 58.62
5 Miller 35 42,732 73.42 51.05 - 102.02 19 Mississippi 27 46,861 57.33 37.70 - 83.44 75 Monroe 1 8,913 5.72 0.14 - 28.09

A Look at Health Disparities in Arkansas
* Death Rates are Age-Adjusted Per 100,000 Population 24
Rank County Deaths Population Death Rates* 95% Confidence
Interval 39 Montgomery 6 9,067 46.24 16.69 - 96.03 57 Nevada 4 9,446 36.37 9.87 - 91.62 15 Newton 7 8,372 62.98 25.15 - 121.41 51 Ouachita 14 26,344 39.61 21.62 - 64.87 55 Perry 5 10,246 36.79 11.89 - 83.76 14 Phillips 17 22,583 63.13 36.71 - 98.92 68 Pike 5 10,795 30.42 9.70 - 67.15 18 Poinsett 17 24,919 58.16 33.85 - 92.48
2 Polk 24 20,221 82.13 52.59 - 119.62 10 Pope 43 58,429 67.62 48.84 - 91.04 72 Prairie 3 8,854 22.83 4.61 - 61.79 45 Pulaski 151 372,548 41.60 35.18 - 48.84 42 Randolph 12 18,200 43.09 22.19 - 72.28 30 Saint Francis 13 27,146 52.21 27.75 - 89.33 50 Saline 39 93,109 39.67 28.14 - 54.29 74 Scott 1 11,211 6.64 0.17 - 35.66 48 Searcy 5 8,064 40.27 13.06 - 87.61 26 Sebastian 67 120,351 53.40 41.31 - 67.90 54 Sevier 6 16,220 36.88 13.47 - 80.20 58 Sharp 12 17,889 36.17 18.65 - 57.35 40 Stone 8 11,951 43.43 18.46 - 80.24
4 Union 44 43,580 73.85 53.37 - 98.87 28 Van Buren 15 16,424 52.66 27.78 - 85.67 29 Washington 78 190,432 52.49 41.39 - 65.64 24 White 45 72,621 55.45 40.36 - 74.17 13 Woodruff 7 7,865 64.23 25.52 - 127.75 11 Yell 17 21,677 67.04 38.88 - 107.07
Combined Counties
1,498 2,809,111 47.38 45.00 - 49.85

A Look at Health Disparities in Arkansas
#6 DIABETES (Diabètes mellitus : ICD-10 Codes (E10–E14)) Diabetes is under-reported as a cause of death. Studies have found that only about 35% to 40% of decedents with diabetes had it listed anywhere on the death certificate and only about 10% to 15% had it listed as the underlying cause of death. Nationally diabetes is the seventh leading cause of death.9 Overall, the risk for death among people with diabetes is about twice that of people without diabetes of similar age. 10
Figure 13: 2006 Diabetes Top Ten Counties
Arkansas Counties w ith Highest Diabetes Death Rates*
80.35
56.1843.75 43.37 41.48 37.70 37.68 37.28 36.71 36.17
Lee Calhoun Sebast ian Polk Clay Dallas Lafayette Independence Prairie Grant
1 2 3 4 5 6 7 8 9 10
Table 11: 2006 Disparities in Race and Arkansas Diabetes Deaths 2006 Race Deaths Population Death
Rates* 95%
Confidence Interval
Males White 317 1,133,349 26.89 24.01 - 30.01 Black 75 214,655 55.62 43.35 - 70.21 Native American 1 11,756 8.87 0.22 - 45.30 Asian/Pacific Islander 0 16,254 0.00 0.00 - 0.00All Males All Races 400 1,376,014 29.63 26.77 - 32.71
Females White 306 1,165,231 19.72 17.55 - 22.07 Black 120 238,250 58.60 48.50 - 70.16 Native American 1 12,080 11.94 0.30 - 65.63 Asian/Pacific Islander 2 17,536 33.14 3.69 - 122.85All Females All Races 437 1,433,097 24.16 21.91 - 26.57All Genders All Races 837 2,809,111 26.30 24.52 - 28.17
* Death Rates are Age-Adjusted Per 100,000 Population 25
A Look at Health Disparities in Arkansas
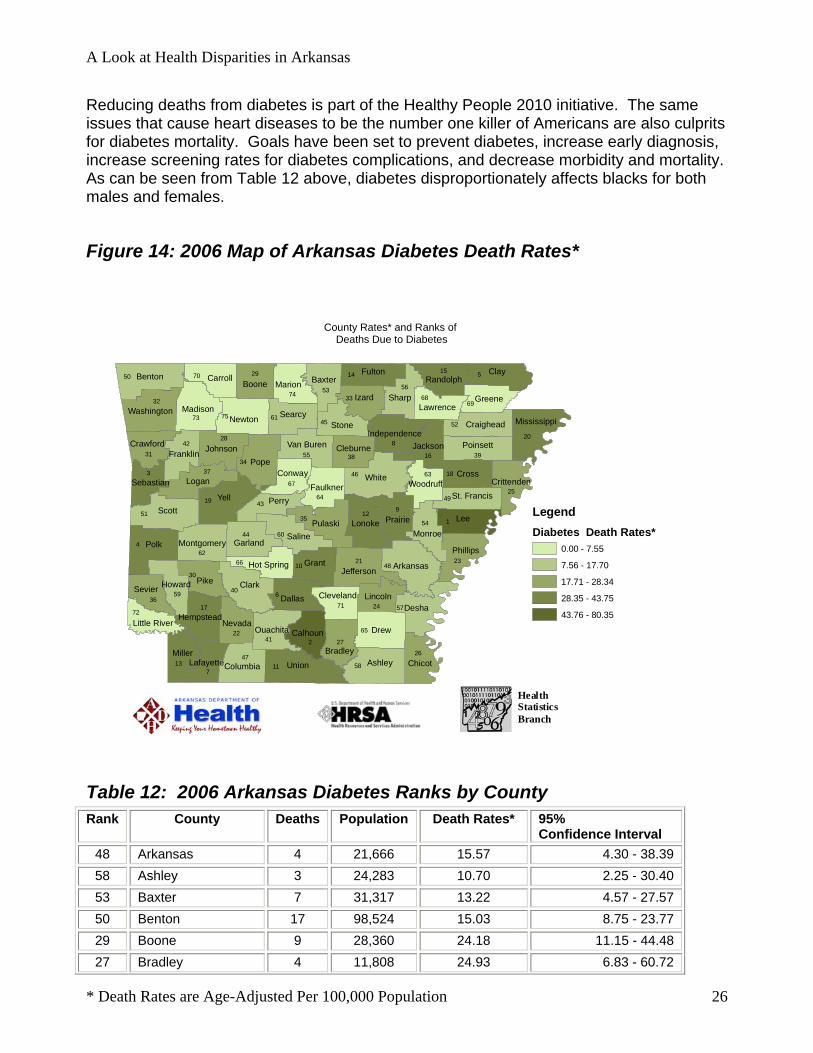
Reducing deaths from diabetes is part of the Healthy People 2010 initiative. The same issues that cause heart diseases to be the number one killer of Americans are also culprits for diabetes mortality. Goals have been set to prevent diabetes, increase early diagnosis, increase screening rates for diabetes complications, and decrease morbidity and mortality. As can be seen from Table 12 above, diabetes disproportionately affects blacks for both males and females.
Figure 14: 2006 Map of Arkansas Diabetes Death Rates*
Yell
Polk
White
Union
Scott
Clark
Lee
Pope
Drew
Clay
Pike
Ashley
Benton
Desha
Izard
Logan
Miller
Saline
Grant
Pulaski
Arkansas
Newton
Lonoke
Cross
Chicot
Dallas
Stone
Perry
Prairie
Sharp
Phillips
Fulton
Madison
Jefferson
Carroll
Searcy
Marion
Poinsett
Boone Baxter
Garland
Sevier
Mississippi
Bradley
Washington
Monroe
Johnson
Lincoln
Columbia
Nevada
Greene
Faulkner
Calhoun
Conway
Van Buren
Craighead
Randolph
Crawford Cleburne
Montgomery
Lawrence
St. Francis
Cleveland
Little RiverOuachita
JacksonFranklin
Howard
Woodruff
Hempstead
Crittenden
Hot Spring
Lafayette
Sebastian
Independence
4
8
9
6
5
2
1
11
3
7
46
48
32
19
20
58
21
51
50
40
73
34
75
65
57
3512
62
39
47
37
44
17
55
41
60
23
52
28
26
61
15
64
74
70
16
27
4925
14
10
13
18
42
54
66
45
56
29
22
31
30
6853
38
63
33
71
59
69
36
67
24
43
72
LegendDiabetes Death Rates*
0.00 - 7.55
7.56 - 17.70
17.71 - 28.34
28.35 - 43.75
43.76 - 80.35
County Rates* and Ranks of Deaths Due to Diabetes
Health
Statistics Branch
Table 12: 2006 Arkansas Diabetes Ranks by County
Rank County Deaths Population Death Rates* 95% Confidence Interval
48 Arkansas 4 21,666 15.57 4.30 - 38.39 58 Ashley 3 24,283 10.70 2.25 - 30.40 53 Baxter 7 31,317 13.22 4.57 - 27.57 50 Benton 17 98,524 15.03 8.75 - 23.77 29 Boone 9 28,360 24.18 11.15 - 44.48 27 Bradley 4 11,808 24.93 6.83 - 60.72
* Death Rates are Age-Adjusted Per 100,000 Population 26

A Look at Health Disparities in Arkansas
* Death Rates are Age-Adjusted Per 100,000 Population 27
Rank County Deaths Population Death Rates* 95% Confidence Interval
2 Calhoun 4 5,821 56.18 15.56 - 137.41 70 Carroll 0 18,770 0.00 0.00 - 0.00 26 Chicot 5 15,630 25.45 8.37 - 56.02 40 Clark 4 21,440 17.35 4.76 - 42.94 5 Clay 11 18,096 41.48 20.72 - 71.03 38 Cleburne 5 19,520 19.31 5.70 - 45.71 71 Cleveland 0 7,764 0.00 0.00 - 0.00 47 Columbia 5 25,691 15.85 5.18 - 35.32 67 Conway 1 19,171 4.28 0.12 - 22.79 52 Craighead 8 69,356 13.81 5.97 - 27.14 31 Crawford 9 42,768 22.87 10.51 - 43.15 25 Crittenden 11 49,959 25.82 12.91 - 45.82 18 Cross 6 19,232 32.03 11.76 - 69.28 6 Dallas 4 9,605 37.70 9.74 - 97.90 57 Desha 2 16,794 11.80 1.43 - 41.71 65 Drew 1 17,378 5.48 0.15 - 29.52 64 Faulkner 3 60,503 6.40 1.33 - 18.59 42 Franklin 3 14,939 17.17 3.59 - 48.76 14 Fulton 4 10,093 33.52 8.65 - 87.06 44 Garland 18 73,563 16.48 9.60 - 25.78 10 Grant 5 13,976 36.17 11.88 - 83.45 69 Greene 1 31,891 2.83 0.08 - 15.37 17 Hempstead 8 21,680 32.05 13.62 - 62.81 66 Hot Spring 1 26,122 4.83 0.13 - 26.55 59 Howard 2 13,594 10.57 1.32 - 35.60 8 Independence 13 31,176 37.28 19.88 - 63.20 33 Izard 4 11,399 21.61 5.92 - 49.67 16 Jackson 8 19,013 32.06 13.90 - 61.48 21 Jefferson 24 85,473 28.34 18.19 - 41.93 28 Johnson 5 18,305 24.44 7.75 - 56.95 7 Lafayette 5 9,588 37.68 12.40 - 82.86 68 Lawrence 1 17,430 3.82 0.10 - 19.74 1 Lee 11 12,982 80.35 39.48 - 143.57 24 Lincoln 3 13,721 26.02 5.34 - 75.91 72 Little River 0 14,002 0.00 0.00 - 0.00 37 Logan 5 20,574 19.82 6.47 - 45.03 12 Lonoke 12 39,468 34.56 17.96 - 60.02 73 Madison 0 11,654 0.00 0.00 - 0.00 74 Marion 0 12,039 0.00 0.00 - 0.00

A Look at Health Disparities in Arkansas
* Death Rates are Age-Adjusted Per 100,000 Population 28
Rank County Deaths Population Death Rates* 95% Confidence Interval
13 Miller 13 38,503 33.72 17.97 - 57.31 20 Mississippi 15 57,561 30.55 17.10 - 50.19 54 Monroe 2 11,321 12.66 1.58 - 42.04 62 Montgomery 1 7,858 8.56 0.23 - 44.24 22 Nevada 4 10,076 28.30 7.84 - 67.24 75 Newton 0 7,685 0.00 0.00 - 0.00 41 Ouachita 6 30,420 17.28 6.32 - 36.87 43 Perry 2 7,973 17.13 2.14 - 58.00 23 Phillips 8 28,768 27.15 11.60 - 53.11 30 Pike 3 10,088 23.20 4.78 - 65.57 39 Poinsett 5 24,643 17.70 5.82 - 40.40 4 Polk 9 17,361 43.37 19.22 - 83.16 34 Pope 9 46,225 21.32 9.81 - 40.15 9 Prairie 3 9,522 36.71 7.66 - 106.66 35 Pulaski 63 350,060 20.61 15.81 - 26.40 15 Randolph 6 16,566 32.21 11.70 - 69.72 49 Saint Francis 4 28,481 15.06 4.02 - 38.59 60 Saline 6 64,464 10.17 3.73 - 21.61 51 Scott 2 10,200 14.49 1.81 - 48.87 61 Searcy 1 7,819 9.72 0.26 - 51.62 3 Sebastian 45 99,743 43.75 31.81 - 58.59 36 Sevier 3 13,752 19.94 3.95 - 58.52 56 Sharp 2 14,128 12.26 1.05 - 48.81 45 Stone 2 9,831 16.29 2.03 - 56.11 11 Union 19 46,785 34.82 21.01 - 53.53 55 Van Buren 3 14,057 12.42 2.54 - 31.40 32 Washington 22 114,325 22.20 13.96 - 33.49 46 White 10 54,931 16.09 7.77 - 29.07 63 Woodruff 1 9,480 7.55 0.20 - 38.82 19 Yell 6 17,822 31.72 11.48 - 69.08
Combined Counties
539 2,356,586 21.28 19.50 - 23.16

A Look at Health Disparities in Arkansas
#7 Alzheimer’s disease (ICD-10 code G30)
Figure 15: 2006 Alzheimer ’s Disease Top Ten Counties
Arkansas Counties w ith Highest Alzheimer's Disease Death Rates*
57.1849.55 45.32 45.09 43.45 41.02 40.22 40.05 39.47 39.19
Cross Conway Jackson Scott Lonoke Saline Lincoln Faulkner Crawford Ouachita
1 2 3 4 5 6 7 8 9 10
Table 13: 2006 Disparities in Race and Arkansas Alzheimer’s Disease Deaths
2006 Race Deaths Population Death Rate
95% CI
Males White 140 1,133,349 13.02 10.95 - 15.37 Black 11 214,655 10.60 5.35 - 18.81 Native American 0 11,756 0.00 0.00 - 0.00 Asian/Pacific Islander 1 16,254 17.51 0.07 - 136.21 All Races 152 1,376,014 12.75 10.80 - 14.95Females White 312 1,165,231 17.03 15.17 - 19.01 Black 30 238,250 12.88 8.63 - 18.44 Native American 1 12,080 6.29 0.02 - 47.52 Asian/Pacific Islander 0 17,536 0.00 0.00 - 0.00All Races All Females 343 1,433,097 16.51 14.79 - 18.36All Races All Genders 495 2,809,111 15.13 13.82 - 16.52
Women have significantly higher rates for Alzheimer's deaths than men; white females have significantly higher rates than their black counterparts do.
* Death Rates are Age-Adjusted Per 100,000 Population 29

A Look at Health Disparities in Arkansas
Figure 16: 2006 Map of Arkansas Alzheimer’s disease Death Rates*
Yell
Polk
White
Union
Scott
Clark
Lee
Pope
Drew
Clay
Pike
Ashley
Benton
Desha
Izard
Logan
Miller
Saline
Grant
Pulaski
Arkansas
Newton
Lonoke
Cross
Chicot
Dallas
Stone
Perry
Prairie
Sharp
Phillips
Fulton
Madison
Jefferson
Carroll
Searcy
Marion
Poinsett
Boone Baxter
Garland
Sevier
Mississippi
Bradley
Washington
Monroe
Johnson
Lincoln
Columbia
Nevada
Greene
Faulkner
Calhoun
Conway
Van Buren
Craighead
Randolph
Crawford Cleburne
Montgomery
Lawrence
St. Francis
Cleveland
Little RiverOuachita
JacksonFranklin
Howard
Woodruff
Hempstead
Crittenden
Hot Spring
Lafayette
Sebastian
Independence
4
56
8
3
1
9
2
7
28
54
20
30
59
65
41
22
61
14
17
60
47
75
64
25
31
69
24
11
70
15
50
23
36
40
10
16
29
33
57
26
52
39
12
55
43
37
5335
51
56
34
71
32
62 74
13
72
63
66
58
73
2142
68
44
49
18
27
38
45
19
48
46
67
LegendAlheimer's Disease Death Rates*
0.00 - 9.61
9.62 - 17.65
17.66 - 23.76
23.77 - 33.07
33.08 - 57.18
County Rates* and Ranks of Deaths Due to Alzheimer's Disease
Health
Statistics Branch
Table 14: 2004 Arkansas Alzheimer’s Disease Ranks
Rank County Deaths Population Death Rates* 95% Confidence Interval
20 Arkansas 8 19,708 31.13 13.39 - 59.72 41 Ashley 6 22,600 20.92 7.61 - 45.00 42 Baxter 19 41,152 19.17 11.50 - 25.30 61 Benton 22 195,097 11.5 7.21 - 17.42 66 Boone 5 35,960 9.61 3.10 - 21.56 37 Bradley 4 12,005 22.68 6.10 - 55.14 32 Calhoun 2 5,565 23.76 2.75 - 78.78 43 Carroll 6 27,168 17.65 6.47 - 37.46 33 Chicot 4 12,532 23.18 6.29 - 56.55 14 Clark 10 23,478 36.54 17.26 - 66.19 12 Clay 10 16,360 37.89 18.09 - 66.43
* Death Rates are Age-Adjusted Per 100,000 Population 30

A Look at Health Disparities in Arkansas
* Death Rates are Age-Adjusted Per 100,000 Population 31
Rank County Deaths Population Death Rates* 95% Confidence Interval
68 Cleburne 3 25,235 6.99 1.44 - 18.31 18 Cleveland 3 8,690 31.29 6.42 - 90.84 15 Columbia 13 24,635 36.45 19.18 - 60.63 2 Conway 14 20,502 49.55 27.07 - 81.50
16 Craighead 31 89,736 35.6 24.13 - 50.58 9 Crawford 19 58,129 39.47 23.71 - 61.72
35 Crittenden 9 51,833 22.71 10.37 - 43.13 1 Cross 12 18,951 57.18 29.54 - 99.45
39 Dallas 3 8,372 21.95 4.37 - 59.96 25 Desha 6 14,079 28.2 10.35 - 57.42 64 Drew 2 18,786 10.82 1.31 - 38.75 8 Faulkner 31 102,189 40.05 27.20 - 56.86
71 Franklin 2 18,056 6.24 0.76 - 20.38 51 Fulton 3 11,623 15.48 3.19 - 40.09 23 Garland 49 95,253 28.82 21.31 - 37.12 56 Grant 2 17,421 13.27 1.61 - 47.88 38 Greene 10 39,928 22.21 10.62 - 40.66 36 Hempstead 7 23,156 22.71 9.05 - 45.90 13 Hot Spring 15 31,637 37.75 21.07 - 61.64 27 Howard 5 14,141 26.23 8.20 - 61.53 24 Independence 12 34,450 28.72 14.83 - 49.57 49 Izard 4 13,095 16.13 4.35 - 36.21 3 Jackson 10 17,313 45.32 21.57 - 81.66
22 Jefferson 26 80,293 28.84 18.77 - 42.19 29 Johnson 9 24,290 25.7 11.75 - 47.09 67 Lafayette 1 7,798 9.58 0.24 - 50.99 21 Lawrence 8 16,822 29.57 12.58 - 55.35 74 Lee 0 11,043 0 0.00 - 0.00 7 Lincoln 6 13,840 40.22 14.54 - 86.61
48 Little River 3 12,919 16.15 3.32 - 44.09 50 Logan 5 22,573 16.03 5.17 - 36.35 5 Lonoke 22 61,879 43.45 27.17 - 65.88
60 Madison 2 15,200 11.52 1.39 - 40.92 55 Marion 4 16,549 13.92 3.79 - 29.90 34 Miller 12 42,732 22.9 11.78 - 39.73 65 Mississippi 5 46,861 10.33 3.34 - 23.98 62 Monroe 2 8,913 11.45 1.39 - 35.09 69 Montgomery 1 9,067 6.84 0.17 - 35.13 58 Nevada 2 9,446 11.7 1.42 - 38.12
A Look at Health Disparities in Arkansas
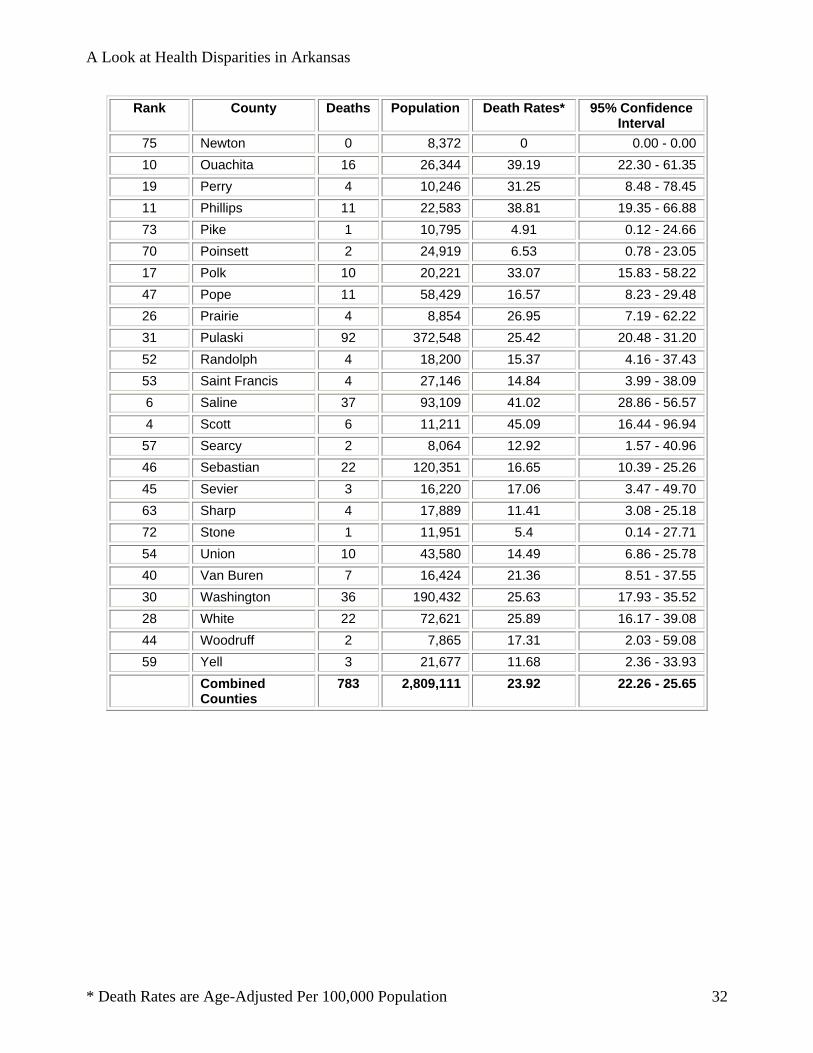
* Death Rates are Age-Adjusted Per 100,000 Population 32
Rank County Deaths Population Death Rates* 95% Confidence Interval
75 Newton 0 8,372 0 0.00 - 0.00 10 Ouachita 16 26,344 39.19 22.30 - 61.35 19 Perry 4 10,246 31.25 8.48 - 78.45 11 Phillips 11 22,583 38.81 19.35 - 66.88 73 Pike 1 10,795 4.91 0.12 - 24.66 70 Poinsett 2 24,919 6.53 0.78 - 23.05 17 Polk 10 20,221 33.07 15.83 - 58.22 47 Pope 11 58,429 16.57 8.23 - 29.48 26 Prairie 4 8,854 26.95 7.19 - 62.22 31 Pulaski 92 372,548 25.42 20.48 - 31.20 52 Randolph 4 18,200 15.37 4.16 - 37.43 53 Saint Francis 4 27,146 14.84 3.99 - 38.09 6 Saline 37 93,109 41.02 28.86 - 56.57 4 Scott 6 11,211 45.09 16.44 - 96.94
57 Searcy 2 8,064 12.92 1.57 - 40.96 46 Sebastian 22 120,351 16.65 10.39 - 25.26 45 Sevier 3 16,220 17.06 3.47 - 49.70 63 Sharp 4 17,889 11.41 3.08 - 25.18 72 Stone 1 11,951 5.4 0.14 - 27.71 54 Union 10 43,580 14.49 6.86 - 25.78 40 Van Buren 7 16,424 21.36 8.51 - 37.55 30 Washington 36 190,432 25.63 17.93 - 35.52 28 White 22 72,621 25.89 16.17 - 39.08 44 Woodruff 2 7,865 17.31 2.03 - 59.08 59 Yell 3 21,677 11.68 2.36 - 33.93 Combined
Counties 783 2,809,111 23.92 22.26 - 25.65
A Look at Health Disparities in Arkansas
#8 INFLUENZA AND PNEUMONIA: ICD-10 Codes (J10–J18)
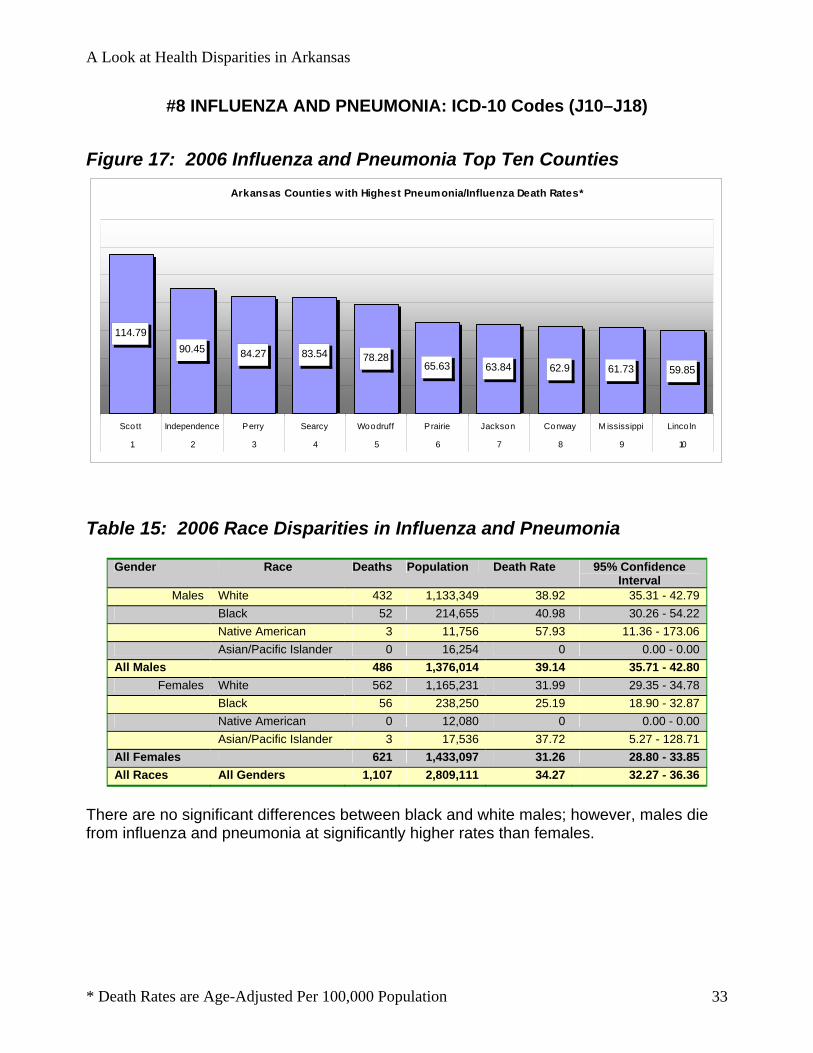
Figure 17: 2006 Influenza and Pneumonia Top Ten Counties Arkansas Counties w ith Highest Pneumonia/Influenza Death Rates*
114.7990.45 84.27 83.54 78.28
65.63 63.84 62.9 61.73 59.85
Scott Independence Perry Searcy Woodruff Prairie Jackson Conway M ississippi Linco ln
1 2 3 4 5 6 7 8 9 10
Table 15: 2006 Race Disparities in Influenza and Pneumonia
Gender Race Deaths Population Death Rate 95% Confidence Interval
Males White 432 1,133,349 38.92 35.31 - 42.79 Black 52 214,655 40.98 30.26 - 54.22
Native American 3 11,756 57.93 11.36 - 173.06 Asian/Pacific Islander 0 16,254 0 0.00 - 0.00 All Males 486 1,376,014 39.14 35.71 - 42.80
Females White 562 1,165,231 31.99 29.35 - 34.78 Black 56 238,250 25.19 18.90 - 32.87 Native American 0 12,080 0 0.00 - 0.00 Asian/Pacific Islander 3 17,536 37.72 5.27 - 128.71 All Females 621 1,433,097 31.26 28.80 - 33.85 All Races All Genders 1,107 2,809,111 34.27 32.27 - 36.36
There are no significant differences between black and white males; however, males die from influenza and pneumonia at significantly higher rates than females.
* Death Rates are Age-Adjusted Per 100,000 Population 33

A Look at Health Disparities in Arkansas
Figure 18: 2006 Map of Arkansas Influenza and Pneumonia Death Rates
Yell
Polk
White
Union
Scott
Clark
Lee
Pope
Drew
Clay
Pike
Ashley
Benton
Desha
Izard
Logan
Miller
Saline
Grant
Pulaski
Arkansas
Newton
Lonoke
Cross
Chicot
Dallas
Stone
Perry
Prairie
Sharp
Phillips
Fulton
Madison
Jefferson
Carroll
Searcy
Marion
Poinsett
Boone Baxter
Garland
Sevier
Mississippi
Bradley
Washington
Monroe
Johnson
Lincoln
Columbia
Nevada
Greene
Faulkner
Calhoun
Conway
Van Buren
Craighead
Randolph
Crawford Cleburne
Montgomery
Lawrence
St. Francis
Cleveland
Little RiverOuachita
JacksonFranklin
Howard
Woodruff
Hempstead
Crittenden
Hot Spring
Lafayette
Sebastian
Independence 9
1
2
4
6
7
58
3
61
55
72
62
12
63
40
49
38
68
30
37
31
51
69
5659
17
26
57
45
66
50
43
14
60
28
22
11
21
71
47
18
25
53
44
24
1652
67
74
39
27
54
75
13 15
48
20
42
32
58
35
29
2336
64
46
65
70
33
1910
41
34
73
LegendPneumonia/Influenza Death Rates*
0.00 - 16.61
16.62 - 34.22
34.23 - 45.79
45.80 - 65.63
65.64 - 114.79
County Rates* and Ranks of Deaths Due to Pneumonia and Influenza
Health
Statistics Branch
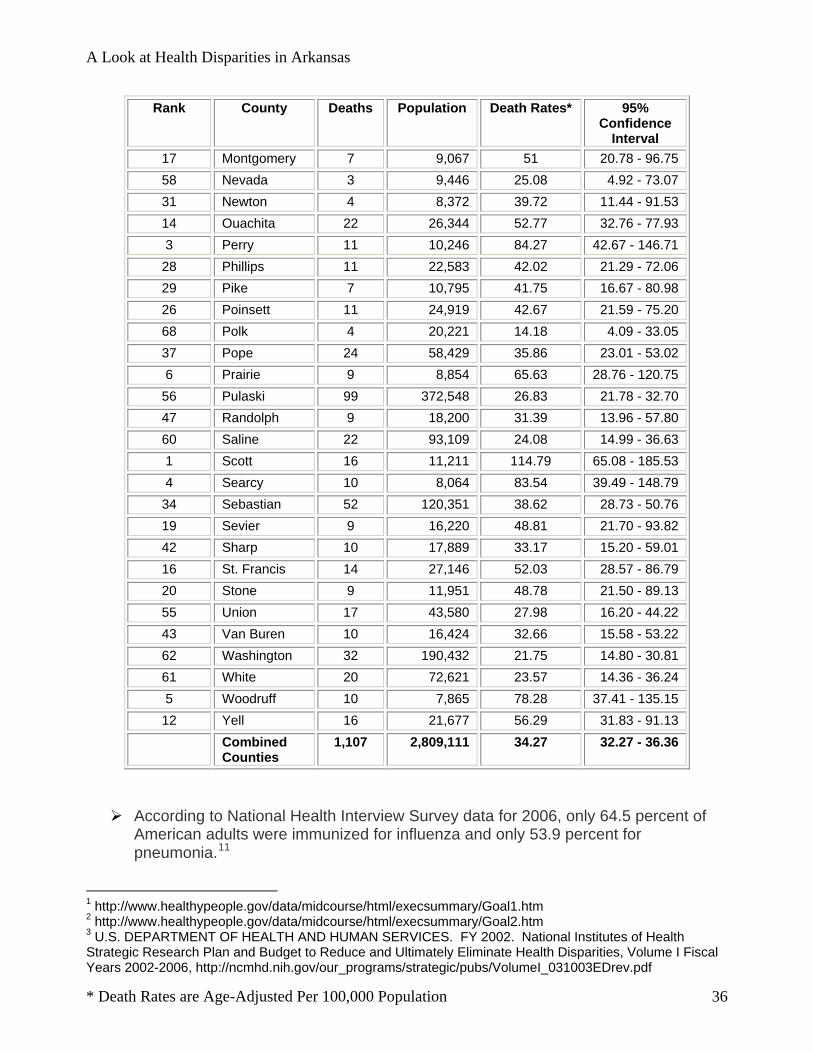
Table 16: 2006 Arkansas Influenza and Pneumonia County Ranks
Rank County Deaths Population Death Rates* 95% Confidence
Interval 72 Arkansas 3 19,708 10.48 2.04 - 29.78 63 Ashley 6 22,600 20.66 7.31 - 45.30 36 Baxter 33 41,152 36.25 24.76 - 46.64 49 Benton 57 195,097 30.05 22.77 - 38.90 32 Boone 20 35,960 39.29 23.97 - 59.64 24 Bradley 9 12,005 43.34 19.15 - 78.90 75 Calhoun 0 5,565 0 0.00 - 0.00 44 Carroll 11 27,168 32.61 16.53 - 56.49 71 Chicot 1 12,532 10.86 0.71 - 47.00 38 Clark 10 23,478 35.49 16.69 - 64.33
* Death Rates are Age-Adjusted Per 100,000 Population 34

A Look at Health Disparities in Arkansas
* Death Rates are Age-Adjusted Per 100,000 Population 35
Rank County Deaths Population Death Rates* 95% Confidence
Interval 25 Clay 10 16,360 43.33 19.94 - 80.19 64 Cleburne 7 25,235 16.61 6.77 - 30.96 65 Cleveland 1 8,690 16.36 1.07 - 71.67 57 Columbia 10 24,635 25.44 12.14 - 44.07 8 Conway 16 20,502 62.9 35.44 - 102.36
22 Craighead 39 89,736 45.76 32.43 - 62.71 35 Crawford 19 58,129 37.15 22.20 - 58.35 52 Crittenden 13 51,833 28.46 14.92 - 49.12 27 Cross 9 18,951 42.2 18.76 - 81.28 11 Dallas 9 8,372 57.67 25.67 - 102.17 69 Desha 3 14,079 13.48 2.64 - 37.23 51 Drew 6 18,786 29.24 10.36 - 64.36 18 Faulkner 40 102,189 50.24 35.83 - 68.50 54 Franklin 7 18,056 28.3 11.35 - 56.46 67 Fulton 3 11,623 15.08 2.96 - 40.16 66 Garland 27 95,253 15.89 10.49 - 22.10 74 Grant 1 17,421 5.87 0.38 - 24.54 33 Greene 17 39,928 39.09 22.75 - 62.44 50 Hempstead 9 23,156 29.83 13.19 - 57.03 48 Hot Spring 11 31,637 31.34 15.89 - 54.98 70 Howard 3 14,141 12.22 2.40 - 34.39 2 Independence 37 34,450 90.45 63.63 - 124.19
46 Izard 7 13,095 31.61 12.78 - 59.05 7 Jackson 14 17,313 63.84 35.02 - 104.51
40 Jefferson 32 80,293 34.22 23.28 - 48.34 21 Johnson 13 24,290 45.79 23.93 - 78.78 73 Lafayette 1 7,798 8.97 0.59 - 34.35 23 Lawrence 10 16,822 43.51 20.03 - 80.39 15 Lee 7 11,043 52.3 20.87 - 106.00 10 Lincoln 10 13,840 59.85 28.36 - 108.14 41 Little River 6 12,919 33.73 11.81 - 72.50 45 Logan 10 22,573 32.02 15.32 - 57.57 59 Lonoke 13 61,879 24.38 12.89 - 41.84 30 Madison 7 15,200 40.82 16.60 - 82.41 53 Marion 7 16,549 28.46 11.30 - 53.21 39 Miller 16 42,732 35.01 19.82 - 57.12 9 Mississippi 30 46,861 61.73 41.57 - 88.10
13 Monroe 9 8,913 54.37 24.12 - 93.90
A Look at Health Disparities in Arkansas
* Death Rates are Age-Adjusted Per 100,000 Population 36
Rank County Deaths Population Death Rates* 95% Confidence
Interval 17 Montgomery 7 9,067 51 20.78 - 96.75 58 Nevada 3 9,446 25.08 4.92 - 73.07 31 Newton 4 8,372 39.72 11.44 - 91.53 14 Ouachita 22 26,344 52.77 32.76 - 77.93 3 Perry 11 10,246 84.27 42.67 - 146.71
28 Phillips 11 22,583 42.02 21.29 - 72.06 29 Pike 7 10,795 41.75 16.67 - 80.98 26 Poinsett 11 24,919 42.67 21.59 - 75.20 68 Polk 4 20,221 14.18 4.09 - 33.05 37 Pope 24 58,429 35.86 23.01 - 53.02 6 Prairie 9 8,854 65.63 28.76 - 120.75
56 Pulaski 99 372,548 26.83 21.78 - 32.70 47 Randolph 9 18,200 31.39 13.96 - 57.80 60 Saline 22 93,109 24.08 14.99 - 36.63 1 Scott 16 11,211 114.79 65.08 - 185.53 4 Searcy 10 8,064 83.54 39.49 - 148.79
34 Sebastian 52 120,351 38.62 28.73 - 50.76 19 Sevier 9 16,220 48.81 21.70 - 93.82 42 Sharp 10 17,889 33.17 15.20 - 59.01 16 St. Francis 14 27,146 52.03 28.57 - 86.79 20 Stone 9 11,951 48.78 21.50 - 89.13 55 Union 17 43,580 27.98 16.20 - 44.22 43 Van Buren 10 16,424 32.66 15.58 - 53.22 62 Washington 32 190,432 21.75 14.80 - 30.81 61 White 20 72,621 23.57 14.36 - 36.24 5 Woodruff 10 7,865 78.28 37.41 - 135.15
12 Yell 16 21,677 56.29 31.83 - 91.13 Combined
Counties 1,107 2,809,111 34.27 32.27 - 36.36
According to National Health Interview Survey data for 2006, only 64.5 percent of American adults were immunized for influenza and only 53.9 percent for pneumonia.11
1 http://www.healthypeople.gov/data/midcourse/html/execsummary/Goal1.htm 2 http://www.healthypeople.gov/data/midcourse/html/execsummary/Goal2.htm 3 U.S. DEPARTMENT OF HEALTH AND HUMAN SERVICES. FY 2002. National Institutes of Health Strategic Research Plan and Budget to Reduce and Ultimately Eliminate Health Disparities, Volume I Fiscal Years 2002-2006, http://ncmhd.nih.gov/our_programs/strategic/pubs/VolumeI_031003EDrev.pdf

A Look at Health Disparities in Arkansas
* Death Rates are Age-Adjusted Per 100,000 Population 37
4 Buescher PhD, Paul A. , PhD, North Carolina State Center for Health Statistics. Multi-State Results of Linking Death Certificates to Indian Health Service Patient Records on PowerPoint. Jun. 6, 2007. 2007 NAPHSIS Annual Meeting, Salt Lake City. http://www.naphsis.org/NAPHSIS/files/ccLibraryFiles/Filename/000000000535/BUESCHER_NAPHSIS%202007%20presentation%20on%20IHS%20linkage%20final-1.ppt 5 Health, United States, 2007, http://www.cdc.gov/NCCDPHP/publications/factsheets/Prevention/dhdsp.htm
6 http://www.cdc.gov/nchs/data/hus/hus07.pdf#053 United States Department of Health and Human Services (US DHHS), Centers for Disease Control and Prevention, National Center for Health Statistics. Compressed Mortality File 1999-2005. CDC WONDER On-line Database, compiled from Compressed Mortality File 1999-2005 Series 20 No. 2K, 2008. Accessed at http://wonder.cdc.gov/cmf-icd10.html on Aug 1, 2008.
6http://www.ninds.nih.gov/disorders/stroke/detail_stroke.htm#56131105 7Centers for Disease Control and Prevention. The Burden of Chronic Diseases and Their Risk Factors: National and State Perspectives 2004. Atlanta: U.S. Department of Health and Human Services; 2004. Available at: http://www.cdc.gov/nccdphp/burdenbook2004. 9 National Diabetes Information Clearinghouse. http://diabetes.niddk.nih.gov/dm/pubs/statistics/#deaths 9National Institute of Diabetes and Digestive and Kidney Diseases. National Diabetes Statistics fact sheet: general information and national estimates on diabetes in the United States, 2005. Bethesda, MD: U.S. Department of Health and Human Services, National Institute of Health, 2005. 10U.S. Dept. of Health and Human Services, National Center for Health Statistics. NATIONAL HEALTH INTERVIEW SURVEY, 2007 [Computer file]. ICPSR04349-v2. Hyattsville, MD: U.S. Dept. of Health and Human Services, National Center for Health Statistics [producer], 2006. Ann Arbor, MI: Inter-university Consortium for Political and Social Research [distributor], 2007-05-04.