Embed Size (px)
Citation preview

MMRR 2011: Volume 1 (4)
Cuckler, G., Martin, A., Whittle, L., Heffler, S., Sisko, A., Lassman, D., Benson, J. E1
Medicare & Medicaid Research Review 2011: Volume 1, Number 4
A publication of the Centers for Medicare & Medicaid Services,
Center for Strategic Planning
Health Spending by State of Residence, 1991–2009 Gigi Cuckler, Anne Martin, Lekha Whittle, Stephen Heffler, Andrea Sisko, Dave Lassman, Joseph Benson
Centers for Medicare & Medicaid Services—Office of the Actuary
Objective: Provide a detailed discussion of baseline health spending by state of residence (per capita personal health care spending, per enrollee Medicare spending, and per enrollee Medicaid spending) in 2009, over the last decade (1998–2009), as well as the differential regional and state impacts of the recent recession. Data Source: State Health Expenditures by State of Residence for 1991–2009, produced by the Centers for Medicare & Medicaid Services’ Office of the Actuary. Principal Findings: In 2009, the 10 states where per capita spending was highest ranged from 13 to 36 percent higher than the national average, and the 10 states where per capita spending was lowest ranged from 8 to 26 percent below the national average. States with the highest per capita spending tended to have older populations and the highest per capita incomes; states with the lowest per capita spending tended to have younger populations, lower per capita incomes, and higher rates of uninsured. Over the last decade, the New England and Mideast regions exhibited the highest per capita personal health care spending, while states in the Southwest and Rocky Mountain regions had the lowest per capita spending. Variation in per enrollee Medicaid spending, however, has consistently been greater than that of total per capita personal health care spending or per enrollee Medicare spending from 1998–2009. The Great Lakes, New England, and Far West regions experienced the largest slowdown in per person health spending growth during the recent recession, largely as a result of higher unemployment rates. Keywords: Health Care Costs, Health Spending Variation, Geographic Variation, Health Spending by State
doi: http://dx.doi.org/10.5600/mmrr.001.04.a03

MMRR 2011: Volume 1 (4)
Cuckler, G., Martin, A., Whittle, L., Heffler, S., Sisko, A., Lassman, D., Benson, J. E2
Introduction
Previous studies on per capita personal health care spending have demonstrated wide variation in health care spending across the United States (Martin et al., 2007). With Affordable Care Act coverage expansions through Medicaid and state-level Health Insurance Exchanges on the horizon, it is more important than ever for policy makers to have detailed information on baseline state-level personal health care spending trends. Personal health care spending includes the total amount spent to treat individuals with specific medical conditions, but excludes expenditures resulting from government administration, net costs of health insurance, government public health activity, non-commercial research, and investment in structures and equipment (Centers for Medicare & Medicaid Services, 2011).
In this study we begin by presenting a detailed discussion of personal health care spending by state of residence in 2009. We then discuss trends in spending at the state level over the last decade, including some information on impacts of the 2006 Massachusetts health reform law and the Prescription Drug, Improvement, and Modernization Act of 2003 on health spending by type of service. Lastly, we analyze the differential impacts of the recent recession on regional and state health spending.
Study Data And Methods
The estimates of State Health Expenditures by State of Residence presented and analyzed in this paper are based on the Centers for Medicare & Medicaid Services’ (CMS) Office of the Actuary National Health Expenditure Accounts (Martin, Lassman, Whittle, Catlin, & the National Health Expenditure Accounts Team, 2011). These data are unique because they are constructed using consistent methods and definitions, which allow for analysis of state-level personal health care spending behavior over time that is not available from other data sources. The estimates are also comprehensive, providing a detailed view of personal health care spending by service and by selected sources of funding. Accordingly, this detail permits comparisons of personal health care spending levels and growth rates across states and relative to the national average for specific programs (Medicare and Medicaid), as well as for the overall population.1
To estimate personal health spending per capita by the residents of each state, we adjust our health spending estimates by state of provider to account for those who travel across state borders for health care services (Centers for Medicare & Medicaid Services, forthcoming). The primary data source that is used to estimate health care spending by state of provider for all payer sources is the quinquennial Economic Census, which includes spending on both residents
1 The District of Columbia was estimated and included in our tables; however, it was excluded from the discussion here due to its urban nature, outlier behavior in personal health care spending, and elevated interstate health care spending when compared with states.

MMRR 2011: Volume 1 (4)
Cuckler, G., Martin, A., Whittle, L., Heffler, S., Sisko, A., Lassman, D., Benson, J. E3
and nonresidents. We used Medicare fee-for-service claims data to adjust Medicare spending from a provider to a residence basis. Medicare is the most comprehensive nationwide insurer, with publicly available claims files containing a large pool of service-specific records upon which to base interstate flows of spending between providers’ and beneficiaries’ resident locations. All non-Medicare and non-Medicaid expenditures—except for prescription drugs and other health, residential, and personal health care spending, which are assumed to already be based on state of residence—were adjusted using Medicare claims data. In addition, non-Medicare and non-Medicaid inpatient hospital and physician services were further adjusted by reweighting Medicare spending flows to account for differences in utilization for the population under 65 years of age, using private hospital discharge information and physician claims records. The claims records data was sourced from the national inpatient samples from the Healthcare Cost and Utilization Project 3 data and MEDSTAT’s MarketScan Commercial Database (Fu Associates, 2005). Medicaid spending was not adjusted, because the overwhelming majority of Medicaid services are provided by in-state providers for eligible residents.
No data source exists that permits us to adjust the health spending estimates for health services beneficiaries received outside the U.S. that were paid for by Medicare, nor for health services received by citizens living in U.S. territories who returned to the U.S. to obtain them. Additionally, the U.S. Census resident population does not include an adjustment for the population undercount by state, which results in slightly overstated per capita spending. Neither limitation materially affects our findings.
In our study findings, we also discuss likely socioeconomic and demographic factors influencing per capita spending levels, as well as plausible reasons for the relationship of per capita spending or growth to the national average, of other states in a region or to the rest of the country. We used various data sources to reflect these factors. Estimates of per capita income are based on internal analysis of Personal Income data from the Bureau of Economic Analysis with updated population estimates from the U.S. Census Bureau (Bureau of Economic Analysis, 2011). Estimates of the uninsured population used data from the Current Population Surveys and methods following Davern, Klerman, Ziegenfuss, Lynch, & Greenberg (2009), as well as updated adjustments by J. Ziegenfuss (personal communication, September 6, 2011).
Medicare enrollment counts by gender and other demographic characteristics were gathered from the Medicare Denominator File. Medicare enrollee cost differentials by race were based on an internal analysis of an enhanced version of the Medical Expenditure Panel Survey developed for the Office of the Actuary Health Reform Model, which projected the impact of the Affordable Care Act on health expenditures (for 2010–2020, released in August, 2011). Our analysis of the composition of Medicaid enrollment by basis of eligibility was based on enrollment data sourced from the Medical Statistical Information System over 1999–2009.
Gross Domestic Product (GDP) by state was acquired from the Bureau of Economic Analysis for use in our discussion of recession-related impacts by region and state. We present

MMRR 2011: Volume 1 (4)
Cuckler, G., Martin, A., Whittle, L., Heffler, S., Sisko, A., Lassman, D., Benson, J. E4
the share of GDP by state spending on personal health care (on a state-of-provider basis) as an indicator of all of the production of health care within the state.
Exhibit 1. Map of Personal Health Care Spending Per Capita, by State of Residence, 2009.
SOURCE: Population, U.S. Bureau of the Census; Spending, Centers for Medicare & Medicaid Services, Office of the Actuary, National Health Statistics Group.
Study Findings
There is wide variation in health care spending across the United States (Exhibit 1). In 2009, the New England and Mideast regions had the highest levels of total personal health care spending per capita, averaging 29 and 17 percent, respectively, higher than the national average of $6,815 (Exhibit 2). In contrast, the Rocky Mountain and Southwest regions had the lowest levels of total personal health care spending per capita with average spending roughly 15 percent lower than the national average.
States with the highest per capita personal health care spending in 2009
In 2009, the 10 states that had the highest levels of total personal health care spending per capita were Massachusetts, Alaska, Connecticut, Maine, Delaware, New York, Rhode Island, New

MMRR 2011: Volume 1 (4)
Cuckler, G., Martin, A., Whittle, L., Heffler, S., Sisko, A., Lassman, D., Benson, J. E5
Hampshire, North Dakota, and Pennsylvania. The per capita spending for these 10 states ranged from 13 to 36 percent higher than the average U.S. per capita spending level and ranged from $7,730 for Pennsylvania to $9,278 for Massachusetts (Exhibit 2).
The states with the highest levels of total personal health care spending per capita share a number of key economic and demographic characteristics. Eight of the top ten states, including Massachusetts, Connecticut, and New York, are ranked in the top third in the nation for annual personal income per capita. Income appears to have an important and positive relationship with health spending. A recent study found that, on average, states with 10 percent higher income relative to other states were found to spend roughly 6 percent more on hospital care (Acemoglu, Finkelstein, & Notowidigdo, 2009). Our findings reflect and support the general trend in the literature on the relationship between income and health spending (see Appendix for details of our econometric modeling).
In addition to commonalities in average income levels, some similarities arose in demographic characteristics of the highest 10 spending states in 2009. Several of these states had higher-than-average populations of females aged 20 through 44 in 2009, the age group of women most likely to use relatively higher-cost maternity care and who spend 73 percent more on health care than their male counterparts (Cylus, Hartman, Washington, Andrews, & Catlin, 2011). Furthermore, the share of the population who are elderly in these states averaged 14.0 percent in 2009, compared to 11.2 percent for the 10 states with the lowest spending.
For 2 of the highest 10 spending states, Alaska and Maine, total personal health care spending per capita was significantly influenced by each state’s Medicaid spending. Alaska had the highest level of Medicaid spending per enrollee in the nation in 2009, at $11,569, or 69 percent higher than the national average. Alaska’s tendency toward comparatively high costs for health care was influenced by its isolation and small markets (Foster & Goldsmith, 2011). On the other hand, Maine had one of the highest shares of Medicaid enrollees as a proportion of its population, and these enrollees consumed 18 percent more health care compared to the national average for Medicaid spending per enrollee. As a result, Maine had one of the highest Medicaid shares of total personal health care spending in 2009.
States lowest in per capita personal health care spending in 2009
In 2009, the ten states that had the lowest levels of total personal health care spending per capita were Utah, Arizona, Georgia, Idaho, Nevada, Texas, Colorado, Arkansas, California and Alabama. Personal health care spending per capita for these states ranged from 8 to 26 percent below the national average and varied from $6,272 (Alabama) to $5,031 (Utah) (Exhibit 2).
As higher income per capita was observed for the 10 states with the highest personal health care spending per capita, we observed lower income per capita for the 10 lowest spending states in 2009. The lower income per capita was coupled with higher rates of uninsured residents in those bottom 10 spending states. Six of the bottom ten states in spending per capita were in the bottom third in the nation in personal income per capita, including Utah, which had the

MMRR 2011: Volume 1 (4)
Cuckler, G., Martin, A., Whittle, L., Heffler, S., Sisko, A., Lassman, D., Benson, J. E6
second lowest annual personal income per capita. Access to care, in terms of health insurance coverage, was also an issue for states where spending was relatively lower. Eight of the ten lowest spending states had uninsured rates in the top third in the nation, including Texas, which had the highest uninsured rate in 2009 at 24 percent (Minnesota Population Center, 2011). Recent research suggests that persistently high uninsured rates in the Southeast, Southwest, and Far West regions were influenced by higher rates of poverty and larger shares of Hispanic residents, who are more likely to be uninsured relative to other Americans (Centers for Disease Control, 2011b; Mendes, 2011).
The majority of the 10 states with the lowest personal health care spending per capita also tended to have younger and healthier residents, with 7 states in the bottom third in the share of elderly residents by state. Reported smoking and obesity rates were also lower among several of these states. For example, Utah residents reported the ninth lowest obesity rate in the nation at 24 percent and the lowest smoking rate of 9.8 percent. Idaho residents reported the 12th lowest obesity rate at 25.1 percent and smoking rate at 16.3 percent (Centers for Disease Control, 2011a).
Exhibit 2. Personal Health Care Spending Per Capita, as a Percentage of U.S. Per Capita Spending and Average Annual Growth, 1998, 2004, and 2009
Personal Health Care Spending Per Capita
Region and State of Total in dollars
As a percent of U.S. per capita
Average annual growth
residence 1998 2004 2009 1998 2004 2009
1998–2004
2004–2009
United States $3,728 $5,411 $6,815
100% 100% 100%
6.4% 4.7%
New England 4,528 6,726 8,783
121 124 129
6.8 5.5 Connecticut 4,712 6,824 8,654
126 126 127
6.4 4.9
Maine 4,062 6,590 8,521
109 122 125
8.4 5.3 Massachusetts 4,793 6,988 9,278
129 129 136
6.5 5.8
New Hampshire 3,767 5,722 7,839
101 106 115
7.2 6.5
Rhode Island 4,296 6,487 8,309
115 120 122
7.1 5.1 Vermont 3,645 6,237 7,635
98 115 112
9.4 4.1
Mideast 4,343 6,346 7,970
117 117 117
6.5 4.7 Delaware 4,247 6,611 8,480
114 122 124
7.7 5.1
District of Columbia 6,180 8,296 10,349
166 153 152
5.0 4.5
Maryland 3,754 5,737 7,492
101 106 110
7.3 5.5 New Jersey 4,234 6,054 7,583
114 112 111
6.1 4.6
New York 4,625 6,709 8,341
124 124 122
6.4 4.5 Pennsylvania 4,159 6,148 7,730
112 114 113
6.7 4.7

MMRR 2011: Volume 1 (4)
Cuckler, G., Martin, A., Whittle, L., Heffler, S., Sisko, A., Lassman, D., Benson, J. E7
Exhibit 2 (cont) Personal Health Care Spending Per Capita
Region and State of Total in ollars
As a percent of U.S. per capita
Average annual growth
residence 1998 2004 2009 1998 2004 2009
1998–2004
2004–2009
Great Lakes $3,721 $5,455 $6,852
100% 101% 101%
6.6% 4.7% Illinois 3,785 5,323 6,756
102 98 99
5.8 4.9
Indiana 3,583 5,401 6,666
96 100 98
7.1 4.3 Michigan 3,692 5,138 6,618
99 95 97
5.7 5.2
Ohio 3,757 5,766 7,076
101 107 104
7.4 4.2 Wisconsin 3,705 5,752 7,233
99 106 106
7.6 4.7
Plains 3,792 5,596 7,085
102 103 104
6.7 4.8 Iowa 3,780 5,445 6,921
101 101 102
6.3 4.9
Kansas 3,741 5,420 6,782
100 100 100
6.4 4.6 Minnesota 3,957 5,930 7,409
106 110 109
7.0 4.6
Missouri 3,733 5,437 6,967
100 100 102
6.5 5.1 Nebraska 3,571 5,602 7,048
96 104 103
7.8 4.7
North Dakota 4,043 5,956 7,749
108 110 114
6.7 5.4 South Dakota 3,669 5,457 7,056
98 101 104
6.8 5.3
Southeast 3,627 5,289 6,506
97 98 95
6.5 4.2 Alabama 3,631 5,272 6,272
97 97 92
6.4 3.5
Arkansas 3,371 4,892 6,167
90 90 90
6.4 4.7 Florida 4,002 5,709 7,156
107 106 105
6.1 4.6
Georgia 3,421 4,714 5,467
92 87 80
5.5 3.0 Kentucky 3,621 5,392 6,596
97 100 97
6.9 4.1
Louisiana 3,715 5,309 6,795
100 98 100
6.1 5.1 Mississippi 3,378 5,110 6,571
91 94 96
7.1 5.2
North Carolina 3,450 5,260 6,444
93 97 95
7.3 4.1
South Carolina 3,458 5,197 6,323
93 96 93
7.0 4.0
Tennessee 3,737 5,499 6,411
100 102 94
6.6 3.1 Virginia 3,265 4,891 6,286
88 90 92
7.0 5.1
West Virginia 4,045 6,055 7,667
109 112 113
7.0 4.8
Southwest 3,286 4,652 5,937
88 86 87
6.0 5.0 Arizona 2,986 4,304 5,434
80 80 80
6.3 4.8
New Mexico 3,232 4,843 6,651
87 89 98
7.0 6.6 Oklahoma 3,393 4,970 6,532
91 92 96
6.6 5.6
Texas 3,346 4,675 5,924
90 86 87
5.7 4.8

MMRR 2011: Volume 1 (4)
Cuckler, G., Martin, A., Whittle, L., Heffler, S., Sisko, A., Lassman, D., Benson, J. E8
Exhibit 2 (cont) Personal Health Care Spending Per Capita
Region and State of Total in dollars
As a percent of U.S. per capita
Average annual growth
residence 1998 2004 2009 1998 2004 2009
1998–2004
2004–2009
Rocky Mountains $3,174 $4,650 $5,810
85% 86% 85%
6.6% 4.6%
Colorado 3,362 4,837 5,994
90 89 88
6.3 4.4 Idaho 3,021 4,485 5,658
81 83 83
6.8 4.8
Montana 3,350 5,085 6,640
90 94 97
7.2 5.5 Utah 2,770 4,087 5,031
74 76 74
6.7 4.2
Wyoming 3,451 5,316 7,040
93 98 103
7.5 5.8
Far West 3,399 4,872 6,361
91 90 93
6.2 5.5 Alaska 3,909 6,528 9,128
105 121 134
8.9 6.9
California 3,389 4,777 6,238
91 88 92
5.9 5.5 Hawaii 3,688 5,122 6,856
99 95 101
5.6 6.0
Nevada 3,109 4,759 5,735
83 88 84
7.4 3.8 Oregon 3,398 5,059 6,580
91 93 97
6.9 5.4
Washington 3,437 5,125 6,782 92 95 100 6.9 5.8 SOURCE: Population, U.S. Bureau of the Census; Centers for Medicare & Medicaid Services, Office of the Actuary,
National Health Statistics Group.
Medicare and Medicaid Spending Per Enrollee in 2009
Medicare
The national average of Medicare personal health care spending per enrollee was heavily influenced by a small group of states with higher-than-average spending per enrollee. Just fourteen states had per enrollee Medicare spending levels greater than the national average in 2009 (Exhibit 3). These states also had a comparatively higher concentration of elderly residents, with the combined enrollment for these states accounting for more than half of all Medicare enrollees in the nation. These states were generally located in the eastern United States in high population density areas. The states with the highest Medicare spending per enrollee were New Jersey and Florida, with each state’s spending levels at nearly $12,000 per enrollee in 2009, or 15 percent above the national average (Exhibit 3). Florida also had the highest share of its overall health spending in 2009 accounted for by Medicare, at 29.5 percent, compared to the national share of 22.5 percent.
The composition of the elderly in terms of gender and race also helped to explain some differences in Medicare spending per enrollee. Prior research has indicated that elderly women can expect to spend more per capita than their male counterparts on health care (Cylus et al., 2011). Nine of the fourteen states with higher than average per enrollee Medicare spending had a share of female enrollees higher than the national average (55.4 percent). Additionally, 9 of these 14 states also had a higher share of African American enrollees than the national average (10.2

MMRR 2011: Volume 1 (4)
Cuckler, G., Martin, A., Whittle, L., Heffler, S., Sisko, A., Lassman, D., Benson, J. E9
percent). This finding corresponds with several studies that have found African Americans to have comparatively poorer health in general and higher Medicare costs relative to other enrollees (Mead, Cartwright-Smith, & Jones, 2008).
Conversely, the 36 states with Medicare spending per enrollee below the national average represented only 46 percent of overall Medicare enrollment. These states were generally located in the western United States, in less densely populated areas, with younger populations and lower ratios of physicians and specialists as a proportion of the population. In 2009, Montana, the state with the lowest per enrollee Medicare personal health care spending, spent roughly two-thirds of New Jersey’s per enrollee amount. This finding is likely related to a relatively higher share of younger beneficiaries enrolled in Montana compared to enrollees in New Jersey.
Exhibit 3. Medicare Personal Health Care Spending Per Enrollee, Average Annual Growth, and Share of State's Total Personal Health Care Spending, By Region And State Of Residence, Calendar Years 1998, 2004, & 2009
Medicare personal health care spending
Region and State of residence
Spending per enrollee in dollars
Average annual growth in per
enrollee spending
As share (%) of state's personal health care
spending
1998 2004 2009
1998–2004
2004–2009 1998 2004 2009
United States $5,327 $7,362 $10,365
5.5% 7.1%
19.7% 18.9% 22.5%
New England 5,538 7,577 10,526
5.4 6.8
18.6 17.2 19.6 Connecticut 5,652 8,193 11,086
6.4 6.2
18.2 18.1 20.3
Maine 4,335 6,008 8,821
5.6 8.0
17.9 16.1 20.4 Massachusetts 6,084 8,145 11,277
5.0 6.7
19.2 17.4 19.2
New Hampshire 4,422 6,316 8,763
6.1 6.8
16.0 15.9 18.4 Rhode Island 5,418 6,897 10,121
4.1 8.0
20.8 17.0 20.8
Vermont 4,147 5,926 8,719
6.1 8.0
16.4 14.5 19.8
Mideast 5,958 7,968 11,297
5.0 7.2
20.2 18.5 22.1 Delaware 5,143 7,668 10,421
6.9 6.3
17.1 17.3 20.2
District of Columbia 7,398 8,876 11,157
3.1 4.7
16.0 13.4 13.8 Maryland 5,882 8,523 11,449
6.4 6.1
18.9 18.3 20.5
New Jersey 6,042 8,137 11,903
5.1 7.9
20.5 19.0 23.6 New York 6,133 8,220 11,604
5.0 7.1
18.9 17.5 20.9
Pennsylvania 5,699 7,349 10,555
4.3 7.5
23.4 20.4 24.4
Great Lakes 5,060 7,245 10,284
6.2 7.3
19.2 19.0 23.2 Illinois 5,238 7,464 10,615
6.1 7.3
18.3 18.6 22.0
Indiana 4,858 6,849 9,843
5.9 7.5
19.0 18.1 22.7 Michigan 5,537 7,840 10,925
6.0 6.9
21.0 22.1 26.8
Ohio 5,032 7,260 10,300
6.3 7.2
20.0 19.1 23.6 Wisconsin 4,115 6,124 8,908
6.8 7.8
16.2 15.7 19.4
MMRR 2011: Volume 1 (4)
Cuckler, G., Martin, A., Whittle, L., Heffler, S., Sisko, A., Lassman, D., Benson, J. E10
Exhibit 3 (cont)
Region and State of
Spending per enrollee in dollars
Average annual growth in per
enrollee spending
As share (%) of state's personal health care
spending residence
1998 2004 2009 1998–2004
2004–2009 1998 2004 2009
Plains $4,419 $6,412 $9,120
6.4% 7.3%
17.4% 17.2% 20.3% Iowa 3,962 5,704 8,461
6.3 8.2
17.2 17.3 20.8
Kansas 4,647 6,830 9,423
6.6 6.6
18.2 18.4 21.0 Minnesota 4,220 6,373 8,941
7.1 7.0
14.3 14.5 17.6
Missouri 4,977 6,827 9,724
5.4 7.3
20.5 19.6 23.0 Nebraska 4,063 6,401 9,138
7.9 7.4
16.9 17.0 19.9
North Dakota 3,844 5,758 7,958
7.0 6.7
15.1 15.7 17.2 South Dakota 3,844 5,628 8,148
6.6 7.7
16.6 16.4 19.2
Southeast 5,243 7,370 10,338
5.8 7.0
21.4 21.0 25.5 Alabama 5,065 7,178 9,718
6.0 6.2
21.2 22.2 27.2
Arkansas 4,629 6,528 8,949
5.9 6.5
22.7 22.4 26.2 Florida 5,927 8,325 11,893
5.8 7.4
26.4 25.2 29.5
Georgia 5,044 7,052 9,836
5.7 6.9
16.6 16.8 21.9 Kentucky 4,724 6,794 9,634
6.2 7.2
20.0 20.1 25.2
Louisiana 6,767 8,658 11,700
4.2 6.2
24.4 22.8 25.7 Mississippi 5,392 7,521 10,667
5.7 7.2
23.4 22.8 26.9
North Carolina 4,605 6,910 9,741
7.0 7.1
18.7 19.1 23.4 South Carolina 4,785 6,919 9,632
6.3 6.8
19.3 19.9 25.0
Tennessee 5,054 7,006 10,024
5.6 7.4
19.6 19.2 25.6 Virginia 4,459 6,305 8,772
5.9 6.8
17.1 16.7 19.7
West Virginia 4,649 6,512 9,333
5.8 7.5
21.2 20.9 25.2
Southwest 5,577 7,622 10,676
5.3 7.0
20.1 19.6 22.8 Arizona 4,440 6,556 9,395
6.7 7.5
19.8 20.2 23.6
New Mexico 4,032 5,656 8,120
5.8 7.5
15.7 15.9 18.5 Oklahoma 5,303 7,356 10,000
5.6 6.3
23.0 22.3 24.6
Texas 6,135 8,216 11,479
5.0 6.9
20.0 19.3 22.7
Rocky Mountains 4,301 6,148 8,331
6.1 6.3
15.3 15.2 17.7 Colorado 4,636 6,543 8,727
5.9 5.9
15.1 14.9 17.5
Idaho 4,070 5,638 7,880
5.6 6.9
17.1 16.7 20.0 Montana 3,871 5,589 7,576
6.3 6.3
17.4 17.2 19.3
Utah 4,087 6,082 8,326
6.8 6.5
13.5 13.9 16.3 Wyoming 4,077 6,014 8,165
6.7 6.3
15.3 15.6 16.7
Far West 5,429 7,215 10,191
4.9 7.2
18.8 17.8 20.8 Alaska 4,822 7,120 8,812
6.7 4.4
7.6 8.2 8.7
California 5,933 7,650 10,954
4.3 7.4
20.1 18.6 22.0 Hawaii 3,904 5,604 7,652
6.2 6.4
13.9 15.6 17.4
Nevada 4,876 7,125 9,692
6.5 6.3
18.9 18.5 22.0 Oregon 3,916 5,989 8,247
7.3 6.6
16.5 17.5 19.7
Washington 4,329 6,170 8,497 6.1 6.6 15.7 15.5 17.6 NOTE: Medicare enrollment figures reflect point-in-time estimates. SOURCE: Centers for Medicare & Medicaid Services, Office of the Actuary, National Health Statistics Group.

MMRR 2011: Volume 1 (4)
Cuckler, G., Martin, A., Whittle, L., Heffler, S., Sisko, A., Lassman, D., Benson, J. E11
Medicaid
The distribution of per enrollee Medicaid personal health care spending relative to the national average in 2009 contrasts with that of per enrollee Medicare spending. Thirty states exhibited per enrollee Medicaid spending that exceeded the national average. However, these states represented just 41 percent of total Medicaid enrollment, suggesting that spending per enrollee and enrollment are not always positively correlated.
In fact, the factors contributing to variation in per enrollee Medicaid spending, as well as to the characteristics of the states with the highest and lowest per enrollee Medicaid spending, reflect a complex mix of policy, economic, and demographic factors. Unlike Medicare, which is a national program and reflects a consistent design across the country, Medicaid’s program design varies from state to state—such as the number and richness of benefits offered, its eligibility rules, and its provider payment policies. Economic factors, such as per capita income can be an indicator of a state’s ability to devote resources to its Medicaid program, as well as an indicator of the potential need of its residents for Medicaid assistance (Holahan, 2007).
Of the 10 states with the highest Medicaid spending per enrollee (Alaska, Connecticut, New Jersey, Rhode Island, New York, New Hampshire, North Dakota, Montana, Minnesota, and Maryland), 6 also ranked in the top 10 for total personal health care spending per enrollee and tended to have higher per capita incomes. Medicaid personal health care spending per enrollee in these top 10 states ranged from $8,533 in Maryland to $11,569 in Alaska, or 25 to 69 percent higher than the national average spending (Exhibit 4). Spending for the 10 states with the lowest per enrollee Medicaid personal health care spending (Florida, Hawaii, Mississippi, Illinois, Arizona, Michigan, Tennessee, Alabama, Georgia, and California) ranged from $5,855 in Florida to $4,569 in California, or 14 to 33 percent lower than the national average. Many of these states are located in the Southeast region where residents have relatively lower per capita personal income; however, California stands out because of its very low Medicaid payment rates (Zuckerman, Williams, & Stockley, 2009).
The underlying characteristics of the Medicaid enrollee population are relevant in understanding per enrollee Medicaid spending trends at the state level. Several analyses have found stark differences between per enrollee spending when examined by basis of eligibility (i.e., adult, child, aged, or disabled). A recent report found that although disabled and elderly Medicaid enrollees comprised just 28 percent of enrollees nationally in fiscal year 2009, these enrollees consumed roughly 66 percent of total Medicaid spending (Office of the Actuary, 2010). Similarly, six of the states with the highest per enrollee Medicaid personal health care spending had a higher-than-average share of the aged enrollees in their state’s Medicaid program, with some of the highest shares existing for Connecticut, New Jersey, and North Dakota in 2009. Additionally, 25 of 30 states with above average per enrollee Medicaid spending also had either above average shares of blind and disabled or above average shares of elderly enrollees.

MMRR 2011: Volume 1 (4)
Cuckler, G., Martin, A., Whittle, L., Heffler, S., Sisko, A., Lassman, D., Benson, J. E12
Exhibit 4. Medicaid Personal Health Care Spending Per Enrollee, Average Annual Growth and Share of State's Total Personal Health Care Spending, By Region & State Of Residence; Calendar Years 1998, 2004, & 2009
Medicaid personal health care spending
Region and State of Spending per enrollee
in dollars
Average annual growth in per
enrollee spending
As share (%) of state's personal health care
spending residence
1998 2004 2009 1998–2004
2004–2009 1998 2004 2009
United States $5,023 $6,089 $6,826
3.3% 2.3%
15.4% 17.1% 16.5%
New England 7,092 8,948 8,983
3.9 0.1
19.0 18.6 18.3 Connecticut 8,339 8,889 10,933
1.1 4.2
17.9 16.4 18.1
Maine 7,239 7,881 8,077
1.4 0.5
21.8 23.0 21.8 Massachusetts 6,760 9,231 8,278
5.3 -2.2
19.3 18.6 18.2
New Hampshire 9,392 11,043 10,302
2.7 -1.4
16.1 15.6 12.7 Rhode Island 7,447 10,115 10,780
5.2 1.3
21.0 23.2 20.3
Vermont 3,553 6,054 7,389
9.3 4.1
17.7 20.1 22.5
Mideast 7,793 9,341 9,821
3.1 1.0
21.2 22.4 21.2 Delaware 5,096 5,649 6,679
1.7 3.4
13.0 13.9 14.7
District of Columbia 7,190 8,524 10,487
2.9 4.2
24.4 24.1 25.4 Maryland 5,207 7,475 8,533
6.2 2.7
12.6 14.3 14.3
New Jersey 7,242 9,872 10,825
5.3 1.9
14.0 13.8 13.9 New York 9,752 10,141 10,708
0.7 1.1
29.9 31.1 29.2
Pennsylvania 5,447 8,199 8,049
7.1 -0.4
15.1 17.2 16.1
Great Lakes 5,076 5,984 6,416
2.8 1.4
13.6 14.8 15.5 Illinois 4,368 5,208 5,773
3.0 2.1
13.5 14.3 15.9
Indiana 5,676 6,456 6,229
2.2 -0.7
12.1 14.2 13.6 Michigan 4,472 5,282 5,703
2.8 1.5
13.3 13.9 14.5
Ohio 5,861 7,365 7,469
3.9 0.3
14.6 16.8 16.3 Wisconsin 6,451 5,924 7,584
-1.4 5.1
13.6 13.5 16.4
Plains 5,592 7,364 8,471
4.7 2.8
13.7 16.0 15.4 Iowa 5,415 7,460 6,887
5.5 -1.6
12.3 13.8 13.8
Kansas 6,064 6,979 8,069
2.4 2.9
10.9 12.2 12.1 Minnesota 6,269 9,044 9,851
6.3 1.7
14.7 17.2 17.3
Missouri 4,880 6,380 8,398
4.6 5.7
14.8 19.0 17.7 Nebraska 5,772 7,548 8,228
4.6 1.7
15.3 14.0 12.6
North Dakota 7,349 9,139 10,111
3.7 2.0
12.6 12.7 11.7 South Dakota 5,507 6,268 6,938
2.2 2.1
12.7 13.4 12.1

MMRR 2011: Volume 1 (4)
Cuckler, G., Martin, A., Whittle, L., Heffler, S., Sisko, A., Lassman, D., Benson, J. E13
Exhibit 4 (cont) Region and State of
Spending per enrollee in dollars
Average annual growth in per
enrollee spending
As share (%) of state's personal health care
spending residence
1998 2004 2009 1998–2004
2004–2009 1998 2004 2009
Southeast $3,931 $5,414 $6,050
5.5% 2.2%
13.4% 15.9% 14.6% Alabama 3,886 4,301 5,086
1.7 3.4
12.2 14.1 13.9
Arkansas 3,996 4,379 5,871
1.5 6.0
15.1 19.3 19.0 Florida 4,013 5,485 5,855
5.3 1.3
9.6 12.0 10.8
Georgia 3,607 5,532 4,835
7.4 -2.7
12.7 17.6 12.8 Kentucky 4,678 6,462 7,089
5.5 1.9
17.0 18.6 18.2
Louisiana 4,560 5,208 6,371
2.2 4.1
15.9 18.8 20.5 Mississippi 3,907 5,241 5,850
5.0 2.2
16.8 23.2 18.7
North Carolina 4,789 6,641 7,275
5.6 1.8
16.2 17.9 17.6 South Carolina 3,604 4,775 6,606
4.8 6.7
14.7 17.5 16.6
Tennessee 2,762 4,829 5,150
9.8 1.3
17.0 20.3 16.3 Virginia 4,113 5,815 7,088
5.9 4.0
9.8 10.3 11.1
West Virginia 4,788 6,588 6,886
5.5 0.9
18.3 18.1 16.7
Southwest 4,302 4,984 6,279
2.5 4.7
12.7 15.4 16.7 Arizona 3,520 4,229 5,739
3.1 6.3
11.0 17.6 21.1
New Mexico 3,715 4,975 6,409
5.0 5.2
16.9 22.5 21.8 Oklahoma 4,352 5,038 6,265
2.5 4.5
11.2 14.0 15.8
Texas 4,560 5,244 6,469
2.4 4.3
13.0 14.5 15.3
Rocky Mountains 5,731 6,335 7,407
1.7 3.2
11.5 12.4 12.1 Colorado 6,024 6,439 7,038
1.1 1.8
11.0 11.3 11.4
Idaho 5,389 5,951 7,093
1.7 3.6
11.7 15.4 14.3 Montana 6,148 7,468 9,937
3.3 5.9
13.7 13.5 13.2
Utah 5,186 5,956 7,293
2.3 4.1
11.3 12.1 11.3 Wyoming 5,661 6,374 8,079
2.0 4.9
11.6 14.0 13.3
Far West 3,630 4,169 4,963
2.3 3.5
14.9 16.8 15.7 Alaska 5,658 10,007 11,569
10.0 2.9
14.8 19.5 16.7
California 3,412 3,806 4,569
1.8 3.7
15.2 17.8 16.9 Hawaii 3,774 5,095 5,852
5.1 2.8
12.0 13.7 13.0
Nevada 5,230 5,713 6,003
1.5 1.0
8.3 9.5 8.6 Oregon 4,380 6,180 7,896
5.9 5.0
14.4 14.2 14.0
Washington 4,333 5,366 6,018 3.6 2.3 15.7 15.7 13.2 NOTE: Enrollees are measured in calendar person-years. SOURCE: Centers for Medicare & Medicaid Services, Office of the Actuary, National Health Statistics Group.

MMRR 2011: Volume 1 (4)
Cuckler, G., Martin, A., Whittle, L., Heffler, S., Sisko, A., Lassman, D., Benson, J. E14
State Variation and Growth in Personal Health Care Spending 1998–2009
Total Personal Health Care Spending Per Capita
Given the wide geographic variation in personal health care spending per capita in 2009, we examined the regions and states for the period of 1998 through 2009 to gauge the persistency of these trends over the last decade, which differ from trends prior to 1998 that were more influenced by managed care (Martin et al., 2007). Over this recent period, the New England and Mideast regions consistently had the highest levels of spending per capita, whereas the Southwest and Rocky Mountain regions consistently had the lowest levels. In fact, 8 of the 10 highest spending states in 2009 (all from New England and the Mideast) were among the highest for every year between 1998 and 2008 (Massachusetts, Connecticut, Maine, Delaware, New York, Rhode Island, New Hampshire, and Pennsylvania). Similarly, the majority of the 10 lowest spending states in 2009 were in the Southwest and Rocky Mountain regions, with Idaho, Arizona, Utah, and Nevada among the lowest every year between 1998 and 2009.
Despite this stability over time, several states experienced changes in their relative spending levels due to comparatively faster or slower growth in spending. For example, Vermont had per capita personal health care spending near the median level of spending in 1998, but by 2009 had the 12th highest spending, mostly due to faster growth from 1998–2004 (9.4 percent on average per year, or 3.0 percentage points faster than the national average), and New Hampshire increased from the 16th highest spending state in the nation to the eighth highest spending state due in part to its 6.5-percent growth for 2004–2009 (1.8 percentage points faster than the national average). Some states in the western U.S. that had lower levels of spending in 1998 experienced faster growth as well. New Mexico and Montana moved from one of the 10 lowest spending states in 1998 to near the middle in 2009. Conversely, several states from the Southeast grew slower than the national average from 2004–2009, notably Alabama and Georgia, which were among the 10 lowest spending states in 2009, after having spending levels in the middle third of states in 1998.
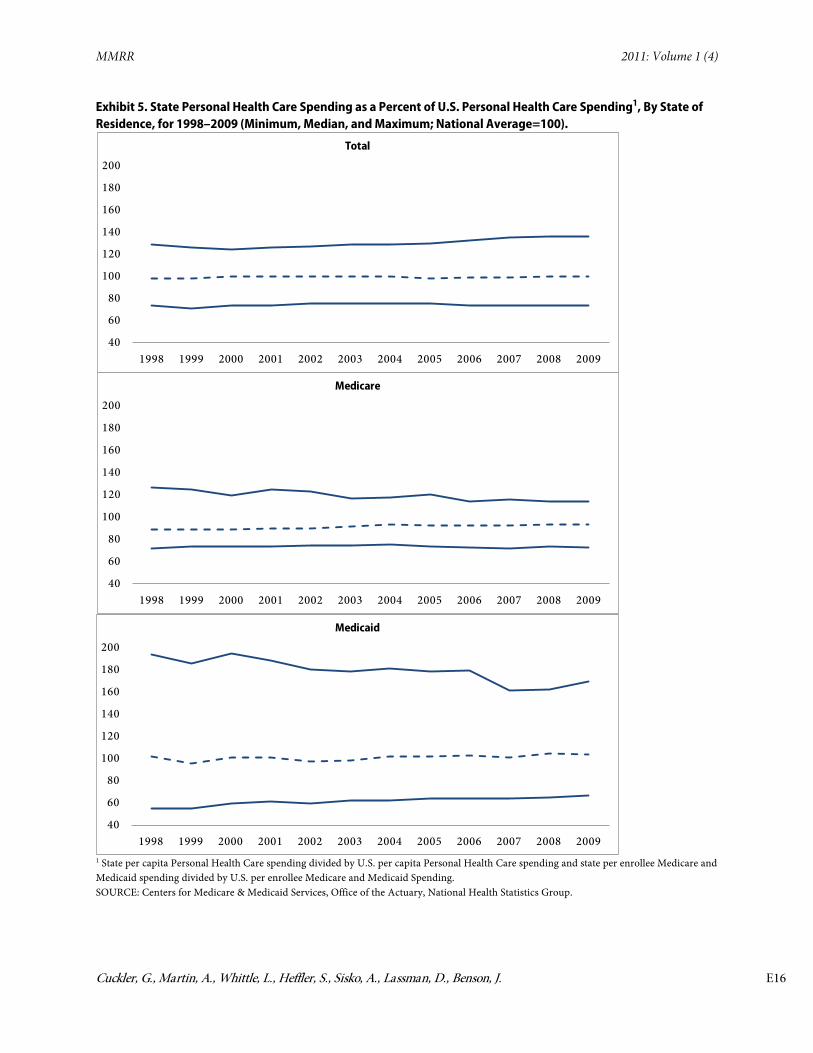
Given the general continuity of states among the 10 highest and lowest in total personal health care spending per capita, the somewhat stable trend in variation between the highest and lowest states is not surprising (Exhibit 5). In 1998, the state with the highest personal health care spending per capita, Massachusetts, had average spending per capita that was 29 percent higher than the national average, while the state with the lowest spending per capita, Utah, had spending per capita 26 percent below the national average in that year. This spread of relative spending between the highest and lowest spending states was largely consistent for 1998 through 2005, ranging from 73 to 71 percent more for the highest versus the lowest spending state. After 2005, however, states with the highest level of personal health care spending per capita increasingly grew faster than the national average, while states with the lowest level of personal health care spending per capita persisted at levels consistently below the national average. By 2009, personal health care spending per capita for the state with the highest spending per capita
MMRR 2011: Volume 1 (4)
Cuckler, G., Martin, A., Whittle, L., Heffler, S., Sisko, A., Lassman, D., Benson, J. E15
(Massachusetts) was 84 percent higher than the state with the lowest spending per capita (Utah). A similar pattern emerged for the 10th and 90th percentiles as well.
Medicare Personal Health Care Spending Per Enrollee
Though the Mideast region consistently had the highest level of Medicare spending per enrollee and the Rocky Mountain region consistently had the lowest from 1998 through 2009, the other regions experienced varying patterns during this period. Most notably, between 2003 and 2004 the Southwest, Southeast, and Great Lakes regions experienced relatively faster per enrollee Medicare spending growth, whereas New England and the Far West grew more slowly. This pattern was influenced by changes to the Medicare program under the Medicare Prescription Drug, Improvement, and Modernization Act of 2003 (MMA). Though the most significant impact arising from MMA was the planned implementation of the Medicare prescription drug program (Part D) in 2006, as discussed later, several other aspects of the legislation had a more immediate impact. The MMA legislation provided for higher payments to rural health care providers and subsidies for low-income beneficences, as well as increased rates for managed care plans (Smith, Cowan, Heffler, & Catlin, 2006), resulting in a disproportionately larger impact on some of these regions in 2004.
The variation between the states with the highest and lowest levels of Medicare personal health care spending per enrollee declined between 1998 and 2009. In 1998, the state with the highest Medicare spending per enrollee (Louisiana) was 76 percent higher than the state with the lowest spending (South Dakota); by 2009 this difference declined to 57 percent between New Jersey and Montana. The narrowing in the spread was associated with slower spending growth for the higher spending states, as the lowest spending states maintained their relative spending levels (Exhibit 5).
Medicaid Personal Health Care Spending Per Enrollee
The relative regional spending levels for Medicaid personal health care spending on a per enrollee basis remained fairly stable between 1998 and 2009. The Mideast and New England had the highest levels of Medicaid spending per enrollee for all years in the period, while the Far West had the lowest levels for all years. However, there was less stability in the composition of states that persisted among the highest and lowest 10 states in spending per enrollee than seen with Medicare or total personal health care spending for all payers. For example, Massachusetts was among the 10 highest spending states in 2006, but not in 2007, while Wisconsin was in the 10 lowest spending states in 2008, but not in 2009, likely related to program changes in each state during those years.
Variation in Medicaid personal health care spending per enrollee is much broader than variation observed in Medicare spending per enrollee and total spending per capita for all payers. In 1998, the state with the highest Medicaid spending per enrollee, New York, had spending 353 percent higher than the state with the lowest spending, Tennessee. By comparison, Medicare spending per enrollee varied by 76 percent and total spending per capita for all payers
MMRR 2011: Volume 1 (4)
Cuckler, G., Martin, A., Whittle, L., Heffler, S., Sisko, A., Lassman, D., Benson, J. E16
Exhibit 5. State Personal Health Care Spending as a Percent of U.S. Personal Health Care Spending1, By State of Residence, for 1998–2009 (Minimum, Median, and Maximum; National Average=100).
40
60
80
100
120
140
160
180
200
1998 1999 2000 2001 2002 2003 2004 2005 2006 2007 2008 2009
Total
40
60
80
100
120
140
160
180
200
1998 1999 2000 2001 2002 2003 2004 2005 2006 2007 2008 2009
Medicare
40
60
80
100
120
140
160
180
200
1998 1999 2000 2001 2002 2003 2004 2005 2006 2007 2008 2009
Medicaid
1 State per capita Personal Health Care spending divided by U.S. per capita Personal Health Care spending and state per enrollee Medicare and Medicaid spending divided by U.S. per enrollee Medicare and Medicaid Spending. SOURCE: Centers for Medicare & Medicaid Services, Office of the Actuary, National Health Statistics Group.

MMRR 2011: Volume 1 (4)
Cuckler, G., Martin, A., Whittle, L., Heffler, S., Sisko, A., Lassman, D., Benson, J. E17
by 73 percent. Between 1998 and 2009 this variation narrowed with Alaska spending 253 percent more than the lowest spending state (California) in 2009. For Medicaid, this narrowing was influenced by a convergence towards the national average for states at both the high and low end of spending, unlike the trend for both Medicare and all payers.
State Spending by Service for All Payers
Spending Growth in Hospital Care.
From 1998 to 2009, spending per capita on hospital care grew fastest in New England and slowest in the Southeast (Exhibit 6). In New England, hospital spending per capita grew roughly one-percentage point faster than the U.S. average for both the 1998–2004 and 2004–2009 periods. In particular, three states in this region grew more than two percentage points faster than the national average in hospital spending per capita between 2004 and 2009 (New Hampshire, Vermont, and Maine). Contributing to this faster growth in total hospital spending, each of these three states also experienced faster growth in Medicare hospital spending per enrollee relative to other states in the region. The Southeast grew the slowest of any region, mainly due to the low 4.3-percent growth from 2004 to 2009 that was heavily influenced by the impacts of the recent recession, as we discuss below.
Spending Growth in Physician and Clinical Services.
Growth in spending for physician and clinical services per capita varied significantly by region and state from 1998 to 2009. (Exhibit 6). New England, between 1998 and 2004, grew 6.3 percent (0.1 percentage point faster than the U.S. average) and experienced the fastest growth of any region from 2004 to 2009 (5.5 percent annually and 1.3 percentage points faster than the U.S. average). Given that spending on physician and clinical services in Massachusetts comprised roughly half of spending for the region for these services, this trend in New England for 2004–2009 was likely influenced by Massachusetts health reform legislation.
In 2006, Massachusetts began to implement health reform legislation with a goal of near universal coverage (Long, 2008). Medicaid coverage was expanded, full or partial premium subsidies were provided for the newly created Commonwealth Health Insurance Connector—analogous to a health insurance exchange—and individual and employer mandates were written into law. Correspondingly, the trend observed in the New England region may be due to increased access to and use of doctor visits for adult residents, including the newly insured in Massachusetts (Long, 2008) (Long & Masi, 2009).
Conversely, the Southeast, which had the fastest spending growth for physician and clinical services per capita from 1998 to 2004 at 7.0 percent, grew the slowest at 3.2 percent from 2004 to 2009 (Exhibit 6). This trend occurred in Alabama, South Carolina, Kentucky, Tennessee, and Georgia, which collectively composed more than a third of spending on this service for the region and all grew less than 3 percent annually during this period, again likely influenced by the effects of the recent recession.

MMRR 2011: Volume 1 (4)
Cuckler, G., Martin, A., Whittle, L., Heffler, S., Sisko, A., Lassman, D., Benson, J. E18
Spending growth for Prescription Drugs.
At the national level, growth in spending per capita on prescription drugs slowed significantly between the 1998 to 2004 and 2004 to 2009 periods, averaging 12.5 percent and 4.6 percent, respectively (Exhibit 6). Though spending growth for prescription drugs slowed for all regions related to increased use of generic drugs and the recent recession, the slowdown was much steeper for some regions in the eastern U.S. (New England and Mideast) and less steep for regions in the western U.S. (Southwest, Far West, and Rocky Mountain). This shift in annual growth trends was influenced by the implementation of the Medicare Part D program.
The addition of prescription drug coverage (Part D) to the Medicare program in 2006 led to the greater use of prescription drugs by the elderly and increased spending for the service (Englehardt & Gruber, 2009; Catlin, Cowan, Hartman, Heffler, & the National Health Expenditure Accounts Team, 2008). In 2006, prescription drug spending per capita grew at least 10 percent in 23 states, compared to 2005 when only two states grew more than 10 percent. Over half of these states with double-digit growth were located in the western half of the country (Southwest, Rocky Mountain, and Far West regions), where nearly every state experienced faster growth in 2006 than in 2005. This regional effect may not be unexpected as insurance coverage has typically been lower in the western regions of the country. Further, based on CMS estimates of these programs included in the National Health Expenditure Accounts, very few of those states had special drug programs or state-based pharmaceutical assistance programs.
Conversely, of the 12 states that experienced slower prescription drug spending per capita growth in 2006 compared to 2005, 9 were in the New England and Mideast regions. These regions are dominated by states that already had drug coverage for seniors through state pharmaceutical assistance programs, Medigap coverage, or a large portion of their Medicaid population having dual coverage with Medicare (Holahan, Miller, & Rousseau, 2009). Finally, as a result of the implementation of Part D coverage, every state experienced a one-time increase in the share of total personal health care spending accounted for by Medicare in 2006.

MMRR 2011: Volume 1 (4)
Cuckler, G., Martin, A., Whittle, L., Heffler, S., Sisko, A., Lassman, D., Benson, J. E19
Exhibit 6a. Regional Per Capita Personal Health Care, Hospital, Physician & Clinics, and Prescription Drug Spending*, Average Annual Growth By State of Residence, Selected Periods 1998–2009
Average annual growth (%)
1998–2004 2004–2009
Region
Pers. Health Care
Hospital Services
Phys. & Clinical Services
Prescrip Drug
Per. Health Care
Hospital Services
Phys. & Clinical Services
Prescrip Drug
United States
6.4% 6.0% 6.2% 12.5%
4.7% 5.1% 4.2% 4.6%
New England
6.8 7.2 6.3 14.4
5.5 6.2 5.5 4.0 Mideast
6.5 5.7 6.4 13.2
4.7 5.0 5.0 3.7
Great Lakes
6.6 6.2 6.9 11.4
4.7 5.7 3.7 3.6 Plains
6.7 6.7 5.9 13.1
4.8 6.2 3.2 4.8
Southeast
6.5 5.4 7.0 12.8
4.2 4.3 3.2 4.6 Southwest
6.0 5.9 6.5 11.0
5.0 4.9 4.0 6.9
Rocky Mountains
6.6 6.7 6.6 10.0
4.6 5.5 3.9 5.3
Far West
6.2 6.6 4.4 13.1 5.5 5.6 5.3 6.1
Exhibit 6b. Regional Per Capita Personal Health Care, Hospital, Physician & Clinics, and Prescription Drug Spending*, as a Percent of U.S. Per Capita, By State of Residence, Selected Periods 1998–2009
Annual growth As a percent of U.S. per capita for 2009
Region
Personal Health Care
Hospital Services
Physician & Clinical Services
Prescription Drug
United States
100% 100% 100% 100%
New England
129 129 117 120 Mideast
117 114 108 118
Great Lakes
101 110 93 94 Plains
104 115 90 101
Southeast
95 92 97 111 Southwest
87 88 92 86
Rocky Mountains
85 87 88 72
Far West
93 87 111 82 * Prescription drug spending shown does not include spending on other non-durable medical products. SOURCE: Population, U.S. Bureau of the Census; Centers for Medicare & Medicaid Services, Office of the Actuary,
National Health Statistics Group
Impacts of the recent recession on health spending by state
The recession from December 2007 through June 2009 was notable because of its duration and depth, as well as for its impact on the health sector (Martin et al., 2011). The significant drop in
MMRR 2011: Volume 1 (4)
Cuckler, G., Martin, A., Whittle, L., Heffler, S., Sisko, A., Lassman, D., Benson, J. E20
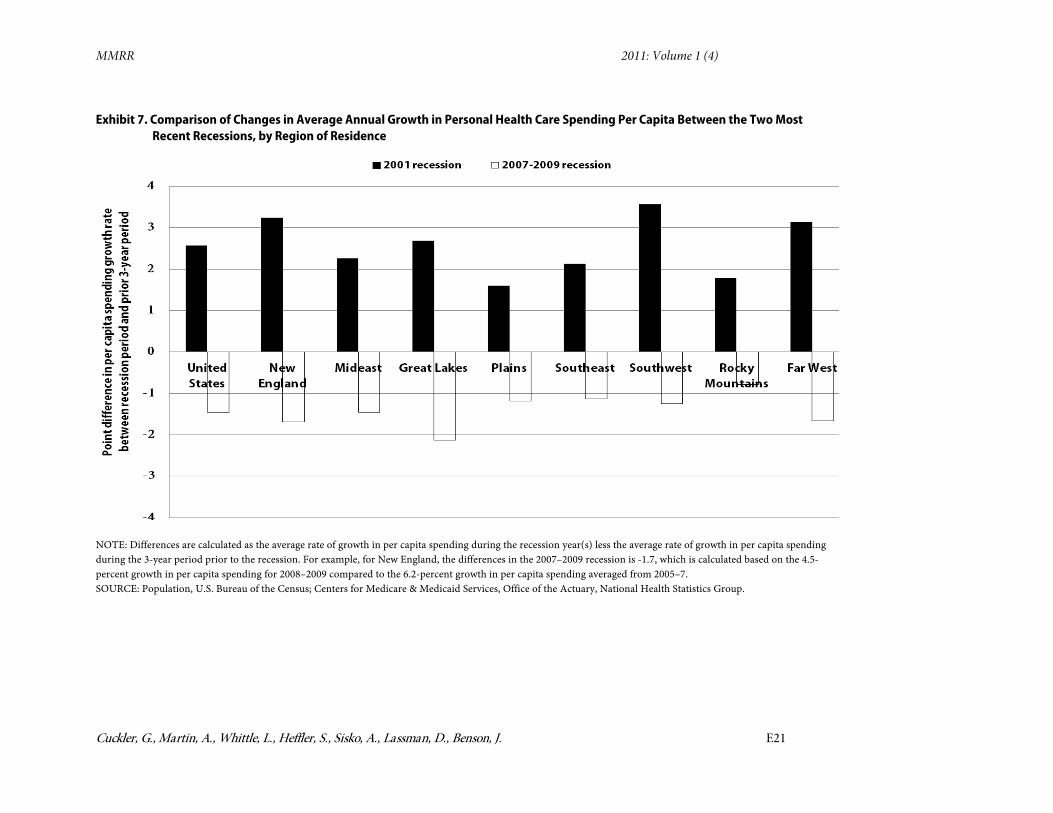
employment and health insurance coverage, coupled with significantly slowing income growth, caused national health spending to grow much slower during the recent recession than was experienced during the 2001 recession. For every region, per capita personal health care spending growth was slower during this most recent recession relative to the prior three-year period, and was different than experienced during the 2001 recession (Exhibit 7). The trend also held for aggregate personal health care spending by region between the two recessions.
Some regions and states were more impacted during the recent recession than others. In particular, the Great Lakes, New England, and Far West regions experienced the most significant slowdowns in per capita personal health care spending growth. The Far West and Great Lakes regions experienced many of the largest increases in unemployment rates, with the majority of states in these regions incurring more than a four-percentage point increase in their unemployment rates between 2007 and 2009, concurrent with a more than one-percentage point increase in their uninsured rates (U.S. Bureau of Labor Statistics, 2011). Excluding Massachusetts, which is unique because of the impact of expanded health insurance coverage under its reform as discussed earlier, the remaining New England states experienced the largest increase in uninsured rates compared to other regions, averaging more than a two-percentage point increase between 2007 and 2009.
Despite the slower overall spending growth during the recession, health care consumed an incrementally larger share of the nation’s resources at a historic pace. From 2007 through 2009, the personal health care share of GDP increased by 1.2-percentage points (reaching 14.8 percent), and included the largest single year increase in share ever experienced in 2009 when nominal GDP actually declined. Over this same period, every region experienced an increase in the personal health care spending share of the region’s GDP by state of at least 0.9-percentage points, which was greater than any region experienced during the 2001 recession.
In the most recent recession, the Southeast and Southwest regions experienced the largest increase in the share of state GDP accounted for by personal health care spending. These two regions have the lowest per capita income and experienced some of the largest declines in per capita state GDP of any region over this period. Within these regions the two largest states, Florida and Texas, both experienced faster-than-average increases in personal health care spending and slower-than-average growth in state GDP. Other states that experienced large increases in the personal health care spending share of state GDP during the most recent recession were Michigan, Arizona, and Oregon, each of which had declines in state GDP per
MMRR 2011: Volume 1 (4)
Cuckler, G., Martin, A., Whittle, L., Heffler, S., Sisko, A., Lassman, D., Benson, J. E21
Exhibit 7. Comparison of Changes in Average Annual Growth in Personal Health Care Spending Per Capita Between the Two Most Recent Recessions, by Region of Residence
NOTE: Differences are calculated as the average rate of growth in per capita spending during the recession year(s) less the average rate of growth in per capita spending during the 3-year period prior to the recession. For example, for New England, the differences in the 2007–2009 recession is -1.7, which is calculated based on the 4.5-percent growth in per capita spending for 2008–2009 compared to the 6.2-percent growth in per capita spending averaged from 2005–7. SOURCE: Population, U.S. Bureau of the Census; Centers for Medicare & Medicaid Services, Office of the Actuary, National Health Statistics Group.
MMRR 2011: Volume 1 (4)
Cuckler, G., Martin, A., Whittle, L., Heffler, S., Sisko, A., Lassman, D., Benson, J. E22
capita. Conversely, Vermont, West Virginia, North Dakota, Oklahoma, and Wyoming all experienced only marginal increases (if not small declines) in the personal health care share of state GDP during this period. All 5 of these states had very rapid growth in per capita state GDP over the period, with all but Vermont growing at least 8 percent (compared to a decline in U.S. per capita GDP growth).
Conclusions
Under current law, the health sector will undergo many changes over the next decade. The implementation of health insurance exchanges at the state level, as well as the expansion of coverage through Medicaid, has implications for state policy and resources. At the same time, a major demographic shift (the aging of the baby-boom generation) will be in progress. As a result, the findings of this study provide policy makers with some key trends relating to per person health spending by state. We found that states with higher per capita personal health care spending generally had relatively higher per capita income together with higher-than-average shares of the elderly. States with lower per capita personal health care spending, on the other hand, have relatively younger populations with less access to health insurance. If these trends persist, these states would be most likely to have the greatest potential number of people eligible for the Medicaid expansion or exchange coverage.
While wide variation in total personal health care spending levels by state persists, we found that the magnitude of variation is fairly stable over time. Variation and the composition of the highest and lowest spending states are less stable over time for Medicare and Medicaid spending per enrollee. Finally, our findings offer some indication of the differential impacts of recent policy changes, as well as the recent recession, on the states and regions. Health reform in Massachusetts led to an increased share of spending on physician and clinical services, while the Medicare Part D expansion led to a one-time increase in prescription drug spending in 2006, with much of it reflected in the western portion of the country. The recent economic downturn slowed spending growth across all regions more severely than the 2001 recession.
Correspondence Gigi Cuckler, M.A., M.B.A., National Health Statistics Group in the Office of the Actuary, Centers for Medicare & Medicaid Services, at [email protected]
Acknowledgements The opinions expressed here are the authors’ and not necessarily those of the Centers for Medicare & Medicaid Services. The authors would like to acknowledge the contributions of Aaron Catlin, Mark Freeland, Todd Caldis, John Poisal, Liming Cai, Chris Truffer and Cathy Cowan.
MMRR 2011: Volume 1 (4)
Cuckler, G., Martin, A., Whittle, L., Heffler, S., Sisko, A., Lassman, D., Benson, J. E23
References
Acemoglu, D., Finkelstein, A., & Notowidigdo, M. J. (2009, February). Income and Health Spending: Evidence from Oil Price Shocks. Retrieved September 15, 2011, from http://www.nber.org/papers/w14744
Baker, L.C., Bundorf, M. K., & Kessler, D. P. (2010). HMO Coverage Reduces Variations in the Use of Health Care Among Patients Under Age Sixty-Five. Health Affairs, 29(11), 2068–2074. PubMed doi:10.1377/hlthaff.2009.0810
Bureau of Economic Analysis (2011). State per Capita Personal Income. Retrieved August 8, 2011, from http://www.bea.gov/iTable/iTable.cfm?reqid=70&step=1&isuri=1&acrdn=4
Catlin, A., Cowan, C., Hartman, M., Heffler, S., & the National Health Expenditure Accounts Team (2008). National Health Spending in 2006: A Year of Change for Prescription Drugs. Health Affairs, 27(1), 14–29. PubMed doi:10.1377/hlthaff.27.1.14
Centers for Disease Control (2011a). Behavioral Risk Factor Surveillance System. Retrieved September 13, 2011, from http://www.cdc.gov/brfss/
Centers for Disease Control. (2011b). State, Regional, and National Estimates of Health Insurance Coverage for People Under 65 Years of Age. National Health Interview Survey 2004–2006.
Centers for Medicare & Medicaid Services. (forthcoming). Health Spending By State of Provider, 1991–2009. Baltimore, MD.
Centers for Medicare & Medicaid Services (2011). National Health Expenditures Accounts: Definitions, Sources, and Methods, 2009. Baltimore, MD. Retrieved November 21, 2011 from http://www.cms.gov/NationalHealthExpendData/downloads/dsm-09.pdf
Congressional Budget Office (2008, February). Geographic Variation in Health Care Spending. Retrieved September 13, 2011, from http://www.cbo.gov/ftpdocs/89xx/doc8972/02-15-GeogHealth.pdf
Cylus, J., Hartman, M., Washington, B., Andrews, K., & Catlin, A. (2011). Pronounced Gender And Age Differences Are Evident In Personal Health Care Spending Per Person. Health Affairs, 30(1), 153–160. PubMed doi:10.1377/hlthaff.2010.0216
Davern, M., Klerman, J. A., Ziegenfuss, J., Lynch, V., & Greenberg, G. (2009). A partially corrected estimate of Medicaid enrollment, uninsurance: Results from an imputational model developed off linked survey, administrative data. Journal of Economic and Social Measurement, 34(4), 219–240.
DiMatteo, L. (2005). The Macro determinants of health expenditure in the United States and Canada: assessing the impact of income, age distribution, and time. Health Policy (Amsterdam), 71, 23–42. doi:10.1016/j.healthpol.2004.05.007

MMRR 2011: Volume 1 (4)
Cuckler, G., Martin, A., Whittle, L., Heffler, S., Sisko, A., Lassman, D., Benson, J. E24
Englehardt, G. V., & Gruber, J. (2009). Medicare Part D and the Financial Security of the Elderly. 11th Annual Joint Conference of the Retirement Research Consortium, (pp. 1–2). Washington, DC.
Foster, M. A., & Goldsmith, S. (2011, August). Alaska's Health-Care Bill: $7.5 Billion and Climbing. Retrieved September 13, 2011, from http://www.iser.uaa.alaska.edu/Publications/RevisedHealthcare.pdf
Fu Associates (2005). Interstate Flows of Health Spending: Update for 2002. [Memoranda dated 30 January 2004, 19 May 2006, 6 Dec 2008, and 10 Dec 2008]. Contract no. CMS-03-01070. Centers for Medicare & Medicaid Services.
Getzen, T. E. (2000). Health Care is an Individual Necessity and a National Luxury: Applying Multilevel Decision Models to the Analysis of Health Care Expenditures. Journal of Health Economics, 19, 259–270. PubMed doi:10.1016/S0167-6296(99)00032-6
Holahan, J. (2007). State Variation in Medicaid Spending: Hard to Justify. Health Affairs, 26(6), w667–w669. PubMed doi:10.1377/hlthaff.26.6.w667
Holahan, J., Miller, D. M., & Rousseau, D. (2009, February). Dual Eligibles: Medicaid Enrollment and Spending for Medicare Beneficiaries in 2005. Retrieved September 15, 2011, from http://www.kff.org/medicaid/upload/7846.pdf
Long, S. K. (2008). On the Road to Universal Coverage: Impacts of Reform in Massachusetts at One Year. Health Affairs, 27(4), w270–w284. PubMed doi:10.1377/hlthaff.27.4.w270
Long, S. K., & Masi, P. B. (2009). Access and Affordability: An Update On Health Reform In Massachusetts, Fall 2008. Health Affairs, 28(4), w578–w587. PubMed doi:10.1377/hlthaff.28.4.w578
Martin, A. B., Whittle, L., Heffler, S., Barron, M. C., Sisko, A., & Washington, B. (2007). Health Spending By State Of Residence, 1991–2004. Health Affairs, 26(6), w651–w663. PubMed doi:10.1377/hlthaff.26.6.w651
Martin, A., Lassman, D., Whittle, L., & Catlin, A., & the National Health Expenditure Accounts Team (2011). Recession Contributes To Slowest Annual Rate Of Increase In Health Spending In Five Decades. Health Affairs, 30(1), 11–22. PubMed doi:10.1377/hlthaff.2010.1032
Mead, H., Cartwright-Smith, L., & Jones, K. (2008, March). Racial and Ethnic Disparities in U.S. Health Care: A Chartbook. Retrieved November 1, 2011, from http://www.commonwealthfund.org/usr_doc/mead_racialethnicdisparities_ chartbook_1111.pdf
Mendes, E. (2011, September 6). Texas and Mass. Still at Health Coverage Extremes in U.S. Retrieved September 13, 2011, from Gallup: http://www.gallup.com/poll/149321/texas-mass-health-coverage-extremes.aspx

MMRR 2011: Volume 1 (4)
Cuckler, G., Martin, A., Whittle, L., Heffler, S., Sisko, A., Lassman, D., Benson, J. E25
Minnesota Population Center (2011). Integrated Public Use Microdata Series (IPUMS). Retrieved September 13, 2011, from http://cps.ipums.org/cps/
Office of the Actuary (2010). 2010 Actuarial Report on the Financial Outlook for Medicaid. Retrieved September 14, 2011, from https://www.cms.gov/actuarialstudies/ downloads/MedicaidReport2010.pdf
Philipson, T. J., Seabury, S. A., Lockwood, L. M., Goldman, D. P., & Lakdawalla, D. N. (2010). Geographic Variation in Health Care: The Role of Private Markets. Retrieved November 1, 2011 from http://www.brookings.edu/~/media/Files/Programs/ES/BPEA/2 010_spring_bpea_papers/ spring2010_philipson.pdf
Rettenmaier, A. J., & Saving, T. R. (2010). Perspectives on the Geographic Variation in Health Care Spending. Retrieved September 13, 2011, from http://www.aei.org/docLib/ Rettenmaier%20and%20Saving%20%20Perspectives%20on%20Geographic%20Variation%20in%20Health%20Spending.pdf
Rettenmaier, A. J., & Wang, Z. (2010). Regional Variations in Medical Spending and Utilization: A Longitudinal Analysis of US Medicare Population. Health Economics. doi:10.1002/hec.1700 PubMed
Smith, C., Cowan, C., Heffler, S., & Catlin, A. (2006, January/February). National Health Spending In 2004: Recent Slowdown Led By Prescription Drug Spending. Health Affairs, 25(1), 186–196. PubMed doi:10.1377/hlthaff.25.1.186
U.S. Bureau of Labor Statistics (2011). Local Area Unemployment Statistics [by State]. Retrieved November 3, 2011, from http://www.bls.gov/data/
U.S. Bureau of the Census (2011). Annual Estimates of the Population for the United States and States. Retrieved June 1, 2011, from http://www.census.gov/popest/estimates.php
Wright, D. B., & Ricketts, T. C. (2010). The Road to Efficiency? Reexamining the Impact of the Primary Care Physician Workforce on Health Care Utilization Rates. Social Science & Medicine, 70, 2006–2010. PubMed doi:10.1016/j.socscimed.2010.02.043
Zuckerman, S., Waidmann, T., Berenson, R., & Hadley, J. (2010). Clarifying Sources of Geographic Differences in Medicare Spending. The New England Journal of Medicine, 363(1), 54–62. PubMed doi:10.1056/NEJMsa0909253
Zuckerman, S., Williams, A. F., & Stockley, K. E. (2009). Trends in Medicaid Physician Fees, 2003–2008. Health Affairs, 28(3), w510–w519. PubMed doi:10.1377/hlthaff.28.3.w510

MMRR 2011: Volume 1 (4)
Cuckler, G., Martin, A., Whittle, L., Heffler, S., Sisko, A., Lassman, D., Benson, J. E26
Appendix: State Health Expenditure Econometric Modeling
Since the inception of the State Health Expenditures component of the National Health Expenditure Accounts, demand has grown for multivariate regression analysis to accompany the usual descriptive analysis that accompanies the estimates by state of residence. For the first time in the state health expenditure analysis, econometric modeling was used to analyze variation in total personal health care spending per capita annually from 1991 through 2009. Our model was designed to provide further substantiation and context for the descriptive analysis-based findings presented in this paper and other related Office of the Actuary analyses presented on the CMS Web site.
Literature Review
To inform model development, we reviewed the health spending variation literature that examined total, Medicare, and Medicaid spending variation. While the literature on Medicare spending variation, particularly the Dartmouth Atlas body of work, is most voluminous, the most influential of these papers on our model were those that examined variation in total personal health care spending per capita and/or used the state as the unit of analysis. 1 From these papers, we identified a range of peer-reviewed and ostensibly accepted specifications, econometric techniques, data sources, coefficient magnitudes, signs, statistical significance, and interpretation.
Our Data Set and Specification Development
The data set constructed for this analysis consists of 950 observations (50 state cross-sections over 19 years of available data) for per capita personal health care spending. The District of Columbia was excluded from our analysis due to its outlier behavior in personal health care spending, elevated interstate health care spending (due to its proximity to Maryland and Virginia), and urban nature when compared with the states.
In addition to our per capita personal health care spending levels by state for 1991 through 2009, we gathered state-level economic data, demographics, health status and other characteristics for use as prospective independent variables in our models applicable to those years.2 Extrapolation or interpolation methods were used to fill gaps in any dataset in which a comprehensive data series was not available. The choice of independent variables in our model, as well as any transformations, was informed by our literature review, as well as by economic and health-sector relevant theory and relationships. These variables are largely gathered from government data
1 These specific studies included DiMatteo (2005), Congressional Budget Office (2008), Zuckerman et al. (2009), Baker et al. (2010), Rettenmaier and Saving (2010), L. Sheiner (personal communication, November 7, 2011), Rettenmaier and Wang (2010), Philipson et al. (2010), Getzen (2000), Wright and Ricketts (2010), Zuckerman et al. (2010), and Acemoglu et al. (2009). A full listing of references consulted is available on request. 2 A full listing of all variables in our models is available on request.

MMRR 2011: Volume 1 (4)
Cuckler, G., Martin, A., Whittle, L., Heffler, S., Sisko, A., Lassman, D., Benson, J. E27
sources, including the Bureau of Economic Analysis, the U.S. Census Bureau, the Centers for Disease Control, the Health Resources and Services Administration, and the National Center for Health Statistics. To integrate a portion of our literature review and to further test the accuracy of our compiled dataset, we successfully replicated the results of a study that used a past vintage of the State Health Expenditures as a data source (Rettenmaier and Saving, 2010) and was consistent with another in progress (L. Sheiner, personal communication, November 7, 2011). All data management and regression analyses were conducted using SAS statistical software.
Our model is intended to explain the variation in levels of per capita personal health care spending over the period 1991–2009 (as opposed to growth in spending over time). While no definitive data source exists to control for state-specific price differences, we did adjust our per capita health spending and income series more generally for inflation using the BEA’s national personal consumption expenditure deflator, which converts the data to 2009 dollars, as was done by Rettenmaier and Saving (2010).
We used an extensive, iterative process in which to narrow down our model specification to those variables that produced reasonable regression coefficients (both in magnitude and sign), statistical significance, and bear resemblance to the best studies found elsewhere in the literature. Our final specification, rationale, as well as relevant source information and descriptive statistics, are summarized in Exhibit A1.
Exhibit A1. Per Capita Personal Health Care Spending by State Model: Independent Variables Descriptive Statistics, and Rationale
Variable Source Expected
sign N Mean Std.
Dev.
Rationale for Inclusion and Interpretation
Natural log of per capita income by state, adjusted by the PCE deflator ($)
Bureau of Economic Analysis
+ 950 10.42 0.18 Controls for differences in means to pay for health care and a state's ability to support a certain level of health care supply; transformation as natural log can be interpreted as an income elasticity.1
Community hospital beds per 1,000 population, by state
Health, US + 950 3.25 1.02 Controls for health care supply/capacity
Share (%) of state population associated with women of childbearing age (20–44)
U.S. Census Bureau
+ 950 18.13 1.27 Controls for a key demographic group (gender-related)

MMRR 2011: Volume 1 (4)
Cuckler, G., Martin, A., Whittle, L., Heffler, S., Sisko, A., Lassman, D., Benson, J. E28
Exhibit A1 (cont)
Variable Source Expected
sign N Mean Std.
Dev. Rationale for Inclusion
and Interpretation
Share (%) of state population that is African American
U.S. Census Bureau
- 950 9.96 9.40 Controls for a key demographic group (race-related)
Share (%) of state population that is age 65 or older
U.S. Census Bureau
+ 950 12.65 1.89 Controls for a key demographic group (age-related)
Bad health index by state (smoking rate*obesity rate)*100 (out of a maximum of 100)
U.S. Centers for Disease Control, Behavioral Risk Factor Surveillance System
+ 950 4.42 1.34 Controls for health status, health behaviors
Share (%) of state population that is uninsured
Enhanced Current Population Survey2
- 950 12.54 3.74 Controls for Insurance Status
HMO penetration by state (%) Health, US - 950 17.70 12.15 Controls for more tightly managed networks
Time Trend (linear) + 950 9.00 5.48 Controls for unmeasured or unaccounted for factors associated with the passage of time (e.g., changes in policy, economic conditions, health care practice patterns, health care technology, tastes and preferences of patients, etc.)
1 As illustrated in Getzen (2000), the interpretation of an income elasticity depends on the unit of analysis. In this case, the unit of analysis is the state, and the income elasticity reflects the relative impact of changes in income on health spending between the states. 2The uninsured population was adjusted for observed underreporting of Medicaid coverage in the Census Population Survey, based on research by Davern et al. (2009) and updated adjustment estimates from J. Ziegenfuss (personal communication, September 6, 2011). SOURCE: Centers for Medicare & Medicaid Services, Office of the Actuary.
Econometric Techniques, Model Results, and Discussion
As with the development of an appropriate and reasonable specification, we employed an iterative process in which we tested the merits of three econometric techniques that have been employed in the literature: ordinary least squares, state/regional fixed effects (which we

MMRR 2011: Volume 1 (4)
Cuckler, G., Martin, A., Whittle, L., Heffler, S., Sisko, A., Lassman, D., Benson, J. E29
independently verified with a Hausman test as the appropriate choice between fixed and random effects), and two-stage least-squares (to determine whether we could address the endogenous nature of income as a determinant of per capita health spending). We found that an OLS model incorporating our entire, pooled dataset produced the most defensible and reasonable estimates for our purpose. Our model results are presented in Exhibit A2.
Exhibit A2: Pooled OLS Model Regression Results Dependent Variable: Natural log of per capita total personal health care spending by state,
adjusted by the PCE deflator
Independent Variables Coefficient
(Standard Error) Intercept 1.04683 ** (0.25532) Natural log of per capita income by state, adjusted by the PCE deflator 0.59849 ** (0.02498) Community hospital beds per 1,000 population by state 0.01900 ** (0.00378)
Share of state population associated with women 0.02887 ** of childbearing age (20–44) (0.00619)
Share of state population that is African American -0.00081 ** (0.00036587) Share of state population age 65 or older 0.02914 ** (0.00198) Bad health index by state (smoking rate*obesity rate) 0.02305 ** (0.0028) Share of state population that is uninsured -0.00128 * (0.0008) HMO penetration by state -0.00127 ** (0.0002966) Time Trend 0.02744 ** (0.00167)
N = 950 Adjusted R-squared: 0.8897 ** denotes significance at the 95 level
* denotes significance at the 90 level SOURCE: Centers for Medicare & Medicaid Services, Office of the Actuary.
The results of the model, which attest to the economic and statistical significance of income, demographic, and other socioeconomic factors in the cross-section, substantiate the findings of the descriptive analysis for 2009 presented in the current paper, and resemble key results found in other studies. Notably, our cross-state income elasticity estimate compares well with the regional elasticities summarized by Getzen (2000) and the state-level elasticities calculated from estimates by Rettenmaier and Saving (2010), which ranged from 0.4 to 0.9. Based on our specification, we are able to account for nearly 90 percent of the variation in per capita personal

MMRR 2011: Volume 1 (4)
Cuckler, G., Martin, A., Whittle, L., Heffler, S., Sisko, A., Lassman, D., Benson, J. E30
health care spending, of which per capita income and the time trend accounted for the greatest amount of variation.
Limitations of the Model
While we have made every attempt to develop a model that accurately assesses the factors that affect per capita personal health care spending, the results of our model do not address, and should not be used to imply, causality. Endogeneity and multicollinearity are factors that affect models that attempt to account for or explain the factors determining per capita health spending; additional research and model development will be necessary to specifically address endogeneity and the possible direction of causality.
As with all the studies that examined per capita personal health care spending by state, our estimates and choice of specification are limited based on the availability of suitable state-level independent variables. Similarly, no data source exists by which we can adjust for state level differences in prices. As a result, we cannot deflate per capita health care spending and income differentially by state, which should be kept in mind when interpreting our estimated income elasticity. Finally, our estimates are subject to any error that may underlie our source data.

MMRR 2011 Volume 1, Number 4
ISSN: 2159-0354 doi: http://dx.doi.org/10.5600/mmrr.001.04.a03 E31
Medicare & Medicaid Research Review 2011
Volume 1, Number 4
Mission Statement
Medicare & Medicaid Research Review is a peer-reviewed, online journal reporting data and research that informs current and future directions of the Medicare, Medicaid, and Children’s Health Insurance programs. The journal seeks to examine and evaluate health care coverage, quality and access to care for beneficiaries, and payment for
health services.
http://www.cms.gov/MMRR/
U.S. Department of Health & Human Services
Kathleen Sebelius, Secretary
Centers for Medicare & Medicaid Services Marilyn Tavenner
Acting Administrator
Center for Strategic Planning Anthony D. Rodgers,
Deputy Administrator and Director Editor-in-Chief David M. Bott, Ph.D. Senior Editor Cynthia Riegler, M.A.
Editorial Board Gerald S. Adler, M.Phil.
CMS/Center for Strategic Planning Andrew Bindman, M.D.
University of California, San Francisco William J. Buczko, Ph.D.
CMS/Innovation Center Todd Caldis, Ph.D., J.D.
CMS/Office of the Actuary Craig F. Caplan, M.A.
CMS/ Innovation Center Melissa A. Evans, Ph.D.
CMS/Center for Medicare
John Hsu, M.D., M.B.A, M.S.C.E. Harvard Medical School
Jesse M. Levy, Ph.D. CMS/ Innovation Center
Jennifer Polinski, Sc.D, M.P.H. Brigham & Women's Hospital Isidor R. Strauss, F.S.A.
CMS/Office of the Actuary Fred G. Thomas, Ph.D., C.P.A.
CMS/ Innovation Center Robert Weech-Maldonado, Ph.D. University of Alabama at Birmingham
Submission Guidelines: http://www.cms.gov/MMRR/downloads/MMRR_Guidelines_for_Authors_20110706.pdf Contact: [email protected]
Published by the Centers for Medicare & Medicaid Services All material in the Medicare & Medicaid Research Review is in the public domain and may be duplicated without permission.
Citation to source is requested.