Embed Size (px)
Citation preview

Health outcomes in former New Zealand timber workers exposed to pentachlorophenol (PCP)
McLean D, Eng A, ‘t Mannetje A, Walls C, Dryson E, Cheng S, Wong K, Pearce N.
Centre for Public Health Research Massey University, Wellington
Health outcomes in former New Zealand timber workers exposed to pentachlorophenol (PCP).

D McLean, A Eng, A ‘t Mannetje, S Cheng, K Wong, N Pearce. Centre for Public Health Research Research School of Public Health Massey University, Wellington, New Zealand C Walls, E Dryson Occupational Medicine Specialists 484 Remuera Rd, Remuera, Auckland, New Zealand Reference McLean D, Eng A, ‘t Mannetje A, Walls C, Dryson E, Cheng S, Wong K, Pearce N. Health outcomes in former New Zealand timber workers exposed to pentachlorophenol (PCP). Technical Report No. 20. Wellington: CPHR, 2007. Acknowledgements This research was funded by the Health Research Council of New Zealand (HRC) Partnership Programme under a Joint Research Portfolio between the Department of Labour and the HRC, under HRC Project Grant 04/493.We wish to thank the management and staff of the two sawmills who provided access to historical employment records, and also Dr Bruce Gollop who provided data from the 1986-7 PCP biomonitoring survey. We also wish to thank Susan Adams (Department of Labour), Dr Simon Buckland (Environmental Risk Management Authority), Professor Chris Cunningham (Research Centre for Māori Health and Development, Massey University), Karen Fletcher (NZCTU), Panu Raea (Forest Industries Council), Gwenda Paul (SWAP), Dr Deborah Read (Ministry of Health), Jim Jones (Northern Distribution Union), Mike Ward (Engineering Printing and Manufacturing Union) and Howard Ellis (Ministry for the Environment) for providing advice on the conduct of this study, and also Drs Phil Shoemack (Medical Officer of Health, Bay of Plenty District Health Board) and Barry Borman (Public Health Intelligence, Ministry of Health) for assistance with the conduct of the study. We also thank Elizabeth Harding, Dr Christine van Dalen, Yvonne Murray, Professor Bill Glass, Michelle and Dr Simon Ryder-Lewis, Barbara Hosie, Helen Parry and Kim Powell for their work on the morbidity survey, Associate Professor Jeroen Douwes and Collin Brooks for arranging the processing and testing of blood samples for dioxin, and Hilary Nuttall for assistance with preparation of the report. We also thank Nick Matsas, Bob Hill and Kataraina Maki (Department of Labour) for administrative assistance with the study. Finally, we also wish to thank the participants in the morbidity survey, and also the members of Sawmill Workers Against Poisons (SWAP) for providing access to their own serum dioxin results, and in particular Joe Harawira for assistance in contacting members.
Health outcomes in former New Zealand timber workers exposed to pentachlorophenol (PCP). i

Summary Concerns remain about chronic health problems experienced by former timber workers who were exposed to pentachlorophenol (PCP) when it was used as an anti-sapstain fungicide treatment in saw mills. The Health Research Council, on behalf of the Department of Labour, issued a Request for Proposals (RFP) for a research project aimed at clarifying whether the health effects were real and whether they were associated with the PCP exposure. The Centre for Public Health Research was subsequently awarded a contract to conduct: (i) an historical cohort study of mortality (deaths); and (ii) a cross-sectional morbidity survey of current health problems in a randomly selected sample of former sawmill workers from the cohort study. The latter survey included: (iii) the collection of serum samples for dioxin testing. (i) The cohort mortality study: Records were identified from three sawmill industry employers, the New Zealand Forest Service and two large private sawmills in the Waikato and Nelson regions. The records covered the period 1970-1990, i.e. the period when PCP was used. Usable records were identified for 3,895 workers, and these were followed up until 31st December 2000. Overall, there were 454 deaths in the cohort, compared with an expected number of 503.6 based on national death rates for men and women of the same age. Thus, the death rate in the sawmill workers was slightly lower than the national average (SMR = 0.90, 95% CI 0.82-0.99), presumably due to the ‘healthy worker effect’. In the overall cohort the only cause of death that showed a significant excess was non-transport accidents (SMR = 1.76, 95% CI 1.14-2.59), a category which mainly comprises non-transport workplace accidents. In workers with known PCP exposure, there was an excess of deaths from non-malignant respiratory disease (SMR = 1.91, 95% CI 0.98-3.33, p=0.05). In internal comparisons between those exposed to PCP and those not exposed there was an elevation in both all-cause mortality (RR = 1.21, 95% CI 0.94-1.55) and total cancer mortality (RR = 1.41, 95% CI 0.80-2.47), with an even more marked elevation in mortality from non-malignant respiratory disease (RR = 2.98, 95% CI 1.18-7.55). (ii) The morbidity survey: This survey involved interviews, clinical examinations, and blood tests in 293 randomly selected surviving members of the sawmill workers’ cohort; of whom 177 had not been exposed to PCP and 116 had been exposed. However, it was found that the participants in the survey had mostly had low exposure (only 10% had worked in the timber industry for ten years or more, or had undertaken either of the two high risk activities of mixing PCP or cleaning sludge from PCP tanks. Thus, the survey indicates that most former timber workers had low and/or short-term exposure. This is reassuring with regards to the levels of exposure in former timber workers in general, but it means that the morbidity survey (and the cohort study on which it is based) has involved relatively few workers with high long-term exposures, and is therefore limited in what it can tell us about the health effects of PCP exposure in such workers. Nevertheless, the morbidity survey yielded several interesting findings. These included: (i) statistically significant associations between exposure levels and risks of self-reported tuberculosis, pleurisy or pneumonia (p<0.01) and a deficit in cranial nerve function (p=0.04), and increased risks for asthma, eczema, thyroid disorders, ‘unexplained persistent fevers’, ‘recurrent nausea and diarrhoea’, ‘having palpitations of the heart’, ‘lack of interest in sex’ and ‘feelings
Health outcomes in former New Zealand timber workers exposed to pentachlorophenol (PCP).
ii

of oppression in the chest’ were observed; (ii) statistically significant associations between years worked in the industry and thyroid disorders (p=0.04), and neuropsychological effects including ‘often going back to check things’ (p=0.04), ‘lack of interest in sex’ (p=0.02) and ‘heart palpitations’ (p=0.02), and also a highly statistically significant dose-response trend for ‘frequent mood changes without cause’ (p<0.01). There were also increased risks for asthma, eczema, ‘persistent fatigue’, ‘recurrent nausea and diarrhoea’, ‘finding it hard to get the meaning from newspapers and books’, ‘problems concentrating’, ‘sweating for no reason’, ‘feeling depressed’, ‘being abnormally tired’, ‘frequent headaches’ and difficulty with the straight leg raising test; and (iii) statistically significant associations between cumulative exposure (exposure intensity times years worked) and ‘frequent mood changes without cause’ (p=0.02), ‘less interest in sex’ (p=0.04), as well as in the overall number of neuropsychological symptoms reported (p=0.03), and associations with asthma, eczema, tuberculosis, pleurisy or pneumonia, thyroid disorders, ‘recurrent nausea’, ‘sweating without reason’ and ‘painful tingling in some parts of the body’ were also observed. No cases of chloracne were identified. Few morbidity survey participants had non-fasting glucose outside the reference range of 3 – 8 mmol/L, and while an association between ever having been exposed to PCP and having excess non-fasting glucose (OR=1.56, 95% CI 0.55 – 4.42, 15 cases) was observed, the small numbers precluded dose-response analyses. The serum survey: Blood was collected from all participants in the morbidity survey, although the available funding permitted testing of serum dioxin levels in only 71 exposed workers and pooled samples from 23 of the non-exposed workers (8 each for the 35-49 and 50-64 age-group and 7 for the 65+ age-group). Blood test results were also available for 23 members of Sawmill Workers Against Poisons (SWAP) who had been tested by the ACC using the same laboratory, and these were included in the analysis of the serum dioxin levels in former timber workers. These analyses showed that: (i) as a group, the former timber workers in the morbidity survey had elevated serum dioxin levels compared with workers of the same age who had not been exposed to PCP; (ii) there was a small group (about 10%) of former timber workers, particularly those who had worked in the industry for ten years or more and/or carried out high risk tasks such as mixing PCP or cleaning sludge from PCP tanks, who had particularly elevated serum dioxin levels; (iii) most of the SWAP members fell into the high risk group, but had much higher serum dioxin levels than were observed in our random sample of timber workers. Overall, our random sample of former timber workers who had worked in the industry for at least ten years had excess serum dioxin levels (TEQ) of about 14 ppt, which were similar to the excess levels observed in former long-term Paritutu residents; however, the SWAP members had much higher excess serum dioxin levels which were more than double those observed in former long-term Paritutu residents. Conclusions: (i) a random sample of former timber workers has found that most former workers in the industry had relatively low levels of exposure and/or worked in the industry for only a few years; (ii) these workers with relatively low exposure have death rates similar to, or less than, the national death rates for workers of the same age; (iii) an internal comparison indicated an increased risk of cancer in workers exposed to PCP compared with those not exposed, although this was not statistically significant; (iv) there is a small subgroup of former timber workers (about 10% of the workforce) who had high exposures and/or worked in the industry for ten years of
Health outcomes in former New Zealand timber workers exposed to pentachlorophenol (PCP).
iii

more; (iv) this group have relatively high levels of dioxin in their blood; (v) the cohort study and morbidity survey included too few highly exposed workers to assess specific health problems such as cancer or diabetes in this group, but they nevertheless identified a number of physical and neuropsychological health problems. Notwithstanding the small numbers with high exposure, strong associations were observed between exposure and chronic respiratory disease, and also ‘unexplained persistent fevers’, ‘recurrent nausea and diarrhoea’, ‘having palpitations of the heart’, ‘sweating for no reason’, ‘reduced libido’ and ‘frequent mood changes without cause’. Similar neuropsychological symptoms have also been observed in an earlier study of PCP-exposed workers in New Zealand.
Health outcomes in former New Zealand timber workers exposed to pentachlorophenol (PCP).
iv

Table of contents Page No. Acknowledgements (i) Summary (ii) Table of Contents (v) List of Tables and Figures (vi) Background 1 Introduction 3 Historical Cohort Mortality Study 5 Aims 5 Methods 5 Results 6 Discussion 10 Cross-Sectional Morbidity study 13 Aims 13 Methods 13 Results 15 Discussion 26 Exposure assessment 28 Introduction 28
Methods 30 Analysis 31 Results 31 Discussion 37 References 39 Appendix 41
Health outcomes in former New Zealand timber workers exposed to pentachlorophenol (PCP).
v

Health outcomes in former New Zealand timber workers exposed to pentachlorophenol (PCP).
vi
List of Tables and Figures _____________________________________________________________________ Page No. Table 1 Characteristics of the sawmill workers cohort 6 Table 2 Total and Cause-specific mortality for the Sawmill Workers
Cohort 7
Table 3 Total and Cause-specific mortality for selected causes by exposure to PCP
9
Table 4 Characteristics of the Morbidity Survey Participants 16 Table 5a Prevalence of symptoms by PCP exposure 17 Table 5b Symptom Scores by PCP exposure 18 Table 6 Frequency of calculated exposure scores 18 Table 7a Prevalence Odds Ratios by Job-Title and Task-Based
Exposure Score 20
Table 7b Symptom Scores by Job-Title and Task-Based Exposure Score
21
Table 8a Prevalence Odds Ratios by Duration of Employment 22 Table 8b Symptom Scores by Duration of Employment 23 Table 9a Prevalence Odds Ratios by Cumulative Exposure Score 24 Table 9b Symptom Scores by Cumulative Exposure Score 25 Table 10 PCP in urine by job title 29 Table 11 Toxic equivalency factors for PCDDs and PCDFs for
humans and animals. 31
Table 12 Mean levels (and range of values) of PCDD congeners and WHO-TEQ in ppt in sawmill workers and both comparison groups
32
Table 13 Mean WHO-TEQ in ppt by age-group for SWAP members and PCP morbidity survey participants
35
Table 14 Excess serum dioxin levels according to estimated intensity of exposure based on job titles and specific work tasks performed
35
Table 15 Excess serum dioxin levels according to work tasks performed
36
Table 16 Excess serum dioxin levels according to years of exposure in the sawmill
36
Figure 1 Average serum levels (lipid-adjusted) of PCDDs in SWAP members and PCP Study participants compared to the general population
33
Figure 2 Serum levels (lipid adjusted) of PCDDs in SWAP members and morbidity survey participants compared to the general population (OCDDs not shown)
33
Figure 3 TEF-adjusted dioxin congeners in ‘exposed’ participants in the morbidity survey, SWAP members and comparison groups
34

Background From the 1950’s through to the late 1980’s pentachlorophenol (PCP) based fungicides were widely used in the New Zealand timber industry. For most of this period, virtually all freshly sawn timber produced in the country, predominantly radiata pine, was routinely surface treated to prevent the proliferation of sapstain fungi. The most commonly used process involved dipping the timber in baths containing an aqueous solution of the sodium salt of PCP (NaPCP). In addition, pressure treatment with a PCP in oil mixture was used as an alternative preservative treatment to creosote. This method was used mainly for railway sleepers, as well as for approximately 1% (mainly Douglas Fir and Larch) of the total roundwood produced in New Zealand over that period (NZFS, 1983). Workers involved in the treatment processes, or in the subsequent handling of the treated timber, are known to have experienced significant exposure to PCP. Uptake was primarily through skin contact with either PCP solutions or with the treated timber itself (Kauppinen and Lindroos, 1985; Enarson et al 1986; Kallioski and Kauppinen, 1990). A New Zealand survey, conducted by the Ministry of Health during 1986 and 1987, measured PCP in urine in workers performing a range of tasks in the sawmilling process, and established that uptake was significant in those who mixed the treatment solutions, and that there was a clear hierarchy of uptake depending on proximity to the treatment baths. Some of the data from this survey has been lost, but from the data that are still in existence, the levels observed for all tasks apart from the mixing of PCP solutions were less than one-tenth of the Biological Exposure Index of 2 mg/L PCP in urine (proposed by the American Conference of Governmental Industrial Hygienists in 1986 and adopted in 1988). However, most individuals mixing concentrated PCP were found to exceed this limit significantly, with levels of up to 13 mg/L recorded. Commercial grade PCP is also known to have contained a variety of contaminants and by-products of the manufacturing process, most significantly the 2,3,7,8-substituted polychlorinated dibenzo-p-dioxins (PCDDs) and dibenzofurans (PCDFs). In addition to exposure to pentachlorophenol itself, heavy exposure to the PCDDs and PCDFs also occurred in certain tasks conducted within sawmills. The job with the potential for the heaviest exposure was the mixing of the antisapstain treatment (PCP) solutions. Other tasks involving the potential for heavy exposure included the handling of the sludge formed in the bottom of dip tanks, and any process involving heating of PCP such as burning treated wood or welding structures which had been contaminated with PCP (Kallioski and Kauppinen, 1990). In 1995, blood collected from four former NZ sawmill workers was analysed for dioxins for a television programme, and the analysis indicated that PCDD and PCDF concentrations were significantly higher than those in the general population (Smith and Lopipero, 2001). Although the relative proportions of the PCDD and PCDF contaminants varied according to the source of the PCP, most references indicate that the hexa- hepta- and octa- PCDDs predominate in both commercial PCP preparations (IARC, 1991; Firestone et al 1972) and in plasma samples of workers with past
Health outcomes in former New Zealand timber workers exposed to pentachlorophenol (PCP). 1
occupational exposure (Schecter et al 1994; Konstas et al, 1998; Smith and Lopipero, 2001; Collins et al 2006). The acute toxic effects of exposure to PCP are well recognised (Jorens and Schepens, 1993), but the evidence for the existence of chronic health effects persisting after exposure has ceased is less conclusive. PCP has been classified by the International Agency for Research on Cancer as a possible human carcinogen (IARC-Group 2B), while 2,3,7,8-TCDD has been classified as a Group 1 (‘sufficient evidence’) human carcinogen. Relatively few studies of cancer among sawmill workers with exposure to PCP have been conducted. A small study of Finnish sawmillers (Jappinen et al, 1989) observed excesses of skin, mouth and pharyngeal cancers, and of lymphomas and leukaemias. A large cohort study of sawmillers in British Columbia (Hertzman et al, 1997) found a two-fold excess of sino-nasal cancer, presumed to be due to their exposure to wood dust, and a smaller excess of non-Hodgkin’s lymphoma that appeared to be associated with their exposure to chlorophenols. A US case-control study of nasal and nasopharyngeal cancers found a significant association between nasopharyngeal cancer and chlorophenol exposure (Mirabelli et al, 2000). An extended follow-up of the British Columbia sawmill worker cohort, of over 27,000 men employed between 1950 and 1995, found no large or statistically significant excesses of any cancer in comparison with the general population. Internal analyses, however, showed strong dose-response relationships for non-Hodgkin’s lymphoma, multiple myeloma and kidney cancer associated with dermal exposure to PCP (Demers et al 2006). Other studies have found limited evidence of a weak effect of PCP exposure on the immune system (Colosio et al, 1993), and an association between paternal exposures to PCP in sawmill workers and the development of certain congenital anomalies in offspring (Dimich-Ward et al, 1996). A New Zealand morbidity survey reported a strong dose-response between past exposure to PCP and self-reported symptoms of fever/sweating, weight loss, persistent fatigue, nausea and responses to a screening test for neuropsychological dysfunction (Walls et al, 1998). In a subsequent assessment of 62 New Zealand timber workers by an ACC medical panel, three distinct clinical syndromes that may have been related to PCP exposure were identified. However, there was no comparison group and the conclusions must therefore be considered as preliminary. A (non-significant) association between a “likelihood test of poisoning” developed by the Royal Australasian College of Physicians and a PCP exposure index was also observed in this group, and further research was recommended (Gorman et al, 2001).
Health outcomes in former New Zealand timber workers exposed to pentachlorophenol (PCP).
2
Introduction _____________________________________________________________________ At the request of the Minister of Labour, the Department of Labour’s Occupational Safety and Health Service (OSH) and the Health Research Council issued a Request for Proposals (JV203-OSHPCP) for a research project to address health outcomes among former timber workers exposed to PCP. The Massey University Centre for Public Health Research (CPHR) was funded (HRC 04/493) to conduct:
1. a cohort study of mortality in former timber workers, and 2. a morbidity study of surviving members of the cohort assembled for the
mortality study, comparing PCP exposed workers with other sawmill workers with little or no PCP exposure).
The cohort mortality study would follow a standard design in which a cohort of former timber workers was enumerated from historical employment records from the period of interest, and this cohort would be followed up in national mortality records held by the New Zealand Health Information Service. The observed mortality in the cohort would be compared with that expected on the basis of national rates, and standardised mortality ratios (SMRs) calculated. Sub-cohort analyses would also be performed to compare groups of workers classified according to estimates of past levels of PCP exposure in specific job titles, and by duration of employment in the sawmilling industry. The cross-sectional morbidity survey would involve a comparison between groups of workers with PCP exposure and with little or no PCP exposure, with participants randomly selected from surviving members of the sawmill workers’ cohort. The prevalence of chronic health problems would be examined using a questionnaire and a clinical examination focussing on specific chronic conditions hypothesized to be associated with PCP exposure. The health conditions evaluated would include chloracne and other persistent skin disease, neurological symptoms, respiratory, thyroid, kidney and liver conditions, as well as diabetes mellitus assessed by a random blood glucose test. Exposure information was required for both studies, but only limited information from overseas studies had been reported in the scientific literature (Kauppinen et al 1985; Kallioski & Kauppinen 1990). Thus, in order for either study to be meaningful, a separate retrospective exposure assessment exercise was necessary, to permit categorisation of exposure levels for the different jobs performed in the industry. A survey of PCP in urine in sawmill workers was known to have been conducted during the late 1980s, so considerable effort was put into locating the data from this survey. In addition, while PCP itself has a short elimination half-life of a few days, the half-lives of the PCDD and PCDF contaminants of PCP are thought to be about ten years. Accordingly, it was decided to test dioxin levels in the blood of participants of the morbidity study, as these would reflect past PCP exposure and provide an alternative source of exposure information that could be used to validate the exposure categories developed from job-title based levels of PCP in urine. An additional benefit of the serum dioxin analyses was that they would give the opportunity to compare the dioxin
Health outcomes in former New Zealand timber workers exposed to pentachlorophenol (PCP).
3

congener profiles in serum with those of PCP solutions and wastes from the wood treatment process, thus confirming whether or not occupational PCP exposure was the source of the body burden of dioxin. The study was approved by the Massey University Human Ethics Committee MUHEC: WGTN Protocol – 04/01; the searching of Cancer Registry data was approved by the Central Regional Ethics Committee CEN/05/04/016.
Health outcomes in former New Zealand timber workers exposed to pentachlorophenol (PCP).
4

Historical Cohort Mortality Study _____________________________________________________________________ Aims The aims of the historical cohort study were to ascertain whether:
• Timber workers exposed to PCP are dying from all causes more often than other workers of comparable gender and age.
• Timber workers exposed to PCP are dying from cancer more often than
workers of comparable gender and age Methods Selection of study subjects A cohort of former timber workers was enumerated from historical employment records obtained from three sawmill industry employers located in both North and South islands; one was the New Zealand Forest Service and the other two were private sector sawmills that were based in the Waikato and Nelson regions. The records covered the period 1970 to 1990, which is a time when PCP was used, and workers with more than six months of employment in the industry were included in the study. The records from the Forest Service and from the Waikato sawmill were standard employment files containing personal and demographic data, and a full job history for the period employed, for each employee. The employment data from the Nelson region was less comprehensive, coming from handwritten ‘starters’ and ‘leavers’ files maintained by the personnel department of the company. While these records included personal and demographic data for each individual, the employment history information available was only the first assigned job and then the final job held by the employee at the time of resignation. Follow up The study period started on 1 January 1970 and ended on 31 December 2003. For each worker, follow up started on the first date of employment in the industry or the study starting date (1/1/1970), whichever came later. Vital status and cause of death were determined for each cohort member by searching national records for death and cancer registrations through the New Zealand Health Information Service (NZHIS). This was done using matching methods (allowing for minor errors in spelling of names and in dates of birth) that were developed and used in similar studies previously (Pearce et al 1997; McLean et al 2004; ‘t Mannetje et al 2005). Underlying causes of death were coded into the International Classification of Disease (ICD 8 before 1979, ICD 9 from 1979 onwards). The next stage was to confirm that those subjects who were not registered as having died were actually alive and resident in New Zealand during the study period. This was done in part using NZHIS records, e.g. if someone had a hospital admission or cancer registration on a particular date then they could be assumed to have been alive on that date. Further follow-up of vital
Health outcomes in former New Zealand timber workers exposed to pentachlorophenol (PCP).
5
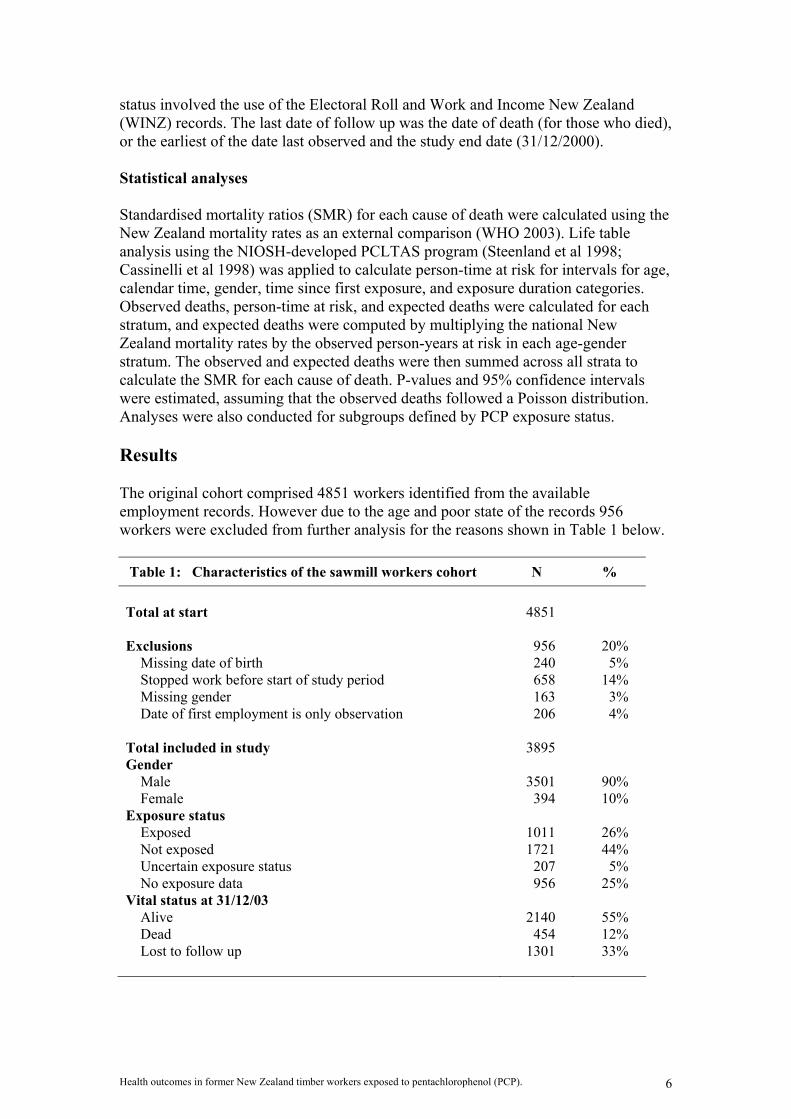
status involved the use of the Electoral Roll and Work and Income New Zealand (WINZ) records. The last date of follow up was the date of death (for those who died), or the earliest of the date last observed and the study end date (31/12/2000). Statistical analyses Standardised mortality ratios (SMR) for each cause of death were calculated using the New Zealand mortality rates as an external comparison (WHO 2003). Life table analysis using the NIOSH-developed PCLTAS program (Steenland et al 1998; Cassinelli et al 1998) was applied to calculate person-time at risk for intervals for age, calendar time, gender, time since first exposure, and exposure duration categories. Observed deaths, person-time at risk, and expected deaths were calculated for each stratum, and expected deaths were computed by multiplying the national New Zealand mortality rates by the observed person-years at risk in each age-gender stratum. The observed and expected deaths were then summed across all strata to calculate the SMR for each cause of death. P-values and 95% confidence intervals were estimated, assuming that the observed deaths followed a Poisson distribution. Analyses were also conducted for subgroups defined by PCP exposure status. Results The original cohort comprised 4851 workers identified from the available employment records. However due to the age and poor state of the records 956 workers were excluded from further analysis for the reasons shown in Table 1 below. Table 1: Characteristics of the sawmill workers cohort N % Total at start 4851 Exclusions 956 20% Missing date of birth 240 5% Stopped work before start of study period 658 14% Missing gender 163 3% Date of first employment is only observation 206 4% Total included in study 3895 Gender Male 3501 90% Female 394 10% Exposure status Exposed 1011 26% Not exposed 1721 44% Uncertain exposure status 207 5% No exposure data 956 25% Vital status at 31/12/03 Alive 2140 55% Dead 454 12% Lost to follow up 1301 33%
Health outcomes in former New Zealand timber workers exposed to pentachlorophenol (PCP).
6

In total, the cohort was followed for 95,850 person years, 88% of the total possible person-years of follow-up if those ‘lost to follow-up’ had been followed until the study end date of 31/12/2003. The cohort was predominantly male. Unfortunately 25% had insufficient work history data in their employment records to enable us to determine their exposure status. Altogether, 454 members of the cohort were deceased, and 98 of these had cancer as the primary cause of death. The findings for all disease categories for which there were more than two deaths are shown in Table 2 below. Mortality was significantly lower than expected on the basis of the mortality rates in the general population for both all-causes and all-cancer. There was also a significant deficit of mortality from malignancies of lymphatic & haematopoietic tissue (based on 5 deaths), and from cancers of the digestive system (based on 28 deaths). The only cause of death for which there was a significant excess was accidents (other than those caused by transport, suicide or homicide and other violence), based on 25 deaths. This category mainly comprises deaths due to non-transport workplace accidents.
Table 2 : Total and Cause-Specific Mortality for the Sawmill Workers Cohort
Cause of death (ICD 9th Revision) Observed Expected SMR 95% CI
All causes 454 503.55 0.90* 0.82-0.99
All neoplasms (140-208) 98 138.19 0.71** 0.58-0.86
Oral cavity and pharynx (140-149) 3 3.02 0.99 0.21-2.90
Digestive system (150-158) 28 42.78 0.65* 0.44-0.95
Respiratory system (160-165) 33 35.92 0.92 0.63-1.29
Lung (162) 33 33.35 0.99 0.68-1.39
Bone, connective tissue and skin (171) 4 9.73 0.41 0.11-1.05
Genitourinary organs (179-189) 15 20.58 0.73 0.41-1.20
Lymphatic & haematopoietic (200-208) 5 12.84 0.39* 0.13-0.91
Diseases of the Circulatory System (390-459) 186 203.44 0.91 0.79-1.06
Diseases of the Respiratory System (460-519) 37 38.51 0.96 0.68-1.32
Diseases of the Digestive System (520-579) 24 16.62 1.44 0.93-2.15
External causes 82 67.04 1.22 0.97-1.52
Transport accidents 31 30.71 1.01 0.69-1.42
Other accidents 25 14.24 1.76* 1.14-2.59
Suicide & self-inflicted injury 20 18.74 1.07 0.65-1.65
Homicide & other violence 6 3.35 1.79 0.66-3.90
* P < 0.05 ** P < 0.01
Health outcomes in former New Zealand timber workers exposed to pentachlorophenol (PCP).
7

Health outcomes in former New Zealand timber workers exposed to pentachlorophenol (PCP).
8
The findings in subgroups defined by exposure to PCP are shown in Table 3 below, with the cohort stratified into those likely to have had no PCP exposure, those with unknown exposure status and those known to have worked in jobs with potential PCP exposure. All-cause mortality in the PCP exposed group was marginally elevated, but cancer mortality in all groups was lower than ‘expected’ on the basis of national mortality rates. Mortality from non-malignant respiratory diseases in the PCP-exposed group was almost double that expected on the basis of national rates (SMR 1.91, 95% CI 0.98 – 3.33, p=0.05, 12 deaths). The excess in mortality from accidents seen in the overall cohort occurred in all three exposure groups, indicating no association with PCP exposure. The table also shows the relative risks (and 95% CIs) for mortality in the exposed group compared only with the non-exposed group. Elevations in both all-cause mortality (RR=1.21, 95% CI 0.94-1.55) and total cancer mortality (RR = 1.41, 95% CI 0.80-2.47) were apparent in those exposed to PCP, while the risk of mortality from non-malignant respiratory disease (RR=2.98, 95% CI 1.18-7.55) was almost trebled.

TABLE 3 Total and Cause-specific Mortality for Selected Causes by Exposure to PCP
Not Exposed to PCP Unknown Exposure Exposed to PCP Relative risk Exposed vs non-exposed Cause of death (ICD 9th Revision)
Obsa SMRb 95% CIc Obs SMR 95% CI Obs SMR 95% CI RR 95% CI
All causes 149 0.91 0.77-1.06 203 0.84* 0.73-0.96 102 1.10 0.90-1.34 1.21 0.94-1.55
All neoplasms (140-208) 29 0.63* 0.42-0.90 48 0.71* 0.52-0.94 21 0.89 0.55-1.37 1.41 0.81-2.47
Oral cavity and pharynx (140-149) 1 0.95 0.02-5.28 1 0.71 0.02-3.96 1 1.82 0.05-10.12 1.92 0.12-29.14
Digestive system (150-158) 8 0.56 0.24-1.10 14 0.67 0.37-1.13 6 0.82 0.30-1.79 1.46 0.51-4.20
Respiratory system (160-165) 10 0.86 0.41-1.59 17 0.94 0.55-1.50 6 1.02 0.37-2.22 1.19 0.43-3.25
Lung (162) 10 0.93 0.45-1.72 17 1.00 0.58-1.61 6 1.10 0.40-2.40 1.18 0.43-3.24
Bone, connective tissue and skin (171) 0 0.00 0.00-0.99 3 0.70 0.14-2.04 1 0.62 0.02-3.42 # #
Genitourinary organs (179-189) 4 0.63 0.17-1.62 7 0.64 0.25-1.33 4 1.21 0.33-3.08 1.92 0.48-7.62
Lymphatic & haematopoietic (200-208) 2 0.45 0.05-1.62 2 0.34 0.04-1.23 1 0.42 0.01-2.31 0.93 0.09-10.23
Diseases of the Circulatory System (390-459) 61 0.99 0.76-1.27 91 0.86 0.69-1.06 34 1.00 0.69-1.40 1.01 0.67-1.53
Diseases of the Respiratory System (460-519) 7 0.64 0.26-1.31 18 0.86 0.51-1.36 12 1.91* 0.98-3.33 2.98* 1.18-7.55
Diseases of the Digestive System (520-579) 11 2.15* 1.07-3.84 10 1.17 0.56-2.14 3 1.07 0.22-3.14 0.50 0.14-1.77
External causes 35 1.29 0.90-1.80 24 1.14 0.73-1.70 23 1.27 0.80-1.90 0.98 0.58-1.66
Transport accidents 14 1.12 0.61-1.89 9 0.98 0.45-1.86 8 0.93 0.40-1.83 0.83 0.35-1.97
Other accidents 10 1.86 0.89-3.41 10 1.95 0.93-3.58 5 1.43 0.46-3.35 0.77 0.26-2.23
Suicide & self-inflicted injury 8 1.03 0.44-2.02 4 0.71 0.19-1.81 8 1.56 0.67-3.08 1.51 0.57-4.01
Homicide & other violence 3 2.14 0.44-6.25 1 1.01 0.03-5.64 2 2.15 0.26-7.74 1.00 0.17-5.89
a Observed number of deaths b Standardised Mortality Ratio c 95% Confidence Interval * p<0.05 # Not calculable due to small numbers
Health outcomes in former New Zealand timber workers exposed to pentachlorophenol (PCP). 9

Discussion In this cohort study we have examined mortality in almost 4,000 former sawmill workers, each followed over a period of at least 10 years, with some followed for up to thirty years, accumulating 95,850 person-years of observation.
A limitation of this study is the size of the cohort assembled. One of the saw mills, at which historical employment records had been located during the feasibility study that preceded this study, had subsequently been sold, and the records were destroyed during the transition to new ownership. In addition, the poor quality of some of the records available resulted in 20% of the potential cohort members being excluded, leaving only 3,895 former sawmill workers, or 95,850 person-years of observation. The size of a cohort is obviously critical to the power of a study to identify any increase in risk, and in particular for the relatively rare diseases such as those previously observed in other studies of PCP-exposed workers. As in any observational epidemiology study of this type, there are a number of potential sources of bias, including selection bias, incompleteness of follow-up, uncontrolled confounding by ethnicity or lifestyle factors such as smoking, and misclassification of exposure. A major potential source of bias found in most occupational cohort studies is the ‘healthy worker effect’. This arises because healthy people are more likely to gain employment and to remain in employment, and results in lower overall mortality being found in working populations in comparisons with the general population. The effect is generally less pronounced for cancer than for all other causes of mortality, although in this cohort cancer mortality SMRs are lower than the SMRs for most other causes. Incompleteness of follow-up is another potential source of bias in studies of this type, but only where the degree of incompleteness differs in the groups being compared. Ascertainment of vital status in this study was by the same method for all cohort members, and was therefore unlikely to introduce significant bias. The rate of follow-up achieved appears lower than would be considered ideal; however, the completeness of follow-up in cohort studies in New Zealand is compromised by the lack of a central population register. While we have virtually complete registration of deaths that occur in New Zealand, it is not easy to ascertain vital status of those not known to be deceased at the time of completion of the study. In some, but not all cases, it is possible to establish the latest date at which an individual was known to be alive by making data linkages with files such as those held by NZHIS or WINZ, thereby extending the known period of follow-up for individuals as a percentage of possible years of follow-up. There was also no information available on smoking or ethnicity in this cohort. Both can be sources of uncontrolled confounding in occupational cohort studies, although their importance is often overstated. There was no increase in smoking-related conditions such as lung cancer or bladder cancer, or of non-malignant respiratory diseases in the overall cohort, so smoking is unlikely to have biased these results. It is reasonable to assume a relatively high proportion of Māori and Pacific people in this cohort, as more than 25% of the current workforce in timber processing is Māori (APR, 2005). However, ethnicity is unlikely to be strongly related to exposure status within the cohort, and any confounding effect of ethnicity is therefore likely to be weak. Furthermore, there is no elevation in mortality from diseases known to be elevated in Māori, such as lung and liver cancer, which suggests that serious confounding by ethnicity is highly unlikely.
Health outcomes in former New Zealand timber workers exposed to pentachlorophenol (PCP). 10

Misclassification of exposure in this study is possible given the inadequacy of the information contained in a significant number of the historical employment records obtained. In those from the Nelson region we only had information on jobs held at one, or at most two, points in time rather than having a full work history. Thus it is conceivable, for these individuals at least, that we misclassified their exposure status. However, in the selection of morbidity survey participants on the basis of assumed exposure category from employment records, and subsequent interviews to obtain information on lifetime work history, we found that only about 10% had been misclassified. This misclassification was also non-differential as the classification of exposure is based on work history records, and would be unaffected by whether a worker had subsequently died. Thus, the effect of any misclassification would be to dilute any true association between the exposure and the outcome and consequently lead to an underestimation of the strength of that association. Bearing these limitations in mind, the findings of the study are of interest, and fall into four groups: (i) overall mortality; (ii) cancer mortality; (iii) accidents; (iv) non-malignant respiratory disease. We found reduced overall and cancer mortality in the full cohort, and in all three exposure categories, apart from a small and non-statistically significant elevation from all-cause mortality in the PCP exposed group (SMR=1.10, 95% CI 0.90 – 1.34). The findings for each exposure group, in comparison with the numbers of deaths expected on the basis of national death rates stratified by gender and age, are presented in table 3. However, if an internal comparison is made between those with known exposure to PCP and those not exposed, then the overall relative risk of death in those exposed to PCP increases from 1.10 to 1.21, and the relative risk of death from cancer increases from 0.89 to 1.41. These findings are not statistically significant, but they nevertheless indicate that the possibility cannot be excluded that there is a small elevation in risk in the PCP-exposed workers for overall mortality, and for cancer mortality specifically, at a level similar to that found in other dioxin exposed cohorts (Kogevinas et al 1997; ‘t Mannetje et al 2005). An excess of deaths from non-transport accidents (SMR=1.76, 95% CI 1.14 – 2.59, 25 cases) is a plausible consequence of work in this industry given its hazardous physical nature. No association between PCP exposure and this cause of death was apparent, however, as it remained elevated across all three exposure categories. Although not elevated in the full cohort, there was an elevation of mortality from non-malignant respiratory disease (SMR=1.91, 95% CI 0.98 – 3.33, 12 cases) in those with exposure to PCP. In the internal comparison between those with known exposure to PCP and those not exposed, the risk of death from non-malignant respiratory disease was almost trebled (RR=2.98, 95% CI 1.18-7.55).
In summary, the death rate in the sawmill workers was slightly lower than the national average (SMR=0.90, 95% CI 0.82 – 0.99), presumably due to the ‘healthy worker effect’, and the only cause of death for which there was a clear excess in the overall cohort was non-transport related accidents (SMR=1.76, 95% CI 1.14 – 2.59). In workers with known PCP exposure, there was a small excess of deaths overall (SMR=1.10, 95% CI 0.90-1.34) and almost double the risk of death from non-malignant respiratory disease (SMR = 1.91, 95% CI 0.98-3.33, p=0.05). In internal comparisons – comparing those exposed and those not exposed to PCP – there was a
Health outcomes in former New Zealand timber workers exposed to pentachlorophenol (PCP).
11

significantly elevated risk of mortality from non-malignant respiratory disease (RR 2.98, 95% CI 1.18-7.55) and a non-significant elevation in total cancer mortality (RR = 1.41, 95% CI 0.80-2.47).
Health outcomes in former New Zealand timber workers exposed to pentachlorophenol (PCP).
12

The Cross-Sectional Morbidity Survey _____________________________________________________________________ Aims The aims of the morbidity study were to determine whether:
• Chronic health problems such as fever/sweating, weight loss, persisting fatigue, nausea and neuropsychological dysfunction are more common in timber workers who worked with PCP than in other timber workers
• The prevalence of these symptoms is related to past PCP exposure. Methods This study examined chronic health problems, in contrast to the historical cohort study that focussed on mortality, and involved a cross-sectional survey similar to that previously conducted in New Zealand (Walls et al, 1998). The current study is significantly different from the earlier New Zealand study of Walls et al in that it involved a random sample of former timber industry workers, rather than the self-selected population studied previously, and none of the participants of the previous study were included in this study. Studying a random sample of workers avoids bias that may result from workers with health problems being more likely to volunteer than workers who do not have health problems. Selection and recruitment of participants From the cohort that had been enumerated for the mortality study, we selected workers who were confirmed to be still alive for possible inclusion in the morbidity study. From their employment records we were then able to categorise individuals as being potentially exposed, or not exposed, on the basis of the information provided on job titles held and tasks performed in the sawmilling industry. The following aspects of a participant’s work history were used to determine the likelihood of exposure to PCP: (i) the individual must have worked in a sawmill known to cut pine (and not exclusively native timbers); and (ii) must have been recorded as having worked mixing PCP concentrate, as a dip bath operator, as a table hand or green chain puller, a yardhand, an order man or a diffusion plant operator. In addition, individuals were also required to have adequate demographic data (e.g. date of birth) and to have worked in the industry for at least one year.
The potential participants were sent a letter inviting them to take part in the study, an information sheet, and a consent form to be returned in a freepost reply envelope. If no response was received, a second and third mail-out was sent. Participants who consented to being included in the study were then contacted by telephone to arrange an appointment.
Health outcomes in former New Zealand timber workers exposed to pentachlorophenol (PCP).
13

Data collection The appointments with participants were usually held at a local medical centre where up to 24 appointments could be scheduled for each day. However, due to the geographical spread of participants, we also had to travel to some individuals in remote locations and examine them in their own homes. A team including an occupational medicine specialist, a nurse or other member of the research team, and a phlebotomist, was assembled for each appointment. Participation involved completing a questionnaire (see appendix 1), taking part in a clinical examination by an occupational medicine specialist, and providing a blood sample. The questionnaire involved a face-to-face interview with a nurse or one of the research team. Demographic information, a lifetime work history, more detailed information on tasks and exposures in the timber industry, information about health and current symptoms, and information about lifestyle factors were collected during the interview. The clinical examination focussed on specific chronic conditions that have been identified as being possibly related to PCP exposure, and for which the symptom questionnaire information alone is insufficient. These include chloracne and other persistent skin disease, neurological symptoms, and diabetes mellitus. Chloracne was assessed by physical examination. Neurological effects were assessed with a standard neurological examination, including assessment of the cranial nerves, a sensory examination with cotton wool and pin prick, vibration sense, joint position, two point discrimination, wasting, power (upper and lower limb), reflexes, and testing of coordination. Diabetes mellitus prevalence was assessed with a non-fasting blood glucose test. The phlebotomist checked haemoglobin levels by finger prick to determine whether the participant could give blood. For exposed participants, 120mL of whole blood was collected in twelve 10mL glass red-top vacutainer tubes. Blood was also collected into a 4mL fluoride tube for glucose testing. For unexposed participants, the blood sampling involved only one 10mL glass red-top vacutainer tube and a 4mL fluoride tube. The samples were transported overnight in chilled bio-containers to be received at the laboratory at the Centre for Public Health Research in Wellington within 24 hours of the blood collection. The serum was separated from the whole blood using glass pipettes into amber glass vials topped with Teflon-lined lids. Approximately 0.5mL was separated for lipid analyses, and the remainder of the serum samples were frozen and stored at -20°C prior to despatch in batches for dioxin testing. The lipid and glucose samples were sent for processing at Medical Laboratory Wellington. Statistical analysis For continuous variables (e.g. the scores on the neurobehavioural tests) the mean scores were compared in exposed and non-exposed workers using an unpaired t-test (with associated confidence intervals) and linear regression (Armitage et al, 2002). For dichotomous variables (e.g. having or not having diabetes) logistic regression (Checkoway et al, 2004) was used to estimate prevalence odds ratios (Pearce, 2004) controlling for age, gender, and smoking.
Health outcomes in former New Zealand timber workers exposed to pentachlorophenol (PCP).
14

Results An initial selection of potential participants from those cohort members known to be alive, and who had a full job history, employment duration of more than one year and a full name and date of birth, resulted in the identification of 326 exposed individuals and 549 non-exposed individuals. As several mail outs did not result in adequate numbers of responses from either exposed or non-exposed individuals, a less stringent selection process was adopted to achieve the numbers required. Additional ‘exposed’ candidates were selected from cohort members without a full job history (since this could be obtained with the questionnaire), but with all the other selection criteria. It was particularly difficult to recruit individuals selected as non-exposed controls since they often considered that the study was not relevant to them because they had no history of exposure to PCP. Overall, a total of 1,077 people were selected for the morbidity study. Of these, 52 were ineligible (e.g. they had never worked in the timber/forestry industry, were no longer in NZ, etc), 103 letters were returned stamped ‘Return to Sender’, and 146 declined to take part. From the remaining 776 potential participants, 338 consents were given, and 293 interviews were completed. We were not able to interview all consenting people due to limitations on time and resources, particularly for interviews with residents of remote locations. The questionnaire responses of each individual morbidity survey participant were reviewed to validate their exposure status on the basis of the work history provided. As the original assignment of exposure was often made on the basis of a job held at a single point in time as detailed in the historical employment records, the full employment history provided by study participants is obviously more relevant and the reviews resulted in reassignment of exposure status in approximately 10% of participants. From the information provided on work history in the sawmilling industry, of the 293 people interviewed for the morbidity survey we were able to classify 177 as non-exposed and 116 as exposed participants. The characteristics of the morbidity survey participants are shown in Table 4 below. There were slightly more non-exposed (177) than exposed (116) participants. Apart from the higher rate of current smoking in the exposed group (23.0% compared with 12.5%) there were only trivial differences between the two groups. There were relatively low numbers of Māori participants. This may have reflected the fact that the largest group of participants was from the Nelson region, but it may also have been as a result of a possible lower response rate in Māori – we are unable to check for this because we do not know the ethnicity of the non-responders. As the smoking rates differed between the exposed and non-exposed groups, we adjusted for age, gender and smoking in all subsequent analyses.
Health outcomes in former New Zealand timber workers exposed to pentachlorophenol (PCP).
15

Health outcomes in former New Zealand timber workers exposed to pentachlorophenol (PCP).
16
Table 4: Characteristics of the Morbidity Survey Participants
Never-exposed Ever-exposed mean range mean range Age 52.9 32-76 52.0 35-75 n % n % Gender Male 169 95.5 116 100.0 Female 8 4.5 0 0.0 Ethnicity§ Māori 13 7.3 9 7.8 Pacific 1 0.6 3 2.6 Other 163 92.1 104 89.7 Smoking status Non-smoker 68 38.6 34 29.3 Ex-smoker 86 48.9 55 47.4 Current smoker 22 12.5 27 23.3 Alcohol consumption Never 21 12.0 8 7.0 Less than once a month 18 10.3 17 14.8 1-2 times a week 79 45.1 55 47.8 4-5 times a week 34 19.4 19 16.5 Daily 23 13.1 16 13.9 § some reported more than one ethnicity, and ethnicity was assigned by the standard prioritisation method of Maori/Pacific/Other
The responses to the questionnaire-based health survey, and adjusted prevalence odds ratios by ever- or never- exposed, are shown in Table 5a. Individuals who had been exposed to PCP reported an elevated prevalence of chronic respiratory disease including TB/Pleurisy or Pneumonia (POR = 3.04, 95% CI 1.46 – 6.33, 24 cases) and recurrent diarrhoea (POR = 2.68, 95% CI 1.07 – 6.71, 14 cases). The only neuropsychological symptoms that were found to be significantly more prevalent in exposed individuals were ‘having palpitations of the heart’ (POR = 1.92, 95% CI 1.06 – 3.50, 31 cases) and ‘sweating with no reason’ (POR = 2.10, 95% CI 1.14 – 3.87, 31 cases), and in the neurological examination only ‘straight leg raising’ (POR = 2.10, 95% CI 1.16 – 3.81, 32 cases) was elevated. In exposed individuals several other conditions were elevated, although not statistically significant, including self reported eczema, diabetes, impaired liver function, ‘unexplained persistent fevers’, ‘recurrent nausea’, ‘depression’ and ‘frequent mood changes without cause’, and on neurological examination a deficit in cranial nerve function.

Health outcomes in former New Zealand timber workers exposed to pentachlorophenol (PCP). 17
Table 5a: Prevalence of symptoms by PCP exposure
Never-exposed€
(n=177) Ever-exposed
(n=116) Prevalence odds ratio§
Health outcomes n % n % OR 95%CI
Clinical disease Asthma 30 17.1 27 23.3 1.46 0.79-2.68 Nasal allergies incl. hay fever 75 42.6 37 31.9 0.62 0.37-1.03 Eczema 49 27.8 44 37.9 1.50 0.90-2.50 Acne 61 34.7 35 30.4 0.87 0.52-1.47 Chronic bronchitis 22 12.5 15 13.0 1.01 0.48-2.13 TB, Pleurisy or Pneumonia 13 7.4 24 20.7 3.04 1.46-6.33 Diabetes 8 4.6 10 8.6 1.95 0.73-5.23 Thyroid disorder 7 4.0 6 5.2 1.50 0.47-4.85 Impaired kidney function 21 11.9 14 12.2 0.94 0.43-2.02 Impaired liver function 15 8.5 18 15.5 1.94 0.92-4.10 Physical symptoms Unintentional weight loss 12 6.8 14 12.1 1.57 0.68-3.62 Unexplained persistent fevers 7 4.0 10 8.6 2.08 0.76-5.73 Long lasting and persistent fatigue unrelieved by rest 37 21.0 31 26.7 1.26 0.72-2.22 Eye discomfort (reddened and dry eyes) 49 27.8 28 24.1 0.88 0.51-1.53 Pins and needles in the hands or feet 82 46.6 52 44.8 0.80 0.48-1.31 Numbness in hands or feet 58 33.0 38 32.8 0.95 0.57-1.60 Loss of muscle power in hands or feet 25 14.2 21 18.0 1.34 0.69-2.58 Recurrent nausea 6 3.4 12 10.3 2.42 0.85-6.87 Recurrent diarrhoea 8 4.6 14 12.1 2.68 1.07-6.71 Recurrent bowel upsets 18 10.2 15 12.9 1.28 0.61-2.72 Neuropsychological symptoms Short memory 72 40.9 47 40.5 1.02 0.62-1.68 Often need to make notes 98 55.7 49 42.2 0.60 0.37-0.97 Needs to go back and check things 82 46.6 57 49.1 1.16 0.72-1.89 Hard to get the meaning 40 22.7 24 20.7 0.73 0.40-1.32 Problem concentrating 55 31.3 38 32.8 0.97 0.58-1.64 Feel depressed 32 18.2 30 25.9 1.57 0.88-2.82 Abnormally tired 45 25.6 34 29.3 1.24 0.72-2.13 Less interested in sex 28 15.9 24 20.7 1.40 0.75-2.63 Have palpitations of the heart 29 16.5 31 26.7 1.92 1.06-3.50 Feel an oppression of the chest 36 20.5 29 25.0 1.26 0.71-2.25 Sweat with no reason 26 14.8 31 26.7 2.10 1.14-3.87 Headache at least once a week 39 22.2 24 20.7 0.86 0.47-1.56 Painful tingling in some parts of the body 39 22.2 34 29.3 1.31 0.75-2.28 Problem buttoning or unbuttoning 16 9.1 11 9.5 1.05 0.45-2.43 Trouble sleeping 54 30.7 42 36.2 1.28 0.77-2.14 Frequent mood changes without cause 37 21.0 35 30.2 1.52 0.86-2.69 Bothered by noise more than in the past 72 40.9 52 44.8 1.11 0.68-1.81 Neurological examination Cranial Nerves 46 26.4 39 33.9 1.64 0.94-2.88 Sensory Examination by cotton wool 19 10.9 11 9.5 0.79 0.35-1.79 Sensory Examination by pin prick 20 11.6 11 9.7 0.75 0.33-1.68 Vibration Sense 13 7.5 6 5.2 0.68 0.24-1.94 Joint position 4 2.3 3 2.6 1.21 0.25-5.78 Two point discrimination 50 28.7 36 31.3 1.11 0.65-1.91 Wasting 4 2.3 2 1.8 0.63 0.10-3.83 Power upper limb 5 2.9 1 0.9 0.33 0.04-3.05 Power lower limb 7 4.1 1 1.0 0.22 0.03-1.91 Reflexes 35 20.1 16 13.9 0.60 0.31-1.17 Straight leg raising 28 17.3 32 31.7 2.10 1.16-3.81 Gait 4 2.5 2 1.8 1.04 0.17-6.57 Tests of co-ordination 8 4.6 3 2.6 0.64 0.15-2.69
€ Reference group § Age, gender and smoking adjusted

Table 5b shows the symptom scores by PCP exposure status. For example, there were ten questions on physical symptoms, and the mean number of symptoms experienced in the never exposed group was 1.72 (95% CI 1.47-1.97) compared with 2.03 (95% CI 1.66-2.39) in the exposed group. For each set of symptoms, the mean score was slightly higher in the exposed group than in the non-exposed group, but in no case was the difference statistically significant. No cases of chloracne were identified. Few morbidity survey participants had non-fasting glucose outside the reference range of 3 – 8 mmol/L, and while an association between ever having been exposed to PCP and having excess non-fasting glucose (OR=1.56, 95% CI 0.55 – 4.42,) was observed, the small numbers (8 cases in exposed workers and 7 cases in non-exposed workers) precluded dose-response analyses.
Table 5b Symptom scores by PCP exposure
Never-exposed€ Ever-exposed
mean 95% CI mean 95% CI p-value §
Physical symptoms (10) 1.72 1.47-1.97 2.03 1.66-2.39 0.32 Neuropsychological symptoms (17) 4.54 4.01-5.08 5.10 4.44-5.77 0.28 Neurological examination (13) 1.39 1.16-1.61 1.41 1.15-1.66 0.95
€ Reference group § Age, gender and smoking adjusted
Exposure scores for each of the morbidity study participants were developed on the basis of the results of the PCP in urine study (see exposure assessment section on page 28), combined with each participant’s full work history as reported in their interview. We developed an algorithm that incorporated the effects of job title and of specific tasks performed, including mixing of PCP solutions, cleaning sludge from the bottom of PCP dip tanks, or backpack spraying of stacks of timber or logs with antisapstain solutions. As can be seen in table 6 more than half of the survey participants (n=177) were given the lowest possible exposure score of 1, with most of the remaining participants (n=86) considered moderately exposed (a score of 2.0 – 4.9), and a much smaller group (n=30) with high exposure (a score of 5+). For a measure of cumulative exposure this was multiplied by the duration of exposure in months.
Table 6 Frequency of calculated Exposure Scores Exposure Score Frequency 1 (non-exposed) 177
2 38 3 23
3.5 1 4 16
4.5 8 5 3
5.5 13 6 3
6.5 3 7 2
7.5 3 8.5 1
9 1 9.5 1
Health outcomes in former New Zealand timber workers exposed to pentachlorophenol (PCP) 18

Health outcomes in former New Zealand timber workers exposed to pentachlorophenol (PCP).
19
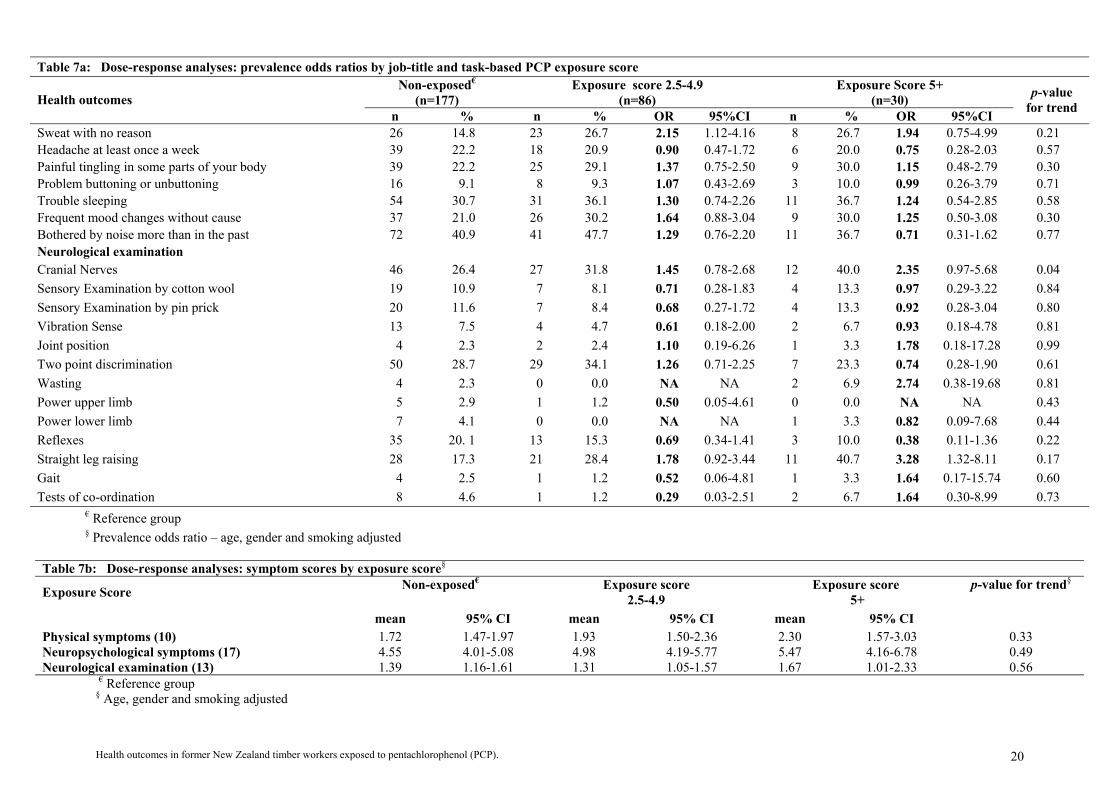
Table 7a shows the findings for the subgroups defined by these three categories of exposure score (non-exposed, 2.0-4.9, 5+). Chronic respiratory disease (including TB, pleurisy and pneumonia) showed a statistically significant dose-response trend (p<0.01) with the highest exposure group having 4 times the risk of the non-exposed group. A positive dose-response trend for ‘having palpitations of the heart’ was suggested, with almost three times the risk in the most highly exposed group. A number of other conditions or symptoms were elevated in the higher exposure group, often with a suggestion of a dose-response trend, although none of them reached statistical significance due to small numbers. These included asthma, eczema, ‘unexplained persistent fevers’, ‘recurrent nausea and diarrhoea’, ‘low interest in sex’, a ‘feeling of oppression in the chest’ and ‘sweating with no reason’. From the neurological examination a dose-response trend (p=0.04) was observed for a deficit in cranial nerve function, with the risk amongst those in the highest exposure group more than doubled, and there was a non-significant dose-response trend for ‘straight leg raising’ with a three-fold risk in the highest exposure group (POR = 3.28, 95% CI 1.32 – 8.11). Table 7b, shows the mean symptom scores in the same three subgroups (defined by exposure scores), as well as the p-values for trend (of symptom score regressed against exposure score, adjusted for age, gender, and smoking). The mean symptom scores increased by exposure level, for both physical and neuropsychological symptoms, but none of the associations were statistically significant.

Table 7a: Dose-response analyses: prevalence odds ratios by job-title and task-based PCP exposure score
Non-exposed€
(n=177) Exposure score 2.0-4.9
(n=86) Exposure Score 5+
(n=30) Health outcomes n % n % OR 95%CI n % OR 95%CI
p-value for trend
Asthma 30 17.1 18 20.9 1.29 0.66-2.54 9 30.0 1.99 0.80-4.93 0.17 Nasal allergies incl. hay fever 75 42.6 28 32.6 0.65 0.37-1.13 9 30.0 0.54 0.23-1.26 0.11 Eczema 49 27.8 30 34.9 1.32 0.75-2.32 14 46.7 2.14 0.95-4.84 0.06 Acne 61 34.7 25 29.1 0.82 0.46-1.45 10 34.5 1.07 0.46-2.52 0.49 Chronic bronchitis 22 12.5 11 12.8 1.02 0.45-2.29 4 13.8 1.01 0.30-3.33 0.91 TB, Pleurisy or Pneumonia 13 7.4 16 18.6 2.66 1.21-5.89 8 26.7 4.33 1.56-12.04 <0.01 Diabetes 8 4.6 9 10.5 2.42 0.88-6.68 1 3.3 0.68 0.08-5.82 0.46 Thyroid disorder 7 4.0 4 4.7 1.36 0.37-5.01 2 6.7 1.92 0.35-10.40 0.32 Impaired kidney function 21 11.9 10 11.8 0.91 0.39-2.12 4 13.3 1.02 0.30-3.53 0.97 Impaired liver function 15 8.5 14 16.3 1.98 0.89-4.38 4 13.3 1.80 0.53-6.14 0.24 Physical symptoms Unintentional weight loss 12 6.8 12 14.0 1.85 0.78-4.39 2 6.7 0.80 0.16-3.96 0.77 Unexplained persistent fevers 7 4.0 7 8.1 1.97 0.66-5.88 3 10.0 2.41 0.56-10.30 0.12 Long lasting and persistent fatigue unrelieved by rest 37 21.0 23 26.7 1.26 0.68-2.33 8 26.7 1.27 0.51-3.18 0.54 Eye discomfort (reddened and dry eyes) 49 27.8 18 20.9 0.72 0.39-1.35 10 33.3 1.49 0.63-3.51 0.79 Pins and needles in the hands or feet 82 45.6 35 40.7 0.71 0.41-1.23 17 56.7 1.10 0.49-2.47 0.96 Numbness in hands or feet 58 33.0 26 30.2 0.88 0.50-1.57 12 40.0 1.17 0.52-2.66 0.78 Loss of muscle power in hands or feet 25 14.2 15 17.4 1.33 0.65-2.73 6 20.0 1.36 0.49-3.76 0.33 Recurrent nausea 6 3.4 8 9.3 2.26 0.73-6.99 4 13.3 2.81 0.71-11.22 0.14 Recurrent diarrhoea 8 4.6 10 11.6 2.62 0.98 -6.96 4 13.3 2.89 0.78-10.68 0.32 Recurrent bowel upsets 18 10.2 12 14.0 1.43 0.64-3.17 3 10.0 0.90 0.24-3.35 0.50 Neuropsychological symptoms Short memory 72 40.9 33 38.4 0.97 0.56-1.69 14 46.7 1.17 0.52-2.64 0.79 Often need to make notes 98 55.7 35 40.7 0.58 0.34-0.99 14 46.7 0.65 0.29-1.45 0.06 Often go back and check things 82 46.6 41 47.7 1.15 0.67-1.95 16 53.3 1.22 0.55-2.71 0.94 Hard to get the meaning from reading 40 22.7 18 20.9 0.76 0.40-1.45 6 20.0 0.65 0.24-1.76 0.37 Problem concentrating 55 31.3 27 31.4 0.94 0.53-1.67 11 36.7 1.06 0.46-2.44 0.47 Feel depressed 32 18.2 22 25.6 1.58 0.84-2.97 8 26.7 1.55 0.62-3.90 0.44 Abnormally tired 45 25.6 26 30.2 1.30 0.73-2.33 8 26.7 1.07 0.44-2.63 0.50 Less interested in sex 28 15.9 16 18.6 1.26 0.63-2.53 8 26.7 1.85 0.72-4.74 0.17 Have palpitations of the heart 29 16.5 20 23.3 1.65 0.85-3.19 11 36.7 2.84 1.18-6.80 0.08 Feel an oppression of the chest 36 20.5 18 20.9 1.02 0.53-1.97 11 36.7 2.12 0.90-4.99 0.12
Health outcomes in former New Zealand timber workers exposed to pentachlorophenol (PCP) 19
Health outcomes in former New Zealand timber workers exposed to pentachlorophenol (PCP).
20
Table 7a: Dose-response analyses: prevalence odds ratios by job-title and task-based PCP exposure score Non-exposed€
(n=177) Exposure score 2.5-4.9
(n=86) Exposure Score 5+
(n=30) Health outcomes n % n % OR 95%CI n % OR 95%CI
p-value for trend
Sweat with no reason 26 14.8 23 26.7 2.15 1.12-4.16 8 26.7 1.94 0.75-4.99 0.21 Headache at least once a week 39 22.2 18 20.9 0.90 0.47-1.72 6 20.0 0.75 0.28-2.03 0.57 Painful tingling in some parts of your body 39 22.2 25 29.1 1.37 0.75-2.50 9 30.0 1.15 0.48-2.79 0.30 Problem buttoning or unbuttoning 16 9.1 8 9.3 1.07 0.43-2.69 3 10.0 0.99 0.26-3.79 0.71 Trouble sleeping 54 30.7 31 36.1 1.30 0.74-2.26 11 36.7 1.24 0.54-2.85 0.58 Frequent mood changes without cause 37 21.0 26 30.2 1.64 0.88-3.04 9 30.0 1.25 0.50-3.08 0.30 Bothered by noise more than in the past 72 40.9 41 47.7 1.29 0.76-2.20 11 36.7 0.71 0.31-1.62 0.77 Neurological examination Cranial Nerves 46 26.4 27 31.8 1.45 0.78-2.68 12 40.0 2.35 0.97-5.68 0.04 Sensory Examination by cotton wool 19 10.9 7 8.1 0.71 0.28-1.83 4 13.3 0.97 0.29-3.22 0.84 Sensory Examination by pin prick 20 11.6 7 8.4 0.68 0.27-1.72 4 13.3 0.92 0.28-3.04 0.80 Vibration Sense 13 7.5 4 4.7 0.61 0.18-2.00 2 6.7 0.93 0.18-4.78 0.81 Joint position 4 2.3 2 2.4 1.10 0.19-6.26 1 3.3 1.78 0.18-17.28 0.99 Two point discrimination 50 28.7 29 34.1 1.26 0.71-2.25 7 23.3 0.74 0.28-1.90 0.61 Wasting 4 2.3 0 0.0 NA NA 2 6.9 2.74 0.38-19.68 0.81 Power upper limb 5 2.9 1 1.2 0.50 0.05-4.61 0 0.0 NA NA 0.43 Power lower limb 7 4.1 0 0.0 NA NA 1 3.3 0.82 0.09-7.68 0.44 Reflexes 35 20. 1 13 15.3 0.69 0.34-1.41 3 10.0 0.38 0.11-1.36 0.22 Straight leg raising 28 17.3 21 28.4 1.78 0.92-3.44 11 40.7 3.28 1.32-8.11 0.17 Gait 4 2.5 1 1.2 0.52 0.06-4.81 1 3.3 1.64 0.17-15.74 0.60 Tests of co-ordination 8 4.6 1 1.2 0.29 0.03-2.51 2 6.7 1.64 0.30-8.99 0.73
€ Reference group § Prevalence odds ratio – age, gender and smoking adjusted
Table 7b: Dose-response analyses: symptom scores by exposure score§
Exposure Score Non-exposed€ Exposure score 2.5-4.9
Exposure score 5+
mean 95% CI mean 95% CI mean 95% CI
p-value for trend§
Physical symptoms (10) 1.72 1.47-1.97 1.93 1.50-2.36 2.30 1.57-3.03 0.33 Neuropsychological symptoms (17) 4.55 4.01-5.08 4.98 4.19-5.77 5.47 4.16-6.78 0.49 Neurological examination (13) 1.39 1.16-1.61 1.31 1.05-1.57 1.67 1.01-2.33 0.56
€ Reference group § Age, gender and smoking adjusted
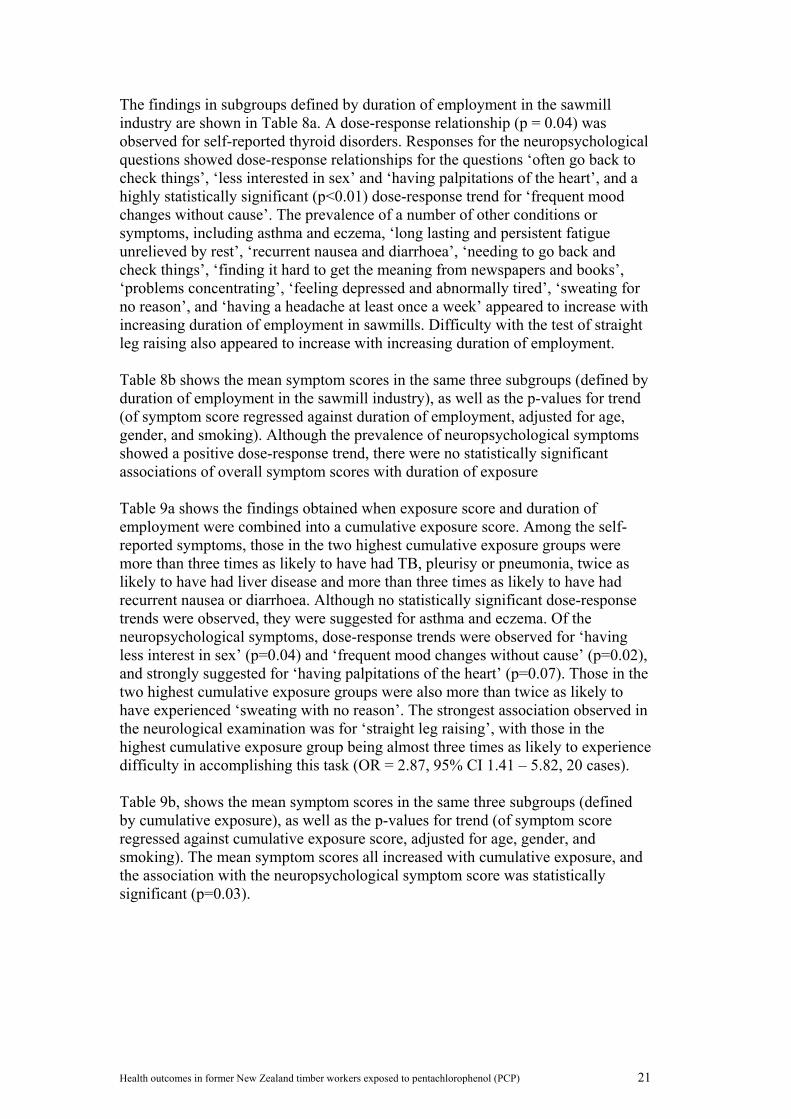
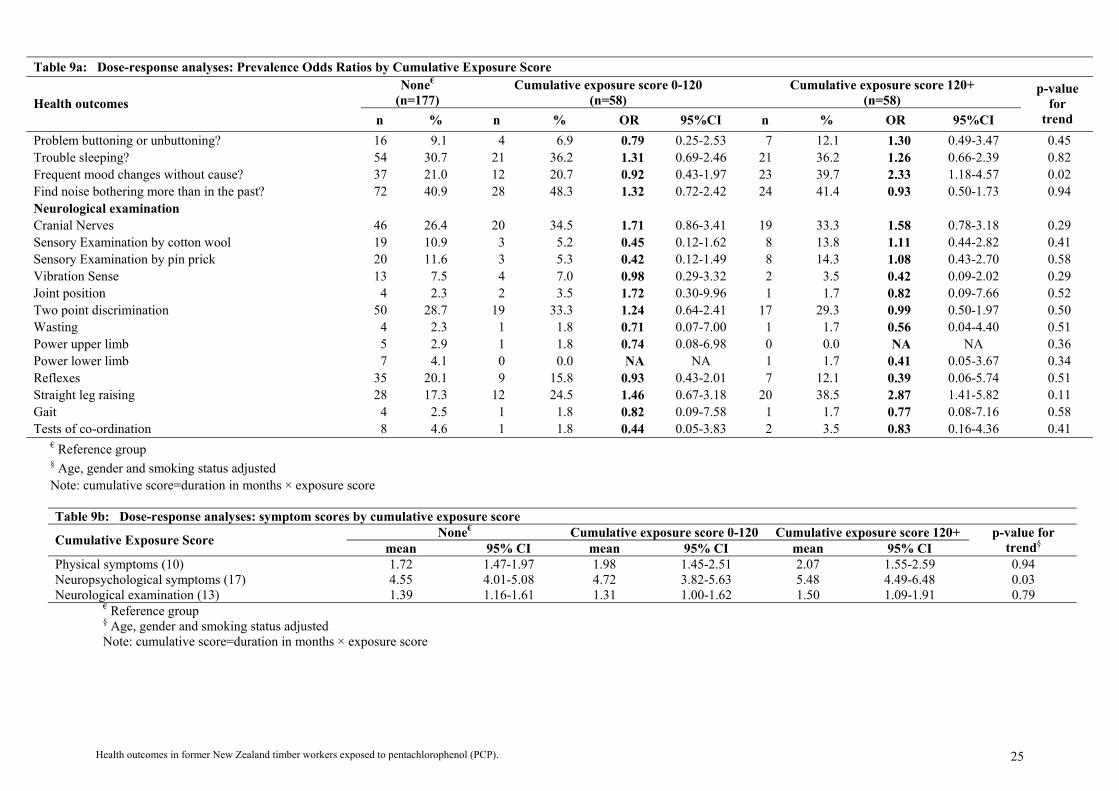
The findings in subgroups defined by duration of employment in the sawmill industry are shown in Table 8a. A dose-response relationship (p = 0.04) was observed for self-reported thyroid disorders. Responses for the neuropsychological questions showed dose-response relationships for the questions ‘often go back to check things’, ‘less interested in sex’ and ‘having palpitations of the heart’, and a highly statistically significant (p<0.01) dose-response trend for ‘frequent mood changes without cause’. The prevalence of a number of other conditions or symptoms, including asthma and eczema, ‘long lasting and persistent fatigue unrelieved by rest’, ‘recurrent nausea and diarrhoea’, ‘needing to go back and check things’, ‘finding it hard to get the meaning from newspapers and books’, ‘problems concentrating’, ‘feeling depressed and abnormally tired’, ‘sweating for no reason’, and ‘having a headache at least once a week’ appeared to increase with increasing duration of employment in sawmills. Difficulty with the test of straight leg raising also appeared to increase with increasing duration of employment. Table 8b shows the mean symptom scores in the same three subgroups (defined by duration of employment in the sawmill industry), as well as the p-values for trend (of symptom score regressed against duration of employment, adjusted for age, gender, and smoking). Although the prevalence of neuropsychological symptoms showed a positive dose-response trend, there were no statistically significant associations of overall symptom scores with duration of exposure Table 9a shows the findings obtained when exposure score and duration of employment were combined into a cumulative exposure score. Among the self-reported symptoms, those in the two highest cumulative exposure groups were more than three times as likely to have had TB, pleurisy or pneumonia, twice as likely to have had liver disease and more than three times as likely to have had recurrent nausea or diarrhoea. Although no statistically significant dose-response trends were observed, they were suggested for asthma and eczema. Of the neuropsychological symptoms, dose-response trends were observed for ‘having less interest in sex’ (p=0.04) and ‘frequent mood changes without cause’ (p=0.02), and strongly suggested for ‘having palpitations of the heart’ (p=0.07). Those in the two highest cumulative exposure groups were also more than twice as likely to have experienced ‘sweating with no reason’. The strongest association observed in the neurological examination was for ‘straight leg raising’, with those in the highest cumulative exposure group being almost three times as likely to experience difficulty in accomplishing this task (OR = 2.87, 95% CI 1.41 – 5.82, 20 cases). Table 9b, shows the mean symptom scores in the same three subgroups (defined by cumulative exposure), as well as the p-values for trend (of symptom score regressed against cumulative exposure score, adjusted for age, gender, and smoking). The mean symptom scores all increased with cumulative exposure, and the association with the neuropsychological symptom score was statistically significant (p=0.03).
Health outcomes in former New Zealand timber workers exposed to pentachlorophenol (PCP) 21
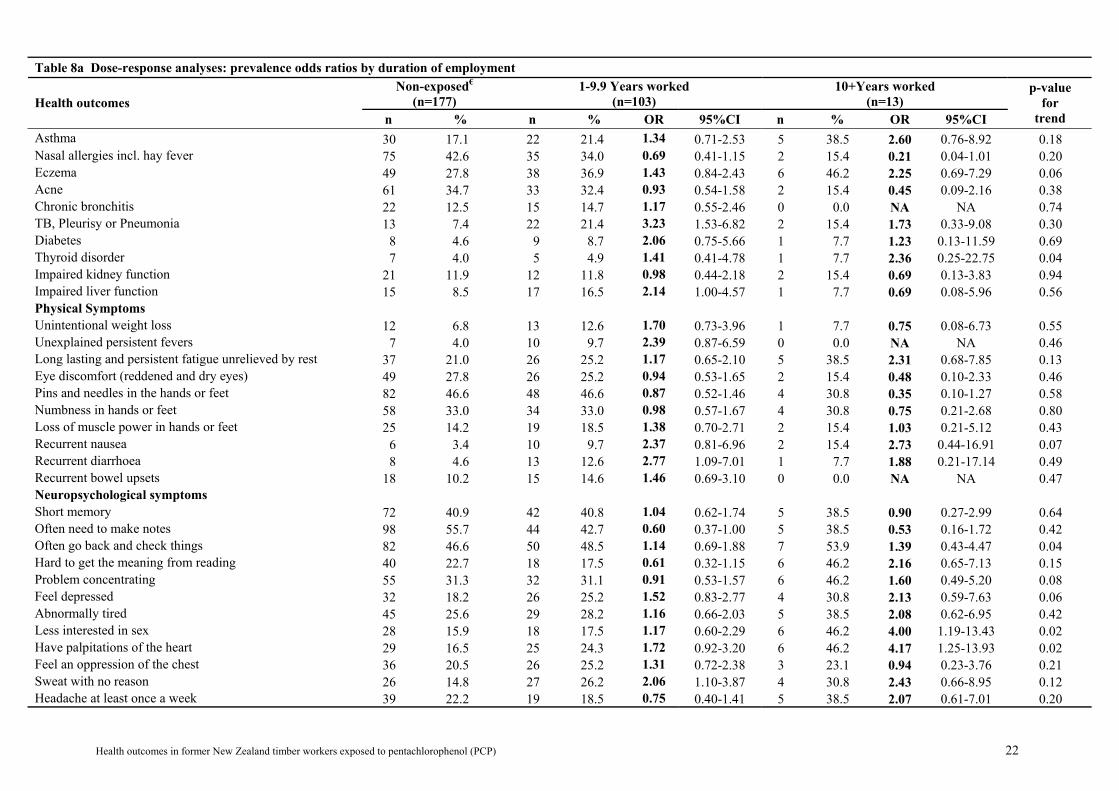
Table 8a Dose-response analyses: prevalence odds ratios by duration of employment Non-exposed€
(n=177) 1-9.9 Years worked
(n=103) 10+Years worked
(n=13) Health outcomes n % n % OR 95%CI n % OR 95%CI
p-value for
trend Asthma 30 17.1 22 21.4 1.34 0.71-2.53 5 38.5 2.60 0.76-8.92 0.18 Nasal allergies incl. hay fever 75 42.6 35 34.0 0.69 0.41-1.15 2 15.4 0.21 0.04-1.01 0.20 Eczema 49 27.8 38 36.9 1.43 0.84-2.43 6 46.2 2.25 0.69-7.29 0.06 Acne 61 34.7 33 32.4 0.93 0.54-1.58 2 15.4 0.45 0.09-2.16 0.38 Chronic bronchitis 22 12.5 15 14.7 1.17 0.55-2.46 0 0.0 NA NA 0.74 TB, Pleurisy or Pneumonia 13 7.4 22 21.4 3.23 1.53-6.82 2 15.4 1.73 0.33-9.08 0.30 Diabetes 8 4.6 9 8.7 2.06 0.75-5.66 1 7.7 1.23 0.13-11.59 0.69 Thyroid disorder 7 4.0 5 4.9 1.41 0.41-4.78 1 7.7 2.36 0.25-22.75 0.04 Impaired kidney function 21 11.9 12 11.8 0.98 0.44-2.18 2 15.4 0.69 0.13-3.83 0.94 Impaired liver function 15 8.5 17 16.5 2.14 1.00-4.57 1 7.7 0.69 0.08-5.96 0.56 Physical Symptoms Unintentional weight loss 12 6.8 13 12.6 1.70 0.73-3.96 1 7.7 0.75 0.08-6.73 0.55 Unexplained persistent fevers 7 4.0 10 9.7 2.39 0.87-6.59 0 0.0 NA NA 0.46 Long lasting and persistent fatigue unrelieved by rest 37 21.0 26 25.2 1.17 0.65-2.10 5 38.5 2.31 0.68-7.85 0.13 Eye discomfort (reddened and dry eyes) 49 27.8 26 25.2 0.94 0.53-1.65 2 15.4 0.48 0.10-2.33 0.46 Pins and needles in the hands or feet 82 46.6 48 46.6 0.87 0.52-1.46 4 30.8 0.35 0.10-1.27 0.58 Numbness in hands or feet 58 33.0 34 33.0 0.98 0.57-1.67 4 30.8 0.75 0.21-2.68 0.80 Loss of muscle power in hands or feet 25 14.2 19 18.5 1.38 0.70-2.71 2 15.4 1.03 0.21-5.12 0.43 Recurrent nausea 6 3.4 10 9.7 2.37 0.81-6.96 2 15.4 2.73 0.44-16.91 0.07 Recurrent diarrhoea 8 4.6 13 12.6 2.77 1.09-7.01 1 7.7 1.88 0.21-17.14 0.49 Recurrent bowel upsets 18 10.2 15 14.6 1.46 0.69-3.10 0 0.0 NA NA 0.47 Neuropsychological symptoms Short memory 72 40.9 42 40.8 1.04 0.62-1.74 5 38.5 0.90 0.27-2.99 0.64 Often need to make notes 98 55.7 44 42.7 0.60 0.37-1.00 5 38.5 0.53 0.16-1.72 0.42 Often go back and check things 82 46.6 50 48.5 1.14 0.69-1.88 7 53.9 1.39 0.43-4.47 0.04 Hard to get the meaning from reading 40 22.7 18 17.5 0.61 0.32-1.15 6 46.2 2.16 0.65-7.13 0.15 Problem concentrating 55 31.3 32 31.1 0.91 0.53-1.57 6 46.2 1.60 0.49-5.20 0.08 Feel depressed 32 18.2 26 25.2 1.52 0.83-2.77 4 30.8 2.13 0.59-7.63 0.06 Abnormally tired 45 25.6 29 28.2 1.16 0.66-2.03 5 38.5 2.08 0.62-6.95 0.42 Less interested in sex 28 15.9 18 17.5 1.17 0.60-2.29 6 46.2 4.00 1.19-13.43 0.02 Have palpitations of the heart 29 16.5 25 24.3 1.72 0.92-3.20 6 46.2 4.17 1.25-13.93 0.02 Feel an oppression of the chest 36 20.5 26 25.2 1.31 0.72-2.38 3 23.1 0.94 0.23-3.76 0.21 Sweat with no reason 26 14.8 27 26.2 2.06 1.10-3.87 4 30.8 2.43 0.66-8.95 0.12 Headache at least once a week 39 22.2 19 18.5 0.75 0.40-1.41 5 38.5 2.07 0.61-7.01 0.20
Health outcomes in former New Zealand timber workers exposed to pentachlorophenol (PCP) 22

Health outcomes in former New Zealand timber workers exposed to pentachlorophenol (PCP).
23
Table 8a Dose-response analyses: prevalence odds ratios by duration of employment Non-exposed€
(n=177) 1-9.9 Years worked
(n=103) 10+Years worked
(n=13) Health outcomes n % n % OR 95%CI n % OR 95%CI
p-value for
trend Painful tingling in some parts of your body 39 22.2 29 28.2 1.25 0.71-2.23 5 38.5 1.81 0.54-6.09 0.20 Problem buttoning or unbuttoning 16 9.1 7 6.8 0.76 0.30-1.97 4 30.8 3.63 0.93-14.24 0.11 Trouble sleeping 54 30.7 39 37.9 1.38 0.82-2.33 3 23.1 0.64 0.16-2.49 0.72 Frequent mood changes without cause 37 21.0 29 28.2 1.33 0.73-2.40 6 46.2 4.39 1.29-14.99 <0.01 Bothered by noise more than in the past 72 40.9 45 43.3 1.07 0.65-1.77 7 53.9 1.57 0.49-5.01 0.53 Neurological examination Cranial Nerves 46 26.4 35 34.0 1.74 0.98-3.10 4 33.3 1.04 0.27-3.98 0.63 Sensory Examination by cotton wool 19 10.9 9 8.7 0.76 0.32-1.82 2 15.4 0.95 0.18-4.97 0.79 Sensory Examination by pin prick 20 11.6 9 8.9 0.71 0.30-1.68 2 16.7 0.98 0.19-5.15 0.99 Vibration Sense 13 7.5 6 5.9 0.82 0.30-2.34 0 0.0 NA NA 0.12 Joint position 4 2.3 3 2.9 1.51 0.32-7.11 0 0.0 NA NA 0.44 Two point discrimination 50 28.7 33 32.3 1.22 0.70-2.13 3 23.1 0.49 0.12-2.00 0.41 Wasting 4 2.3 2 2.0 0.82 0.14-4.89 0 0.0 NA NA 0.37 Power upper limb 5 2.9 1 1.0 0.31 0.03-2.90 0 0.0 NA NA 0.29 Power lower limb 7 4.1 1 1.0 0.27 0.03-2.31 0 0.0 NA NA 0.33 Reflexes 35 20.1 16 15.7 0.70 0.36-1.35 0 0.0 NA NA 0.03 Straight leg raising 28 17.3 28 30.1 1.98 1.07-3.66 4 50.0 3.81 0.86-16.87 0.02 Gait 4 2.5 2 2.0 0.94 0.17-5.35 0 0.0 NA NA 0.40 Tests of co-ordination 8 4.6 3 2.9 0.75 0.18-3.11 0 0.0 NA NA 0.26
€ Reference group § Prevalence odds ratio – age, gender and smoking adjusted
Table 8b: Dose-response analyses: symptom scores by duration of employment Non-exposed€ 1-9.9 Years worked 10+Years worked Duration of Employment
mean 95% CI mean 95% CI mean 95% CI p-value for
trend§ Physical symptoms (10) 1.72 1.47-1.97 2.08 1.68-2.47 1.62 0.58-2.65 0.59 Neuropsychological symptoms (17) 4.55 4.01-5.08 4.90 4.24-5.57 6.69 3.64-9.75 0.12 Neurological examination (13) 1.39 1.16-1.61 1.44 1.17-1.70 1.15 0.27-2.04 0.60
€ Reference group § Prevalence odds ratio – age, gender and smoking adjusted

Table 9a: Dose-response analyses: Prevalence Odds Ratios by Cumulative Exposure Score None€
(n=177) Cumulative exposure score 0-120
(n=58) Cumulative exposure score 120+
(n=58) Health outcomes n % n % OR 95%CI n % OR 95%CI
p-value for
trend Asthma 30 17.1 11 19.0 1.56 0.53-2.53 16 27.6 1.79 0.87-3.70 0.11 Nasal allergies incl. hay fever 75 42.6 18 31.0 0.61 0.32-1.16 19 32.8 0.59 0.31-1.11 0.25 Eczema 49 27.8 19 32.8 1.20 0.62-2.29 25 43.1 1.87 0.99-3.51 0.21 Acne 61 34.7 18 31.0 0.88 0.46-1.69 17 29.8 0.86 0.44-1.68 0.47 Chronic bronchitis 22 12.5 5 8.6 0.65 0.23-1.85 10 17.5 1.43 0.60-3.38 0.70 TB, Pleurisy or Pneumonia 13 7.4 13 22.4 3.41 1.46-7.94 11 19.0 2.68 1.11-6.48 0.42 Diabetes 8 4.6 7 12.1 2.93 0.99-8.72 3 5.2 1.07 0.27-4.31 0.83 Thyroid disorder 7 4.0 2 3.5 1.00 0.19-5.11 4 6.9 2.03 0.54-7.64 0.10 Kidney problem 21 11.9 6 10.5 0.83 0.30-2.26 8 13.8 1.05 0.41-2.68 0.95 Liver problem 15 8.5 11 19.0 2.42 1.03-5.72 7 12.1 1.46 0.55-3.88 0.71 Physical Symptoms Unintentional weight loss 12 6.8 9 15.5 2.13 0.83-5.47 5 8.6 1.05 0.34-3.22 0.47 Unexplained persistent fevers 7 4.0 6 10.3 2.58 0.82-8.09 4 6.9 1.60 0.44-5.79 0.69 Long lasting and persistent fatigue unrelieved by rest 37 21.0 16 27.6 1.31 0.66-2.63 15 25.9 1.21 0.59-2.46 0.14 Eye discomfort (reddened and dry eyes) 49 27.8 14 24.1 0.87 0.43-1.74 14 24.1 0.89 0.43-1.81 0.45 Pins and needles in the hands or feet 82 46.6 23 39.7 0.68 0.36-1.28 29 50.0 0.93 0.50-1.74 0.83 Numbness in hands or feet 58 33.0 14 24.1 0.65 0.32-1.29 24 41.4 1.34 0.71-2.51 0.98 Loss of muscle power in hands or feet 25 14.2 10 17.2 1.31 0.58-2.98 11 19.0 1.37 0.61-3.05 0.74 Recurrent nausea 6 3.4 3 5.2 1.18 0.28-5.08 9 15.5 3.71 1.21-11.37 0.24 Recurrent diarrhoea 8 4.6 10 17.2 4.08 1.51-11.02 4 6.9 1.42 0.40-4.98 0.65 Recurrent bowel upsets 18 10.2 10 17.2 1.82 0.78-4.28 5 15.2 0.80 0.28-2.29 0.26 Neuropsychological symptoms Short memory? 72 40.9 24 41.4 1.11 0.59-2.06 23 39.7 0.94 0.50-1.77 0.56 Need to often make notes? 98 55.7 25 43.1 0.63 0.34-1.17 24 41.4 0.56 0.30-1.04 0.50 Often go back and check things? 82 46.6 25 43.1 0.95 0.51-1.75 32 55.2 1.44 0.78-2.66 0.07 Hard to get the meaning from reading? 40 22.7 10 17.2 0.60 0.27-1.32 14 24.1 0.87 0.42-1.79 0.22 Problem concentrating? 55 31.3 18 31.0 0.93 0.48-1.80 20 34.5 1.02 0.53-1.95 0.12 Feel depressed? 32 18.2 15 25.9 1.59 0.78-3.25 15 25.9 1.55 0.76-3.19 0.29 Abnormally tired? 45 25.6 18 31.0 1.34 0.69-2.60 16 27.6 1.14 0.58-2.26 0.20 Less interested in sex? 28 15.9 8 13.8 0.89 0.38-2.12 16 27.6 2.00 0.96-4.16 0.04 Have palpitations of the heart? 29 16.5 12 20.7 1.42 0.66-3.07 19 32.8 2.49 1.23-5.03 0.07 Feel an oppression of the chest? 36 20.5 11 19.0 0.91 0.42-1.97 18 31.0 1.67 0.84-3.32 0.31 Sweat with no reason? 26 14.8 17 29.3 2.45 1.19-5.07 14 24.1 1.77 0.83-3.79 0.59 Headache at least once a week? 39 22.2 11 19.0 0.79 0.37-1.70 13 22.4 0.93 0.44-1.94 0.42 Painful tingling in some parts of your body? 39 22.2 15 25.9 1.16 0.57-2.35 19 32.8 1.46 0.75-2.87 0.38
Health outcomes in former New Zealand timber workers exposed to pentachlorophenol (PCP) 24
Health outcomes in former New Zealand timber workers exposed to pentachlorophenol (PCP).
25
Table 9a: Dose-response analyses: Prevalence Odds Ratios by Cumulative Exposure Score None€
(n=177) Cumulative exposure score 0-120
(n=58) Cumulative exposure score 120+
(n=58) Health outcomes n % n % OR 95%CI n % OR 95%CI
p-value for
trend Problem buttoning or unbuttoning? 16 9.1 4 6.9 0.79 0.25-2.53 7 12.1 1.30 0.49-3.47 0.45 Trouble sleeping? 54 30.7 21 36.2 1.31 0.69-2.46 21 36.2 1.26 0.66-2.39 0.82 Frequent mood changes without cause? 37 21.0 12 20.7 0.92 0.43-1.97 23 39.7 2.33 1.18-4.57 0.02 Find noise bothering more than in the past? 72 40.9 28 48.3 1.32 0.72-2.42 24 41.4 0.93 0.50-1.73 0.94 Neurological examination Cranial Nerves 46 26.4 20 34.5 1.71 0.86-3.41 19 33.3 1.58 0.78-3.18 0.29 Sensory Examination by cotton wool 19 10.9 3 5.2 0.45 0.12-1.62 8 13.8 1.11 0.44-2.82 0.41 Sensory Examination by pin prick 20 11.6 3 5.3 0.42 0.12-1.49 8 14.3 1.08 0.43-2.70 0.58 Vibration Sense 13 7.5 4 7.0 0.98 0.29-3.32 2 3.5 0.42 0.09-2.02 0.29 Joint position 4 2.3 2 3.5 1.72 0.30-9.96 1 1.7 0.82 0.09-7.66 0.52 Two point discrimination 50 28.7 19 33.3 1.24 0.64-2.41 17 29.3 0.99 0.50-1.97 0.50 Wasting 4 2.3 1 1.8 0.71 0.07-7.00 1 1.7 0.56 0.04-4.40 0.51 Power upper limb 5 2.9 1 1.8 0.74 0.08-6.98 0 0.0 NA NA 0.36 Power lower limb 7 4.1 0 0.0 NA NA 1 1.7 0.41 0.05-3.67 0.34 Reflexes 35 20.1 9 15.8 0.93 0.43-2.01 7 12.1 0.39 0.06-5.74 0.51 Straight leg raising 28 17.3 12 24.5 1.46 0.67-3.18 20 38.5 2.87 1.41-5.82 0.11 Gait 4 2.5 1 1.8 0.82 0.09-7.58 1 1.7 0.77 0.08-7.16 0.58 Tests of co-ordination 8 4.6 1 1.8 0.44 0.05-3.83 2 3.5 0.83 0.16-4.36 0.41
€ Reference group § Age, gender and smoking status adjusted Note: cumulative score=duration in months × exposure score
Table 9b: Dose-response analyses: symptom scores by cumulative exposure score
None€ Cumulative exposure score 0-120 Cumulative exposure score 120+ Cumulative Exposure Score mean 95% CI mean 95% CI mean 95% CI p-value for
trend§ Physical symptoms (10) 1.72 1.47-1.97 1.98 1.45-2.51 2.07 1.55-2.59 0.94 Neuropsychological symptoms (17) 4.55 4.01-5.08 4.72 3.82-5.63 5.48 4.49-6.48 0.03 Neurological examination (13) 1.39 1.16-1.61 1.31 1.00-1.62 1.50 1.09-1.91 0.79
€ Reference group § Age, gender and smoking status adjusted
Note: cumulative score=duration in months × exposure score

Discussion As in the cohort study, the morbidity survey participants mostly had relatively low exposure – only about 10% had worked in the industry for ten years or more while PCP was in use, or carried out ‘high risk’ activities such as mixing PCP or cleaning sludge from dip tanks or baths. This survey indicates, therefore, that most former timber workers had low and/or short-term exposure. This is reassuring with regards to the levels of exposure in former timber workers in general, but it means that the morbidity survey (and the cohort study on which it is based) has involved relatively few workers with high long-term exposures, and is therefore limited in what it can tell us about the health effects of PCP exposure in such workers. Nevertheless, the morbidity survey yielded several interesting findings. When participants were stratified according to their exposure status individuals who had been exposed to PCP reported a statistically significantly elevated prevalence of chronic respiratory disease including TB/Pleurisy or Pneumonia, ‘recurrent diarrhoea’, ‘palpitations of the heart’, ‘sweating for no reason’ and ‘straight leg raising’. In exposed individuals several other conditions were elevated, although not-statistically significant, including self-reported eczema, diabetes, impaired liver function, ‘unexplained persistent fevers’, ‘recurrent nausea’, ‘depression’ and ‘frequent mood changes without cause’, and a deficit in cranial nerve function. Other interesting findings included: (i) strong associations between exposure levels and risks of self-reported chronic respiratory disease including TB, pleurisy or pneumonia (p<0.01) and a deficit in cranial nerve function (p=0.04), and non-significant increased risks for asthma, eczema, ‘unexplained persistent fevers’, ‘recurrent nausea and diarrhoea’, ‘having palpitations of the heart’, ‘lack of interest in sex’, feelings of ‘oppression in the chest’ and ‘sweating for no reason’; (ii) similarly strong associations between years worked in the industry and self-reported thyroid disorders (p=0.04), and also the neuropsychological questions including ‘often going back to check things’ (p=0.04), ‘lack of interest in sex’ (p=0.02) and ‘having palpitations of the heart’ (p=0.02), and a highly statistically significant dose-response trend for ‘frequent mood changes without cause’ (p<0.01). There were also non-significant increased risks for asthma, eczema, ‘long lasting and persistent fatigue unrelieved by rest’, ‘recurrent nausea and diarrhoea’, ‘needing to go back and check things’, ‘finding it hard to get the meaning from newspapers and books’, ‘problems concentrating’, ‘sweating for no reason’, ‘feeling depressed’, ‘being abnormally tired’, ‘having frequent headaches’ and difficulty with the straight leg raising test; and (iii) strong associations between cumulative exposure (exposure intensity times duration of exposure) and risk of chronic respiratory disease (including TB, pleurisy and pneumonia), liver disease and ‘recurrent nausea and diarrhoea’, and dose-response trends for having “less interest in sex’ (p=0.04) and ‘frequent mood changes without cause’ (p=0.02). Dose-response trends were also suggested for asthma, eczema, tuberculosis, pleurisy or pneumonia, thyroid disorders, ‘recurrent nausea’, ‘having palpitations of the heart’ and ‘sweating without reason’. There was also a statistically significant dose-response trend between cumulative exposure and the overall number of neuropsychological symptoms reported (p=0.03). The elevated risks of chronic respiratory disease in this survey of surviving former sawmill workers are consistent with the two-fold risk of dying from a non-malignant respiratory disease seen in the sawmill workers cohort study (see above).
Health outcomes in former New Zealand timber workers exposed to pentachlorophenol (PCP). 26

Furthermore, the morbidity survey findings (unlike the cohort mortality study findings) are adjusted for smoking. The other consistent findings from the morbidity survey all fall into the category of subclinical deficits of a range of neuropsychological and physiological functions, such as ‘fatigue’, ‘mood changes’, ‘palpitations of the heart’ and ‘fevers and sweats’. Although many of these findings were not statistically significant, the findings for the neuropsychological symptoms in particular are similar to those from the 1998 PCP survey of another group of former New Zealand sawmill workers (Walls et al, 1998). Furthermore, the elevations in the prevalence of positive responses to the neuropsychological questions were similar in magnitude to those measured in heavily solvent exposed floor layers (Nordling Nilson et al, 2007). This is of concern as even small changes in nervous system functions induced by exposure to toxic chemicals have important repercussions in elderly people because of their reduced capacity to compensate for impairment, resulting in accelerated aging (Weiss, 2000).
Health outcomes in former New Zealand timber workers exposed to pentachlorophenol (PCP). .
27

Exposure Assessment Introduction PCP is readily absorbed through the lungs, skin and gastrointestinal tract, although dermal uptake is usually the most significant route of entry. If inhaled, the inhaled amount is absorbed, as little if any is exhaled due to PCP’s low vapour pressure (ACGIH 2001). In the sawmill industry it has been assumed that the predominant route of exposure is dermal (Kauppinen and Lindroos, 1985; Enarson et al 1986; Kallioski and Kauppinen, 1990), although it was not uncommon in New Zealand to spray PCP on stacks of logs or air drying sawn timber, thus providing additional potential for inhalation. Absorbed PCP is excreted primarily in urine, with elimination half-lives of between 4 and 72 days having been observed, while the PCDD and PCDF contaminants of PCP are thought to have elimination half-lives of up to 10 years. Measurement of PCP in urine or plasma, therefore, only provides a measure of current exposure while the chemical is in use whereas the measurement of dioxin in serum provides an estimate of exposure in previous decades. The biological monitoring survey conducted by the Ministry of Health in the 1980s identified a clear hierarchy of intensity of PCP exposure associated with different job titles in the industry, with the table hands that pulled timber off the green chain having the highest exposure through their prolonged skin contact with PCP. Workers employed in jobs such as in boron diffusion treatment plants, picking orders, grading and sorting, as yard hands, in other treatment plants or filleting stacks of timber for air drying, all of which involved more intermittent or peripheral exposure to PCP treated timber, had clearly elevated but significantly lower levels of PCP in their urine. A final group, including most workers in the green and dry milling areas, and drivers of mobile plant, had only minimal exposure that was probably close to the general population background levels (ACGIH 2001). The average (geometric mean) levels and geometric standard deviation (GSD) for each job title tested are shown in Table 10 below: The results from an additional 8 workers who performed the task of mixing PCP were also located, and these showed significantly higher levels of PCP in urine than workers in any of the job titles shown in table 10, including the table hands. Their group geometric mean of 2.80 mg/L was more than an order of magnitude above that of the table hands, reflecting exposure to higher strength solutions and concentrated waste. Tests of PCP uptake were not available for workers involved in any other specific work task.
Health outcomes in former New Zealand timber workers exposed to pentachlorophenol (PCP). .
28

Table 10: PCP in urine by job title
Job Title N GM (mg/L) GSD
Table hands 48 0.21 3.36 Diffusion plant 4 0.06 2.21 Ordermen 5 0.06 2.38 Graders/Sorters 24 0.05 2.80 Yardhands 16 0.04 3.84 CCA plant operators 7 0.03 4.60 Filleter/Kiln workers 8 0.03 2.49 Green Mill 9 0.01 5.44 Dry mill (planers/machinists) 15 0.01 2.82 Mobile plant drivers 20 0.01 3.55 Total 164 0.06 6.35
The sodium pentachlorophenate (NaPCP) and PCP formulations used in antisapstain fungicides typically contained 2,3,7,8-substituted PCDD and PCDF congeners, in characteristic profiles with particularly elevated hexa-, hepta- and octa-chlorinated dioxins (Schecter et al, 1994; Collins et al 2006). Wastes from New Zealand sawmill industry PCP storage and make-up tanks, and sludge from PCP dip tanks, were also found to be contaminated with significant quantities of dioxins with the same characteristic congener profiles, and with concentrations in the parts per million range (Bingham & Bettany, 1991). Due to its long biological half-life, serum dioxin levels reflect exposure from the period of PCP use, and the unique congener profiles found can be evaluated for their consistency with the profiles found in PCP and its waste. However, until recently, the only serum dioxin tests that had been conducted on former New Zealand timber workers exposed to PCP were four tests that were conducted for a television programme (Smith & Lopipero, 2001). These found elevated levels, particularly for the specific PCP dioxin congener profiles, even though the tests were conducted more than a decade after exposure ceased (Smith & Lopipero, 2001). Similar findings have been reported in overseas studies (Collins et al, 2006). In the current study we measured serum dioxin levels in a random selection of blood samples taken from all those workers included in the cross-sectional morbidity survey, and also analysed data from serum dioxin tests from members of Sawmill Workers Against Poisons (SWAP) who had been tested by the Accident Compensation Corporation (ACC).
Health outcomes in former New Zealand timber workers exposed to pentachlorophenol (PCP). .
29

Methods Selection of morbidity survey samples An initial selection of ‘exposed’ and ‘non-exposed’ workers for the morbidity survey was made on the basis of their employment records, although the final categorisation of exposure status was made after interview and completion of the lifetime job history. To be classified as ‘exposed’ meant that the individual must have worked in a sawmill known to cut pine (and not exclusively native timbers), and must have been recorded as having worked mixing PCP concentrate, as a dip bath operator, as a table hand or green chain puller, a yardhand, an order man or a diffusion plant operator. As outlined in the methods section of the morbidity survey (see above), 120 ml of whole blood was taken from each ‘exposed’ individual and 10 ml from the ‘non-exposed’. From the 281 blood samples obtained, we selected ‘exposed’ workers at random from each age-group, 28 from those 35-49 years old, 34 from the 50-64 year group, and 9 from the 65+ age-group, i.e. 71 in total, to reflect the age distribution of the sample. Serum dioxin levels in members of Sawmill Workers Against Poisons (SWAP) We were also provided with copies of the blood test results from 23 members of SWAP who had been tested in 2006 by the Accident Compensation Corporation (ACC), in the same laboratory using the same analytical method as the samples tested in the current study. These results were included in our analysis of the serum dioxin levels in former sawmill workers by job-title, tasks performed and duration of employment etc. The SWAP members were also interviewed with the work history questionnaire so that we could use that information in the analyses of exposure associated with these parameters. However, no information from SWAP members concerning health outcomes was used in the morbidity survey analyses since these were based on a random sample of timber workers rather than ‘volunteers’. Comparison groups We also selected a further 23 samples from the ‘non-exposed’ sawmill workers in the morbidity survey, randomly from within each age-group, and these were pooled into two samples for each of the age-groups. Blood from 8 individuals were included in each sample from the 35-49 and 50-64 groups, and 7 from the 65+ age-group. These composite samples provided a comparison with ‘exposed’ workers, and were used to determine the excess dioxin levels in the serum of the ‘exposed’ workers – based on the each worker’s ‘excess’ level in comparison with the average of the ‘non-exposed’ composite samples for the same age-group. The age bands selected for these samples correspond to those used in the 1996 Ministry for the Environment (MfE) national serum survey. As an additional comparison, our results were also compared with those obtained in the national serum survey (Bates et al, 1999), with individual congener and WHO-TEQ results extrapolated to 2006 values by assuming a half-life of 7-10 years.
Health outcomes in former New Zealand timber workers exposed to pentachlorophenol (PCP). .
30
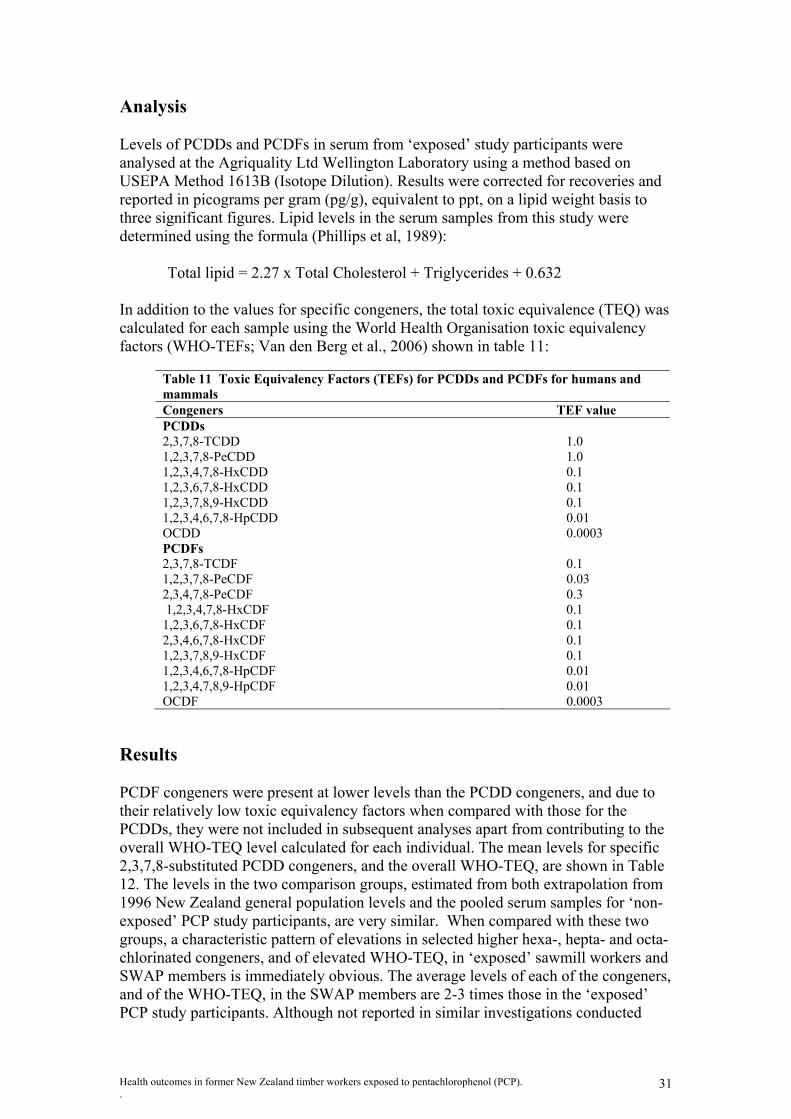
Analysis Levels of PCDDs and PCDFs in serum from ‘exposed’ study participants were analysed at the Agriquality Ltd Wellington Laboratory using a method based on USEPA Method 1613B (Isotope Dilution). Results were corrected for recoveries and reported in picograms per gram (pg/g), equivalent to ppt, on a lipid weight basis to three significant figures. Lipid levels in the serum samples from this study were determined using the formula (Phillips et al, 1989):
Total lipid = 2.27 x Total Cholesterol + Triglycerides + 0.632 In addition to the values for specific congeners, the total toxic equivalence (TEQ) was calculated for each sample using the World Health Organisation toxic equivalency factors (WHO-TEFs; Van den Berg et al., 2006) shown in table 11:
Table 11 Toxic Equivalency Factors (TEFs) for PCDDs and PCDFs for humans and mammals Congeners TEF value PCDDs 2,3,7,8-TCDD 1.0 1,2,3,7,8-PeCDD 1.0 1,2,3,4,7,8-HxCDD 0.1 1,2,3,6,7,8-HxCDD 0.1 1,2,3,7,8,9-HxCDD 0.1 1,2,3,4,6,7,8-HpCDD 0.01 OCDD 0.0003 PCDFs 2,3,7,8-TCDF 0.1 1,2,3,7,8-PeCDF 0.03 2,3,4,7,8-PeCDF 0.3 1,2,3,4,7,8-HxCDF 0.1 1,2,3,6,7,8-HxCDF 0.1 2,3,4,6,7,8-HxCDF 0.1 1,2,3,7,8,9-HxCDF 0.1 1,2,3,4,6,7,8-HpCDF 0.01 1,2,3,4,7,8,9-HpCDF 0.01 OCDF 0.0003
Results PCDF congeners were present at lower levels than the PCDD congeners, and due to their relatively low toxic equivalency factors when compared with those for the PCDDs, they were not included in subsequent analyses apart from contributing to the overall WHO-TEQ level calculated for each individual. The mean levels for specific 2,3,7,8-substituted PCDD congeners, and the overall WHO-TEQ, are shown in Table 12. The levels in the two comparison groups, estimated from both extrapolation from 1996 New Zealand general population levels and the pooled serum samples for ‘non-exposed’ PCP study participants, are very similar. When compared with these two groups, a characteristic pattern of elevations in selected higher hexa-, hepta- and octa- chlorinated congeners, and of elevated WHO-TEQ, in ‘exposed’ sawmill workers and SWAP members is immediately obvious. The average levels of each of the congeners, and of the WHO-TEQ, in the SWAP members are 2-3 times those in the ‘exposed’ PCP study participants. Although not reported in similar investigations conducted
Health outcomes in former New Zealand timber workers exposed to pentachlorophenol (PCP). .
31

elsewhere, there is also an elevation in 1,2,3,7,8-PeCDD in the ‘exposed’ groups. This is significant because the TEQ value of this congener under the WHO classification is 1.0 (i.e. the same as for TCDD), and it therefore has a large effect on the overall TEQ. What is also apparent is the range of values of the individual congeners, and of the overall TEQ values, in the ‘exposed’ PCP study and SWAP members, with both groups containing a few individuals with very high levels. Note that the national serum survey samples were pooled (i.e. small samples of serum from several individuals was combined in order to obtain sufficient serum for testing), so no range of values is available.
Table 12 Mean levels (and range of values) of PCDD congeners and WHO-TEQ in ppt in sawmill workers and both comparison groups
2,3,7,8-TCDD
1,2,3,7,8-PeCDD
1,2,3,4,7,8-HxCDD
1,2,3,6,7,8-HxCDD
1,2,3,7,8,9-HxCDD
1,2,3,4,6,7,8 HpCDD OCDD WHO-
TEQ ‘Exposed’ morbidity survey participants
1.88 (0.51-4.13)
5.64 (1.91-32.9)
2.98 (0.92-21.0)
29.39 (6.3-343)
3.78 (0.93-35.3)
28.51 (3.66-222)
309.25 (63.9-2740)
13.67 (5.15-90.2)
‘Non-Exposed’ morbidity survey participants
1.48 (0.67-2.61)
4.62 (2.9-6.72)
2.46 (1.5-4.21)
13.54 (6.0-25.9)
2.53 (1.5-4.28)
13.58 (8.0-19.9)
157.83 (112-160)
9.56 (6.7-13.0)
SWAP Members 3.58 (0.62-9.25)
14.84 (5.97-28.4)
9.82 (2.37-18.3)
95.26 (21.5-285)
9.95 (2.71-27.4)
83.96 (9.27-200)
917.60 (184-2200)
37.74 (13.7-77.7)
NZ Population (extrapolated from 1996)
1.62 2.95 1.82 13.60 2.52 23.20 208.50 8.23
Congener Profiles The dioxin congener profiles found in the serum samples of both ‘exposed’ and ‘unexposed’ PCP Study participants, and of SWAP members, are shown in figure 1. They are consistent with the profiles found in PCP solutions in China (Schecter et al), the USA (Collins et al) and in the waste streams from PCP used in New Zealand as an antisapstain in the late 1980s (Bingham & Bettany), with elevated levels of 1,2,3,6,7,8-HxCDD, 1,2,3,4,6,7,8-HpCDD and OCDD.
Health outcomes in former New Zealand timber workers exposed to pentachlorophenol (PCP). .
32

0100200300400500600700800900
1000
2,3,7,
8-TCDD
1,2,3,
7,8-P
eCDD
1,2,3,
4,7,8-
HxCDD
1,2,3,
6,7,8-
HxCDD
1,2,3,
7,8,9-
HxCDD
1,2,3,
4,6,7,
8 HpC
DD
OCDDTEQ
ppt
SWAP Exposed Unexposed
Figure 1 Average serum levels (lipid-adjusted) of PCDDs in SWAP members and
PCP morbidity survey participants The OCDDs have very low TEQs, however, and their high levels tend to obscure the presence of some other important congeners. Thus, Figure 2 shows an enlarged scale provided by the removal of the OCDD, and from this it becomes apparent that the 1,2,3,7,8-PeCDD, 1,2,3,4,7,8-HxCDD and 1,2,3,7,8,9-HxCDD congeners are also elevated above background levels.
0.00
20.00
40.00
60.00
80.00
100.00
120.00
2,3,7
,8-TCDD
1,2,3
,7,8-
PeCDD
1,2,3
,4,7,8
-HxC
DD
1,2,3
,6,7,8
-HxC
DD
1,2,3
,7,8,9
-HxC
DD
1,2,3
,4,6,7
,8 HpC
DDTEQ
SWAP PCP study exposed PCP study unexposed
Figure 2 Serum levels (lipid-adjusted) of PCDDs in SWAP members and PCP
morbidity survey participants (OCDDs not shown)
Health outcomes in former New Zealand timber workers exposed to pentachlorophenol (PCP). .
33

However, apart from the penta- chlorinated congener, the elevated hexa-, hepta- and octa- chlorinated congeners are of relatively low toxic equivalence in the WHO classification scheme. In order to gauge the actual contribution of the various congeners of dioxin found in the blood of sawmill workers, we adjusted these results by the toxic equivalency of the specific congeners. As can be seen in Figure 3 below, it is clear that the most significant contributors to the excess TEQ in former sawmill workers are the 1,2,3,7,8-PeCDD and 1,2,3,6,7,8-HxCDD congeners. In the case of the SWAP members there is also a contribution from 2,3,7,8-TCDD, but this is not apparent in the ‘exposed’ PCP study participants. Note that the total TEQ figure includes a contribution from the PCDF congeners not shown in this figure, so the overall TEQ looks greater than the sum of the individual congeners.
0
5
10
15
20
25
30
35
40
2,3,7,
8-TCDD
1,2,3,
7,8-P
eCDD
1,2,3,
4,7,8-H
xCDD
1,2,3,
6,7,8-H
xCDD
1,2,3,
7,8,9-H
xCDD
1,2,3,
4,6,7,8 H
pCDD
OCDDTEQ
ppt
SWAP Exposed Unexposed
Figure 3 TEF-adjusted dioxin congeners in SWAP members and PCP morbidity
survey participants. Excess TEQ We then calculated the difference or excess in WHO-TEQ by subtracting the level found in pooled samples of ‘non-exposed’ sawmill workers in a particular age-group from the levels found in ‘exposed’ sawmill workers in the same age-group, as shown in Table 13 below. The mean overall excess TEQ in the SWAP members is significantly greater than that in the PCP morbidity survey participants.
Health outcomes in former New Zealand timber workers exposed to pentachlorophenol (PCP). .
34

Table 13: Mean excess WHO-TEQ over background in ppt by age groups for members of SWAP and of the PCP morbidity survey
Age groups n Excess WHO-TEQ (ppt) 95%C.I.
SWAP 35-49 2 12.33 -86.15-110.8 50-64 11 24.11 16.55-31.67 65+ 10 36.95 23.35-50.54 Overall 23 28.67 21.48-35.86 PCP morbidity 35-49 29 1.22 -0.35-2.79 survey 50-64 33 5.93 2.49-14.28 participants 65+ 9 8.26 -4.36-20.85 Overall 71 4.30 1.52-7.08
We also assessed the effects of occupational exposure on the excess serum dioxin levels in study participants by calculating the mean WHO-TEQ excess by degree of exposure, using the exposure categories that were used in the morbidity survey. As can be seen in Table 14 below, there is a clear increase in the level of excess dioxin with increasing PCP exposure. However, there are significant differences between the SWAP members and the PCP study participants that suggest possible additional sources of exposure in the SWAP members. The excess serum dioxin levels are small in those PCP study participants who did not have high levels of exposure to PCP during their work in sawmills, but are significantly elevated in those with high exposure through having worked in certain specific job titles and having performed certain work tasks.
Table 14: Excess Serum Dioxin Levels according to estimated intensity of exposure based on job titles and specific work tasks performed.
PCP morbidity survey participants SWAP members Exposure score n Mean 95% C.I. n Mean 95% C.I. <3 27 1.56 -0.19-3.31 3 22.20 -28.80-73.20 3 - 6 31 4.86 0.58-10.3 9 27.18 14.79-39.58 >6 13 8.67 0.73-16.62 11 31.65 20.17-43.12 We then assessed the levels of PCP exposure associated with specific work tasks by measuring the excess serum dioxin levels of the former sawmill workers, and the results are shown in Table 15 below. From this table it is clear that in the PCP morbidity survey participants the tasks of mixing PCP and of cleaning sludge from dip tanks were both associated with excess exposure, while merely handling treated timber was associated with a relatively smaller excess. We found no evidence that maintenance work was a source of exposure. In the SWAP members, the only task that appeared to increase serum dioxin levels significantly above the background level was mixing of PCP solutions.
Health outcomes in former New Zealand timber workers exposed to pentachlorophenol (PCP). .
35

Table 15: Excess Serum Dioxin Levels according to work tasks performed PCP morbidity survey SWAP members Exposed Not exposed Exposed Not exposed Task n mean n mean n mean n mean Mixing PCP 16 8.52 55 3.08 8 36.50 16 29.21 Cleaning sludge from dip tank 31 7.44 40 1.87 8 29.99 16 32.47 Handling treated timber 66 4.41 5 2.83 7 27.96 15 34.53 Maintenance 18 1.79 53 5.16 12 26.13 12 37.15
The duration of exposure in the sawmilling industry also has a strong influence on serum dioxin levels, as can be seen in Table 16 below. PCP morbidity survey participants with more than 5 years exposure had average levels at about 150% of background levels in the general population, and after 10 or more years this increased to double the background level in both the non-exposed sawmill workers and in the general population.
Table 16: Excess Serum Dioxin Levels according to years of exposure in the sawmill industry Years of exposure <5 5 – 10 >10 n Mean
(95% CI) n Mean (95% CI) n Mean
(95% CI) PCP morbidity survey participants 40 1.59
(0. 10 – 3.08) 20 4.34 (2.19 – 6.49) 11 14.1
(–3.74 - 31.93)
SWAP members 3 24.79 (12.49 –37.09) 4 23.78
(-6.13 – 53.68) 18 33.62 (23.42 – 43.81)
Health outcomes in former New Zealand timber workers exposed to pentachlorophenol (PCP). .
36
Discussion This serum study has found that as a group the ‘exposed’ former sawmill workers in the morbidity survey had clearly elevated serum dioxin levels when compared with either the ‘non-exposed’ sawmill workers or with the New Zealand general population. The dioxin congener profiles found in the serum of study participants were also consistent with the source of the dioxin having been the PCP encountered at work in sawmills, with the higher hexa-, hepta- and octa-chlorinated congeners being elevated, as has been found in other occupationally exposed groups. In both the exposed sawmill workers and the SWAP members there was also a significant contribution to the overall toxic equivalence of the dioxin by 1,2,3,7,8-PeCDD. The pattern of serum dioxin levels found in study participants closely matched the pattern of exposure shown by the PCP biomonitoring survey conducted in the 1980s, which also indicates that the level of serum dioxin in former sawmill workers’ blood is likely to be a direct consequence of their PCP exposure prior to 1988. Given that the use of PCP ceased in about 1988, the mean excess serum dioxin in the most highly exposed group of sawmill workers can be estimated to have been 30-60 ppt above the background levels in the general population at that time. This is comparable to the levels found in phenoxy herbicide producers and other exposed occupational cohorts at that time (‘t Mannetje et al, 2005). The average level in the exposed PCP study participants was considerably lower than the average level in members of SWAP, but still clearly elevated above unexposed participants and the general population. There was a small group of former sawmill workers who had worked in jobs such as dip bath operator or tablehand on the green chain, or who had performed high risk tasks such as mixing PCP solutions, cleaning sludge from dip tanks and handling timber still wet from treatment, who had significantly higher levels of exposure and of serum dioxin levels. The highest dioxin level recorded in this study was in a PCP morbidity survey participant, who had a WHO-TEQ of 90.2 ppt, which exceeded the level recorded in any of the SWAP members. Unless this individual’s exposure has continued since 1988 this would suggest a level of 360 - 720 ppt at that time. The higher overall levels found in the SWAP members were mainly due to the fact that more than half of them had worked in exposed jobs for over 10 years, and almost all had carried out the two main high risk tasks and/or worked as a tablehand pulling timber off a green chain. There were also relatively high serum dioxin levels, however, in some SWAP members who had not reported mixing PCP or cleaning out tanks and who had worked in the industry for less than ten years. The congener profile indicates that it is likely that these elevated serum dioxin levels were due to exposure to PCP, but exposure must have occurred through work tasks that were not adequately identified by our questionnaire or possibly through environmental PCP exposures. In summary, the findings of the serum dioxin analyses indicate that: (i) as a group, the former timber workers in the morbidity survey had elevated serum dioxin levels compared with workers of the same age who had not been exposed to PCP; (ii) a small group (about 10%) of former timber workers, particularly those who had a longer duration of employment in the industry and/or carried out high risk tasks such as mixing PCP or cleaning sludge from PCP tanks, had the highest serum dioxin levels; (iii) most of the SWAP members fell into the high risk group, but had higher serum dioxin levels than were observed in our random sample of timber workers.
Health outcomes in former New Zealand timber workers exposed to pentachlorophenol (PCP). .
37

Health outcomes in former New Zealand timber workers exposed to pentachlorophenol (PCP). .
38
Overall, our random sample of former timber workers who had worked in the industry for at least ten years and/or carried out high risk tasks, had excess serum dioxin levels (TEQ) of about 14 ppt, which were similar to the excess levels observed in former long-term Paritutu residents; however, the SWAP members had much higher excess serum dioxin levels which were more than double those observed in former long-term Paritutu residents.

References Armitage P, Berry G, Matthews JNS. Statistical methods in medical research. 4th ed. Oxford: Blackwell Science, 2002). Bates MN, Buckland SJ, Ellis KH, et al., (1999). PCDDs and PCDFs in the serum of non-occupationally exposed New Zealand population. Organohalogen compounds 44: 17-21. Bingham AG and Bettany BL. Pentachlorophenol and related wastes in New Zealand. NECAL Service Report S91/327. New Zealand Department of Health 1991. Cassinelli R, Kock K, Steenland K, et al. User documentation PC LTAS. Life table analysis system for use on the PC. www.cdc.gov/niosh/ltdown.html,, 1998. Checkoway H, Pearce NE, Kriebel D. Research methods in occupational epidemiology. 2nd ed. New York: Oxford University Press, 2004. Collins JJ, Budinsky RA, Burns CJ et al. Serum dioxin levels in former chlorophenol workers. J Expo Sci Environ Epidemiol 2006; 16: 76-84. Colosio C, Maroni M, Barcellini W, et al. Toxicological and immune findings in workers exposed to pentachlorophenol (PCP). Arch Environ Health 1993; 48: 81-8 Demers PA, Davies HW, Friesen MC, et al. Cancer and occupational exposure to pentachlorophenol and tetrachlorophenol (Canada). Cancer Causes Control 2006; 17: 749-758. Dimich-Ward H, Hertzman C, Teschke K, et al. Reproductive effects of paternal exposure to chlorophenate wood preservatives in the sawmill industry. Scand J Work Environ Health 1996; 22: 267-73 Enarson DA, Chan-Yeung M, Embree V, et al. Occupational exposures to chlorophenates; Renal, hepatic and other health effects. Scand J Work Environ Health 1986; 12: 144-148 Firestone D, Rees J, Brown NL, et al. Determination of polychlorodibenzo-p-dioxins and related compounds in commercial chlorophenols. J Assoc Anal Chem 1972; 55: 85-92. Gorman D, Monigatti J, Glass B, et al. Assessment of pentachlorophenol-exposed timber workers using a test-of-poisoning model. Int J Occup Environ Health 2001; 7: 189-94. Heacock H, Hogg R, Marion SA, et al. Fertility among a cohort of male sawmill workers exposed to chlorophenate fungicides. Epidemiology 1998; 9: 56-60 Hertzman C, Teschke K, Ostry A, et al. Mortality and cancer incidence among sawmill workers exposed to chlorophenate wood preservatives. Am J Public Health 1997; 87: 71-9. Hogstedt C, Andersson K, Hane M. A questionnaire approach to the monitoring of early disturbances in central nervous system functions. In: Aitio A, Rihimäki V, Vainio H, eds. The biological monitoring of exposure to industrial chemicals. Washington DC: Hemisphere, 1984: 275-87. International Agency for Research on Cancer (IARC) Monographs on the Evaluation of Carcinogenic Risks to Humans. No 53. Occupational exposures in insecticides application, and some pesticides. Lyon: IARC. 1991, pp 371-402. Jappinen P, Pukkala E, Tola S. Cancer incidence of workers in a Finnish sawmill. Scand J Work Environ Health 1989; 15: 18-23. Jorens PG, Schepens PJ. Human pentachlorophenol poisoning. Hum Exp Toxicol 1993; 12: 479-95. Kalliokoski P, Kauppinen T. Complex chlorinated hydrocarbons: occupational exposure in the sawmill industry. IARC Sci Publ. Lyon: IARC, 1990, pp 390-6. Kauppinen T, Lindroos L. Chlorophenol exposure in sawmills. Am Ind Hyg Assoc J 1985; 46: 34-38.
39

40
Kogevinas M, Becher H, Benn T, et al. Cancer mortality in workers exposed to phenoxy herbicides, chlorophenols and dioxins. Am J Epidemiol 1997; 145: 1061-75. Konstas H, Rosenberg C, Pfäffli P, et al. Gas chromatographic-mass spectrometric determination of chlorophenols in the urine of sawmill workers with past use of chlorophenols-containing anti-stain agents. Analyst 1995; 120: 1745-9. Konstas H, Rosenberg C, Tornaeus J, et al. Exposure of workers to 2,3,7,8-substituted polychlorinated Dibenzo-p-dioxin (PCDD) and Dibenzofuran (PCDF) compounds in sawmills previously using chlorophenol-containing antistain agents. Arch Environ Health 1998; 53: 99-108. ‘t Mannetje A, McLean D, Cheng S, et al. Mortality in New Zealand workers exposed to phenoxy herbicides and dioxins. Occup Environ Med 2005; 62: 34-40. McLean D, Pearce N, Colin D, et al. Mortality and cancer incidence in New Zealand pulp and paper mill workers. NZ Med J 2002; 115: 186-90. McLean D, Cheng S, ’t Mannetje A, et al. Mortality and cancer incidence in New Zealand meat workers. Occup Environ Med 2004; 61: 541–7. Mirabelli MC, Hoppin JA, Tolbert PE, et al. Occupational exposure to chlorophenol and the risk of nasal and nasopharyngeal cancers among US men aged 30 to 60. Am J Ind Med 2000; 37: 532-541. New Zealand Forest Service. Statistics of the forests and forest industries of New Zealand to 1983. Nordling Nilson L, Barregård L, Sällsten G, et al. Self-reported symptoms and their effects on cognitive functioning in workers with past exposure to solvent-based glues: an 18-year follow-up. Int Arch Occup Environ Health 2007. DOI 10.1007/s00420-007-0192-1. Pearce N. Effect measures in prevalence studies. Environmental Health Perspectives 2004; 112: 1047-50. Pearce N, Winkelmann R, Kennedy J, et al. Further follow-up of New Zealand participants in United Kingdom atmospheric nuclear weapons tests in the Pacific. Cancer Causes Control 1997; 8: 139–45. Pearce N, Prior I, Methven D, et al. Follow up of New Zealand participants in British atmospheric nuclear weapons tests in the Pacific. BMJ 1990; 300: 1161–6. Phillips DL, Pirkle JL, Burse VW, et al. Chlorinated hydrocarbon levels in human serum: effects of fasting and feeding. Arch Environ Contam Toxicol. 1989: 18; 495-500. Schecter A, Jiang K, Päpke O, et al. Comparison of dibenzodioxin levels in blood and milk in agricultural workers and others following pentachlorophenol exposure in China. Chemosphere 1994; 29 Nos 9-11: 2371-2380. Smith AH, Lopipero P. Evaluation of the toxicity of dioxins and dioxin-like PCBs: A health risk appraisal for the New Zealand population. 2001. A report to the Ministry for the Environment, Wellington, New Zealand. Steenland K, Spaeth S, Cassinelli R, et al. NIOSH life table program for personal computers. Am J Ind Med 1998; 34: 517–18. Van den Berg M, Birnbaum LS, Denison M, et al. Review: The 2005 World Health Organisation re-evaluation of human and mammalian Toxic Equivalency Factors for dioxins and dioxin-like compounds. Toxicol Sci 2006; 93(2): 223-241. Walls CB, Glass WI, Pearce NE. Health effects of occupational pentachlorophenol exposure in timber sawmill employees: a preliminary study. NZ Med J 1998; 111: 362-4. Weiss B. Vulnerability to pesticide neurotoxicity is a lifetime issue. Neurotoxicol 2000; 21: 67-73. WHO. Online WHO Mortality Database. http.//www3.who.int/whosis/. vol. 2003, 2003.
Timber industry workers questionnaire Subject ID Number:
41
Name:
Today’s date:
day month year
Phone number:
E-mail:
Date of birth:
day month year
Gender:
male female
Height: cm
Weight: kg
To which ethnic
group(s) do you European/ Maori Pacific Island Other
Specify:
Name and address of Please record any other GPs

Lifetime Work History
Q1.
Please tell me all the jobs you have held in order from the first job you ever held to the most recent job
ever held.
Interviewer: Please include all jobs that lasted at least 6 months in total. Please start with the first job after leaving school and end with the most recent. The list should be without gaps, meaning that also e.g. unemployed periods or periods taking care of children should be reported here. The last year in the work history should be the year of interview.
Job
Num
ber
Who was your employer? (Name and Location)
Over what period did you work for this employer?
What was the main activity of the company or organisation you worked for? (For example: sheep farming, selling shoes, making clothes)
What department did you work in, and what was your job title?
Name
42
1.
………………… Location ………………….
From: ….…. (year) To: ….…. (year) Total time employed: …………... years
Department: ………………. Job title: ……………….
2. Name ………………… Location ………………….
From: ….…. (year) To: ….…. (year) Total time employed: …………... years
Department: ………………. Job title: ……………….
3.
Name ………………… Location ………………….
From: ….…. (year) To: ….…. (year) Total time employed: …………... years
Department: ………………. Job title: ……………….
4.
Name ………………… Location ………………….
From: ….…. (year) To: ….…. (year) Total time employed: …………... years
Department: ………………. Job title: ……………….

Who was your employer? (Name and Location)
Over what period did you work for this employer?
What was the main activity of the company or organisation you worked for?
What department did you work in, and what was your job title?
5.
Name ………………… Location ………………….
From: ….…. (year) To: ….…. (year) Total time employed: …………... years
Department: ………………. Job title: ……………….
6.
Name ………………… Location ………………….
From: ….…. (year) To: ….…. (year) Total time employed: …………... years
Department: ………………. Job title: ……………….
7.
Name ………………… Location ………………….
From: ….…. (year) To: ….…. (year) Total time employed: …………... years
Department: ………………. Job title: ……………….
8.
Name ………………… Location ………………….
From: ….…. (year) To: ….…. (year) Total time employed: …………... years
Department: ………………. Job title: ……………….
Name ………………… Location ………………….
From: ….…. (year) To: ….…. (year) Total time employed: …………... years
Department: ………………. Job title: ……………….
9.
10.
Name ………………… Location ………………….
From: ….…. (year) To: ….…. (year) Total time employed: …………... years
Department: ………………. Job title: ………………. Interviewer: use add-in if more than 10 jobs
43

Your work in the timber industry
Please answer the following questions about when you worked in the timber industry:
From: To: Q2. Period of employment: (mm) (yy) (mm) (yy)
44
Q3. Number of days worked per week (on average): Days/week
Q4. Number of hours worked per day (on average): Hours/day
Q5. Did you regularly work outside 9-5 o’clock for this job?
No
Yes → If yes, please specify:
Q6. During a normal workday, what % of time did you work outside? %
Q7. What was the name of the company?
Q8. What was the location of the company?
Q9. What was the size of the company? (please give an indication
of the number of employees)
workers
Q10. What types of timber did the sawmill
i ?
Q11. What end-products did the sawmill
d li ?
Q12. In which department did you work?
Q13. What was your job-title?
Q14. Please describe your
tasks:
-what did you do on a normal work day?
-what machines did you use?
-what materials did you use?
-what processes were

Q15. Were you involved in the wood treatment process?
Yes
45
→ go to Q16
No No → If no, please go to Q20
Yes → If yes, describe tasks:
→ How many hours per day were you handling treated wood?
Hours/day
No
→ Were your clothes saturated? Yes
→ What was the wood treated with?
→ Go to Q20 Q16. How many hours a day were you involved in the wood treatment process? Hours/day
Q17. Which of the following were used for wood treatment? (please tick box if used)
Chemical: Method:
Specify
calendar
Hours
per
Creosote/ coal tar Vacuum pressure treatment with hot creosote Immersion/dipping in open tank with cold creosote Immersion/dipping in open tank with hot creosote Brushing Other:
CCA Vacuum pressure impregnation using water solution of CCA (copper chromium arsenic) Other:
PCP Vacuum pressure treatment using hot oil-based PCP (pentachlorophenol) Immersion/dipping in open tank with aqueous solution of NaPCP PCP spray tunnel with aqueous solution of NaPCP Spraying of stacked timber with aqueous spray Other:
FCAP Vacuum pressure treatment (fluor-chrome-arsenic-phenol) Other:
TBTO LOSP – Light Organic Solvent Preservative (tri-n-butyl-tin oxide) Other:
Boron Vapour phase using boron esters Dipping in boron salt solution, stacking and wrapping (=diffusion) Other:
Other: Method:

Q18. Did you mix up the wood treatment chemicals yourself? No → go to next question
46
Yes
→ If yes, which chemicals did
you mix? (please specify if
→ Number of times a week mixing: Times/week
→ Volume of mixed product:
Q19. Did you handle wood that was still wet from treatment?
No → go to next question
Yes → If yes, describe task:
→ How many hours per day did you handle wood
till t f t t t?
Hours/day
No
→ Were your clothes saturated?
Yes
Q20. Did you clean sludge out of the treatment baths?
No
Yes → If yes, how many times a year: Times/year
Q21. Did you do maintenance on the treatment baths?
No
Yes → If yes, how many times a year: Times/year
Q22. Do you remember any accidents with wood treatment chemicals resulting in high exposures?
No → go to next question
Yes → If yes, please describe the accident:
→ When did this occur? year

Q23. What type of ventilation did your work area have? (tick appropriate boxes)
No ventilation Open doors and windows
47
Ventilation fan ducted to outside Air conditioning
Fume hood with fan and air filters Other:
Q24. How effective was the ventilation of your work area? (tick appropriate boxes)
Not at all effective Moderately effective Very effective Don’t know
Q25. Did you wear any protective equipment while at work?
No
Yes → If yes, which ones? For which tasks?
Goggles
footwear
apron
simple dust mask
filter cartridge respirator
air-supplied respirator or SCBA
rubber or plastic gloves
Other
Q26. Did you wear clean working clothes every day?
No Times, per
Yes
→ if no, how often did you change working
clothes for clean working clothes?
Q27. Did you use compressed air jets to clean the work place? No
Yes → If yes, how many times a week? Times per week

48
Q28. In the environment you worked, were any of the following present? (please tick appropriate boxes)
Dust (e.g. coal, metal, wood, insulation material)
Smoke or fume (e.g. combustion products, engine emissions, welding fumes)
Gas (e.g. combustion gases, refrigerant)
Oils and solvents (e.g. lubricants, cutting oils, degreasers, thinners)
Acids or alkalis
Fungicides
Insecticides
Herbicides
Adhesives and glues
Paints, inks or dyes
Q29. If yes to any of the above, please state the names of the substances you were exposed to,
Name of substance Weeks
per year
Hours
per day
Source of substance (during which task did the
exposure occur?)

Questions about your health
Q30. Have you had wheezing or whistling in your chest at any time in the past 12 months?
49
No → If no, go to Q34
Yes
Q31. Have you been at all breathless when the wheeze noise was present?
No
Yes
Q32. Have you had this wheezing or whistling in the chest when you did not have a cold?
No
Yes
Q33. How many attacks of wheezing or whistling have you had in the past 12 months?
None
1-3 times
4-12 times
More than 12 times
Q34. Have you woken up with a feeling of tightness in your chest at any time in the past 12 months?
No
Yes
Q35. Have you been woken by an attack of shortness of breath at any time in the past 12 months?
No
Yes

Q36. Have you been woken by an attack of coughing at any time in the past 12 months?
50
No
Yes
Q37. Have you ever had asthma?
No → If no, go to Q43
Yes
Q38. Was the diagnosis confirmed by a doctor?
No
Yes
Q39. How old were you when you had your first attack of asthma? years
Q40. How old were you when you had your last attack of asthma? years
Q41. Have you had an attack of asthma in the past 12 months?
No
Yes
Q42. Are you currently taking any medicine (including inhalers, aerosols or tablets) for asthma?
No
Yes
Q43. Do you have any nasal allergies including hay fever?
No → If no, go to Q46
Yes

Q44. How old were you when you first had hay fever or a nasal allergy? years
Q45. How old were you when you had hay fever or nasal allergy for the last time? years
Q46. Do you cough almost daily for at least part of the year?
No → If no, go to Q54
51
Yes
Q47. How many months a year do you have this cough? Month(s) a year
Q48. How many consecutive years have you had this cough? Year(s)
Q49. Do you usually have this cough in winter?
No
Yes
Q50. Do you cough up phlegm almost daily for at least part of the year?
No → If no, go to Q54
Yes
Q51. How many months a year do you have this cough (with phlegm)? Month(s) a year
Q52. How many consecutive years have you had this cough (with phlegm)? Year(s)
Q53. Do you usually have this cough (with phlegm) in winter?
No
Yes
Q54. In the past 12 months, how often have you been unable to work because or respiratory symptoms, i.e. cough, phlegm, wheezing/whistling or shortness of breath?
52
Never
1-7 days
8-30 days
At least 31 days
Don’t know
Q55. Have you ever had eczema (or atopic dermatitis)?
No
Yes → If yes, what years did you have eczema? (years)
→ Was the diagnosis confirmed by a doctor? No
Yes
Q56. Have you ever had acne?
No
Yes → If yes, what years did you have acne? (years)
→ Was the diagnosis confirmed by a doctor? No
Yes
Q57. Have you ever had chronic bronchitis?
No
Yes → If yes, what years did you have chronic bronchitis? (years)
→ Was the diagnosis confirmed by a doctor? No
Yes
Q58. Have you ever had Tuberculosis (TB), Pleurisy or Pneumonia?
No
Yes → If yes, what years did you have TB/Pleurisy/Pneumonia? (years)
→ Was the diagnosis confirmed by a doctor? No
Yes

Q59. Have you ever had any other chest condition?
53
No
Yes → If yes, which?
No → Was the diagnosis confirmed by a doctor?
Yes, year:
Q60. Do you have diabetes (sugar)?
No
Yes → If yes, was the diagnosis confirmed by a doctor? No
Yes, year:
Q61. Have you ever had thyroid disorders?
No
Yes → If yes, please specify:
→ Was the diagnosis confirmed by a doctor? No
Yes, year:
Q62. Have you ever had any kidney function problems?
No
Yes → If yes, please specify:
→ Was the diagnosis confirmed by a doctor? No
Yes, year:
Q63. Have you ever had any liver function problems? (such as becoming yellow/jaundiced)
No
Yes → If yes, please specify:
→ Was the diagnosis confirmed by a doctor? No
Yes, year:

Q64. Have you ever had any of the following general, non-specific medical complaints?
54
Unintentional weight loss If so, when? (years)
Unexplained persistent fevers If so, when? (years)
If so, when? (years)
Long lasting and persistent fatigue
which was unrelieved by rest Eye discomfort (reddened and dry eyes) If so, when? (years)
Pins and needles in the hands or feet If so, when? (years)
Numbness in hands or feet If so, when? (years)
Loss of muscle power in hands or feet If so, when? (years)
Recurrent nausea If so, when? (years)
Recurrent diarrhoea If so, when? (years)
Recurrent bowel upsets If so, when? (years)
Q65. Have you ever had any other general, non-specific medical complaints?
No
Yes → If yes, please specify:
Q66. Do you think your symptoms or illness were caused by your work or work environment?
No
Yes → If yes, please specify:
Q67. Please list any medication you are
taking at the moment:
Questions about current symptoms
Q68. Do you currently have any of the following general symptoms that reflect some change to your
thinking ability or your personality? (please tick the appropriate boxes)
Do you have short memory?
55
Do you often have to make notes about what you have to remember?
Do you often have to go back and check things that you have done such as turned off the stove, locked the door, etc.?
Do you generally find it hard to get the meaning from reading newspapers and books?
Do you often have problems concentrating?
Do you often feel depressed without any particular reason?
Are you abnormally tired?
Are you less interested in sex than you think is normal?
Do you have palpitations of the heart even when you don’t exert yourself?
Do you sometimes feel an oppression in your chest?
Do you sweat without any particular reason?
Do you have a headache at least once a week?
Do you often have painful tingling in some parts of your body?
Do you have problems buttoning and unbuttoning?
Are you having trouble sleeping?
Do you find you mood changes frequently without cause?
Do you find that noise bothers you more than in the past?

Questions about lifestyle factors
Q69. Have you ever smoked tobacco?
No → If no, go to Q75
Yes
Q70. What did you smoke? (please tick appropriate boxes)
56
Cigarettes cigars Pipe Other:
Q71. In what year did you start smoking? (year)
Q72. In what year did you stop smoking? (year)
Q73. For how many years did you smoke? Years
Q74. How many do/did you smoke per day? Per day
Q75. During your working life, how often do/did you consume alcohol?
Never
Less then once a month
1-2 times a week
4-5 times a week
Daily
Q76. During a normal week, how much do you consume (total over the whole week)?
Bottles of beer (number)
Glasses of wine (number)
Small glasses of spirits (number)
Thank you!

57
Nurses notes from interview
Nurses notes:
Name: (nurse)
Date:

Permission to contact your general practitioner
58
We may wish to contact your general practitioner with some questions relating to your medical conditions (if it seems appropriate from your answers to this questionnaire). If you are happy with this, please sign (& write) your name and date the form when completed:
Signature: (participant
)
Name: (participant
Date: