Embed Size (px)
Citation preview
Health outcomes and determinants by occupation and industry in Scotland, 2008–2011
Authors: Martin Taulbut, Gerry McCartney

Published by NHS Health Scotland
1 South Gyle CrescentEdinburgh EH12 9EB
© NHS Health Scotland 2017
All rights reserved. Material contained in this publication may not be reproduced in whole or part without prior permission of NHS Health Scotland (or other copyright owners).While every effort is made to ensure that the information given here is accurate, no legal responsibility is accepted for any errors, omissions or misleading statements.
NHS Health Scotland is a WHO Collaborating Centre for Health Promotion and Public Health Development.
This resource may also be made available on request in the following formats:
0131 314 5300

iii
Acknowledgements
The authors would like to thank the Scottish Government Analytical Services (HD)
for their work on deriving occupation and industry variables for use with the Scottish
Health Survey. We would also like to thank Vittal Katikeddi (MRC/CSO Social and
Public Health Sciences Unit, University of Glasgow), Francis Stuart (Oxfam
Scotland), Anna Ritchie Allan (Scottish Trades Union Congress), Craig Kellock
(Scottish Government) and NHS Health Scotland colleagues, especially Lucie Giles
and Rory Mitchell, for their advice and helpful comments throughout this project.
The forest plots presented in Figures 15–20 use tools developed by Neyeloff, Fuchs
and Moreira (2012).1
Formal citation of survey data ScotCen Social Research, University College London. Department of Epidemiology
and Public Health, University of Glasgow. MRC/CSO Social and Public Health
Sciences Unit. (2016). Scottish Health Survey, 2011. [data collection]. 4th Edition.
UK Data Service. SN: 7247.
Office for National Statistics. Social Survey Division. (2015). Annual Population
Survey, January - December, 2010: Special Licence Access. [data collection]. 3rd
Edition. UK Data Service. SN: 6810.

iv
Contents
Executive summary .................................................................................................. 1
Chapter 1: Introduction ............................................................................................ 4
Background and aims .......................................................................................................................... 4
What is known already and what this report adds ............................................................................. 5
Structure of the report ........................................................................................................................ 6
Chapter 2: Methods .................................................................................................. 7
Data sources ........................................................................................................................................ 7
Defining occupations and industries ................................................................................................... 8
Approach ........................................................................................................................................... 11
Chapter 3: Results.................................................................................................. 18
Distribution of the population by occupation and industry ............................................................. 18
Health outcomes ............................................................................................................................... 23
Health behaviours ............................................................................................................................. 37
Workplace stress ............................................................................................................................... 50
Work characteristics ......................................................................................................................... 58
Accounting for differences in health outcomes................................................................................ 67
Classifying occupations and industries by multiple (dis)advantage ................................................. 76
Chapter 4: Discussion ........................................................................................... 78
Summary of findings ......................................................................................................................... 78
Strengths and limitations .................................................................................................................. 79
Implications ....................................................................................................................................... 81
Comparisons with other studies ....................................................................................................... 82
Potential areas for future research ................................................................................................... 84
Concluding remarks .......................................................................................................................... 85
Appendix 1 .............................................................................................................. 86
References .............................................................................................................. 97
1
Executive summary
Introduction This report aims to:
• describe health outcomes, behavioural risk factors, workplace stress and work
characteristics, by occupation and industry, for adults in Scotland aged 16–64
• identify whether or not occupations and industries were independently
associated with differences in self-reported general health and possible mental
health problems, for adults in Scotland aged 16–64, after adjustment for
individual, socioeconomic and lifestyle risk factors
• classify occupations and industries that could be characterised as ‘multiply’
advantaged or disadvantaged by health outcomes and determinants
• summarise the key findings, highlight strengths and limitations and suggest
implications for policy and future research.
Methods
The analysis is based on comparisons of occupations and industries using cross-
sectional data from the Scottish Health Survey,2 Annual Population Survey3/Labour
Force Survey4 and the Annual Survey of Hours and Earnings.5
We used logistic regression to assess the independent association between
occupation/industry on the likelihood of reporting ‘good/very good’ general health and
having a General Health Questionnaire 12 (GHQ-12) score of 4+ (which indicates a
possible mental health problem). Results were adjusted for age, sex, employment
status, educational attainment, living in a low-income household and lifestyle risk
factors (smoking, physical activity, hazardous/harmful alcohol consumption, obesity
and not eating five or more portions of fruit/vegetables a day).
Results
This report confirms the importance of paid, secure employment in improving health,
but also highlights the independent association between household income, health
outcomes, and occupation and industry of employment. It supports the view that
2
inequalities in health are partly driven by inequalities in the labour market. However, it
is important to note that social class, a distinct concept from occupation, may also be
driving these differences at a more fundamental level (through status and power),
although it is not possible to be definitive about this using cross-sectional data.
Professionals and managers are, in general, consistently advantaged, along with
those in protective service occupations, such as police or prison officers (in the latter
case, this is despite high levels of job strain). Those in transport, process, caring,
customer service and elementary occupations appear consistently disadvantaged.
Industries that may cause a health disadvantage to their employees include land
transport, hotels and restaurants, food and beverage manufacturing, and construction.
Industries that may give some health advantage to their workforce include extraction of
petroleum and natural gas, education and (with some challenges around workplace
stress) financial services.
Many of the disadvantaged occupations were independently associated with poorer
self-reported health even after employment status and a range of other factors were
taken into account. Occupation was also independently associated with possible
mental health problems for men but not for women. Land transport remained
significantly associated with poorer self-reported heath, and computer and related
activities, and electrical and electronic manufacturing with poorer mental health, after
adjustment for demographic, socioeconomic and lifestyle factors. It is also important to
note that the following factors emerged as important independent variables: living in a
low-income household, physical activity, smoking and obesity.
There is a gendered dimension as well. In particular, current or previous employment
in professional/managerial occupations does not appear to protect working-age
women’s mental health (as it does for men); while for women, household income is
relatively more important in (creating) good health.

3
Discussion
A key strength of this research is its novel use of Scottish Health Survey data to
present health outcomes and determinants by occupation and industry. However,
there are limitations, which include:
• reliance on self-reported data for health outcomes
• a crude approach to scoring outcomes, behaviours, workplace stress and work
characteristics
• the indicators selected may not capture the relevant concepts adequately
• findings are restricted to a point in time, and to Scotland only.
The research suggests a number of policy implications:
• more support for measures that increase the number of people in sustainable,
paid employment that protect against poverty
• a continued focus on measures that increase household incomes (by increasing
money coming in and reducing unfair costs and the poverty premiums) over and
above increasing the employment rate
• continued support for effective interventions to reduce lifestyle risk factors,
especially smoking, obesity and lack of physical activity
more detailed consideration of the health challenges for specific occupations
and industries.
Consideration could be given to:
• the extent to which growth sector industries promote improved health and
reduced health inequalities
• ensuring that demand-side measures to increase the availability of work also
take the quality of employment into account.
Adverse health outcomes and determinants associated with occupations and
industries are not inevitable. The information in this report can be used to increase the
prospects of ‘good work for all’ – with all the human, social and economic benefits that
it would bring.

4
Chapter 1: Introduction
Background and aims This report describes contemporary health outcomes, behaviours and determinants,
by current or most recent occupation and industry of employment, for adults aged 16–
64 years in Scotland. Employment, along with income and education, are key social
determinants of population health and health inequalities.6
In Scotland, health inequalities are widest for adults of working age, especially for
those aged 30–49 years,7 and there is increasing policy interest in the role of work
quality in determining social outcomes.8,9 NHS Health Scotland is undertaking a
programme of research on how the patterning of employment in Scotland affects
health and health inequalities to inform decisions that will help promote good work for
all and a healthier working-age population.
While previous NHS Health Scotland research in this area has focused on inequalities
in the risk of worklessess (focusing on differences in the effective demand for
labour),10 this report broadens the focus to examine inequalities in the health of
working-age adults currently or recently in work. It aims to:
• describe health outcomes, health behaviours and workplace stress by current
or most recent occupation or industry of employment
• describe the quality of work within different industries and occupations using (a
subset of) criteria defined by the Marmot review11
• assess the independent association of occupation and industry on self-reported
general health and possible mental health problems for working-age adults in
Scotland using logistic regression
• identify occupations and industries characterised by multiple
advantages/disadvantages across three domains: health outcomes, health
behaviours and work characteristics.

5
What is known already and what this report adds
There is a large body of literature describing inequalities in health outcomes and
determinants by social class – measures that are typically derived from information
about individuals’ current or most recent job held. The Black report (1980),12 Acheson
enquiry (1998)13 and Marmot review (2010)11 illustrated their arguments by reference
to the Registrar General’s social class, socioeconomic groupings and the National
Statistics Socio-economic Classification (NS-SEC).
Population surveys in Scotland, including the Scottish Health Survey and Scottish
Household Survey, publish analyses of outcomes by these categories and this is very
useful in providing researchers, policy-makers and others with individual-level
information on the extent of socioeconomic inequalities. However, typically, results are
shown at a high level of aggregation. Data on health outcomes by industry of
employment are seldom shown: the exception is reporting on accidents and injuries at
work published by the Health and Safety Executive on a regular basis.
By contrast, policy-makers, employment support services, employers and statutory
institutions* involved in labour market interventions focus on (often quite specific)
occupations and industries. NS-SEC and its predecessors may not provide sufficient
detail for them to identify challenges and prioritise actions. Broad occupational
categories may conceal different challenges within them. For example, in NS-SEC,
routine occupations include both bus and coach drivers, and cleaners and domestics;
small employers and own account workers include both taxi drivers and opticians; and
lower managerial and professionals include both nurses and teachers. Scottish
Government policy also aims to expand seven key sectors14 in order to promote
sustainable economic growth. It would be useful to know the contribution these sectors
could also make to cohesion, solidarity and the reduction of health inequalities, which
are also Scottish Government priorities. Recent work published by Eurofound,15,16
using data from the European Working Conditions Survey17 (EWCS), recognised the
need to be more specific in describing differences by occupation type and industry to
* Such as the Health and Safety Executive (HSE) and UK Commission for Employment and Skills (UKCES).
6
inform policy. This report uses this principle, greater specificity, to help improve
knowledge in this area for Scotland.
A key question is to what extent health outcomes for individuals reflect the
characteristics of their current/most recent occupation or industry of employment,
independent of individual circumstances. These circumstances include not just age,
sex and health behaviours, but also household income and whether or not the
individuals are currently in paid employment. The report attempts to address this
question by examining the independent association of occupation and industry of
employment with self-reported general health and a GHQ-12 score of 4+ (which
indicates a possible mental health problem).
Structure of the report
The report is structured as follows:
• A methods section, outlining the data sources, definitions of occupations and
industries, and the analytical approach.
• A results section, which presents the key findings split by occupation, industry
and (where appropriate) sex. Themes covered include:
o distribution of the population
o health outcomes
o health behaviours
o workplace stress
o work characteristics
o accounting for differences in health outcomes, after adjusting for a number
of other factors
o classifying occupations and industries by multiple (dis)advantage.
• A conclusions section with a section summarising the key findings, strengths
and limitations, and implications.

Chapter 2: Methods
Data sources
Most of the information presented in this report comes from three cross-sectional
population surveys of the Scottish adult population. The main source is the Scottish
Health Survey, which began in 1995 (with follow-up surveys in 1998 and 2003),
before becoming an annual survey in 2008. The design of Scottish Health Survey
currently consists of both a core questionnaire and two modules of questions. The
core questionnaire collects information on health outcomes, determinants and the
characteristics of all respondents every year. The modules include a rotating biennial
module which collects information on selected topics of a subset of respondents
every second year and a biological module to be completed by the remaining subset
of respondents. The biennial module includes questions on workplace psychosocial
stress.
The second main source is the Annual Population Survey, which combines four
quarters of UK Labour Force Survey data on a range of labour market issues (e.g.
employment and unemployment), and has been boosted to produce more robust
results for the regions and local areas of England, Scotland, Wales and Northern
Ireland.
Data on accidents at work are taken from the quarterly Labour Force Survey, as this
question is only asked in the January–March quarter of the survey. Supplementary
data on hourly earnings by occupations and industry are taken from the Annual
Survey of Hours and Earnings, which is drawn from a 1% random sample of
employees jobs registered to Pay As You Earn (PAYE) schemes. Except for a small
number of indicators in which the Scottish sample was not robust, information
presented from the Annual Population Survey, Annual Survey of Hours and Earnings
and Labour Force Survey in this report is for Scotland.
Data on health outcomes and behaviours were pooled from 4 years of the Scottish
Health Survey (2008–11) and were confined to adults aged 16–64 years. Indicators
of workplace stress used combined data from the 2009 and 2011 ‘version A’ module

8
of the Scottish Health Survey, and again was restricted to adults aged 16–64 years.
Labour market data are based on estimates from the January–December 2010
Annual Population Survey. All results shown are based on weighted data.†
Defining occupations and industries
Adult respondents to the Scottish Health Survey are asked if they are: currently in
employment; waiting to take up employment; or have ever been in paid employment.
If they answer yes, they are then asked the name or title of the job.18 This is used to
derive information on the occupation or industry of employment. Based on this
information, the Scottish Health Survey team created two new variables for inclusion
in the data set. These were:
1 Standard Occupational Classification (SOC) 2000,‡ using the two-digit
subcategories.
2 Industry of employment, derived from Standard Industrial Classification (SIC)
codes 1992 and 2003.
Please note that analyses presented for health outcomes and health behaviours
refer to the current or most recent job held (including those currently
inactive/unemployed with a recent work history), but for the workplace stress factors
analyses, only the current job held by respondent is used (including only those
currently in paid employment).
There were 25 occupational categories within the SOC 2000 two-digit subcategories.
While most of the subcategory titles are self-explanatory, note that the most common
† For the Scottish Health Survey, the ‘int08091011_wt’ weight was applied to adjust for differences between responding and non-responding individuals within cooperating households. For analysis of workplace stress module variables, the ‘vera0911wt’ weight was applied to adjust for the fact that the Health Board boost sample interview did not include the version A module. For the APS/Labour Force Survey, results were weighted using the population grossing weight. ‡ A new classification for occupations in the UK, the SOC 2010, was introduced after 2010 and is now used routinely in most labour market data sets (e.g. the Annual Population Survey). The main revisions of note are a tighter definition of managers (with a number of jobs re-classified as professionals) and the movement of midwives and nurses from the associate professional to professional category. For more information, see: www2.warwick.ac.uk/fac/soc/ier/publications/2000/soc2000vol1v5_tcm77-179121.pdf
9
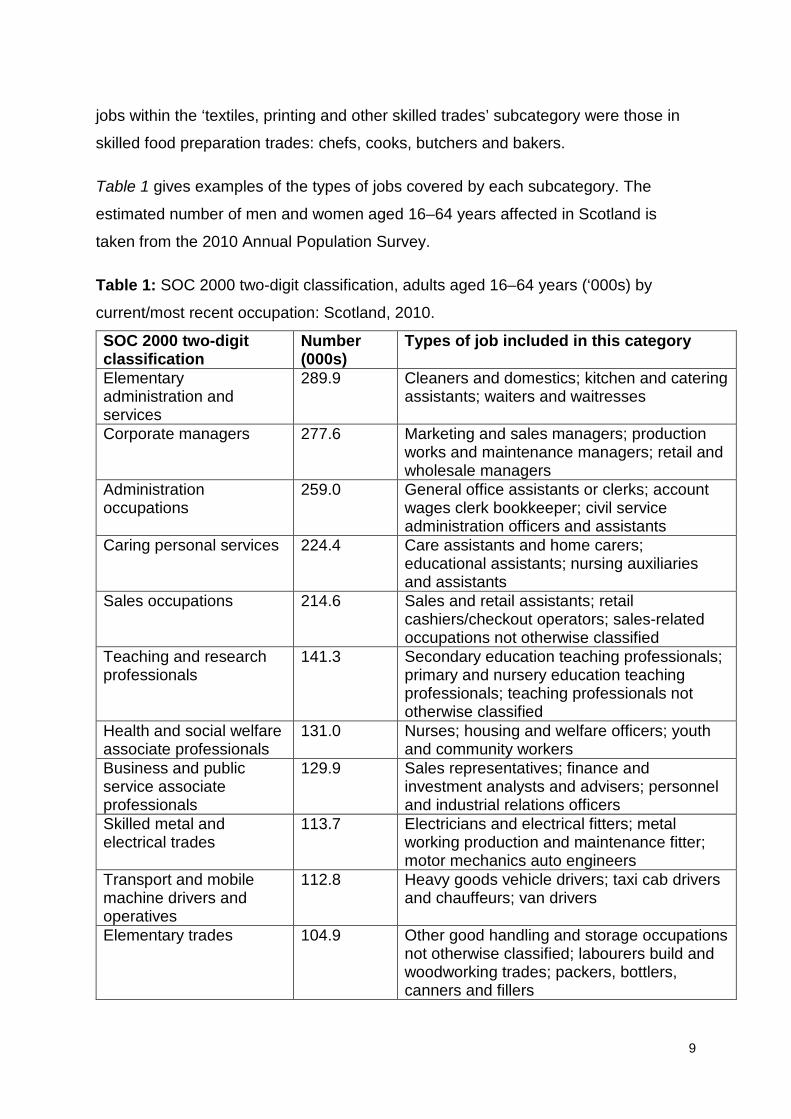
jobs within the ‘textiles, printing and other skilled trades’ subcategory were those in
skilled food preparation trades: chefs, cooks, butchers and bakers.
Table 1 gives examples of the types of jobs covered by each subcategory. The
estimated number of men and women aged 16–64 years affected in Scotland is
taken from the 2010 Annual Population Survey.
Table 1: SOC 2000 two-digit classification, adults aged 16–64 years (‘000s) by
current/most recent occupation: Scotland, 2010.
SOC 2000 two-digit classification
Number (000s)
Types of job included in this category
Elementary administration and services
289.9 Cleaners and domestics; kitchen and catering assistants; waiters and waitresses
Corporate managers 277.6 Marketing and sales managers; production works and maintenance managers; retail and wholesale managers
Administration occupations
259.0 General office assistants or clerks; account wages clerk bookkeeper; civil service administration officers and assistants
Caring personal services 224.4 Care assistants and home carers; educational assistants; nursing auxiliaries and assistants
Sales occupations 214.6 Sales and retail assistants; retail cashiers/checkout operators; sales-related occupations not otherwise classified
Teaching and research professionals
141.3 Secondary education teaching professionals; primary and nursery education teaching professionals; teaching professionals not otherwise classified
Health and social welfare associate professionals
131.0 Nurses; housing and welfare officers; youth and community workers
Business and public service associate professionals
129.9 Sales representatives; finance and investment analysts and advisers; personnel and industrial relations officers
Skilled metal and electrical trades
113.7 Electricians and electrical fitters; metal working production and maintenance fitter; motor mechanics auto engineers
Transport and mobile machine drivers and operatives
112.8 Heavy goods vehicle drivers; taxi cab drivers and chauffeurs; van drivers
Elementary trades 104.9 Other good handling and storage occupations not otherwise classified; labourers build and woodworking trades; packers, bottlers, canners and fillers

10
SOC 2000 two-digit classification
Number (000s)
Types of job included in this category
Process, plant and machine
96.5 Food, drink and tobacco process operator; metal working machine operatives; construction operatives not otherwise classified
Skilled construction and building trades
94.7 Carpenters and joiners; construction trades not otherwise classified; plumbers, heating and ventilating engineers
Science and technology professionals
92.5 Software professionals; IT strategy and planning professionals; engineering professionals not otherwise classified
Business and public service professionals
87.1 Management consultants and actuaries, economists and statisticians; chartered and certified accountants; solicitors and lawyers, judges and coroners
Managers and proprietors in agriculture and services
81.6 Managers and proprietors in other services not otherwise classified; restaurant and catering managers, shopkeepers, wholesale and retail dealers
Textiles, printing and other skilled trades
67.6 Chefs, cooks; furniture makers, other craft woodworkers; butchers, meat cutters
Secretarial occupations 63.0 Personal assists and other secretaries; receptionists; medical secretaries
Customer service occupations
57.6 Customer care occupations; call centre agents and operators
Leisure and other personal services
57.1 Hairdressers, barbers; caretakers; housekeepers and related occupations
Science and technology associate professionals
50.8 IT operations technicians; engineering technicians; IT user support technicians
Culture, media and sport 50.7 Graphic designers; photo and audio-visual equipment operators; sports coaches, instructors and officials
Skilled agricultural trades 39.3 Gardeners and grounds(wo)men; farmers Health professionals 38.7 Medical practitioners; pharmacists and
pharmacologists; dental practitioners Protective services 37.0 Police officers (sergeant and below); non-
commissioned officers; and other ranks; prison serving officers (below principal officers)
Source: Annual Population Survey January–December 2010. Figures include those in
employment and the unemployed/inactive whose previous job was in those occupations.
The industry of employment variable used in this report contains 38 categories,
based on the SIC codes. Some categories were combined to strike a balance
between retaining reasonable sample sizes and presenting results at as fine-grained
11
a level as possible. Note that ‘other business activities’ is a diverse category
containing: a range of professional services (legal, accountancy, architectural and
engineering consultancy); head office and management consultancy; and office and
facilities support (such as security, administration, cleaning and call centres). As for
occupations, the number of men and women aged 16–64 years currently or
previously employed in these industries in Scotland was estimated from the 2010
Annual Population Survey.
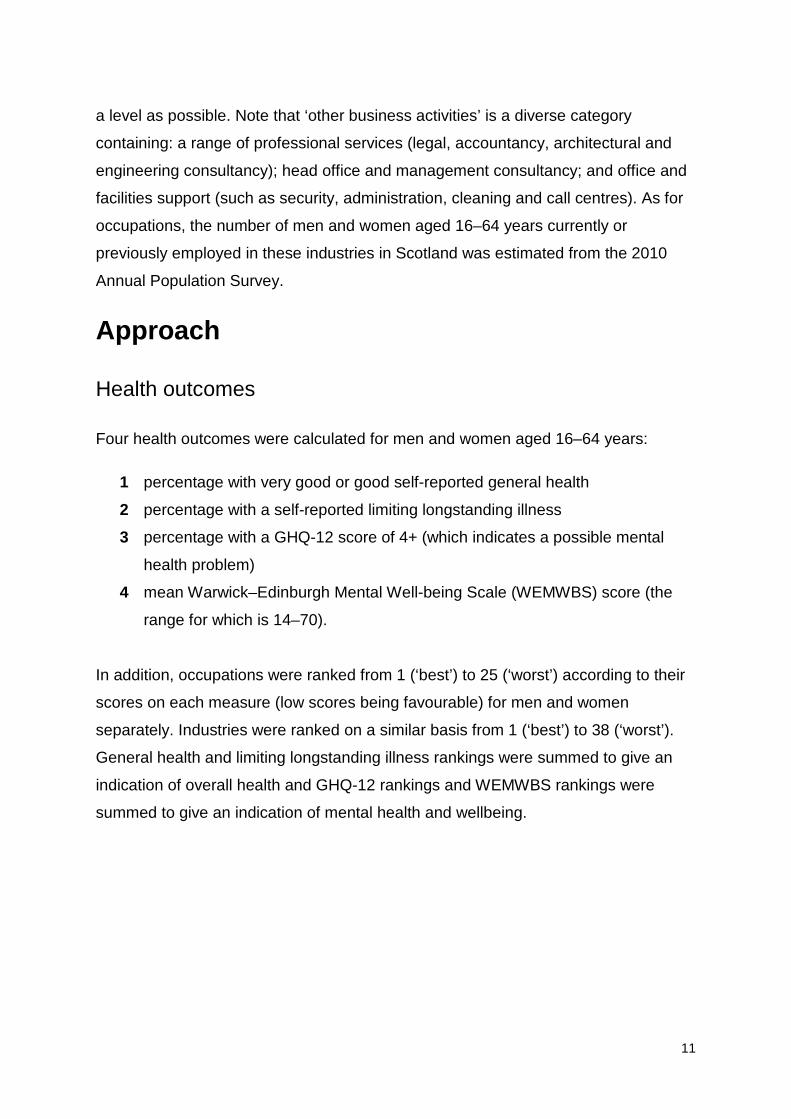
Approach
Health outcomes
Four health outcomes were calculated for men and women aged 16–64 years:
1 percentage with very good or good self-reported general health
2 percentage with a self-reported limiting longstanding illness
3 percentage with a GHQ-12 score of 4+ (which indicates a possible mental
health problem)
4 mean Warwick–Edinburgh Mental Well-being Scale (WEMWBS) score (the
range for which is 14–70).
In addition, occupations were ranked from 1 (‘best’) to 25 (‘worst’) according to their
scores on each measure (low scores being favourable) for men and women
separately. Industries were ranked on a similar basis from 1 (‘best’) to 38 (‘worst’).
General health and limiting longstanding illness rankings were summed to give an
indication of overall health and GHQ-12 rankings and WEMWBS rankings were
summed to give an indication of mental health and wellbeing.
12
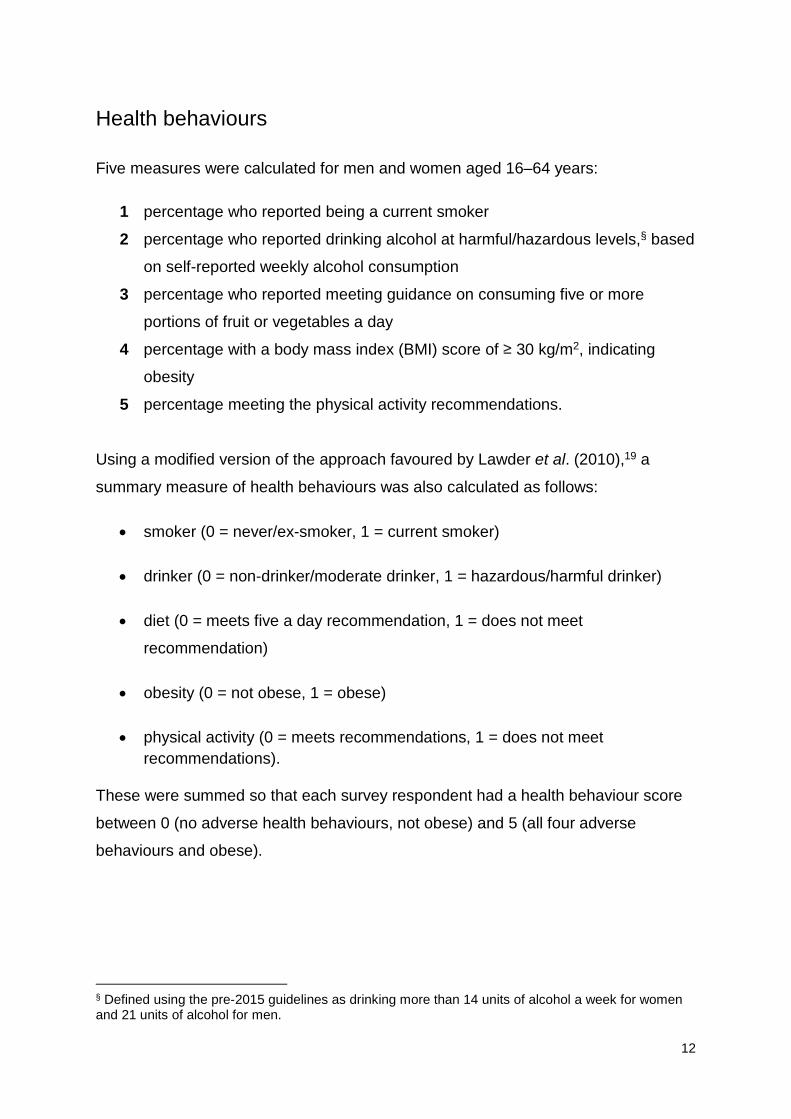
Health behaviours
Five measures were calculated for men and women aged 16–64 years:
1 percentage who reported being a current smoker
2 percentage who reported drinking alcohol at harmful/hazardous levels,§ based
on self-reported weekly alcohol consumption
3 percentage who reported meeting guidance on consuming five or more
portions of fruit or vegetables a day
4 percentage with a body mass index (BMI) score of ≥ 30 kg/m2, indicating
obesity
5 percentage meeting the physical activity recommendations.
Using a modified version of the approach favoured by Lawder et al. (2010),19 a
summary measure of health behaviours was also calculated as follows:
• smoker (0 = never/ex-smoker, 1 = current smoker)
• drinker (0 = non-drinker/moderate drinker, 1 = hazardous/harmful drinker)
• diet (0 = meets five a day recommendation, 1 = does not meet
recommendation)
• obesity (0 = not obese, 1 = obese)
• physical activity (0 = meets recommendations, 1 = does not meet recommendations).
These were summed so that each survey respondent had a health behaviour score
between 0 (no adverse health behaviours, not obese) and 5 (all four adverse
behaviours and obese).
§ Defined using the pre-2015 guidelines as drinking more than 14 units of alcohol a week for women and 21 units of alcohol for men.
13
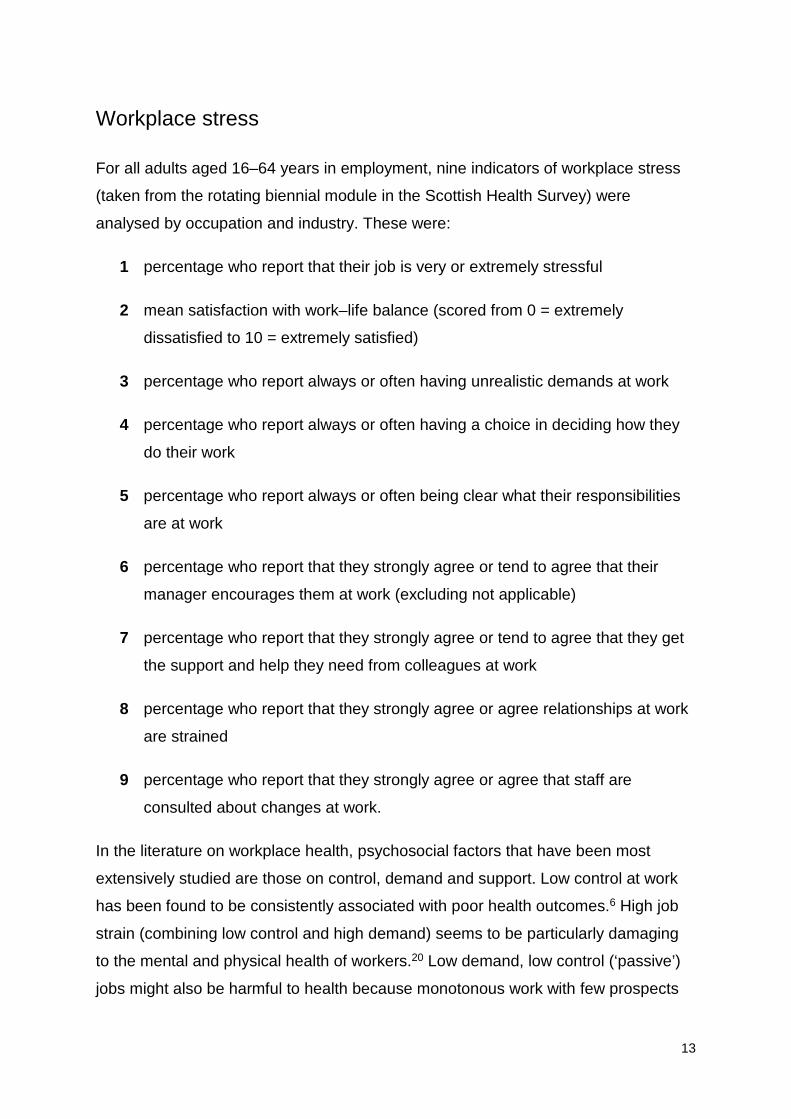
Workplace stress
For all adults aged 16–64 years in employment, nine indicators of workplace stress
(taken from the rotating biennial module in the Scottish Health Survey) were
analysed by occupation and industry. These were:
1 percentage who report that their job is very or extremely stressful
2 mean satisfaction with work–life balance (scored from 0 = extremely
dissatisfied to 10 = extremely satisfied)
3 percentage who report always or often having unrealistic demands at work
4 percentage who report always or often having a choice in deciding how they
do their work
5 percentage who report always or often being clear what their responsibilities
are at work
6 percentage who report that they strongly agree or tend to agree that their
manager encourages them at work (excluding not applicable)
7 percentage who report that they strongly agree or tend to agree that they get
the support and help they need from colleagues at work
8 percentage who report that they strongly agree or agree relationships at work
are strained
9 percentage who report that they strongly agree or agree that staff are
consulted about changes at work.
In the literature on workplace health, psychosocial factors that have been most
extensively studied are those on control, demand and support. Low control at work
has been found to be consistently associated with poor health outcomes.6 High job
strain (combining low control and high demand) seems to be particularly damaging
to the mental and physical health of workers.20 Low demand, low control (‘passive’)
jobs might also be harmful to health because monotonous work with few prospects

14
for advancement has been shown to have a negative impact on workers’ mental
health and wellbeing.21 ‘Active’ jobs are characterised by a combination of high
control and high demand, and ‘low strain’ jobs by high control and low demand: both
of these types of jobs (especially active jobs) may confer some relative health
advantage.
Given the importance of control–demand–support for psychosocial health, we
created charts to divide occupations and industries into low control, high demand
(high job strain); low control, low demand (passive); high control, high demand
(active); and high control, low demand jobs. We also created additional charts to
divide occupations and industries by the level of perceived support received by
managers and colleagues. We made comparisons to discriminate between
occupations and industries by the other measures of workplace stress.
Work characteristics
The following indicators were proposed as reflecting job quality, in line with the
Marmot characteristics. The data source used is shown in brackets after each
indicator:
• Unemployment rate: % of the economically active population aged 16–64
years who were unemployed using the International Labour Organization
(ILO) measure (Annual Population Survey 2010).**
• Hourly pay: median hourly pay for all employees on adult rates whose pay
for the survey pay period was not affected by absence (Annual Survey of
Hours and Earnings 2010).
• Inadequate hours: % of those in employment aged 16–64 years working part
time because they cannot find a full-time job (Annual Population Survey
2010).
** Arguably a better measure of demand would be the number of ILO unemployed relative to the number of unfilled vacancies. However, vacancies data from the Employers Skills Surveys are not currently disaggregated below single-digit SOC and broad industrial sector, so it was not possible to calculate this.
15
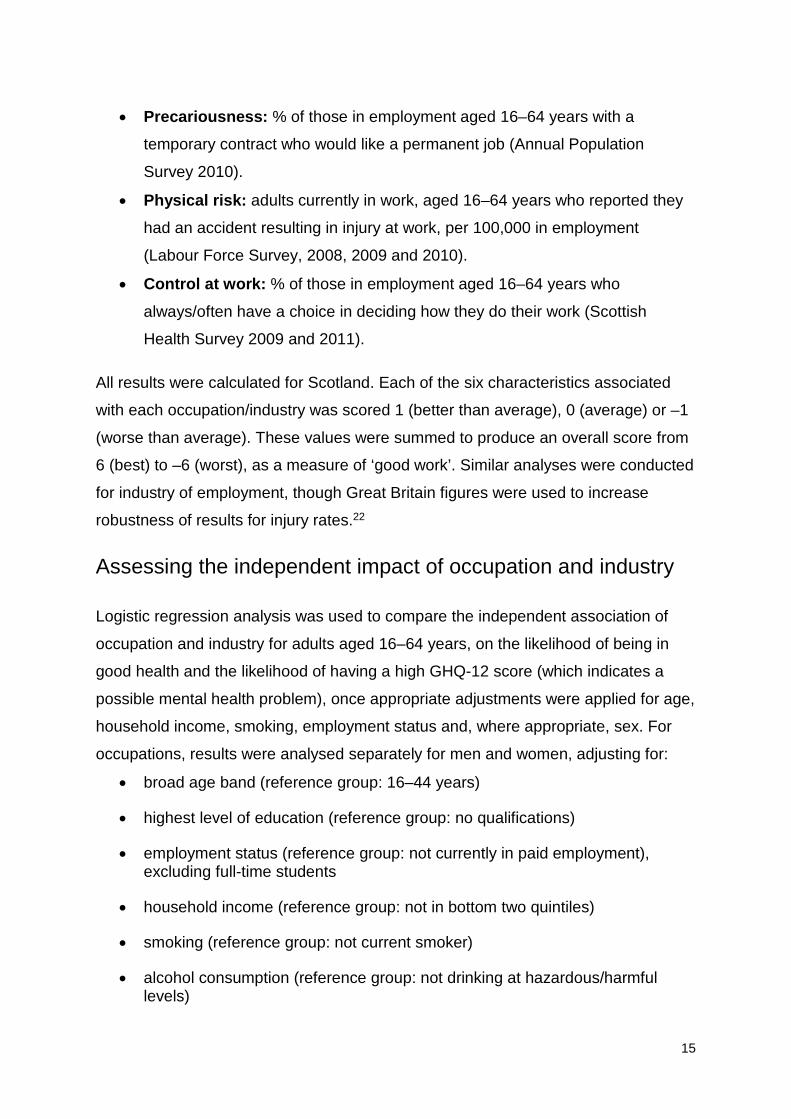
• Precariousness: % of those in employment aged 16–64 years with a
temporary contract who would like a permanent job (Annual Population
Survey 2010).
• Physical risk: adults currently in work, aged 16–64 years who reported they
had an accident resulting in injury at work, per 100,000 in employment
(Labour Force Survey, 2008, 2009 and 2010).
• Control at work: % of those in employment aged 16–64 years who
always/often have a choice in deciding how they do their work (Scottish
Health Survey 2009 and 2011).
All results were calculated for Scotland. Each of the six characteristics associated
with each occupation/industry was scored 1 (better than average), 0 (average) or –1
(worse than average). These values were summed to produce an overall score from
6 (best) to –6 (worst), as a measure of ‘good work’. Similar analyses were conducted
for industry of employment, though Great Britain figures were used to increase
robustness of results for injury rates.22
Assessing the independent impact of occupation and industry
Logistic regression analysis was used to compare the independent association of
occupation and industry for adults aged 16–64 years, on the likelihood of being in
good health and the likelihood of having a high GHQ-12 score (which indicates a
possible mental health problem), once appropriate adjustments were applied for age,
household income, smoking, employment status and, where appropriate, sex. For
occupations, results were analysed separately for men and women, adjusting for:
• broad age band (reference group: 16–44 years)
• highest level of education (reference group: no qualifications)
• employment status (reference group: not currently in paid employment), excluding full-time students
• household income (reference group: not in bottom two quintiles)
• smoking (reference group: not current smoker)
• alcohol consumption (reference group: not drinking at hazardous/harmful levels)

16
• diet (reference group: not eating at least five portions of fruit or vegetables a day)
• obese (reference group: not obese)
physical activity (reference group: not meeting physical activity recommendations).
The socioeconomic variables were selected owing to the importance of income,
employment and education in patterning health inequalities.23 The lifestyle variables
were chosen because of their association with mental health and wellbeing
(especially physical activity, smoking, fruit and vegetable consumption and alcohol
consumption),24 and their association with physical health.25
For industries, regression analysis was run for all adults aged 16–64 years, with sex
included as an independent variable (rather than stratification), along with the other
variables listed above.
Classifying occupations and industries by multiple (dis)advantage
New variables were created as follows:
• A combined measure of general self-reported health and limiting longstanding illness. Respondents scored 1 if their health was good/very
good, 2 if it was fair and 3 if it was bad/very bad. They also scored 1 if they
had no long-term conditions, 2 if they had a long-term condition but it was not
limiting and 3 if they had a limiting long-term condition. These were summed
to give scores from 2–6, with higher scores indicating poorer general and
physical health. A mean score was taken for occupations and industries.
• A combined measure of possible mental health problems and wellbeing. Respondents scored 1 if they had a GHQ-12 score of 0, 2 if they had a GHQ-
12 score of 1–3 and 3 if it was 4+. They also scored 1 if their WEMWBS score
was between 58 and 70, 2 if it was between 42 and 57 and 3 if it was less
than 42. Again, these were summed to give scores from 2–6, with higher
scores indicating poorer mental health. A mean score was taken for
occupations and industries.

17
• The mean number of adverse health behaviours, by occupation and
industry, calculated from the summary measure of health behaviours shown
above.
Occupations and industries were then classified according to their scores in four
areas: general health and limiting longstanding illness; mental health; multiple
adverse health behaviours; and the work characteristics scores shown in Work
characteristics above. They were classified as multiply disadvantaged if they were in
the worst scoring 10 occupations/15 industries, and multiply advantaged if they were
in the best scoring five occupations and eight industries, for at least two areas.
18
Chapter 3: Results
Distribution of the population by occupation and industry
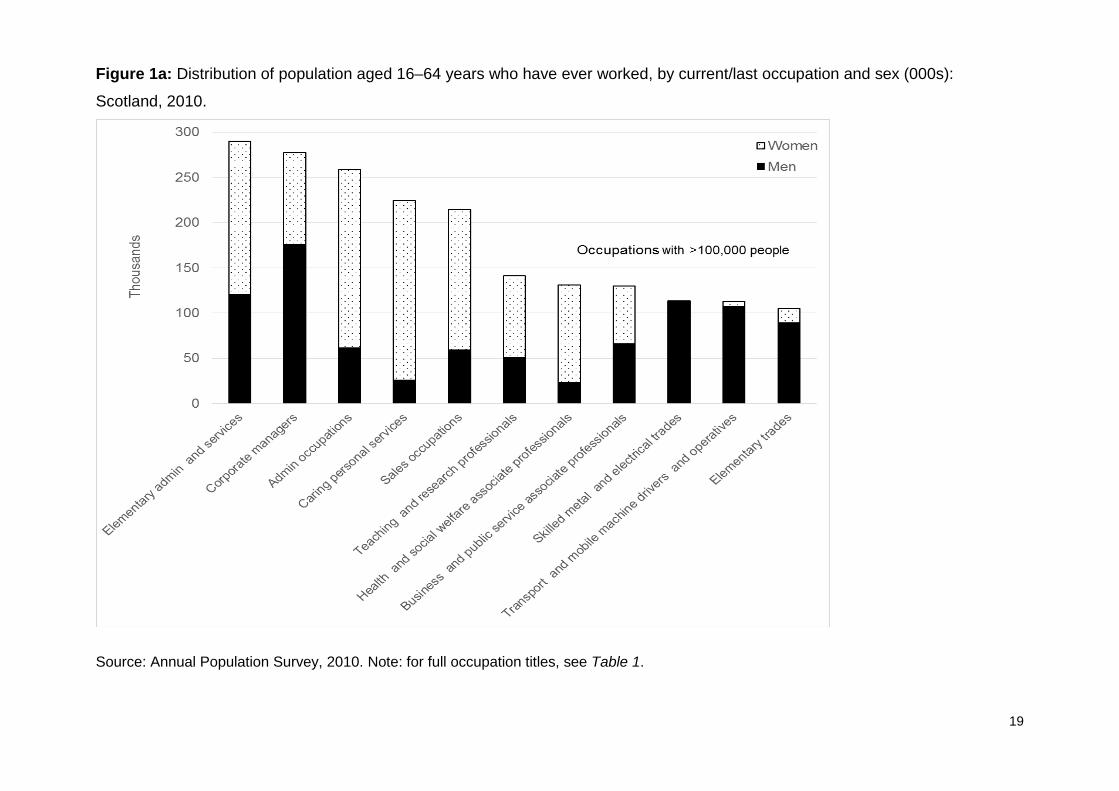
Figure 1 shows the distribution of the population aged 16–64 years who have ever
worked, by current/last occupation and sex, for Scotland in 2010. Two points are
worth noting. First, in 2010, while many adults in Scotland had experience of work in
professional or managerial jobs, a large number were concentrated in occupations
that required few or no formal qualifications, such as sales and elementary
occupations, or that required either sustained physical labour (skilled manual trades)
or a mixture of emotional and physical labour and practical knowledge (caring).
Second, there is a clear sex divide: the most extreme examples are in the skilled
manual trades, transport and mobile machine operative and elementary trades (more
men than women) and secretarial and caring occupations (more women than men).
For men, the largest occupation categories were corporate managers, elementary
administration and services, and skilled metal and electrical trades, while for women
the single largest occupation groups were caring personal services, administration
occupations, sales, and elementary administration and services.
Figure 2 shows the distribution of the population aged 16–64 years who have ever
worked, by current/last industry of employment and sex, for Scotland in 2010. The
largest single industrial sectors were health and social work, retail, education and
other business activities. For both men and women, education, health and social
work, and hotels and restaurants are important sources of employment, though
health and social work is heavily skewed towards women. Construction is the largest
single industrial category for men, with land transport also being important. Financial
services is a relatively more important source of employment for women.
In the next section, health outcomes for each occupation and industry, by sex, are
examined.
19
Figure 1a: Distribution of population aged 16–64 years who have ever worked, by current/last occupation and sex (000s):
Scotland, 2010.
Source: Annual Population Survey, 2010. Note: for full occupation titles, see Table 1.

20
Figure 1b: Distribution of population aged 16–64 years who have ever worked, by current/last occupation and sex (000s):
Scotland, 2010.
Source: Annual Population Survey, 2010. Note: for full occupation titles, see Table 1.

21
Figure 2a: Distribution of population aged 16–64 years who have ever worked, by current/last industry of employment and sex
(000s): Scotland, 2010.
Source: Annual Population Survey, 2010. Note: for full industry titles, see Table 4.

22
Figure 2b: Distribution of population aged 16–64 years who have ever worked, by current/last industry of employment and sex
(000s): Scotland, 2010.
Source: Annual Population Survey, 2010. Note: for full industry titles, see Table 4.
23
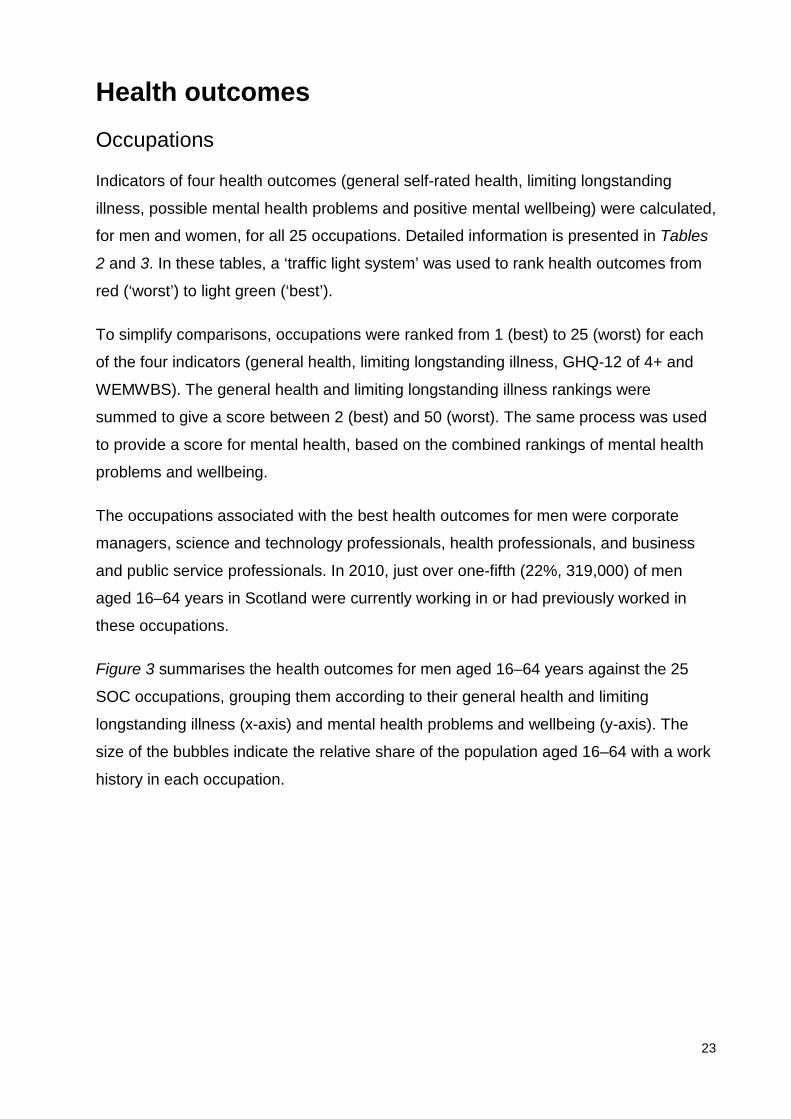
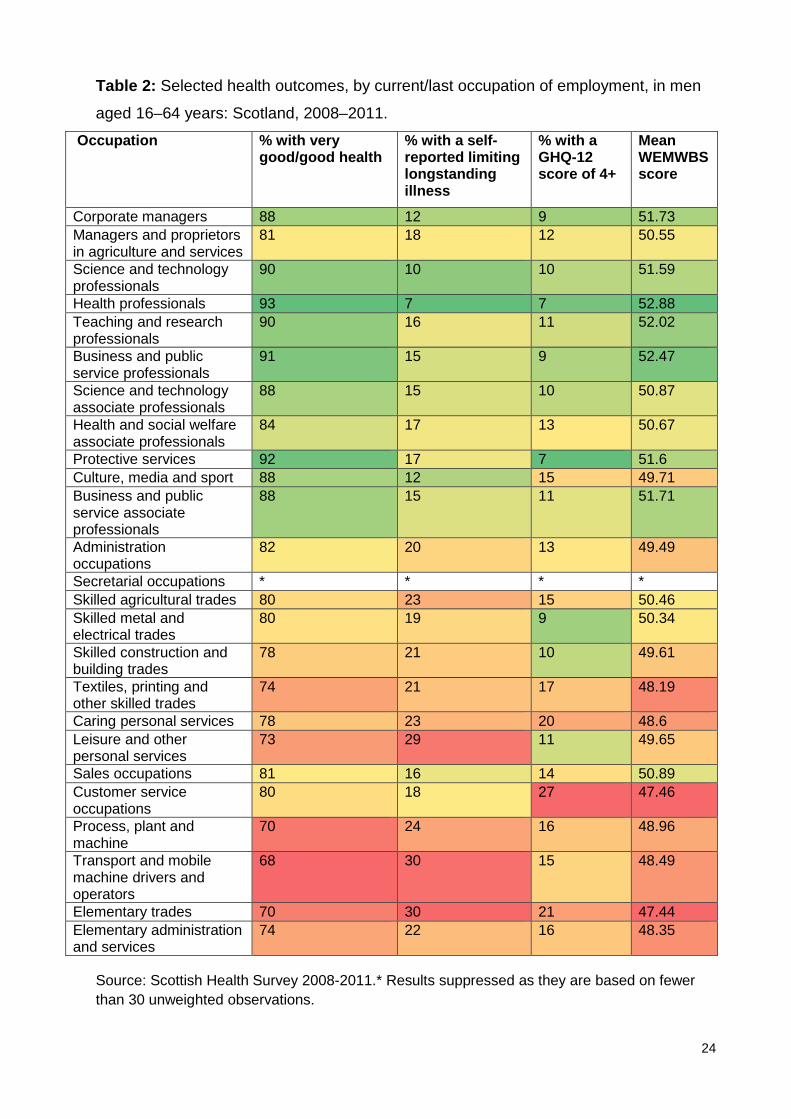
Health outcomes Occupations
Indicators of four health outcomes (general self-rated health, limiting longstanding
illness, possible mental health problems and positive mental wellbeing) were calculated,
for men and women, for all 25 occupations. Detailed information is presented in Tables
2 and 3. In these tables, a ‘traffic light system’ was used to rank health outcomes from
red (‘worst’) to light green (‘best’).
To simplify comparisons, occupations were ranked from 1 (best) to 25 (worst) for each
of the four indicators (general health, limiting longstanding illness, GHQ-12 of 4+ and
WEMWBS). The general health and limiting longstanding illness rankings were
summed to give a score between 2 (best) and 50 (worst). The same process was used
to provide a score for mental health, based on the combined rankings of mental health
problems and wellbeing.
The occupations associated with the best health outcomes for men were corporate
managers, science and technology professionals, health professionals, and business
and public service professionals. In 2010, just over one-fifth (22%, 319,000) of men
aged 16–64 years in Scotland were currently working in or had previously worked in
these occupations.
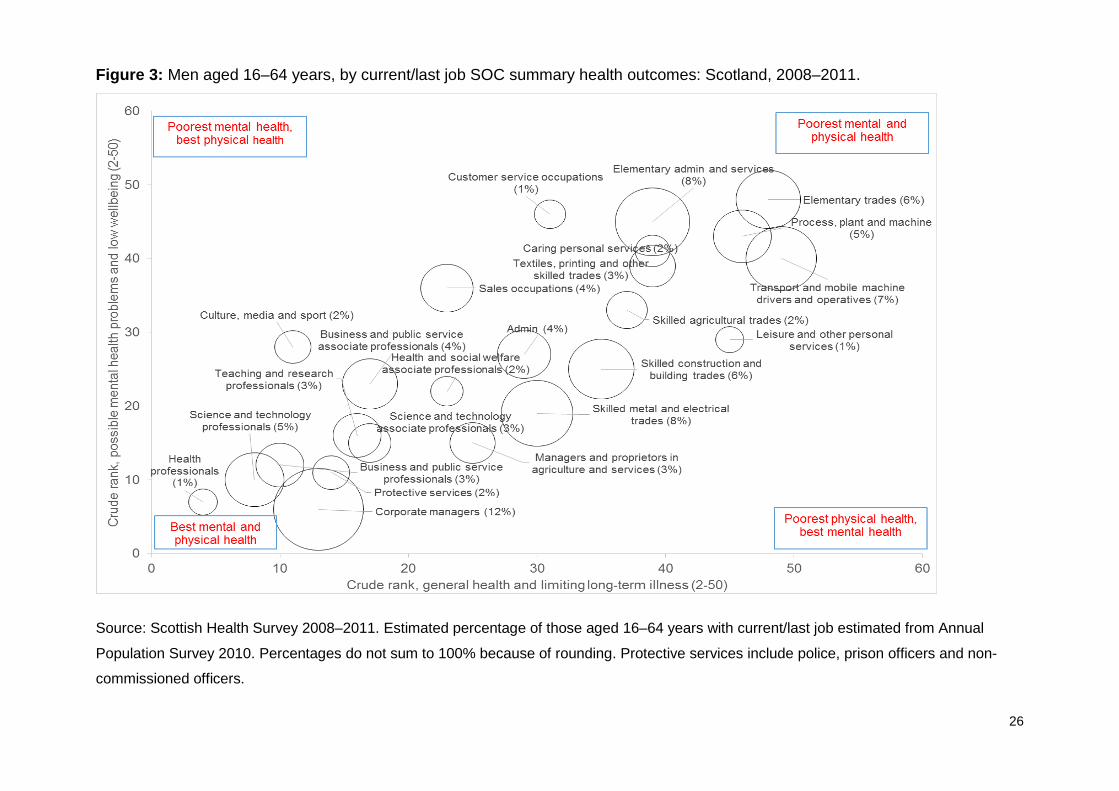
Figure 3 summarises the health outcomes for men aged 16–64 years against the 25
SOC occupations, grouping them according to their general health and limiting
longstanding illness (x-axis) and mental health problems and wellbeing (y-axis). The
size of the bubbles indicate the relative share of the population aged 16–64 with a work
history in each occupation.
24
Table 2: Selected health outcomes, by current/last occupation of employment, in men
aged 16–64 years: Scotland, 2008–2011.
Occupation % with very good/good health
% with a self-reported limiting longstanding illness
% with a GHQ-12 score of 4+
Mean WEMWBS score
Corporate managers 88 12 9 51.73 Managers and proprietors in agriculture and services
81 18 12 50.55
Science and technology professionals
90 10 10 51.59
Health professionals 93 7 7 52.88 Teaching and research professionals
90 16 11 52.02
Business and public service professionals
91 15 9 52.47
Science and technology associate professionals
88 15 10 50.87
Health and social welfare associate professionals
84 17 13 50.67
Protective services 92 17 7 51.6 Culture, media and sport 88 12 15 49.71 Business and public service associate professionals
88 15 11 51.71
Administration occupations
82 20 13 49.49
Secretarial occupations * * * * Skilled agricultural trades 80 23 15 50.46 Skilled metal and electrical trades
80 19 9 50.34
Skilled construction and building trades
78 21 10 49.61
Textiles, printing and other skilled trades
74 21 17 48.19
Caring personal services 78 23 20 48.6 Leisure and other personal services
73 29 11 49.65
Sales occupations 81 16 14 50.89 Customer service occupations
80 18 27 47.46
Process, plant and machine
70 24 16 48.96
Transport and mobile machine drivers and operators
68 30 15 48.49
Elementary trades 70 30 21 47.44 Elementary administration and services
74 22 16 48.35
Source: Scottish Health Survey 2008-2011.* Results suppressed as they are based on fewer than 30 unweighted observations.

25
Table 3: Selected health outcomes, by current/last occupation of employment, women
aged 16–64: Scotland, 2008–2011.
Occupation % with very good/good health
% with a self-reported limiting longstanding illness
% with a GHQ-12 score of 4+
Mean WEMWBS score
Corporate managers 88 17 16 51.09 Managers and proprietors in agriculture and services
79 17 15 50.92
Science and technology professionals
94 10 15 51.47
Health professionals 88 12 16 53.03 Teaching and research professionals
89 17 14 52.52
Business and public service professionals
87 16 18 51.57
Science and technology associate professionals
84 26 20 49.16
Health and social welfare associate professionals
87 20 14 51.62
Protective services 89 14 17 50.4 Culture, media and sport 83 22 15 51.17 Business and public service associate professionals
90 18 17 50.79
Administration occupations
83 21 15 49.89
Secretarial occupations 83 20 17 50.06 Skilled agricultural trades 77 35 13 52.59 Skilled metal and electrical trades
* * * *
Skilled construction and building trades
* * * *
Textiles, printing and other skilled trades
71 29 21 47.5
Caring personal services 77 25 18 49.12 Leisure and other personal services
79 21 18 50.1
Sales occupations 78 22 20 48.62 Customer service occupations
74 27 23 47.9
Process, plant and machine
52 47 22 45.69
Transport and mobile machine drivers and operators
65 35 29 45.81
Elementary trades 71 29 25 45.93 Elementary administration and services
69 30 21 47.59
Source: Scottish Health Survey 2008-2011. * Results suppressed as they are based on fewer
than 30 unweighted observations.
26
Figure 3: Men aged 16–64 years, by current/last job SOC summary health outcomes: Scotland, 2008–2011.
Source: Scottish Health Survey 2008–2011. Estimated percentage of those aged 16–64 years with current/last job estimated from Annual
Population Survey 2010. Percentages do not sum to 100% because of rounding. Protective services include police, prison officers and non-
commissioned officers.

27
The occupation type associated with the worst health for men was elementary trades. More
than 1 in 20 (6%, 89,000) men aged 16–64 years in Scotland in 2010 were currently
working, or had previously worked, in these occupations. Process, plant and machine
operatives, transport and mobile machine drivers and operatives, and elementary
administration and service occupations were also identified as risky for men in terms of their
health outcomes. In 2010, 300,000 men aged 16–64 years in Scotland (>20%) were
currently working in or had previously worked in these occupations.
Figure 4 summarises the four health outcomes for women against the 25 SOC occupations.
The occupation types associated with the best health for women was teaching and research
professionals, while health outcomes for health professionals were also very good. More
than 112,000 women (8%) were currently working in or had previously worked in these two
occupation types in Scotland in 2010.
While no occupations scored unfavourably on all four outcomes, 15% of women aged 16–
64 years (215,000) were currently working in or had previously worked in the most risky
occupations, with the majority of these in elementary administration and service
occupations. Women with experience of customer service occupations and caring
occupations (accounting for 16% of those with a current/previous occupation in 2010, most
of whom with experience in caring occupations) were also less likely to assess their health
as very good or good. For both men and women, jobs with poor mental health also tended
to have poor physical health, with little deviation from this pattern.

28
Figure 4: Women aged 16–64 years, by current/last job SOC summary health outcomes: Scotland, 2008–2011.
Source: Scottish Health Survey 2008-2011. Estimated percentage of those aged 16–64 years with current/last job estimated from Annual
Population Survey 2010. Percentages do not sum to 100% because of rounding. Protective services include police, prison officers and non-
commissioned officers.

29
Industries
Figure 5 summarises the four health outcomes for men against 36 industries,
grouping them according to their general health and limiting longstanding illness (x-
axis) and mental health problems and wellbeing (y-axis) in the same way as for
occupations. The size of the bubbles indicate the relative share of the population
aged 16–64 years with a work history in each industry. Detailed information on the
four health outcomes for men, for all 36 industries, is presented in Table 4.
The industries associated with the best health outcomes for men were: education;
electricity, gas and water; extraction of petroleum and natural gas; and recreational,
cultural and sporting activities. In 2010, one in 10 (10%, 150,000) men aged 16–64
years in Scotland were currently working in or had previously worked in these
occupations.
In the same year, almost four in 10 men in Scotland aged 16–64 years (37%,
536,600) were currently working in or had previously worked in an industry with
relatively favourable health outcomes. The largest sectors identified in this category
were retail, public administration, education and financial services.
Just under a quarter of men (24%, 349,300) were currently working in or had
previously worked in an industry with relatively poor health, with the largest
industries affected being construction, land transport, manufacture of basic and
fabricated metals, and post and telecoms. For men, the most risky industries in
terms of health outcomes were land transport, sewage and waste disposal and
textiles.

30
Figure 5: Men aged 16–64 years, by current/last SIC summary health outcomes: Scotland, 2008–2011.
Source: Scottish Health Survey 2008–2011. Estimated percentage of those aged 16–64 years with current/last job estimated from Annual
Population Survey 2010. Percentages do not sum to 100% because of rounding.

31
Table 4: Selected health outcomes, by current/last industry, men aged 16–64 years:
Scotland, 2008–2011.
Health outcome % with very good/good health
% with a self-reported limiting longstanding illness
% with a GHQ-12 score of 4+
Mean WEMWBS score
Activities of membership organisations not elsewhere classified
84 22 14 52.06
Agriculture and fishing 82 19 13 49.86 Computer and related activities
86 13 20 50.99
Construction 75 24 13 49.73 Education 88 18 10 51.29 Electrical and electronic manufacturing
76 26 24 48.63
Electricity, gas and water 84 17 11 51.73 Extra territorial organisations and bodies
* * * *
Extraction of petroleum and natural gas
84 17 5 50.69
Financial services 88 15 14 50.45 Forestry, logging and related service activities
89 11 17 51.32
Health and social work 81 19 15 49.96 Hotels and restaurants 78 20 14 49.50 Land transport 66 28 16 47.73 Manufacture of basic and fabricated metals
75 18 19 48.51
Manufacture of chemicals and chemical products
86 11 10 49.65
Manufacture of food products and beverages
76 21 17 49.14
Manufacture of machinery or equipment not otherwise classified
77 16 6 50.95
Manufacture of rubber, plastic, non-metallic minerals
81 21 12 48.95
Manufacturing of wood and paper products
80 19 5 51.23
Mining; manufacture of minerals; waste
78 21 15 49.81
Motor vehicles and other transport equipment
79 23 14 49.28
Other business activities 82 19 13 50.23 Other manufacturing 75 18 13 49.87 Other service activities 76 33 12 52.11

32
Health outcome % with very good/good health
% with a self-reported limiting longstanding illness
% with a GHQ-12 score of 4+
Mean WEMWBS score
Post and telecoms 77 18 14 48.50
Private households with employed persons
* * * *
Public administration and defence; compulsory social security
84 20 11 50.64
Publishing, printing and reproduction of recorded media
86 23 10 49.64
Real estate and renting 83 19 13 49.79 Recreational, cultural and sporting activities
86 14 13 50.55
Research and development
* * * *
Retail 81 14 15 50.30 Sales and retail of motor vehicles; repair of motor vehicles; retail sale of automobiles
82 19 8 50.24
Sewage and refuse disposal
62 31 9 47.76
Supporting and aux transport activities (including warehousing); travel agencies
80 19 17 49.27
Textiles manufacturing 70 27 20 47.75 Water and air transport 80 23 7 50.40 Wholesale trades 80 24 10 50.30
Source: Scottish Health Survey 2008-2011. * Results suppressed as they are based on
fewer than 30 unweighted observations.
Men with work experience in the construction industry were less likely to assess their
general health as good or very good, and more likely to report they had a
longstanding illness.
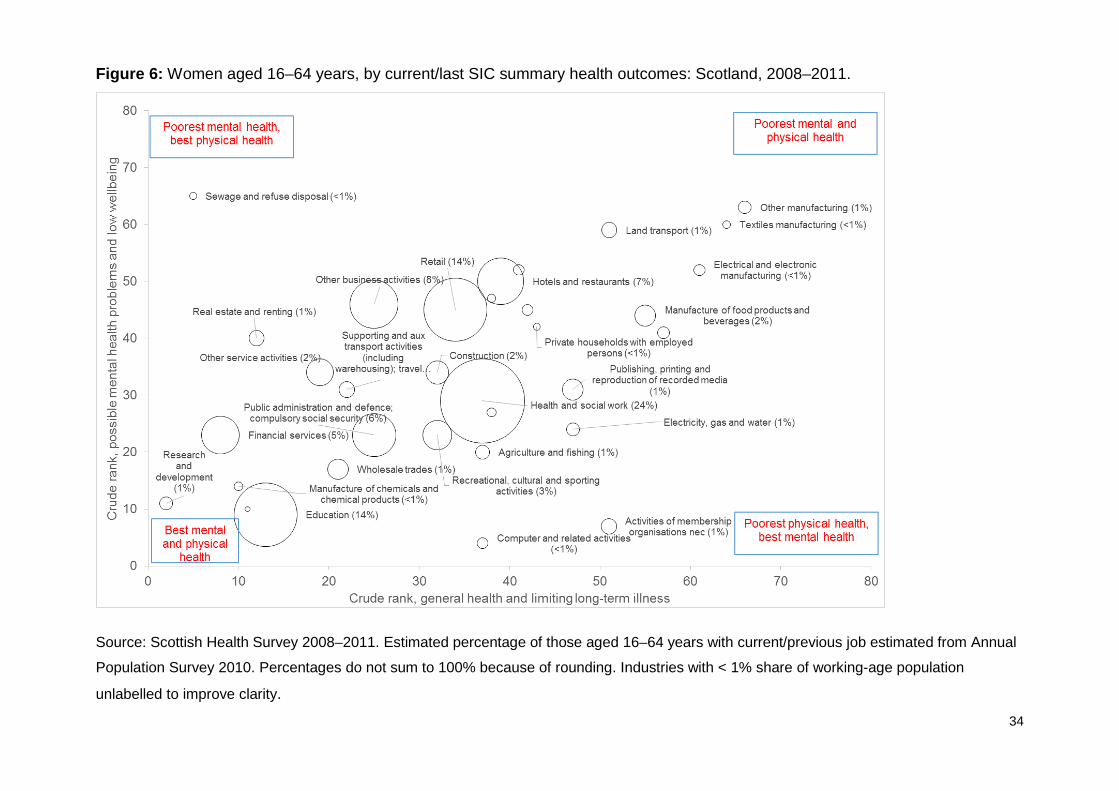
Results are presented for women in Figure 6 and Table 5. Almost a third (28%,
397,900) of women aged 16–64 years in 2010 were currently working in or had
previously worked in an industry with relatively good health outcomes. The largest
sectors in this group were education (good physical and general health and low
33
mental health problems), public administration (good general health) and financial
services.
In 2010, one in five women aged 16–64 years in Scotland (20%, 282,000) were
currently working in or had previously worked in an industry with more adverse
health outcomes, though the pattern is slightly different than for men. The largest
industries affected for women were other business activities (poor mental health),
hotels and restaurants (poor general health) and manufacture of food products and
beverages (poor general health, high limiting longstanding illness and low wellbeing).
Land transport and other manufacturing also have poor health outcomes, though
fewer women work in these sectors compared with men.
It is notable that the mental and physical health outcomes are closely correlated for
men and women using the occupational categories (i.e. occupations associated with
worse physical health are also those associated with worse mental health), but this is
less pronounced for the industrial categories. For example, among men working in
construction, retail and computer-related activities there are very similar mental
health outcomes but very wide range of physical health outcomes (with worse
physical health in construction but better for retail- and computer-related activities).
34
Figure 6: Women aged 16–64 years, by current/last SIC summary health outcomes: Scotland, 2008–2011.
Source: Scottish Health Survey 2008–2011. Estimated percentage of those aged 16–64 years with current/previous job estimated from Annual
Population Survey 2010. Percentages do not sum to 100% because of rounding. Industries with < 1% share of working-age population
unlabelled to improve clarity.
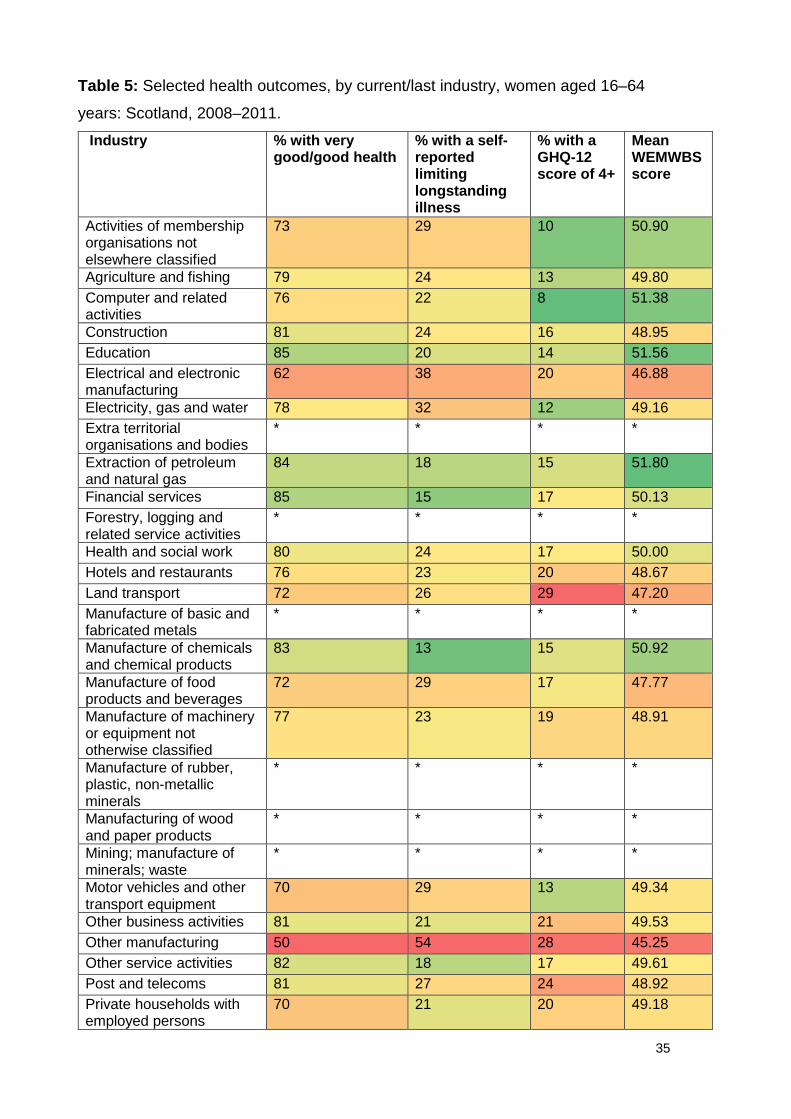
35
Table 5: Selected health outcomes, by current/last industry, women aged 16–64
years: Scotland, 2008–2011.
Industry % with very good/good health
% with a self-reported limiting longstanding illness
% with a GHQ-12 score of 4+
Mean WEMWBS score
Activities of membership organisations not elsewhere classified
73 29 10 50.90
Agriculture and fishing 79 24 13 49.80 Computer and related activities
76 22 8 51.38
Construction 81 24 16 48.95 Education 85 20 14 51.56 Electrical and electronic manufacturing
62 38 20 46.88
Electricity, gas and water 78 32 12 49.16 Extra territorial organisations and bodies
* * * *
Extraction of petroleum and natural gas
84 18 15 51.80
Financial services 85 15 17 50.13 Forestry, logging and related service activities
* * * *
Health and social work 80 24 17 50.00 Hotels and restaurants 76 23 20 48.67 Land transport 72 26 29 47.20 Manufacture of basic and fabricated metals
* * * *
Manufacture of chemicals and chemical products
83 13 15 50.92
Manufacture of food products and beverages
72 29 17 47.77
Manufacture of machinery or equipment not otherwise classified
77 23 19 48.91
Manufacture of rubber, plastic, non-metallic minerals
* * * *
Manufacturing of wood and paper products
* * * *
Mining; manufacture of minerals; waste
* * * *
Motor vehicles and other transport equipment
70 29 13 49.34
Other business activities 81 21 21 49.53 Other manufacturing 50 54 28 45.25 Other service activities 82 18 17 49.61 Post and telecoms 81 27 24 48.92 Private households with employed persons
70 21 20 49.18

36
Industry % with very good/good health
% with a self-reported limiting longstanding illness
% with a GHQ-12 score of 4+
Mean WEMWBS score
Public administration and defence; compulsory social security
84 23 16 50.11
Publishing, printing and reproduction of recorded media
78 30 20 50.78
Real estate and renting 84 15 19 49.86 Recreational, cultural and sporting activities
83 24 16 50.12
Research and development
91 12 11 50.51
Retail 78 21 18 48.80 Sales and retail of motor vehicles; repair of motor vehicles; retail sale of automobiles
73 38 15 46.72
Sewage and refuse disposal
* * * *
Supporting and aux transport activities (including warehousing); travel agencies
81 18 17 50.05
Textiles manufacturing 51 46 20 44.63 Water and air transport 76 21 25 49.59 Wholesale trades 83 20 13 50.10
Source: Scottish Health Survey 2008–2011. * Results suppressed as they are based on
fewer than 30 unweighted observations.

37
Health behaviours
Occupations
As described in the methods, five health behaviours (smoking, drinking alcohol at
hazardous/harmful levels, consumption of fewer than five portions of fruit or
vegetables daily, not meeting the physical activity recommendations and being
obese) were examined. Prevalence rates were calculated for each indicator
separately, for all occupations and industries, split by sex.
A summary variable was also created based on the distribution of multiple adverse
health behaviours within each occupation and industry: from 0, where none of the
exposures was present, to 5, where all were present. In common with previous
studies, nearly the whole sample (94%) had at least one exposure. Lower risk was
defined as those with 0–1 exposures and higher risk as those with 4–5 exposures.
Based on the distributions of these simple classifications, lower-risk occupations for
men are health and teaching professionals, skilled agricultural trades, culture,
media and sport associate professionals, plus protective services (such as police or
prison officers). Men with current or recent experience in customer service
occupations, transport and mobile machine operative, and process, plant and
machine occupations appear to be highest risk (Figure 7).
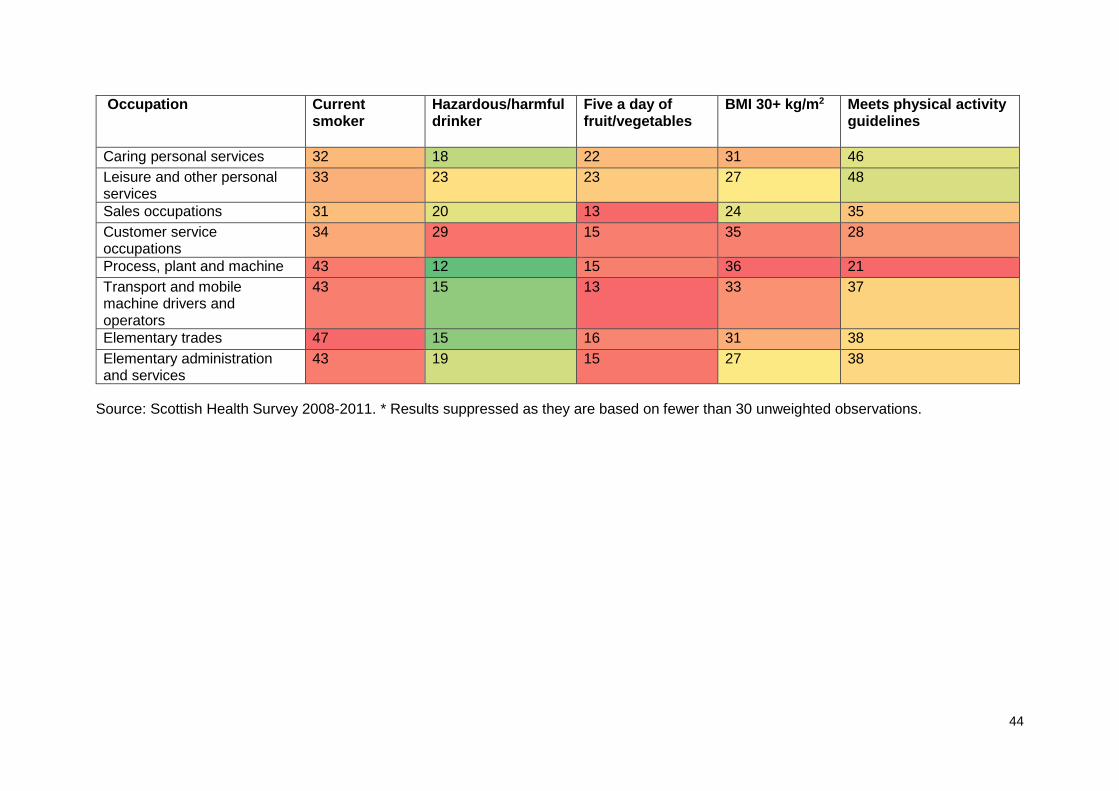
For women, the least risky occupations (in terms of health behaviours and obesity)
were also the professions and skilled agricultural trades: health professionals and
protective service occupations were among the ‘healthiest’ occupations. At the
other end of the spectrum, women with a labour market background in process
plant and machine occupations, customer service or elementary administration and
services were at higher risk.

38
Figure 7: Number of risk factors, by current/last occupation of employment, men aged 16–64 years: Scotland, 2008–2011.
Source: Scottish Health Survey 2008–2011. Note: for full occupation titles, see Table 1.

39
Figure 8: Number of risk factors, by current/last occupation of employment, women aged 16–64 years: Scotland, 2008–2011.
Source: Scottish Health Survey 2008–2011. Note: for full occupation titles, see Table 1.

40
The prevalence of individual health behaviours and obesity by occupation is shown
in more detail in Table 6. They show a mixed pattern. Men with experience of
customer service occupations compare poorly on almost all indicators except
obesity; females with experience of customer service occupations compare poorly
on all of the indicators. While professionals and managers compare favourably on
smoking and diet, consumption of hazardous or harmful levels of alcohol may be an
issue for managers and some professionals (especially science and technology
associate professionals and those in culture, media and sport occupations).
Process, transport and elementary occupations are among the riskiest occupations,
though reported risky alcohol consumption is low for these groups except for men in
elementary trades. For administration/secretarial occupations the challenges may
be around low levels of physical activity and obesity, while for skilled manual trades (outside agriculture) they reflect above-average levels of smoking, alcohol
consumption and poor diet.
Industries
The distribution of risk factors was calculated for industries in the same way as for
occupations. Figure 9 shows results for men aged 16–64 years. The ‘riskiest’
industries were land transport, sewage and refuse disposal, and other service
activities. Five industries (forestry, logging and related service activities; activities of
membership organisations not otherwise classified; agriculture and fishing;
recreational, cultural and sporting activities; and education) were less risky in terms
of health behaviours and obesity.
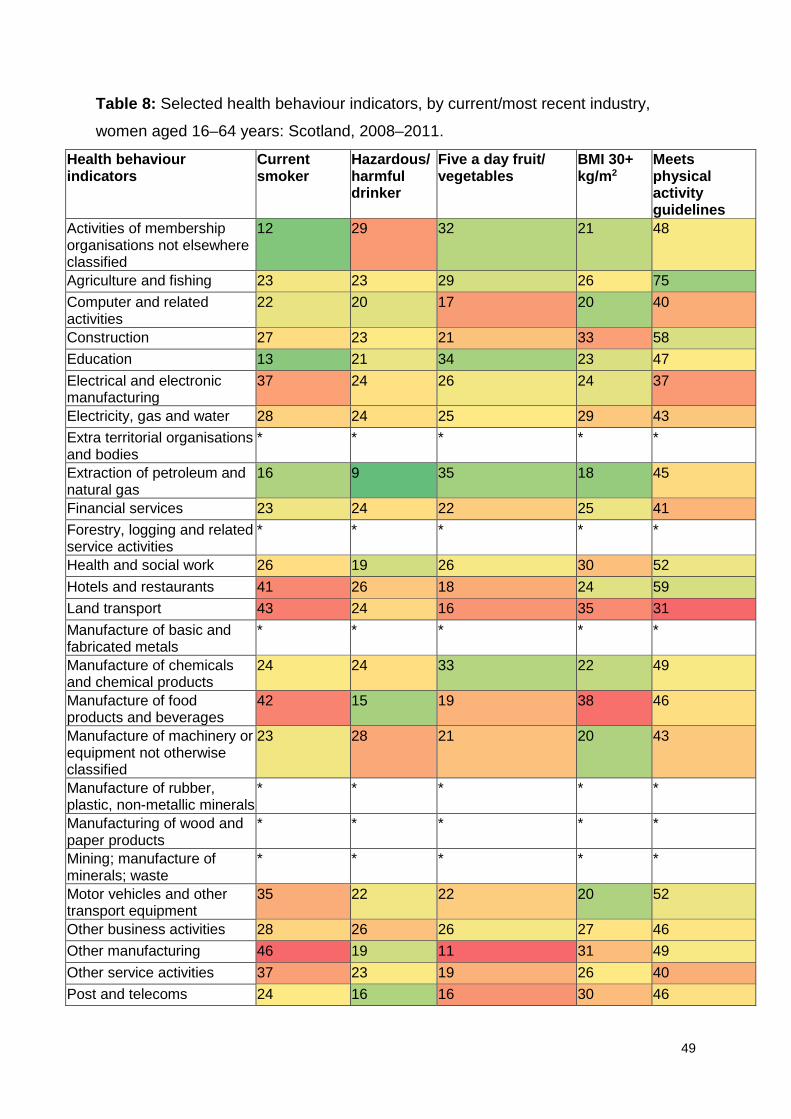
Results for women are shown in Figure 10. They show that lower-risk industries for
women included: extraction of petroleum and natural gas, chemicals manufacturing
and education, while motor vehicles and other transport equipment, other
manufacturing, construction and land transport were much more risky on these
measures.

41
Table 6a: Selected health behaviour indicators, by current/most recent occupation of employment, men aged 16–64 years:
Scotland, 2008–2011.
Occupation Current smoker Hazardous/harmful drinker
Five a day of fruit/vegetables
BMI 30+ kg/m2 Meets physical activity guidelines
Corporate managers 16 30 26 34 43 Managers and proprietors in agriculture and services
26 33 20 28 54
Science and technology professionals
13 26 26 27 42
Health professionals 11 25 46 18 49 Teaching and research professionals
10 32 38 23 46
Business and public service professionals
10 29 31 29 50
Science and technology associate professionals
21 37 19 27 37
Health and social welfare associate professionals
26 24 29 27 56
Protective services 13 28 18 24 70 Culture, media and sport 18 32 33 24 63 Business and public service associate professionals
18 27 24 32 44
Administration occupations
20 23 18 26 43
Secretarial occupations * * * * * Skilled agricultural trades 29 23 21 22 74 Skilled metal and electrical trades
31 32 16 29 50

42
Occupation Current smoker Hazardous/harmful drinker
Five a day of fruit/vegetables
BMI 30+ kg/m2 Meets physical activity guidelines
Skilled construction and building trades
35 35 17 24 69
Textiles, printing and other skilled trades
45 28 22 27 57
Caring personal services 36 26 18 29 55 Leisure and other personal services
27 30 22 28 50
Sales occupations 33 26 18 19 48 Customer service occupations
39 41 11 13 31
Process, plant and machine
38 32 16 30 50
Transport and mobile machine drivers and operators
39 25 16 39 34
Elementary trades 50 31 12 22 58 Elementary administration and services
39 26 16 20 54
Source: Scottish Health Survey 2008-2011. * Results suppressed as they are based on fewer than 30 unweighted observations.

43
Table 6b: Selected health behaviour indicators, by current/most recent occupation of employment, women aged 16–64 years:
Scotland, 2008–2011.
Occupation Current smoker
Hazardous/harmful drinker
Five a day of fruit/vegetables
BMI 30+ kg/m2 Meets physical activity guidelines
Corporate managers 23 29 27 26 41 Managers and proprietors in agriculture and services
33 30 27 28 42
Science and technology professionals
13 23 35 14 45
Health professionals 5 18 53 10 49 Teaching and research professionals
8 24 42 21 44
Business and public service professionals
14 24 35 25 40
Science and technology associate professionals
14 25 36 32 33
Health and social welfare associate professionals
16 21 34 27 48
Protective services 22 17 32 6 62 Culture, media and sport 15 28 36 14 51 Business and public service associate professionals
18 23 29 19 39
Administration occupations 22 22 23 31 31 Secretarial occupations 19 24 26 30 34 Skilled agricultural trades 16 19 45 17 70 Skilled metal and electrical trades
* * * * *
Skilled construction and building trades
* * * * *
Textiles, printing and other skilled trades
37 20 22 36 35
44
Occupation Current smoker
Hazardous/harmful drinker
Five a day of fruit/vegetables
BMI 30+ kg/m2 Meets physical activity guidelines
Caring personal services 32 18 22 31 46 Leisure and other personal services
33 23 23 27 48
Sales occupations 31 20 13 24 35 Customer service occupations
34 29 15 35 28
Process, plant and machine 43 12 15 36 21 Transport and mobile machine drivers and operators
43 15 13 33 37
Elementary trades 47 15 16 31 38 Elementary administration and services
43 19 15 27 38
Source: Scottish Health Survey 2008-2011. * Results suppressed as they are based on fewer than 30 unweighted observations.

45
Figure 9: Number of risk factors, by current/most recent industry of employment, men aged 16–64 years: Scotland, 2008–2011.
Source: Scottish Health Survey 2008–2011. Note: for full industry titles, see Table 4.

46
Figure 10: Number of risk factors, by current/most recent industry of employment, women aged 16–64 years: Scotland, 2008–2011.
Source: Scottish Health Survey 2008–2011. Note: for full industry titles, see Table 4.
Detailed analyses of health behaviours and obesity, by industry and sex, are shown in Tables 7 and 8.

47
Table 7: Selected health behaviour indicators, by current/most recent industry, men
aged 16–64: Scotland, 2008–2011.
Health behaviour indicators
Current smoker
Hazardous/harmful drinker
Five a day fruit/ vegetables
BMI 30+ kg/m2
Meets physical activity guidelines
Activities of membership organisations not elsewhere classified
16 13 13 30 48
Agriculture and fishing
30 23 23 25 75
Computer and related activities
17 21 26 24 40
Construction 37 36 16 26 58 Education 16 30 32 22 47 Electrical and electronic manufacturing
26 22 16 25 37
Electricity, gas and water
24 31 24 39 43
Extra territorial organisations and bodies
* * * * *
Extraction of petroleum and natural gas
28 27 29 31 45
Financial services 13 28 24 26 41 Forestry, logging and related service activities
34 9 20 10 87
Health and social work
28 25 26 28 52
Hotels and restaurants
44 34 20 20 59
Land transport 32 26 15 36 31 Manufacture of basic and fabricated metals
34 27 11 32 49
Manufacture of chemicals and chemical products
21 39 20 17 49
Manufacture of food products and beverages
38 32 15 29 46
Manufacture of machinery or equipment not otherwise classified
28 28 19 34 43
Manufacture of rubber, plastic, non-metallic minerals
37 34 11 33 53
Manufacturing of wood and paper products
33 32 22 29 55

48
Health behaviour indicators
Current smoker
Hazardous/harmful drinker
Five a day fruit/ vegetables
BMI 30+ kg/m2
Meets physical activity guidelines
Mining; manufacture of minerals; waste
27 38 20 50 42
Motor vehicles and other transport equipment
30 32 20 39 52
Other business activities
26 28 27 27 46
Other manufacturing 29 26 14 29 49 Other service activities
44 25 16 43 40
Post and telecoms 36 33 15 29 46 Private households with employed persons
* * * * *
Public administration and defence; compulsory social security
15 29 22 30 53
Publishing, printing and reproduction of recorded media
25 41 17 27 41
Real estate and renting
25 23 18 32 55
Recreational, cultural and sporting activities
18 27 25 22 65
Research and development
* * * * *
Retail 32 24 15 22 51 Sales and retail of motor vehicles; repair of motor vehicles; retail sale of automobiles
29 23 11 24 44
Sewage and refuse disposal
39 25 11 39 57
Supporting and aux transport activities (including warehousing); travel agencies
31 29 19 23 47
Textiles manufacturing
27 32 8 21 35
Water and air transport
28 27 20 31 48
Wholesale trades 36 31 17 29 47
Source: Scottish Health Survey 2008–2011. * Results suppressed as they are based on
fewer than 30 unweighted observations.
49
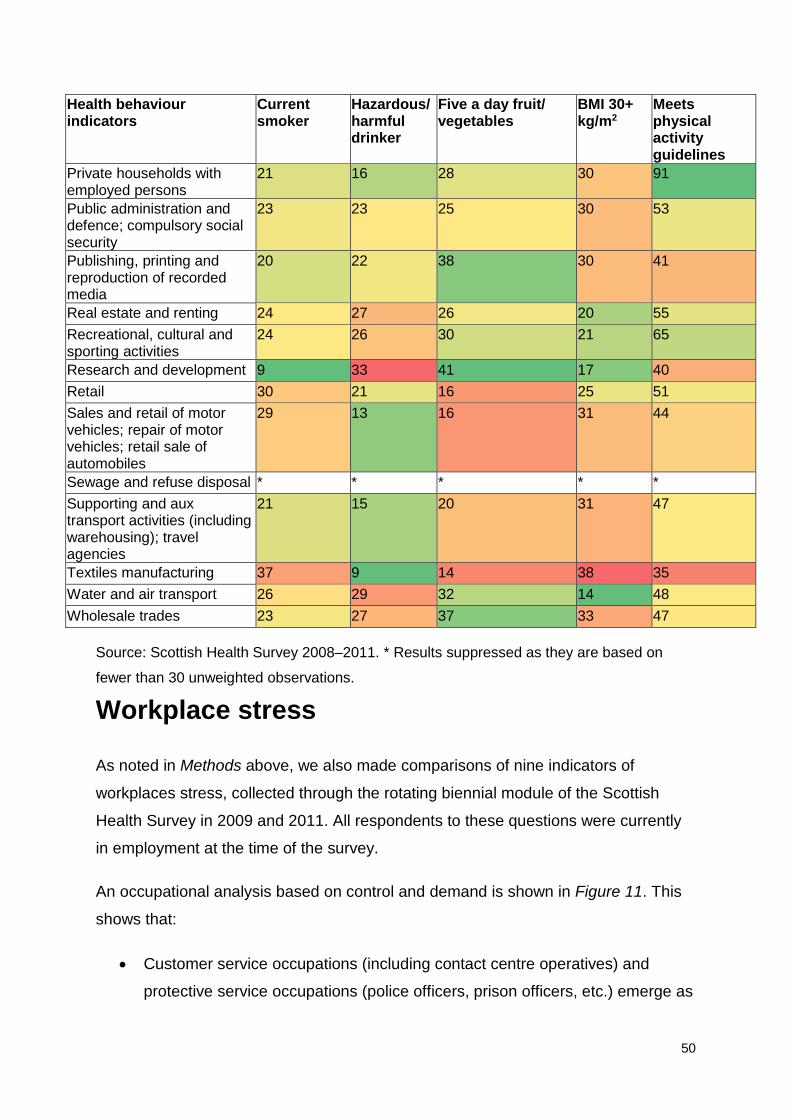
Table 8: Selected health behaviour indicators, by current/most recent industry,
women aged 16–64 years: Scotland, 2008–2011.
Health behaviour indicators
Current smoker
Hazardous/harmful drinker
Five a day fruit/ vegetables
BMI 30+ kg/m2
Meets physical activity guidelines
Activities of membership organisations not elsewhere classified
12 29 32 21 48
Agriculture and fishing 23 23 29 26 75 Computer and related activities
22 20 17 20 40
Construction 27 23 21 33 58 Education 13 21 34 23 47 Electrical and electronic manufacturing
37 24 26 24 37
Electricity, gas and water 28 24 25 29 43 Extra territorial organisations and bodies
* * * * *
Extraction of petroleum and natural gas
16 9 35 18 45
Financial services 23 24 22 25 41 Forestry, logging and related service activities
* * * * *
Health and social work 26 19 26 30 52 Hotels and restaurants 41 26 18 24 59 Land transport 43 24 16 35 31 Manufacture of basic and fabricated metals
* * * * *
Manufacture of chemicals and chemical products
24 24 33 22 49
Manufacture of food products and beverages
42 15 19 38 46
Manufacture of machinery or equipment not otherwise classified
23 28 21 20 43
Manufacture of rubber, plastic, non-metallic minerals
* * * * *
Manufacturing of wood and paper products
* * * * *
Mining; manufacture of minerals; waste
* * * * *
Motor vehicles and other transport equipment
35 22 22 20 52
Other business activities 28 26 26 27 46 Other manufacturing 46 19 11 31 49 Other service activities 37 23 19 26 40 Post and telecoms 24 16 16 30 46
50
Health behaviour indicators
Current smoker
Hazardous/harmful drinker
Five a day fruit/ vegetables
BMI 30+ kg/m2
Meets physical activity guidelines
Private households with employed persons
21 16 28 30 91
Public administration and defence; compulsory social security
23 23 25 30 53
Publishing, printing and reproduction of recorded media
20 22 38 30 41
Real estate and renting 24 27 26 20 55 Recreational, cultural and sporting activities
24 26 30 21 65
Research and development 9 33 41 17 40 Retail 30 21 16 25 51 Sales and retail of motor vehicles; repair of motor vehicles; retail sale of automobiles
29 13 16 31 44
Sewage and refuse disposal * * * * * Supporting and aux transport activities (including warehousing); travel agencies
21 15 20 31 47
Textiles manufacturing 37 9 14 38 35 Water and air transport 26 29 32 14 48 Wholesale trades 23 27 37 33 47
Source: Scottish Health Survey 2008–2011. * Results suppressed as they are based on
fewer than 30 unweighted observations.
Workplace stress
As noted in Methods above, we also made comparisons of nine indicators of
workplaces stress, collected through the rotating biennial module of the Scottish
Health Survey in 2009 and 2011. All respondents to these questions were currently
in employment at the time of the survey.
An occupational analysis based on control and demand is shown in Figure 11. This
shows that:
• Customer service occupations (including contact centre operatives) and
protective service occupations (police officers, prison officers, etc.) emerge as
51
having the greatest risk of combined ‘high demand, low control’, and thus of
high job strain. These occupations accounted for 3% of people in employment
in Scotland.
• Control at work is lowest for: protective service occupations; caring personal
services occupations; sales and customer service occupations; process, plant
and machine operatives; and elementary occupations.
• Control at work is highest for corporate managers; managers and proprietors
in agriculture and services; business and public service professionals and
associate professionals; culture, media and sports occupations; and textiles,
printing and other skilled trades.
• Elementary administration and service occupations are more likely to be
passive jobs, characterised by ‘low control, low demand’. More people are in
these occupations compared to high job strain occupations, amounting to 9%
of people in employment in Scotland in 2010.
• Corporate manager occupations, accounting for 10% of people in employment
in 2010, are ‘active jobs’, with high levels of demand and high levels of
control.
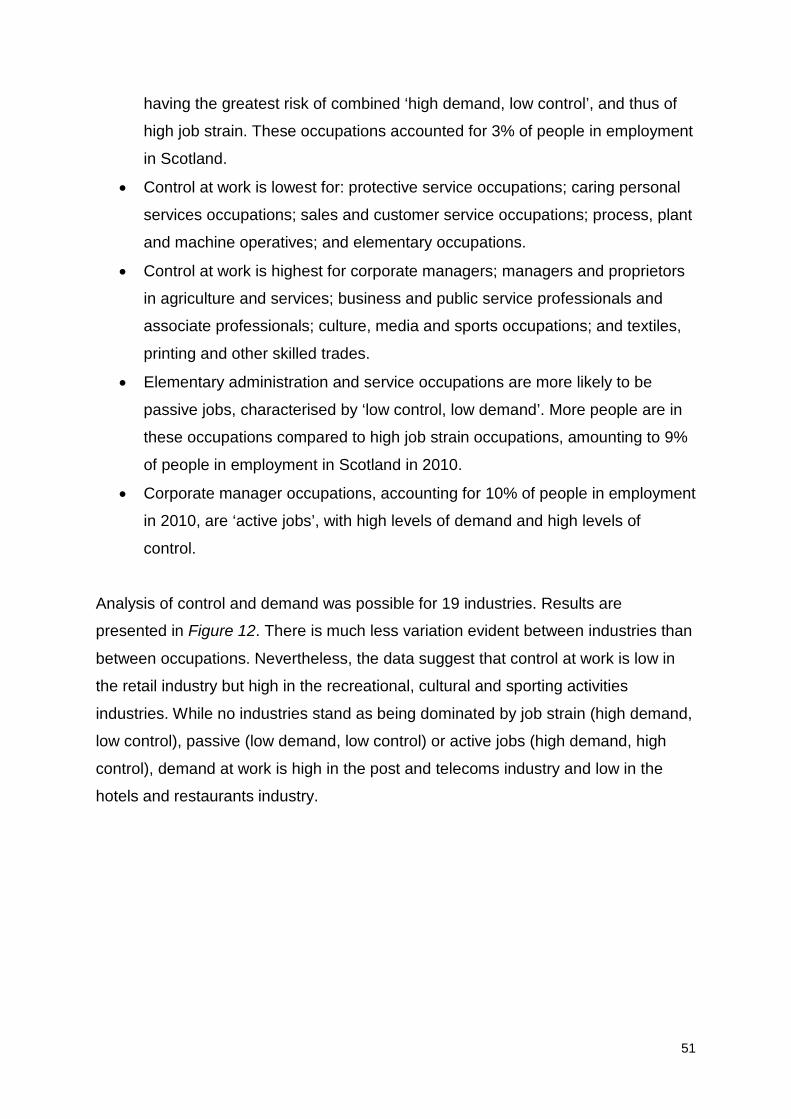
Analysis of control and demand was possible for 19 industries. Results are
presented in Figure 12. There is much less variation evident between industries than
between occupations. Nevertheless, the data suggest that control at work is low in
the retail industry but high in the recreational, cultural and sporting activities
industries. While no industries stand as being dominated by job strain (high demand,
low control), passive (low demand, low control) or active jobs (high demand, high
control), demand at work is high in the post and telecoms industry and low in the
hotels and restaurants industry.

52
Figure 11: Occupations by demand and control classification, all persons aged 16–64 years in employment: Scotland, 2009 and 2011.
Source: Scottish Health Survey 2009 and 2011. Percentages show the share of people in employment in Scotland in each occupation (2010). Red
lines indicate mean for all occupations.
53
Figure 12: Industries by demand and control classification, all persons aged 16–64 years in employment: Scotland, 2009 and 2011.
Source: Scottish Health Survey 2009 and 2011. Percentages show the share of people in employment in Scotland in each industry (2010). Red
lines indicate mean for all industries.

54
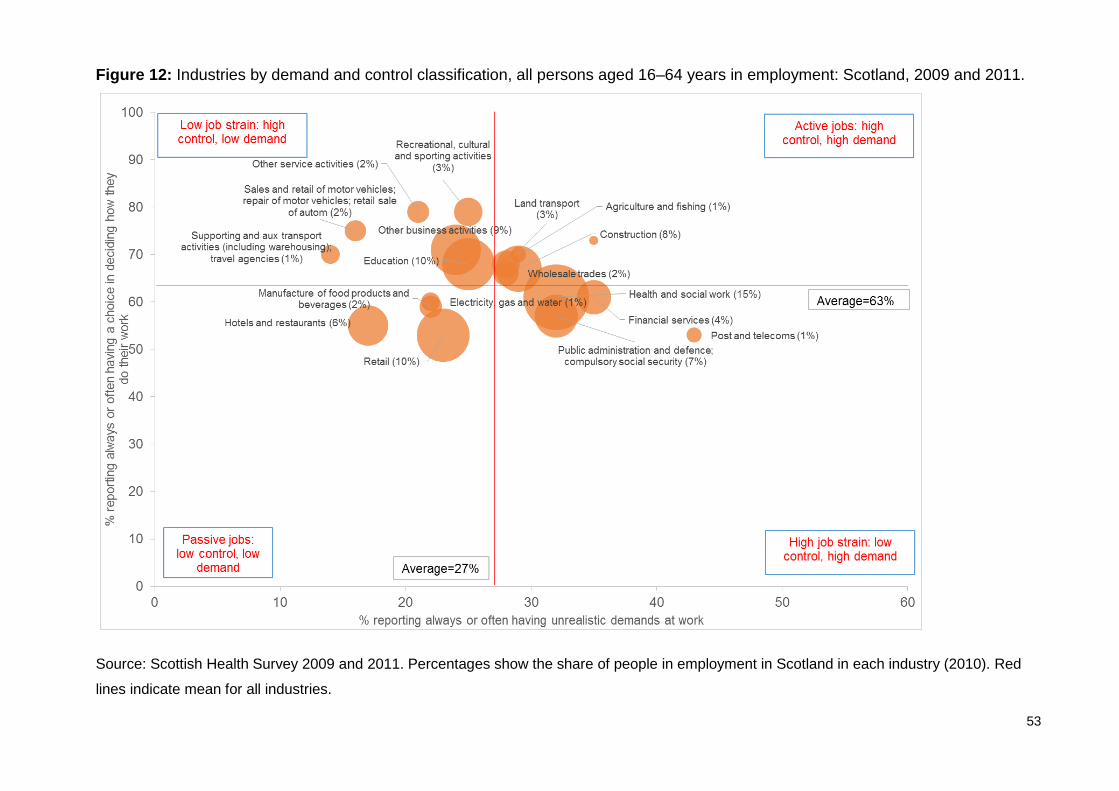
There is also some evidence6 that lack of social support at work is associated with
poorer mental health, though the evidence of its impact on physical health is mixed.
Figure 13 shows occupations in Scotland by reported levels of manager and
colleague support. The key findings are:
• Science and technology professionals, health professionals, and teaching and
research professionals were most likely to agree that their line manager
encouraged them. Transport and mobile machine drivers and operatives
reported very low levels of managerial support.
• In general, people were more likely to agree they received support from
colleagues than from their manager. However, people employed in
elementary trades and skilled construction trades, as well as
manager/proprietors in agriculture and services, were least likely to agree that
their colleagues always/often supported them.
Figure 14 illustrates the equivalent balance between manager and colleague support
by industry. It shows that:
• levels of managerial support are particularly high in education and low in the
land transport industry
• reported levels of colleague support are high in public administration, but low
in both the construction and the sales and retail of motor vehicles industries.
A number of other issues also emerged on the other indicators of workplace stress.
Results by occupation and industry are summarised in Table 9. This shows that:
• corporate managers and those working in wholesale trades were more likely
to have lower levels of satisfaction with their work–life balance
• health and social welfare professionals, business and public service
managers and corporate managers, and those employed in the health and
social work industry, were more likely to report their job was very/extremely
stressful
• people working in skilled metal and electrical trades and in the financial
services industry were less likely to report that their responsibilities at work
were always/often clear

55
• staff consultation about change at work was less common for people working
in protective service occupations, skilled construction trades and transport
and mobile machine operatives, and the land transport industry
• work relationships were more likely to be strained among textiles and other
skilled manual occupations and elementary trades, and in the food and drink
manufacturing industry.
Table 9: Occupations and industries by specific workplace stress challenges:
Scotland, 2009 and 2011.
Challenge Occupation Industry Poor work–life balance
Corporate managers Wholesale trades
Job was very/extremely stressful
Health and social welfare associate professionals; business and public service professionals; corporate managers
Health and social work
Responsibilities at work unclear
Skilled metal and electrical trades Financial services
Less likely to be consulted about change at work
Protective service occupations (police, prison officers); skilled construction; transport and mobile machine operatives
Land transport
Work relationships strained
Textiles and other skilled manual occupations; elementary trades
Manufacture of food products and beverages
Source: Scottish Health Survey 2009 and 2011.
Detailed results on workplace stress measures are shown in Tables A1 and A2.
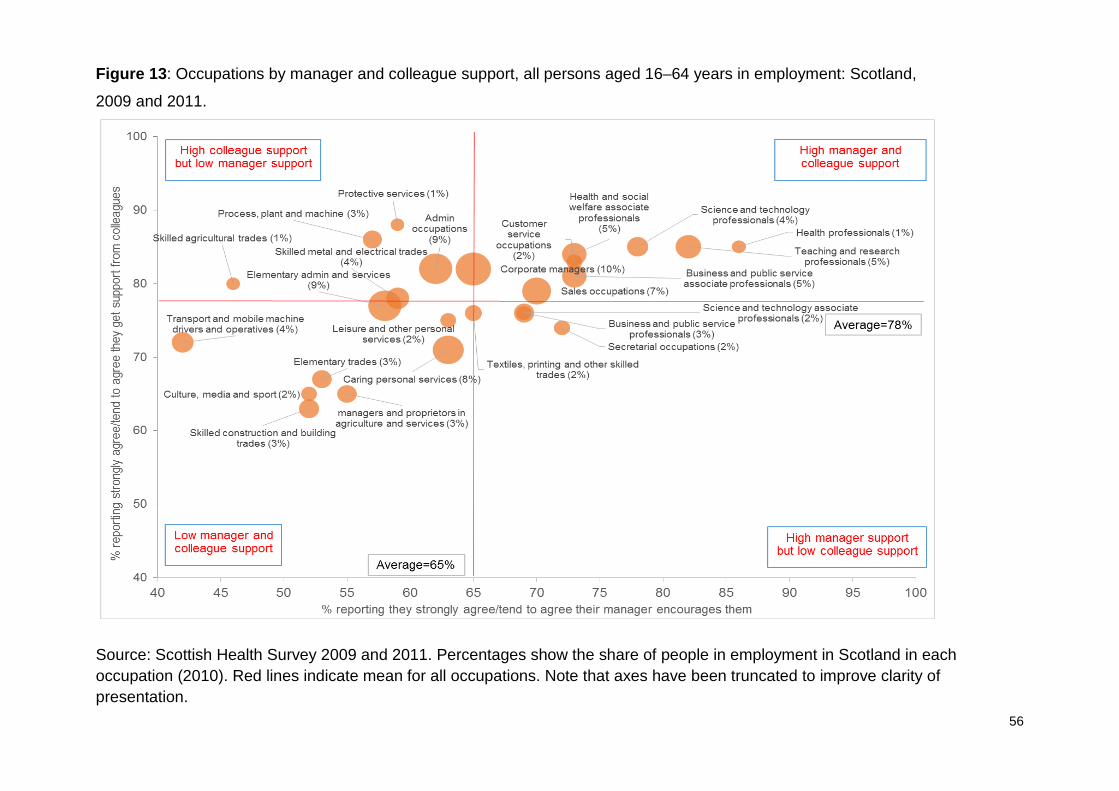
56
Figure 13: Occupations by manager and colleague support, all persons aged 16–64 years in employment: Scotland,
2009 and 2011.
Source: Scottish Health Survey 2009 and 2011. Percentages show the share of people in employment in Scotland in each occupation (2010). Red lines indicate mean for all occupations. Note that axes have been truncated to improve clarity of presentation.

57
Figure 14: Industries by manager and colleague support, all persons aged 16–64 years in employment: Scotland, 2009 and 2011.
Source: Scottish Health Survey 2009 and 2011. Percentages show the share of people in employment in Scotland in each industry (2010). Red lines indicate mean for all industries. Note that axes have been truncated to improve clarity of presentation.

58
Work characteristics
The final piece of descriptive analysis was to examine broader characteristics of
work (including unemployment, hourly pay, lack of hours, involuntary temporary
employment, task discretion and, where possible, the accident rate).
Occupations
Table 10 shows the detailed work characteristics of the 25 SOC2000 occupations.
Professional, managerial and administrative/secretarial occupations tend to compare
favourably: only the high rates of involuntary, temporary employment in teaching and
research, and administrative occupations stand out. At the other end of the scale,
elementary occupations compare unfavourably on most measures of employment
quality.
Good work scores were also calculated for each occupation, based on the number of
positive and negative characteristics observed for each. Results are shown in Table
11, along with a summary of the features of each occupation. Based on these
characteristics, the 25 occupations were divided into five broad categories:
1 Good work (30%, 723,800)††, including: corporate managers (10%); science
and technology professionals (4%); managers and proprietors in agriculture
and services (3%); business and public service professionals and associate
professionals (3%); health professionals (1%); science and technology
associate professionals (2%); and secretarial occupations (2%).
2 Mixed, favourable (19%, 447,000), including: administration occupations
(9%); teaching and research professionals (5%); protective services (1%); and
skilled construction and building trades (3%).
3 Middling (19%, 446,000), including: health and social welfare associate
professionals (5%); culture, media and sport (2%); skilled metal and electrical
trades (4%); textiles, printing and other skilled trades (2%); skilled agricultural
trades (1%); leisure and other personal services (2%); and customer service
occupations (2%).
†† Figures in parenthesis show the number and share of adults aged 16–64 years in employment within each category.

59
4 Mixed, unfavourable (21%, 510,900), including: process, plant and machine
(3%); transport and mobile machine drivers and operatives (4%); caring
personal services (8%); and sales occupations (7%).
5 Bad work (12%, 281,300), including: elementary trades (3%); and elementary
administration and services (9%).

60
Table 10: Selected indicators of employment quality, by main occupation, persons aged 16–64: Scotland, 2010.
Indicators of employment quality
Unemployment rate (2010)
Hourly pay (2010)
Inadequate hours (2010)
Precariousness (2010)
Accident rate (2008–2010)
Control at work (2008–2011)
Corporate managers 2.8 19.0 0.6 0.5 1771 82 Managers and proprietors in agriculture and services
2.1 12.1 0.7 0.1 738 79
Science and technology professionals
1.2 18.5 0.6 0.7 573 74
Health professionals 0.0 25.1 0.7 0.0 3723 71 Teaching and research professionals
1.1 18.8 4.6 5.0 2129 72
Business and public service professionals
1.9 18.0 0.8 1.3 797 75
Science and technology associate professionals
3.1 13.6 1.2 2.1 3636 63
Health and social welfare associate professionals
1.2 14.6 3.7 1.5 3111 69
Protective services 2.6 15.2 1.0 0.0 8232 34 Culture, media and sport 5.0 12.8 3.5 1.4 1468 89 Business and public service associate professionals
3.3 13.3 1.4 2.1 157 80
Administration occupations
4.2 9.7 2.6 3.0 1082 60
Secretarial occupations 4.6 8.9 3.3 0.6 317 70 Skilled agricultural trades 5.6 9.1 2.3 3.6 8360 76 Skilled metal and electrical trades
5.5 12.8 0.8 1.5 4679 70
Skilled construction and building trades
11.5 11.3 1.4 0.3 3165 60

61
Indicators of employment quality
Unemployment rate (2010)
Hourly pay (2010)
Inadequate hours (2010)
Precariousness (2010)
Accident rate (2008–2010)
Control at work (2008–2011)
Textiles, printing and other skilled trades
6.7 7.5 6.1 1.0 5137 78
Caring personal services 4.1 8.8 9.3 2.3 4821 49 Leisure and other personal services
4.0 8.1 5.8 1.4 984 70
Sales occupations 8.8 6.4 10.9 1.2 1209 42 Customer service occupations
7.4 8.4 2.2 1.6 978 37
Process, plant and machine
12.1 9.7 0.8 2.8 3528 47
Transport and mobile machine drivers and operatives
7.4 9.3 3.1 1.3 6736 56
Elementary trades 18.0 8.1 4.4 4.4 3388 35 Elementary administration and services
10.7 6.7 14.8 2.5 3352 53
Average 5.6 11.0 4.4 1.8 2628 64
Sources: Annual Population Survey; Annual Survey of Hours and Earnings; Labour Force Survey; Scottish Health Survey.
62
Table 11: Standard occupational classifications, with main characteristics
highlighted, ranked by overall ‘good work’ score: Scotland, 2010.
Score: +6 (best) to –6 (worst)
Occupation Positive aspects Negative aspects
5 Corporate managers Low unemployment, adequate hours, low precariousness, high control, high pay
None
5 Managers and proprietors in agriculture and services
Low unemployment, adequate hours, low precariousness, low accident rate, high control
None
5 Science and technology professionals
Low unemployment, adequate hours, low precariousness, low accident rate, high pay
None
5 Business and public service professionals
Low unemployment, adequate hours, low accident rate, high pay, high control
None
4 Health professionals Low unemployment, high pay, adequate hours, low precariousness
None
4 Business and public service associate professionals
Low unemployment, adequate hours, high control, low accident rate
None
2 Science and technology associate Professionals
Low unemployment, adequate hours
None
2 Secretarial and related occupations
Low precariousness, low accident rate
None
2 Administrative occupations
Low unemployment, adequate hours, safe
Precariousness
1 Health and social welfare associate professionals
Low unemployment None
1 Culture, media and sport occupations
High control None
1 Skilled metal and electrical trades
Adequate hours None
1 Textiles, printing and other skilled trades
High control None
1 Teaching and research professionals
Low unemployment, high pay Precariousness
1 Skilled construction and building trades
Adequate hours, low precariousness
High unemployment
1 Protective services Low unemployment, adequate hours, low precariousness
High accident rate, low control
0 Skilled agricultural trades
Adequate hours High accident rate
0 Leisure and other personal service
Low accident rate Low pay
0 Customer service occupations
Adequate hours, low precariousness, safe
High unemployment, low control

63
Score: +6 (best) to –6 (worst)
Occupation Positive aspects Negative aspects
–1 Process, plant and machine operatives
Adequate hours High unemployment, low control
–1 Transport and mobile machine drivers and operators
None High accident rate
–2 Caring personal services
Low unemployment Lack of hours, high accident rate, low control
–3 Sales occupations Low accident rate High unemployment, low pay, lack of hours, low control
–4 Elementary trades None High unemployment, low pay, high precariousness, low control
–4 Elementary administration and service
None High unemployment, low pay, lack of hours, low control
There is considerable variation in terms of the favourable and unfavourable
characteristics of each occupation grouping. Looking in more detail at those
occupations with the largest share of employment in Scotland in 2010:
• corporate managers: favourable on five out of the six measures,
unfavourable on none
• administrative occupations: characterised by low unemployment, adequate
hours and low accident rates, but also high rates of precariousness
• elementary administration and services: characterised by high
unemployment, low pay, lack of hours and low control
• caring personal services: characterised by low unemployment but with a
lack of hours, a high accident rate and low control
• sales occupations: characterised by high unemployment, low pay, lack of
hours, low control, but with a low accident rate.
Industries
A similar exercise was undertaken for broad industrial groupings (Tables 12 and 13).
This process was cruder than for occupations, in part because of incomplete injury
rate data and also owing to the classification of industry by broad sectors, which may

64
obscure differences by detailed industrial category (e.g. between the professional
and support activities included in ‘other business activities’), and between
occupations within industries (e.g. care assistants and nurses in health and social
work, brokers and customer service advisors in financial services, casual agricultural
labourers and farmers in agriculture). Changes to the labour market since 2010
(including, for example, radical reductions in employment in some parts of the public
sector) may also change the picture presented here.
Industries with the most favourable characteristics included: financial services;
electricity, gas and water; and public administration, defence and compulsory social
security. Those with the least favourable characteristics included retail, hotels and
restaurants.
Looking in more detail at the industries with the largest share of people in
employment in Scotland in 2010:
• health and social work: had low levels of unemployment
• retail: was characterised by high unemployment, low pay, lack of hours and
low control, but with below-average rates of temporary jobs
• education: was characterised by a lack of hours, a higher rate of involuntary
temporary employment but low rates of unemployment.
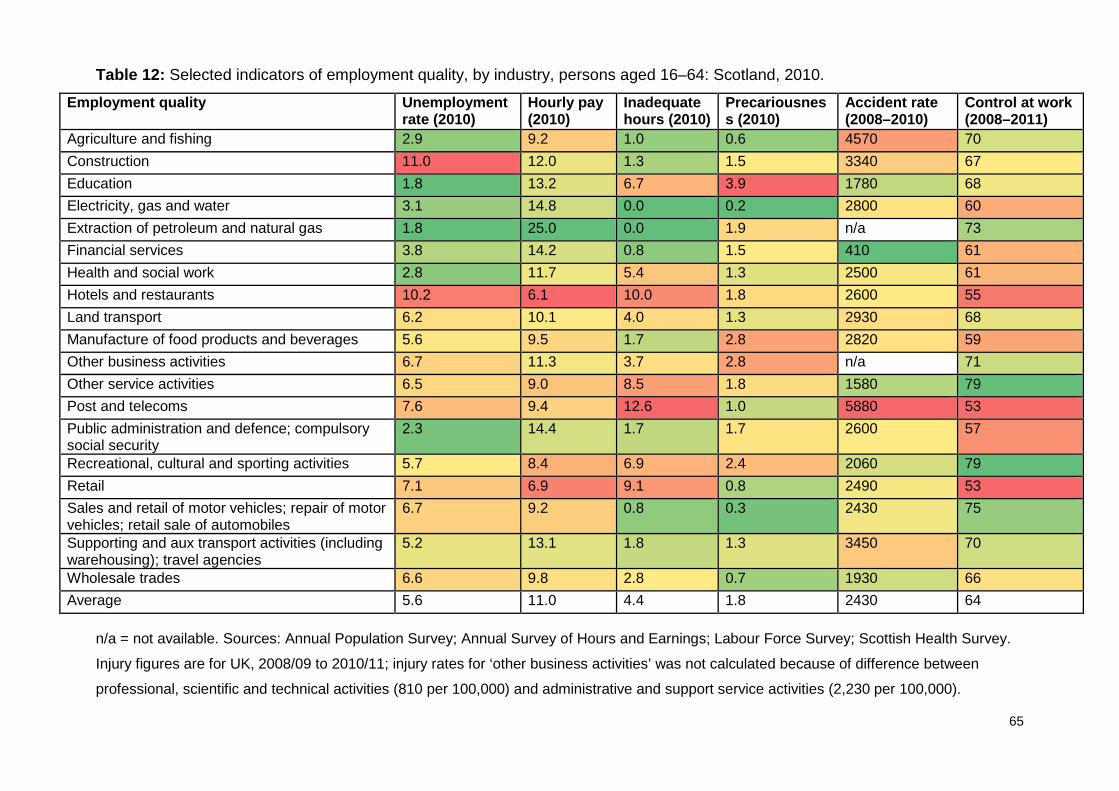
65
Table 12: Selected indicators of employment quality, by industry, persons aged 16–64: Scotland, 2010.
Employment quality Unemployment rate (2010)
Hourly pay (2010)
Inadequate hours (2010)
Precariousness (2010)
Accident rate (2008–2010)
Control at work (2008–2011)
Agriculture and fishing 2.9 9.2 1.0 0.6 4570 70 Construction 11.0 12.0 1.3 1.5 3340 67 Education 1.8 13.2 6.7 3.9 1780 68 Electricity, gas and water 3.1 14.8 0.0 0.2 2800 60 Extraction of petroleum and natural gas 1.8 25.0 0.0 1.9 n/a 73 Financial services 3.8 14.2 0.8 1.5 410 61 Health and social work 2.8 11.7 5.4 1.3 2500 61 Hotels and restaurants 10.2 6.1 10.0 1.8 2600 55 Land transport 6.2 10.1 4.0 1.3 2930 68 Manufacture of food products and beverages 5.6 9.5 1.7 2.8 2820 59 Other business activities 6.7 11.3 3.7 2.8 n/a 71 Other service activities 6.5 9.0 8.5 1.8 1580 79 Post and telecoms 7.6 9.4 12.6 1.0 5880 53 Public administration and defence; compulsory social security
2.3 14.4 1.7 1.7 2600 57
Recreational, cultural and sporting activities 5.7 8.4 6.9 2.4 2060 79 Retail 7.1 6.9 9.1 0.8 2490 53 Sales and retail of motor vehicles; repair of motor vehicles; retail sale of automobiles
6.7 9.2 0.8 0.3 2430 75
Supporting and aux transport activities (including warehousing); travel agencies
5.2 13.1 1.8 1.3 3450 70
Wholesale trades 6.6 9.8 2.8 0.7 1930 66 Average 5.6 11.0 4.4 1.8 2430 64
n/a = not available. Sources: Annual Population Survey; Annual Survey of Hours and Earnings; Labour Force Survey; Scottish Health Survey.
Injury figures are for UK, 2008/09 to 2010/11; injury rates for ‘other business activities’ was not calculated because of difference between
professional, scientific and technical activities (810 per 100,000) and administrative and support service activities (2,230 per 100,000).

66
Table 13: Selected industry groups, with main characteristics highlighted, ranked by
overall ‘good work’ score: Scotland, 2010.
Score: +6 (best) to –6 (worst)
Industry Positive aspects Negative aspects
4 Financial services Low unemployment, high pay, adequate hours, low injury rate
None
3 Electricity, gas and water
High pay, adequate hours, low precariousness
None
3 Public administration and defence; compulsory social security
Low unemployment, high pay, low precariousness
None
2 Agriculture and fishing Low unemployment, adequate hours, low precariousness
High injury rate
2 Sales and retail of motor vehicles; repair of motor vehicles; retail sale of automobiles
Adequate hours, low precariousness None
1 Health and social work Low unemployment None 1 Manufacture of food
products and beverages*
Adequate hours None
1 Supporting and aux transport activities (including warehousing); travel agencies
Adequate hours None
1 Wholesale trades Low precariousness None
0 Post and telecoms Low precariousness High injury rate 0 Land transport None None –1 Construction Adequate hours High
unemployment, high injury rate
–1 Education Low unemployment Lack of hours, high precariousness
–1 Recreational, cultural and sporting activities
High control Low pay, lack of hours
–2 Other service activities None Low pay, inadequate hours
–3 Retail Low precariousness High unemployment, low pay, lack of hours, low control
–3 Hotels and restaurants None High unemployment, low pay, lack of hours
*Assuming that the rate for all manufacturing also applies in this sector.
67
Accounting for differences in health outcomes
Logistic regression was used to identify whether or not occupations/industries were
associated with differences in health outcomes, after other factors were accounted
for. The health outcomes examined were:
• being in very good/good general self-reported health: odds of greater than 1
are ‘good’, indicating increased likelihood of good general health
• having a score of 4+ on the GHQ-12, which indicates a possible mental health
problem: odds of greater than 1 are ‘bad’, indicating increased likelihood of
poor mental health.
The reference categories used were: current/previous job as corporate manager;
aged 16–44 years; no qualifications; not in work (excluding full-time students); living
in household income quintiles 3–5 (mid-high income); never smoked or ex-smoker;
not drinking at
hazardous/harmful levels; not eating at least five portions of fruit or vegetables a day;
not obese; and not meeting physical activity recommendations.
For men and women, occupation remains significantly associated with being in good
health after adjustment (Figure 15 and 16). A wide range of occupations exert an
independent association on reducing the odds of being in good health. For men, the
strongest associations were seen for process, plant and machine operatives; and
transport and mobile machine drivers and operatives. For women, the strongest
associations were seen for process, plant and machine; customer service
occupations; and skilled metal and electrical trades.‡‡ Red squares indicate that the
independent variable was associated with worse general or mental health, relative to
the reference category; green squares indicate that it was associated with better
health.
Of the other factors adjusted for, only self-reported hazardous/harmful alcohol
consumption (men only) and self-reported consumption of five or more portions of
‡‡ Only a very small number of women worked in these occupations.

68
fruit or vegetables a day (women only) were not associated with self-reported
general health. Currently being in paid employment was the factor with strongest
impact on self-reported health, with smoking, physical activity and obesity also
emerging as relatively important. Living in a low-income household exerted an
independent (negative) association on self-reported general health even after
adjustment for current employment status, educational attainment and occupation.

69
Figure 15: Adjusted log odds and 95% confidence intervals of being in good/very good
general health for men aged 16–64 years, by current/most recent occupation, relative to
corporate managers: Scotland, 2008–2011.
Note: Adjusted for age, highest level of qualifications, employment status, household income,
smoking, alcohol consumption, fruit and vegetable consumption, obesity and physical activity.
Red squares indicate that the independent variable was associated with worse general or mental
health, relative to the reference category; green squares indicate that it was associated with
better health.

70
Figure 16: Adjusted log odds and 95% confidence intervals of being in good/very good
general health for women aged 16–64 years, by current/most recent occupation, relative
to corporate managers: Scotland, 2008–2011.
Note: Adjusted for age, highest level of qualifications, employment status, household income,
smoking, alcohol consumption, fruit and vegetable consumption, obesity and physical activity.
Red squares indicate that the independent variable was associated with worse general or mental
health, relative to the reference category; green squares indicate that it was associated with
better health.
71
Focusing on GHQ-12 scores, after adjustment for the variables above, occupation of
employment remained a significant independent predictor of a high GHQ-12 score
for men but not for women (Figures 17 and 18). Compared with corporate managers,
three occupations (health and social welfare associate professionals, caring
occupations and customer service occupations) were associated with higher GHQ-
12 scores for men aged 16–64 years. For both men and women, of the factors
controlled for, being in paid employment had the strongest (protective) influence on
GHQ-12 scores. Income also exerted an independent association.
The results for industries are shown in Figures 19 and 20. After adjustment for a
range of independent variables, industry of employment was not significantly
associated overall with self-reported general health. However, after adjustment,
general health was poorer for people aged 16–64 years with work experience in land
transport and less definitively, other manufacturing compared to wholesales trades
(Figure 19). As with the occupational analysis, being in paid employment and, to a
lesser extent, smoking, physical activity, obesity and living in a low-income
households had strong, independent associations on the health outcomes. Industry
of employment was also independently associated with a higher or lower risk of
having a GHQ-12 score of 4+ and thus a possible mental health problem. Compared
to those in wholesale trades industries, computer and related activities, and electrical
and electronic manufacturing were associated with higher GHQ-12 scores (and
possible mental health problems) for adults aged 16–64 years (Figure 20).

72
Figure 17: Adjusted log odds of having a GHQ-12 score of 4+ (which indicates a
possible mental health problem) for men aged 16–64 years, by current/most recent
occupation, relative to corporate managers: Scotland, 2008–2011.
Note: Adjusted for age, highest level of qualifications, employment status, household
income, smoking, alcohol consumption, fruit and vegetable consumption, obesity and
physical activity. Red squares indicate that the independent variable was associated with
worse general or mental health, relative to the reference category; green squares indicate
that it was associated with better health.

73
Figure 18: Adjusted log odds of having a GHQ-12 score of 4+ (and a possible mental
health problem) for women aged 16–64 years, by current/most recent occupation,
relative to corporate managers: Scotland, 2008–2011.
Note: Adjusted for age, highest level of qualifications, employment status, household income,
smoking, alcohol consumption, fruit and vegetable consumption, obesity and physical activity.
Red squares indicate that the independent variable was associated with worse general or
mental health, relative to the reference category; green squares indicate that it was associated
with better health.
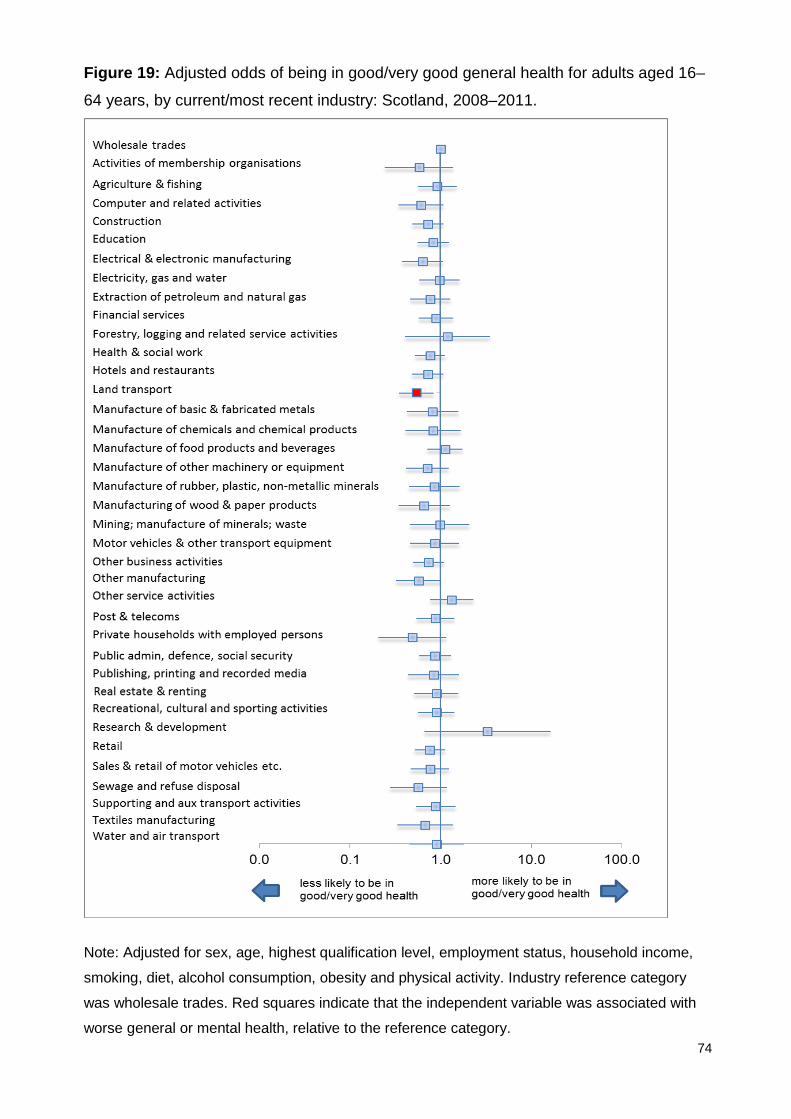
74
Figure 19: Adjusted odds of being in good/very good general health for adults aged 16–
64 years, by current/most recent industry: Scotland, 2008–2011.
Note: Adjusted for sex, age, highest qualification level, employment status, household income,
smoking, diet, alcohol consumption, obesity and physical activity. Industry reference category
was wholesale trades. Red squares indicate that the independent variable was associated with
worse general or mental health, relative to the reference category.

75
Figure 20: Adjusted odds of having a GHQ-12 score of 4+ for adults aged 16–64 years,
by current/most recent industry: Scotland, 2008–2011.
Note: Adjusted for sex, age, highest qualification level, employment status, household income,
smoking, diet, alcohol consumption, obesity and physical activity. Industry reference category
was wholesale trades. Red squares indicate that the independent variable was associated with
worse general or mental health, relative to the reference category; green squares indicate that it
was associated with better health.
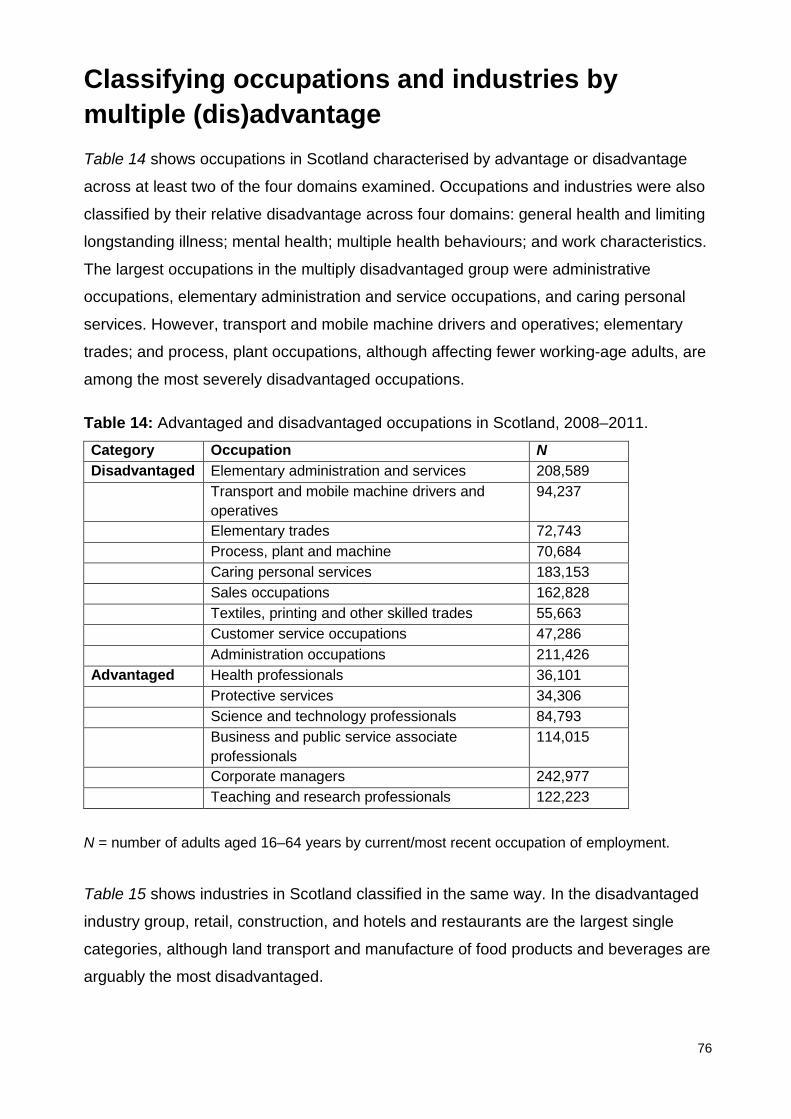
76
Classifying occupations and industries by multiple (dis)advantage Table 14 shows occupations in Scotland characterised by advantage or disadvantage
across at least two of the four domains examined. Occupations and industries were also
classified by their relative disadvantage across four domains: general health and limiting
longstanding illness; mental health; multiple health behaviours; and work characteristics.
The largest occupations in the multiply disadvantaged group were administrative
occupations, elementary administration and service occupations, and caring personal
services. However, transport and mobile machine drivers and operatives; elementary
trades; and process, plant occupations, although affecting fewer working-age adults, are
among the most severely disadvantaged occupations.
Table 14: Advantaged and disadvantaged occupations in Scotland, 2008–2011.
Category Occupation N Disadvantaged Elementary administration and services 208,589 Transport and mobile machine drivers and
operatives 94,237
Elementary trades 72,743 Process, plant and machine 70,684 Caring personal services 183,153 Sales occupations 162,828 Textiles, printing and other skilled trades 55,663 Customer service occupations 47,286 Administration occupations 211,426 Advantaged Health professionals 36,101 Protective services 34,306 Science and technology professionals 84,793 Business and public service associate
professionals 114,015
Corporate managers 242,977 Teaching and research professionals 122,223
N = number of adults aged 16–64 years by current/most recent occupation of employment.
Table 15 shows industries in Scotland classified in the same way. In the disadvantaged
industry group, retail, construction, and hotels and restaurants are the largest single
categories, although land transport and manufacture of food products and beverages are
arguably the most disadvantaged.

77
Excluded from this list were industries in which it was not possible to estimate control at
work. If these were included, the list of disadvantaged industries would expand to
include: most of manufacturing (except chemicals manufacturing);§§ private households
with employed persons; publishing, printing and reproduction of recorded media and
sewage; and refuse disposal. Computer and related activities; forestry, logging and
related service activities; manufacture of chemicals and chemical products; and research
and development would be added to the list of advantaged industries.
Table 15: Advantaged and disadvantaged industries in Scotland, 2008–2011.
Category Occupation N Disadvantaged Construction 230,676
Hotels and restaurants 183,705
Land transport 74,715
Manufacture of food products and beverages 52,668
Post and telecoms 25,606
Retail 305,251
Advantaged Agriculture and fishing 38,127
Education 273,565
Electricity, gas and water 34,227
Extraction of petroleum and natural gas 8,032
Financial services 118,907
Recreational, cultural and sporting activities 82,482
Sales and retail of motor vehicles; repair of motor vehicles; retail sale of automobiles
44,431
N = Number of adults aged 16–64 years by current/most recent industry of employment.
The detailed scores underpinning these classifications are shown in Tables A2 and A3.
§§ Specifically, electrical and electronic manufacturing, manufacture of basic and fabricated metals, manufacture of machinery or equipment not otherwise classified, manufacture of rubber, plastic, non-metallic minerals, motor vehicles and other transport equipment, other manufacturing and textiles manufacturing.

78
Chapter 4: Discussion
Summary of findings
This report has described contemporary health outcomes, behaviours and determinants
by current or most recent occupation and industry of employment, for adults aged 16–64
years in Scotland. The evidence suggests a number of broad conclusions.
Descriptive analysis
Focusing first on the descriptive analysis, some occupations appear consistently
disadvantaged or advantaged across multiple aspects of health and its determinants,
regardless of the measures used. Professionals and managers are, in general,
consistently advantaged, along with those in protective services (for protective services,
this is despite high levels of job strain). Those in transport, process, caring, customer
service and elementary occupations appear consistently disadvantaged.
For industries, the pattern is less clear. Where industries are characterised by a high
degree of internal inequality (e.g. financial services, public administration, and health and
social care), taking average scores of measures may obscure these differences.
Nonetheless, the evidence does provide some clues. The most ‘disadvantaged’
industries (in 2008–2011) included land transport, hotels and restaurants, food and
beverage manufacturing and construction. ‘Advantaged’ industries included extraction of
petroleum and natural gas, education and (with some challenges around workplace
stress) financial services.
Being in any paid employment was more important than occupation or industry in
accounting for differences in the range of health outcomes examined. However, many of
the disadvantaged occupations (especially elementary, process and customer service
occupations) listed in Table 14 were independently associated with poorer self-reported
health even after employment status and a range of other factors were taken into
account. Occupation was also independently associated with possible mental health
problems for men but not for women. Land transport remained significantly associated
with poorer self-reported health, and computer and related activities, and electrical and
electronic manufacturing with poorer mental health, after adjustment. It is also important

79
to note that physical activity, smoking, obesity and (especially for women) living in a low-
income household emerged as important independent variables.
Anomalies
In addition, there are some interesting potential anomalies. Health and social work
emerged as an industry with relatively favourable health outcomes and behaviours,
despite scoring unfavourably in terms of workplace stress. Likewise, skilled construction
trades have poor health behaviours, high unemployment and injury rates, and relatively
low levels of control at work, but also low levels of reported mental health problems.
Exploring these issues might be a useful piece of future research.
Finally, the evidence highlights interaction between sex, labour market (dis)advantage
and health outcomes. While men are more likely to be concentrated in the occupations
with the ‘worst’ health outcomes, they are also more likely to be found in occupations
with the ‘best’ outcomes. Unlike men, being employed in professional/managerial jobs
does not seem to protect the mental health of working-age women. In addition, being in
paid employment has a slightly weaker beneficial impact, and low income a slightly more
detrimental impact, on their health compared to men.
Strengths and limitations
A key strength of this analysis is that it presents detailed contemporary self-reported
health-related data by occupations and industries in Scotland. Limitations of the
approach include the following:
• Use of cross-sectional data means we are unable to draw conclusions about causation. This could be addressed by future research using the Scottish Health
Survey linked data sets, to explore whether or not occupation and industry in the
starting time period are associated with hospitalisation and other health outcomes
at follow-up.
• Health outcomes and behaviours include not just those currently in employment but also those who are unemployed or economically inactive. This has partly been accounted for through the regression analysis adjustment
above. Being in employment has a strong association, but it reduces, rather than
eliminates, inequalities in health outcomes.

80
• A reliance on self-reported data. Although generally considered good indicators
of health, and shown to be good predictors of mortality, the health outcome
measures presented here are based on individuals’ subjective judgement or self-
reporting.
• A crude, unweighted approach to scoring overall outcomes, behaviours, workplace stress and work characteristics. It could reasonably be argued that
some aspects of workplace stress or job characteristics are more important than
others: for example, job control and unemployment might be more important than
support from colleagues/managers and underemployment for health. Future work
might explore how different measures can be weighted to create a more
sophisticated index.
• The indicators chosen might not fully capture the relevant concepts: for
example, the measure of demand might accurately assess time pressures at work
but not the degree of task monotony (which is also important for health). Another
example is how hourly pay and hours interact in reality – with home care workers
not paid for time spent driving between clients, for example.
• Findings are restricted to a point in time. Results shown are drawn from
population survey data collected around the years 2008–2011. They do not allow
us to comment on how health outcomes and determinants for particular
occupations/industries changed over time prior to that date, and or how they might
have changed since. The economic context of that period (a move from economic
growth and a more favourable labour market into a deep and prolonged
recession) may also influence the results. For example, fear of redundancy has
been shown to have an adverse impact on employees’ mental health. If this was
higher during the period 2008–2011 (and it seems plausible that it was), then this
might mean mental health reported here was poorer than during ‘normal’ times.
• Findings are restricted to Scotland as a whole. The results shown do not
describe any geographic differences in health outcomes by employment. The next
phase of work will involve using Annual Population Survey and Census data to
describe how ‘healthy’ local labour markets might be. This is assuming that the
health-related characteristics of jobs/industries do not also vary within Scotland.

81
Implications
This report supports the view that inequalities in health are partly driven by inequalities in
the labour market. Policies that increase the number of working-age adults in
sustainable, paid employment that protects their physical and mental health would make
an important contribution to improving health outcomes. Measures that achieve this
should be supported, but it is important to note that many of the flagship policies (such
as the Work Programme26 and increased conditionality for benefits receipt), which have
this as a stated aim, have met with only partial success, and may have actually moved
some people further away from the labour market. There is also emerging evidence that
increased conditionality is associated with increased risk of possible mental health
problems for working-age adults in low-income households.27
Attention should also be paid to reducing working-age poverty. This could include
focusing on measures that can boost the amount of money coming into low-income
households (hourly wages, social security benefits, availability of hours, childcare that
would allow more hours to be worked, working practices on what is counted as ‘working
time’) and to reduce the amount of money going out (by looking at unfair costs and
premiums paid by those on a low income). This should be done in parallel with
interventions to tackle specific health behaviours, such as smoking, obesity and lack of
physical activity (and it should be noted that upstream measures, focused on legislation
and fiscal measures, are likely to be more effective at reducing health inequalities than
those targeting individuals or their employers).
In addition, the evidence assembled suggest that there are inequalities in health
outcomes and determinants by occupation and industry that cannot be accounted for by
employment status, individual characteristics (age, sex or educational attainment) or
health behaviours. Information presented here could be used to prioritise occupations
and/or industries for targeted interventions. Decisions on this could also be based on the
relative scale of employment. On this basis, it might be useful to consider targeting:
• caring personal services, elementary trades and elementary service occupations:
these three occupations account for just under one-fifth (19%, 484,000) of
Scottish working-age adults in employment
• construction, and hotels and restaurants: these two industries employ 370,000
people (15% of the Scottish workforce).
82
Some clues as to how employment might be improved are suggested in the workplace
stress and job quality tables (Tables 10, 11, A1 and A2). For example, in caring personal
services, this might include decreasing the injury rate, increasing levels of job control,
and looking at ways to reduce precariousness and involuntary part-time employment.
Additionally, it would be useful to explore why occupation is important in changing the
relative risk of mental health problems for men but not for women.
In the medium term, the evidence shown here poses a number of important questions.
The Scottish Government has identified seven key growth sectors that offer particular
opportunities for current and future prosperity.14 It might be reasonable to explore –
consistent with recommendations from the Fair Work Convention – the extent to which
these sectors contribute to creating good health and narrowing health inequalities.
At times and places where labour market demand is weak (and as acknowledged by the
Fair Work Convention), the quality of employment tends to be poorer.8 The results
reinforce the need for any national full employment strategy to focus on both the quantity
and the quality of employment, especially as those occupations where health outcomes
and determinants are poorest are also those in which the relative demand for labour is
very weak.
Comparisons with other studies
As noted in the limitations section, these findings allow us to describe associations,
rather than causal links. Perhaps more fundamentally, the approach only begins to
scratch the surface of the interaction between occupation and social class, as argued
elsewhere, are ‘two distinct constructs that lead to different social stratification
hypotheses, social mechanisms and intervention strategies with regard to health
inequalities’.28 Health inequalities that show up as associated with different occupations
and industries may in fact reflect differences in power and status in society.
These findings can be compared with work based on the European Work Conditions
Survey (EWCS), which attempted to classify occupations and industries by job quality
(including measures of earnings, working time quality, prospects, intrinsic job quality, and
health and wellbeing at work). The occupations identified across the EU using their

83
methods were very similar to those shown in Table 14.*** There are a few exceptions:
sales occupations and skilled trades do not emerge as clearly disadvantaged from the
Scottish data, however, they do from the European analysis. Industries identified as
disadvantaged across the EU were also similar to that shown in Table 15, although
agriculture and fishing, and other business activities do not appear to be as
disadvantaged in Scotland as they are in other parts of Europe, while education and
public administration appear slightly more advantaged.†††
Some staff satisfaction surveys for the UK or Scotland also ask similar or identical
questions to those in workplace stress module of the Scottish Health Survey. Compared
with the Scottish Health Survey findings above for the health and social work industry,
the NHS Scotland Staff Survey 2015 shows much less positive results for control at work
(40% vs. 61%) and staff consultation (28% vs. 44%), though results are similar in both
surveys for unrealistic demands, clarity of role and manager/colleague support. The UK
Civil Service People survey29 suggests that employees in the largest Scottish
organisations have similar levels of control at work to that reported in Scottish Health
Survey for people working in the public administration and defence; and compulsory
social security industries (63% vs. 57%). Readily obtained information of this kind is,
however, confined to the public sector. It would be useful to explore whether or not large
private sector industries (for example, construction, transport, retail and social care)
would be open to monitoring the mental health of their workforce in a similar, systematic
way.
The Workplace Employment Relations Study30 also provides some revealing results on
aspects relevant to physical and psychosocial health by industry and workplace size for
the UK, with some analyses possible for Scotland. This includes some concepts not
covered by the Scottish Health Survey or Annual Population Survey, such as task
monotony, perceived job insecurity and representation at work. Comparing the evidence
*** The EWCS analysis describes as multiply disadvantaged the following occupations: customer services clerks; personal service workers; sales workers; market-oriented skilled forestry; fishery and hunting workers; building and related trades workers; metal, machinery and related trades workers; food processing; wood working; garment and other craft and related trades workers; stationary plant and machine operators; assemblers, drivers and mobile plant operators; labourers in mining, construction, manufacturing and transport; and food preparation assistants. ††† The EWCS identified the administrative services, the agro-food industry, food and beverage services, textiles and clothing, transport and storage, and construction industries as being especially disadvantaged. It identified the chemical industry, utilities supply, banking, insurance, real estate activities, legal and accounting activities, and financial services as being relatively advantaged.
84
from Workplace Employment Relations Study with this data may also yield useful
insights.
Lastly, the Health and Safety Executive31 provides an important example for bringing
together the monitoring of risks at work (for both occupations and industry) and, at least
in part, the responsibility to intervene to prevent and mitigate adverse health outcomes. It
would be useful to consider if a similar approach could be taken for a broader range of
health outcomes and determinants associated with work, starting with the routine
monitoring of the ‘problem’.
Potential areas for future research
This analysis also suggests a number of areas for further work. These might include:
• Developing a more sophisticated theoretical understanding of what factors to
adjust for to identify more clearly the work-related determinants of health and what
is likely to be due to social status, income and exposure to different
socioeconomic contexts throughout the life course. This could utilise the ‘directed
acyclic graphs’ (DAG) method32 and longitudinal data sources such as the UK
birth cohorts.
• Presenting mortality and (if possible) hospitalisation rates by occupation and
industry as a complement to the self-reported health outcomes shown here. The
MRC/CSO Social and Public Health Sciences Unit is currently leading a project
which will partly answer this question, by providing detailed information on
mortality rates by occupation.33
• Combining the information in this report (and perhaps the additional analysis
proposed below) with routine labour market data (e.g. the Annual Population
Survey and the 2011 Census) to quantify the level of good/bad/intermediate work
in Scotland and describe its geographical distribution and trends over time.
• Use of routine data to map the characteristics of occupations/industries in
Scotland against a more comprehensive suite of ‘good work’ indicators.
• Use of the Scottish Health Survey data set to explore the relative contribution of
different aspects of workplace stress to mental health problems for employed
adults in Scotland, controlling for household income, sex and other factors. This
would build on recommendations made by Harkins and Egan (2013)34 and could
use as its model the analysis published by Stansfeld et al. (2013).35
85
• Exploring whether or not the health outcomes related to employment (after
adjusting for other relevant exposures) for similar occupations and industries differ
in places where labour market demand is strong, compared with where it is weak.
Concluding remarks
The association of occupations and industries with better or worse health outcomes, and
determinants of health, is not inevitable. We describe here wide variations by occupation,
within industries, between sexes within the same industries and occupations, and
several other variations. These analyses are not explanatory studies but they invite
further study by those who have insights into working conditions, and by those who take
action to explain and tackle the causes of poorer experience, determinants and
outcomes.
The analyses presented in this report suggest that it is possible to examine health
outcomes and determinants by occupation and industry in Scotland. This information can
be used to increase the prospects of ‘good work for all’ – with all the human, social and
economic benefits that would bring.

86
Appendix 1 Table A1: Workplace stress indicators, by current occupation of employment, persons aged 16–64 years: Scotland, 2009 and 2011.
Workplace stress indicators
Very/ extremely stressful
Always/ often high demand
Always/ often choice at work
Always/ often clear responsibilities
Strongly agree/ tend to agree line manager encourages
Strongly agree/tend to agree colleagues at work support
Strongly agree/agree work relationships are strained
Staff consulted about change
Work–life balance
Corporate managers
21 34 82 93 65 82 16 57 5.73
Managers and proprietors in agriculture and services
23 19 79 93 55 65 14 57 6.36
Science and technology professionals
19 28 74 90 78 85 16 47 6.41
Health professionals
12 47 71 94 86 85 0 41 6.95
Teaching and research professionals
15 30 72 92 82 85 15 57 6.43
Business and public service professionals
24 31 75 91 69 76 15 47 6.25
Science and technology associate professionals
7 28 63 98 69 76 9 65 6.64

87
Workplace stress indicators
Very/ extremely stressful
Always/ often high demand
Always/ often choice at work
Always/ often clear responsibilities
Strongly agree/ tend to agree line manager encourages
Strongly agree/tend to agree colleagues at work support
Strongly agree/agree work relationships are strained
Staff consulted about change
Work–life balance
Health and social welfare associate professionals
25 35 69 96 73 84 19 49 6.6
Protective services
26 52 34 91 59 88 28 30 6.03
Culture, media and sport
8 24 89 95 52 65 6 43 7
Business and public service associate professionals
17 22 80 93 73 81 12 44 6.13
Administration occupations
11 19 60 91 62 82 20 46 6.63
Secretarial occupations
10 25 70 90 72 74 17 57 6.83
Skilled agricultural trades
14 38 76 98 46 80 17 56 6.95
Skilled metal and electrical trades
7 33 70 82 59 78 20 41 6.45
Skilled construction and building trades
13 29 60 98 52 63 18 36 6.33
Textiles, printing and other skilled trades
12 37 78 100 65 76 33 55 6.27

88
Workplace stress indicators
Very/ extremely stressful
Always/ often high demand
Always/ often choice at work
Always/ often clear responsibilities
Strongly agree/ tend to agree line manager encourages
Strongly agree/tend to agree colleagues at work support
Strongly agree/agree work relationships are strained
Staff consulted about change
Work–life balance
Caring personal services
16 24 49 92 63 71 24 44 6.51
Leisure and other personal services
8 20 70 97 63 75 13 48 7.11
Sales occupations 10 19 42 95 70 79 15 49 6.44
Customer service occupations
24 41 37 87 73 83 27 54 5.85
Process, plant and machine
14 18 47 89 57 86 20 51 6.53
Transport and mobile machine drivers and operatives
7 21 56 97 42 72 23 32 5.99
Elementary trades 10 21 35 90 53 67 30 36 5.78
Elementary administration and services
9 15 53 95 58 77 21 52 6.74

89
Table A2: Workplace stress indicators, by current industry of employment, persons aged 16–64 years: Scotland, 2009 and 2011.
Industry Very/ extremely stressful
Always/ often high demand
Always/often choice at work
Always/often clear responsibilities
Strongly agree/tend to agree line manager encourages
Strongly agree/tend to agree colleagues at work support
Strongly agree/agree relationships are strained
Staff consulted about change
Work–life balance
Agriculture and fishing
16 29 70 100 68 72 27 48 6.61
Construction 11 29 67 93 57 70 18 43 6.20 Education 13 25 68 90 77 81 19 51 6.64 Electricity, gas and water
13 22 60 87 67 84 15 48 6.32
Extraction of petroleum and natural gas
20 35 73 90 76 83 15 46 7.34
Financial services 15 35 61 87 71 86 15 53 5.96 Health and social work
21 32 61 94 67 75 23 44 6.47
Hotels and restaurants
11 17 55 99 62 81 17 54 6.18
Land transport 13 28 68 93 38 75 17 36 5.78 Manufacture of food products and beverages
13 22 59 94 58 92 34 52 6.28
Other business activities
20 24 71 95 68 73 14 44 6.59
Other service activities
5 21 79 95 63 68 10 51 7.59
Post and telecoms 13 43 53 98 64 80 25 50 6.06 Public administration and
18 32 57 90 62 85 17 41 6.40

90
Industry Very/ extremely stressful
Always/ often high demand
Always/often choice at work
Always/often clear responsibilities
Strongly agree/tend to agree line manager encourages
Strongly agree/tend to agree colleagues at work support
Strongly agree/agree relationships are strained
Staff consulted about change
Work–life balance
defence; compulsory social security Recreational, cultural and sporting activities
8 25 79 94 67 80 16 46 6.79
Retail 10 23 53 93 68 75 19 54 6.40 Sales and retail of motor vehicles; repair of motor vehicles; retail sale of automobiles
11 16 75 84 54 61 6 47 5.70
Supporting and aux transport activities (including warehousing); travel agencies
6 14 70 86 74 81 17 47 6.91
Wholesale trades 22 28 66 93 61 81 28 41 5.79

91
Table A3: Mean scores for general health and limiting longstanding illness, mental health and number of adverse health
behaviours; and work quality scores: by Standard Occupational Classification, adults aged 16–64 years, Scotland.
Occupation General health and limiting longstanding illness (2–6)
Mental health problems and wellbeing (2–6)
Mean number of risk factors
Work quality [6 (best) to –6 (worst)]
Corporate managers 2.58 3.37 1.79 5 Managers and proprietors in agriculture and services 2.75 3.46 1.83 5 Science and technology professionals 2.46 3.32 1.72 5 Health professionals 2.48 3.33 1.48 4 Teaching and research professionals 2.64 3.35 1.62 1 Business and public service professionals 2.61 3.36 1.69 4 Science and technology associate professionals 2.72 3.41 1.83 2 Health and social welfare associate professionals 2.73 3.45 1.69 1 Protective services 2.55 3.29 1.63 1 Culture, media and sport 2.7 3.63 1.66 1 Business and public service associate professionals 2.61 3.41 1.76 4 Administration occupations 2.77 3.52 1.84 2 Secretarial occupations 2.75 3.52 1.82 2 Skilled agricultural trades 2.91 3.38 1.62 0 Skilled metal and electrical trades 2.81 3.3 1.84 1 Skilled construction and building trades 2.82 3.41 1.77 1 Textiles, printing and other skilled trades 3.02 3.71 1.83 1 Caring personal services 2.94 3.6 1.81 -2 Leisure and other personal services 2.86 3.49 1.78 0 Sales occupations 2.8 3.61 1.87 -3 Customer service occupations 2.91 3.85 2.02 0 Process, plant and machine 3.24 3.64 1.93 -1 Transport and mobile machine drivers and operators 3.18 3.57 2.00 -1
Elementary trades 3.14 3.73 1.88 -4 Elementary administration and services 3.03 3.65 1.88 -4

92
Table A4: Mean scores for general health and limiting longstanding illness, mental health and number of adverse health
behaviours; and work quality scores: by industry, adults aged 16–64 years, Scotland.
Industry General health and limiting longstanding illness (2–6)
Mental health problems and wellbeing (2–6)
Multiple risk factors
Work quality [6 (best) to –6 (worst)]
Agriculture and fishing 3.38 2.82 1.82 2 Construction 3.44 2.93 2.22 –1 Education 3.37 2.74 1.82 –1 Electricity, gas and water 3.33 2.77 2.24 3 Extraction of petroleum and natural gas 3.3 2.71 2.03 2 Financial services 3.55 2.62 2.09 4 Health and social work 3.54 2.87 2.05 1 Hotels and restaurants 3.64 2.84 2.27 –3 Land transport 3.63 3.15 2.51 0 Manufacture of food products and beverages 3.57 2.93 2.39 1 Other service activities 3.47 2.76 2.27 –2 Post and telecoms 3.6 2.84 2.29 0 Public administration and defence; compulsory social security 3.46 2.77 2.05 3 Recreational, cultural and sporting activities 3.54 2.75 1.88 –1 Retail 3.58 2.77 2.18 –3 Sales and retail of motor vehicles; repair of motor vehicles; retail sale of automobiles
3.37 2.88 2.18 2
Supporting and aux transport activities (including warehousing); travel agencies
3.61 2.79 2.12 1
Wholesale trades 3.46 2.83 2.23 1
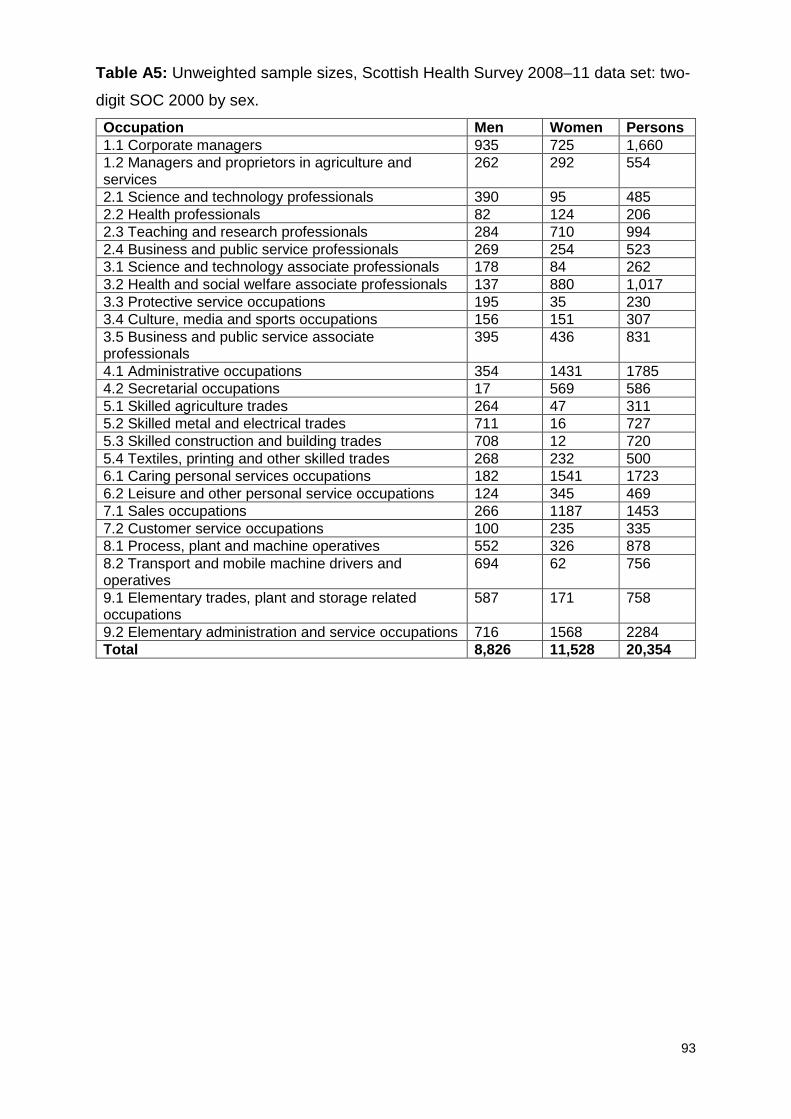
93
Table A5: Unweighted sample sizes, Scottish Health Survey 2008–11 data set: two-
digit SOC 2000 by sex.
Occupation Men Women Persons 1.1 Corporate managers 935 725 1,660 1.2 Managers and proprietors in agriculture and services
262 292 554
2.1 Science and technology professionals 390 95 485 2.2 Health professionals 82 124 206 2.3 Teaching and research professionals 284 710 994 2.4 Business and public service professionals 269 254 523 3.1 Science and technology associate professionals 178 84 262 3.2 Health and social welfare associate professionals 137 880 1,017 3.3 Protective service occupations 195 35 230 3.4 Culture, media and sports occupations 156 151 307 3.5 Business and public service associate professionals
395 436 831
4.1 Administrative occupations 354 1431 1785 4.2 Secretarial occupations 17 569 586 5.1 Skilled agriculture trades 264 47 311 5.2 Skilled metal and electrical trades 711 16 727 5.3 Skilled construction and building trades 708 12 720 5.4 Textiles, printing and other skilled trades 268 232 500 6.1 Caring personal services occupations 182 1541 1723 6.2 Leisure and other personal service occupations 124 345 469 7.1 Sales occupations 266 1187 1453 7.2 Customer service occupations 100 235 335 8.1 Process, plant and machine operatives 552 326 878 8.2 Transport and mobile machine drivers and operatives
694 62 756
9.1 Elementary trades, plant and storage related occupations
587 171 758
9.2 Elementary administration and service occupations 716 1568 2284 Total 8,826 11,528 20,354

94
Table A6: Unweighted sample sizes, Scottish Health Survey workplace stress
module 2009 and 2011: two-digit SOC 2000.
Occupation Persons 1.1 Corporate managers 248 1.2 Managers and proprietors in agriculture and services 72 2.1 Science and technology professionals 86 2.2 Health professionals 29 2.3 Teaching and research professionals 137 2.4 Business and public service professionals 89 3.1 Science and technology associate professionals 37 3.2 Health and social welfare associate professionals 168 3.3 Protective service occupations 36 3.4 Culture, media and sports occupations 41 3.5 Business and public service associate professionals 121 4.1 Administrative occupations 200 4.2 Secretarial occupations 69 5.1 Skilled agriculture trades 46 5.2 Skilled metal and electrical trades 96 5.3 Skilled construction and building trades 93 5.4 Textiles, printing and other skilled trades 47 6.1 Caring personal services occupations 217 6.2 Leisure and other personal service occupations 56 7.1 Sales occupations 149 7.2 Customer service occupations 49 8.1 Process, plant and machine operatives 79 8.2 Transport and mobile machine drivers and operatives
91
9.1 Elementary trades, plant and storage related occupations
69
9.2 Elementary administration and service occupations 206 Total 2531

95
Table A9: Unweighted sample sizes, Scottish Health Survey 2008–11 data set:
industry category by sex.
Number Industry Men Women Persons 1 Activities of membership organisations not
elsewhere classified 30 35 65
2 Agriculture and fishing 312 112 424 3 Computer and related activities 133 55 188 4 Construction 1306 141 1447 5 Education 449 1347 1796 6 Electrical and electronic manufacturing 118 85 203 7 Electricity, gas and water 198 82 280 8 Extra territorial organisations and bodies 1 2 3 9 Extraction of petroleum and natural gas 270 64 334 10 Financial services 263 458 721 11 Forestry, logging and related service activities 35 8 43 12 Health and social work 568 3077 3645 13 Hotels and restaurants 400 970 1370 14 Land transport 337 85 422 15 Manufacture of basic and fabricated metals 118 20 138 16 Manufacture of chemicals and chemical products 64 46 110 17 Manufacture of food products and beverages 290 232 522 18 Manufacture of machinery or equipment not
otherwise classified 144 40 184
19 Manufacture of rubber, plastic, non-metallic minerals
84 31 115
20 Manufacturing of wood and paper products 75 22 97 21 Mining, manufacture of minerals, waste 74 17 91 22 Motor vehicles and other transport equipment 106 25 131 23 Other business activities 602 739 1341 24 Other manufacturing* 67 144 211 25 Other service activities 44 252 296 26 Post and telecoms 209 117 326 27 Private households with employed persons 10 48 58 28 Public administration and defence; compulsory
social security 664 731 1395
29 Publishing, printing and reproduction of recorded media
63 64 127
30 Real estate and renting 99 111 210 31 Recreational, cultural and sporting activities 238 333 571 32 Research and development 20 37 57 33 Retail 603 1578 2181 34 Sales and retail of motor vehicles; repair of motor
vehicles; retail sale of automobiles 222 84 306
35 Sewage and refuse disposal 67 7 74 36 Supporting and aux transport activities (including
warehousing); travel agencies 201 97 298
37 Textiles manufacturing 37 69 106 38 Water and air transport 100 41 141 39 Wholesale trades 191 95 286
* Manufacturing of wearing apparel; leather goods; furniture; and tobacco, of which
the largest categories were manufacture of wearing apparel and of furniture.

96
Table A10: Unweighted sample sizes, Scottish Health Survey workplace stress
module 2009 and 2011: by industry category (16–64 years).
Number Industry Persons 1 Activities of membership organisations not elsewhere classified 9 2 Agriculture and fishing 61 3 Computer and related activities 29 4 Construction 176 5 Education 245 6 Electrical and electronic manufacturing 21 7 Electricity, gas and water 39 8 Extraction of petroleum and natural gas 41 9 Financial services 119 10 Forestry, logging and related service activities 9 11 Health and social work 491 12 Hotels and restaurants 140 13 Land transport 57 14 Manufacture of basic and fabricated metals 18 15 Manufacture of chemicals and chemical products 11 16 Manufacture of food products and beverages 45 17 Manufacture of machinery or equipment not otherwise classified 21 18 Manufacture of rubber, plastic, non-metallic minerals 11 19 Manufacturing of wood and paper products 9 20 Mining; manufacture of minerals; waste 9 21 Motor vehicles and other transport equipment 13 22 Other business activities 154 23 Other manufacturing 16 24 Other service activities 34 25 Post and telecoms 43 26 Private households with employed persons 5 27 Public administration and defence; compulsory social security 200 28 Publishing, printing and reproduction of recorded media 16 29 Real estate and renting 28 30 Recreational, cultural and sporting activities 65 31 Research and development 5 32 Retail 233 33 Sales and retail of motor vehicles; repair of motor vehicles; retail sale of
automobiles 36
34 Sewage and refuse disposal 2 35 Supporting and aux transport activities (including warehousing); travel
agencies 33
36 Textiles manufacturing 6 37 Water and air transport 29 38 Wholesale trades 50 39 Total 2529

97
References
1 Neyeloff JL, Fuchs SC, Moreira LB. Meta-analyses and forest plots using a
Microsoft Excel spreadsheet: step-by-step guide focusing on descriptive data
analysis. BMC Res Notes 2012;5:52. 2 Scottish Government. Scottish Health Survey.
www.gov.scot/Topics/Statistics/Browse/Health/scottish-health-survey (accessed
10/01/17). 3 UK Data Service. Annual Population Survey.
https://discover.ukdataservice.ac.uk/series/?sn=200002 (accessed 10/01/2017). 4 UK Data Service. Labour Force Survey.
https://discover.ukdataservice.ac.uk/series/?sn=2000026 (accessed 10/01/2017). 5 Office for National Statistics. Annual Survey of Hours and Earnings Statistical
Bulletins.
www.ons.gov.uk/employmentandlabourmarket/peopleinwork/earningsandworkinghou
rs/bulletins/annualsurveyofhoursandearnings/previousReleases (accessed
10/01/2017). 6 Bambra C. Work, Worklessness and the Political Economy of Health. Oxford:
Oxford University Press; 2011. 7 Leyland AH, Dundas R, McLoone P, Boddy FA. Cause-specific inequalities in
mortality in Scotland: two decades of change. A population-based study. BMC Public
Health 2007;7:172. 8 Fair Work Convention. Fair Work Framework 2016. APS Group; 2016. 9 Scottish Parliament Economy, Energy and Tourism Committee. 1st Report, 2016
(Session 4): Taking the High Road - Work, Wages and Wellbeing in the Scottish
Labour Market. Edinburgh: Scottish Parliament; 2016. 10 Taulbut M, McCartney G. The chance to work in Scotland. Edinburgh: NHS Health
Scotland; 2013. 11 Marmot M. Strategic review of health inequalities in England post-2010. Marmot
review final report. London: University College London; 2010. 12 Black D. (Chair) Inequalities in health. London: DHSS; 1980. 13 Acheson D. (Chairman) Independent enquiry into inequalities in health. London:
The Stationery Office; 1998.

98
14 Scottish Government. Growth s ectors. www.gov.scot/Topics/Economy/Key-
Sectors Sectors (accessed 19/12/16). 15 Eurofound. Occupational Profiles in Working Conditions: Identification of Groups
with Multiple Disadvantages. Dublin: Eurofound; 2014. 16 Eurofound. Working Conditions and Job Quality: Comparing Sectors in Europe.
Dublin: Eurofound; 2014. 17 Eurofound. European Working Conditions Survey (EWCS); 2015.
www.eurofound.europa.eu/surveys/european-working-conditions-surveys 18 Scottish Centre for Social Research, Department of Epidemiology and Public
Health, University College London, The MRC Social and Public Health Sciences
Unit, Glasgow. Scottish Health Survey ’10. Questionnaires and showcards.
www.gov.scot/Resource/0038/00388424.pdf (accessed 19/12/16). 19 Lawder R, Harding O, Stockton D, et al. Is the Scottish population living
dangerously? Prevalence of multiple risk factors: the Scottish Health Survey 2003.
BMC Public Health 2010;10:330. 20 Kuper H, Marmot M. Job strain, job demands, decision latitude, and risk of
coronary heart disease within the Whitehall II study. Journal of Epidemiology and
Community Health 2003;57:147–153. 21 Von Bonsdorff MB, Seitsamo J, Von Bonsdorff ME, Ilmarinen J, Kan C-H, Rd N,
Rantanen T. Job strain among blue-collar and white-collar employees as a
determinant of total mortality: a 28-year population- based follow-up. BMJ open.
2012;2(e000860). 22 Health and Safety Executive. LFS - Labour Force Survey - Self-reported work-
related ill health and workplace injuries: Index of LFS tables; 2016.
www.hse.gov.uk/statistics/lfs/index.htm#allinjuries (accessed 19/11/16). 23 Macintyre S. Inequalities in health in Scotland: what are they and what can we do
about them? Glasgow: MRC Social & Public Health Sciences Unit; 2007. 24 Wilson M, Kellock C, Adams D, Landsberg L. The Scottish health survey topic
report: mental health and wellbeing. Edinburgh: Scottish Government; 2015. 25 Scottish Government. The Scottish Health Survey 2014: Volume 1: Main Report.
Edinburgh: Scottish Government; 2015. 26 Government. Help with moving from benefits to work; 2016. www.gov.uk/moving-
from-benefits-to-work/job-search-programmes (accessed 10/01/2017). 27 Taulbut M, Hearty W, Myers F, Craig N, McCartney G. Pulling in different
directions? The impact of economic recovery and continued changes to social

99
security on health and health inequalities in Scotland. Edinburgh: NHS Health
Scotland; 2016. 28 Muntaner C, Ng E, Benach J, Chung H. Occupation and (social) class refer to
different social mechanisms. Occup Environ Med 2012;69(10):770–1. 29 Government. Civil Service people surveys; 2012.
www.gov.uk/government/collections/civil-service-people-surveys 30 Department for Business Innovation & Skills. The 2011 Workplace Employment
Relations Study (WERS) Transparency. London; Government; 2013. 31 Health and Safety Executive. www.hse.gov.uk (accessed 5/1/17). 32 DAGitty. http://dagitty.net (accessed 19/12/16). 33 Scottish Longitudinal Study Development & Support Unit. Current projects.
http://sls.lscs.ac.uk/projects/view/2013_015/ (accessed 19/12/16). 34 Harkins C, Egan J. The rise of in-work poverty and the changing nature of poverty
and work in Scotland: what are the implications for population health? Glasgow:
GCPH: 2013. 35 Stansfeld SA, Pike C, McManus S, Harris J, Bebbington P, Brugha T, Hassiotis A,
Jenkins R, Meltzer H, Moran P, Clark C. Occupations, work characteristics and
common mental disorder. Psychological Medicine 2013;43:961–973.