Embed Size (px)
Citation preview

Health Inequalities National Support Team Diagnostic Workbook
Assessment of Services to Reduce Diabetes-related Mortality
Includes potential key actions to reduce mortality
Identifying strengths and effective practice and making tailored recommendations on how to address gaps in service delivery
1

DH INFORMATION READER BOX
Policy EstatesHR / Workforce CommissioningManagement IM & TPlanning / FinanceClinical Social Care / Partnership Working
Document Purpose
Gateway ReferenceTitle
Author
Publication DateTarget Audience
Circulation List
Description
Cross Ref
Superseded Docs
Action Required
TimingContact Details
0
15591
For Information
For Recipient's Use
Assessment of Services to Reduce Diabetes-related Mortality
London SE1 8UGwww.dh.gov.uk/HINST
Health Inequalities National Support TeamNational Support TeamsWellington House133 - 155 Waterloo Road
This workbook was developed by the Health Inequalities National Support Teams (HINST) with 70 local authorities covering populations in England. Local areas could use this approach when analysing whether a population level improvements could be achieved from a set of best-practice and established interventions. This is offered as useful resource for commissioners: use is NOT mandatory.
N/A
Chris Burton, DH Health Inequalities National Support Team
01 Apr 2011PCT CEs, NHS Trust CEs, SHA CEs, Care Trust CEs, Foundation Trust CEs , Medical Directors, Directors of PH, Directors of Nursing, Local Authority CEs, Directors of Adult SSs, Allied Health Professionals, GPs, Communications Leads, Directors of Children's SSs, GP Commissioning Leads
#VALUE!
0
N/A
N/A
2

Contents
Foreword ....................................................................................................................................... 4 Executive Summary ...................................................................................................................... 5 Introduction.................................................................................................................................... 7 How to Use this Workbook – a guide for facilitators...................................................................... 8 Background to Population Level Interventions .............................................................................. 9 Commissioning Services to Achieve Best Population Outcomes................................................ 11 Equality........................................................................................................................................ 15 Why this topic has been chosen.................................................................................................. 15 The Workbook ............................................................................................................................. 17 1. Known intervention efficacy ................................................................................................. 18 2. Local Service Effectiveness ................................................................................................. 20 3. Cost effectiveness ................................................................................................................ 24 4. Accessibility.......................................................................................................................... 25 5. Engaging the public.............................................................................................................. 26 6. Known population health needs ........................................................................................... 27 7. Expressed demand .............................................................................................................. 28 8. Equitable resourcing ............................................................................................................ 30 9. Responsive services ............................................................................................................ 31 10. Supported self-management................................................................................................ 32 11. Adequate service volumes ................................................................................................... 34 12. Balanced service portfolio .................................................................................................... 34 13. Networks, Leadership and Coordination ............................................................................ 35 Optimal Population Outcome ...................................................................................................... 37
Appendix 1: Health Inequalities National Support Team. Tackling Inequalities in Diabetes Mortality Rates - Ten potential key actions to reduce mortality..........................................38 Appendix 2: Use of QOF registers to improve population level outcomes .........................40 Appendix 3: Best Practice Approach to delivering systematic ...........................................41 Appendix 4: HINST Model: Community engagement in long term conditions to help reach all patients for all aspects of care.......................................................................................44 Appendix 5.........................................................................................................................46
3

Foreword National Support Teams (NSTs) were established by the Department of Health from 2006 to support local areas – including Local Authorities, Primary Care Trusts (PCTs) and their partners – to tackle complex public health issues more effectively, using the best available evidence. By undertaking intensive, ‘diagnostic’ visits to local areas, spending time with key leaders (commissioners and providers) including clinicians and front-line staff, the ten NSTs provided intelligence, support and challenge to local areas to assist in their achieving better public health outcomes. The programme finished in March 2011. The ten subject specific teams (Sexual Health, Tobacco Control, Health Inequalities, Teenage Pregnancy, Childhood Obesity, Alcohol Harm Reduction, Infant Mortality, Response to Sexual Violence, Vaccination and Immunisation and Children and Young People’s Emotional Wellbeing and Mental Health) were commissioned and established with a focus on improving health and reducing health inequalities. The ten teams undertook more than 450 visits to local partnerships during the course of the programme and their findings and successes have been documented in Knowledge Management and Evaluation reports. Each team also produced reports setting out and consolidating the learning from their work. A further report that captures best practice identified by each team is planned to enable local areas to continue using the expertise and lessons learnt from the NST model. The NST process involved a desk review of key documentation and data-based intelligence, and interviews with key informants, often in combination with a series of workshops or focus groups. Collation and analysis of findings was immediate, and the findings, including strengths and recommendations, were fed back straight away and on site to the key local players and leadership. Recommendations were accompanied by offers of support, either at the time of reporting, or as part of follow-up activity. The Department is publishing a number of reports which distil the learning from the programme, and exemplify the methodology employed.
4

Executive Summary This workbook is one of a series developed by the Health Inequalities National Support Team (HINST), in its work with the 70 local authorities covering populations in England with the highest levels disadvantage and poorest health. These workbooks are a summary of local views on good practice. The suggested approaches are not mandatory, and reflect learnings from a snapshot in time. Where there is clear established evidence to support interventions, this has been signposted in the footnote. This is offered as useful resource for commissioners: use is NOT mandatory. The topic of this workbook – Assessment of Services to Reduce Diabetes-related Mortality - was selected for its potential impact on health and wellbeing, and on mortality and life expectancy in the short, medium or long term. Diabetes is a major contributor to cardiovascular disease mortality and to the increased mortality and decreased life expectancy in the most disadvantaged geographical areas and the most vulnerable groups such as those with mental health problems. The National Diabetes Audit (2008-9)1 showed that only 50% of the 1,620,278 participants with type 2 diabetes were receiving all of the nine NICE care processes essential to risk evaluation and selection of treatment. (NICE Clinical Guidance CG872). The Association of Public Health Observatories (APHO) Diabetes Prevalence Model3 has estimated that about 3 million people aged 16 years and older in England had diabetes in 2010. Comparisons with the 2008/09 Quality and Outcomes Framework (QOF) data suggest that only 72.9% of adults with diabetes are currently diagnosed (around 2.2 million) which suggests that there were 821,800 adults with diabetes who were not diagnosed in England in 2009. Prevalence of diabetes among adults is rising, with an expected number of over 8.5 million adults over 16 in England by 2030 The systematic approach to diabetes treatment and care explored using this workbook, could reduce the variation shown in the National Diabetes Audit. Implementation of a systematic approach will have a population level impact in the short term in reducing inequalities in health, mortality and morbidity and improving life expectancy. An impact would be achieved in the medium term through preventative interventions and earlier detection. This workbook – which is recommended for use in a facilitated workshop – provides advice on achieving best outcomes at population level, and for identifying and recommending changes that could be introduced locally. Recommended workshop invitees are provided. Central to the HINST approach is a diagnostic framework – Commissioning for Best Population Level Outcomes (see p13), which focuses on evidence-based interventions which could be used in aiming for the best possible outcomes at population level. The left part of the framework addresses delivery of service outcomes in the most effective and cost effective manner. This is balanced by considerations in the right part, of how the 1 NHS Information Centre (2010) National Diabetes Audit Executive Summary, 2008-2009 http://www.ic.nhs.uk/services/national-clinical-audit-support-programme-ncasp/audit-reports/diabetes . London 2 National Institute for Health and Clinical Excellence (NICE); 2009 May. 49 p. (Clinical guideline; no. 87) http://www.nice.org.uk/guidance/CG873 APHO Diabetes Prevalence Model (2010)http://www.yhpho.org.uk/default.aspx?RID=81090
5

population uses services, and is supported to do so, to help make sure optimal population level outcomes that are fairly distributed. The framework points to the following areas of consideration:
A CHALLENGE TO PROVIDERS
1. Known intervention efficacy 2. Local service effectiveness 3. Cost effectiveness 4. Accessibility 5. Engaging the public
B POPULATION FOCUS
6. Known population health needs 7. Expressed demand 8. Equitable resourcing 9. Responsive services 10. Supported self management
11. Adequate service volumes 12. Balanced service portfolio 13. Networks, leadership and coordination
The workbook is made up of sets of detailed questions in the above categories. They provide local groups of commissioners and providers with a systematic approach to deciding what needs to be done in relation to diabetes to further improve population health and wellbeing, capitalising on evidence-based interventions. How these improvements will best be achieved in a given locality will be for local participants to decide. The workbook signposts good practice and guidance where this may be helpful. Appendix 1 outlines 10 potential key actions for successful interventions this area, which have been identified by HINST to have the biggest impact on morbidity and mortality in the short term and thus impact on costs of hospital admissions and on health inequalities.
6
Introduction
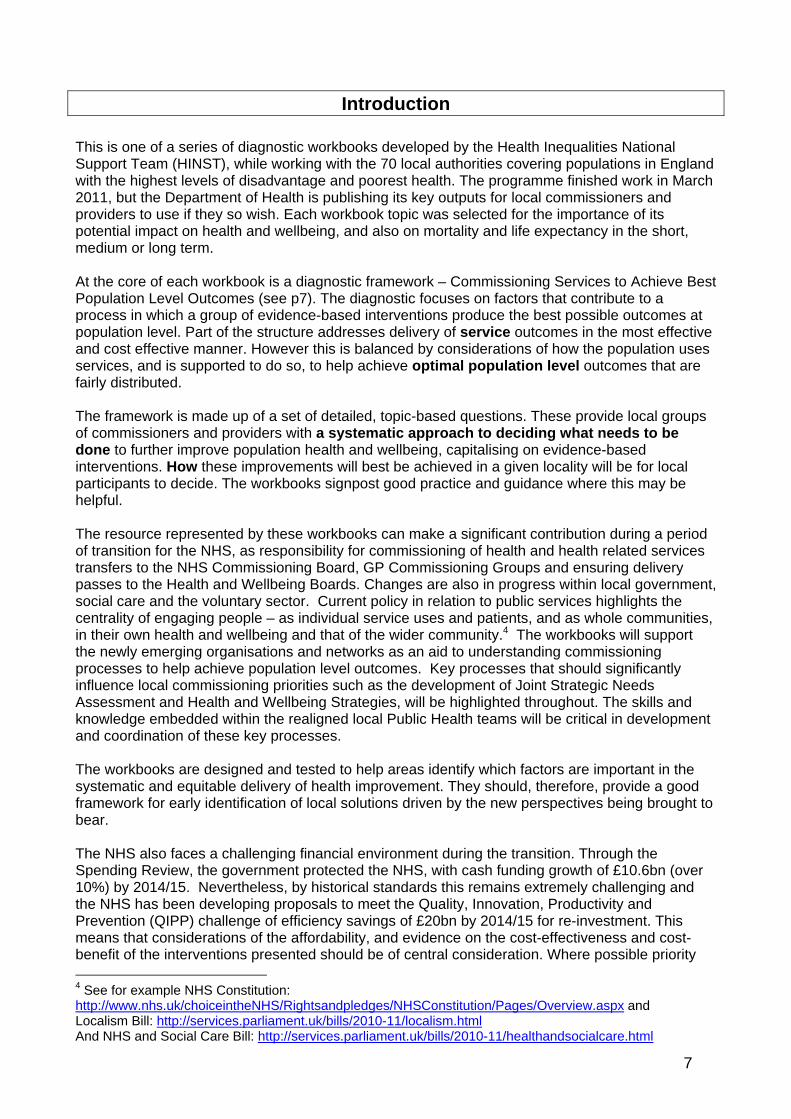
This is one of a series of diagnostic workbooks developed by the Health Inequalities National Support Team (HINST), while working with the 70 local authorities covering populations in England with the highest levels of disadvantage and poorest health. The programme finished work in March 2011, but the Department of Health is publishing its key outputs for local commissioners and providers to use if they so wish. Each workbook topic was selected for the importance of its potential impact on health and wellbeing, and also on mortality and life expectancy in the short, medium or long term. At the core of each workbook is a diagnostic framework – Commissioning Services to Achieve Best Population Level Outcomes (see p7). The diagnostic focuses on factors that contribute to a process in which a group of evidence-based interventions produce the best possible outcomes at population level. Part of the structure addresses delivery of service outcomes in the most effective and cost effective manner. However this is balanced by considerations of how the population uses services, and is supported to do so, to help achieve optimal population level outcomes that are fairly distributed. The framework is made up of a set of detailed, topic-based questions. These provide local groups of commissioners and providers with a systematic approach to deciding what needs to be done to further improve population health and wellbeing, capitalising on evidence-based interventions. How these improvements will best be achieved in a given locality will be for local participants to decide. The workbooks signpost good practice and guidance where this may be helpful. The resource represented by these workbooks can make a significant contribution during a period of transition for the NHS, as responsibility for commissioning of health and health related services transfers to the NHS Commissioning Board, GP Commissioning Groups and ensuring delivery passes to the Health and Wellbeing Boards. Changes are also in progress within local government, social care and the voluntary sector. Current policy in relation to public services highlights the centrality of engaging people – as individual service uses and patients, and as whole communities, in their own health and wellbeing and that of the wider community.4 The workbooks will support the newly emerging organisations and networks as an aid to understanding commissioning processes to help achieve population level outcomes. Key processes that should significantly influence local commissioning priorities such as the development of Joint Strategic Needs Assessment and Health and Wellbeing Strategies, will be highlighted throughout. The skills and knowledge embedded within the realigned local Public Health teams will be critical in development and coordination of these key processes. The workbooks are designed and tested to help areas identify which factors are important in the systematic and equitable delivery of health improvement. They should, therefore, provide a good framework for early identification of local solutions driven by the new perspectives being brought to bear. The NHS also faces a challenging financial environment during the transition. Through the Spending Review, the government protected the NHS, with cash funding growth of £10.6bn (over 10%) by 2014/15. Nevertheless, by historical standards this remains extremely challenging and the NHS has been developing proposals to meet the Quality, Innovation, Productivity and Prevention (QIPP) challenge of efficiency savings of £20bn by 2014/15 for re-investment. This means that considerations of the affordability, and evidence on the cost-effectiveness and cost-benefit of the interventions presented should be of central consideration. Where possible priority 4 See for example NHS Constitution: http://www.nhs.uk/choiceintheNHS/Rightsandpledges/NHSConstitution/Pages/Overview.aspx and Localism Bill: http://services.parliament.uk/bills/2010-11/localism.htmlAnd NHS and Social Care Bill: http://services.parliament.uk/bills/2010-11/healthandsocialcare.html
7

should be given to interventions which are likely to lead to cash-releasing savings that can be re-invested in other services, based on a sound evidence base. Some of the relevant evidence has been referenced through the workbooks. Local facilitators and participants will be aware of changes that may be outside the scope of this workbook and of any detail in the workbook that may have been superseded. These should be taken into account. To facilitate this, a generic workbook (available on the HINST website, www.dh.gov.uk/HINST) has been produced that could be used to guide the diagnostic questions and discussion during the workshop, with this detailed workbook being used alongside the generic one for reference
How to Use this Workbook – a guide for facilitators
The objective of the workbook, used in a workshop setting, is to gain a picture of the local strengths and gaps in services in relation to the objective of achieving best outcomes at population level, and to identify and recommend changes that could be introduced. The workbook is best used in a facilitated workshop setting for a minimum of 8 and a maximum of 25 participants. Allow 4 hours for the workshop. The participants in the workshop should include key individuals who are involved in planning, commissioning and delivering services and interventions in relation to the workbook topic through a partnership approach. The make-up of the group will vary according to local situations but the suggested minimal attendee list for this workbook is set out below: • Diabetes Lead Commissioner/Manager • Diabetes Network Chair • Diabetes clinical lead GP • Consultant Diabetologist • Diabetes Network Coordinator • Public Health Consultant • GP Commissioning Lead • QMAS Analyst • QOF Lead • Pharmacy/Medicine Management
• Lead/Deputy • Community development
lead/representative • Specialist Diabetes Nurses (community/
secondary care and practice based) • Dietician • Podiatrist • Psychologist • Diabetes UK/ Local patient and carer reps
Where there is more than one organisation (for example, hospital trust) providing local services, it is advisable to invite senior representatives from each. Provide a copy of this workbook to each participant at the workshop. It is suggested that the participants do not see the workbook in advance, but inform them that the workshop will be an opportunity to explore their knowledge of approaches to the issue with others who will bring differing perspectives. This will mitigate against any participants over-preparing, becoming defensive or being resistant to discussing – and finding solutions for – local issues The facilitator should be familiar with the workbook questions and the model described below, which helps to gain a population level perspective. It is suggested that facilitators introduce the participants to this model and approach. Following the introduction, it is useful to look at section 13 first as this gives an overview of the situation in the area for this topic and makes sure all participants have an opportunity to contribute at the beginning. Finish by working through each sections 1-12 of the model). A group discussion about all of the questions in each section allows strengths, best practice and gaps to be identified, and the group to begin to think about where improvements could be made. A separate publication available on the website includes a facilitator’s recording book, which can be
8
used during the workshop to record this discussion. This need not be copied for workshop participants. Key actions and lead stakeholders to take these actions forward can be identified during the workshop. The greatest impact is likely to result if summaries of these key actions and of the recognised strengths and recommendations from the workshop are produced and circulated to attendees and key accountable stakeholders within the partnership, following the workshop. Throughout the workbook, some questions have been highlighted in bold italics. These are questions that investigate areas of work that are likely to have the biggest impact on reducing health inequalities. They will help to work towards services that are delivered in a way that is systematic, reducing variability and resulting in population level change. These potential key actions are summarised in Appendix 1. It is advisable to emphasise these questions during the workshop.
Background to Population Level Interventions Challenging public health outcomes, such as achieving significant percentage change within a given population by a given date, will require systematic programmes of action to implement interventions that are known to be effective and reaching as many people as possible who could benefit. Programme characteristics will include being: • Evidence based – concentrating on interventions where research findings and professional
consensus are strongest • Outcomes orientated – with measurements locally relevant and locally owned • Systematically applied – not depending on exceptional circumstances and exceptional
champions • Scaled up appropriately – ‘industrial scale’ processes require different thinking to small scale
projects or pilots (‘bench experiments’) • Appropriately resourced – refocusing on core budgets and services rather than short bursts
of project funding • Persistent – continuing for the long haul, capitalising on, but not dependant on fads, fashion
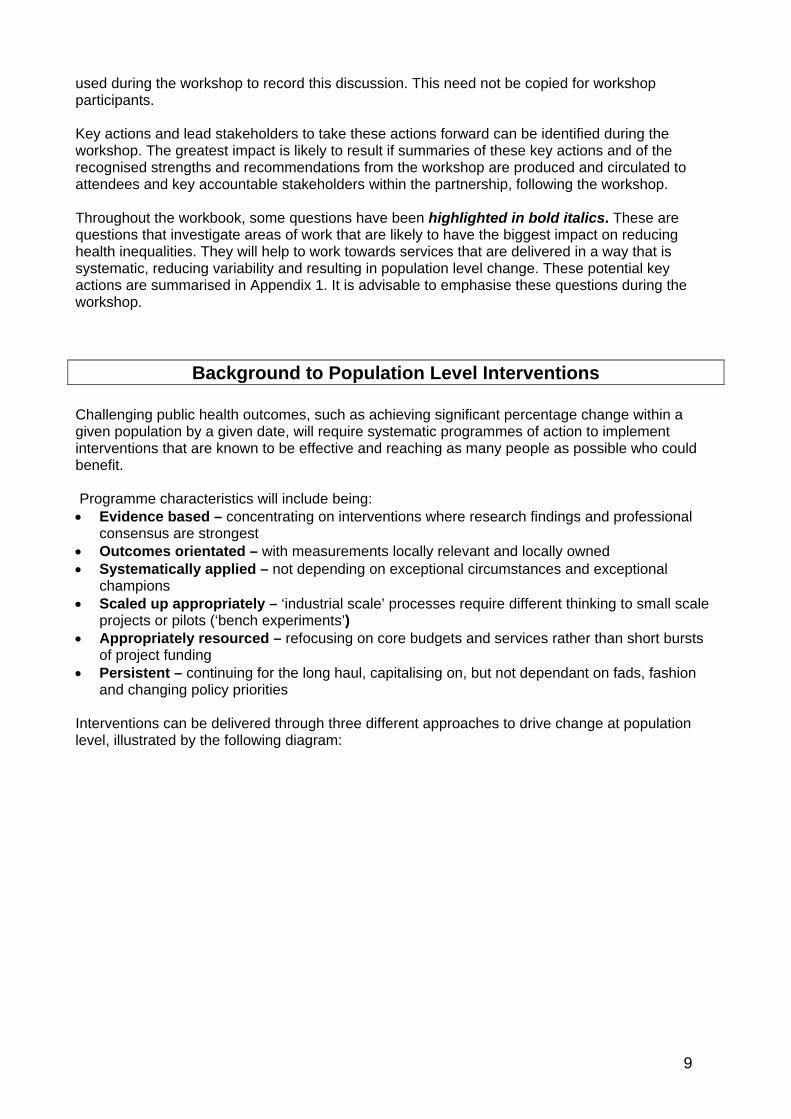
and changing policy priorities Interventions can be delivered through three different approaches to drive change at population level, illustrated by the following diagram:
9

Population
Population approaches Direct population level interventions will include developing healthy public policy, legislation, regulation, taxation and public funding strategies. These elements should support making ‘healthy choices easy choices’ for individuals and communities. The impacts of such population level interventions, however, will not automatically ‘trickle down’ to all, often in particular missing those who are socially excluded for various reasons. Strategies for targeted communication and education, service support and even enforcement will be required to achieve full impact. Individual approaches through services Some interventions taken up at individual level, such as support for environment and behaviour change, therapies, treatments and rehabilitation, can change individual risk significantly, in some cases by 30-40%. The challenge is to achieve so many of those individual successes that it adds up to percentage change at population level. This will be achieved only if services take into account issues of system and scale to enable this to happen, and work to address population level outcomes as well as those for individual service users. Improvements in health and wellbeing will require some reorientation of health and other services to take a more holistic view of individual circumstances, with regard to any personal characteristics/sub-population group status or socio-economic status and to focus on development of personal skills of staff and service users, so promoting healthy choices and actions.
Partnership, Vision and Strategy,
Leadership and Engagement
Systematic community engagement
Systematic and scaled interventions through
services
Individual Community
Service engagement with the community
Producing Percentage Change at Population C. Bentley 2007
10
Community approaches Individuals will only choose to use and benefit from certain behaviours and actions if those behaviours fit with the cultural and belief system of their own community. Communities can be based on place (neighbourhood, school, workplace), culture (ethnicity, faith) and others (disability, sexual orientation). Community development is one way of facilitating communities’ awareness of the factors and forces that affect their wellbeing, health and quality of life. Community engagement is often patchy, favouring those communities that already have leadership, organisation and some resources. Instead, it needs to be systematic in bringing top-down and bottom-up priorities together into plans. This will strengthen community action to create more supportive environments and develop knowledge and skills of community members. Service links into communities can be superficial, of poor quality, unsystematic, and based on low levels of understanding. Connectivity between services can be disorganised and confusing. Use of the voluntary community and faith sector as a bridge between services and community based structures needs to be more systematic and based on need rather than supply. Commissioning is key to this.
Commissioning Services to Achieve Best Population Outcomes Substantial progress can be achieved in making an impact in the short, medium and long term in relation to inequalities in mortality and life expectancy through a focus on existing services. Because of this, extra attention is given here to extracting maximum benefit from delivery of interventions for which there is strong evidence of effectiveness. In addition there is a deliberate emphasis wherever possible, on improving access to services of a scale that will impact on bringing about a population level improvement in mortality and life expectancy within a two to three year period. The detail is illustrated in the attached diagram on Page 13 with the title ‘Commissioning for Best Population Level Outcomes’, otherwise known as the ‘Christmas Tree’ diagnostic, with an accompanying description of its component principles. The framework balances two sets of factors that determine whether optimal outcome can be achieved at population level from a given set of personal health interventions. The right hand side of the diagram (1 to 5) - a challenge to providers: links the factors that will influence health service outcomes, that is how can we construct the most effective service. However, optimal outcomes at population level will not be obtained without the following: The left hand side of the diagram (6 to 10) - a population focus: identifies those factors that determine whether a community makes best use of the service provided – for example, whether the benefits of personalised improvements to services are having a systematic impact on reducing health inequalities at the population level. The balance between the two sides of the diagram - the commissioning challenge: Ensuring equality of outcome, not just equality of access to service provision and support, is a significant and crucial challenge for commissioners. The ‘Christmas Tree’ diagnostic, is a tool to help achieve this. The right side of the diagram enables commissioners to identify the best services available for their population. The left side allows commissioners to consider whether what is commissioned and delivered best meets the needs of all people in the local population. Attention to both sides of the diagram will help in commissioning of services that are effective and engaged with and used by all of the diverse communities in the area they serve.
11

The central elements of the diagram are concerned with ensuring that when the most effective services/interventions are identified that are fully acceptable, accessible and effective in terms of take-up and compliance, there is adequate capacity to meet the need. Effective leadership and networks are needed to keep all these elements under review to aim for continuous improvement and equality of morbidity and mortality outcomes.
12

Commissioning for Best Population Level Outcomes
Population Focus Challenge to ProvidersOptimalPopulation Outcome 5. Engaging the public10. Supported self-
management
13. Networks, leadership 9. Responsive Services 4. Accessibility and coordination
2. Local Service 7. Expressed Demand Effectiveness
13
1. KnownInterventio
n Efficacy
12. Balanced Service Portfolio
11. Adequate Service Volumes8. Equitable Resourcing 3. Cost Effectiveness
6. Known Population
Needs
C Bentley 2007

Commissioning for Best Population Level Outcomes
A CHALLENGE TO PROVIDERS
1. Known Intervention Efficacy: Looks for life saving interventions, for which there is strong evidence, to be implemented equitably and made available to as many people who could benefit as possible.
2. Local Service Effectiveness: Aim for service providers maintaining high standards of local effectiveness through education and training, driven by systems of professional and organisational governance and audit.
3. Cost Effectiveness: Aim for programme elements that are as
affordable as possible at population level. 4. Accessibility: Aim for services to be designed with the
minimum barriers to access, balancing a drive to bring services closer to the patient with the need for efficiency and effectiveness of that service.
5. Engaging the Public: Working with service users and
communities to aim for needs and requirements to be placed at the centre of service provision and for quality assurance systems in place that makes the services acceptable to service users.
B POPULATION FOCUS
6. Known Population Health Needs: Aim for a realistic assessment of the size of the problem locally, its distribution geographically and demographically and the level and type of service being based upon this assessment.
7. Expressed Demand: Aim for as many people as possible who
are suffering from the problem or its precursors, to present to services in a timely and appropriate fashion, through informing, educating and supporting the population.
8. Equitable Resourcing: Aim for the distribution of finance and
other resources to support equitable outcomes according to need.
9. Responsive Services: When people present to services, aim
to make sure they are afforded equal access to timely beneficial interventions according to need.
10. Supported Self Management: Where appropriate, help
service users to be empowered to make choices about their circumstances and service offer on the basis of good information, and to be supported to utilise the service offer to best effect.
11. Adequate Service Volumes: Commissioning adequate service volumes to aim for acceptable access times. 12. Balanced Service Portfolio: Aim for balance of services within pathways to avoid bottlenecks and delays. 13. Networks, Leadership and Co-ordination: Designating leadership and co-ordination to aim for services that
are commissioned and networked to meet population need and the population is supported to use services and interventions appropriately.
Whilst the service design elements are an immediate concern to providers, all sections of the ‘Christmas Tree’ diagnostic are of direct relevance
to commissioners.
14

Equality
Equalities perspectives need to be built into all whole population approaches. The Equality Act 2010 set out the public sector equality duty:
(1) A public authority must, in the exercise of its functions, have due regard to the need to:
(a) eliminate discrimination, harassment, victimisation and any other conduct that is prohibited by or under this Act;
(b) advance equality of opportunity between persons who share a relevant protected characteristic and persons who do not share it;
(c) foster good relations between persons who share a relevant protected characteristic and persons who do not share it.
The Act identifies a number of ‘protected’ population groups/characteristics where specific elements of the legislation apply. These groups/characteristics are:
age; disability; sex reassignment; marriage and civil partnership; pregnancy and maternity; race; religion or belief; sex; sexual orientation.
Although socioeconomic inequalities are not specifically included in the Equality Act, there are a range of duties in relation to tackling inequalities included at different levels in new health and social care legislation, and for all key structures and partners involved in the commissioning and delivery of this legislation. The Health and Social Care Bill 2010 proposes new legal duties on health inequalities for the Secretary of State and the NHS. Subject to Parliamentary approval: • The Secretary of State for Health must have regard to the need to reduce health inequalities
relating to the NHS and public health. • The NHS Commissioning Board and GP consortia must have regard to reducing inequalities
in access to, and outcomes of, healthcare.
In order to carry out these duties effectively an emphasis on socioeconomic disadvantage will be essential as it is recognised as a major driver in relation to inequalities of access to, and outcomes of, health and wellbeing services.5
Useful Materials6
Why this topic has been chosen
The raised glucose levels resulting from type 1 or type 2 diabetes can gradually damage blood vessels and lead to a range of complications, including atheroma, which can lead to problems such as angina, heart attacks and stroke, kidney damage (sometimes leading to kidney failure), eye problems affecting vision and foot problems due to poor circulation and nerve damage. Early mortality is therefore common in diabetic patients. Weight loss, stopping smoking and effective control of blood sugar, cholesterol levels and blood pressure can reduce these complications.
5 The Marmot Review (2010) Fair Society, Healthy Lives - Strategic Review of Health Inequalities in England post 2010
http://www.marmotreview.org/AssetLibrary/pdfs/Reports/FairSocietyHealthyLives.pdf 6 Department of Health (2008) Making the difference – The Pacesetters beginner’s guide to service improvement for equality and diversity in the NHS http://www.dh.gov.uk/en/Publicationsandstatistics/Publications/PublicationsPolicyAndGuidance/DH_086039
15

The Association of Public Health Observatories (APHO) Diabetes Prevalence Model7 has estimated that about 3 million people aged 16 years and older in England had diabetes in 2010. Comparisons with the 2008/09 Quality and Outcomes Framework (QOF) data suggest that only 72.9% of adults with diabetes are currently diagnosed (around 2.2 million) which suggests that there were 821,800 adults with diabetes who were not diagnosed in England in 2009. Prevalence of diabetes among adults is rising, with an expected number of over 8.5 million adults over 16 in England by 2030. The most common form of diabetes in adults is type 2 diabetes, which generally: • develops in over-40-year-olds (although tends to develop in younger in South Asian and
African-Caribbean people) • is more common in people who are overweight or obese • is strongly associated with social disadvantage (prevalence of 2.94% in the least deprived
quintile [Q1] compared to 4.21% in the most deprived quintile [Q5]) • tends to run in families • is five times more common in South Asian and African-Caribbean people The National Diabetes Audit (2008-9)8 showed that only 50% of the 1,620,278 participants with type 2 diabetes were receiving all of the nine NICE care processes essential to risk evaluation and selection of treatment. The Audit showed that healthcare teams saw 90% of the participants during the year but only 67% had achieved an HbA1c equal to or less than 7.5% and only 49% achieved the combined NICE recommended blood pressure indicators. Achievement of HbA1c outcome was associated with older age, being female, white ethnic group, lower body mass index (BMI) and lower social disadvantage, indicating an inequality in outcomes that will impact on mortality. NICE Clinical Guidance CG879 states:
Diabetes care is typically complex and time-consuming, drawing on many areas of healthcare management. The necessary lifestyle changes and the complexities of the effects of therapy, make self-monitoring and education of people with diabetes central parts of management. Treatment and care should take into account patients’ individual needs and preferences.
Diabetes is a major contributor to cardiovascular disease mortality and to the increased mortality and decreased life expectancy in the most disadvantaged areas and the most vulnerable groups such as those with mental health problems. The systematic approach to diabetes treatment and care explored using the ‘Christmas Tree’ (see p13) diagnostic in this workbook, could reduce the variation shown in the National Diabetes Audit. Implementation of a systematic approach will have a population level impact in the short term in reducing inequalities in health, mortality and morbidity and improving life expectancy. An impact would be achieved in the medium term through preventative interventions and earlier detection.
7 APHO Diabetes Prevalence Model (2010)http://www.yhpho.org.uk/default.aspx?RID=81090 8 NHS Information Centre (2010) National Diabetes Audit Executive Summary, 2008-2009 http://www.ic.nhs.uk/services/national-clinical-audit-support-programme-ncasp/audit-reports/diabetes . London 9 National Institute for Health and Clinical Excellence (NICE); 2009 May. 49 p. (Clinical guideline; no. 87) http://www.nice.org.uk/guidance/CG87
16

The Workbook
Assessment of Services to Reduce Diabetes-related Mortality
17

1. Known Intervention
Efficacy
Challenge to Providers
5. Engaging the public
4. Accessibility
2. Local Service Effectiveness
3. Cost Effectiveness 1. Known intervention efficacy
Looks for life saving interventions, for which there is strong evidence, to be implemented equitably and made available to as many people who could benefit as possible.
The evidence base 10 shows that the most effective interventions to reduce diabetes related mortality and morbidity include:
• Patient Education o Offer structured education to every person and/or their carer at and around the
time of diagnosis, with annual reinforcement and review. • Lifestyle management
o All people who smoke should be advised to stop and offered support to facilitate this.
o Obese adults with type 2 diabetes should be offered individualised interventions to encourage weight loss (including lifestyle, pharmacological or surgical interventions) in order to improve metabolic control.
• Psychosocial factors o Children and adults with type 1 and type 2 diabetes should be offered
psychological interventions (including motivational interviewing, goal setting skills and CBT) to improve glycaemic control in the short and medium term.
• Management of diabetes o An HbA1c target level should be agreed with the patient11 although evidence
indicates a level 7.0% (53 mmol/mol) among people with type 2 diabetes is reasonable to reduce risk of microvascular disease and macrovascular disease. A recent population level study suggests an optimal value of 7.5% to reduce mortality.12
o Expected outcomes should be set for individuals in order to balance benefits with harms, in particular hypoglycaemia and weight gain.
• Management of diabetic cardiovascular disease o Hypertension in people with diabetes should be treated aggressively with
lifestyle modification and drug therapy. Optimal clinical outcome for blood pressure in people with diabetes is <140/80 mm Hg.
o A lipid-lowering drug therapy is recommended for primary prevention in patients with type 2 diabetes aged >40 years regardless of baseline cholesterol.
10 Scottish Intercollegiate Guidelines Network (March 2010) Management of diabetes, A national clinical guidelinehttp://www.sign.ac.uk/guidelines/fulltext/116/index.html 11 NICE Quality standard: Diabetes in adults (Consultation Document Nov 2010) suggests a HbA1c level between 6.5 and 7.5% http://www.nice.org.uk/media/163/66/DiabetesQualityStandard.pdf12 “Survival in people with type 2 diabetes as a function of HbA1c” (6 February 2010) The Lancet, V:375; I: 9713. pp 438 - 440
18

Recent evidence and advice on use of anti-thrombotic therapy for those at risk of a vascular event (including diabetics) The Medicines and Healthcare products Regulatory Authority (MHRA) Drug Safety Update13 gives the following advice on using aspirin for the primary prevention of vascular events, which is relevant to NICE recommendations14 on anti-thrombotic therapy:
Aspirin is not licensed for the primary prevention of vascular events. If aspirin is used in primary prevention, the balance of benefits and risks should be considered for each individual, particularly the presence of risk factors for vascular disease (including conditions such as diabetes) and the risk of gastrointestinal bleeding.
Management of kidney, eye and foot damage in diabetes • All patients should have an annual urine test for any sign of kidney damage. • Arrange or perform eye screening at or around the time of diagnosis. Arrange
repeat of structured eye surveillance annually. • All patients with diabetes should be screened to assess their risk of developing a
foot ulcer.15 16 The NHS and Social Care Long Term Conditions Model17 builds on the wealth of local and international experiences and innovations. It draws on the ‘chronic care model’ of Wagner18 and the pyramid of care developed by Kaiser Permanente. It recommends the following three levels of care: • Level 3: Case management - requires the identification of the very high intensity
users of unplanned secondary care. Care for these patients is to be managed using a community matron or other professional using a case management approach, to anticipate, coordinate and join up health and social care.
• Level 2: Disease-specific care management - This involves providing people who have a complex single need or multiple conditions with responsive, specialist services using multi-disciplinary teams and disease-specific protocols and pathways, such as the National Service Frameworks (NSFs) and Quality and Outcomes Framework (QOF).
Level 1: Supported self care - collaboratively helping individuals and their carers to develop the knowledge, skills and confidence to care for themselves and their condition effectively. The evidence base above is consistent with the draft NICE Quality Standards for Diabetes in Adults 19
13The Medicines and Healthcare products Regulatory Authority (2009), Drug Safety Update. 3(I3), October http://www.mhra.gov.uk/Publications/Safetyguidance/DrugSafetyUpdate/CON059804 14 NICE. Clinical Guidance 87, quick reference guide. 15CG10 Type 2 diabetes - footcare: NICE guideline(2004) http://www.nice.org.uk/guidance/index.jsp?action=download&o=29241 16 NHS Diabetes Website contains examples of best practice in improving care while reducing costs – An example of an integrated footcare service is provided at: http://www.diabetes.nhs.uk/high_impact_change_success_stories/footcare/an_intregrated_foot_care_service/ 17 Department of Health (Feb 2007) An NHS and Social Care Model for improving care for people with long term conditions http://www.dh.gov.uk/en/Publicationsandstatistics/Publications/PublicationsPolicyAndGuidance/Browsable/DH_4965951 18 Wagner EH, Austin BT, Von Korff M. (1996) Organizing Care for Patients with Chronic Illness. Milbank Q. 74(4)511-44 http://www.ncbi.nlm.nih.gov/sites/entrez?orig_db=PubMed&db=pubmed&cmd=Search&defaultField=Title%20Word&term=Organizing%20Care%20for%20Patients%20with%20Chronic%20Illness19 NATIONAL INSTITUTE FOR HEALTH AND CLINICAL EXCELLENCE CENTRE FOR CLINICAL PRACTICE QUALITY STANDARDS PROGRAMME. Quality standard topic: Diabetes in adults (Nov 2010) http://www.nice.org.uk/media/163/66/DiabetesQualityStandard.pdf
19

1. Known Intervention
Efficacy
Challenge to Providers
5. Engaging the public
4. Accessibility
2. Local Service Effectiveness
3. Cost Effectiveness
2. Local Service Effectiveness
Aim for service providers maintaining high standards of local effectiveness through education and training, driven by systems of professional and organisational governance and audit.
1. Optimal clinical outcomes in primary care – using the QOF registers (Best practice encountered by HINST suggests the following proposed approaches may act to reduce variation in outcomes and so reduce health inequalities)
• Is there an analysis of treatment outcomes by practice using QOF including the following: o Blood glucose control o Blood pressure o Cholesterol o Smoking advice o BMI?
• Support for underperformers – is there a strategy to support practices where
maximum quality for patients on the register is not being achieved as part of QOF assessment?
• Raise the bar – has an enhanced service/bonus scheme to reward achievement beyond the current (rather low) ceiling been considered? (taking into account value for money and making sure payment is only for achievement over and above QOF maximum)
• Reduce exception reporting – have exceptions from the QOF register been verified in line with national guidance20 and tight local interpretation been agreed?
• Are practices recording the clinical reason for the exception in a way that facilitates audit in the patient record? This is to help manage the care of the excepted patient and to facilitate verification audits.
• Have care plans been put in place for excepted patients? How is this
monitored?
20 Guidance on Exception Reporting (October 2006) http://www.pcc.nhs.uk/uploads/QOF/october_06/qof212_exception_reporting_guidance_final.pdf
20

2. Primary Care Audit and assessment • Has a baseline assessment of service in each GP practice been carried out?21 Has
this included: o QOF outcomes data? o Skills, education and resources available to deliver optimal care? o Whether particular parts of the client group (e.g. sex, ethnic groups, age
groups, mosaic segments) are consistently achieving worse outcomes or not accessing primary care?
o Admission rates for diabetes related emergencies broken down by locality, ethnicity or other (e.g. Mosaic) group? Have these been benchmarked with other communities?
o The proportion of all patients with diabetes that are achieving clinical desired outcomes for the following (which will impact on mortality in the short term): Smoking status Raised blood pressure Raised cholesterol Raised HbA1C Assessed for risk/benefit of using low dose aspirin
Note: The aim should be to risk manage all four or five issues rather than one or two. 22
• What proportion of GP practices have taken part in the National Diabetes Audit?
3. Strategies to address inconsistencies in primary care
• Are strategies in place to address inconsistencies in primary care,
particularly for those groups identified as having consistently poorer outcomes, and to raise the bar on outcomes?23
(the following suggested approaches are based upon best practice seen working in local areas by HINST and from the HINST masterclass referred to below)
• Has a baseline assessment been used to appraise and accredit practices according to their competency to provide differing levels of care?
An example follows:
21 Department of Health. HINST (2010) HINST ‘How-to Guide’ How to develop an ongoing programme of GP chronic disease management audits using a z-score-based dashboard’ would help with this work 22 Note: see section 1, p12 for more information on aspirin in primary prevention. 23 See appendix 3 for a description of a systematic model of care which would result if the questions in this section were addressed and implemented and the HINST Masterclass Guide. This is detailed in: Department of Health (2010) Health Inequalities National Support Team Masterclass Guide, A systematic approach to achieving effective and comprehensive care for patients with diabetes http://www.dh.gov.uk/prod_consum_dh/groups/dh_digitalassets/@dh/@en/@ps/documents/digitalasset/dh_115472.pdf
21

Prevention Identification Impaired Glucose Tolerance/ Impaired Fasting Glucose Diet controlled Type 2 diabetes
Type 2 on tablets - Annual review
Management of patients stabilised on insulin Annual review - Type 1 and Type 2 diabetes
Initiation of insulin Problem patients Unstable diabetes Annual review Type 1 and Type 2 diabetes
Gestational diabetes Pre-conception care Children and adolescents Inpatient hospital care Complex complications Insulin pump Carbohydrate counting DAFNE
Practice Level 1
Specialist Care
Practice Level 2
Primary Care
Practice Level 3
PracticeLevel 4
This model upon which the following questions for consideration are based, is derived from examples of best practice seen working in local areas by HINST and from the HINST masterclass referred to below • Is there a joint action plan between each GP practice and diabetes specialist
teams for each practice (which would help gaps in skills and resources to deliver optimal care to be systematically filled)?
• 24Is there a plan to commission an intermediate or community specialist service
that could provide the links to general practice? How will this be funded? What categories of staff will be in the service?
• Is there a mechanism for providing this diabetes specialist consultant and
nurse input into practices (which will improve practice by raising the level of
24 • The HINST Masterclass guide
http://www.dh.gov.uk/prod_consum_dh/groups/dh_digitalassets/@dh/@en/@ps/documents/digitalasset/dh_115472.pdf illustrates what NST consider to be best practice. Examples and evidence of cost benefit analysis of this approach is still incomplete and evolving. However to assist areas considering business cases to implement similar approaches, the masters who are referenced in the masterclass guide have been working in this way for sometime and up to date costings should be available from them.
• The Diabetes Integrated Care Initiative in East Cambridgeshire and Fenland is another example, which is still subject to formal evaluation, but the preliminary data suggests that there is a range of benefits. A presentation about this work is available at: http://www.google.co.uk/url?q=http://www.catchcambs.nhs.uk/documents/PBC/PBC%2520CATCH%2520FORUMS/10%2520-%2520PBC%2520Forum%252029%2520April%25202010/DAVID_SIMMONS_-_DIABETES_-_FINAL_VERSION.ppt%3FpreventCache%3D30%252F04%252F2010%2B15%253A00&sa=U&ei=UkZ6TZ2pM8aFhQf-wMn0Bg&ved=0CBIQFjAC&usg=AFQjCNHWbOJDWd3PmRY1zAdqIT6pLjKfrw
• Also NHS Diabetes website http://www.diabetes.nhs.uk/publications_and_resources/factsheets_and_case_studies/case_studies/clinical_care_of_adults_with_diabetes contains examples of best practice commissioning of diabetes care in this way with proven examples of some of the savings achieved, but does not illustrate investment and running costs that may be required to establish such services. However, you may wish to approach some of the organisations direct to understand their business case in greater detail .
• An additional sources of evidence around this approach to tackling long-term conditions are also evolving as part of the QIPP Long Term Conditions workstream.
22

competency of practice staff)? Are there stated objectives to systematically upgrade the skills of practice staff through such means?
• Is there an educational programme in place to meet any identified gaps in staff skills, or are the experiential learning opportunities offered by joint working with diabetic specialists utilised and monitored systematically? Is this learning accredited for portfolios?
• Is there an ongoing process of a joint case notes review of patients with unsatisfactory parameters by primary care and specialist clinicians (e.g. HbA1C over 10% or 86 mmol/mol)? Is this followed by a care plan?
• Does the whole system (primary, community and specialist care) share responsibility for population level outcomes (e.g. in QOF)? Is this information available to all involved?
• Is utilisation of DiabetesE25 being widely used? Are the poorest practices participating?
4. Are registers used, with partners, to target high risk patients for multiplicative risk reduction26, including
o Smoking cessation support o Alcohol harm reduction o Physical activity o Cold/damp housing; fuel poverty in the elderly27 o Weight management?
• Is there a focus on outcomes, rather than referral? • Is brief advice and referral for support systematically built into the diabetes care
pathway? Is referral proactive, with a system in place to help diabetic patients who have expressed an interest to be contacted by the specialist services?
• Is there a menu of support options based on social marketing/insight research?
5. Intermediate and specialist care • Have there been any audits of adherence to national guidelines for care of people with
diabetes while in hospital? • Are links to other specialist care (e.g. kidney care and people on dialysis) monitored
and coordinated? • Do quality accounts, CQUIN and other quality measures include inequality and
specifically recognise patients not connecting with service?
25 DiabetesE is a web-based, self assessment, diabetes care performance improvement tool that supports the implementation of the Diabetes NSF. https://www.diabetese.net/Welcome.aspx?AspxAutoDetectCookieSupport=126 Targeting people with multiplicative risk will reduce the numbers needed to treat to reduce mortality. Evidence of effectiveness for these lifestyle interventions is given in the Guidance ‘Type 2 diabetes: national clinical guideline for management in primary and secondary care (update) (2008)’ Chapter 6 - Non-pharmacological management http://www.nice.org.uk/nicemedia/live/11983/40803/40803.pdf 27 For further questions and ideas for engaging patients in support to stop smoking see HINST Model: Community engagement in Long Term Conditions to help reach all patients for all aspects of care See Appendix 3
23

1. Known Intervention
Efficacy
Challenge to Providers
5. Engaging the public
4. Accessibility
2. Local Service Effectiveness
3. Cost Effectiveness
3. Cost effectiveness Aim for programme elements that are as affordable as possible at population level .
1. Programme budgeting28 • Has the diabetes programme been looked at from a Programme Budgeting
perspective? How did the cost of services benchmark and is there scope for improvement while taking into account inequalities in access and use of services?
2. Prescribing guidance • Is there a formulary or prescribing guidance that promotes cost effective as well as
effective prescribing for diabetes and its complications?
• Are prescribing guidelines for diabetes coordinated across primary and secondary care?
3. Costs of prescribing compared with diabetes outcomes • Have there been any initiatives that evaluate and benchmark the cost of diabetes
prescribing in primary care in relation to outcomes being achieved?29
• Have change management projects been run as a result?
• Has the total diabetes prescribing spend been plotted against QOF outcomes for each practice, shared with all practices, and an action and support plan put in place by medicines management to drive down costs and drive up outcomes?30
28 The QIPP Right Care NHS Atlas of Variation can help understand the cost of services http://www.rightcare.nhs.uk/atlas/ 29 The Diabetes Outcomes Versus Expenditure (DOVE) tool allows users to compare expenditure on diabetes care with clinical outcomes for a selected PCT, other PCTs with similar populations and all other PCTs. http://www.yhpho.org.uk/resource/item.aspx?RID=63145 . Also see the National Diabetes Information Website http://ndis.ic.nhs.uk/pages/index.aspx30 The HINST How-to Guide Achieving population health impact, by systematically addressing the quality and cost effectiveness of prescribing as part of the management of major killer chronic diseases in primary care will help with this. Department of Health Health Inequalities National Support Team (2010) http://www.dh.gov.uk/prod_consum_dh/groups/dh_digitalassets/@dh/@en/@ps/documents/digitalasset/dh_115095.pdf
24

1. Known Intervention
Efficacy
Challenge to Providers
5. Engaging the public
4. Accessibility
2. Local Service Effectiveness
3. Cost Effectiveness
4. Accessibility Aim for services to be designed with the minimum barriers to access, balancing a
drive to bring services closer to the patient with the need for efficiency and effectiveness of that service.
1. Care in the community
• What arrangements are in place to bring members of the specialist diabetes team into the community and closer to patients’ homes?
• Do these arrangements take into account how they can reduce admissions/ readmissions?
• Has this been informed by public engagement with all groups of patients including older people, housebound people, ethnic minority groups and people with mental health problems?
2. Housebound and care homes • Is there a programme for specialised diabetes staff (e.g. Diabetes Nurse
Practitioners) to work in nursing and care homes, or with housebound patients to upgrade the standards of diabetes care?
3. Interpreters and other support for patients • Are interpreter services available to support all the major components of diabetes
services in the community as well as in hospital settings? • Is health literacy taken into account, including in languages other than English, for
disabled people with physical or learning disabilities and deaf people who sign? • Have more innovative ways of improving accessibility been taken into account?31 • Are there mechanisms for patients whose major links are with learning disabilities
or mental health services, but who also have diabetes, to have integrated care with primary and specialist diabetes services, so their physical healthcare is not compromised?
• Has an analysis of DNAs (people who ‘did not attend’ appointments) by ethnicity, sex, age group, type of disability, GP practice, etc indicated accessibility issues that could be addressed? For example, are invitation letters accessible; are appointment times convenient; is the location accessible physically and by local means of transport (parking, bus, etc.)?
31 For example, Pacesetters and Health Trainers have examples where training a member of the community to deliver health messages, or recruiting a specialist health professional with the relevant language skills can be more effective to deliver services in other languages than using an interpreter who may not be familiar with the medical terminology or the local community.
25

1. Known Intervention
Efficacy
Challenge to Providers
5. Engaging the public
4. Accessibility
2. Local Service Effectiveness
3. Cost Effectiveness
5. Engaging the public
Working with service users and communities to aim for needs and requirements to be placed at the centre of service provision and for quality assurance systems in place that makes the services acceptable to service users.
1. Mechanisms to engage the patients and public32 33 • Which of the following mechanisms have been utilised to involve patients and the
public in design, modification and improvement of diabetes services: o Patient satisfaction surveys (primary care? specialist service?) o Systematic involvement of user and carer representatives in the Network o Audit of DNA (did not attend) episodes in outpatients, retinopathy screening or
podiatry (by ethnicity, sex, age, practice, etc.) followed by asking these patients their views of service provision, locality, access etc.
o Discovery interviews o Focus and reference groups o Diabetes UK (local) groups
• What tangible input and change has there been as a result? 2. Segmentation and social marketing • Has there been any social marketing research into the provision and use of diabetes
services? What have been the results?
32 Pacesetters model – A Dialogue of Equals is the Pacesetters guide to community engagement and development and will help development of community engagement skills http://www.dh.gov.uk/en/Policyandguidance/Equalityandhumanrights/Pacesettersprogramme/index.htm 33 Another really useful guide to developing a strategic approach to community development is the HINST How to Guide no 8 – How to develop and implement a strategic framework for community engagement - Five Elements Model http://www.dh.gov.uk/en/Publicationsandstatistics/Publications/PublicationsPolicyAndGuidance/DH_115113
26

Population Focus
6. Known Population
Health Needs
10. Supported self-management
9. Responsive Services
7. Expressed Demand
8. Equitable Resourcing
6. Known population health needs Aim for a realistic assessment of the size of the problem locally, its distribution geographically and demographically and the level and type of service being based upon this assessment.
1. Comprehensive local diabetes needs assessment34: • Has a local diabetes network carried out a diabetes needs assessment? What are the
main conclusions?
• What is the breakdown of the local diabetes population by: o Age - adult
- children and young people - women of reproductive age
o Ethnicity o Patients in residential and nursing homes and housebound o Geography o Segmentation group o People with physical or learning difficulties or mental health problems o Other relevant vulnerable groups (e.g. prisons; gypsies and travellers)
• Are diabetes related hospital admissions charted using similar breakdown? • Has there been an analysis of local deaths identifying where diabetes is the primary
or contributory cause? • Have estimates of the contribution of diabetes to the macro-vascular disease load
been carried out and taken into account? (cerebrovascular, ischemic heart and peripheral vascular)
2. Expected prevalence: Has the Diabetes Prevalence Model35 been used to predict case numbers at PCT level, and also at: o ward level o practice level o GP Commissioning Group level?
34 Yorkshire and Humber PHO have produced Diabetes Community Health Profiles for every PCT which may be helpful here. Association of Public Health Observatories, Diabetes Community Health Profiles – An Overview, 2009 www.yhpho.org.uk/resource/view.aspx?RID=78382 35 Association of Public Health Observatories, Diabetes Prevalence Model.2010 http://www.yhpho.org.uk/resource/view.aspx?RID=81090
27

Population Focus
6. Known Population
Health Needs
10. Supported self-management
9. Responsive Services
7. Expressed Demand
8. Equitable Resourcing
7. Expressed demand
Aim for as many people as possible who are suffering from the problem or its precursors, to present to services in a timely and appropriate fashion, through informing, educating and supporting the population.
1. Using the registers to case find by addressing the following questions:
• Has the expected prevalence of diabetes by practice been compared with actual numbers on registers and used to verify discrepancies on practice registers?34
• Have gaps been addressed by: o improving patient capture from records o improving practice of screening high risk patients
2. NHS Health Checks programme: • How well-developed is the implementation? • Does it include assessing the risk of diabetes and kidney disease? • Are commissioners recruiting community staff, providers and local authority
frontline staff to ‘case find’? • Are groups where diabetes prevalence is known to be highest, specifically
targeted? • Do such programmes take into account culture, language and special needs?
o Are commissioners ensuring that everyone gets lifestyle management advice as a result of their check?
3. Other opportunities to ‘case find’: • Is there a local protocol for identifying people in hospital with undiagnosed diabetes,
and reporting of this to practice registers?
• Is there a structured programme that covers arrangements to facilitate diagnosis and treatment of patients who are housebound or living in residential/nursing homes?
28

4. Awareness raising36 • Is there a programme in place to raise awareness among the public of the signs and
symptoms of diabetes? • Does the programme take into account culture, language and special needs? • Has a segmentation analysis informed how, where, when and how this awareness
raising is carried out (i.e. a social marketing approach)? • Is there a plan to help staff likely to come in contact with undiagnosed diabetes to be
aware of the signs and symptoms (e.g. community staff, providers and local authority frontline staff)?
5. Engagement with other diabetic care services: • Is there a measure of the proportion of people, newly diagnosed in the last 12 months,
with diabetic retinopathy already established and used as a measure of late presentation?
36 See Appendix 3, HINST Model: Community engagement in Long Term Conditions to help reach all patients for all aspects of care
29

Population Focus
6. Known Population
Health Needs
10. Supported self-management
9. Responsive Services
7. Expressed Demand
8. Equitable Resourcing
8. Equitable resourcing Aim for the distribution of finance and other resources to support equitable outcomes according to need.
1. Staff capacity and roles • Has there been a review of staffing requirements based on current and projected
estimates of need? That is, are there, and will there be, sufficient staff in every practice to carry out the required registrations checks and reviews?
• Does this review include a skill mix review including the use of non professional staff to carry out routine monitoring, for example, by using healthcare assistants or care technicians for regular reviews?
• Does skill mix include community languages; knowledge and experience of working with specific disability groups?37
2. Sustainability • Are there sustainable financial arrangements to cover specialist staff inputs? Have
any other financial barriers been identified that may be holding back improvement in outcomes?
3. Targeting resource according to need - cost effective provision • Has existing specialist diabetes staffing and access to structured patient education
and other community diabetes services (e.g. retinopathy screening, dietetics and podiatry) been monitored to try and make sure its use is targeted where treatment outcomes are currently poorest? Does this include: o designing action plans for each practice (see section 2.3) o ensuring services are provided how and where they are needed, determined
by understanding patient needs e.g. working in partnership to co-design and review services with patients, through community engagement and social marketing techniques
o ensuring pathways are utilised effectively with appropriate provision and resourcing
o partnership working to minimise duplication of effort?
37 See ‘How-to Guide’ for help with this: Department of Health. Health Inequalities National Support Team (2010) How to model need and develop a workforce plan to manage chronic disease registers as an industrial scale process http://www.dh.gov.uk/prod_consum_dh/groups/dh_digitalassets/@dh/@en/@ps/documents/digitalasset/dh_13793.pdf
30

Population Focus
6. Known Population
Health Needs
10. Supported self-management
9. Responsive Services
7. Expressed Demand
8. Equitable Resourcing 9. Responsive services
When people present to services, aim to make sure they are afforded equal access to timely beneficial interventions according to need.
1. Annual reviews and ‘Did not Attend’ (DNAs) • If patients DNA for their annual review, is there routinely a failsafe mechanism to
make sure follow-up is carried out?
• Is there a template (or other mechanism) in place to prompt that all nine NICE recommended interventions are carried out?38 Is effectiveness monitored?
• Is attendance also monitored and DNA’s followed up for: o Diabetic retinopathy screening o Podiatry o Diabetic support o Structured education?
• Are there strategies in place to support patients who regularly DNA? Do these strategies take into account the differing needs of, for example, people with mental health problems, learning disabilities, different ethnic groups and people in fulltime employment?
2. Older people
• Is there a ‘patch’ wide model of care for elderly people with diabetes, with clear identification of roles of primary care, specialist diabetes and specialist care of the elderly team?
3. Responsiveness to different groups
• Have all the diabetes services taken into account the differing needs of groups such as BME communities and their languages, prisoners, people with different disabilities, Gypsies and Travellers, older people and young people, etc?
38 As noted in the introduction, all patients should receive nine crucial tests from their GP at an annual review of their diabetes management. These include measurements of weight, blood pressure, smoking status, a marker for blood glucose called HbA1c, urinary albumin, serum creatinine, cholesterol, and tests to assess whether the eyes and feet have been damaged by diabetes. The National Diabetes Audit, which looks at the records of over 1.7 million people with diabetes in England and Wales, found that only just over half of patients with type-2 diabetes and a third of patients with type-1 diabetes received all nine tests in 2008/9.Measuring urine albumin creatinine ratio, which detects the earliest stage of kidney disease, is the test least likely to be carried out, while blood pressure measurement remains the most frequently recorded test at 96.5% in type-2 diabetes and 88.8% in type-1 diabetes. “Well over two-thirds of people with type-1 diabetes and half of people with type-2 diabetes in England and Wales are missing out on checks that in real terms translate into preventing blindness or lower limb loss, and extending life expectancy through the prevention of kidney failure, stroke and heart disease. More worrying is that these figures are worse for young people", said Dr Douglas Smallwood, Chief Executive at Diabetes UK. (June 2010) http://www.nice.org.uk/newsroom/news/DiabetesCareImprovesButPatientsStillMissingOutOnKeyTests.jsp
31

Population Focus
6. Known Population
Health Needs
10. Supported self-management
9. Responsive Services
7. Expressed Demand
8. Equitable Resourcing
10. Supported self-management Where appropriate, help service users to be empowered to make choices about their circumstances and service offer on the basis of good information, and to be supported to utilise the service offer to best effect
1. Training for clinicians
• Is specific training in place for clinicians to facilitate the joint care planning process (e.g. using the Health Foundation Co-creating health model39)
• Are all clinicians who work with diabetes patients (including practice nurses,
dieticians, podiatrists, GPs and consultant diabetologists), able to support patients for effective self- management including: o Support at the time of diagnosis.
An initial and on-going care planning process developed together with the patient
Coordination of the other issues (e.g. managing co-morbidities) o Provide specific referrals (including emotional and psychological support) as
appropriate? 2. Support for patients to manage their diabetes
• Is a care planning process in place with sufficient time to carry it our during consultations? (See Diabetes Year of Care)40
• Is it known what proportion of patients a) are offered and b) receive a structured
education programme within 12 months of diagnosis? • Are mechanisms in place to monitor if patients, from differing population/
segmentation groups receive the same standard of support?
• Is there support for patients between consultations (e.g. community support services), including peer and specific community support?
• What arrangements are in place to allow patients rapid access to information
and support, particularly when newly diagnosed, changing treatment regime or stabilising on insulin? Is this available out of hours and at weekends?
39 The Health Foundation, Co-creating Health Programme. Information at: http://www.health.org.uk/current_work/programmes/cocreating_health.html 40 Diabetes Year of Care is a partnership initiative between the Department of Health, Diabetes UK, the Health Foundation and NHS Diabetes. http://www.diabetes.nhs.uk/year_of_care/
32

3. Segmenting patient preferences
• Is information on patient preferences for education and self management being collected by segmentation group (using mechanisms outlined in section 5.1) and through gathering information from frontline staff such as nurses, health trainers, local authority care workers?
• Is this information used to inform the development and design of education,
support and self-management programmes so that there a structured, co-ordinated and comprehensive patient education programme for everyone with diabetes? Are these suitable for people with different educational needs and tailored to different relevant groups?
• Have the programmes been developed as a menu of options to try and make
sure there is suitable provision for all patients?
• To what extent do information/education materials, provided to people with newly diagnosed diabetes, take into account cultural sensitivities, language barriers, literacy and special needs?
• Are there particular clinics arranged for support to client groups with special needs (e.g. Muslim women, non-English language groups)?
4. Generic approach to supporting people with long term conditions
• Are opportunities being taken to extend training and care planning approaches so that it is applicable to all patients with long term conditions?
• Are partnership approaches being adopted across local authority and frontline
health, through multidisciplinary teams? Are these being used to maximise opportunities to support to all patients with long term conditions?
33

Optimal Population Outcome
13. Networks, leadership and coordination
12. Balanced Service Portfolio
11. Adequate Service Volumes
11. Adequate service volumes Commissioning adequate service volumes to aim for acceptable access times 1. Process mapping
• Have all partners involved in delivering diabetes care carried out a process mapping exercise to help identify areas where there are inefficiencies, lack of resources or duplication? Have the outcomes been acted upon?
2. Walking the patient journey
• Have techniques been used to gain a real picture of the issues and problems for patients as they move through the care pathway? (e.g. such patient shadowing, tracing patient journey’s through a study of records) Useful materials41
Optimal Population Outcome
13. Networks, leadership and coordination
12. Balanced Service Portfolio
11. Adequate Service Volumes
12. Balanced service portfolio Aim for balance of services within pathways to avoid bottlenecks and delays. 1. Identifying bottlenecks
• Have points on the care pathway where delays (ie rate limiting steps) occur been identified? (eg through techniques discussed in section 11)
• Have the causes of any bottlenecks been determined? • Have steps been put in place to alleviate the problem? (e.g. through reallocation
of resources, consideration of skills mix, demand and capacity calculations)
41 A comprehensive range of tools to facilitate improvement of pathway design and management are available on the NHS Institute for Innovation and Improvement website NHS Institute for Innovation and Improvement , Quality and Service Improvement Tools: http://www.institute.nhs.uk/option,com_quality_and_service_improvement_tools/Itemid,5015.html
34

Optimal Population Outcome
13. Networks, leadership and coordination
12. Balanced Service Portfolio
11. Adequate Service Volumes
13. Networks, Leadership and Coordination Designating leadership and co-ordination to aim for services that are commissioned and networked to meet population need and the population is supported to use services and interventions appropriately
1. Diabetes Network • Is there a network/ Local Implementation Team in place to co-ordinate
activity within the city/borough? • What is the level of leadership of the network? • Is there a clinical lead with dedicated time? • Is there a dedicated coordinator with dedicated time providing management
support? • Is there appropriate public health specialist input? • Are all GP Commissioning Groups represented? • Who are the main other partners, and what is their level of representation
and attendance? • Is there input from social services/local authority/local voluntary sector? • Is there local patient representation?
2. Model of diabetes care • Is there a jointly owned vision by the providers and commissioners and patients, of
how diabetes care should be delivered?
• Are outcome measures (e.g. QOF) also jointly owned?
• Is there a clearly identified model of care for diabetes services across the health economy, with all the elements of a comprehensive diabetes service specified and procured matched to identified segments of the population?
• Is attention paid to an effective model of care specifically addressing engagement and outcomes within specific ethnic minority populations?
35

3. Commissioning42 • Is there a commissioning plan for services that is:
o comprehensive o needs based o geared to population rather than service outcomes o actually addressing differential need/ health inequalities o addressing the links between specialist diabetes nurses and provider services
(e.g. district nurses)?
• How are the needs of joint commissioning and joint provision by partners in the local authority accommodated in these arrangements?
42 NHS Diabetes Commissioning Resource - This web resource aims to offer practical support, templates, information and case studies for diabetes commissioners and health care professionals to enhance the World Class Commissioning skills and capability to deliver the Diabetes National Service Framework. http://www.diabetes.nhs.uk/commissioning_resource/
36

Optimal Population Outcome
13. Networks, leadership and coordination
12. Balanced Service Portfolio
11. Adequate Service Volumes
Optimal Population Outcome Ensuring that intermediate and healthcare outcomes are meaningful locally, and drive the programme
1. Reporting and monitoring outcomes:
• Are diabetes outcome measures regularly monitored and reported?
• Is the above particularly reported for a defined most disadvantaged 20% of the population?
• Who is responsible for performance against desired outcomes? • Are practices provided with an integrated scorecard of their outcomes and
performance related to diabetes and is this shared with intermediate and specialist care and across the Network?
• Are diabetes standardised mortality rates, for population as a whole and for most
disadvantaged 20%, reported to the Health and Wellbeing Board?
• Are any diabetes outcome or performance measures for targeted neighbourhoods presented to neighbourhood fora?
37

Appendix 1: Health Inequalities National Support Team. Tackling Inequalities in Diabetes Mortality Rates - Ten potential key actions to reduce mortality 1. Aim to have a network in place to co-ordinate activity with:
• Senior level leadership • A clinical lead with dedicated time • A dedicated co-ordinator with dedicated time providing management support • Appropriate public health specialist input • Membership that includes primary, secondary and community care and patient
representatives
2. Calculate an ‘expected’ prevalence of diabetes by practice, and compare with actual numbers on registers. Work on verification with practices showing discrepancy. Address gaps by: • improving patient capture from records • improving practice of screening high risk patients • recruiting community staff to case finding
3. Aim that patients who have been exception reported from QOF registers have been excepted in line with national guidance, aiming to make sure that the clinical reason for the exception is fully recorded by the practice in way that facilitates a clear audit trail in the patient record. Try to make sure that excepted patients have a care plan - they are likely to be high risk, and should be targeted as such.
4. Work to make sure all patients with diabetes are assessed and managed for the
following: • Still smoking • Raised blood pressure • Raised cholesterol • Raised HbA1C • Risk/benefit of using low dose aspirin(?)
The aim should be to risk manage all four or five issues rather than one or two. 5. Carry out a baseline assessment of service for diabetes patients in each GP practice.
Use this to appraise and accredit practices according to their competency to provide differing levels of care. Use this also to develop a joint action plan between the practice and specialists for each practice and provide incentives for improvement. The plan should include an educational programme to address the identified gaps in Primary Care delivery to raise the competency of practice staff. Use experiential learning opportunities offered by joint working with diabetic specialists and work to make sure this learning is accredited for portfolios.
6. The whole system should share responsibility for population level outcomes (e.g. in
QOF). This information should be available to all involved.
38

7. Carry out an ongoing process of joint case notes review of patients with unsatisfactory parameters by primary care and specialist clinicians (e.g. HbA1C over 10% or 86 mmol/mol). Develop a care plan for specific treatment of identified patients.
8. Develop prescribing guidance that promotes cost effective as well as effective prescribing for diabetes and its complications with prescribing guidelines for diabetes coordinated across primary and secondary care. Evaluate and benchmark the cost of diabetes prescribing in primary care in relation to outcomes being achieved and work with outliers to change manage improvements.
9. A structured, coordinated and comprehensive patient education programme should exist with a menu of options to help to make sure it meets the needs of everyone with diabetes, targeted at people with different educational needs and tailored to different relevant groups. Make sure the proportion of patients offered and matched with the appropriate option and receiving the appropriate structured education programme within 12 months of diagnosis is high.
10. Patient engagement and empowerment: Work with clinical staff to enable best practice in care planning with the patients and supporting their self-management. Link across to community structures, using existing resources to engage and empower people to both recognise the symptoms of diabetes and to support self -management with every contact. Adoption of the Health Foundation Co-creating Health approach is one way forward.
39

Appendix 2: Use of QOF registers to improve population level outcomes Showing and sharing QOF outcomes for the range of diabetes outcome indicators by GP practice is a tool to support improvement through reducing variation. Share with all partners involved in delivering diabetes care. Examples of the presentation of this information are shown below. An area with problems
DM 6 - % patients whose HbA1C <= 7.4 (measured in last 15 months)
0%
20%
40%
60%
80%
100%
F840
04F8
4006
F840
09F8
4010
F840
14F8
4017
F840
22F8
4032
F840
47F8
4050
F840
52F8
4053
F840
70F8
4074
F840
77F8
4086
F840
88F8
4089
F840
90F8
4091
F840
92F8
4093
F840
97F8
4121
F841
24F8
4631
F846
41F8
4642
F846
54F8
4657
F846
58F8
4660
F846
61F8
4662
F846
66F8
4669
F846
70F8
4671
F846
72F8
4673
F846
77F8
4679
F846
81F8
4699
F847
00F8
4706
F847
07F8
4708
F847
13F8
4717
F847
22F8
4724
F847
27F8
4728
F847
29F8
4730
F847
34F8
4735
F847
36F8
4739
F847
40F8
4741
F847
42F8
4749
Y002
25Practice code
Target Met Target Missed Exception coded This is an area that has worked at reducing variation and improving outcomes
DM 20 - % patients whose HbA1C <= 7.4 (measured in last 15 months)
0%
20%
40%
60%
80%
100%
A880
01A8
8002
A880
03A8
8004
A880
05A8
8006
A880
07A8
8008
A880
09A8
8010
A880
11A8
8012
A880
13A8
8014
A880
15A8
8016
A880
20A8
8022
A880
23A8
8024
A880
25A8
8601
A886
03A8
8608
A886
11A8
8613
A886
14A8
8615
A880
18
Practice code
Target Met Target Missed Exception coded 40

Appendix 3: Best Practice Approach to delivering systematic Taken from HINST Masterclass Guide - A systematic approach to achieving effective and comprehensive care for patients with diabetes 43
Where standards are patchy, best practice engages primary and secondary care together as a compensatory system: 1. Define the current level of provision by practice The range of provision of diabetes care can be classified into levels of complexity, all of which it was possible to deliver in primary care given the appropriate level of knowledge and skills. Each practice was assessed and assigned to a level, initially based on self assessment, but subsequently validated by the specialist team.
2. Specialist care is deployed to complement primary care knowledge and skills If patients are not to be disadvantaged by the variable level of interest, knowledge and skills of their GPs, these would have to be compensated for by the deployment of specialist services. Commissioners will need to aim that resources to provide the full service are deployed accordingly.
43 ‘Health Inequalities National Support Team Masterclass Guide, A systematic approach to achieving effective and comprehensive care for patients with diabetes’ , Department of Health, 2010 http://www.dh.gov.uk/prod_consum_dh/groups/dh_digitalassets/@dh/@en/@ps/documents/digitalasset/dh_115472.pdf
41

3. Avoiding referral gaps – situation before a new service is set up This compensatory system and integrated delivery avoids the situation where, from the patient perspective, there are gaps and uncertainties around clinical responsibility
4. The strategy, therefore, was to systematise delivery In order to fill the gaps in capability and capacity, plans were made to provide more specialist care alongside primary care in community settings, and to make referral into specialist care more straightforward. Improved integration: joint working between primary and specialist/secondary care prevents gaps in care and provides clear referral pathways.
42

5. Through more integrated working, overall standards are being raised The accreditation and commissioning process provides incentives for practices to improve their standards and levels of delivery. At the same time, joint working with specialist medical and nursing colleagues and increased exposure to other specialist staff (e.g. dieticians) provide the means to train and improve ‘on the job’. This is particularly powerful when focused on joint assessment and management of complex patients.
The whole system should share responsibility for population level outcomes (e.g. in QOF). This information should be available to all involved.
43

Appendix 4: HINST Model: Community engagement in long term conditions to help reach all patients for all aspects of care
Challenge 4 Challenge 1
Smithies 2009
This model was developed as part of strategic work to tackle inequalities in health, with a specific focus on diabetes, by the Community Development service of NHS Bradford & Airedale.
• Stage 1: included identifying the four main challenges that were contributing to diabetes-related health inequalities.
• Stage 2: focused on developing action plans to address the four main challenges.
• Stage 3: focused on identifying which communities to initially target, as part of a planned District wide initiative over 3 years.
Delivery of the action plans is still at an early stage (as of October 2009).
Challenge 1: HINST work had highlighted that there were possibly several thousand people missing from GP Practice Registers who were likely to be diabetic, based on the population profile. Specific work to raise awareness of the levels of under-diagnosis with local people and health and other professionals was accompanied by the offer of risk assessment sessions in a range of NHS and community venues, planned, promoted and delivered through a range of partnership and joint working initiatives.
TAKING FORWARD
JOINED-UP WORK ON ALL IDENTIFIED BARRIERS TO
EMPOWERMENT AND ACCESSING SERVICES
Challenge 2
Social marketing approach to targeting key
health messages re: prevention and early
identification
Supporting self Cross sector partnership
management and approach to case findingaddressing identified and link to lifestyle and
reasons for non primary care services engagement with
services
Challenge 3
Improving access to clinical care and
improving quality of services
44

Challenge 2: There were still many local people who were unaware of the link between diabetes and lifestyle. There were also significant numbers of people who are unaware of the various identified risk factors that mean certain population groups are at increased risk of developing diabetes. The general level of awareness of the early indications that someone may have developed diabetes was also low – amongst local people and for many health, social care and community service providers (unless specialists in this area). Thus the challenge was to increase access to information and widen awareness raising through specifically targeted materials, staff with community knowledge and good links to specific communities, and a range of activities and events.
Challenge 3: This focused on upping the skills and awareness of primary care and specialist diabetes services to better meet the needs of their patients and those who were currently not their patients but who needed to be if an equitable, accessible service was to be provided. This included skills in discussing and supporting self-management with patients in ways most appropriate to individual needs. It also included ensuring GPs and other primary care teams were fully aware of, and had easy routes to link/refer people to lifestyle support change services (e.g. exercise, smoking cessation, Health Trainers, welfare rights) in their locality.
Challenge 4: HINST work had highlighted through analysis of the relevant QOF indicators that significant numbers of diabetics on practice registers did not have their blood sugar controlled. Subsequent discussion with specialist community and acute diabetes service providers confirmed that certain communities were less engaged with services, and also that some services (e.g. diabetes education and self management support) were only available to a limited number of newly diagnosed diabetics, and were not easily accessible by many of those who most needed them.
The action plan for this part of the work looked at initially outreaching to a range of people who were not using services (e.g. DNAs at specialist clinics) or whose blood sugar and other health management needs (e.g. blood pressure) were often or usually not well controlled). The purpose of the outreach work was to discuss people’s health and well-being with them, from their perspective. Also their views on the services they were (or were not) receiving were discussed and any other information needs/concerns they had. This helped to better identify what sort of services and support might need to be commissioned to better meet their needs and tackle the inequalities challenges. The central box indicates that coordination is needed to take forward all of this work and feed in the lessons, learning and commissioning/service re-design implications from each of the four inequalities challenge areas of work. In this case the Diabetes Pathway Group was identified as the most relevant coordinating body at a district level. At a locality level local cross sector partnerships are being formed to coordinate the work in relation to all four challenges with specific geographical communities. Challenges 1 and 2 also include a ‘training the trainers’ approach to help make sure staff and volunteers working in services such as children’s centres, home care services, homeless hostels, faith centres and so forth are able to act as advocates and informed message sharers with their own clientele/service users/communities.
45

Appendix 5 Acronyms and Abbreviations BME Black and minority ethnic BMI Body mass index CQUIN Commissioning for quality and innovation payment framework CHD Coronary heart disease CVD Cardiovascular Disease DNA did not attendDPH Director of Public Health GP General Practitioner HbA1c A test that measures the amount of glycated haemoglobin in the blood HINST Health Inequalities National Support Team MOSAIC A geodemographic segmentation system developed by Experian and
groups are classified into sixty segments on the basis of a wide range of demographic characteristics.
NICE National Institute of Clinical Excellence NSF National Service Framework
46