Embed Size (px)
Citation preview

Health in All Policies:Lessons Learned by LA County DPH
CDC Leaders to Leaders ConferenceJuly 8, 2008
Jonathan E. Fielding, M.D., M.P.H., M.B.ADirector of Public Health and Health Officer
L.A. County Department of Public HealthProfessor of Health Services and Pediatrics
Schools of Public Health and Medicine, UCLA

Los Angeles County –Background
• 4,300 square miles• 88 incorporated cities and 2 islands• 10.3 million residents (more than 42 States)• 46% Latino, 32% White, 13% Asian/Pacific
Islander, 10% African American, 0.3% American Indian
• Over 100 different languages spoken by significant size populations
• 15% living in poverty (14% of families & 24% <18)
• 22% of adults and 8% of children have no health insurance

Crude Death Rate for Infectious Diseases, U.S., 1900 - 2000
MMWR, CDC, 1999
* Rate is per 100,000

Policy and Public Health• Historically, policy changes have yielded
some of the biggest improvements in public health– Tobacco: smoking bans– Injury prevention: helmet laws– Disease prevention: immunization
requirements, sanitation improvements• The biggest levers we can move are often
policy levers

Policies Can Work on Multiple Levels• Level 1 – Reducing burden of disease
– e.g. Siting schools away from freeways to reduce asthma burden
• Level 2 – Reducing risk factors for disease– e.g. Smoking bans and tobacco retail
licensing to reduce smoking opportunities
• Level 3 – Focus on underlying determinants of disease– e.g. Create a healthier built environment by
incorporating health into land use decisions

Level 1 – Reducing the Disease Burden: LAUSD school siting policy
• Pollutant levels are correlated with distance from freeway– High concentrations of regulated air pollutants such as PM10, NOx,
and VOC’s are found in close proximity to freeways.– Concentrations of ultrafine particles are found at levels significantly
above background within 500 feet of freeways. – Potentially adverse health impacts have been identified up to 1500
meters away from freeways.
• Health effects associated with traffic related pollutants include:– Decreased lung function and lung development in children– Increased rates of respiratory disease, e.g., asthma, bronchitis– Increased rates of premature births, low birth weight, and cardiac
birth defects– Increased rates of heart attack and other heart disease

[school siting policy]

LAUSD School Siting Policy• LAC DPH’s Involvement:
– Provided technical assistance to determine risks associated with siting schools close to freeways
– Collaborated with LAUSD to develop the policy
– Educated LAUSD Board Members about importance of the measure
• Resulting policy prohibited siting of schools within 500 feet of freeways


Level 2 – Reducing Risk Factors:Tobacco Control
• Current Tobacco Control and Prevention Priorities in Los Angeles County:– Countywide tobacco cessation initiative– Tobacco retail licensing (TRL)
- Reduce tobacco availability to youth in the retail environment through local licensure
– Smoke-free outdoor areas- Reduce exposure to secondhand smoke (SHS) through the adoption of smoking bans in parks and beaches
– Smoke-free multi-unit housing- Reduce exposure to SHS through the adoption of policies that restrict smoking in apartments and common areas

Measuring Progress on Policy Change
• Tobacco retail licensing - implemented in 17 jurisdictions, including the cities of
Los Angeles, Glendale, Compton, Long Beach and the County of Los Angeles
• Smoke-free parks and beaches - implemented in 36 jurisdictions, including the cities of
Santa Monica, Los Angeles, Malibu, and Long Beach, and the County of Los Angeles
• Smoke-free multi-unit housing- implemented in one city (Calabasas) and being
considered in three others (S. Pasadena, Glendale, and Santa Monica)

Lessons Learned fromTobacco Control Efforts
• Public education important but not sufficient; need to focus as much or more on the environment than the individual
• Tobacco control laws are critically important– Cities are a key leverage point for continued policy and
environmental change – Community organizations and their constituents can be extremely
effective policy change agents– Requires long term commitment of support to CBO’s to build capacity
needed to organize and facilitate policy campaigns– Community-based policy campaigns require a sequence of steps or
“phases”
• Success ultimately attributable to a comprehensive multi-pronged approach

Level 3: Addressing the Underlying Determinants of Health
Social Environment
PhysicalEnvironment
GeneticEnvironment
IndividualResponse– Behavior– Biology
Health &
Function
Disease &
Injury
Health Care
Well - Being Prosperity
The Evans -StoddartModel

Level 3 – The Underlying Determinants of Health: the Physical Environment
• Definition of the built environment:– The built environment encompasses all
buildings, spaces, and products that are created, or modified, by people. It includes homes, schools, workplaces, parks/recreation areas, greenways, business areas, and transportation systems.
• The importance of regional planning:– Decisions made by cities and counties
about zoning, development, and transportation have tremendous influence on the health of the local population

traffic safetyair pollutionwater quality & quantityobesity & chronic diseasephysical activitycrime & violencesocial capitalelder health & mobilitymental health health disparities
Multiple Possible Adverse Health Impacts From Poor Community Design

Summary of Health Effects of Air Pollution• Amount of goods transported
through California projected to nearly quadruple between 2000 and 20201
• Will have significant impact on air quality and health2
• Diesel particulate matter (PM)– concentrated around ports,
railyards, and heavily trafficked roads3
premature deathscancerrespiratory diseaselost workdaysglobal warming (2nd to CO2)
Annual Health Impacts in CA from PM and Ozone4
1 (Cal EPA, 2005); 2 (Pacific Institute, 2006)3 (CA/EPA Air Resources Board); 4 (CA/EPA Air Resources Board, 2004)

Achievements to Date in LA County• LAC Public Health and Regional
Planning Directors have agreed to have their staff work collaboratively on General Plan update
• Public Health has met with Regional Planning and provided feedback/suggestions on “Shaping the Future 2025” in support of healthy, livable communities
• Policies supporting healthy, livable communities have been incorporated into the Draft Preliminary General Plan

DPH’s Focus on Health Equity &the Social Environment
• Department-wide workgroup on reducing health inequities
• Focus on the root causes of inequities, particularly underlying social conditions
• Five domains1. Neighborhood conditions2. Education across the life
course3. Income and employment4. Social connectedness5. Health care and health
promotion
• Action plan is currently under development –policy work will be large component

Annual Age-adjusted Mortality Rate by Median Household Income - LA County, 2003-2005*
400
500
600
700
800
< $30K $30 - 40K $40 - 50K > $50KMedian Household Income
Rat
e / 1
00,0
00 p
op
*provisional data used for 2005

Percentage of the Population Living in Poverty, LA County, 1970-2000
0%
10%
20%
30%
40%
1970 1980 1990 2000
Year
Livi
ng in
pov
erty
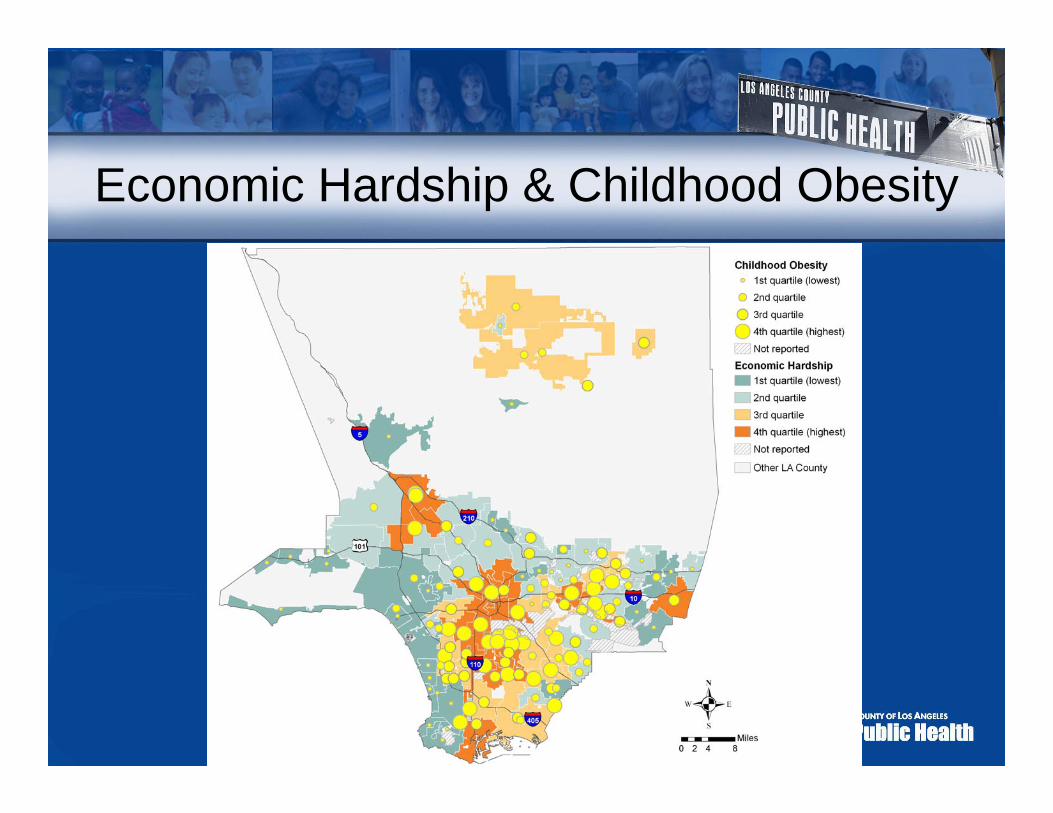
Economic Hardship & Childhood Obesity

Cities/Communities with Lowest and Highest Childhood Obesity Prevalence
*Table excludes cities/communities where number of students with BMI data < 500. Source: California Physical Fitness Testing Program, California Department of Education. Includes 5th, 7th, and 9th graders enrolled in LA County public schools.
8.0%Average 10 lowest
3512.3Arcadia
1311.6Rancho Palos Verdes
1811.4La Canada Flintridge
179.0South Pasadena
88.0Calabasas
107.3Agoura Hills
157.1San Marino
196.9Beverly Hills
56.3Palos Verdes Estates
24.2Manhattan Beach
Rank of Economic Hardship (1 - 128)
2005 Youth Obesity
Prevalence (%)
City/Community Name
Top 10*
31.5%Average 10 highest
12137.4Maywood
10332.9San Fernando
12832.0Florence-Graham
11731.9East Los Angeles
12230.6Huntington Park
11630.5Willowbrook
11530.2Bell
9030.0West Puente Valley
8129.7West Whittier-Los Nietos
12329.4Cudahy
Rank of Economic Hardship(1 - 128)
2005 Youth Obesity
Prevalence (%)
City/Community Name
Bottom 10*

What Factors are Contributing to the Obesity Epidemic: a Partial List
• Increased marketing of junk food and sodas to children
• Increased portion size of food and beverages
• More meals consumed outside the home• Decreased physical education in schools• Fewer safe areas for exercise in
communities• Increased TV and computer time• Less access to fresh, nutritious, affordable
food in underserved areas• Increased time spent in cars
Can be addressed by policy work?
YES
YES
?
YES
YES
?
YES
YES

Key New Tool –Health Impact Assessment (HIA)
• HIA is tool for systematically evaluating, synthesizing, and communicating information about potential health impacts for more informed decision-making, especially in other sectors.
• An HIA might ask:– What are the health consequences of high rates of students dropping out
from high schools?– What elements of school site design are most cost-effective in
encouraging physical activity?• Why use an HIA?
– It influences decision makers using a broad understanding of health and a wide range of evidence – it places public health on the agenda
– It highlights potentially significant health impacts that are unknown, under-recognized, or unexpected
– It facilitates inter-sectoral working and public participation in decision making

Link Between Obesity and Eating Out• Americans eating out more than ever before--in LA County,
one in four children 2-17 years of age ate fast food in the past day (2005 LA County Health Survey).
• Supersizing of restaurant food and beverage portions has become widespread.
• Fast food consumption linked with increased caloric intake and excess weight gain.
• Studies have shown that most people (even nutritionists) greatly underestimate the caloric content of restaurant menu items.
• Calorie and other nutritional information not generally available at the point of purchase in restaurants (in contrast to packaged food products which are required by the FDA to include nutrition information).

Require chain restaurants with > 15 outlets in CA to provide nutritional information at point of purchase
- Menu Boards: calories
- Menus: calories, fat, sat/trans fat, carbohydrate, sodium
Applies to standard menu items only
SB 1420 - Menu LabelingExample of Subway menu board
in NYC

2 Big Macs 1,080 cal 53%
2 Egg McMuffins 600 cal 8%
1 Large shake 1,160 cal 11%
4 Hamburgers 1,000 cal 22%
Field Poll, 523 registered voters, April 2007
Which McDonald’s Menu OptionHas the Most Calories?
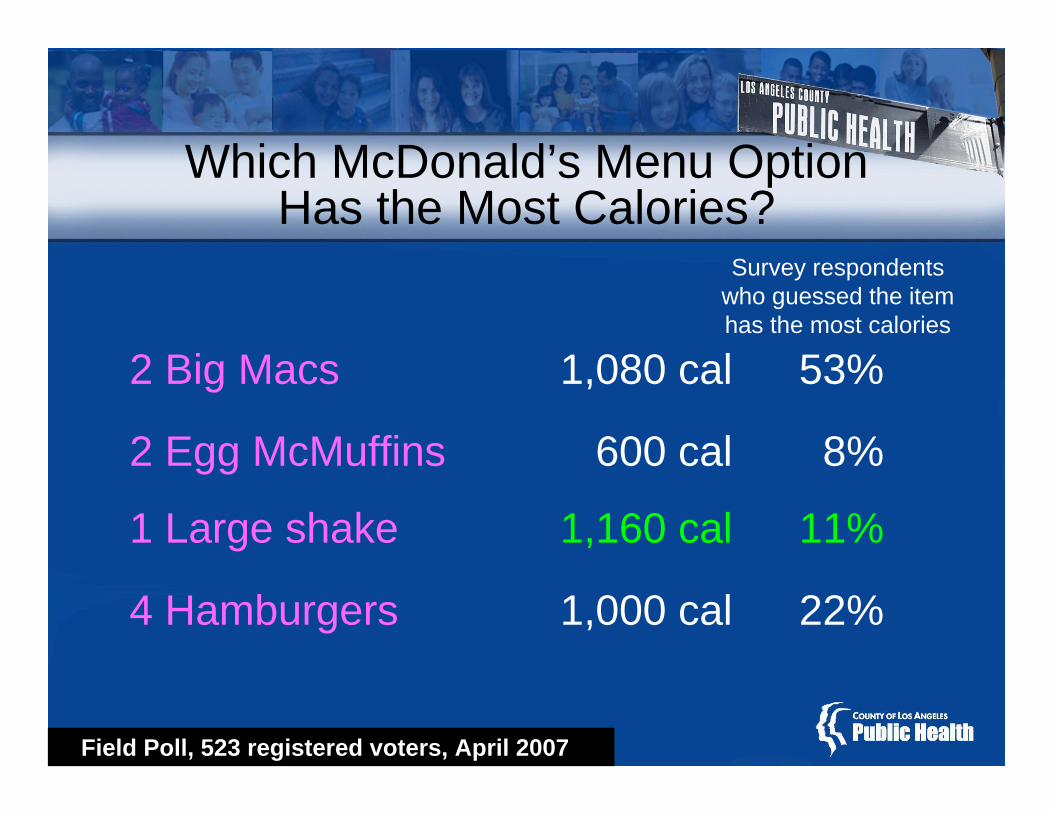
2 Big Macs 1,080 cal 53%
2 Egg McMuffins 600 cal 8%
1 Large shake 1,160 cal 11%
4 Hamburgers 1,000 cal 22%
Field Poll, 523 registered voters, April 2007
Which McDonald’s Menu OptionHas the Most Calories?
Survey respondents who guessed the item has the most calories

Conducting HIA to Estimate Impactof Menu Labeling Bill
• HIA found that if menu labeling resulted in just 10% of restaurant patrons ordering reduced calorie meals (with an average reduction of 100 calories per meal), a total of 38.9% of the 6.75 million pound average annual weight gain in the county population (5 yrs and older) would be averted.
• Significantly larger impacts could be realized with increased consumer response to the posted calorie information.

Key New Tool - Health Forecasting• Currently we spend time examining health status, health
risks, and health improvement opportunities for today– But optimal planning requires us to understand how our current
activities will influence future health status• Health forecasting = a modeling project that helps us to
estimate what health status will be in the future• HF allows us to:
– Model future health status based on health behavior patterns, population trends, and other variables
– Compare policy options to determine which are the most cost-effective for improving health
– Demonstrate the health impact of non-health oriented policies– Model effect of multiple interventions

0%
10%
20%
30%
40%
50%
60%
Physical Activity & Obesity Are Not Independent
0
2
4
6
8
10
12
5020 25 30 35 40 4515
Med
ian
MET
hrs/
wee
k
BMI
Perc
ent O
verw
eigh
t
Age6020 30 40 50 70 9080
Active
Inactive
People with low levels of Physical Activity (<8 METhrs/wk) are more likely to be overweight:
People with healthy BMI have higher levels of Physical Activity:
Source: CA-BRFS 1984-2000

Identifying Strategies to Reduce Disparities
-10%
-8%
-6%
-4%
-2%
0%2005 2010 2015 2020
WHITEBLACKLATINOASIAN-PI
Charts show the forecasted percent change in age-adjusted mortality:
-10%
-8%
-6%
-4%
-2%
0%2005 2010 2015 2020
WHITEBLACKLATINOASIAN-PI
Up to Best
+2 METs Hours per week

Further Increases in BMI = Additional $12 B. in Personal Medical Expenditures in CA Annually by 2025
-
20,000
40,000
60,000
80,000
100,000
120,000
140,000
2005 2010 2015 2020 2025
Scenario I - DecreasingBMIBaseline
Scenario II - IncreasingBMI
( = 1985 levels)
( = 2005 levels)
( = continuing increase in rate equal to rate incrase from 1985 to 2005)
Total direct personal medical expenditures*, age 18+ (2003 $000,000)All dollars used below are 2003 actual dollars
108,350
127,499
115,672

What Health Departments Can Do to Promote Healthy Policies
• Develop appropriate skills– Hire people with expertise in policy work– Learn new tools (e.g., HIA)
• Work with new partners that have overlapping goals and objectives– Look for partners in business, academia, other levels
of government• Educate decision makers and public about the
underlying determinants – Explain why every policy is a health policy
• Use best evidence in choosing policy interventions to support

Guide to Community Preventive Services
• Excellent source for best evidence on interventions to improve health in populations
• 15 member independent expert panel working with CDC staff and other governmental agencies and interested organizations
• Performs systematic reviews and makes related recommendations based on standardized methods
• www.thecommunityguide.org

Insufficient evidenceTransportation and travel policies and practicesRecommended (strong evidence)Community-scale urban design and land use policies and practicesRecommended (strong evidence)Street-scale urban design and land use policies and practicesRecommended (strong evidence)“Point-of-decision” prompts
Recommended (strong evidence)Creation of or enhanced access to places for PA combined with informational outreach activities
Environmental & Policy Approaches to Increasing Physical ActivityInsufficient evidenceFamily-based social supportInsufficient evidenceCollege-based health education and physical education
Insufficient evidenceClassroom-based health education focused on reducing TV viewing and video game playing
Recommended (strong evidence)Individually-adapted health behavior changeRecommended (strong evidence)Social support interventions in community settingsRecommended (strong evidence)School-based physical education
Behavioral & Social Approaches to Increasing Physical ActivityInsufficient evidenceMass media campaignsInsufficient evidenceClassroom-based health education focused on providing infoRecommended (strong evidence)“Point-of-decision” promptsRecommended (strong evidence)Community-wide campaigns
Informational Approaches to Increasing Physical Activity (PA)RecommendationIntervention

Environmental and Policy Approaches to Increase Physical Activity
• The Task Force recommended: Creating or improving access to places for physical activity
• Background on interventions:– Involve worksites, coalitions, agencies, communities to change
the local environment– Examples of changes: creating walking trails, building exercise
facilities, providing access to existing facilities nearby• Findings:
– In all 10 studies, improving access to places for physical activity was effective in getting people to exercise more
• Median estimates = 25% increase in percent of people exercising at least 3 times a week
– These interventions were effective among both men and women and in various settings, including industrial plants, universities, federal agencies, and low-income communities.

Environmental and Policy Approaches to Increase Physical Activity
• The Task Force recommended: Community-scale urban design and land use policies and practices to promote physical activity
• Background on interventions:– Defined as urban design and land use policies and practices that
support physical activity in geographic areas, generally severalsquare kilometers in area or more.
– Involve urban planners, architects, engineers, developers, and public health professionals
– Design elements include the proximity of residential areas to stores, jobs, schools and recreation areas: the continuity and connectivity of sidewalks and streets; and the aesthetic quality and safety aspects of the physical environment
• Findings:– Studies generally compared behavior of residents in auto-oriented
(suburban) communities with those in urban communities– In 12 studies, overall median improvement in some aspect of
physical activity (e.g., # of walkers) was 161%

Environmental and Policy Approaches to Increase Physical Activity
• The Task Force recommended: Street-scale urban design and land use policies and practices to promote physical activity
• Background on interventions:– Defined as street-scale urban design and land use policies that
support physical activity in small geographic areas, generally limited to a few blocks
– Involve urban planners, architects, engineers, developers, and public health professionals
– Design components include improved street lighting, infrastructure projects to increase safety of street crossing, use of traffic calming approaches, & enhancing the street landscape
• Findings:– Studies assessed effectiveness in providing a more inviting and
safer outdoor environment for physical activity– In 6 studies, the overall median improvement in some aspect of
physical activity (e.g., # of walkers) was 35%

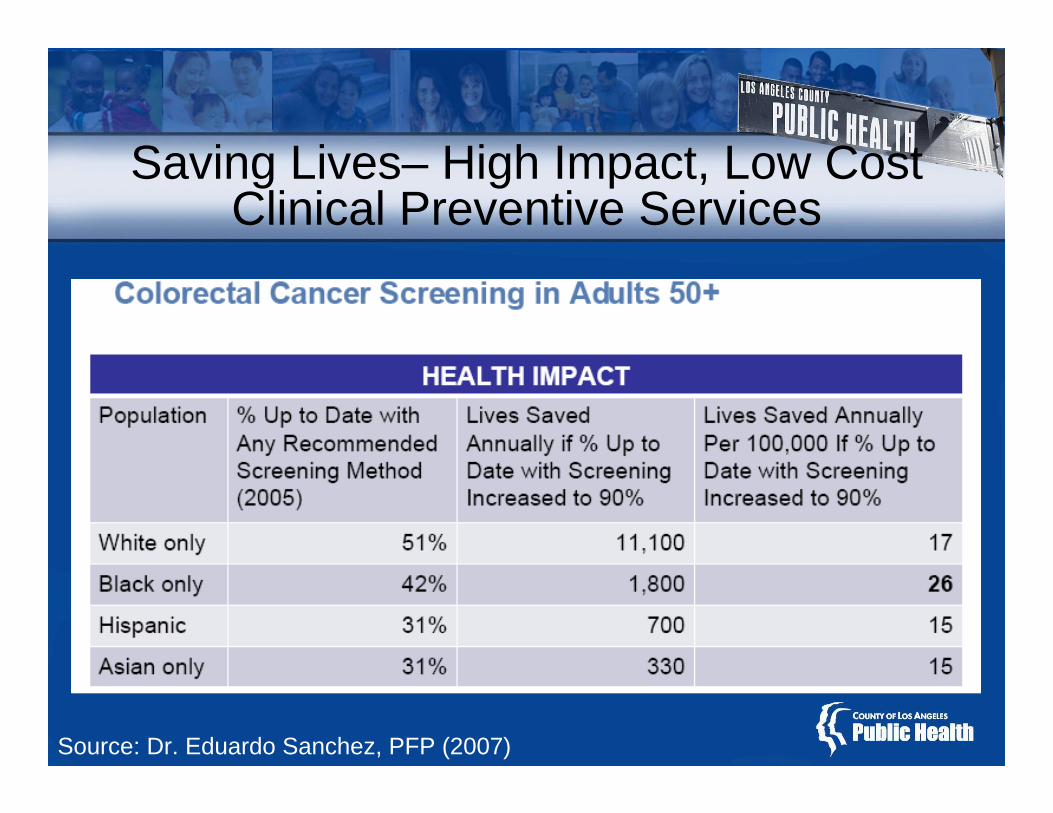
Setting Priorities Among High Impact, Low Cost Clinical Preventive Services
• Partnership for Prevention, non-profit organization dedicated to improving use of effective prevention, reviewed 25 preventive services recommended by the USPSTF & the Advisory Committee on Immunization Practices.
• Rankings based on clinically preventable burden, which measures (in QALYs):– Health impact of the service on the relevant population– Cost effectiveness of the service– Cost effectiveness = average net cost per QALY gained
• For full report & more about the National Commission on Prevention Priorities, go to www.prevent.org

Saving Lives – High Impact, Low Cost Clinical Preventive Services
Source: Dr. Eduardo Sanchez, PFP (2007)

Saving Lives – High Impact, Low Cost Clinical Preventive Services
Source: Dr. Eduardo Sanchez, PFP (2007)

Saving Lives– High Impact, Low Cost Clinical Preventive Services
Source: Dr. Eduardo Sanchez, PFP (2007)

Source: Dr. Eduardo Sanchez, PFP (2007)
Saving Lives– High Impact, Low Cost Clinical Preventive Services
Saving Lives– High Impact, Low Cost Clinical Preventive Services
Source: Dr. Eduardo Sanchez, PFP (2007)

LA County Public Health –Healthy People Build Healthy Communities


![Key Assets for Implementing Local Health Department Health in All Policies Initiatives · 2020. 3. 12. · Department Health in All Policies Initiatives [FACT SHEET] March 2018 1](https://img.dokumen.tips/doc/110x75/5fe2d39cc2d61b13b97d312f/key-assets-for-implementing-local-health-department-health-in-all-policies-initiatives.jpg)