Embed Size (px)
Citation preview
The University of San FranciscoUSF Scholarship: a digital repository @ Gleeson Library |Geschke Center
Master's Projects and Capstones Theses, Dissertations, Capstones and Projects
Summer 8-26-2015
Health Hub Program EvaluationNatalie [email protected]
Follow this and additional works at: https://repository.usfca.edu/capstone
Part of the Community Health and Preventive Medicine Commons, Educational Assessment,Evaluation, and Research Commons, Health and Physical Education Commons, Other NutritionCommons, Other Social and Behavioral Sciences Commons, and the Public Health Education andPromotion Commons
This Project/Capstone is brought to you for free and open access by the Theses, Dissertations, Capstones and Projects at USF Scholarship: a digitalrepository @ Gleeson Library | Geschke Center. It has been accepted for inclusion in Master's Projects and Capstones by an authorized administratorof USF Scholarship: a digital repository @ Gleeson Library | Geschke Center. For more information, please contact [email protected].
Recommended CitationMacias, Natalie, "Health Hub Program Evaluation" (2015). Master's Projects and Capstones. 196.https://repository.usfca.edu/capstone/196
Running head: HEALTH HUB PROGRAM EVALUATION 1
HEALTH HUB PROGRAM EVALUATION
by
Natalie R. Macias
A Capstone Project submitted in fulfillment of the requirement
for the degree of Master of Science in Behavioral Health
University of San Francisco
San Francisco, California
August 2015
Primary Advisor: Dr. Jaclynn Hawkins
Secondary Advisor: Dr. Kathleen Raffel
Peer Reviewer: Aouie Rubio
HEALTH HUB PROGRAM EVALUATION 2
Executive Summary
This paper examines and evaluates the work of LIFT-Levántate a non-profit organization
in San Rafael, California on their school-based nutritional education “health hub,” through health
promotion interventions with adolescents. The James B. Davidson Middle School health hub
educates students on topics related to nutrition and physical activity with the goal of providing
access and increasing consumption of fruits and vegetables while lowering students’ intake of
high-fat and sugary processed foods. Through research and observations of the students and
families in this community, the data seems to indicate apparent disparities which vary by
ethnicity, socioeconomic status and access. Underserved populations, including racial and ethnic
minorities, face significant health disparities in the United States.
An evaluation of the health hub’s progress will be assessed in order to recognize and
address potential obstacles to effectively implementing a multifaceted program. By
implementing pre-and-post intervention questionnaires, during the 2014-15 school year, the
primary goal of this evaluation is to increase rates of healthy eating and physical activity
participation among students. In the hope to implement this school-based health hub at other
school communities in San Rafael, California. Results indicated that students overall, beliefs,
perceptions, attitudes, and knowledge increased positively with the implementation of the health
hub at James B. Davidson Middle School. These results have a promising effect for further
support of programs and resources to be provided to this school community.
HEALTH HUB PROGRAM EVALUATION 3
Agency Description
Organizational Background
LIFT-Levántate is a nonprofit organization that strives to do as its name implies: to lift
low-resource communities out of poverty. Founded in 2008, LIFT-Levántate keeps the mission
of fostering health equity in these communities at the center of its programs, which operates in
Marin County. The organization focuses its services on the most challenged communities in the
San Francisco Bay Area, including high risk populations. Realizing that low-income
communities face serious health disparities and high rates of chronic diseases, the organization
was founded to address needs within these communities. They include, food insecurity, limited
access to affordable health services, limited physical activity options and access to safe parks,
high rates of stress, and limited transportation options. Historically, the organization focused on
providing primary and secondary preventive services to teenagers deemed as high risk. The
purpose of these preventive services, including screening and health education, is to reduce
health disparities among the lowest income residents by reducing the prevalence of chronic
disease, including type 2 diabetes, obesity, and cardiovascular disease. Over time, that approach
has moved upstream to include teenagers’ families and other vulnerable residents in the
community, with the overall aim of promoting more comprehensive family and community
wellness in low-resource settings.
LIFT-Levántate’s goal of building healthy, equitable communities revolves around five
core strategies: increasing health education programs; improving health access; offering training
and technical assistance; influencing policy and systems to create change; and promoting
evaluation and research for further study and improvement. To address these core strategies,
LIFT-Levántate initially developed 28 programs focusing on food distribution, workforce
HEALTH HUB PROGRAM EVALUATION 4
engagement, community engagement, worksite wellness, nutrition and physical activity
education, and policy initiatives. Today, LIFT-Levántate has narrowed its resources down to four
main projects: community health hubs, parks programs, the Diabetes, Obesity, & Cardiovascular
Initiative, and workplace wellness.
One of LIFT-Levántate’s innovative and signature efforts are the community health hubs
program. Operating in three community-based San Francisco Bay Area locations, these
community health hubs provide comprehensive services ranging from nutrition education to
clinical screenings and referrals to workforce engagement. Other activities taking place within
this program include food distribution, physical activity classes, and peer education. All services
are locally delivered with the intent of being multilingual and culturally sensitive.
To carry out service delivery, LIFT-Levántate relies on organizational staff, community
partnerships, and capacity built within the communities it serves. The staff of nine employees
oversees program activities and maintains partnerships with health clinics, community centers,
private and nonprofit organizations, and government agencies. Volunteers from within the target
communities also provide other services. For example, at certain locations, teenagers are trained
to assist in health education delivery. By using a multi-faceted approach to service delivery,
LIFT-Levántate addresses the unique needs of low-resourced residents in their diverse service
areas.
One of the health hubs is set at James B. Davidson Middle School, which implements
these resources and programs in a school-based setting. According to the San Rafael School
District, the school has over 60 % students of color, over 66% are eligible for Free and Reduced
Lunch and over 60% are English Language Learners. One in four of these children are food
insecure, and 57.3% of the students’ families are living at or below the Federal Poverty Line
HEALTH HUB PROGRAM EVALUATION 5
without access to safe outdoor places to play. Since implementation to the end of the school year,
the LIFT-Levántate team must monitor and evaluate this health hub program to learn if the
programs being offered are effective and efficient at James B. Davidson Middle School. The
primary objective of the James B. Davidson health hub is to create a culture of health and
wellness and build a sustainable and vibrant healthy community. In addition, the health hub
wants to improve lives by health equity, quality of life, and life expectancy. To combat these
issues, the health hub needs to track and monitor the progress toward achieving its goals and
outcomes. The health hub implemented an initial pre-and-post evaluation questionnaire to
determine if outcomes are being reached, and if the program effectively identified successful
strategies to overcome anticipated challenges. Successful implementation required participation
from all students in the assessment of their knowledge, skills, and behaviors towards eating and
physical activity habits. Anticipated barriers are the receipt of continual support and ownership
of the health hub from school staff and faculty, and student’s parents. If there is not consistent
collaboration from all stakeholders the James B. Davidson Middle School health hub will fail to
reach its goals and objectives.
Literature Review
An unhealthy diet is one of the major risk factors for a range of chronic diseases,
including diabetes, cardiovascular diseases and other conditions linked to obesity. Certain
recommendations for a healthy diet include eating more vegetables and fruit and eating less fats
and processed sugars. Improving these healthy dietary habits is a societal, not just an individual
problem. Thus, it requires support from every facet in our society, and a multi-disciplinary, and
culturally relevant approach.
Epidemiology
HEALTH HUB PROGRAM EVALUATION 6
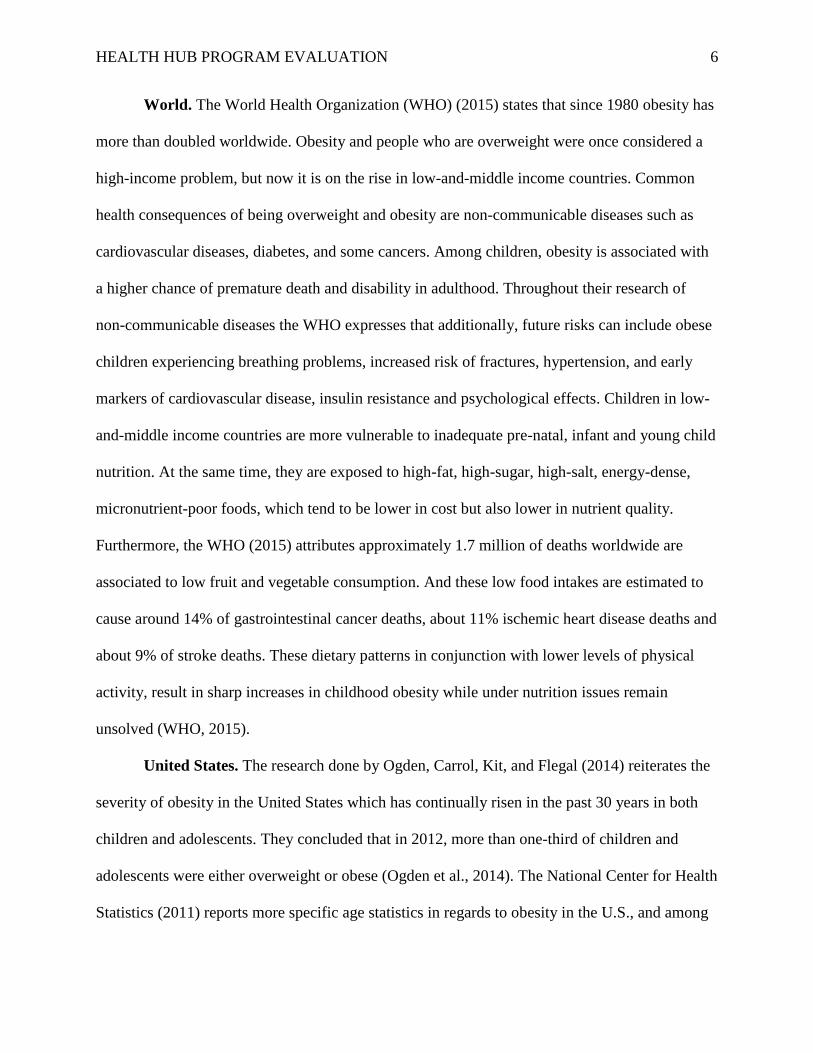
World. The World Health Organization (WHO) (2015) states that since 1980 obesity has
more than doubled worldwide. Obesity and people who are overweight were once considered a
high-income problem, but now it is on the rise in low-and-middle income countries. Common
health consequences of being overweight and obesity are non-communicable diseases such as
cardiovascular diseases, diabetes, and some cancers. Among children, obesity is associated with
a higher chance of premature death and disability in adulthood. Throughout their research of
non-communicable diseases the WHO expresses that additionally, future risks can include obese
children experiencing breathing problems, increased risk of fractures, hypertension, and early
markers of cardiovascular disease, insulin resistance and psychological effects. Children in low-
and-middle income countries are more vulnerable to inadequate pre-natal, infant and young child
nutrition. At the same time, they are exposed to high-fat, high-sugar, high-salt, energy-dense,
micronutrient-poor foods, which tend to be lower in cost but also lower in nutrient quality.
Furthermore, the WHO (2015) attributes approximately 1.7 million of deaths worldwide are
associated to low fruit and vegetable consumption. And these low food intakes are estimated to
cause around 14% of gastrointestinal cancer deaths, about 11% ischemic heart disease deaths and
about 9% of stroke deaths. These dietary patterns in conjunction with lower levels of physical
activity, result in sharp increases in childhood obesity while under nutrition issues remain
unsolved (WHO, 2015).
United States. The research done by Ogden, Carrol, Kit, and Flegal (2014) reiterates the
severity of obesity in the United States which has continually risen in the past 30 years in both
children and adolescents. They concluded that in 2012, more than one-third of children and
adolescents were either overweight or obese (Ogden et al., 2014). The National Center for Health
Statistics (2011) reports more specific age statistics in regards to obesity in the U.S., and among
HEALTH HUB PROGRAM EVALUATION 7
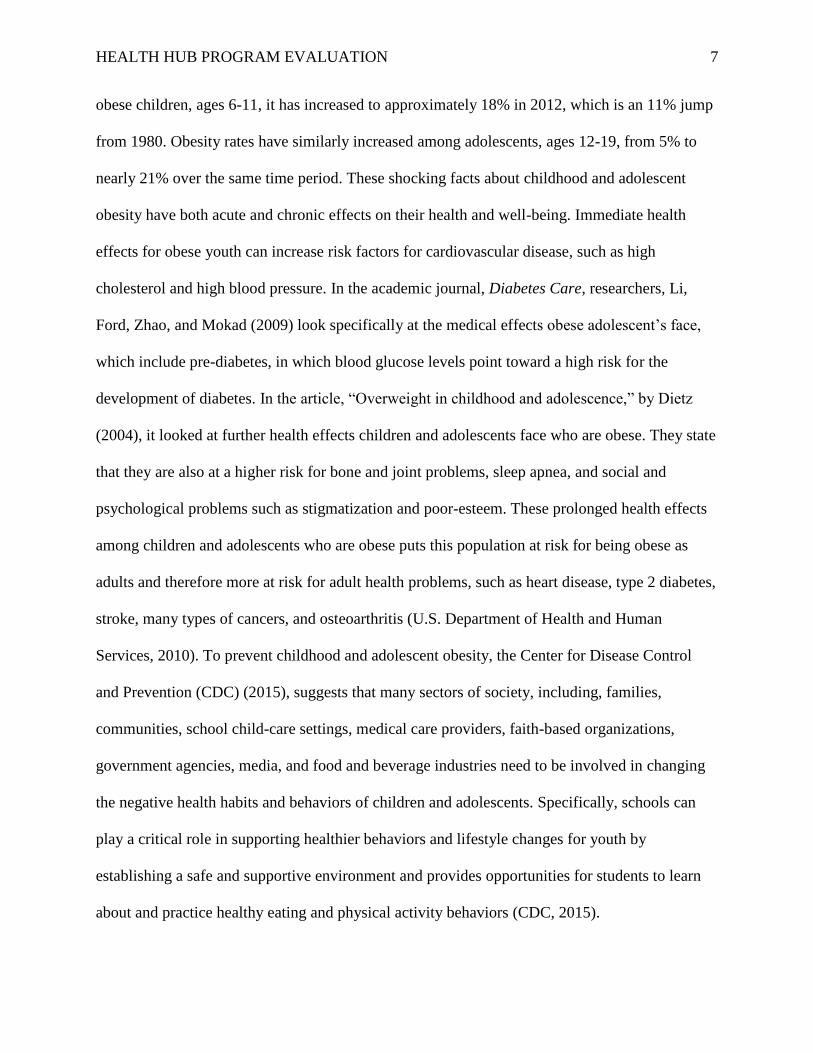
obese children, ages 6-11, it has increased to approximately 18% in 2012, which is an 11% jump
from 1980. Obesity rates have similarly increased among adolescents, ages 12-19, from 5% to
nearly 21% over the same time period. These shocking facts about childhood and adolescent
obesity have both acute and chronic effects on their health and well-being. Immediate health
effects for obese youth can increase risk factors for cardiovascular disease, such as high
cholesterol and high blood pressure. In the academic journal, Diabetes Care, researchers, Li,
Ford, Zhao, and Mokad (2009) look specifically at the medical effects obese adolescent’s face,
which include pre-diabetes, in which blood glucose levels point toward a high risk for the
development of diabetes. In the article, “Overweight in childhood and adolescence,” by Dietz
(2004), it looked at further health effects children and adolescents face who are obese. They state
that they are also at a higher risk for bone and joint problems, sleep apnea, and social and
psychological problems such as stigmatization and poor-esteem. These prolonged health effects
among children and adolescents who are obese puts this population at risk for being obese as
adults and therefore more at risk for adult health problems, such as heart disease, type 2 diabetes,
stroke, many types of cancers, and osteoarthritis (U.S. Department of Health and Human
Services, 2010). To prevent childhood and adolescent obesity, the Center for Disease Control
and Prevention (CDC) (2015), suggests that many sectors of society, including, families,
communities, school child-care settings, medical care providers, faith-based organizations,
government agencies, media, and food and beverage industries need to be involved in changing
the negative health habits and behaviors of children and adolescents. Specifically, schools can
play a critical role in supporting healthier behaviors and lifestyle changes for youth by
establishing a safe and supportive environment and provides opportunities for students to learn
about and practice healthy eating and physical activity behaviors (CDC, 2015).

HEALTH HUB PROGRAM EVALUATION 8
California. The National Initiative for Children’s Healthcare Quality (NICH) (2007),
ranked the state of California 24th in overall prevalence with 30.5% of children ages 10-17,
classified as overweight or obese. Once more there are many risk factors that contribute to the
prevalence of overweight and obese children. These risk factors include lack of physical activity
and low quantities of fruits and vegetables in daily diets and high intake of sugary drinks and
foods. Among health disparities Californian families and their children rank fairly even among
the nation. However, when it comes to race/ethnicity, the percentage of overweight or obese by
Hispanic origin is significantly higher than non-Hispanic (39.9% v 21.7%) (NICH, 2007).
Recognizing that childhood obesity is a growing problem nationally and in the state; California
has implemented some key policies and grant initiatives. First, California receives six grants
from the Robert Wood Johnson Foundation (2014), one is Healthy Kids, Healthy Communities
Fund to battle overweight and obesity in children. California is also, one of only five states
(California, Maine, New Jersey, Oregon, and Vermont) with menu labeling laws. There are also
many obesity-related school standards required in California. Nutritional standards for school
meals and snacks go beyond existing USDA requirements. In addition, nutritional standards and
limited access to competitive food products sold in vending machines, and school stores. These
policies, standards and initiatives are a great start to achieving a healthier result among children
and adolescents whom are overweight and obese. However, more must be done so this
population can prevent many of the chronic conditions that attribute to obesity.
Marin County. According to Bee (2012), locally in the Bay Area is home to some of the
widest disparities in wealth and health in the United States. The California Food Policy
Advocates (2015) has Marin County ranked “Healthiest County in America” in 2013, yet over
37% of adults are considered food insecure. The U.S. Census Bureau (2014), data regarding
HEALTH HUB PROGRAM EVALUATION 9
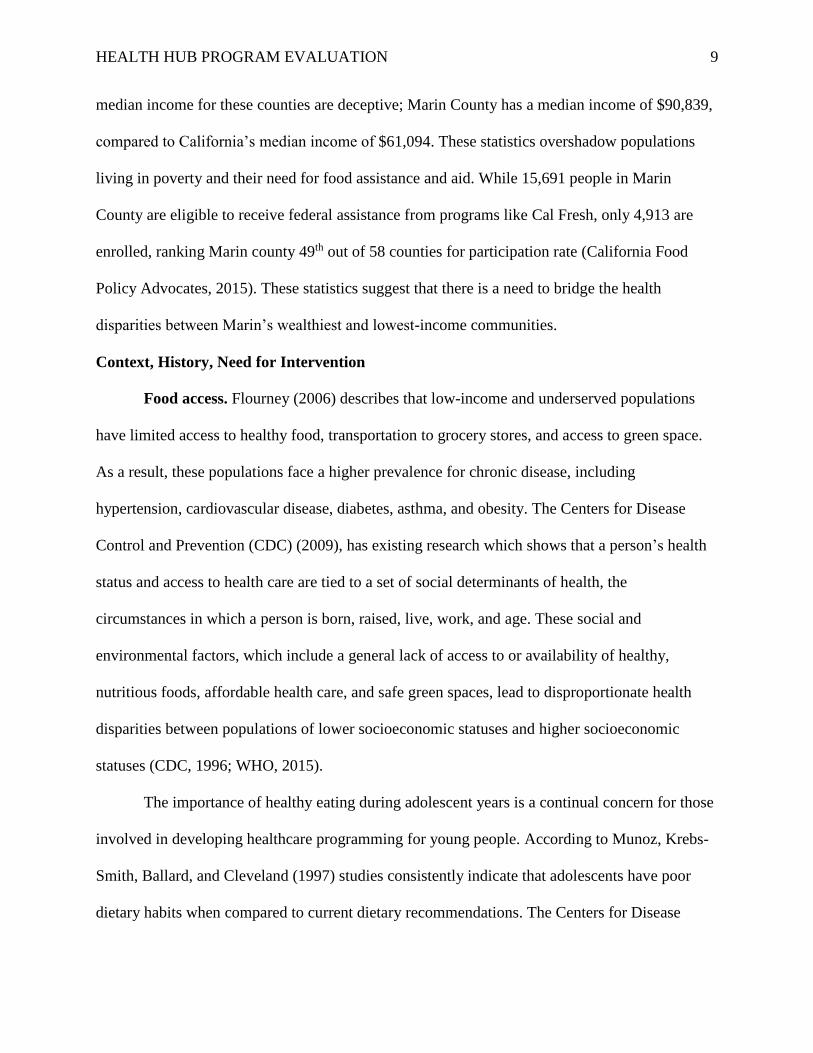
median income for these counties are deceptive; Marin County has a median income of $90,839,
compared to California’s median income of $61,094. These statistics overshadow populations
living in poverty and their need for food assistance and aid. While 15,691 people in Marin
County are eligible to receive federal assistance from programs like Cal Fresh, only 4,913 are
enrolled, ranking Marin county 49th out of 58 counties for participation rate (California Food
Policy Advocates, 2015). These statistics suggest that there is a need to bridge the health
disparities between Marin’s wealthiest and lowest-income communities.
Context, History, Need for Intervention
Food access. Flourney (2006) describes that low-income and underserved populations
have limited access to healthy food, transportation to grocery stores, and access to green space.
As a result, these populations face a higher prevalence for chronic disease, including
hypertension, cardiovascular disease, diabetes, asthma, and obesity. The Centers for Disease
Control and Prevention (CDC) (2009), has existing research which shows that a person’s health
status and access to health care are tied to a set of social determinants of health, the
circumstances in which a person is born, raised, live, work, and age. These social and
environmental factors, which include a general lack of access to or availability of healthy,
nutritious foods, affordable health care, and safe green spaces, lead to disproportionate health
disparities between populations of lower socioeconomic statuses and higher socioeconomic
statuses (CDC, 1996; WHO, 2015).
The importance of healthy eating during adolescent years is a continual concern for those
involved in developing healthcare programming for young people. According to Munoz, Krebs-
Smith, Ballard, and Cleveland (1997) studies consistently indicate that adolescents have poor
dietary habits when compared to current dietary recommendations. The Centers for Disease
HEALTH HUB PROGRAM EVALUATION 10
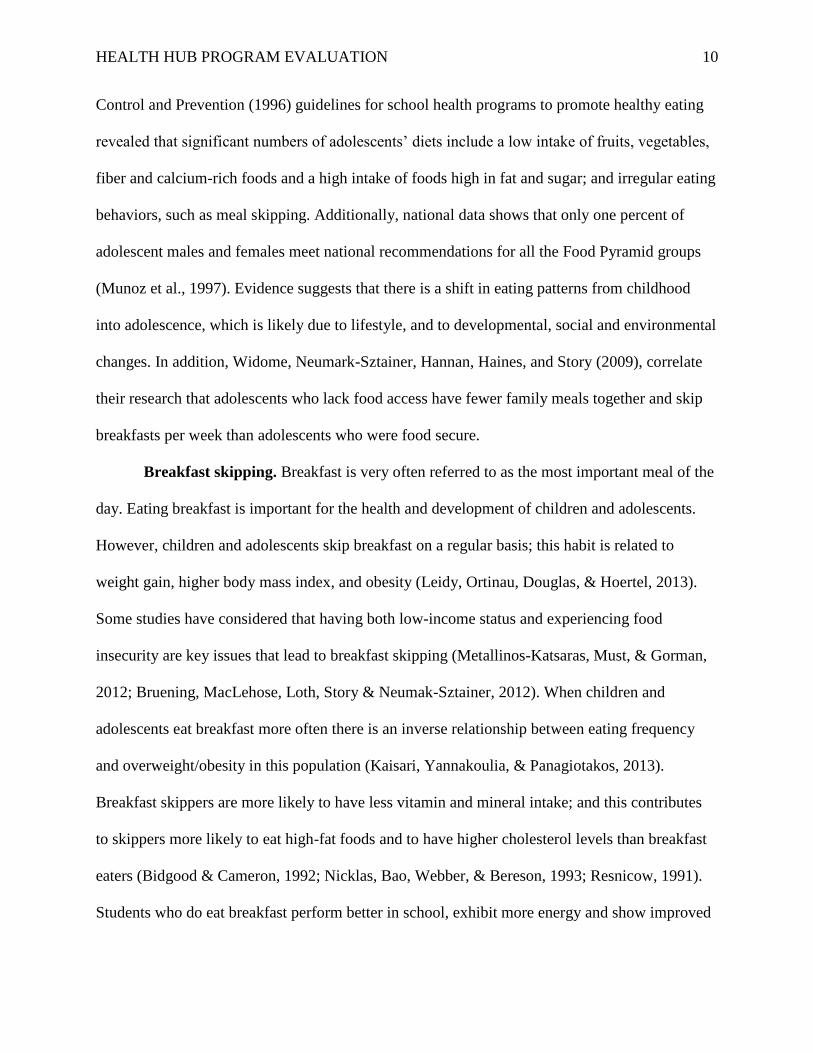
Control and Prevention (1996) guidelines for school health programs to promote healthy eating
revealed that significant numbers of adolescents’ diets include a low intake of fruits, vegetables,
fiber and calcium-rich foods and a high intake of foods high in fat and sugar; and irregular eating
behaviors, such as meal skipping. Additionally, national data shows that only one percent of
adolescent males and females meet national recommendations for all the Food Pyramid groups
(Munoz et al., 1997). Evidence suggests that there is a shift in eating patterns from childhood
into adolescence, which is likely due to lifestyle, and to developmental, social and environmental
changes. In addition, Widome, Neumark-Sztainer, Hannan, Haines, and Story (2009), correlate
their research that adolescents who lack food access have fewer family meals together and skip
breakfasts per week than adolescents who were food secure.
Breakfast skipping. Breakfast is very often referred to as the most important meal of the
day. Eating breakfast is important for the health and development of children and adolescents.
However, children and adolescents skip breakfast on a regular basis; this habit is related to
weight gain, higher body mass index, and obesity (Leidy, Ortinau, Douglas, & Hoertel, 2013).
Some studies have considered that having both low-income status and experiencing food
insecurity are key issues that lead to breakfast skipping (Metallinos-Katsaras, Must, & Gorman,
2012; Bruening, MacLehose, Loth, Story & Neumak-Sztainer, 2012). When children and
adolescents eat breakfast more often there is an inverse relationship between eating frequency
and overweight/obesity in this population (Kaisari, Yannakoulia, & Panagiotakos, 2013).
Breakfast skippers are more likely to have less vitamin and mineral intake; and this contributes
to skippers more likely to eat high-fat foods and to have higher cholesterol levels than breakfast
eaters (Bidgood & Cameron, 1992; Nicklas, Bao, Webber, & Bereson, 1993; Resnicow, 1991).
Students who do eat breakfast perform better in school, exhibit more energy and show improved
HEALTH HUB PROGRAM EVALUATION 11
behavior and attentiveness (Conners & Blouin, 1982; Strauss, 2000). The children and
adolescents who do not eat breakfast regularly are at risk for poor nutrition, eating habits and
behaviors. Practical interventions or school-based programs, such as nutrition and dietary
education, cooking skills, and behavior strategies are recommended to improve the diets and
healthy lifestyles of youth in an effort to prevent obesity (Benjamin Neelon & Briley, 2011).
Drinking water. The research done by Kenny, Long, Cradock, and Gortmaker (2015)
looked at how many children and adolescents are not drinking enough fluids, which can lead to
dehydration and can affect fatigue, mood and possibly the ability to focus in school. According
to the 2014 National Health and Nutrition Examination Survey conducted by the Centers for
Disease Control and Prevention from 2009-2012 determined whether children and adolescents
ages 6-19, were sufficiently hydrated. They concluded that 54.5% of this population were
inadequately hydrated; boys were 76% more likely than girls, and non-Hispanic blacks were
34% more likely than non-Hispanic whites to be more dehydrated (Kenney et al., 2015). The
research also recommends that children and adolescents should consume about 2-3 liters of water
a day. However, getting children and adolescents to drink more water throughout the day is more
difficult than previously anticipated. Sugary beverages are often more common at schools and
students often prefer those choices rather than water. More school programs targeted at reducing
the consumption of sugary drinks and soda are attempting to make water more accessible to its
students and appealing in cafeterias (Kenney et al., 2015).
Attitudes, knowledge and perceptions. According to Hampl, Wharton, Taylor,
Winham, Block, and Hall’s (2004) study on, “Primetime television impacts on adolescents’
impression of bodyweight,” advocates that children and adolescents may lower their risk of
becoming overweight and obese if they live a healthier lifestyle by improving their nutrition
HEALTH HUB PROGRAM EVALUATION 12
knowledge and attitudes towards nutrition and health. Factors that can contribute to influencing
the eating behaviors of the adolescent population are television, hunger and food cravings, peers,
and food appeal (Hamp et al., 2004). Other research findings by the, Journal of School Health,
have proved that eating behaviors are developed in childhood and continue through adulthood
(Powers, Struempler, Guarino, & Parmer, 2005). This life-course perspective presented by Elder
(1998) and Lee, Harris, and Gordon-Larsen (2009), serves as a framework to understand the
trajectory of health and nutrition on obesity transitions from children to adolescence into young
adulthood. A few themes define this life course paradigm. First, people are linked through a
social network of relationships that are interdependent. For example, parents eating choices,
behaviors and practices affect and influence their children’s development and eating behaviors
(Birch & Fisher, 1998). Second, the sequence of life events can determine subsequent protective
and risks factors. For example, a child living in poverty can affect the physical and psychological
morbidity of low-income children (Evans, 2004). Thirdly, people have the option of choices. For
example, nutritional and food choices and diets among individuals is influenced by the social,
historical and economic world, and family background (Lee et al., 2009). Incorporating school-
based nutrition programs is a tool that can assist low-income families and educate students about
nutrition and shift their attitudes and beliefs about healthy eating habits. To tackle this barrier
Lautenschlager and Smith (2007) concluded that students who are exposed to nutrition
intervention programs akin to, interactive nutrition classes, gardening, physical activity, and
cooking have a better understanding of food and nutrition, are more environmentally conscious,
and can help youth navigate through food choices that will positively enhance their health
outcomes.
HEALTH HUB PROGRAM EVALUATION 13
Race/ethnicity. Although rates of childhood obesity among the general population are
alarmingly high, they are higher still in ethnic minority and low-income communities. Particular
populations to address are minority populations regarding their nutritional and physical activity
status because they are at risk for obesity, diabetes and other unwanted health concerns in the
years to follow. Kumanyika and Grier (2006) describe differences in childhood obesity
prevalence by race and ethnicity and by socioeconomic status. They display how various
environmental factors (i.e. neighborhood, media campaigns, and access) can have larger effects
on disadvantaged and minority children than of their advantaged white peers, which contributes
to disparities in obesity rates. It is noted that neighborhoods where low-income and minority
children live typically have more fast-food restaurants and fewer vendors of healthy foods than
do wealthier or predominantly white neighborhoods. This further explains the disparities
experienced in Marin County with the recent CX3 Communities of Excellence survey by Marin
Health and Human Services (2014), which found that 0% of these fast food outlets offered or
promoted healthy food options. Obstacles also come in the form of physical activity with unsafe
streets, dilapidated parks, and lack of facilities. In the schools that low-income and minority
children attend, however, there are opportunities to lead the way to effectively promote obesity
prevention. Ultimately, winning the fight against childhood obesity in minority and low-income
communities will depend on the nation's will to change the social and physical environments in
which these communities exist (Kumanyika et al., 2006).
School-based nutrition. Numerous research has been done on nutrition education
through school-based settings and has the potential to positively impact the nutritional health and
dietary behaviors of adolescents. School-based nutrition education is an ideal setting because of
the direct capacity to reach youth. These programs provide the opportunity for students to better

HEALTH HUB PROGRAM EVALUATION 14
integrate healthy eating behaviors within their daily routines as more than one-half of youth in
the United States eat at least one meal in school. Matson-Koffman, Brownstein, Neeiner, and
Greaney (2005), explain that because eating is a socially learned behavior influenced by social
pressures, school-based programs can harness the power of peer influence to support and
reinforce healthy eating habits. Gortmaker, Peterson, Wiecha, Sobol, Dixit, Fox and Larid
(1999), recommend that school-based interventions aimed at increasing access to healthy food,
physical activities, and increasing knowledge about nutritious eating can lead to healthy behavior
changes in the short-term as well as reduce the prevalence of obesity and chronic disease in the
long term. Many research articles believe the most effective pedagogical approaches of health
promotion for middle school students are project-based, hands-on, engaging and interactive, and
provide opportunities for peer-to-peer education and mentorship (Lytle & Achterberg, 1995;
Story, Lytle, Birnbaum, & Perry 2002; Katz, O’Connell, Njike, Yeh, & Nawaz 2008).
Best Practices
School-based programs. As mentioned in the previous article by Gortmaker et al.,
(1999), schools provide an excellent vehicle for the delivery of obesity interventions and
prevention programs. They offer continual regular contact with children and opportunities for
nutrition education and promotion of physical activity both within the formal curriculum and
informally through a supportive environment such as healthy school meals and break time
snacks. The rapidly increasing prevalence of obesity among adolescents in the United States,
may require a bigger effort through interventions focused on environments where adolescents
may be more comfortable learning about nutrition and healthy eating habits. Schools seem to be
an ideal channel of program intervention because they offer access to large populations of
students and provide the opportunity to institutionalize programs in communities. School-based
HEALTH HUB PROGRAM EVALUATION 15
nutrition programs can provide that opportunity for behavioral change because of the near
universal enrollment of youth in school (Lytle, Kelder, Perry, Klepp, & Covariance, 1995).
School gardens. Many innovative research articles support school-kitchen gardens as a
wonderful alternative to teach children and adolescents about different foods and educate them
on nutrition. A program abroad, in Australia and New Zealand called, “The tooty fruity vegie
project,” proved there are positive indications that cooking and gardening programs provide
outcomes in program activities, increased nutrition knowledge, increased eco-literacy, and
benefits of experiential learning (Lautenschlager et al., 2007; Newll, Huddy, Adams, Miller,
Holden, & Deitrich, 2004; Liquori, Koch, Contento, & Castle, 1998). The article, “Children are
growing health in South Carolina,” also indicates that school garden and nutrition programs can
increase the willingness to consume vegetables and fruits (Cason, 1999; Heim, Stang, & Ireland;
2009). The local Bay area school garden program that was implemented at James B. Davidson
Middle School health hub was started by Sanzuma. They customized a school program
specifically for the students to address food access, nutrition education, food safety, cooking and
sustainable living. James B. Davidson Middle School collaboration with Sanzuma presents
considerable potential to improve students’ fruit and vegetable intake through experiential
learning. These experiences only enhance ones learning and personal connection with food.
Champions for change. Proper education about nutrition is important for preventative
health behaviors among children and adolescents. It is recommended from the dietary guidelines
for Americans from the US Department of Health and Human Services (2000) that children and
adolescents eat at least five servings of fruit and vegetables daily to reduce their risk of obesity
and chronic disease, however, youth are not meeting policy standards of this health behavior.
The challenge is to develop and deliver intervention strategies to middle school aged children
HEALTH HUB PROGRAM EVALUATION 16
because they are at a greater risk for difficulty and motivation declines among a wide range of
behaviors. However, in the article, “Physical activity and nutrition in children and youth: An
overview of obesity prevention,” states that these years suggest behavioral decisions will impact
behaviors and health throughout their life (Baranowski, Mendlein, Resnicow, Frank, Weber,
Cullen, & Baranowski, 2000; Telama, Yang, Laakso, & Viikari, 1997). Developing an effective
intervention to promote healthy behavior changes in fruit and vegetable consumption, positive
beliefs and attitudes towards nutrition, and healthy lifestyle changes may become challenging for
a school community. However, one program through the California Department of Public Health
(CDPH) (2015) has proven effective in many school settings. Champions for Change, promotes
the Nutrition Education and Obesity Prevention Branch (NEOPB), in a statewide movement
working toward improving the health status of low-income Californians through increased fruit
and vegetable consumption, physical activity, and food security with the goal of preventing
obesity and other chronic diseases (CDPH, 2015). The non-profit agency, LIFT-Levántate
applied this program curriculum to the James B. Davidson Middle School health hub. In a
longitudinal study by, Sugerman, Foerster, Gregson, Linares, and Hudes (2007), they studied the
impact of NEOPB and has shown to have a positive and increase of fruit and vegetable
consumption among low-income families.
Media smart youth. Health experts continually attempt to effect change in the food
environment to address the obesity and poor diets of young people (Golderberg & Gunasti,
2007). Various studies consider the mass volumes of marketing toward calorie-dense nutrient-
poor foods targeted toward children and adolescents to be one of the most destructive
environmental influences on food consumption by youth (Harris, Bargh, & Brownell, 2009;
Swinburn, Sacks, & Lobstein, 2008). Another impact addressed by, Harris, Pomeraz, Lobstein,
HEALTH HUB PROGRAM EVALUATION 17
and Brownell (2009), is food marketing which can also have a substantial impact on unhealthy
food consumption in children in the short-term. Another link to obesity was addressed by Dietz
(1990) and Hu, Li, Colditz, Willett, and Manson (2003), about the frequency of television
viewing of food advertising and its link with obesity, which leads to subsequent consumption of
advertised foods. Recent public health initiatives and programs have been trying to reduce the
exposure of advertising for energy-dense nutrient-poor foods, particularly with soda and fast
food. In an article by, Andreyeva, Kelly, and Harris (2011), they discuss one such initiative, the
2006 Children’s Food and Beverage Advertising Initiative (CFBAI), which relies on industry
self-regulation to improve nutritional quality marketed to children. Another program developed
and provided by the National Institute of Child Health and Human Development (NICHD)
(2009), called Media-Smart Youth, gives youth the autonomy and self-efficacy to understand and
connect that media and advertising can have an effect on young people’s health. LIFT-Levántate,
adopted this curriculum for its school-based health hub at James B. Davidson Middle School to
empower youth to: become aware of and think critically about media’s role in influencing their
nutrition and physical activity choices; build skills to help them make informed decisions in daily
life; establish health habits that will last into adulthood; and learn about media to educate their
peers (NICHD, 2009).
Physical activity. To reduce the risk of obesity and chronic disease among children and
adolescents, students should be physically active daily. In a research article by Sallis (1993), the
study has estimated that physical activity declines over the school ages years at about 2.7%
yearly for males and 7.4% per year for females. Further research in another article, “Inequality in
the build environment underlies key health disparities in physical activity and obesity,”
concludes that overweight or obese adolescents who come from low-income families may face
HEALTH HUB PROGRAM EVALUATION 18
additional barriers to engaging in physical activity while living in a neighborhood with higher
crime and less green space (Gordon-Larsen, Nelson, Page, & Popkin, 2006). In the study,
“School physical education: Effect of the child and adolescent trial for cardiovascular health,”
suggests that there is a need to increase both diet and physical activity in middle school students
through implementing changes in teacher practices and physical education programs (McKenzie,
Nader, Strikmiller, Yang, Stone, Perry, Taylor, et al., 1996). Many new and innovative ways of
physical activity can engage youth, besides physical education programs. The Centers for
Disease Control and Prevention (CDC) (2010), launched a campaign from 2002-06, called
VERB, to encourage tweens to be physically active every day. At James B. Davidson Middle
School, LIFT-Levántate, continually used its programs – Media Smart Youth, Champions for
Change and daily physical activity events to engage the students to stay active on a daily basis.
The combination of these programs provided the students with many different opportunities and
options to try new activities, like Zumba, yoga, gardening, soccer and basketball.
Target Population
Low-income and underserved populations have limited access to healthy food,
transportation to grocery stores, and access to green space (Gordon-Larsen et al., 2006). As a
result, these populations face a higher prevalence for chronic disease, including hypertension,
cardiovascular disease, diabetes, asthma, and obesity (Flourney, 2006). Existing research shows
that a person’s health status and access to health care are tied to a set of social determinants of
health, the circumstances in which a person is born, raised, live, work, and age (CDC, 2009).
These social and environmental factors, which include a general lack of access to or availability
of healthy, nutritious foods, affordable health care, and safe green spaces, lead to
disproportionate health disparities between populations of lower socioeconomic statuses and

HEALTH HUB PROGRAM EVALUATION 19
higher socioeconomic statuses (CDC, 1996; WHO, 2015). James B. Davidson Middle School is
a sixth through eighth-grade public school located in the central section of San Rafael and serves
vulnerable residents from San Rafael, Santa Venetia and the low income Canal community,
largely comprised of Latino and Asian immigrant families. Over 60 % are students of color, over
66% are eligible for Free and Reduced Lunch and over 60% are English Language Learners. One
in four of these children are food insecure, and 57.3% of Canal families are living at or below the
Federal Poverty Line and are without access to safe outdoor places to play, as there is only one
park in the neighborhood.
The importance of healthy eating during adolescent years is a continual concern for those
involved in developing healthcare programming for young people. Studies consistently indicate
that adolescents have poor dietary habits when compared to current dietary recommendations
(Munoz, Krebs-Smith, Ballard-Barbash, Cleveland, 1997). The Centers for Disease Control and
Prevention (2009) guidelines for school health programs to promote healthy eating revealed that
significant numbers of adolescents’ diets include a low intake of fruits, vegetables, fiber and
calcium-rich foods and a high intake of foods high in fat and sugar; and irregular eating
behaviors, such as meal skipping. Evidence suggests that there is a shift in eating patterns from
childhood into adolescence, which is likely due to lifestyle, and to developmental, social and
environmental changes.
Nutrition education through school-based education has the potential to positively impact
the nutritional health and dietary behaviors of adolescents. School-based nutrition education is an
ideal setting because of the direct capacity to reach youth. These programs provide the
opportunity for students to better integrate healthy eating behaviors within their daily routines.
Since eating is a socially learned behavior influenced by social pressures, school-based programs
HEALTH HUB PROGRAM EVALUATION 20
can harness the power of peer influence to support and reinforce healthy eating habits. School-
based interventions aimed at increasing access to healthy food, physical activities, and increasing
knowledge about nutritious eating can lead to healthy behavior changes in the short term as well
as reduce the prevalence of obesity and chronic disease in the long term (Matson-Koffman,
Brownstein, Neiner, & Greaney, 2005; Gortmaker, Peterson, Wiecha, Sobol, Dixit, Fox, & Laird
1999). The most effective health promotion curricula for middle school students are project-
based, hands-on, engaging and interactive, and provide opportunities for peer-to-peer education
and mentorship (Lytle & Achterberg, 1995; Story, Lytle, Birnbaum, & Perry 2002; Katz,
O’Connell, Njike, Yeh, & Nawaz 2008).
SWOT Analysis
The SWOT analysis (see Appendix A) provided LIFT-Levántate with the ability to see
the advantages and shortcomings faced by the health hub program evaluation. It also helped to
organize the future opportunities available with the data collected throughout the project. The
reoccurring theme that LIFT-Levántate continually faces is shortage of resources and lack of
communication between the team. Without a clear and efficient communication plan between the
executive director and staff, the program evaluation plan for James B. Davidson Middle School’s
health hub has the possibility of losing headway through the process. Another very vital threat to
the program evaluation is funding resources, if LIFT-Levántate doesn’t continually foster its
relationships with stakeholders and prove that this program is effective, these stakeholders have
no obligation to continue to support the health hub. To tackle the lack of funding, LIFT-
Levántate needs to recognize this obstacle and be more proactive in finding funds through grant
writing and proposals. However, LIFT-Levántate has many positive attributes to prevent these
setbacks. The organization has a long-standing reputation in Marin County with many different

HEALTH HUB PROGRAM EVALUATION 21
networks and support from vital community leaders. They take advantage of these assets by
incorporating students, families and school staff into the community organizing. If LIFT-
Levántate continues to cultivate these relationships there is no doubt this organization can
continue its work with proven program evaluation of the James B. Davidson Middle School
health hub.
Problem Statement
James D. Davidson Middle School students and families are at high risk for, or suffer
from some of the highest healthcare problems in the County. One in four students experiencing
food insecurity report eating multiple fast food meals and/or highly processed meals each week,
in addition to consuming significant amounts of sugar-sweetened beverages daily. As stated the
CX3 Communities of Excellence survey found that 0% of these fast food outlets offered or
promoted healthy food options. Most of the students are not involved in meal planning and
preparation and have not acquired even the most basic of kitchen skills (Marin Health and
Human Services, 2014). Through LIFT-Levántate’s health hub programs of nutrition education,
gardening, and physical activity access, the goal is to positively increase students’ knowledge,
attitudes, and perceptions towards nutrition and physical activity.
Goals and Objectives
AIM Statement and Objectives
AIM. By June 1, evaluate the effectiveness of the health hub at James B. Davidson
Middle School by implementing pre-and-post questionnaires within the 2014-2015 school year.
The LIFT-Levántate staff will increase the response rates of positive eating and physical activity
habits by 100% among the school students.
Goals and objectives. Goal 1: Build a healthy, sustainable, and vibrant community at
James B. Davidson Middle School through the school-based health hub.
HEALTH HUB PROGRAM EVALUATION 22
Process Objectives:
1. Between September 2014 and May 2015, distribute free weekly amounts of healthy
food to low income at-risk students and family members.
2. Between September 2014 and May 2015, teach classes and deliver programs on
nutrition, physical activity, and cooking, gardening and environmental sustainability.
3. Between September 2014 and May 2015, train student leaders in Garden club and
Media Smart Youth programs.
Outcome Objectives:
1. Provide weekly free, nutritious food distributed to over 170 families (approximately
700 people).
2. Conduct at least five classes per week on nutrition, physical activity, cooking,
gardening and/or environmental sustainability reaching over 100 students weekly.
3. At least 30 student leaders and peer mentors participating in garden club and Media
Smart Youth Program.
Logic model narrative. As shown in Appendix B, the evaluation plan’s logic model
shows the progression through which school-based health hub aims to address James B.
Davidson Middle School’s main goal: building a healthy, sustainable, and vibrant middle school
community. This aligns with LIFT-Levántate’s main goal: increasing health and nutrition equity
through improved healthy food access and food security and empowering community members
to address food insecurity within their own communities.
Inputs. James B. Davidson health hub relies on a number of people, including its
partners, bilingual health educators and health education interns. A number of partners, including
Kaiser Permanente, San Francisco-Marin Food Bank, the Rotary Club of San, Whole Foods, and
HEALTH HUB PROGRAM EVALUATION 23
the school’s faculty and staff. Community partners also contribute resources, like healthy food,
the infrastructure to support food storage and distribution, and materials and supplies for each
program activity. Contracts, grants, contributions, organizational income, in-kind donations,
reimbursements, and sponsorship provide fiscal support, totaling $37,574 for fiscal year 2014-
2015.
Outputs. On a weekly basis, LIFT-Levántate distributes healthy food via a farmers’
market style food pantry. Food for distribution is obtained from food banks and grocery store
donations. While food distribution is the main draw for program participants, the school-based
health hub also provides an array of other services, like health education and nutrition classes,
physical activity classes, and gardening and/or sustainability classes and the media smart youth
program.
Short-term outcomes. In the short-term, James B. Davidson health hub participants
receive a number of services, including free, healthy food, health education materials and reduce
stigma associated with accessing food bank services. The students receive weekly nutrition and
cooking information that produce an increased awareness about the nutrition and a positive shift
in knowledge, attitudes and skills regarding healthy eating, physical activity and sustainability.
Aside from participants receiving services, student volunteers participate in food distribution
and/or health education delivery. Participation in these activities increase interaction with other
students in the short term. Interactions are geared toward supporting fellow peer’s health and
nutrition.
Intermediate outcomes. With the obtaining of free, healthy food through food
distribution, James B. Davidson health hub participants gain access to healthy food and increase
their self-efficacy related to obtaining nutritious food and reduce food insecurity in the
HEALTH HUB PROGRAM EVALUATION 24
intermediate term. Receipt of health education materials leads to increased awareness about
health and nutrition and begin to change health behaviors. Also in the intermediate term,
volunteers enhance their capacity to assist fellow peers in obtaining health and nutrition-
promoting services. Increased awareness of students needs contributes in part to building this
capacity by improving attendance, decreasing bullying and building a greater sense of
community.
Long-term outcomes. In the long-term, LIFT-Levántate will foster improved food
security among the James B. Davidson health hub students and school community through a
culture of health and wellness; and eventually reduce the risk of chronic diseases. The James B.
Davidson health hub will also produce health and nutrition equity, quality of life, and life
expectancy in the underserved communities they target in the long term.
Methodology
Ethical approval for the project evaluation was obtained from the University of San
Francisco Institutional Review Board and all relevant educational departments. The James B.
Davidson Middle School health hub is an evaluation study of the personal opinions, attitudes,
perceptions, and knowledge of healthy eating and physical activity (exercise), which will help
LIFT-Levántate improve the health hub program for the students at James B. Davidson Middle
School. LIFT-Levántate will have a better understanding of the eating and exercise habits of the
students which will aid in developing and delivering more fitting health education services to all
students that will be accessible in the future at no cost.
Participants
As part of the James B. Davidson Middle School health hub, we surveyed 130 middle
school students, sixth-through-eighth grade in the after-school program, for the pre-questionnaire
during the 2014-2015 academic year in the month of March. At the end of the academic school
HEALTH HUB PROGRAM EVALUATION 25
year, in the month of May, the same students were given a post-questionnaire, which only 115
completed the questionnaire. Participants completed in-class questionnaires that included
questions, ranging from food security, nutrition education, and physical activity.
Instrument Development
The questionnaire (see Appendix C) was developed to collect nutrition knowledge,
students’ attitudes toward nutrition and physical activity, food and fluid consumption behaviors,
and food accessibility. The 26-item questionnaire was adapted from the Center for Disease
Control and Prevention 2010 National Youth Physical Activity and Nutrition Survey (NYPANS)
and the California Department of Public Health’s (CDPH) Compendium of Surveys for Nutrition
Education and Obesity Prevention. The NYPANS was used to provide data on behaviors and
behavioral determinants related to nutrition and physical activity among students and CDPH
compendium of survey was compiled in the questionnaire to measure change in consumption of
fruits, vegetables, and other foods; physical activity; food security and factors that influence
those behaviors.
Background information included age, gender, and where they were born was asked. A
total of six multiple-choice questions were included of overall food consumption yesterday on
fruit and vegetable consumption and drink consumption. Students answered questions about the
frequency of consuming certain foods and drinks. Two questions were asked about fast food and
French fry consumption in the past week (7 days). Students answered questions by the number of
days they ate those foods. Two questions were asked whether they ate breakfast that day and
how often, ranging from every day, almost every day, rarely, and never. Two questions were
asked about their personal preferences towards fruit and vegetables, responses ranging from I
love, I like, I do not like, and I hate. Two questions were asked about their attitude towards trying
new fruits and vegetables, responses ranged from almost always or always, sometimes, and
HEALTH HUB PROGRAM EVALUATION 26
almost never or never. Two questions were asked about availability of fruits and vegetables at
home, responses ranged from always, sometimes and never. Eight questions were asked about
knowledge, perceptions, attitudes, and beliefs of fruit and vegetables and physical activity,
response ranged from true, false and not sure. Two questions were asked about their daily
exercise they got in the past week. Responses were recorded by days of the week (Monday to
Sunday and did not play outdoors this week). One question was asked about their perception of,
how many minutes a middle school student should get each day to stay healthy. Responses
ranged from 15, 30, 60, 90 minutes and I don’t know. And lastly, two questions asked their
thoughts and beliefs if exercise was boring or embarrassing in front of others. Responses were
either agree or disagree.
Description of the Evaluation Process
The project evaluation was conducted in 2 phases and no identifying information was
collected as part of this project. Participation in the evaluation was through voluntary recruitment
in which all eligible program participants were given consent forms via school staff and LIFT-
Levántate staff and asked to thoroughly read, sign and return to staff to collect. Phase I consisted
of a pre-program questionnaire (administered prior to the start of the health hub). Phase II
consisted of a post-program questionnaire (after completing participation in the health hub
program). Students of James B. Davidson Middle School participated in a health program that
was developed and was implemented by the school and LIFT-Levántate staff. The health
program consisted of weekly health promotion to teach nutrition, gardening, cooking, and
physical activity, as well as, access to free, nutritious food to students and their families of low
income. The goal of this project was to administer the pre-and-post questionnaires to track the
HEALTH HUB PROGRAM EVALUATION 27
diet and exercise behavior changes of students who participated in the health hub program
implemented by school and LIFT-Levántate staff.
Procedures:
Phase I – Administered a pre-program questionnaire
Approximately 130 students were asked to participate. Students will be approached in
their classrooms at the after school LIFT-Levántate program. In order to track pre-and-post
questionnaires, students were asked to create a unique identifier that was included written on
their completed questionnaire. The unique identifier will consist of the initials of the first and last
name, year of birth, and day of birth. The pre-program questionnaire asks demographic
information and questions about eating and exercise habits.
Phase II – Administered the post-program questionnaires
Following the end of the school year, the same LIFT-Levántate students were asked to
participate and, with the exception of the demographic portion, complete the same questionnaire
about their eating, exercise habits, and an additional, five short written open-ended questions
about their health habits and the program. Students were asked to use their unique identifier
developed in Phase I in order to link their post-program questionnaire responses to their pre-
program responses. Please see Appendix D for more detail on entire project process,
implementation, and evaluation.
Quantitative Measures
Food consumption. We determined their behavioral factors of food consumption by the
item, “…think about what you ate yesterday. How many times did you eat the following: fruit,
vegetables, chips or other salty snacks, a glass or bottle of water, soda or sweet drinks, and
energy drinks?” The response options for each of these items were 0 times, 1 time, 2 times, 3 or
HEALTH HUB PROGRAM EVALUATION 28
more times. We recoded these options 0, 1, 2, 3 times, respectively. The higher the coded
number the better their healthy food consumption was recorded.
Fast food and French fry consumption. We determined fast food and French fry intake
by the item, “…think about everything you’ve eaten in the past week (7 days). How many times
did you eat the following: fast food (McDonalds, Burger Kind, KFC, Taco Bell, Chipotle, etc.),
and French fries or other fried potatoes such as home fries, hash browns, or tater tots?” The
response options for each of these questions were: I did not eat fast food/French fries or other
fried potatoes during the past 7 days; 1 to 3 times during the past 7 days; 4 to 6 times during the
past 7 days; 1 time per day; 2 times per day; 3 times per day; 4 or more times per day. Each of
these options were recoded; 3 for I did not eat fast food/French fries; 2 for 1 to 3 time during the
past 7 days; and 1 for any other response option. Again, the higher the coded number the
healthier the student was perceived to have eaten in the past seven days.
Breakfast. Breakfast eating was assessed by two items, “Did you eat breakfast today?”
And, “How often do you eat breakfast?” The responses for the first question were yes or no and
recoded as 0 and 1, respectively. The other question responses were: every day; almost every
day; rarely; and never, and we recoded these to 3, 2, 1, and 0 times, respectively. For this
question, again the higher the number (3) the better the students breakfast consumption was
recorded.
Personal preferences towards fruit and vegetables. Preference toward healthy foods
fruit and vegetables was measured by a scale composed of the following items: I love to eat
fruit/vegetables, I like to eat fruit/vegetables, I do not like to eat fruit/vegetables, and I hate to eat
fruit/vegetables. These responses were recoded to 3, 2, 1, and 0 respectively. Again, the higher
the recoded number response the better their attitude towards fruit and vegetables.
HEALTH HUB PROGRAM EVALUATION 29
Beliefs towards trying new fruits and vegetables. We addressed self-efficacy of
students trying new fruits and vegetables by the item, “I like to try new fruits/vegetables.” The
responses for these questions were: almost always or always; sometimes; and almost never or
never, and we recoded these to 2, 1, and 0, respectively. The higher the recoded value the higher
their beliefs were towards trying new fruits and vegetables.
Access of fruits and vegetables at home. We ascertained household food availability of
fruit and vegetables by the item, “How often do you have fruit/vegetables in your home?” The
responses for these questions were: always; sometimes; and never; and again we recoded these to
2, 1, and 0 respectively. The higher the recoded value the more access these students had to fruits
and vegetables in their homes.
Knowledge, perceptions, attitudes, and of fruit and vegetables and physical activity.
We determined students’ knowledge, perceptions and attitudes of the nutrition program by a
sequence of true/false questions. The items addressing fruit and vegetables were, “Eating fruits
and vegetables keeps you healthy, keeps you from getting sick, and gives you healthier skin.”
The items addressing physical activity were, “Physical activity can keep you from getting sick,
can help you do better in school, gives you more energy, builds healthy bones, and muscles to
keep you strong and can make you better at sports.” All true/false responses were recoded to 1
and 0, respectively.
Daily exercise. We assessed students weekly exercise habits or physical activity and time
spent outdoors by the item, “Thinking about the past week, check off the days you exercise or
took part in physical activity that made your heart beat fast and made you breathe hard for at
least 60 minutes?” Response options included: I did not do any exercise for 60 minutes at a time
during the past week, and Monday through Sunday, and were coded from 0 to 7, respectively.
HEALTH HUB PROGRAM EVALUATION 30
The higher the number of days a student participated in outdoor activity, the student was
perceived to have healthier physical activity (exercise) habits.
Perception of number of minutes needed to stay healthy. Perceptions of how much
exercise middle school students need was determined by item, “How many minutes of exercise
do you think middle school students should get each day to be healthy?” The response options
for this question were: at least 15, 30, 60, 90 minutes each day, and I don’t know. All responses
were recoded to 0, 1, 2, 3, and 98, respectively. The higher the number in regards to the recode
(0-3), the better the students’ perceptions of exercise minutes to stay healthy.
Thoughts and attitudes of exercise. We determined students’ thoughts of physical
activity and exercise by two items, first, “Physical activity is boring.” And, “It is embarrassing to
exercise in front of others.” Both these items responses were either agree or disagree, and were
recorded to 1, and 0 respectively.
Qualitative Measures
Qualitative data was collected from the post-questionnaires open-ended question
methods. All questions were designed to be open-ended, to avoid leading participants toward
particular answers. Participants were asked to describe things they learned from the programs
they were involved in; their experiences they liked and disliked the most; and if they believed the
program made an impact in their eating and physical activity habits. These questions elicited data
from participants relevant to understanding the impact of the program on the students eating and
exercise habits, and willingness to change and improve these habits. Analysis of all responses
were identified by common themes and patterns. Most themes consisted of eating healthier
foods, trying the different food samples, having access to free nutritious foods, and exercising
HEALTH HUB PROGRAM EVALUATION 31
more. These themes and patterns were organized and recorded in Microsoft Excel and then
analyzed in the software program.
Data Analysis
Only the data from students that responded the pre and post-questionnaires were
included. IBM Statistics Package for the Social Sciences (SPSS) 21 was used to analyze data.
Data was first entered into Microsoft Excel then converted and recoded and inputted to SPSS.
For eating habits, consumption, perceptions, and behavior questions, the responses to the items
were scored from 1 to 3 (or 1 to 7 if there were 7 responses to the question) with a higher score
reflecting a more positive response. Items were reversely scored when questions were related to
an unhealthy behavior. For all the continuous data variables, paired t-tests were analyzed to
understand if there was any statistical significance with each item. All dichotomy responses,
either True/False or Agree/Disagree, a “1 or 0” was given to the participant’s responses. These
responses were analyzed with McNemar cross-tabs to determine if there is any marginal
homogeneity among the responses and statistical significance.
Findings
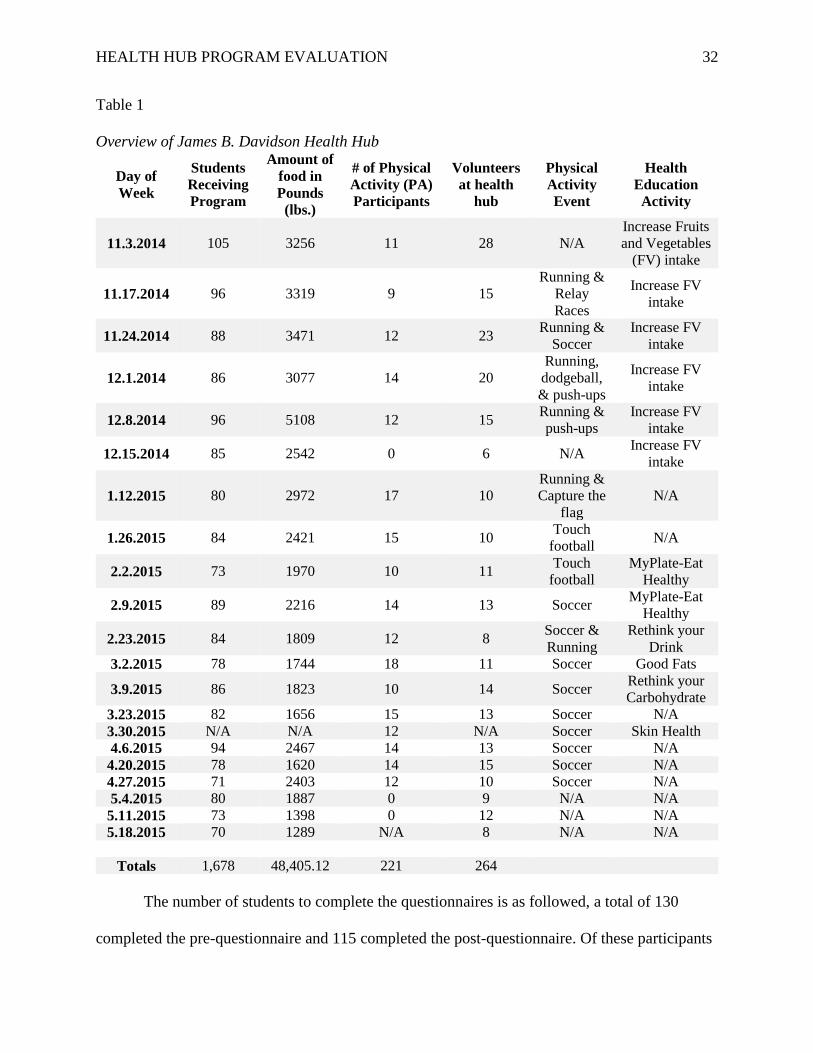
The James B. Davidson Middle School health hub program was implemented from
November 2014 to May 2015 in San Rafael, California. Table 1 describes the overview of the
program and the number of participants each week, the nutrition-education program being
offered and the amount of food the students and their families have access to. The school-based
health hub was one-day a week for 21 weeks. Each week students received free, nutritious food,
participated in the small health education lesson and had the opportunity to participate in the
physical activity event that day. Items marked N/A indicate that a physical activity event did not
occur that week or a health education activity did not take place either.
HEALTH HUB PROGRAM EVALUATION 32
Table 1
Overview of James B. Davidson Health Hub
Day of
Week
Students
Receiving
Program
Amount of
food in
Pounds
(lbs.)
# of Physical
Activity (PA)
Participants
Volunteers
at health
hub
Physical
Activity
Event
Health
Education
Activity
11.3.2014 105 3256 11 28 N/A
Increase Fruits
and Vegetables
(FV) intake
11.17.2014 96 3319 9 15
Running &
Relay
Races
Increase FV
intake
11.24.2014 88 3471 12 23 Running &
Soccer
Increase FV
intake
12.1.2014 86 3077 14 20
Running,
dodgeball,
& push-ups
Increase FV
intake
12.8.2014 96 5108 12 15 Running &
push-ups
Increase FV
intake
12.15.2014 85 2542 0 6 N/A Increase FV
intake
1.12.2015 80 2972 17 10
Running &
Capture the
flag
N/A
1.26.2015 84 2421 15 10 Touch
football N/A
2.2.2015 73 1970 10 11 Touch
football
MyPlate-Eat
Healthy
2.9.2015 89 2216 14 13 Soccer MyPlate-Eat
Healthy
2.23.2015 84 1809 12 8 Soccer &
Running
Rethink your
Drink
3.2.2015 78 1744 18 11 Soccer Good Fats
3.9.2015 86 1823 10 14 Soccer Rethink your
Carbohydrate
3.23.2015 82 1656 15 13 Soccer N/A
3.30.2015 N/A N/A 12 N/A Soccer Skin Health
4.6.2015 94 2467 14 13 Soccer N/A
4.20.2015 78 1620 14 15 Soccer N/A
4.27.2015 71 2403 12 10 Soccer N/A
5.4.2015 80 1887 0 9 N/A N/A
5.11.2015 73 1398 0 12 N/A N/A
5.18.2015 70 1289 N/A 8 N/A N/A
Totals 1,678 48,405.12 221 264
The number of students to complete the questionnaires is as followed, a total of 130
completed the pre-questionnaire and 115 completed the post-questionnaire. Of these participants
HEALTH HUB PROGRAM EVALUATION 33
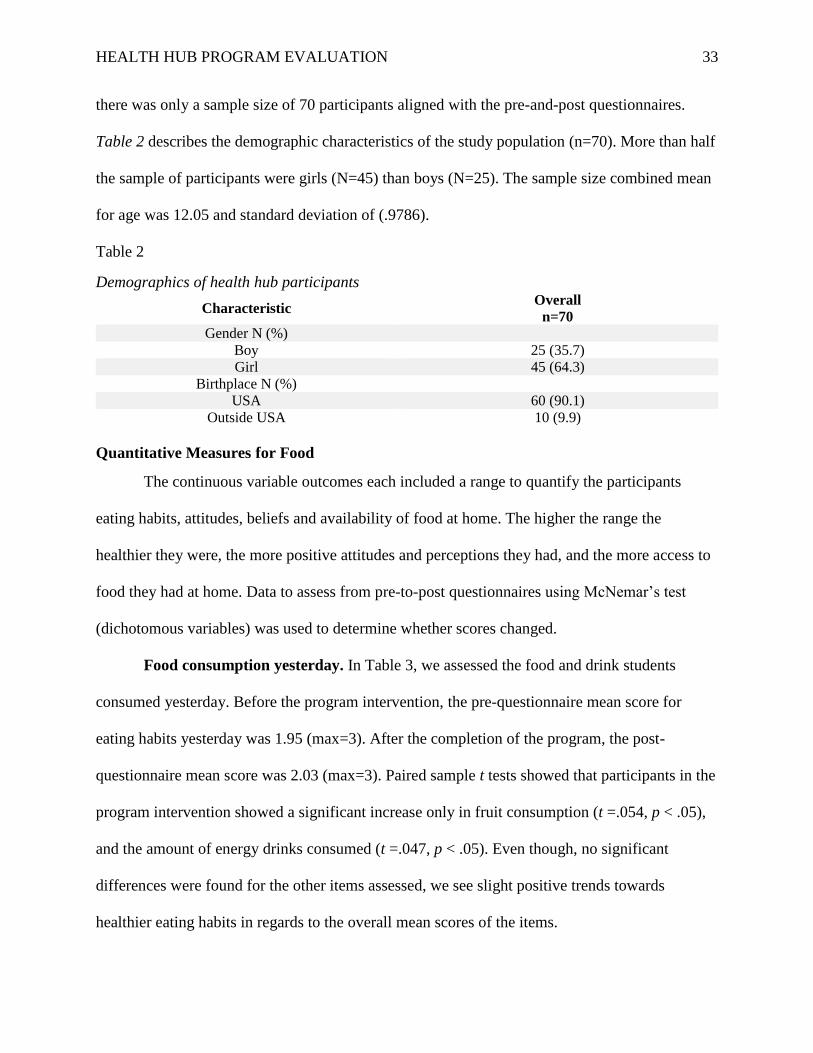
there was only a sample size of 70 participants aligned with the pre-and-post questionnaires.
Table 2 describes the demographic characteristics of the study population (n=70). More than half
the sample of participants were girls (N=45) than boys (N=25). The sample size combined mean
for age was 12.05 and standard deviation of (.9786).
Table 2
Demographics of health hub participants
Characteristic Overall
n=70
Gender N (%)
Boy 25 (35.7)
Girl 45 (64.3)
Birthplace N (%)
USA 60 (90.1)
Outside USA 10 (9.9)
Quantitative Measures for Food
The continuous variable outcomes each included a range to quantify the participants
eating habits, attitudes, beliefs and availability of food at home. The higher the range the
healthier they were, the more positive attitudes and perceptions they had, and the more access to
food they had at home. Data to assess from pre-to-post questionnaires using McNemar’s test
(dichotomous variables) was used to determine whether scores changed.
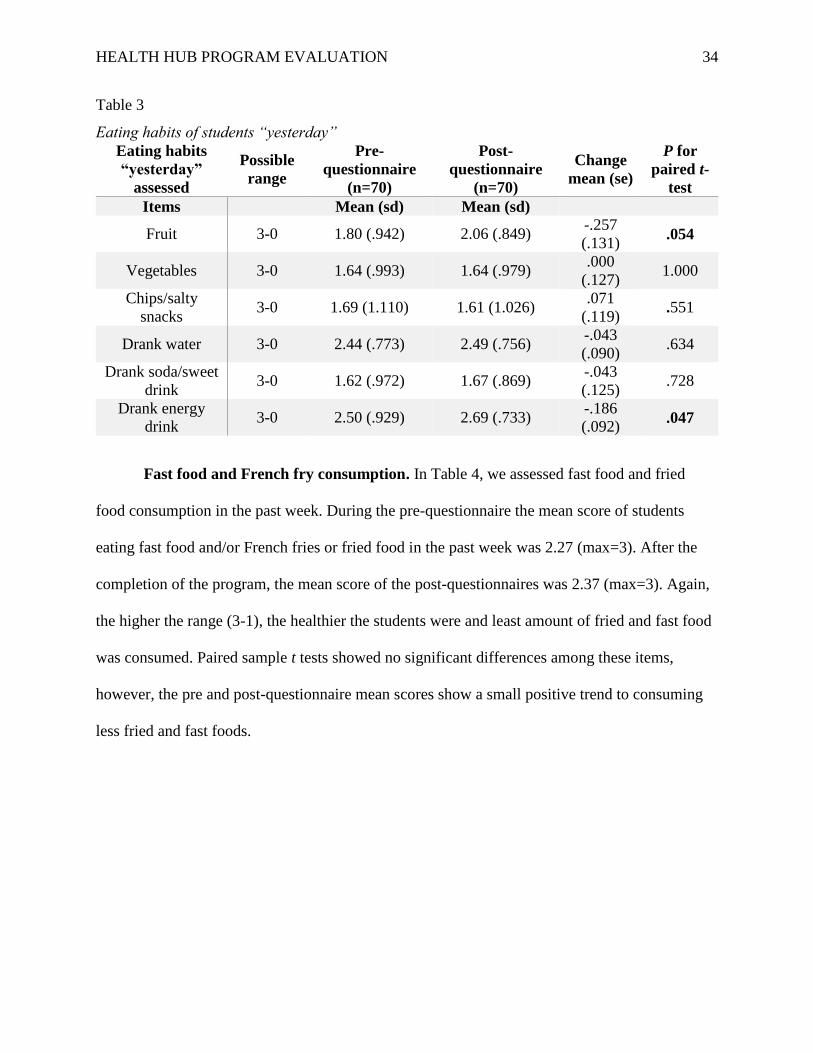
Food consumption yesterday. In Table 3, we assessed the food and drink students
consumed yesterday. Before the program intervention, the pre-questionnaire mean score for
eating habits yesterday was 1.95 (max=3). After the completion of the program, the post-
questionnaire mean score was 2.03 (max=3). Paired sample t tests showed that participants in the
program intervention showed a significant increase only in fruit consumption (t =.054, p < .05),
and the amount of energy drinks consumed (t =.047, p < .05). Even though, no significant
differences were found for the other items assessed, we see slight positive trends towards
healthier eating habits in regards to the overall mean scores of the items.
HEALTH HUB PROGRAM EVALUATION 34
Table 3
Eating habits of students “yesterday”
Eating habits
“yesterday”
assessed
Possible
range
Pre-
questionnaire
(n=70)
Post-
questionnaire
(n=70)
Change
mean (se)
P for
paired t-
test
Items Mean (sd) Mean (sd)
Fruit 3-0 1.80 (.942) 2.06 (.849) -.257
(.131) .054
Vegetables 3-0 1.64 (.993) 1.64 (.979) .000
(.127) 1.000
Chips/salty
snacks 3-0 1.69 (1.110) 1.61 (1.026)
.071
(.119) .551
Drank water 3-0 2.44 (.773) 2.49 (.756) -.043
(.090) .634
Drank soda/sweet
drink 3-0 1.62 (.972) 1.67 (.869)
-.043
(.125) .728
Drank energy
drink 3-0 2.50 (.929) 2.69 (.733)
-.186
(.092) .047
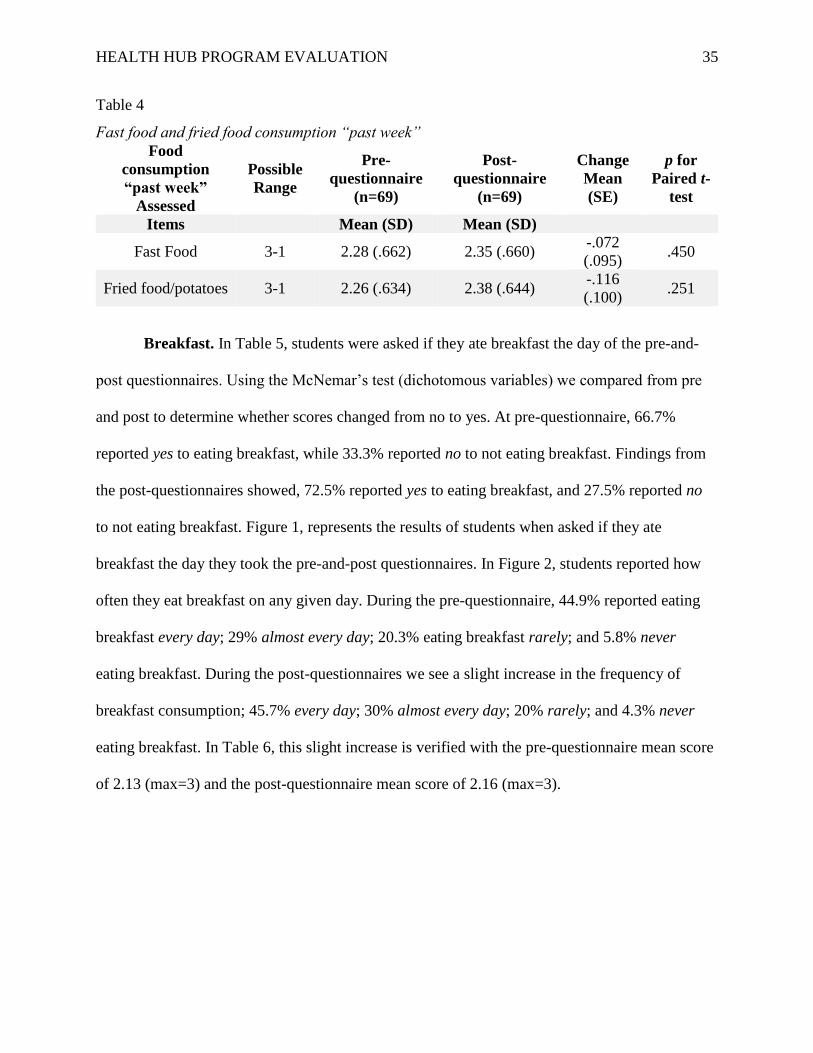
Fast food and French fry consumption. In Table 4, we assessed fast food and fried
food consumption in the past week. During the pre-questionnaire the mean score of students
eating fast food and/or French fries or fried food in the past week was 2.27 (max=3). After the
completion of the program, the mean score of the post-questionnaires was 2.37 (max=3). Again,
the higher the range (3-1), the healthier the students were and least amount of fried and fast food
was consumed. Paired sample t tests showed no significant differences among these items,
however, the pre and post-questionnaire mean scores show a small positive trend to consuming
less fried and fast foods.
HEALTH HUB PROGRAM EVALUATION 35
Table 4
Fast food and fried food consumption “past week”
Food
consumption
“past week”
Assessed
Possible
Range
Pre-
questionnaire
(n=69)
Post-
questionnaire
(n=69)
Change
Mean
(SE)
p for
Paired t-
test
Items Mean (SD) Mean (SD)
Fast Food 3-1 2.28 (.662) 2.35 (.660) -.072
(.095) .450
Fried food/potatoes 3-1 2.26 (.634) 2.38 (.644) -.116
(.100) .251
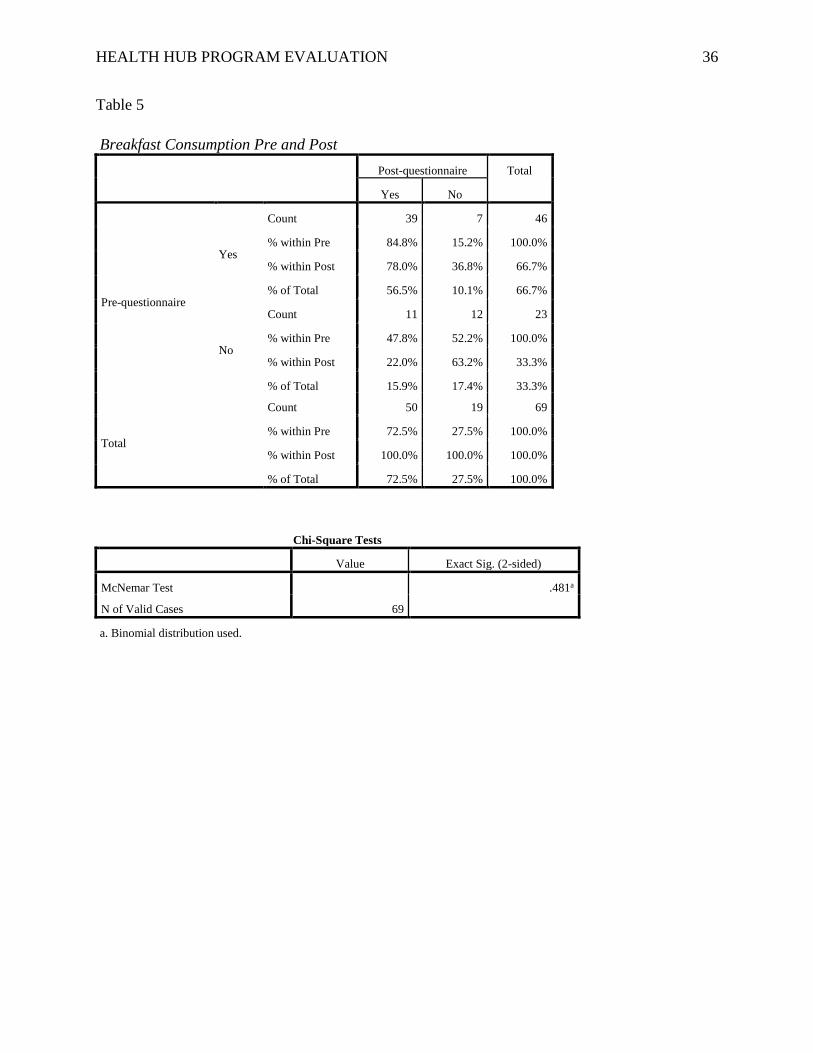
Breakfast. In Table 5, students were asked if they ate breakfast the day of the pre-and-
post questionnaires. Using the McNemar’s test (dichotomous variables) we compared from pre
and post to determine whether scores changed from no to yes. At pre-questionnaire, 66.7%
reported yes to eating breakfast, while 33.3% reported no to not eating breakfast. Findings from
the post-questionnaires showed, 72.5% reported yes to eating breakfast, and 27.5% reported no
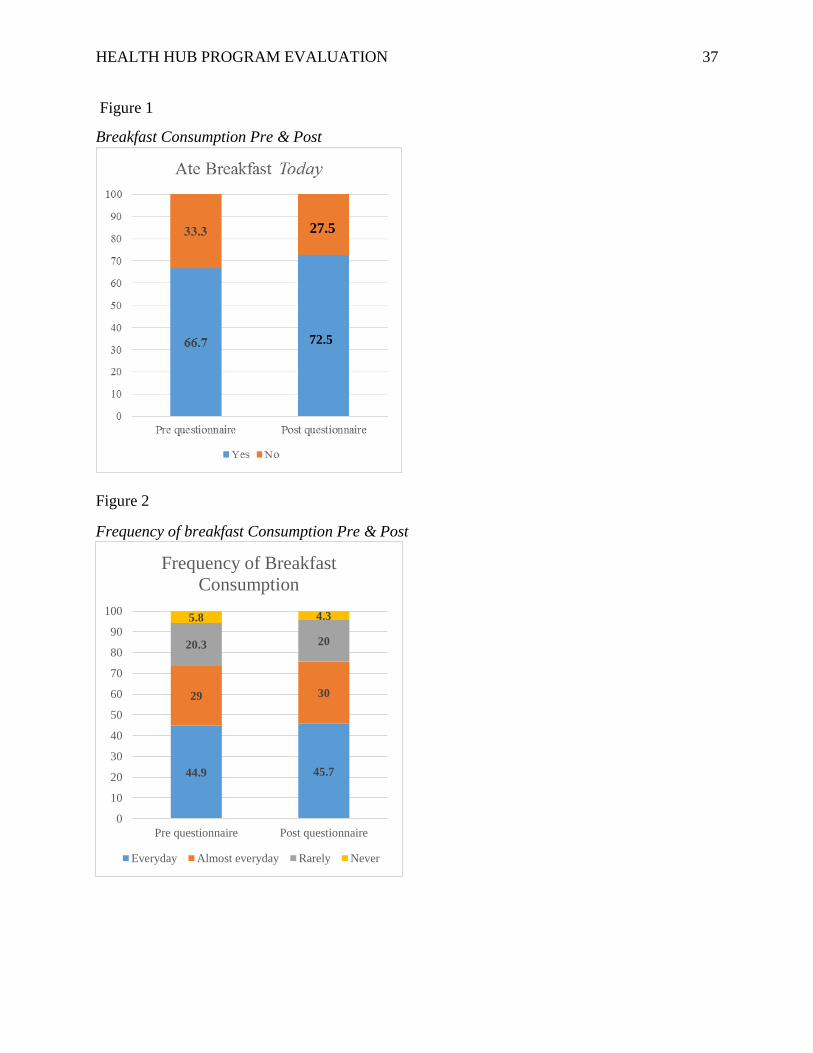
to not eating breakfast. Figure 1, represents the results of students when asked if they ate
breakfast the day they took the pre-and-post questionnaires. In Figure 2, students reported how
often they eat breakfast on any given day. During the pre-questionnaire, 44.9% reported eating
breakfast every day; 29% almost every day; 20.3% eating breakfast rarely; and 5.8% never
eating breakfast. During the post-questionnaires we see a slight increase in the frequency of
breakfast consumption; 45.7% every day; 30% almost every day; 20% rarely; and 4.3% never
eating breakfast. In Table 6, this slight increase is verified with the pre-questionnaire mean score
of 2.13 (max=3) and the post-questionnaire mean score of 2.16 (max=3).
HEALTH HUB PROGRAM EVALUATION 36
Table 5
Breakfast Consumption Pre and Post
Post-questionnaire Total
Yes No
Pre-questionnaire
Yes
Count 39 7 46
% within Pre 84.8% 15.2% 100.0%
% within Post 78.0% 36.8% 66.7%
% of Total 56.5% 10.1% 66.7%
No
Count 11 12 23
% within Pre 47.8% 52.2% 100.0%
% within Post 22.0% 63.2% 33.3%
% of Total 15.9% 17.4% 33.3%
Total
Count 50 19 69
% within Pre 72.5% 27.5% 100.0%
% within Post 100.0% 100.0% 100.0%
% of Total 72.5% 27.5% 100.0%
Chi-Square Tests
Value Exact Sig. (2-sided)
McNemar Test .481a
N of Valid Cases 69
a. Binomial distribution used.
HEALTH HUB PROGRAM EVALUATION 37
Figure 1
Breakfast Consumption Pre & Post
Figure 2
Frequency of breakfast Consumption Pre & Post
44.9 45.7
29 30
20.3 20
5.8 4.3
0
10
20
30
40
50
60
70
80
90
100
Pre questionnaire Post questionnaire
Frequency of Breakfast
Consumption
Everyday Almost everyday Rarely Never
72.5
27.5
HEALTH HUB PROGRAM EVALUATION 38
Table 6
Frequency of breakfast consumption
Frequency of
breakfast
consumption
assessed
Possible
Range
Pre-
questionnaire
(n=69)
Post-
questionnaire
(n=69)
Change
Mean
(SE)
p for
Paired t-
test
Item Mean (SD) Mean (SD)
How often do you
eat breakfast? 3-0 2.13 (.938) 2.16 (.901)
-.029
(.077) .708
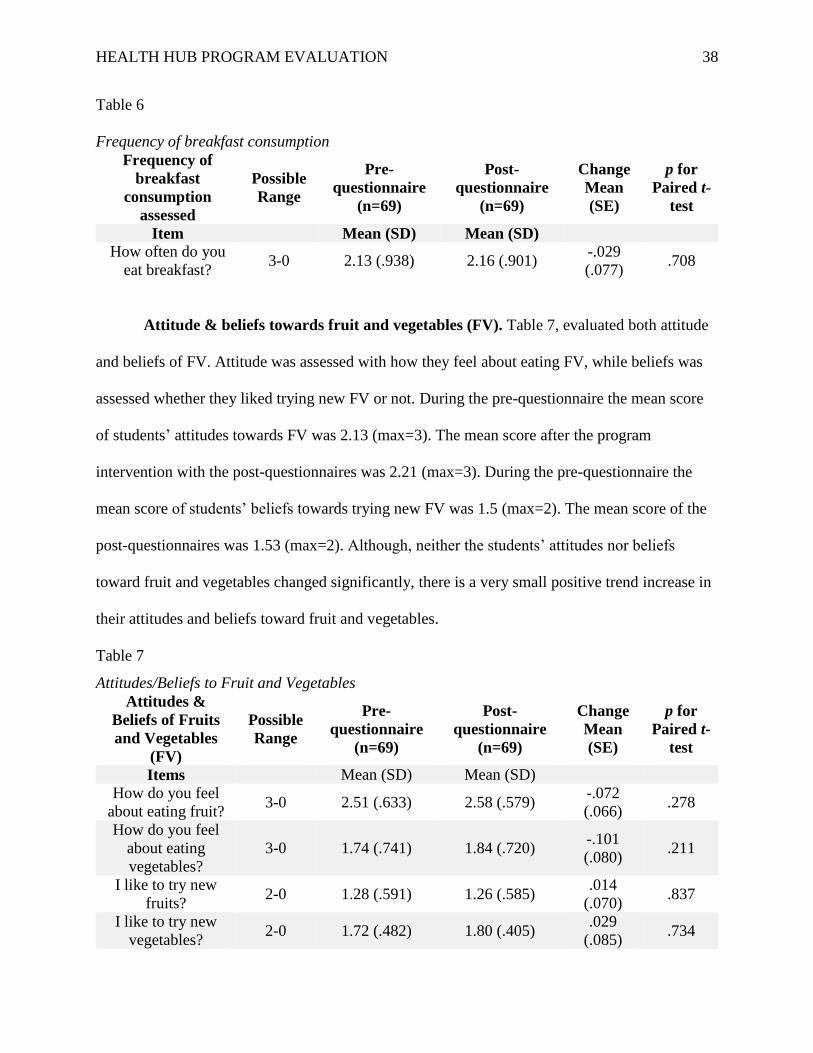
Attitude & beliefs towards fruit and vegetables (FV). Table 7, evaluated both attitude
and beliefs of FV. Attitude was assessed with how they feel about eating FV, while beliefs was
assessed whether they liked trying new FV or not. During the pre-questionnaire the mean score
of students’ attitudes towards FV was 2.13 (max=3). The mean score after the program
intervention with the post-questionnaires was 2.21 (max=3). During the pre-questionnaire the
mean score of students’ beliefs towards trying new FV was 1.5 (max=2). The mean score of the
post-questionnaires was 1.53 (max=2). Although, neither the students’ attitudes nor beliefs
toward fruit and vegetables changed significantly, there is a very small positive trend increase in
their attitudes and beliefs toward fruit and vegetables.
Table 7
Attitudes/Beliefs to Fruit and Vegetables
Attitudes &
Beliefs of Fruits
and Vegetables
(FV)
Possible
Range
Pre-
questionnaire
(n=69)
Post-
questionnaire
(n=69)
Change
Mean
(SE)
p for
Paired t-
test
Items Mean (SD) Mean (SD)
How do you feel
about eating fruit? 3-0 2.51 (.633) 2.58 (.579)
-.072
(.066) .278
How do you feel
about eating
vegetables?
3-0 1.74 (.741) 1.84 (.720) -.101
(.080) .211
I like to try new
fruits? 2-0 1.28 (.591) 1.26 (.585)
.014
(.070) .837
I like to try new
vegetables? 2-0 1.72 (.482) 1.80 (.405)
.029
(.085) .734
HEALTH HUB PROGRAM EVALUATION 39
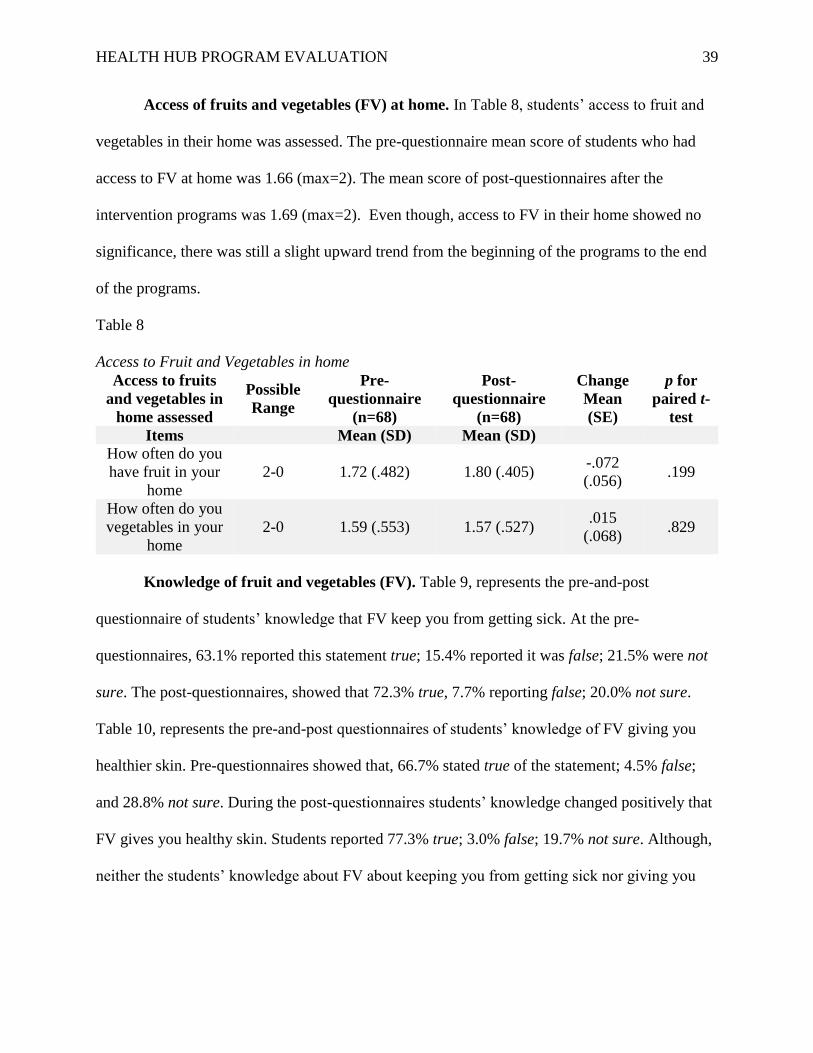
Access of fruits and vegetables (FV) at home. In Table 8, students’ access to fruit and
vegetables in their home was assessed. The pre-questionnaire mean score of students who had
access to FV at home was 1.66 (max=2). The mean score of post-questionnaires after the
intervention programs was 1.69 (max=2). Even though, access to FV in their home showed no
significance, there was still a slight upward trend from the beginning of the programs to the end
of the programs.
Table 8
Access to Fruit and Vegetables in home
Access to fruits
and vegetables in
home assessed
Possible
Range
Pre-
questionnaire
(n=68)
Post-
questionnaire
(n=68)
Change
Mean
(SE)
p for
paired t-
test
Items Mean (SD) Mean (SD)
How often do you
have fruit in your
home
2-0 1.72 (.482) 1.80 (.405) -.072
(.056) .199
How often do you
vegetables in your
home
2-0 1.59 (.553) 1.57 (.527) .015
(.068) .829
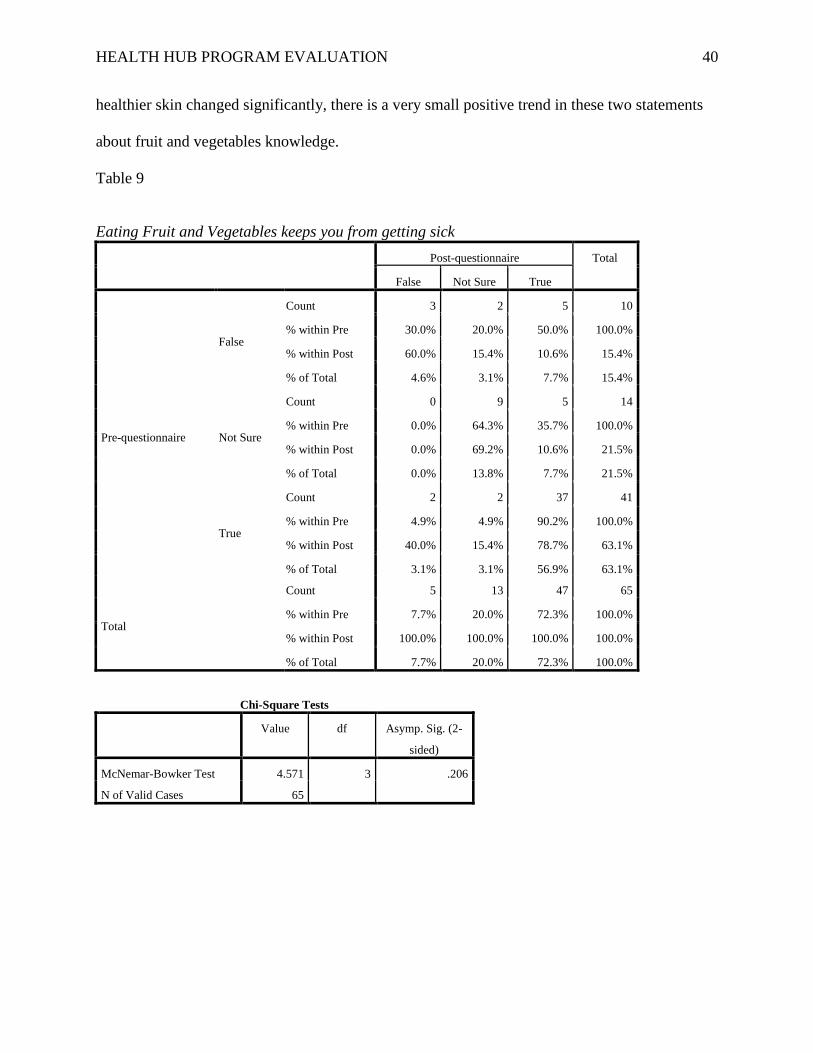
Knowledge of fruit and vegetables (FV). Table 9, represents the pre-and-post
questionnaire of students’ knowledge that FV keep you from getting sick. At the pre-
questionnaires, 63.1% reported this statement true; 15.4% reported it was false; 21.5% were not
sure. The post-questionnaires, showed that 72.3% true, 7.7% reporting false; 20.0% not sure.
Table 10, represents the pre-and-post questionnaires of students’ knowledge of FV giving you
healthier skin. Pre-questionnaires showed that, 66.7% stated true of the statement; 4.5% false;
and 28.8% not sure. During the post-questionnaires students’ knowledge changed positively that
FV gives you healthy skin. Students reported 77.3% true; 3.0% false; 19.7% not sure. Although,
neither the students’ knowledge about FV about keeping you from getting sick nor giving you
HEALTH HUB PROGRAM EVALUATION 40
healthier skin changed significantly, there is a very small positive trend in these two statements
about fruit and vegetables knowledge.
Table 9
Eating Fruit and Vegetables keeps you from getting sick
Post-questionnaire Total
False Not Sure True
Pre-questionnaire
False
Count 3 2 5 10
% within Pre 30.0% 20.0% 50.0% 100.0%
% within Post 60.0% 15.4% 10.6% 15.4%
% of Total 4.6% 3.1% 7.7% 15.4%
Not Sure
Count 0 9 5 14
% within Pre 0.0% 64.3% 35.7% 100.0%
% within Post 0.0% 69.2% 10.6% 21.5%
% of Total 0.0% 13.8% 7.7% 21.5%
True
Count 2 2 37 41
% within Pre 4.9% 4.9% 90.2% 100.0%
% within Post 40.0% 15.4% 78.7% 63.1%
% of Total 3.1% 3.1% 56.9% 63.1%
Total
Count 5 13 47 65
% within Pre 7.7% 20.0% 72.3% 100.0%
% within Post 100.0% 100.0% 100.0% 100.0%
% of Total 7.7% 20.0% 72.3% 100.0%
Chi-Square Tests
Value df Asymp. Sig. (2-
sided)
McNemar-Bowker Test 4.571 3 .206
N of Valid Cases 65

HEALTH HUB PROGRAM EVALUATION 41
Table 10
Eating Fruit and Vegetables gives you healthier skin
Post-questionnaire Total
False Not Sure True
Pre-questionnaire
False
Count 0 2 1 3
% within Pre 0.0% 66.7% 33.3% 100.0%
% within Post 0.0% 15.4% 2.0% 4.5%
% of Total 0.0% 3.0% 1.5% 4.5%
Not Sure
Count 2 7 10 19
% within Pre 10.5% 36.8% 52.6% 100.0%
% within Post 100.0% 53.8% 19.6% 28.8%
% of Total 3.0% 10.6% 15.2% 28.8%
True
Count 0 4 40 44
% within Pre 0.0% 9.1% 90.9% 100.0%
% within Post 0.0% 30.8% 78.4% 66.7%
% of Total 0.0% 6.1% 60.6% 66.7%
Total
Count 2 13 51 66
% within Pre 3.0% 19.7% 77.3% 100.0%
% within Post 100.0% 100.0% 100.0% 100.0%
% of Total 3.0% 19.7% 77.3% 100.0%
Chi-Square Tests
Value df Asymp. Sig. (2-
sided)
McNemar-Bowker Test 3.571 3 .312
N of Valid Cases 66
Quantitative Measures for Physical Activity
The continuous variable outcomes each included a range to quantify the participants’
physical activity habits, beliefs and perceptions of physical activity and knowledge of physical
activity (exercise). The higher the range, the healthier they were, the more positive habits,
beliefs, knowledge, and perceptions they had toward physical activity. Data to assess pre-to-post
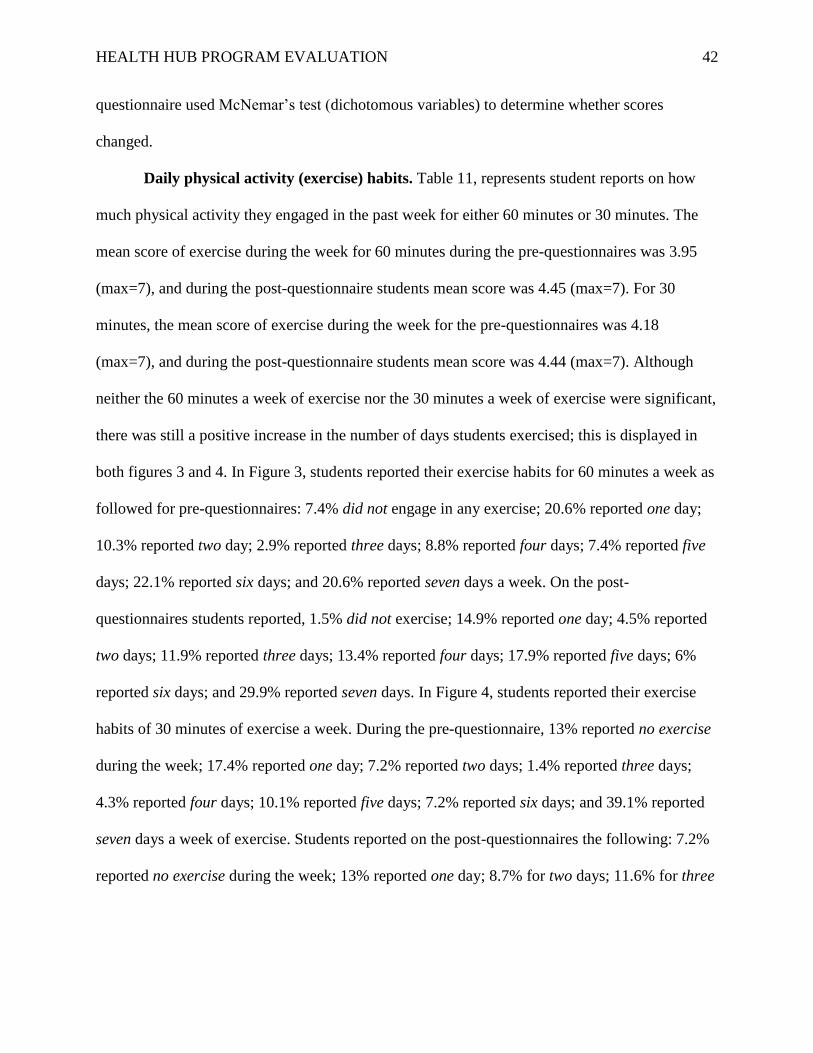
HEALTH HUB PROGRAM EVALUATION 42
questionnaire used McNemar’s test (dichotomous variables) to determine whether scores
changed.
Daily physical activity (exercise) habits. Table 11, represents student reports on how
much physical activity they engaged in the past week for either 60 minutes or 30 minutes. The
mean score of exercise during the week for 60 minutes during the pre-questionnaires was 3.95
(max=7), and during the post-questionnaire students mean score was 4.45 (max=7). For 30
minutes, the mean score of exercise during the week for the pre-questionnaires was 4.18
(max=7), and during the post-questionnaire students mean score was 4.44 (max=7). Although
neither the 60 minutes a week of exercise nor the 30 minutes a week of exercise were significant,
there was still a positive increase in the number of days students exercised; this is displayed in
both figures 3 and 4. In Figure 3, students reported their exercise habits for 60 minutes a week as
followed for pre-questionnaires: 7.4% did not engage in any exercise; 20.6% reported one day;
10.3% reported two day; 2.9% reported three days; 8.8% reported four days; 7.4% reported five
days; 22.1% reported six days; and 20.6% reported seven days a week. On the post-
questionnaires students reported, 1.5% did not exercise; 14.9% reported one day; 4.5% reported
two days; 11.9% reported three days; 13.4% reported four days; 17.9% reported five days; 6%
reported six days; and 29.9% reported seven days. In Figure 4, students reported their exercise
habits of 30 minutes of exercise a week. During the pre-questionnaire, 13% reported no exercise
during the week; 17.4% reported one day; 7.2% reported two days; 1.4% reported three days;
4.3% reported four days; 10.1% reported five days; 7.2% reported six days; and 39.1% reported
seven days a week of exercise. Students reported on the post-questionnaires the following: 7.2%
reported no exercise during the week; 13% reported one day; 8.7% for two days; 11.6% for three
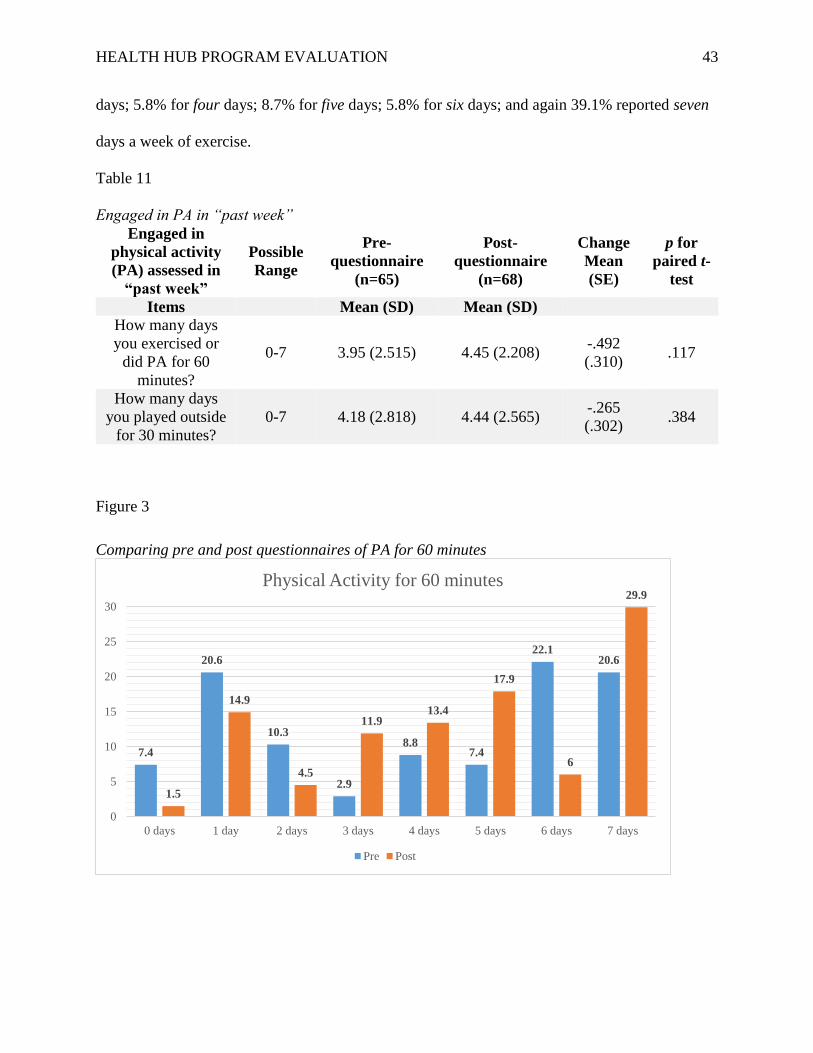
HEALTH HUB PROGRAM EVALUATION 43
days; 5.8% for four days; 8.7% for five days; 5.8% for six days; and again 39.1% reported seven
days a week of exercise.
Table 11
Engaged in PA in “past week”
Engaged in
physical activity
(PA) assessed in
“past week”
Possible
Range
Pre-
questionnaire
(n=65)
Post-
questionnaire
(n=68)
Change
Mean
(SE)
p for
paired t-
test
Items Mean (SD) Mean (SD)
How many days
you exercised or
did PA for 60
minutes?
0-7 3.95 (2.515) 4.45 (2.208) -.492
(.310) .117
How many days
you played outside
for 30 minutes?
0-7 4.18 (2.818) 4.44 (2.565) -.265
(.302) .384
Figure 3
Comparing pre and post questionnaires of PA for 60 minutes
7.4
20.6
10.3
2.9
8.87.4
22.120.6
1.5
14.9
4.5
11.913.4
17.9
6
29.9
0
5
10
15
20
25
30
0 days 1 day 2 days 3 days 4 days 5 days 6 days 7 days
Physical Activity for 60 minutes
Pre Post
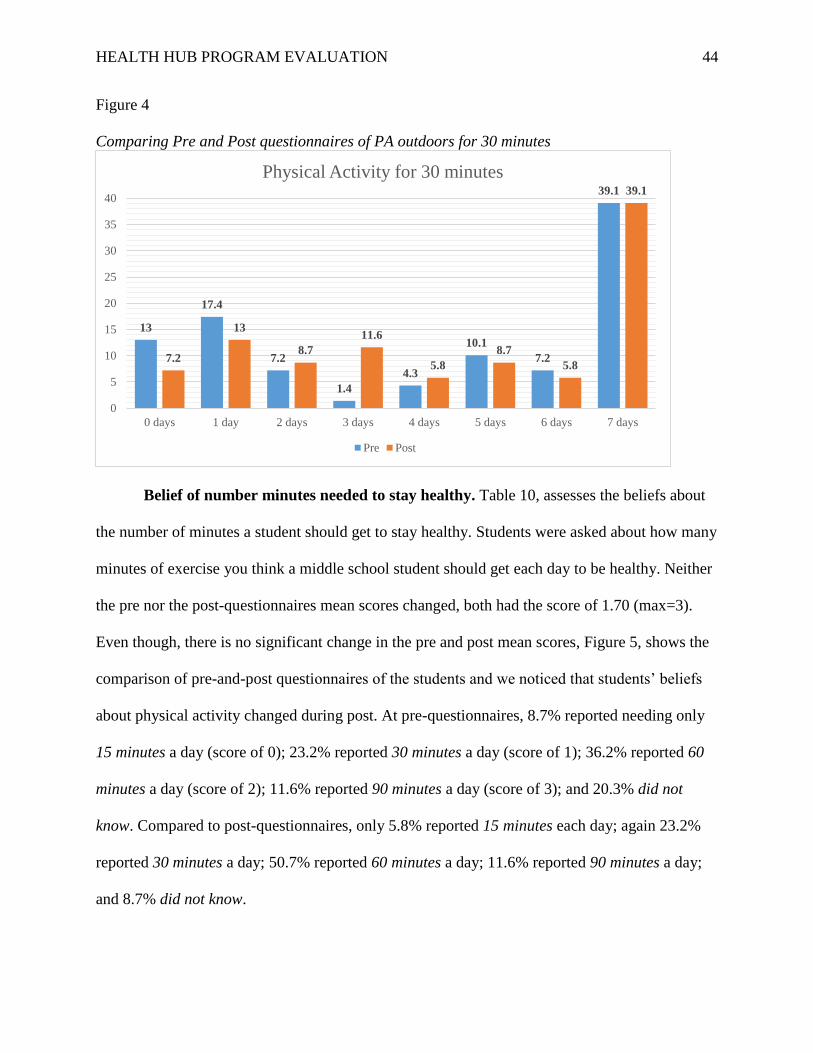
HEALTH HUB PROGRAM EVALUATION 44
Figure 4
Comparing Pre and Post questionnaires of PA outdoors for 30 minutes
Belief of number minutes needed to stay healthy. Table 10, assesses the beliefs about
the number of minutes a student should get to stay healthy. Students were asked about how many
minutes of exercise you think a middle school student should get each day to be healthy. Neither
the pre nor the post-questionnaires mean scores changed, both had the score of 1.70 (max=3).
Even though, there is no significant change in the pre and post mean scores, Figure 5, shows the
comparison of pre-and-post questionnaires of the students and we noticed that students’ beliefs
about physical activity changed during post. At pre-questionnaires, 8.7% reported needing only
15 minutes a day (score of 0); 23.2% reported 30 minutes a day (score of 1); 36.2% reported 60
minutes a day (score of 2); 11.6% reported 90 minutes a day (score of 3); and 20.3% did not
know. Compared to post-questionnaires, only 5.8% reported 15 minutes each day; again 23.2%
reported 30 minutes a day; 50.7% reported 60 minutes a day; 11.6% reported 90 minutes a day;
and 8.7% did not know.
13
17.4
7.2
1.4
4.3
10.1
7.2
39.1
7.2
13
8.7
11.6
5.8
8.7
5.8
39.1
0
5
10
15
20
25
30
35
40
0 days 1 day 2 days 3 days 4 days 5 days 6 days 7 days
Physical Activity for 30 minutes
Pre Post
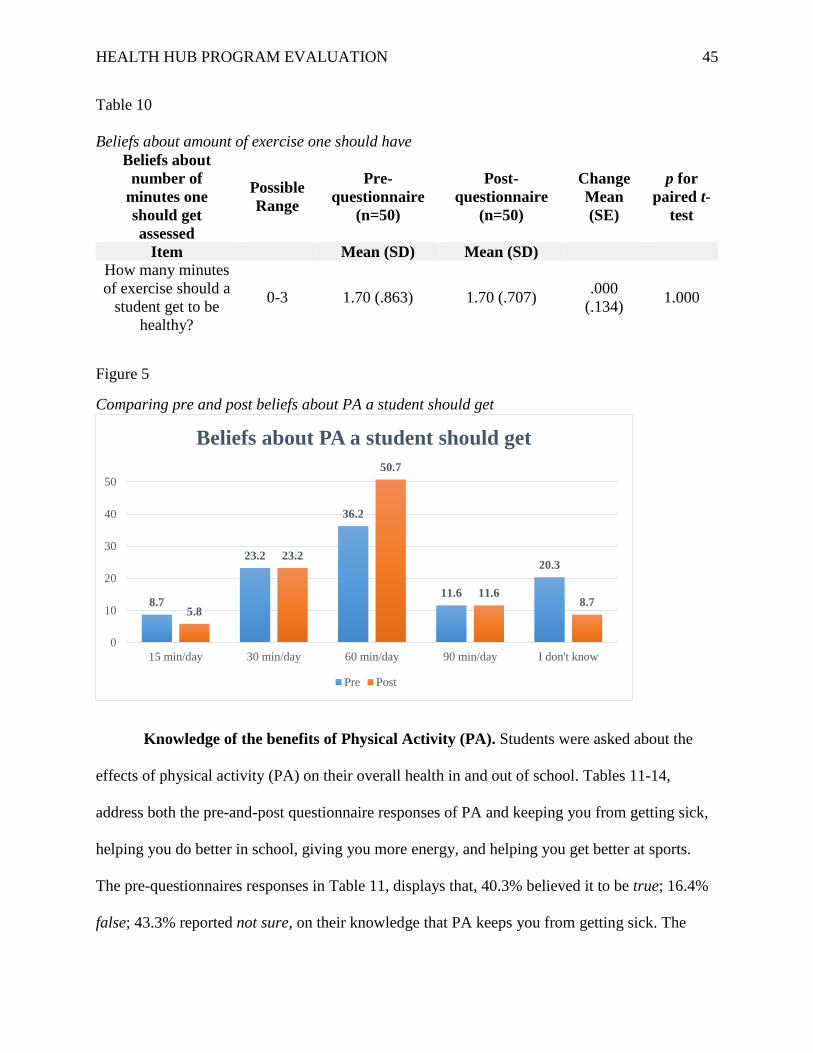
HEALTH HUB PROGRAM EVALUATION 45
Table 10
Beliefs about amount of exercise one should have
Beliefs about
number of
minutes one
should get
assessed
Possible
Range
Pre-
questionnaire
(n=50)
Post-
questionnaire
(n=50)
Change
Mean
(SE)
p for
paired t-
test
Item Mean (SD) Mean (SD)
How many minutes
of exercise should a
student get to be
healthy?
0-3 1.70 (.863) 1.70 (.707) .000
(.134) 1.000
Figure 5
Comparing pre and post beliefs about PA a student should get
Knowledge of the benefits of Physical Activity (PA). Students were asked about the
effects of physical activity (PA) on their overall health in and out of school. Tables 11-14,
address both the pre-and-post questionnaire responses of PA and keeping you from getting sick,
helping you do better in school, giving you more energy, and helping you get better at sports.
The pre-questionnaires responses in Table 11, displays that, 40.3% believed it to be true; 16.4%
false; 43.3% reported not sure, on their knowledge that PA keeps you from getting sick. The
8.7
23.2
36.2
11.6
20.3
5.8
23.2
50.7
11.68.7
0
10
20
30
40
50
15 min/day 30 min/day 60 min/day 90 min/day I don't know
Beliefs about PA a student should get
Pre Post
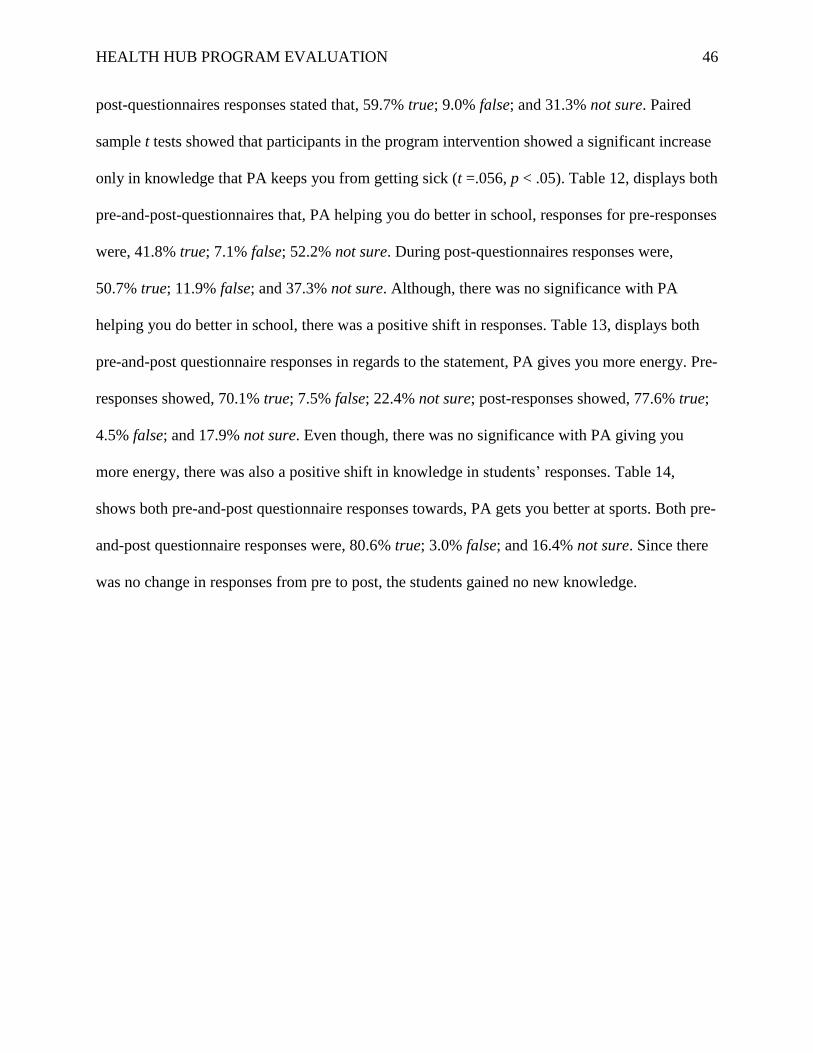
HEALTH HUB PROGRAM EVALUATION 46
post-questionnaires responses stated that, 59.7% true; 9.0% false; and 31.3% not sure. Paired
sample t tests showed that participants in the program intervention showed a significant increase
only in knowledge that PA keeps you from getting sick (t =.056, p < .05). Table 12, displays both
pre-and-post-questionnaires that, PA helping you do better in school, responses for pre-responses
were, 41.8% true; 7.1% false; 52.2% not sure. During post-questionnaires responses were,
50.7% true; 11.9% false; and 37.3% not sure. Although, there was no significance with PA
helping you do better in school, there was a positive shift in responses. Table 13, displays both
pre-and-post questionnaire responses in regards to the statement, PA gives you more energy. Pre-
responses showed, 70.1% true; 7.5% false; 22.4% not sure; post-responses showed, 77.6% true;
4.5% false; and 17.9% not sure. Even though, there was no significance with PA giving you
more energy, there was also a positive shift in knowledge in students’ responses. Table 14,
shows both pre-and-post questionnaire responses towards, PA gets you better at sports. Both pre-
and-post questionnaire responses were, 80.6% true; 3.0% false; and 16.4% not sure. Since there
was no change in responses from pre to post, the students gained no new knowledge.

HEALTH HUB PROGRAM EVALUATION 47
Table 11
PA can keep you from getting sick
Post-questionnaire Total
False Not Sure True
Pre-questionnaire
False
Count 2 5 4 11
% within Pre 18.2% 45.5% 36.4% 100.0%
% within Post 33.3% 12.5% 19.0% 16.4%
% of Total 3.0% 7.5% 6.0% 16.4%
Not Sure
Count 0 25 4 29
% within Pre 0.0% 86.2% 13.8% 100.0%
% within Post 0.0% 62.5% 19.0% 43.3%
% of Total 0.0% 37.3% 6.0% 43.3%
True
Count 4 10 13 27
% within Pre 14.8% 37.0% 48.1% 100.0%
% within Post 66.7% 25.0% 61.9% 40.3%
% of Total 6.0% 14.9% 19.4% 40.3%
Total
Count 6 40 21 67
% within Pre 9.0% 59.7% 31.3% 100.0%
% within Post 100.0% 100.0% 100.0% 100.0%
% of Total 9.0% 31.3% 59.7 % 100.0%
Chi-Square Tests
Value df Asymp. Sig. (2-
sided)
McNemar-Bowker Test 7.571 3 .056
N of Valid Cases 67
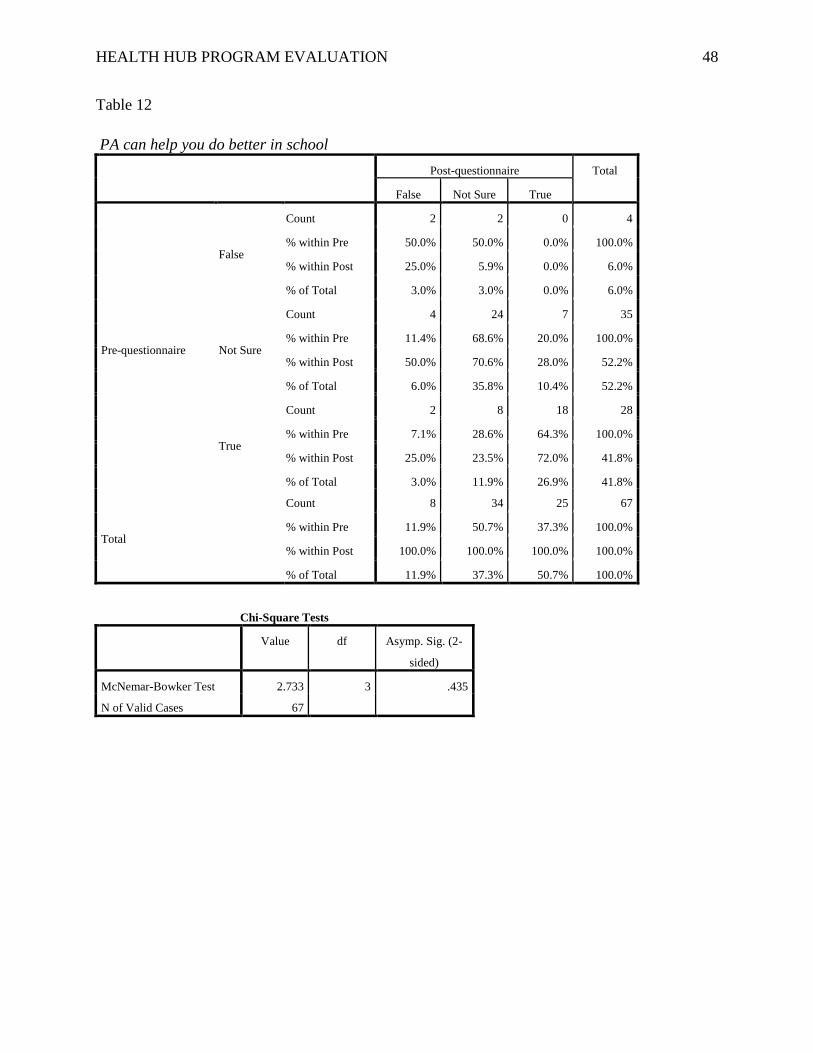
HEALTH HUB PROGRAM EVALUATION 48
Table 12
PA can help you do better in school
Post-questionnaire Total
False Not Sure True
Pre-questionnaire
False
Count 2 2 0 4
% within Pre 50.0% 50.0% 0.0% 100.0%
% within Post 25.0% 5.9% 0.0% 6.0%
% of Total 3.0% 3.0% 0.0% 6.0%
Not Sure
Count 4 24 7 35
% within Pre 11.4% 68.6% 20.0% 100.0%
% within Post 50.0% 70.6% 28.0% 52.2%
% of Total 6.0% 35.8% 10.4% 52.2%
True
Count 2 8 18 28
% within Pre 7.1% 28.6% 64.3% 100.0%
% within Post 25.0% 23.5% 72.0% 41.8%
% of Total 3.0% 11.9% 26.9% 41.8%
Total
Count 8 34 25 67
% within Pre 11.9% 50.7% 37.3% 100.0%
% within Post 100.0% 100.0% 100.0% 100.0%
% of Total 11.9% 37.3% 50.7% 100.0%
Chi-Square Tests
Value df Asymp. Sig. (2-
sided)
McNemar-Bowker Test 2.733 3 .435
N of Valid Cases 67
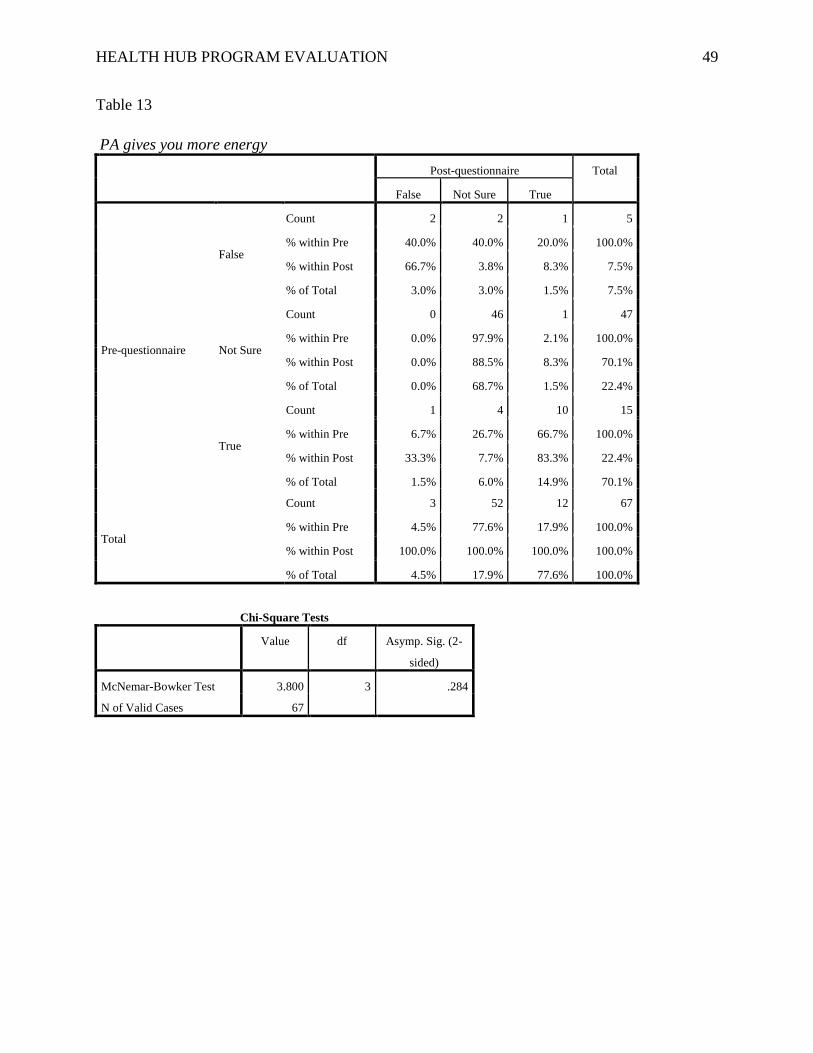
HEALTH HUB PROGRAM EVALUATION 49
Table 13
PA gives you more energy
Post-questionnaire Total
False Not Sure True
Pre-questionnaire
False
Count 2 2 1 5
% within Pre 40.0% 40.0% 20.0% 100.0%
% within Post 66.7% 3.8% 8.3% 7.5%
% of Total 3.0% 3.0% 1.5% 7.5%
Not Sure
Count 0 46 1 47
% within Pre 0.0% 97.9% 2.1% 100.0%
% within Post 0.0% 88.5% 8.3% 70.1%
% of Total 0.0% 68.7% 1.5% 22.4%
True
Count 1 4 10 15
% within Pre 6.7% 26.7% 66.7% 100.0%
% within Post 33.3% 7.7% 83.3% 22.4%
% of Total 1.5% 6.0% 14.9% 70.1%
Total
Count 3 52 12 67
% within Pre 4.5% 77.6% 17.9% 100.0%
% within Post 100.0% 100.0% 100.0% 100.0%
% of Total 4.5% 17.9% 77.6% 100.0%
Chi-Square Tests
Value df Asymp. Sig. (2-
sided)
McNemar-Bowker Test 3.800 3 .284
N of Valid Cases 67
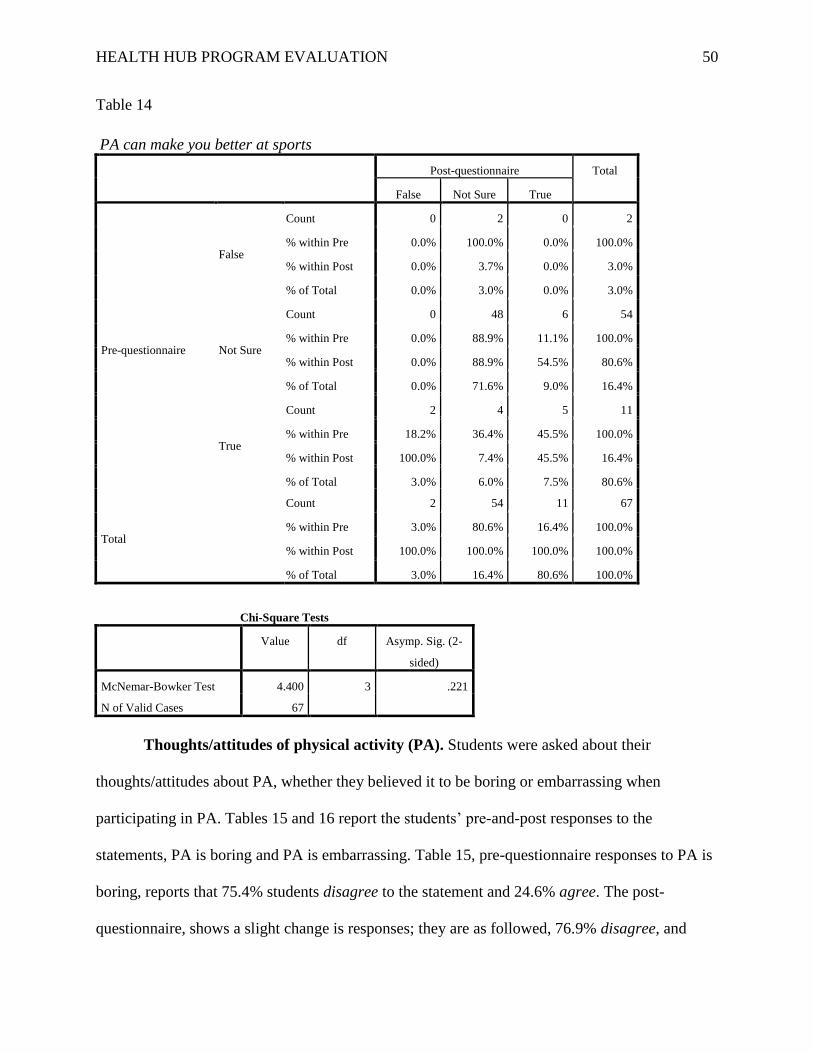
HEALTH HUB PROGRAM EVALUATION 50
Table 14
PA can make you better at sports
Post-questionnaire Total
False Not Sure True
Pre-questionnaire
False
Count 0 2 0 2
% within Pre 0.0% 100.0% 0.0% 100.0%
% within Post 0.0% 3.7% 0.0% 3.0%
% of Total 0.0% 3.0% 0.0% 3.0%
Not Sure
Count 0 48 6 54
% within Pre 0.0% 88.9% 11.1% 100.0%
% within Post 0.0% 88.9% 54.5% 80.6%
% of Total 0.0% 71.6% 9.0% 16.4%
True
Count 2 4 5 11
% within Pre 18.2% 36.4% 45.5% 100.0%
% within Post 100.0% 7.4% 45.5% 16.4%
% of Total 3.0% 6.0% 7.5% 80.6%
Total
Count 2 54 11 67
% within Pre 3.0% 80.6% 16.4% 100.0%
% within Post 100.0% 100.0% 100.0% 100.0%
% of Total 3.0% 16.4% 80.6% 100.0%
Chi-Square Tests
Value df Asymp. Sig. (2-
sided)
McNemar-Bowker Test 4.400 3 .221
N of Valid Cases 67
Thoughts/attitudes of physical activity (PA). Students were asked about their
thoughts/attitudes about PA, whether they believed it to be boring or embarrassing when
participating in PA. Tables 15 and 16 report the students’ pre-and-post responses to the
statements, PA is boring and PA is embarrassing. Table 15, pre-questionnaire responses to PA is
boring, reports that 75.4% students disagree to the statement and 24.6% agree. The post-
questionnaire, shows a slight change is responses; they are as followed, 76.9% disagree, and
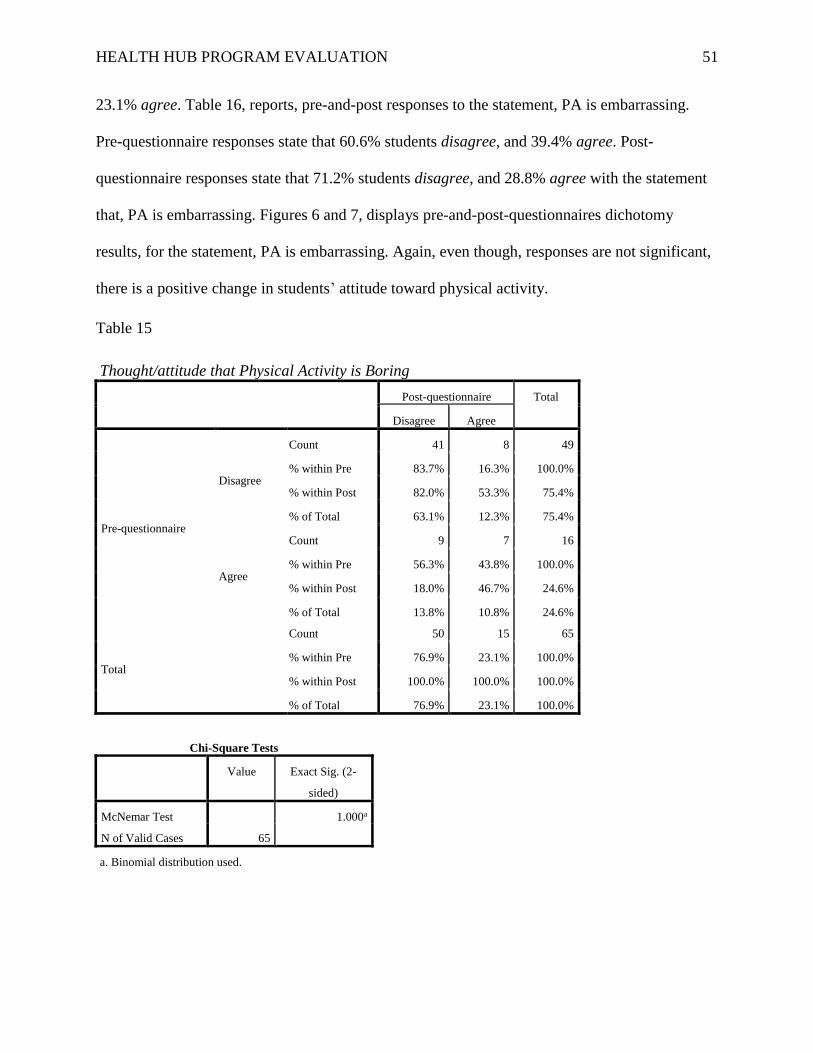
HEALTH HUB PROGRAM EVALUATION 51
23.1% agree. Table 16, reports, pre-and-post responses to the statement, PA is embarrassing.
Pre-questionnaire responses state that 60.6% students disagree, and 39.4% agree. Post-
questionnaire responses state that 71.2% students disagree, and 28.8% agree with the statement
that, PA is embarrassing. Figures 6 and 7, displays pre-and-post-questionnaires dichotomy
results, for the statement, PA is embarrassing. Again, even though, responses are not significant,
there is a positive change in students’ attitude toward physical activity.
Table 15
Thought/attitude that Physical Activity is Boring
Post-questionnaire Total
Disagree Agree
Pre-questionnaire
Disagree
Count 41 8 49
% within Pre 83.7% 16.3% 100.0%
% within Post 82.0% 53.3% 75.4%
% of Total 63.1% 12.3% 75.4%
Agree
Count 9 7 16
% within Pre 56.3% 43.8% 100.0%
% within Post 18.0% 46.7% 24.6%
% of Total 13.8% 10.8% 24.6%
Total
Count 50 15 65
% within Pre 76.9% 23.1% 100.0%
% within Post 100.0% 100.0% 100.0%
% of Total 76.9% 23.1% 100.0%
Chi-Square Tests
Value Exact Sig. (2-
sided)
McNemar Test 1.000a
N of Valid Cases 65
a. Binomial distribution used.
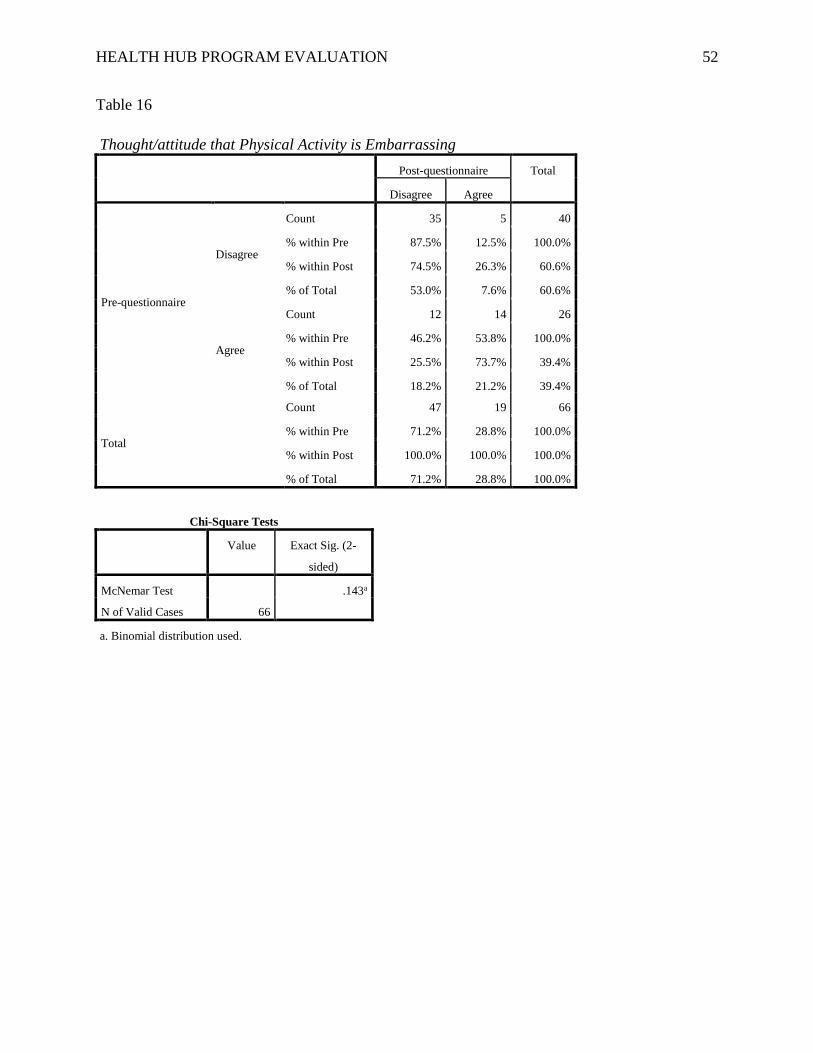
HEALTH HUB PROGRAM EVALUATION 52
Table 16
Thought/attitude that Physical Activity is Embarrassing
Post-questionnaire Total
Disagree Agree
Pre-questionnaire
Disagree
Count 35 5 40
% within Pre 87.5% 12.5% 100.0%
% within Post 74.5% 26.3% 60.6%
% of Total 53.0% 7.6% 60.6%
Agree
Count 12 14 26
% within Pre 46.2% 53.8% 100.0%
% within Post 25.5% 73.7% 39.4%
% of Total 18.2% 21.2% 39.4%
Total
Count 47 19 66
% within Pre 71.2% 28.8% 100.0%
% within Post 100.0% 100.0% 100.0%
% of Total 71.2% 28.8% 100.0%
Chi-Square Tests
Value Exact Sig. (2-
sided)
McNemar Test .143a
N of Valid Cases 66
a. Binomial distribution used.
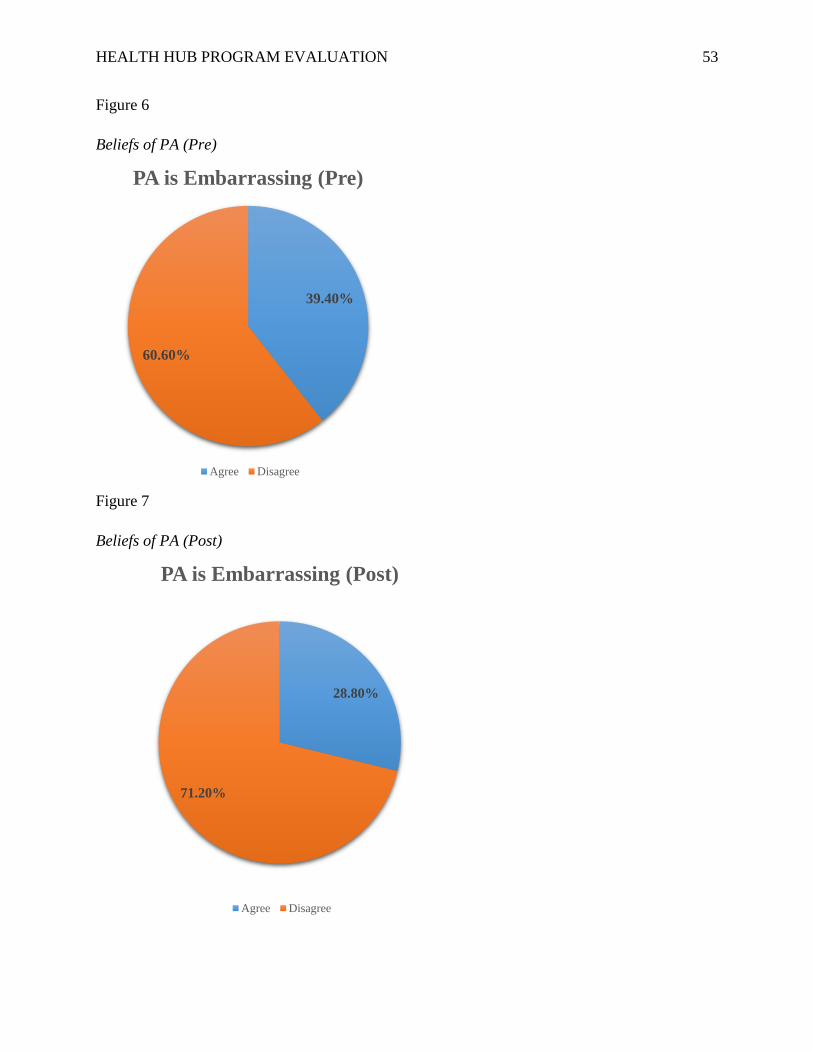
HEALTH HUB PROGRAM EVALUATION 53
Figure 6
Beliefs of PA (Pre)
Figure 7
Beliefs of PA (Post)
39.40%
60.60%
PA is Embarrassing (Pre)
Agree Disagree
28.80%
71.20%
PA is Embarrassing (Post)
Agree Disagree
HEALTH HUB PROGRAM EVALUATION 54
Qualitative Measures
The post-questionnaire open-ended questions were given to students and asked: what
they learned from the LIFT programs; what they liked and disliked the most about the program;
have their eating habits changed since participating in the LIFT programs; and have their
exercise habits changed since participating in the LIFT programs. For question one, four main
themes emerged from things they learned from the programs, which were: eating healthy, eating
and trying new foods, exercising, and other, which included responses like, sugar builds up in
your body, and sometimes healthy foods are tasty. Questions two; what you liked about the LIFT
program, the main responses were: the food they were given, the food they tasted, and others,
which included responses resembling, they care about us, and we learn interesting facts. For
question three; what you disliked about the LIFT program, main responses were: the heavy bags,
nothing, and too much food. Question four asked if eating habits changed since participating in
the LIFT program and how have they changed. The main responses were: eating healthy foods
makes you stronger, yes, nothing, and other, which included responses like, don’t eat junk food,
and learned eating healthier makes you stronger. Question five asked if exercise habits changed
since participating in the LIFT program and how have they changed. The main responses were:
exercise more, yes, no, and other, which included responses resembling, got faster, more fit, and
doing better in PE and stronger.
Discussion
Quantitative Results
This study was designed to evaluate whether LIFT-Levántate’s nutrition-related courses
and exercise activities would improve middle school students’ knowledge and positively affect
their attitudes towards nutrition and food consumption behaviors. The results revealed that there
was an overall slight increase in nutrition knowledge of students who participated in the
HEALTH HUB PROGRAM EVALUATION 55
programs. These findings were consistent with school-based nutrition programs in the United
States to prevent adolescent obesity. Gortmaker and colleagues (1999) discuss that school
settings would be the ideal location to use nutrition program intervention because they offer
access to large numbers of adolescents and the communities surrounding the schools. Numerous
research studies suggest that health promotion curricula for this age of student must be hands-on,
engaging and interactive, and provide opportunities for peer-to-peer education (Birnbaum, &
Perry 2002; Katz, O’Connell, Njike, Yeh, & Nawaz 2008). Because LIFT-Levántate’s school-
based nutrition programs were effective and had a diverse curriculum it was beneficial to the
middle school students. It is important to note that this nutrition program lasted for only six
months during the school year thus, while there was a slight increase in their knowledge and
positive affect towards nutrition and exercise it can be ascertained that if programs were longer
and the sample size larger we would see even higher increases in the results. Overall, the
findings of this research suggest that school-based nutrition education and exercise activities
through these opportunities may lead to a significant increase in nutrition knowledge.
In the six month program the pre-and-post questionnaires showed that students’ overall
healthy eating habits (food consumption, fast food/fried food consumption, attitude toward FV
and availability of FV) increased slightly. Although the increase was little for students in these
areas, these programs are still promising because students increased their overall FV intake, ate
less chips and salty snacks, and drank more water. One of the biggest increases were students’
knowledge of FV and the positive effects of eating FV regularly. LIFT-Levántate’s health
education curriculum specifically addresses all these health outcomes and were communicated to
the students in both formal and informal settings at the school. Seeing these increases in
students’ knowledge and overall healthy eating habits only reiterates that school-based nutrition
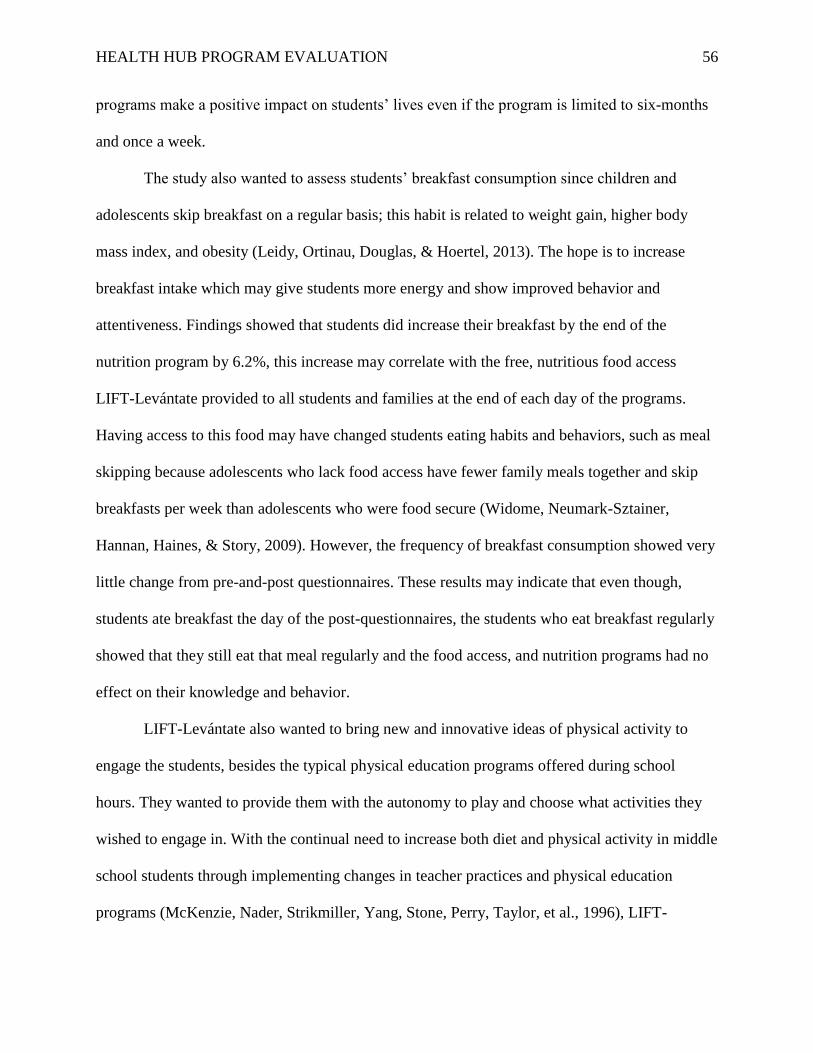
HEALTH HUB PROGRAM EVALUATION 56
programs make a positive impact on students’ lives even if the program is limited to six-months
and once a week.
The study also wanted to assess students’ breakfast consumption since children and
adolescents skip breakfast on a regular basis; this habit is related to weight gain, higher body
mass index, and obesity (Leidy, Ortinau, Douglas, & Hoertel, 2013). The hope is to increase
breakfast intake which may give students more energy and show improved behavior and
attentiveness. Findings showed that students did increase their breakfast by the end of the
nutrition program by 6.2%, this increase may correlate with the free, nutritious food access
LIFT-Levántate provided to all students and families at the end of each day of the programs.
Having access to this food may have changed students eating habits and behaviors, such as meal
skipping because adolescents who lack food access have fewer family meals together and skip
breakfasts per week than adolescents who were food secure (Widome, Neumark-Sztainer,
Hannan, Haines, & Story, 2009). However, the frequency of breakfast consumption showed very
little change from pre-and-post questionnaires. These results may indicate that even though,
students ate breakfast the day of the post-questionnaires, the students who eat breakfast regularly
showed that they still eat that meal regularly and the food access, and nutrition programs had no
effect on their knowledge and behavior.
LIFT-Levántate also wanted to bring new and innovative ideas of physical activity to
engage the students, besides the typical physical education programs offered during school
hours. They wanted to provide them with the autonomy to play and choose what activities they
wished to engage in. With the continual need to increase both diet and physical activity in middle
school students through implementing changes in teacher practices and physical education
programs (McKenzie, Nader, Strikmiller, Yang, Stone, Perry, Taylor, et al., 1996), LIFT-
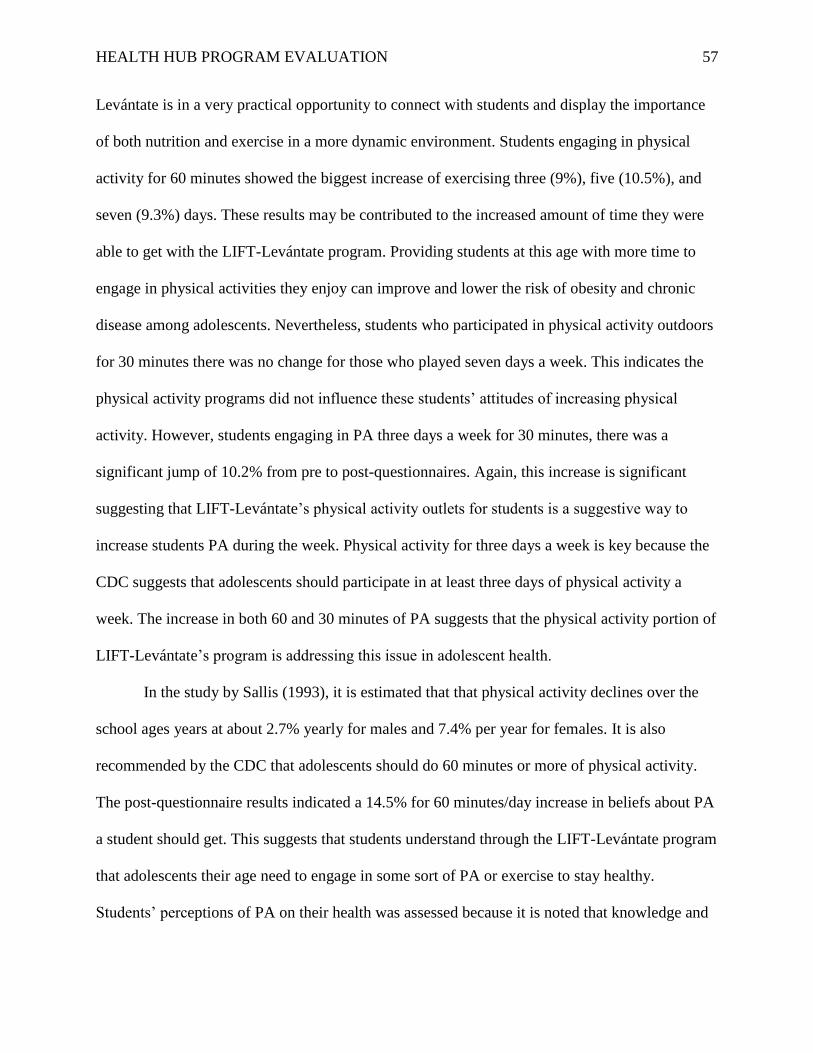
HEALTH HUB PROGRAM EVALUATION 57
Levántate is in a very practical opportunity to connect with students and display the importance
of both nutrition and exercise in a more dynamic environment. Students engaging in physical
activity for 60 minutes showed the biggest increase of exercising three (9%), five (10.5%), and
seven (9.3%) days. These results may be contributed to the increased amount of time they were
able to get with the LIFT-Levántate program. Providing students at this age with more time to
engage in physical activities they enjoy can improve and lower the risk of obesity and chronic
disease among adolescents. Nevertheless, students who participated in physical activity outdoors
for 30 minutes there was no change for those who played seven days a week. This indicates the
physical activity programs did not influence these students’ attitudes of increasing physical
activity. However, students engaging in PA three days a week for 30 minutes, there was a
significant jump of 10.2% from pre to post-questionnaires. Again, this increase is significant
suggesting that LIFT-Levántate’s physical activity outlets for students is a suggestive way to
increase students PA during the week. Physical activity for three days a week is key because the
CDC suggests that adolescents should participate in at least three days of physical activity a
week. The increase in both 60 and 30 minutes of PA suggests that the physical activity portion of
LIFT-Levántate’s program is addressing this issue in adolescent health.
In the study by Sallis (1993), it is estimated that that physical activity declines over the
school ages years at about 2.7% yearly for males and 7.4% per year for females. It is also
recommended by the CDC that adolescents should do 60 minutes or more of physical activity.
The post-questionnaire results indicated a 14.5% for 60 minutes/day increase in beliefs about PA
a student should get. This suggests that students understand through the LIFT-Levántate program
that adolescents their age need to engage in some sort of PA or exercise to stay healthy.
Students’ perceptions of PA on their health was assessed because it is noted that knowledge and
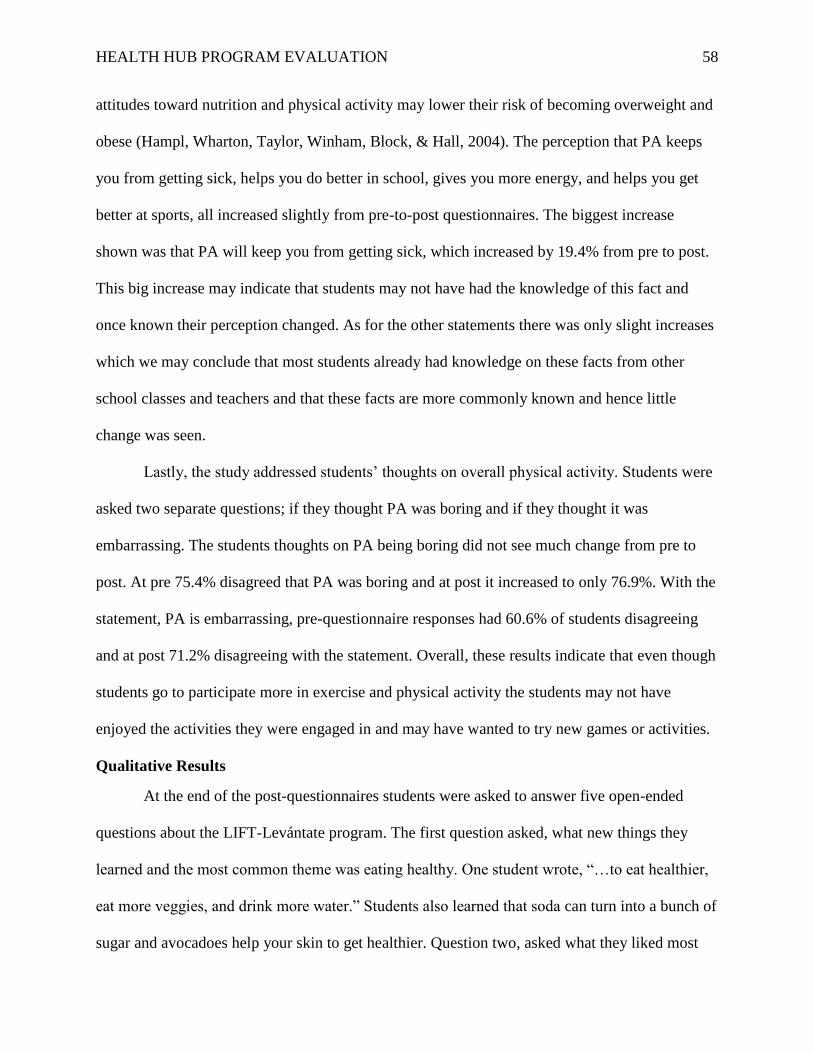
HEALTH HUB PROGRAM EVALUATION 58
attitudes toward nutrition and physical activity may lower their risk of becoming overweight and
obese (Hampl, Wharton, Taylor, Winham, Block, & Hall, 2004). The perception that PA keeps
you from getting sick, helps you do better in school, gives you more energy, and helps you get
better at sports, all increased slightly from pre-to-post questionnaires. The biggest increase
shown was that PA will keep you from getting sick, which increased by 19.4% from pre to post.
This big increase may indicate that students may not have had the knowledge of this fact and
once known their perception changed. As for the other statements there was only slight increases
which we may conclude that most students already had knowledge on these facts from other
school classes and teachers and that these facts are more commonly known and hence little
change was seen.
Lastly, the study addressed students’ thoughts on overall physical activity. Students were
asked two separate questions; if they thought PA was boring and if they thought it was
embarrassing. The students thoughts on PA being boring did not see much change from pre to
post. At pre 75.4% disagreed that PA was boring and at post it increased to only 76.9%. With the
statement, PA is embarrassing, pre-questionnaire responses had 60.6% of students disagreeing
and at post 71.2% disagreeing with the statement. Overall, these results indicate that even though
students go to participate more in exercise and physical activity the students may not have
enjoyed the activities they were engaged in and may have wanted to try new games or activities.
Qualitative Results
At the end of the post-questionnaires students were asked to answer five open-ended
questions about the LIFT-Levántate program. The first question asked, what new things they
learned and the most common theme was eating healthy. One student wrote, “…to eat healthier,
eat more veggies, and drink more water.” Students also learned that soda can turn into a bunch of
sugar and avocadoes help your skin to get healthier. Question two, asked what they liked most
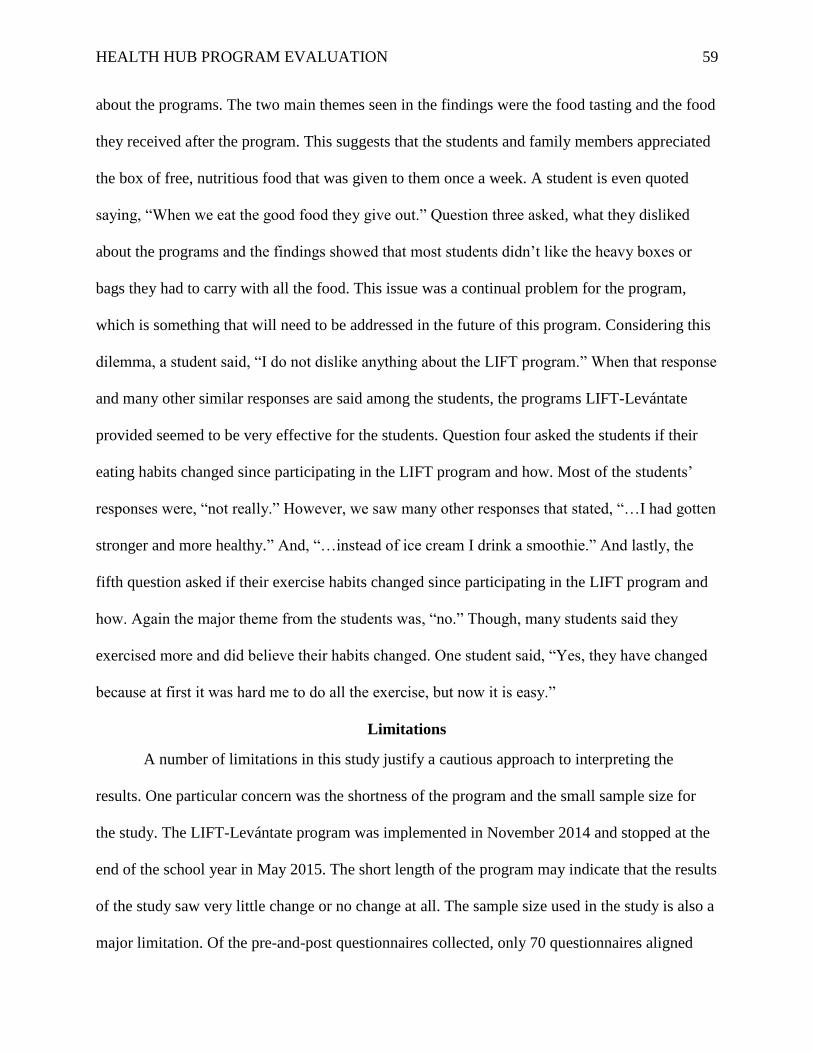
HEALTH HUB PROGRAM EVALUATION 59
about the programs. The two main themes seen in the findings were the food tasting and the food
they received after the program. This suggests that the students and family members appreciated
the box of free, nutritious food that was given to them once a week. A student is even quoted
saying, “When we eat the good food they give out.” Question three asked, what they disliked
about the programs and the findings showed that most students didn’t like the heavy boxes or
bags they had to carry with all the food. This issue was a continual problem for the program,
which is something that will need to be addressed in the future of this program. Considering this
dilemma, a student said, “I do not dislike anything about the LIFT program.” When that response
and many other similar responses are said among the students, the programs LIFT-Levántate
provided seemed to be very effective for the students. Question four asked the students if their
eating habits changed since participating in the LIFT program and how. Most of the students’
responses were, “not really.” However, we saw many other responses that stated, “…I had gotten
stronger and more healthy.” And, “…instead of ice cream I drink a smoothie.” And lastly, the
fifth question asked if their exercise habits changed since participating in the LIFT program and
how. Again the major theme from the students was, “no.” Though, many students said they
exercised more and did believe their habits changed. One student said, “Yes, they have changed
because at first it was hard me to do all the exercise, but now it is easy.”
Limitations
A number of limitations in this study justify a cautious approach to interpreting the
results. One particular concern was the shortness of the program and the small sample size for
the study. The LIFT-Levántate program was implemented in November 2014 and stopped at the
end of the school year in May 2015. The short length of the program may indicate that the results
of the study saw very little change or no change at all. The sample size used in the study is also a
major limitation. Of the pre-and-post questionnaires collected, only 70 questionnaires aligned
HEALTH HUB PROGRAM EVALUATION 60
with students’ ID codes. This limited sample size should not be generalized to a larger
population in Marin, California. As well as, should not be generalized to other middle schools in
the area because only James B. Davidson Middle School was used to pilot this program. Another
limitation to the program is the frequency of the program. The LIFT-Levántate programs were
only once a week after-school. This limits the possibility of including more students into the
programs. During the collection of pre-and-post questionnaires another major limitation was
accurately getting students to provide a correct ID code. If students didn’t provide the correct
information for either the pre or post-questionnaires, we could not use their questionnaires for
the evaluation analysis. Another limitation to the study was the dissemination of the
questionnaires during the school year. Although the day of the week for post-questionnaires was
consistent (on Monday, one day), the days of the week for pre-questionnaire were different (two
Monday’s in two weeks), due to time constraints and staff’s convenience. Because behavior
questions specifically asked about the week before and the day before, there may have been
some variations in students’ behaviors due to different days of the week. The questionnaire was
also too long for the students’ to administer. Students would become disengaged and find the
process boring and redundant. This could have an effect on their response rates for either the pre-
or-post questionnaires. The post-questionnaire’s five open-ended questions, which students self-
reported about the programs they participated in, may have the potential for biased reporting.
Students may have recorded what LIFT-Levántate wanted to see in the results and not their true
feelings or beliefs about the programs.
Implications
LIFT-Levántate’s school-based nutrition program implications include the need to
explore variations of each of the programs activities (nutrition education, physical activity, and
gardening) and the potential for implementation on a larger scale. Elements of the overall health
HEALTH HUB PROGRAM EVALUATION 61
hub program at James B. Davidson worked, but results show that other areas may need be
revised and improved. Another implication about the health hub programs is not using each of
the other programs to collaborate together and have more of a collaborative approach to the
material being covered through the year. The involvement of the student’s family is another
implication that could improve the health hub in the future. Most family members had no
knowledge that LIFT-Levántate was providing students with additional nutritional and healthy
resources after school. More awareness of the health hub and communication between all
stakeholders may have provided even more resources and volunteers for the health hub. One of
major implications of the health hub was the possibility of LIFT-Levántate shutting down
completely in the middle of the school year. This daunting reality has the potential having James
B. Davidson’s health hub not continuing the following school year.
Suggestions
In summary, the James B. Davidson health hub succeeded in implementing a small
school-based nutritional program to positively impact middle school students’ knowledge,
beliefs and perceptions about healthy eating and exercise habits. Future suggestions to improve
this health program would be to provide students more access to places and opportunities for
engaging in physical activity. Also, using a more peer-led intervention has the potential for
promoting healthy eating among adolescents. Another overarching suggestion would be the
improvement of promoting the health hub among the entire school community. If the health hub
at James B. Davidson is too continue there needs to be more involvement and buy-in from the
parents, school administration and the San Rafael Unified School District. If these school-based
nutrition programs are too survive in communities all stakeholders involved need to understand
that not only are the programs improving the students’ health and well-being, but also the
community at large. Future research is recommended with a larger sample size that includes
HEALTH HUB PROGRAM EVALUATION 62
more racially/ethnically diverse participants from different middle school in multiple locations.
Another suggestion might be a follow-up study to determine if changes in knowledge, attitudes,
and behavior last. The findings of this research study suggest that an increased knowledge of
nutrition may have a positive effect on student’s attitudes toward nutrition and food consumption
behaviors which may further lead to improving health in adolescence to adulthood. The school-
based nutrition program provided a natural learning environment, and can incorporate nutrition
messages into science, health, and other courses which may be an effective way to reach the
young population.
HEALTH HUB PROGRAM EVALUATION 63
References
Andreyeva, T., Kelly, I. R., & Harris, J. L. (2011). Exposure to food advertising on television:
Associations with children’s fast food and soft drink consumption and obesity.
Economics and Human Biology, 9(3), 221-233.
Baranowski, T., Mendlein, J., Resnicow, K., Frank, E., Weber Cullen, K. & Baranowski, J.
(2000). Physical activity and nutrition in children and youth: an overview of obesity
prevention. Preventive Medicine, 31, 1-10.
Bee, A. (2012). Household income inequality within U.S. counties: 2006-2010. U.S. Census
Bureau. Retrieved from http://www.census.gov/prod/2012pubs/acsbr10-18.pdf.
Benjamin Neelon, S. E., & Briley, M. E. (2011). Position of the American Dietetic Association:
Benchmarks for nutrition in child care. Journal of American Dietetic Association, 111(4),
607-615.
Bidgood, B. A., & Cameron, G. (1992). Meal/snack missing and dietary inadequacy of primary
school children. Journal of the Canadian Dietetic Association, 53, 164-168.
Birch, L. L., & Fisher, J. O. (1998). Development of eating behaviors among children and
adolescents. Pediatrics, 101, 539-549.
Bruening, M., MacLehose, R., Loth, K., Story, M., & Neumark-Sztainer, D. (2012). Feeding a
family in a recession: Food insecurity among Minnesota parents. American Journal of
Public Health, 102(3), 520-526.
California Department of Public Health (CDPH). (2015). Nutrition education and obesity
prevention branch (NEOPB). Retrieved from
https://www.cdph.ca.gov/programs/cpns/Pages/default.aspx
HEALTH HUB PROGRAM EVALUATION 64
California Food Policy Advocates. (2015). Nutrition and food insecurity profiles. Retrieved from
http://cfpa.net/county-profiles.
Cason, K. (1999). Children are growing health in South Carolina. Journal of Nutrition Education
and Behavior, 31(4), 235-236.
Centers for Disease Control and Prevention (CDC). (1996). Guidelines for school health
programs to promote lifelong health eating. Morbidity and Mortality Weekly Report, 45,
1-37.
Center for Disease Control and Prevention (CDC). (2009). Surveillance of health status in
minority communities: Racial and ethnic approaches to community health across the U.S.
Morbidity and Mortality Weekly Report: Risk Factor Survey, 60(6).
Center for Disease Control and Prevention (CDC). (2010). Youth Media Campaign: VERB.
Retrieved from http://www.cdc.gov/youthcampaign/
Center for Disease Control and Prevention (CDC). (2014). National Health and Nutrition
Examination Survey. Retrieved from http://www.cdc.gov/nchs/nhanes/about_nhanes.htm
Center for Disease Control and Prevention (CDC). (2015). Nutrition and the health of young
people. Retrieved from http://www.cdc.gov/healthyyouth/nutrition/facts.htm
Conners, C. K., & Blouin, A. G. (1982). Nutritional effects on behavior of children. Journal of
Psychiatric Research, 17(2), 193-201.
Dietz, W. H. (1990). You are what you eat – what you eat is what you are. Journal of Adolescent
Health Care, 11(1), 76-81.
Dietz, W. H. (2004). Overweight in childhood and adolescence. New England Journal of
Medicine, 350(8), 55-857.
Elder, G. H. (1998). The life course as developmental theory. Child Development, 69, 1–12.
HEALTH HUB PROGRAM EVALUATION 65
Evans, G. W. (2004). The environment of childhood poverty. The American Psychologist, 59,
77–92.
Flourney, R. (2006). Healthy food, strong communities. National Housing Institute, 147.
Retrieved from http://www.nhi.org/online/issues/147/healthyfoods.html.
Goldberg, M. E., & Gunasti, K. (2007). Creating an environment in which youths are encouraged
to eat a healthier diet. Journal of Public Policy Market, 26, 162–181.
Gordon-Larsen, P., Nelson, M. C., Page, P., & Popkin, B. M. (2006). Inequality in the build
environment underlies key health disparities in physical activity and obesity. Pediatrics,
117(2), 417-424.
Gortmaker, S. L., Peterson, K., Wiecha, J., Sobol, A. M., Dixit, S., Fox, M. K., & Laird, N.
(1999). Reducing obesity via a school-based interdisciplinary intervention among youth:
Planet health. Archives of Pediatrics & Adolescent Medicine 153(4), 409-418.
Hampl, J. S., Wharton, C. M., Taylor, C. A., Winham, D. M., Block, J. L., & Hall, R. (2004).
Primetime television impacts on adolescents’ impressions of bodyweight, sex appeal, and
food and beverage consumption. Nutrition Bulletin, 29(2), 92-98.
Harris, J. L., Bargh, J. A., & Brownell, K., (2009). The direct effects of television food
advertising on eating behavior. Health Psychology, 28, 404–413.
Harris, J. L., Pomeranz, J. L., Lobstein, T., & Brownell, K. D. (2009). A crisis in the
marketplace: How food marketing contributes to childhood obesity and what can be
done. Annual Review of Public Health 30, 211–225.
Health and Huma Services. Dietary Guidelines Advisory Committee. Report of the Dietary
Guidelines Advisory Committee on the Dietary Guidelines for Americans, 2010, to the
HEALTH HUB PROGRAM EVALUATION 66
Secretary of Agriculture and the Secretary of Health and Human Services. Washington,
DC: U.S. Department of Agriculture; 2010.
Heim, S., Stang, J., & Ireland, M. (2009). A garden pilot project enhances fruit and vegetable
consumption among children. Journal of American Dietetic Association, 109, 1220-1226.
Hoynes, H. W., Schanzenbach, D. W., Almond, D. (2012). Long run impacts of childhood access
to the safety net. National Bureau of Economic Research. Retrieved from
http://www.nber.org/papers/w18535.
Hu, F. B, Li, T. Y., Colditz, G. A., Willett, W. C., & Manson, J. E. (2003). Television watching
and other sedentary behaviors in relation to risk of obesity and type 2 diabetes mellitus in
women. The Journal of the American Medicine Association, 290, 332.
Katz, D. L., O’Connell, M., Njike, V. Y., Yeh, M. C., & Nawaz, H. (2008). Strategies for the
prevention and control of obesity in the school setting: Systematic review and meta-
analysis. International Journal of Obesity, 32(12), 1780-1789.
Kaisari, P., Yannakoulia, M., Panagiotakos, D. B. (2013). Eating frequency and overweight and
obesity in children and adolescents: A meta-analysis. Pediatrics, 131(5), 958-967.
Kenny, E. L., Long, M. W., Cradock, A. L. & Gortmaker, S. L. (2015). Prevalence of inadequate
hydration among US children and disparities by gender and race/ethnicity: National
health and nutrition examination survey, 2009-2012. American Journal of Public Health.
Retrieved from http://ajph.aphapublications.org/doi/abs/10.2105/AJPH.2015.302572
Kumanyika, S. K. & Grier, S. (2006). Targeting interventions for ethnic minority and low
income populations. The Future of Children, 16(1), 187-207.
Lautenschlager L., & Smith, C. (2007). Beliefs, knowledge, and values held by inner city youth
about gardening, nutrition, and cooking. Agriculture and Human Values, 24, 245-258.
HEALTH HUB PROGRAM EVALUATION 67
Lee, H., Harris, K., & Gordon-Larsen, P. (2009). Life course perspectives on the links between
poverty and obesity during the transition to young adulthood. Population Research and
Policy Review, 28(4), 505- 532.
Leidy, H. J., Ortinau, L. C., Douglas, S. M., & Hoertel, H. A. (2013). Beneficial effects of a
higher-protein breakfast on the appetitive, hormonal, and neural signals controlling
energy intake regulation in overweight/obese, “breakfast skipping,” late-adolescent girls.
American Journal of Clinical Nutrition, 97(4), 677-688.
Li, C., Ford, E. S., Zhao, G., & Mokdad, A. H. (2009). Prevalence of pre-diabetes and its
association with clustering of cardiometabolic risk factors and hyperinsulinemia among
US adolescents: NHANES 2005–2006. Diabetes Care, 32, 342–347.
LIFT-Levántate: Building Healthy Communities. (n.d.). Retrieved March 26, 2015 from the
LIFT-Levántate: http://lift-levantate.org/.
Liquori T., Koch, P. D., Contento, I. R., & Castle J. (1998). The cookshop program: Outcome
evaluation of a nutrition education program linking lunchroom food experiences with
classroom cooking experiences. Journal of Nutrition Education, 30, 302-313.
Lytle, L., & Achterberg, C. (1995). Changing the diet of America’s children: What works and
why? Journal of Nutrition Education, 27(5), 250-260.
Lytle, L. A., Kelder, S. H., Perry, C. L., Klepp, K. (1995). Covariance of adolescent health
behaviors: The class of 1989 study. Health Education Research Theory Practice, 146.
Marin Health and Human Services. (2014). CX3: A health snapshot of our communities
[PowerPoint slides]. Retrieved from https://www.marinhhs.org/nutrition-wellness
program.
Matson-Koffman, D. M., Brownstein, J. N., Neiner, J. A., & Greaney, M. L. (2005). A site
HEALTH HUB PROGRAM EVALUATION 68
specific literature review of policy and environmental interventions that promote physical
activity and nutrition for cardiovascular health: What works? American Journal of Health
Promotion, 19(3), 167-193.
McKenzie, T. L., Nader, P. R., Strikmiller, P. K., Yang, M., Stone, E. J., Perry, C. L., Taylor, W.
C., Epping, J. N., Feldman, H. A., Luepker, R. V., & Kelder, S. H. (1996). School
physical education: Effect of the child and adolescent trial for cardiovascular health.
Preventive Medicine, 25, 423–431.
Metallinos-Katsaras, E., Must, A., & Gorman, K. (2012). A longitudinal study of food insecurity
on obesity in preschool children. Journal of the Academy of Nutrition and Dietetics,
112(12), 1949-1958.
Munoz, K., Krebs-Smith, S., Ballard-Barbash, R., Cleveland, L. (1997). Food intakes of U.S.
children and adolescents compared with recommendations. Pediatrics, 100, 323-329.
National Initiative for Children’s Healthcare Quality. (2007). California state fact sheet.
Retrieved from http://www.childhealthdata.org/docs/nsch-docs/california-
pdf.pdf?sfvrsn=0
National Institute of Child Health and Human Development. (2009). Media-Smart Youth.
Retrieved from https://www.nichd.nih.gov/msy/about/Pages/default.aspx
National Institutes of Health. (2005). Theory at a glance: A Guide for Health Promotion Practice.
2nd ed. No. 05-3896. Accessed May 8, 2015.
National Center for Health Statistics. Health, United States, 2011: With Special Features on
Socioeconomic Status and Health. Hyattsville, MD; U.S. Department of Health and
Human Services; 2012.
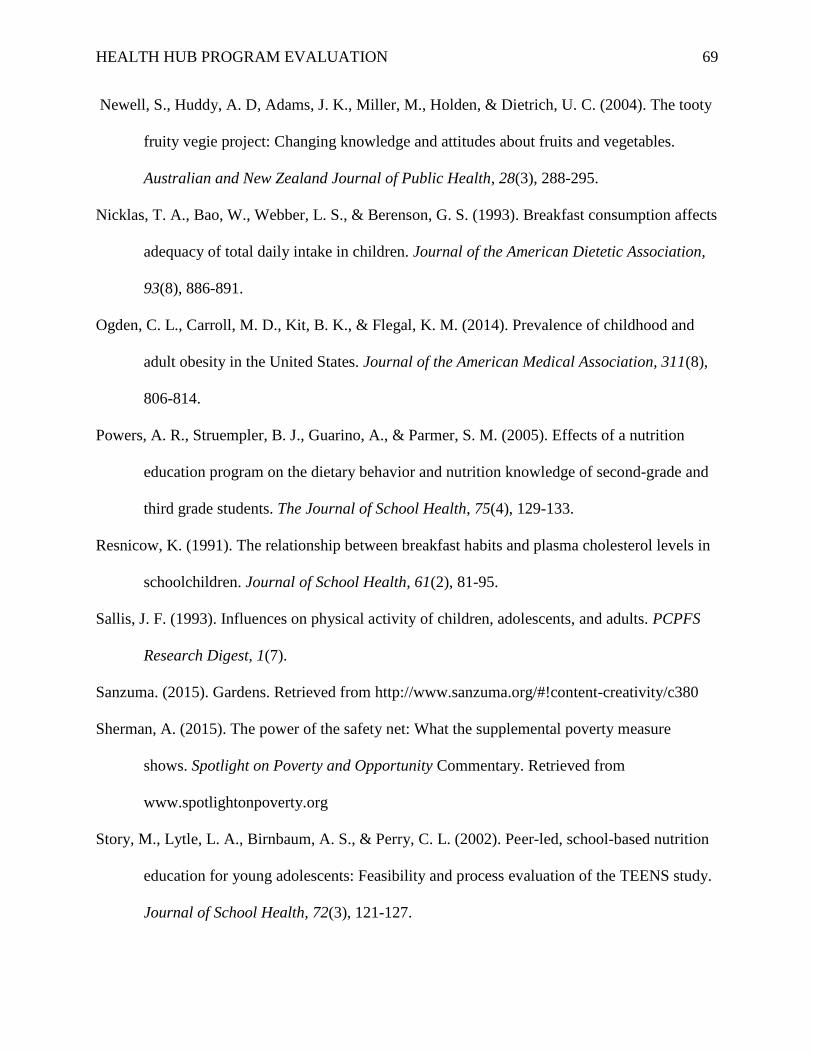
HEALTH HUB PROGRAM EVALUATION 69
Newell, S., Huddy, A. D, Adams, J. K., Miller, M., Holden, & Dietrich, U. C. (2004). The tooty
fruity vegie project: Changing knowledge and attitudes about fruits and vegetables.
Australian and New Zealand Journal of Public Health, 28(3), 288-295.
Nicklas, T. A., Bao, W., Webber, L. S., & Berenson, G. S. (1993). Breakfast consumption affects
adequacy of total daily intake in children. Journal of the American Dietetic Association,
93(8), 886-891.
Ogden, C. L., Carroll, M. D., Kit, B. K., & Flegal, K. M. (2014). Prevalence of childhood and
adult obesity in the United States. Journal of the American Medical Association, 311(8),
806-814.
Powers, A. R., Struempler, B. J., Guarino, A., & Parmer, S. M. (2005). Effects of a nutrition
education program on the dietary behavior and nutrition knowledge of second-grade and
third grade students. The Journal of School Health, 75(4), 129-133.
Resnicow, K. (1991). The relationship between breakfast habits and plasma cholesterol levels in
schoolchildren. Journal of School Health, 61(2), 81-95.
Sallis, J. F. (1993). Influences on physical activity of children, adolescents, and adults. PCPFS
Research Digest, 1(7).
Sanzuma. (2015). Gardens. Retrieved from http://www.sanzuma.org/#!content-creativity/c380
Sherman, A. (2015). The power of the safety net: What the supplemental poverty measure
shows. Spotlight on Poverty and Opportunity Commentary. Retrieved from
www.spotlightonpoverty.org
Story, M., Lytle, L. A., Birnbaum, A. S., & Perry, C. L. (2002). Peer-led, school-based nutrition
education for young adolescents: Feasibility and process evaluation of the TEENS study.
Journal of School Health, 72(3), 121-127.

HEALTH HUB PROGRAM EVALUATION 70
Strauss, R. S. (2000). Childhood obesity and self-esteem. Pediatrics, 105(1), e15.
Sugerman, S., Foerster, S. B., Gregson, J., Linares A., & Hudes, M. (2007). California adults
increase fruit and vegetable consumption from 1997-2007. Journal of Nutrition
Education and Behavior, 43(4), 96-103.
Swinburn, B., Sacks, G., & Lobstein, T. (2008). The ‘Sydney Principles’ for reducing the
commercial promotion of foods and beverages to children. Public Health Nutrition, 11,
881–886.
Telama, R., Yang. X., Laakso, L. and Viikari, J. (1997). Physical activity in childhood and
adolescence as predictor of physical activity in young adulthood. American Journal of
Preventive Medicine, 13, 317–322.
United States Census Bureau. (2014). State and county quick facts. Retrieved from
http://quikfactscensus.gov/qfd/states/
United States Department of Health and Human Services. (2000). Dietary guidelines for
Americans 2000. Retrieved from
http://198.102.218.57/dietaryguidelines/dga2000/document/frontcover.htm
Widome, R., Neumark-Sztainer, D., Hannan, P. J., Haines, J., & Story, M. (2009). Eating when
there is not enough to eat: Eating behaviors and perceptions of food among food-insecure
youths. American Journal of Public Health, 99(5), 822-828.
World Health Organization (WHO). (2014). Social determinants of health. Retrieved from
http://www.healthypeople.gov/2020/topicsobjectives2020/overview.aspx?topicid=39
World Health Organization (WHO). (2015). Obesity and overweight: Fact Sheet. Retrieved from
http://www.who.int/mediacentre/factsheets/fs311/en/
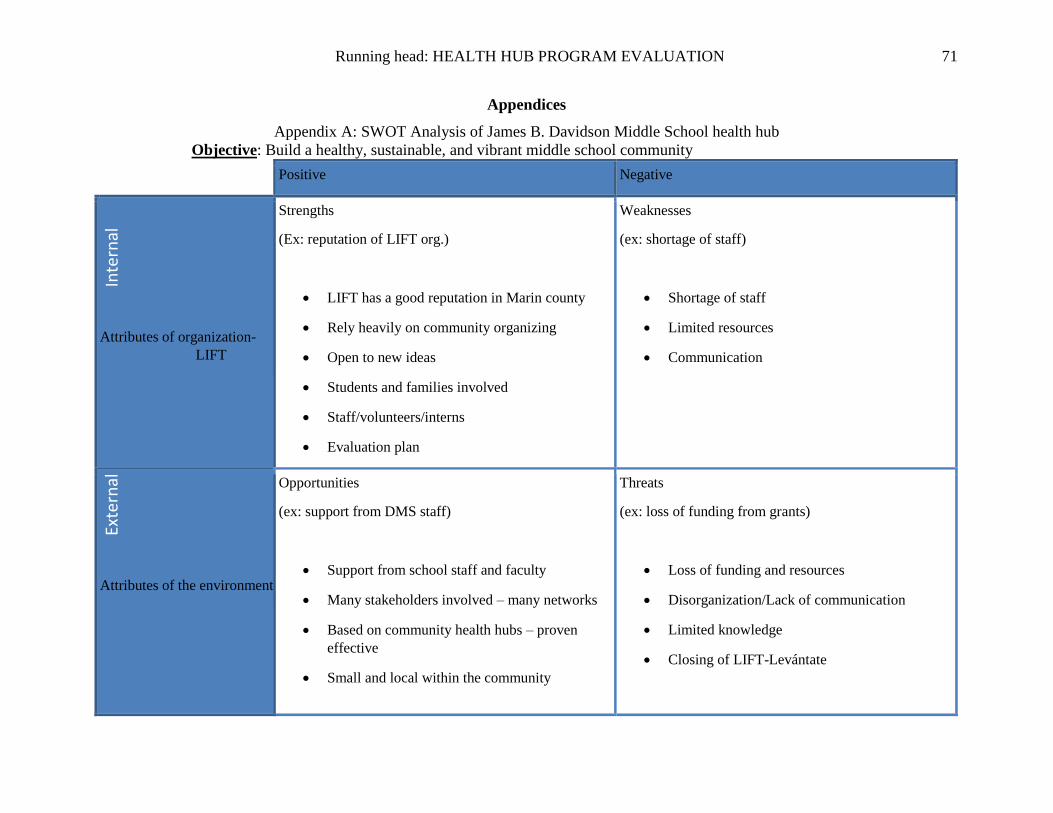
Running head: HEALTH HUB PROGRAM EVALUATION 71
Appendices
Appendix A: SWOT Analysis of James B. Davidson Middle School health hub
Objective: Build a healthy, sustainable, and vibrant middle school community
Positive Negative
Attributes of organization-
LIFT
Strengths
(Ex: reputation of LIFT org.)
LIFT has a good reputation in Marin county
Rely heavily on community organizing
Open to new ideas
Students and families involved
Staff/volunteers/interns
Evaluation plan
Weaknesses
(ex: shortage of staff)
Shortage of staff
Limited resources
Communication
Attributes of the environment
Opportunities
(ex: support from DMS staff)
Support from school staff and faculty
Many stakeholders involved – many networks
Based on community health hubs – proven
effective
Small and local within the community
Threats
(ex: loss of funding from grants)
Loss of funding and resources
Disorganization/Lack of communication
Limited knowledge
Closing of LIFT-Levántate
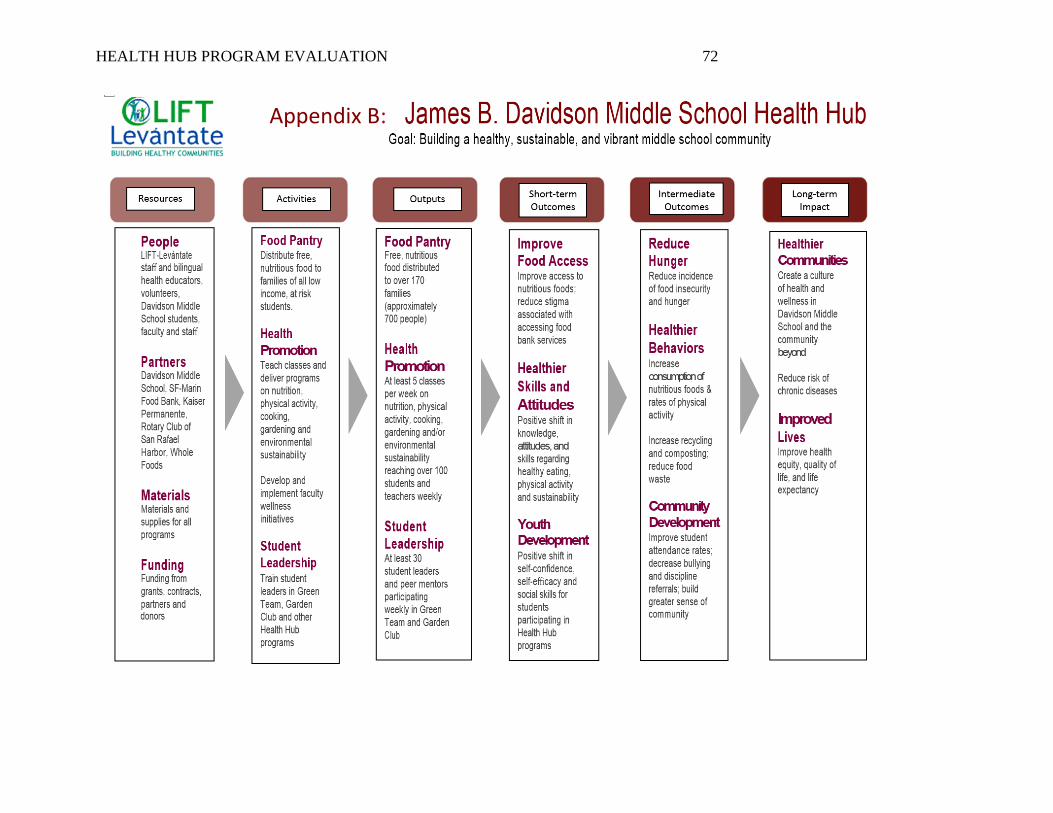
HEALTH HUB PROGRAM EVALUATION 72
Appendix B:
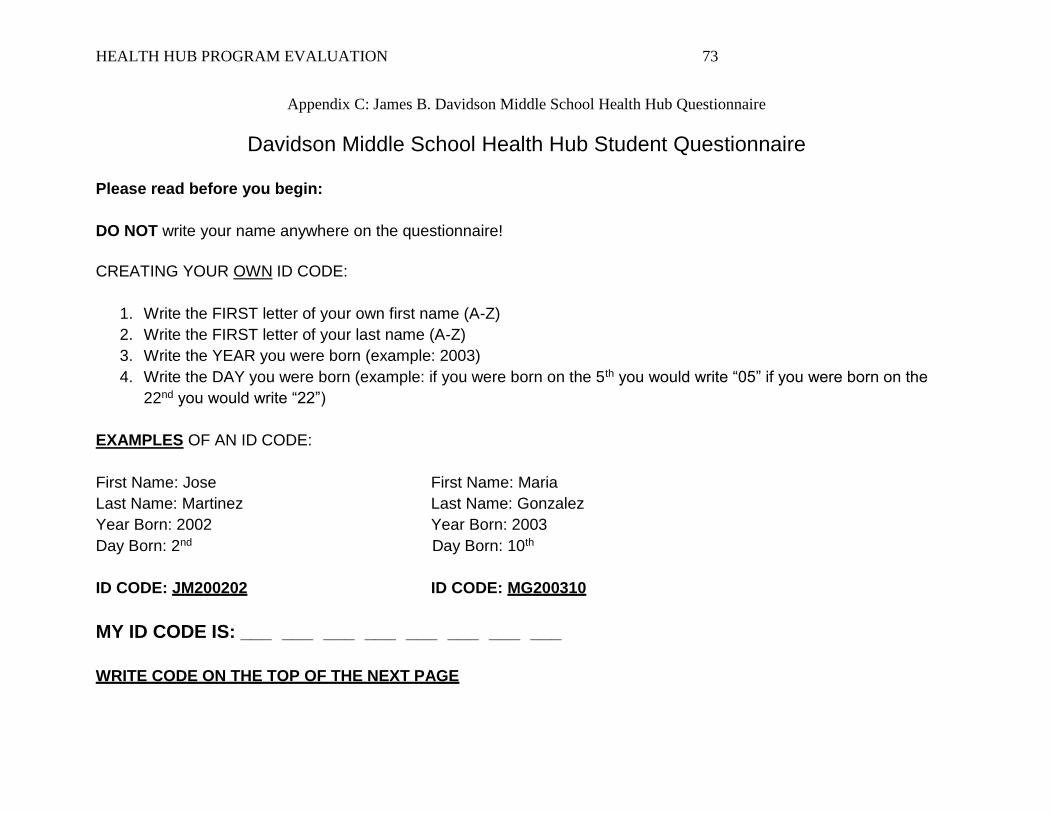
HEALTH HUB PROGRAM EVALUATION 73
Appendix C: James B. Davidson Middle School Health Hub Questionnaire
Davidson Middle School Health Hub Student Questionnaire
Please read before you begin:
DO NOT write your name anywhere on the questionnaire!
CREATING YOUR OWN ID CODE:
1. Write the FIRST letter of your own first name (A-Z)
2. Write the FIRST letter of your last name (A-Z)
3. Write the YEAR you were born (example: 2003)
4. Write the DAY you were born (example: if you were born on the 5th you would write “05” if you were born on the
22nd you would write “22”)
EXAMPLES OF AN ID CODE:
First Name: Jose First Name: Maria
Last Name: Martinez Last Name: Gonzalez
Year Born: 2002 Year Born: 2003
Day Born: 2nd Day Born: 10th
ID CODE: JM200202 ID CODE: MG200310
MY ID CODE IS: ___ ___ ___ ___ ___ ___ ___ ___
WRITE CODE ON THE TOP OF THE NEXT PAGE
HEALTH HUB PROGRAM EVALUATION 74
PLEASE TEAR THIS FIRST SHEET OFF AND SAVE YOUR ID CODE!
Davidson Middle School Health Hub Student Questionnaire1
Please read before you begin:
This questionnaire is about healthy eating and physical activity (exercise).
DO NOT write your name anywhere on the questionnaire. No one will know what you write. Please answer the questions
honestly based on what you really do, not what you think you should do. It will help us develop a better health education
program for you and your classmates.
This questionnaire is not a test. There are no right or wrong answers, just your opinion. It will not affect your grades in
school. You do not have to participate if you do not want to. If you do not want to answer a question, you can skip it.
Thank you very much for your help!
1 This survey was adapted from the CDC’s 2010 “National Youth Physical Activity and Nutrition Survey” and the California Department of Public Health’s “Compendium of Surveys
For Nutrition Education and Obesity Prevention.”
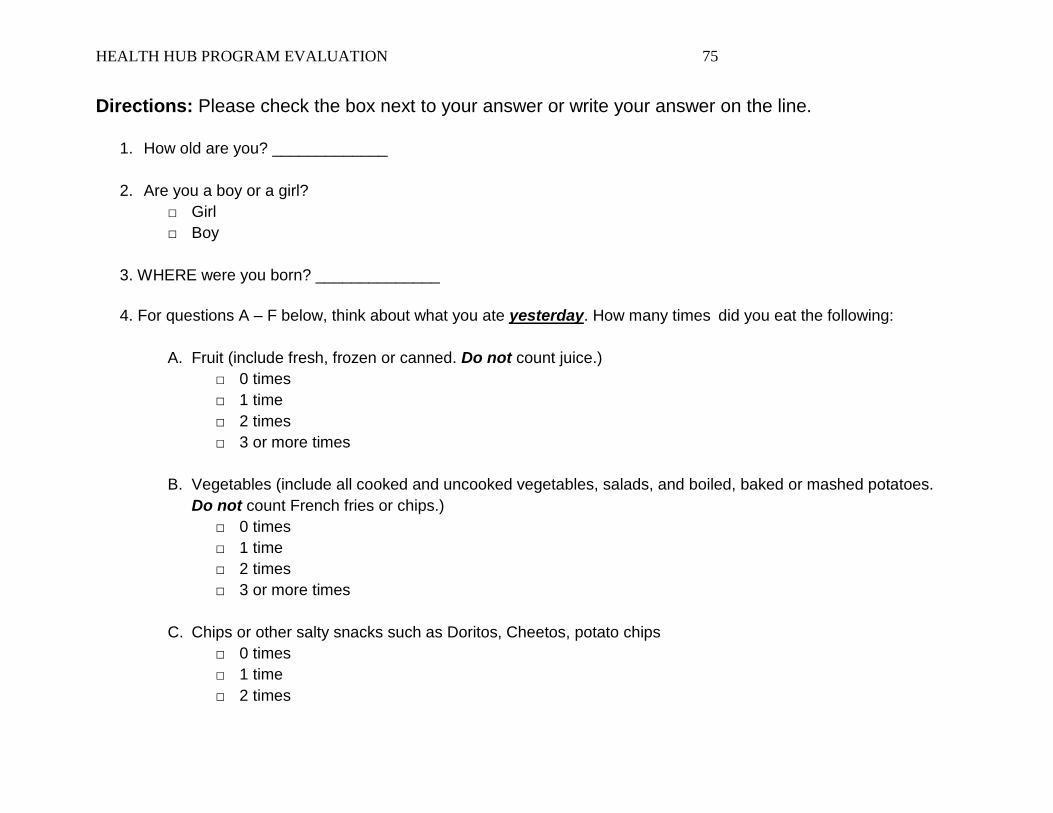
HEALTH HUB PROGRAM EVALUATION 75
Directions: Please check the box next to your answer or write your answer on the line.
1. How old are you? _____________
2. Are you a boy or a girl?
□ Girl
□ Boy
3. WHERE were you born? ______________
4. For questions A – F below, think about what you ate yesterday. How many times did you eat the following:
A. Fruit (include fresh, frozen or canned. Do not count juice.)
□ 0 times
□ 1 time
□ 2 times
□ 3 or more times
B. Vegetables (include all cooked and uncooked vegetables, salads, and boiled, baked or mashed potatoes.
Do not count French fries or chips.)
□ 0 times
□ 1 time
□ 2 times
□ 3 or more times
C. Chips or other salty snacks such as Doritos, Cheetos, potato chips
□ 0 times
□ 1 time
□ 2 times
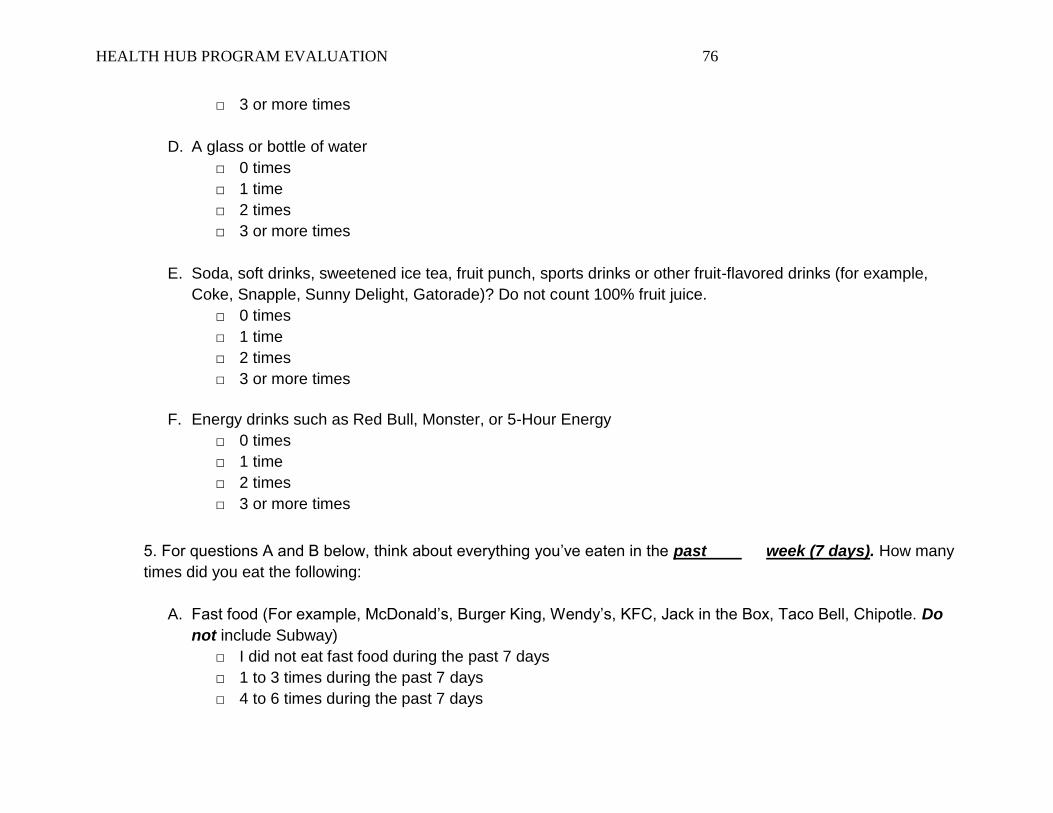
HEALTH HUB PROGRAM EVALUATION 76
□ 3 or more times
D. A glass or bottle of water
□ 0 times
□ 1 time
□ 2 times
□ 3 or more times
E. Soda, soft drinks, sweetened ice tea, fruit punch, sports drinks or other fruit-flavored drinks (for example,
Coke, Snapple, Sunny Delight, Gatorade)? Do not count 100% fruit juice.
□ 0 times
□ 1 time
□ 2 times
□ 3 or more times
F. Energy drinks such as Red Bull, Monster, or 5-Hour Energy
□ 0 times
□ 1 time
□ 2 times
□ 3 or more times
5. For questions A and B below, think about everything you’ve eaten in the past week (7 days). How many
times did you eat the following:
A. Fast food (For example, McDonald’s, Burger King, Wendy’s, KFC, Jack in the Box, Taco Bell, Chipotle. Do
not include Subway)
□ I did not eat fast food during the past 7 days
□ 1 to 3 times during the past 7 days
□ 4 to 6 times during the past 7 days
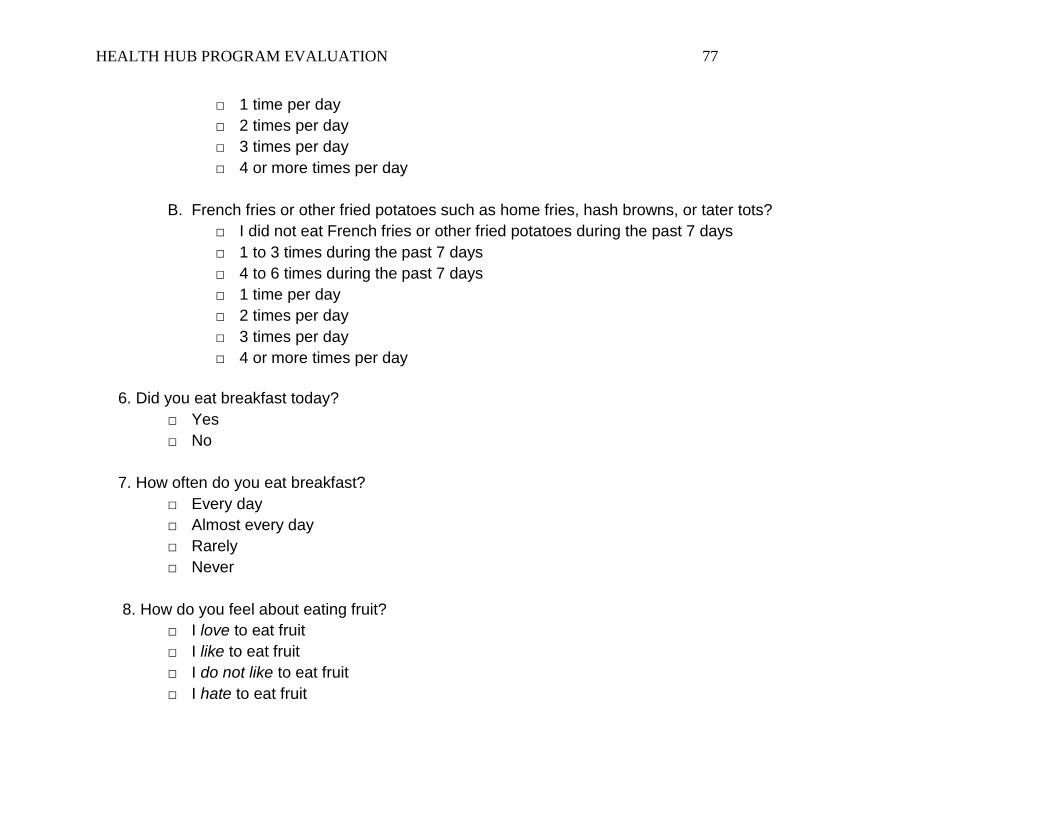
HEALTH HUB PROGRAM EVALUATION 77
□ 1 time per day
□ 2 times per day
□ 3 times per day
□ 4 or more times per day
B. French fries or other fried potatoes such as home fries, hash browns, or tater tots?
□ I did not eat French fries or other fried potatoes during the past 7 days
□ 1 to 3 times during the past 7 days
□ 4 to 6 times during the past 7 days
□ 1 time per day
□ 2 times per day
□ 3 times per day
□ 4 or more times per day
6. Did you eat breakfast today?
□ Yes
□ No
7. How often do you eat breakfast?
□ Every day
□ Almost every day
□ Rarely
□ Never
8. How do you feel about eating fruit?
□ I love to eat fruit
□ I like to eat fruit
□ I do not like to eat fruit
□ I hate to eat fruit
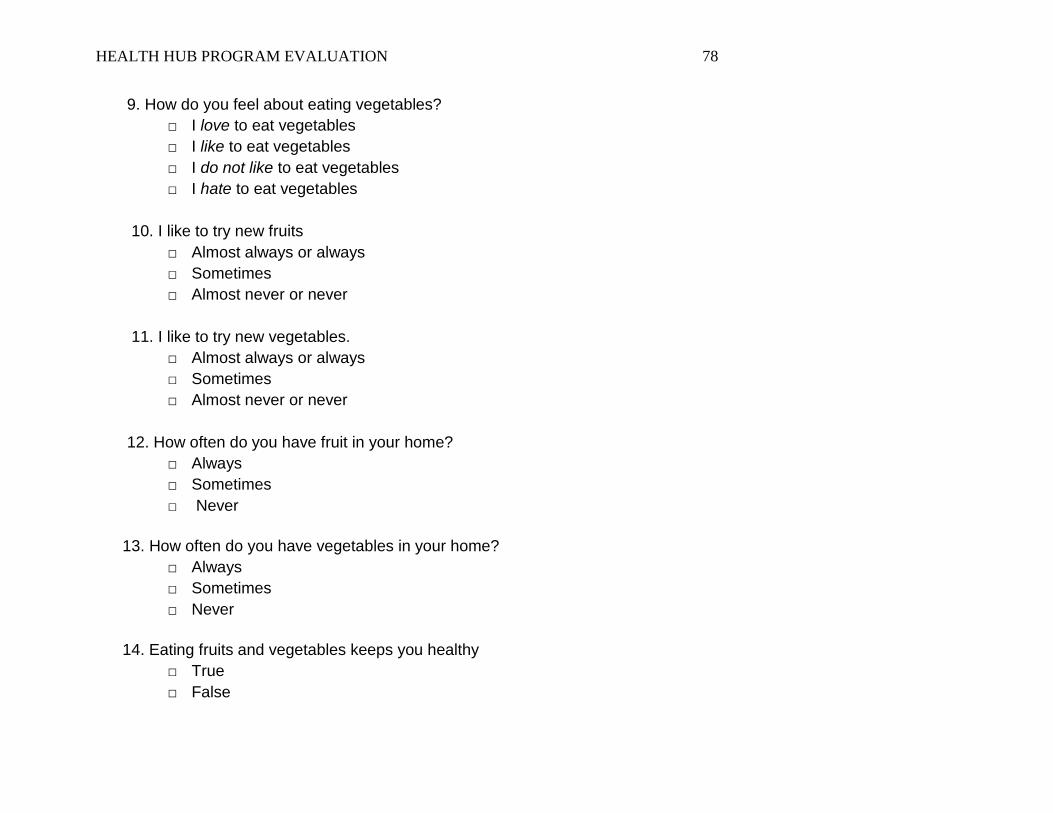
HEALTH HUB PROGRAM EVALUATION 78
9. How do you feel about eating vegetables?
□ I love to eat vegetables
□ I like to eat vegetables
□ I do not like to eat vegetables
□ I hate to eat vegetables
10. I like to try new fruits
□ Almost always or always
□ Sometimes
□ Almost never or never
11. I like to try new vegetables.
□ Almost always or always
□ Sometimes
□ Almost never or never
12. How often do you have fruit in your home?
□ Always
□ Sometimes
□ Never
13. How often do you have vegetables in your home?
□ Always
□ Sometimes
□ Never
14. Eating fruits and vegetables keeps you healthy
□ True
□ False
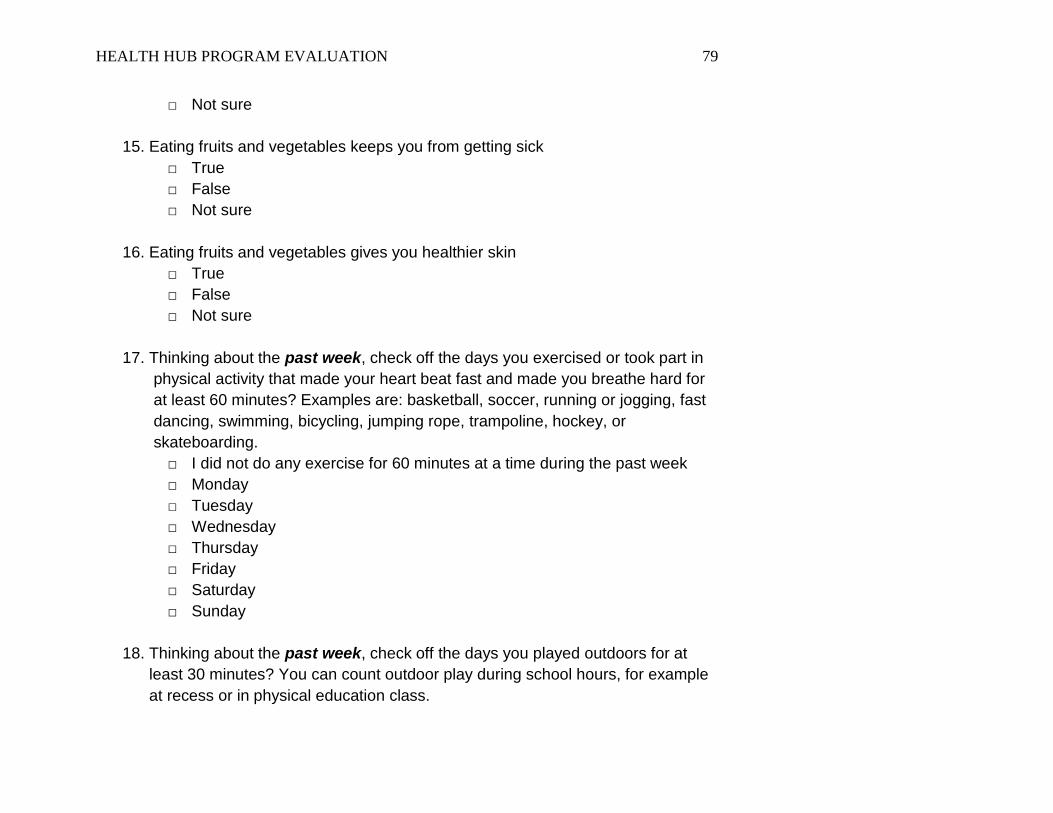
HEALTH HUB PROGRAM EVALUATION 79
□ Not sure
15. Eating fruits and vegetables keeps you from getting sick
□ True
□ False
□ Not sure
16. Eating fruits and vegetables gives you healthier skin
□ True
□ False
□ Not sure
17. Thinking about the past week, check off the days you exercised or took part in
physical activity that made your heart beat fast and made you breathe hard for
at least 60 minutes? Examples are: basketball, soccer, running or jogging, fast
dancing, swimming, bicycling, jumping rope, trampoline, hockey, or
skateboarding.
□ I did not do any exercise for 60 minutes at a time during the past week
□ Monday
□ Tuesday
□ Wednesday
□ Thursday
□ Friday
□ Saturday
□ Sunday
18. Thinking about the past week, check off the days you played outdoors for at
least 30 minutes? You can count outdoor play during school hours, for example
at recess or in physical education class.
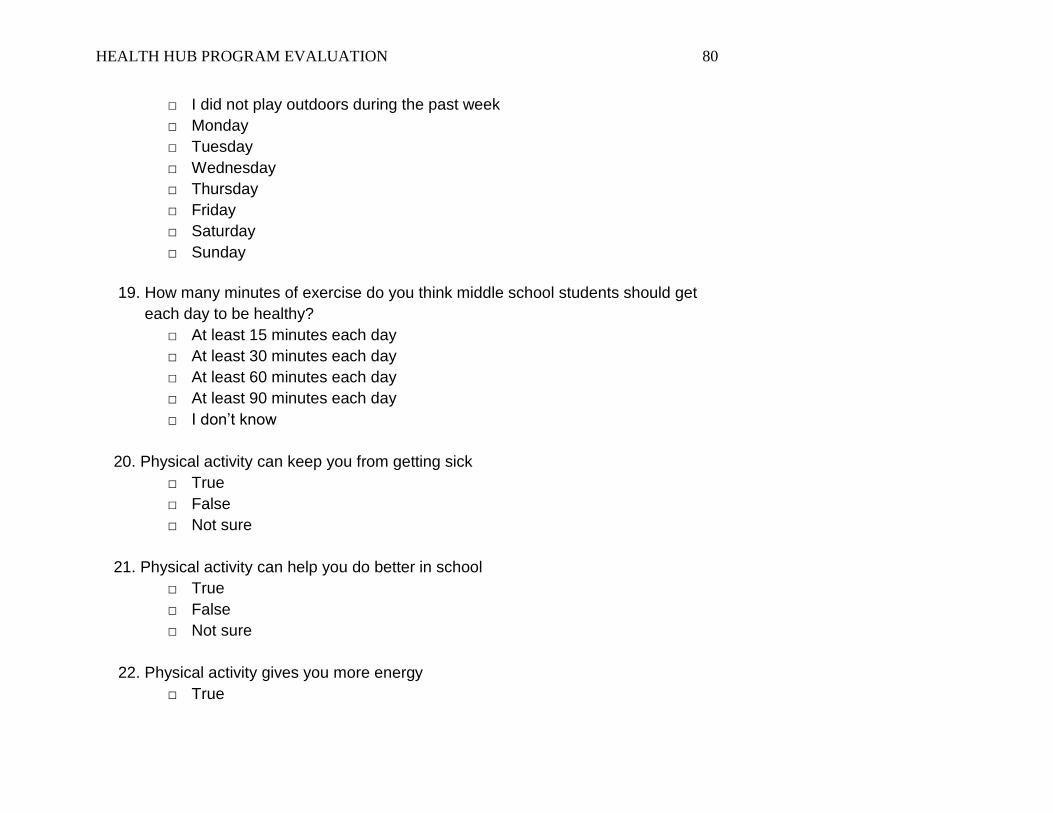
HEALTH HUB PROGRAM EVALUATION 80
□ I did not play outdoors during the past week
□ Monday
□ Tuesday
□ Wednesday
□ Thursday
□ Friday
□ Saturday
□ Sunday
19. How many minutes of exercise do you think middle school students should get
each day to be healthy?
□ At least 15 minutes each day
□ At least 30 minutes each day
□ At least 60 minutes each day
□ At least 90 minutes each day
□ I don’t know
20. Physical activity can keep you from getting sick
□ True
□ False
□ Not sure
21. Physical activity can help you do better in school
□ True
□ False
□ Not sure
22. Physical activity gives you more energy
□ True
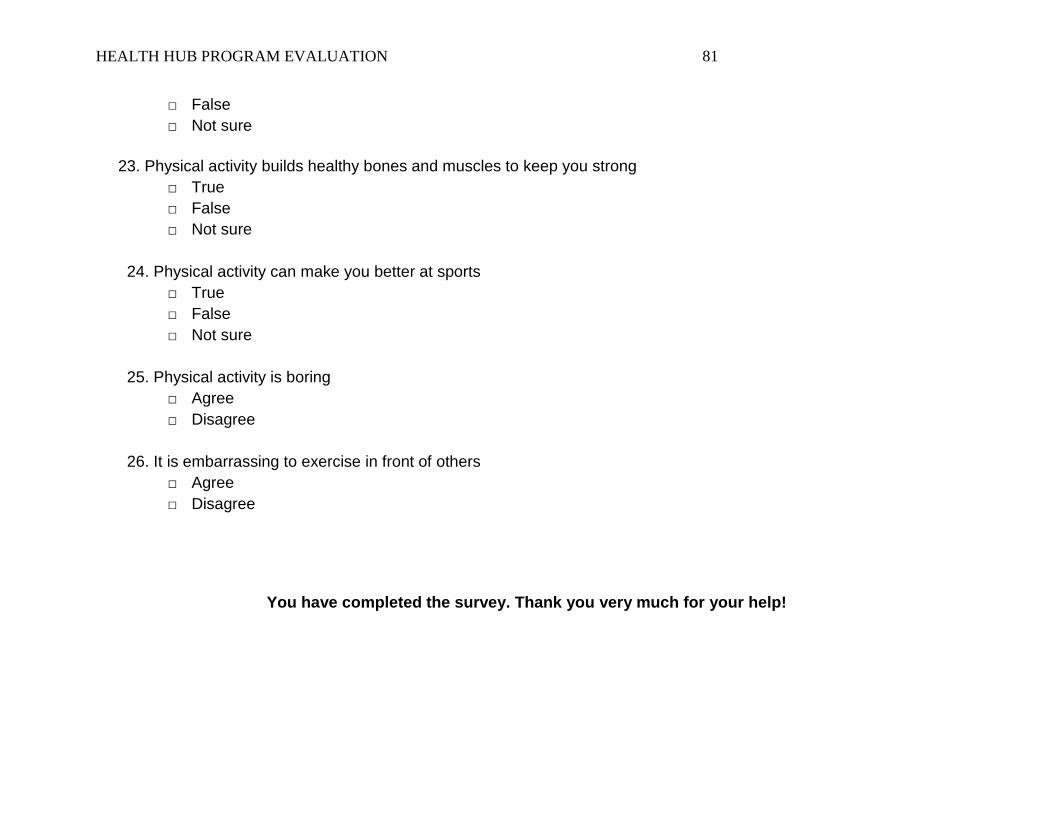
HEALTH HUB PROGRAM EVALUATION 81
□ False
□ Not sure
23. Physical activity builds healthy bones and muscles to keep you strong
□ True
□ False
□ Not sure
24. Physical activity can make you better at sports
□ True
□ False
□ Not sure
25. Physical activity is boring
□ Agree
□ Disagree
26. It is embarrassing to exercise in front of others
□ Agree
□ Disagree
You have completed the survey. Thank you very much for your help!
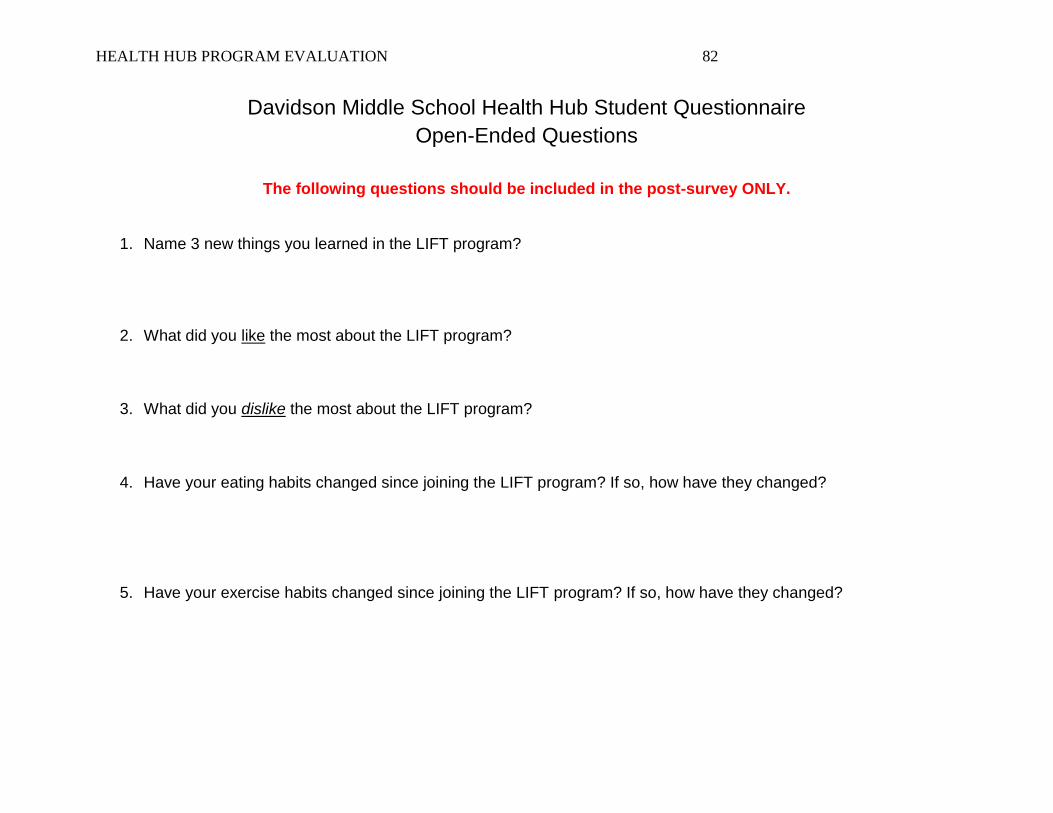
HEALTH HUB PROGRAM EVALUATION 82
Davidson Middle School Health Hub Student Questionnaire
Open-Ended Questions
The following questions should be included in the post-survey ONLY.
1. Name 3 new things you learned in the LIFT program?
2. What did you like the most about the LIFT program?
3. What did you dislike the most about the LIFT program?
4. Have your eating habits changed since joining the LIFT program? If so, how have they changed?
5. Have your exercise habits changed since joining the LIFT program? If so, how have they changed?
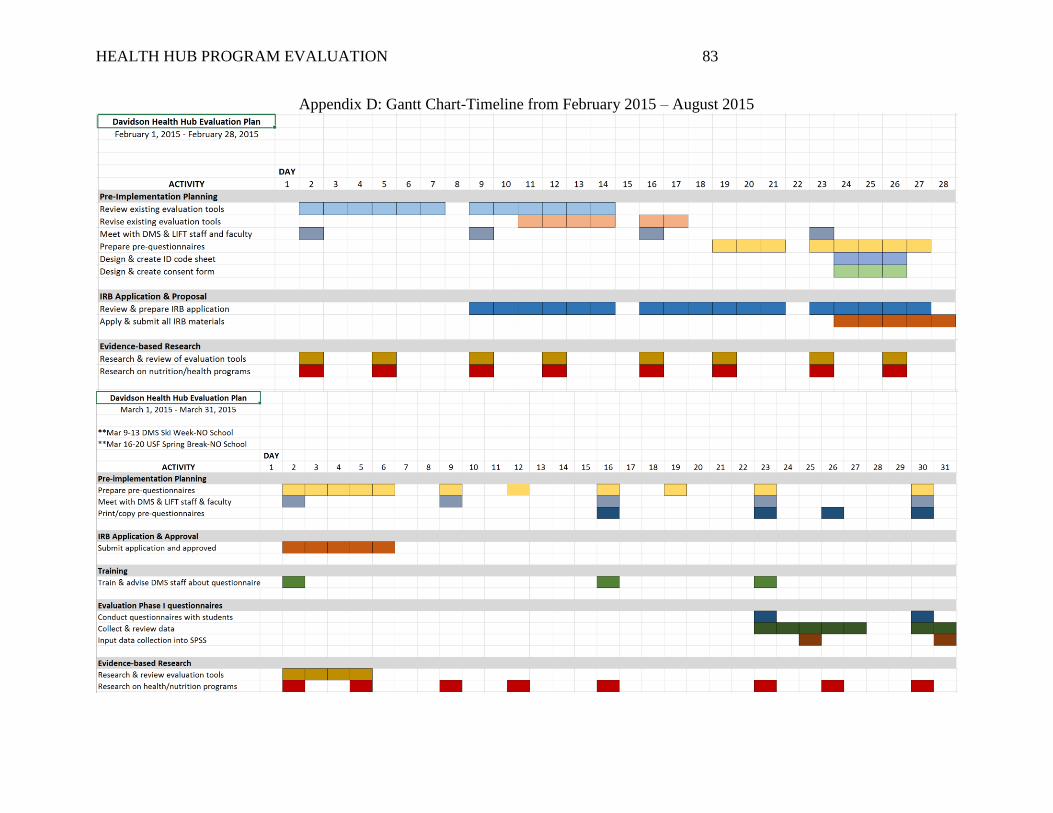
HEALTH HUB PROGRAM EVALUATION 83
Appendix D: Gantt Chart-Timeline from February 2015 – August 2015
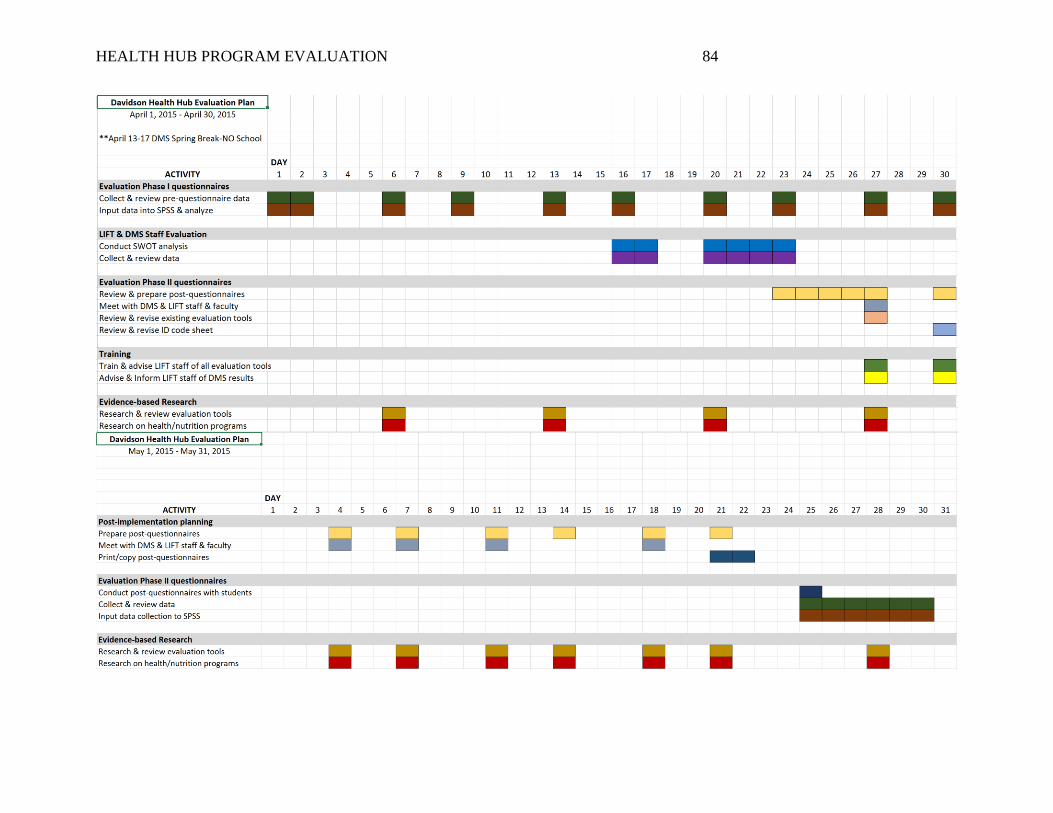
HEALTH HUB PROGRAM EVALUATION 84
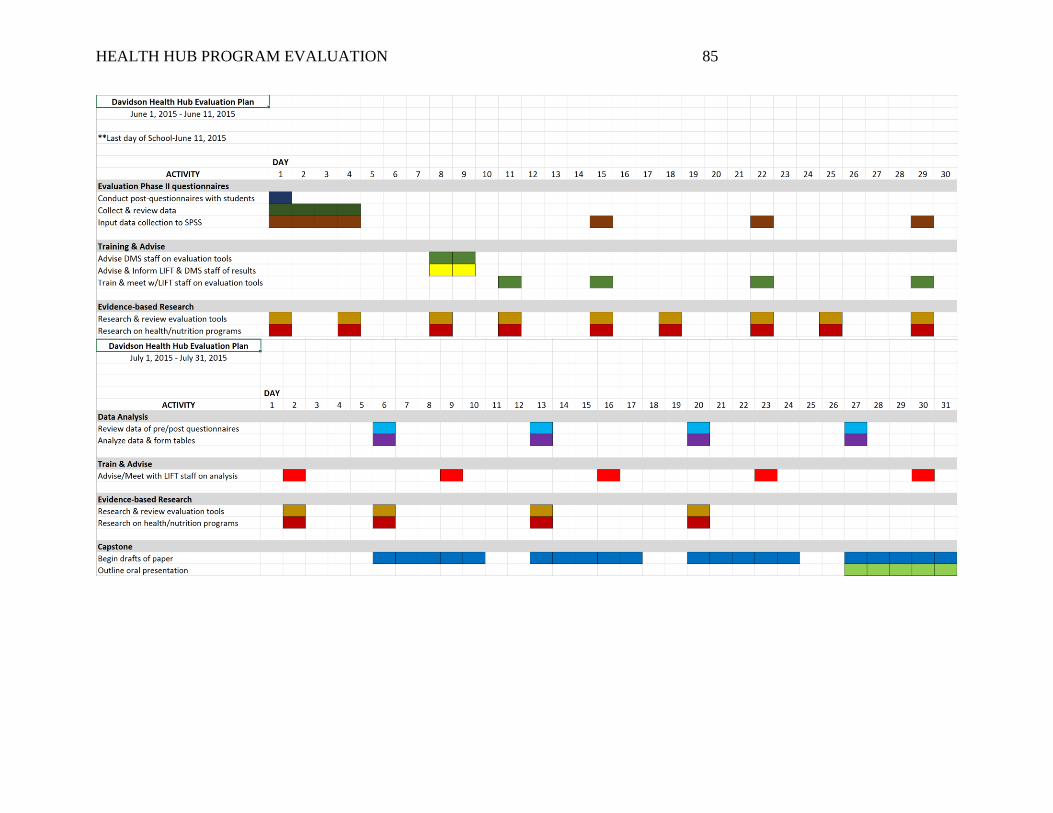
HEALTH HUB PROGRAM EVALUATION 85
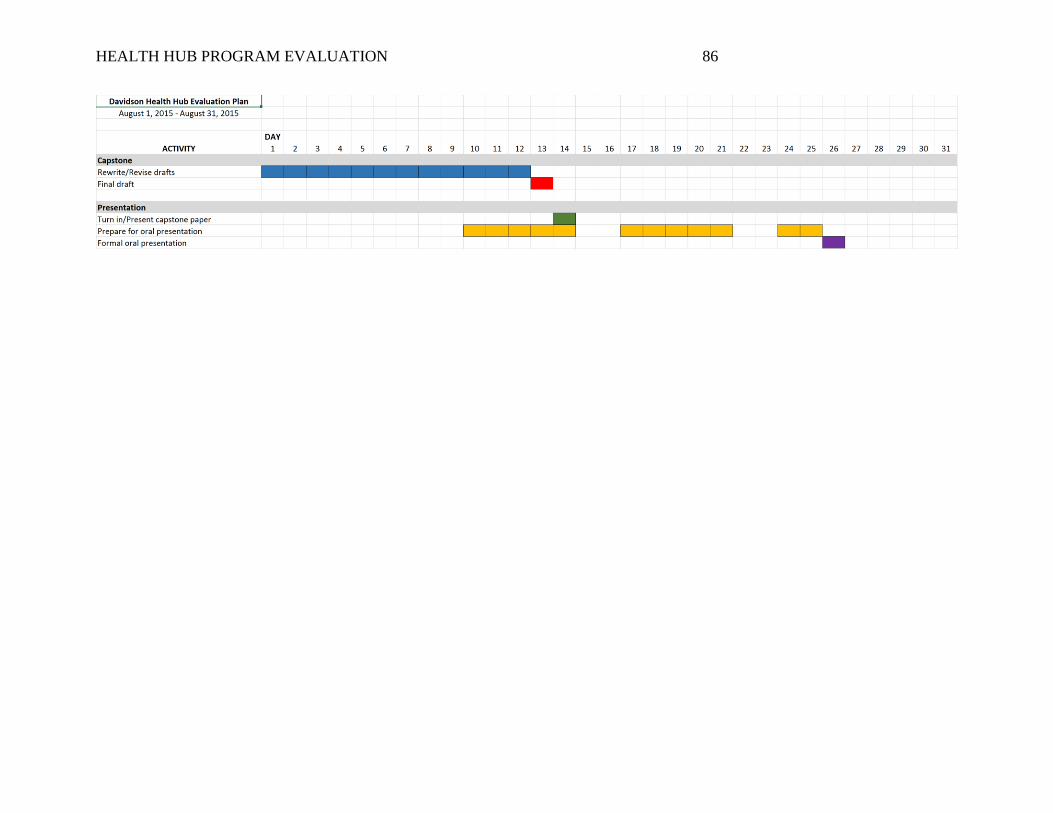
HEALTH HUB PROGRAM EVALUATION 86