Embed Size (px)
Citation preview
University of WollongongResearch Online
Faculty of Health and Behavioural Sciences - Papers(Archive) Faculty of Science, Medicine and Health
2008
Health claims and food advertising: comparison ofmarketing and nutrition experts' ratings ofmagazine advertisementsSandra C. JonesUniversity of Wollongong, [email protected]
Peter WilliamsUniversity of Wollongong, [email protected]
Linda C. TapsellUniversity of Wollongong, [email protected]
Kelly L. AndrewsUniversity of Wollongong, [email protected]
Research Online is the open access institutional repository for the University of Wollongong. For further information contact the UOW Library:[email protected]
Publication DetailsJones, S. C., Williams, P., Tapsell, L. C. & Andrews, K. L. (2008). Health claims and food advertising: comparison of marketing andnutrition experts' ratings of magazine advertisements. Food Australia, 60 (11), 526-533.

Health claims and food advertising: comparison of marketing andnutrition experts' ratings of magazine advertisements
AbstractTo determine the nature and differences in expert opinion from the fields of nutrition and marketing on theuse of health claims in the 30 most frequently appearing Australian magazine food advertisements, a surveywas conducted with 28 nutritionists and 21 marketing experts in Australia and New Zealand. The expertsassessed the advertisements with respect to the accuracy of the nutrition claims, the tactics and intentions ofthe advertising strategy and the accessibility of the nutrition information to lay consumers. Of 28advertisements where a claim was identified, for only one did more than 90% believe the claim to be accurate.Nutritionists were more likely than marketers to perceive that the target audience would identify with theadvertisement, and nutritionists more likely to perceive that the target audience would believe andmisunderstand the nutritional information provided. This research showed that experts in both nutrition andmarketing perceive that there is considerable potential for food advertising to mislead consumers.
Keywordscomparison, advertising, food, nutrition, magazine, claims, marketing, experts, health, ratings, advertisements
DisciplinesArts and Humanities | Life Sciences | Medicine and Health Sciences | Social and Behavioral Sciences
Publication DetailsJones, S. C., Williams, P., Tapsell, L. C. & Andrews, K. L. (2008). Health claims and food advertising:comparison of marketing and nutrition experts' ratings of magazine advertisements. Food Australia, 60 (11),526-533.
This journal article is available at Research Online: http://ro.uow.edu.au/hbspapers/1453
Health claims and food advertising: Comparison of marketing andnutrition experts' ratings of magazine advertisementss. C. Jones, P. Williams, L. Tapsell and K. Andrews
To determine the nature and differences in expert opinion from the fields of nutrition and marketing onthe use of health claims in the 30 most frequently appearing Australian magazine food advertisements, asurvey was conducted with 28 nutritionists and 21 marketing experts in Australia and New Zealand. Theexperts assessed the advertisements with respect to the accuracy of the nutrition claims, the tactics andintentions of the advertising strategy and the accessibility of the nutrition information to lay consumers. Of28 advertisements where a claim was identified, for only one did more than 90% believe the claim to beaccurate. Nutritionists were more likely than marketers to perceive that the target audience would identifywith the advertisement, and nutritionists more likely to perceive that the target audience would believe andmisunderstand the nutritional information provided. This research showed that experts in both nutritionand marketing perceive that there is considerable potential for food advertising to mislead consumers.
Nutrition misinformation can have harmful effectson health and wellbeing (ADA 2006). The right offood companies to promote the nutritional value oftheir products has been recognised for many years,but in many countries specific health claims forfoods are still prohibited (Hawkes 2004). Nutritionmarketing of products is widespread and severalstudies have shown that when a health claim is madefor a food product consumers view the product ashealthier and are more likely to purchase it (Ford &others 1996, Mazis & Raymond 1997, Garretson &Burton 2000). Proponents of food advertising claimsargue that consumers have a right to choose amongalternatives; however, in making those choices, they areassumed to have the capacity to make a fully informedchoice. Previous research has suggested that whileconsumers report that they are interested in nutritioninformation or claims about foods, they may lack therequisite knowledge and skills to evaluate and use thisinformation appropriately (Burton & others 1994, Roe& others 1999, Health Canada 2000).
The accuracy with which consumers can interprethealth claims has been examined in only a few studies,and has generally focused on food packages rather thanadvertising. One study of Utah shoppers examiningunderstanding of health claims for breakfast cerealsreported that only 40% of the consumers couldcorrectly interpret the health messages, with those withhigher levels of education less likely to misinterpret theclaims (Fullmer & others 1991). Andrews & others(2000) showed shoppers various labels and foundthat a claim of "healthier" resulted in a slightly morefavourable and misleading evaluation of the sodiumcontent of a canned soup. Another US study foundthat even warning statements about risk-increasingnutrients in a product (such as high sodium) wereoverlooked by a significant proportion of consumers inthe presence of a health claim (Murphy & others 1998).In contrast, other studies have found that consumershave lower perceptions of the nutritional value of foodproducts when they are provided with both nutritioninformation and a health claim, as opposed to productswith a health claim only (Mazis & Raymond 1997).
In Australia, five different surveys from 1984 to 1998all reported that magazines are the most commonly usedsource ofnutrition information among consumers (Radimer& Harvey 1995, Kellogg's 1998). Advertisements in printmedia such as magazines provide more detailed nutritioninformation about food than other advertising media andoften contain health and nutrition claims that influencepurchasing decision (Lohmann & Kant 2000). A fewstudies hav.e examined the accuracy of nutrition messagesin articles or features in magazines, and reported that thelevel of misinformation was generally low, however, thesame type of examination of nutrition claims made infood advertisements has not been undertaken (Begley &Cardwell 1996, Radimer 1996).
Purpose of the studyIt has been reported that there are significant differencesbetween expert nutritionists and consumers in attitudesto functional foods and health claims made for them(McConnon & others 2004) In general, consumers saythey are sceptical about the accuracy of such claims madeby food companies and strongly agree with the idea thathealth claims should be approved by government (Williams2005). Experts may be more aware of the processes ofregulation governing development and substantiation ofclaims in advertising, and they may feel more confidentabout making informed assessments of advertising claimsabout nutrition. Experts from fields such as dietetics andmarketing are of interest because they would have aninterest in the impact of advertising on consumers andbecause of their assumed ability to evaluate nutritionalaccuracy and identify marketing intentions respectively.A comparison of their relative views would also determinewhether the different base of their expertise resulted indifferences in their interpretations of the content and intentof the advertisements under study.
This study, an independent expert analysis of messageaccuracy and intent, was the second phase of a three-partstudy examining current healthy eating campaigns. Phase1 monitored magazine advertising of food products forsix months in the top 30 selling magazines in Australia(Williams & others 2007) and analysed the nature andextent of specific nutrition claims and more general healthmessages.
Prof Salldra JOlles, (correspol/dil/g al/thm) is Director, Celllre for Health II/itiatives, UI/ivel'sity of Wol/Ol/gOl/g, NSW 2522. A/Prof Peter Williall/s MAIFSTis with ami Prof Lil/da Tapsell MAIFST is DireccOl, SII/art Foods Cellll'e, School of Health Sciel/ces, UOW': Kelly AI/drews is Research Assislal/l, Celllre forHealth II/itiatives, UOW. Ell/ail: sal/[email protected],
I
l 526 Food Australia 60 (11) - November, 2008
· u
r~ C"~r. _ ~':' -.
The aim of the study reported here was to determinethe nature of, and differences in, expert opinion on the 30most frequently appearing magazine food advertisementsthat met the study's inclusion criteria.
Materials and methodsApproval for this study was obtained from the university'sHuman Research Ethics Committee. A conveniencesample of nutritionists and marketing experts wasrecruited during the period November 2005-January2006 to form an expert panel. Recruitment was via anemailed request for participation which was sent to themembers of the Australian and New Zealand MarketingAcademy and a list of dietitians involved with teaching orresearch activities at a multi-institutional research centreaffiliated with the university. Of the nutritionists whoresponded, 57% were community based practitioners(majority with over 20 years in the role). Theirpractical experience with consumers and consumers'understanding of nutrition information, is suggestiveof a collective professional expert opinion on the likelyinterpretation by the consumer. Similarly, all marketers(19/21 were academics) had a background in consumerbehaviour with the majority having between 10 and 20years experience.
Panel members were sent a package via postcontaining the advertisements and questionnaires. Inbrief, advertisements included were those that madespecific comments on the function or claimed effect ofthe food (or an ingredient or property of the food) onconsumer health or performance. Thus, to be included,an advertisement needed to have a clear statementthat (this product) is/contains (ingredient) and this(ingredient) has this benefit for health or wellbeing. Thepacks included a cover letter explaining the purpose ofthe study; a full-page full-colour copy of each of the 30advertisements, a set of questions for each advertisement;a reply-paid return envelope; and a form to enter acompetition to win a $250 voucher.
In terms ofaccuracy ofnutrition claims, panel memberswere asked to comment on whether the advertisementmade a nutritional claim and, for those advertisementswhich did so, whether the participant believed thatthe claim was accurate; and that the advertisementsubstantiated or provided evidence supporting the claim.In terms of advertising techniques, panel members wereasked to comment on the main focus of the advertisement;and identify the types of advertising techniques eachadvertisement used (the response format was to tick asmany boxes as applied for each advertisement). Withrespect to consumer capacity to interpret information,panel members were asked to comment on whether theythought the intended target market would (a) believe;(b) understand; or (c) misunderstand or misconstrue thenutritional information; and whether they thought thatconsumers would (a) be able to identify; and (b) trust thesponsors of the advertisements.
A total of 49 panel members (respondents) tookpart in the study: 28 nutritionists (a mixture of bothnutritionists and dietitian-nutritionists) and 21 marketers(all academics and/or practitioners with a backgroundin consumer behaviour). Three-quarters (37) of therespondents were female; 29% (14) were aged 18-34,37% (18) aged 35-44, and 35% (17) aged 45 and over.Just under half (21) described their employment role as
"academic", 35% (17) as "practitioner", and 22% (11)as "other". One quarter (12) reported that they had beenin their current profession more than 20 years, 18% (9)15-20 years, 31 % (15) 10-15 years, 18% (9) 5-10 years,and 8% (4) less than five years.
Respondents' answers to each question, for eachadvertisement, were analysed as a whole and comparativelyby expert role (ie nutritionists and marketers). Analyseswere conducted using SPSS version 13.0, and significantdifferences between expert groups in response patternswere assessed by independent sample t-tests. Throughoutthe paper, the results are presented for the panel as awhole; this is followed by a description of any differencesbetween the two groups (where there is no comparisonof the groups provided, the responses of the two groupswere not significantly different). Owing to the smallnumber of statistically significant differences between thegroups, these data are not presented in tabular form.
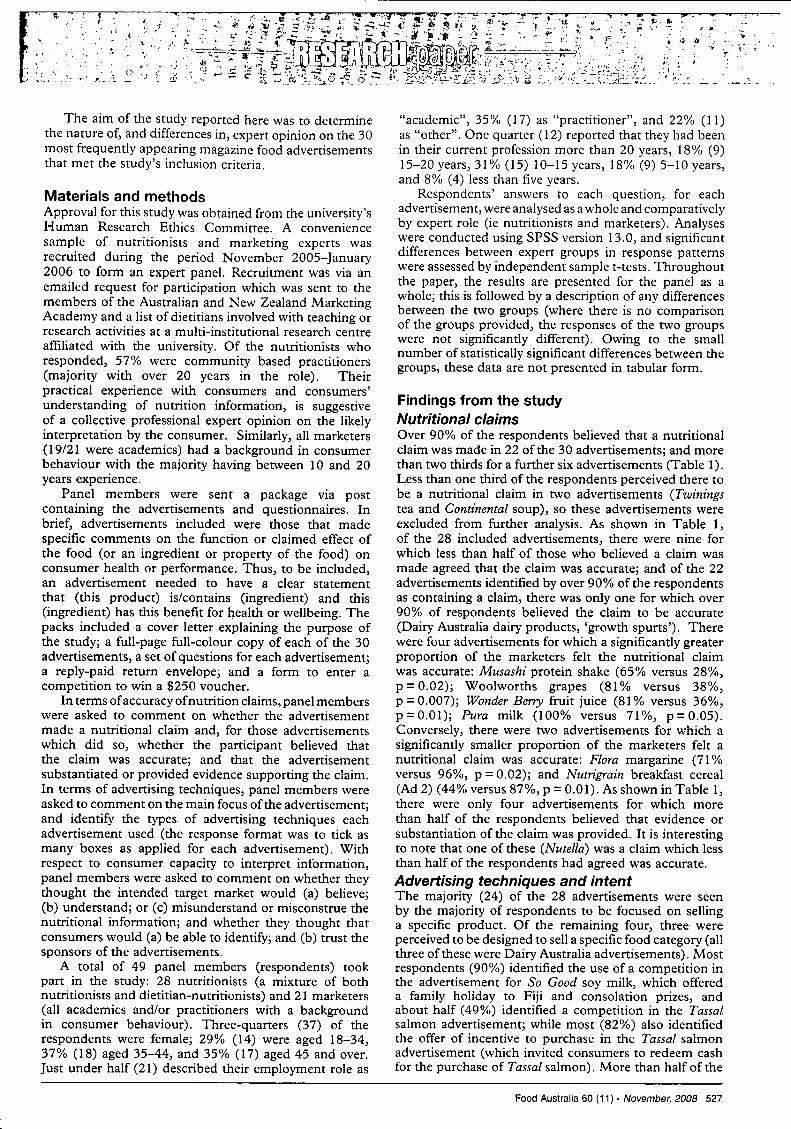
Findings from the studyNutritional claimsOver 90% of the respondents believed that a nutritionalclaim was made in 22 of the 30 advertisements; and morethan two thirds for a further six advertisements (Table 1).Less than one third of the respondents perceived there tobe a nutritional claim in two advertisements (Twiningstea and Continental soup), so these advertisements wereexcluded from further analysis. As shown in Table 1,of the 28 included advertisements, there were nine forwhich less than half of those who believed a claim wasmade agreed that the claim was accurate; and of the 22advertisements identified by over 90% of the respondentsas containing a claim, there was only one for which over90% of respondents believed the claim to be accurate(Dairy Australia dairy products, 'growth spurts'). Therewere four advertisements for which a significantly greaterproportion of the marketers felt the nutritional claimwas accurate: Musashi protein shake (65% versus 28%,p = 0.02); Woolworths grapes (81 % versus 38%,p = 0.007); Wonder Berry fruit juice (81 % versus 36%,p=O.OI); Pura milk (100% versus 71%, p=0.05).Conversely, there were two advertisements for which asignificantly smaller proportion of the marketers felt anutritional claim was accurate: Flora margarine (71 %versus 96%, p = 0.02); and Nutrigrain breakfast cereal(Ad 2) (44% versus 87%, p = 0.01). As shown in Table 1,there were only four advertisements for which morethan half of the respondents believed that evidence orsubstantiation of the claim was provided. It is interestingto note that one of these (Nutella) was a claim which lessthan half of the respondents had agreed was accurate.
Advertising techniques and intentThe majority (24) of the 28 advertisements were seenby the majority of respondents to be focused on sellinga specific product. Of the remaining four, three wereperceived to be designed to sell a specific food category (allthree of these were Dairy Australia advertisements). Mostrespondents (90%) identified the use of a competition inthe advertisement for So Good soy milk, which offereda family holiday to Fiji and consolation prizes, andabout half (49%) identified a competition in the Tassalsalmon advertisement; while most (82%) also identifiedthe offer of incentive to purchase in the Tassal salmonadvertisement (which invited consumers to redeem cashfor the purchase of Tassal salmon). More than half of the
Food Australia 60 (11) - November, 2008 527
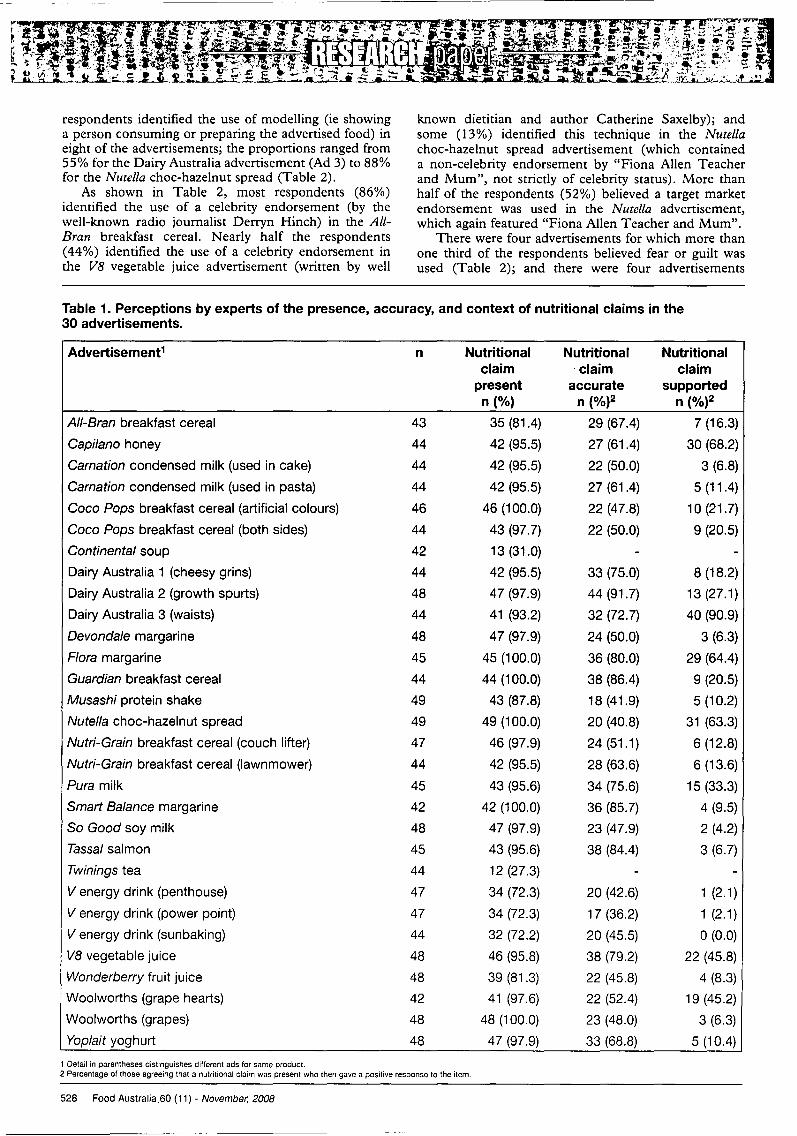
respondents identified the use of modelling (ie showinga person consuming or preparing the advertised food) ineight of the advertisements; the proportions ranged from55% for the Dairy Australia advertisement (Ad 3) to 88%for the Nutel/a choc-hazelnut spread (Table 2).
As shown in Table 2, most respondents (86%)identified the use of a celebrity endorsement (by thewell-known radio journalist Derryn Hinch) in the AI/Bran breakfast cereal. Nearly half the respondents(44%) identified the use of a celebrity endorsement inthe V8 vegetable juice advertisement (written by well
known dietitian and author Catherine Saxelby); andsome (13%) identified this technique in the Nutellachoc-hazelnut spread advertisement (which containeda non-celebrity endorsement by "Fiona Allen Teacherand Mum", not strictly of celebrity status). More thanhalf of the respondents (52%) believed a target marketendorsement was used in the Nutel/a advertisement,which again featured "Fiona Allen Teacher and Mum".
There were four advertisements for which more thanone third of the respondents believed fear or guilt wasused (Table 2); and there were four advertisements
Table 1. Perceptions by experts of the presence, accuracy, and context of nutritional claims in the30 advertisements.
Advertisement1 n Nutritional Nutritional Nutritionalclaim 'claim claim
present accurate supportedn (%) n (%)2 n (%)2
All-Bran breakfast cereal 43 35 (81.4) 29 (67.4) 7 (16.3)
Capilano honey 44 42 (95.5) 27 (61.4) 30 (68.2)
Carnation condensed milk (used in cake) 44 42 (95.5) 22 (50.0) 3 (6.8)
Carnation condensed milk (used in pasta) 44 42 (95.5) 27 (61.4) 5 (11 .4)
Coco Pops breakfast cereal (artificial colours) 46 46 (100.0) 22 (47.8) 10 (21.7)
Coco Pops breakfast cereal (both sides) 44 43 (97.7) 22 (50.0) 9 (20.5)
Continental soup 42 13(31.0) - -Dairy Australia 1 (cheesy grins) 44 42 (95.5) 33 (75.0) 8 (18.2)
Dairy Australia 2 (growth spurts) 48 47 (97.9) 44 (91.7) 13 (27.1)
Dairy Australia 3 (waists) 44 41 (93.2) 32 (72.7) 40 (90.9)
Devondale margarine 48 47 (97.9) 24 (50.0) 3 (6.3)
Flora margarine 45 45 (100.0) 36 (80.0) 29 (64.4)
Guardian breakfast cereal 44 44 (100.0) 38 (86.4) 9 (20.5)
Musashi protein shake 49 43 (87.8) 18 (41.9) 5 (10.2)
Nutella choc-hazelnut spread 49 49 (100.0) 20 (40.8) 31 (63.3)
Nutri-Grain breakfast cereal (couch lifter) 47 46 (97.9) 24 (51.1) 6 (12.8)
Nutri-Grain breakfast cereal (lawnmower) 44 42 (95.5) 28 (63.6) 6 (13.6)
Pura milk 45 43 (95.6) 34 (75.6) 15 (33.3)
Smart Balance margarine 42 42 (100.0) 36 (85.7) 4 (9.5)
So Good soy milk 48 47 (97.9) 23 (47.9) 2 (4.2)
Tassal salmon 45 43 (95.6) 38 (84.4) 3 (6.7)
Twinings tea 44 12 (27.3) - -V energy drink (penthouse) 47 34 (72.3) 20 (42.6) 1 (2.1)
V energy drink (power point) 47 34 (72.3) 17 (36.2) 1 (2.1)
V energy drink (sunbaking) 44 32 (72.2) 20 (45.5) 0(0.0)
VB vegetable juice 48 46 (95.8) 38 (79.2) 22 (45.8)
Wonderberry fruit juice 48 39 (81.3) 22 (45.8) 4 (8.3)
Woolworths (grape hearts) 42 41 (97.6) 22 (52.4) 19 (45.2)
Woolworths (grapes) 48 48 (100.0) 23 (48.0) 3 (6.3)
Yoplait yoghurt 48 47 (97.9) 33 (68.8) 5 (10.4)
1 Detail in parentheses distinguishes different ads for same product.2 Percentage of those agreeing that a nutritional claim was present who then gave a positive response to the item,
528 Food Australia ,60 (11) . November, 2008

~8.:l>c:ttl
~iii'C1lo~
~
~iii30III.-'
~U1I\)<0
Table 2. Perceptions by experts of the utilisation of advertising/marketing techniques used in 28 magazine food advertisements.
Advertisement1 n Celebrity Target market Fear/guilt Humour Symbols EndorsingModelling endorsement endorsement used used used organisation
n (%) n (%) n (%) n (%) n (%) n (%) n(%)
All-Bran 44 18 (40.9) 38 (86.4) 8 (18.2) 3 (6.8) 12 (27.3) 1 (2.3) 1 (2.3)
Capilano 44 21 (47.7) 1 (2.3) 1 (2.3) 17 (38.6) 3 (6.8) 9 (20.5) 11 (25.0)Carnation (used in cake) 44 35 (79.6) 0(0.0) 1 (2.3) 8 (18.2) 8 (18.2) 0(0.0) 0(0.0)Carnation (used in pasta) 44 34 (77.3) 0(0.0) 1 (2.3) 10 (22.7) 8 (18.2) 0(0.0) 0(0.0)Coco Pops 1 (artificial colours) 46 17 (37.0) 1 (2.2) 2 (4.4) 10(21.7) 10 (21.7) 2 (4.4) 0(0.0)
Coco Pops 2 (both sides) 44 17 (38.6) 0(0.0) 2 (4.6) 12 (27.3) 7 (15.9) 0(0.0) 0(0.0)Dairy Australia 1 (cheesy grins) 44 30 (68.2) 1 (2.3) 4 (9.1) 13 (29.6) 7 (15.9) 4 (9.1) 7 (15.9)Dairy Australia 2 (growth spurts) 48 29 (60.4) 0(0.0) 4 (8.3) 22 (45.8) 2 (4.2) 6 (12.5) 12 (25.0)Dairy Australia 3 (waists) 44 24 (54.6) 1 (2.3) 2 (4.6) 4 (9.1) 3 (6.8) 3 (6.8) 18(40.1)
Devonda/e 48 5 (10.4) 0(0.0) 1 (2.1) 8 (16.7) 28 (58.3) 4 (8.3) 3 (6.3)Flora 45 19 (42.2) 0(0.0) 3 (6.7) 19 (42.2) 6 (13.3) 5 (11.1) 23 (51.1)
Guardian 45 17 (37.8) 1 (2.2) 2 (4.4) 15(33.3) 7 (15.6) 3 (6.7) 21 (46.7)
Musashi 49 22 (44.9) 0(0.0) 2 (4.1) 0(0.0) 1 (2.0) 7 (14.3) 1 (2.0)
Nutella (breakfast) 48 42 (87.5) 6 (12.5) 25 (52.1) 9 (18.8) 1 (2.1) 36 (75.0) 6 (12.5)
Nutri-Grain (couch lifter) 47 19 (40.4) 1 (2.1) 10 (21.3) 8 (17.0) 34 (72.3) 0(0.0) 0(0.0)Nutri-Grain (lawnmower) 44 22 (50.0) 1 (2.3) 6 (13.6) 7 (15.9) 25 (56.8) 0(0.0) 0(0.0)
Pura 44 14 (31.8) 0(0.0) 0(0.0) 17 (38.6) 3 (6.8) 0(0.0) 2 (4.6)
Smart Balance 44 14 (31.8) 0(0.0) 3 (6.8) 11 (25.0) 0(0.0) 2 (4.6) 12 (27.3)
So Good 48 19 (39.6) 0(0.0) 1 (2.1) 3 (6.3) 0(0.0) 17 (35.4) 4 (8.3)
Tassal 45 4 (8.9) 0(0.0) 1 (2.2) 5 (11.1) 0(0.0) 2 (4.4) 5 (11.1)
V (penthouse) 48 14 (29.2) 2 (4.2) 6 (12.5) 13 (27.1) 28 (58.3) 0(0.0) 0(0.0)
V (power point) 48 16 (33.3) 1 (2.1) 10(20.8) 13 (27.1) 24 (50.0) 0(0.0) 0(0.0)
V (sunbaking) 45 17 (37.8) 1 (2.2) 8 (17.8) 10(22.2) 28 (62.2) 0(0.0) 0(0.0)
V8 48 34 (70.8) 21 (43.8) 4 (8.3) 12 (25.0) 1 (2.1) 1 (2.1) 9 (18.8)
Wonderberry 48 19 (39.6) 1 (2.1) 8 (17.8) 2 (4.2) 0(0.0) 2 (4.2) 6 (12.5)
Woolworths (grape hearts) 42 17 (40.5) 0(0.0) 1 (2.4) 13. (31.0) 1 (2.4) 0(0.0) 20 (47.6)
Woolworths (grapes) 48 23 (47.9) 0(0.0) 1 (2.1) 12 (25.0) 3 (6.3) 2 (4.2) 1 (2.1)
Yoplait 48 41 (85.4) 0(0.0) 12 (25.0) 9 (18.8) 2 (4.2) 2 (4.2) 1 (2.1)I Delail in parentheses distinguishes different ads for same product.
. .. "1' . - ~ '.', .
i'
.::~ s",~ 1.'";.?o
(-0,
'.... ~ ~ ,,3:" (It,
\'? 1_ " ,~ • ~..;_.
~:
~.~ ,';, IJ
"J""';~) .. '-l~ ~.
P :"1 ' ...
. ,• \ t t ".. ~ \.

for which a significantly greater proportion of thenutritionists than the marketers identified that fear orguilt was used (Devondale margarine, 26% versus 5%,p =0.05; Dairy Australia (Ad 2), 59% versus 29%,p =0.03; Coco Pops breakfast cereal (Ad 1), 35%versus 5%, p = 0.02; Capilano honey, 52% versus 21 %,p =0.04). More than half of the respondents identifiedthe use of humour in five advertisements (Table 2).There were three advertisements for which a significantlysmaller proportion of the nutritionists than the marketersidentified the use of humour (Coco Pops breakfast cereal(Ad 1), 8% versus 40%, p =0.008; p =0.03; Pura milk,0% versus 15%, p =0.05; Capilano honey, 0% versus16%, p =0.04); and one for which the reverse was thecase (Flora, 76% versus 50%, p =0.03). Two of theadvertisements perceived by a greater proportion ofnutritionists to contain fear or guilt were the same asthose perceived by more of the marketers to containhumour (Coco Pops breakfast cereal (Ad 1) and Capilanohoney).
Most of the respondents (75%) reported that asymbol was used in the Nutella choc-hazelnut spreadadvertisement (Table 2), in this case the Glycemic IndexLtd symbol. Just over one third (35%) reported that asymbol was used in the So Good soy milk advertisement(which contained logos of two supermarkets), and 21 %reported the use of a symbol in the Capilano honeyadvertisement (in this case the use of a red circular tickwhich is very similar to the Heart Foundation Tick).There was one advertisement for which a significantlysmaller proportion of the nutritionists than the marketersfelt that a symbol was used (Dairy Australia (Ad 2),4% versus 24%, p =0.04). Just over half (51 %) of therespondents identified an endorsing organisation in theFlora margarine advertisement, and slightly less thanhalf in the Guardian breakfast cereal and Woolwonhsgrape (Ad 2) (Table 2). There were two advertisementsfor which a significantly greater proportion of thenutritionists than the marketers felt that an endorsingorganisation was used (Guardian breakfast cereal, 60%versus 30%, p =0.05; Smart Balance margarine, 44%versus 5%, p =0.004).
Impact on consumers.The majority of respondents indicated that they believedthe target market would identify with each of theadvertisements, ranging from 69% for the Musashiprotein shake to 100% for the Devondale margarineadvertisement (Table 3). There was a clear trendtowards nutritionists being more likely than marketersto perceive that the target audience would identifywith the advertisement, statistically significant for sixadvertisements (Musashi protein shake, 86% versus 53%,p =0.01; Dairy Australia (Ad 2), 100% versus 86%,p =0.04; Woolworths grapes (Ad 1), 92% versus 65%,p =0.03; Wonderberry fruit juice, 96% versus 55%,p =0.006; and Smart Balance margarine, 96% versus 74%,p =0.04). For all of the advertisements, well over half ofthe respondents were of the view that the target marketwould believe the nutritional information provided, withover 90% holding this view for 15 of the advertisementsand over 80%, for an additional nine (Table 3). The twoadvertisements whose nutritional claims were perceivedto be least believable for the target audience were the twoCoco Pops breakfast cereal advertisements, although thesestill received an affirmative response from 64% to 66% of
530 Food Australia 60 (11) - November, 2008
the respondents. Again, there was a clear trend towardsnutritionists being more likely than marketers to perceivethat the target audience would believe the nutritionalinformation provided, which was statistically significantfor four advertisements (Musashi protein shake, 100%versus 78%, p = 0.01; Nutrigrain breakfast cereal (Ad 1),96% versus 76%, p = 0.04; Nutrigrain (Ad 2), 100%versus 85%, p =0.05; and Dairy Australia (Ad 3), 88%versus 63%, p =0.05).
For all of the advertisements, over half of therespondents were of the view that the target marketwould be able to understand the nutritional information.The advertisements whose nutritional information wasperceived to be least understandable to the target marketwere those for Nutella choc-hazelnut spread, Musashiprotein shake, Woolwonhs two grape promotions, andSo Good soy milk. There was a clear trend towardsnutritionists being less likely than marketers to perceivethat the target audience would understand the nutritionalinformation provided, which was statistically significant forfour advertisements (Nutella, 50% versus 81 %, p = 0.03;Flora margarine, 63% versus 85%, p =0.09; Capilanohoney, 65% versus 95%, p =0.02; and Woolworths grapes(Ad 2), 42% versus 79%, p = 0.01).
Conversely, for 19 of the 28 advertisements,over half of the respondents indicated that there waspotential for the target market to misconstrue ormisunderstand the nutritional information provided.The advertisements seen to be most likely to resultin consumer misunderstanding were Musashi proteinshake, Nutella choc-hazelnut spread, and the two CocoPops breakfast cereal advertisements. Consistent withthe previous finding that nutritionists were less likely tobelieve that consumers would understand the nutritionalinformation, they tended to be more likely than marketersto perceive that the target audience would misconstrueor misunderstand the nutritional information, althoughthis difference was only statistically significant for twoadvertisements (Wonderberry fruit juice, 65% versus30%, p =0.04; Capilano honey, 87% versus 53%,p =0.01).
Overall the respondents were of the view that thetarget market would be able to identify the sponsoror advertiser, with more than two thirds answering'yes' to this question for all advertisements. Funher,the majority supported the view that the target marketwould trust nutritional information from the sponsors/advertisers. The advertisers perceived to be least trustedby consumers included Wonderberry fruit juice, SmartBalance margarine, Nutella choc-hazelnut spread, CocoPops breakfast cereal, and Woolworths grapes. Thecomparison between the expert groups showed somedivision in relation to perceptions that consumers wouldbe able to identify the sponsors, with a significantly smallerproportion of nutritionists than marketers believing thisto be the case for two advertisements (So Good milk, 19%versus 50%, p =0.02; and V energy drink (Ad 2), 68%versus 95%, p = 0.02); but the reverse for two others(Dairy Australia (Ad 1), 92% versus 68%, p = 0.05;and Dairy Australia (Ad 3), 92% versus 63%, p =0.02).However, there was a trend for a greater proportion ofnutritionists than marketers to perceive that consumerswould trust nutritional information from the sponsors,statistically significant for Musashi protein shake, 91 %versus 58%, p =0.01; Dairy Australia (Ad 2), 100%versus 85%, p =0.04; and V energy drink (Ad 3), 95%versus 74%, p =0 .05.

Discussion
Ambiguity in categorisation of advertisements ascontaining nutrition claimsThe advertisements under study were those identified ina sample of magazines reviewed in a defined period bythe nutrition experts in the research team that met theinclusion criterion of "a clear statement that: (this product)is/contains (ingredient) and (ingredient) has this benefit forhealth or wellbeing". The fact that the expert panels did notidentify nutrition claims in two of these advertisements wasthe first sign of variation in difference of opinion that wasto emerge throughout the study (and perhaps reflects thedifference between our categorical definition and the moreoperational definitions utilised by the respondents).
'" ~ o' -'::-' r...J.S? .' ".
Need for multidisciplinary approach to
research and policyAn important implication of this study both forfuture research in this area and for considerationin development of policy is the differences betweenand within the two groups of experts in relation tosome key components of the nutrition-related claimsand, indeed, the advertisements themselves. It is,unfortunately, often the case that researchers limitthemselves to collaborating with colleagues in theirown field (and reading the literature in their field),which potentially limits their capacity to develop a fullunderstanding of the likely consumer impact of foodadvertising messages.
Table 3. Perceptions by experts in relation to potential consumer (mis)understanding of the claims in28 magazine food advertisements.
Advertisement1 n Target Target Target Target marketmarket market market misunderstand
identify with believe understand or misconstruen (%) n (%) n (%) n (%)
All-Bran 42 37 (88.1) 38 (90.5) 39 (92.9) 12 (28.6)
Capilano 41 40 (97.6) 39 (95.1) 33 (80.5) 30 (73.2)
Carnation (used in cake) 43 41 (95.3) 33 (76.7) 29 (67.4) 28 (65.1)
Carnation (used in pasta) 42 40 (95.2) 36 (85.7) 34 (81.0) 23 (54.8)
Coco Pops (artificial colours) 42 39 (92.8) 27 (64.3) 35 (83.3) 33 (78.6)
Coco Pops (both sides) 41 37 (90.2) 27 (65.9) 33 (80.5) 32 (76.2)
Dairy Australia 1 (cheesy grins) 43 40 (93.0) 42 (97.7) 40 (93.0) 11 (25.6)
Dairy Australia 2 (growth spurts) 47 44 (93.6) 45 (95.8) 45 (95.8) 8 (17.0)
Dairy Australia 3 (waists) 44 40 (90.9) 34 (77.3) 39 (88.6) 15 (34.1)
Devondale 46 46 (100.0) 45 (97.8) 37 (80.4) 30 (65.2)
Flora 43 42 (97.7) 42 (97.7) 32 (74.4) 18 (41.9)
Guardian 45 41 (91.1) 44 (97.8) 36 (80.0) 19 (42.2)
Musashi 43 30 (69.8) 39 (90.7) 26 (60.5) 35 (81.4)
Nutella (breakfast) 45 44 (97.8) 39 (86.7) 30 (66.7) 36 (80.0)
Nutri-Grain (couch lifter) 47 44 (93.6) 41 (87.2) 41 (87.2) 27 (57.5)
Nutri-Grain (lawnmower) 44 42 (95.2) 41 (93.2) 38 (86.4) 26 (59.1)
Pura 42 39 (92.8) 40 (95.2) 35 (83.3) 15 (35.7)
Smart Balance 41 35 (85.4) 39 (95.1) 29 (70.7) 28 (68.3)
So Good 44 42 (95.4) 37 (84.1) 30 (68.2) 28 (63.6)
Tassal 44 35 (79.5) 39 (88.6) 34 (77.3) 12 (27.3)
V (penthouse) 44 41 (93.2) 39 (88.6) 37 (84.1) 26 (59.1)
V (power point) 44 42 (95.4) 40 (90.9) 39 (88.6) 30 (68.2)
V (sunbaking) 41 39 (95.1) 38 (92.7) 37 (90.2) 26 (63.4)
VB 47 40 (85.1) 46 (97.9) 42 (89.4) 19 (40.4)
Wonderberry 44 34 (77.3) 38 (86.4) 34 (77.3) 23 (52.3)
Woolworths (grape hearts) 43 37 (86.0) 36 (83.7) 25 (58.1) 25 (58.1)
Woolworths (grapes) 43 34 (79.1) 36 (83.7) 31 (72.1) 28 (65.1)
Yoplait 46 45 (97.8) 45 (97.8) 38 (82.6) 24 (52.2)
1 Detail in parentheses distinguishes different ads for same product.
Food Australia 60 (11) - November, 2008 531

While this research indicated that nutritionists andmarketers generally agreed in their identification ofthe presence of nutrition-related claims in the sampleadvertisements, and in perceptions that the presence ofevidence statements to substantiate these claims was low(Table 1), there were differences in perceptions of theaccuracy of the claims made in the advertisements. Wherethe attribute was general (presence of claim, evidencebase) there was good consensus and little differencebetween groups. However, where a value judgementon the nutritional issues is drawn on (acceptability ofclaims) the groups diverged, which could be expectedgiven that these judgements are based on different expertknowledge bases.
The observed difference between expert groups indetermining advertising techniques and marketing intentmight also reflect the different ways in which thesegroups respond to information, based on their disciplinebackground; that is, while nutritionists were hypothesisedto be more familiar with the evidence for nutritionalclaims, marketers may be more familiar with the differenttechniques and strategies and more experienced atidentifying their presence.
The differences between groups in responses tothe use of symbols and endorsing agents may reflectdifferent exposure to and experience with these practices(Table 2). For example, nutritionists are involved instandards setting and have the professional trainingthat enables them to differentiate between symbols, aswell as between foods/agents that meet these standardsand/or have the authorisation to use these symbols. Thedifference in attribution of humour may also reflect thedifferent discipline bases of the two expert groups. Forexample, nutritionists' attribution of fear or guilt tacticsto product advertising where total energy (calories) or fatare highlighted could be a function of their knowledgeof the effects of fat consumption (both physiological andpsychological), whereas marketing experts' attributionof humour to some of these same advertisements mayreflect a focus on the clever wording (eg word play) ofthe messages themselves.
Both expert groups were of the view that, in themajority of cases, consumers would believe the messagesin the advertisements (Table 3). However, for a numberof the advertisements, there was a trend for nutritioniststo be more likely to state that consumers would identifywith and believe the advertisements, which suggests thatmarketers perceive consumers to be more sceptical and/or resistant to persuasive messages than do nutritionists.
Need for improved consumer education.One of the most interesting, and concerning, findingsfrom this study was the fact that there were few claimsthat were universally supported (or not supported) asbeing accurate, either between or within the two expertgroups. The fact that experts - both expert nutritionistsand expert marketers - were in many cases unable toagree as to whether the nutrition claims made in theadvertisements were accurate does not augur well for theconsumer who has to make this same determination inthe absence of a relevant professional education.
Our data suggests that both groups of experts shareda general concern about potential misunderstanding ormisconstrual of information by consumers, although forsome advertisements there was a trend for nutritionists toreport that consumers would be less likely to understand/
532 Food Australia 60 (11) . November, 2008
more likely to misunderstand the nutritional information.We note that, of the 28 nutritionists, 16 (57%) wereexperienced community based practitioners with morethan 20 years in the role - indicating a high levelof consumer contact and informed opinion regardingconsumer's likely interpretation of such information.This suggests that consumers are not well positionedto interpret the claims made in current Australian foodadvertisements.
The most commonly accepted claims were for dairyfoods, a plain breakfast cereal and a margarine, all ofwhich could be considered staple foods as they fit withinthe Australian Guide to Healthy Eating (www.health.gov.au/pubhlth/strateg/jood/guide/index.htm) and thereby maybe linked with common knowledge of nutritional value.The least accepted were for a choc-hazelnut spread, aprotein shake and an energy drink; food groups which arenot core foods and perhaps not commonly seen as beingof nutritional value.
Given the concerns in the public health arena aboutchildhood obesity, it is also not surprising that three ofthe four advertisements rated as potentially misleading bythe respondents were for high energy products targetedat children (chocolate-flavoured breakfast cereal andchocolate-flavoured sandwich spread). We also foundthat, in general, the ads perceived as most likely to bemisunderstood by the target market were those rated bythe respondents as having the least credible claims.
While magazine advertisements are among the mostcommonly used sources of nutrition information, severalstudies with Australian consumers suggest that they areamong the least trusted sources, particularly by thosewho are older and better educated. (Worsley 1989,Worsley & Lea 2003). However, this lack of trust doesnot mean they are without influence; other Australianresearch about nutrition claims on food labels suggestthat even when consumers are sceptical about claimsthey may influence purchasing decisions (Chan & others2005).
While there are current regulations on the inclusionof health claims in food advertising, such claims arenarrowly defined and do not encompass the monitoringor regulation of nutrition-related claims, such as thosein the advertisements included in this study. In theabsence of increased regulation of such claims we suggestthat there is a need for enhanced consumer education,perhaps starting within primary or secondary schools, toequip consumers with the skills to interpret such claimsand make appropriate food choices.
LimitationsThe small numbers in the expert panel cannot be seenas representative of the two professional groups. Forexample, there were 3451 members of the DieteticAssociation of Australia in 2007 (DAA Annual Report)and so statistical significance is certainly not achievablein this sample. We acknowledge that the outcomes ofthis research hold an informative 'case study' valuewhich cannot be generalised to the broad professions ofdietetics and marketing.
ConclusionIn summary, this research shows that experts inboth nutrition and marketing perceive that there isconsiderable potential for current food advertising tomislead consumers. The two groups differ in regard to

.! .' ' .'\' . )
? u·
the aspects of advertising that they find most concerning,with more nutritionists (56%) than marketers (45.8%)worried about possible confusion over dietary claims. Inaddition, this research demonstrates the importance ofensuring that both nutritionists and marketers are involvedin the development and evaluation of food advertising,as well as in the development and implementation ofpolicies regulating the practice of food advertising. Thisensures that the different - but equally valuable andapplicable - knowledge bases of both groups are accessedto ensure that food advertising is consistent with theneeds of consumers.
AcknowledgementsThis project was funded by a grant from the AustralianResearch Council awarded to the first three authors.
ReferencesADA (American Dietetic Association). 2006. Position of the American
Dietetic Association: Food and nutrition misinformation. JAm.Diet. Assoc. 106: 601-607.
Andrews, J, Burton, S & Netemeyer, R. 2000. Are some comparativenutrition claims misleading? The role of nutrition knowledge, adclaim type and disclosure conditions. J Advertising 29(3): 29-452.
Begley, A & Cardwell, G. 1996. The reliability and readability ofnutrition information' in Australian women's magazines. Aust. JNutI'. Diet. 53: 160-166.
Burton, S, Biswas, A & Netemeyer, R. 1994. Effects of alternativenutrition label formats and nutrition reference information onconsumer perceptions, comprehension and product evaluations. J.Pub. Pol. Marketing 13(Spring): 36-47.
Chan, C, Patch, C & Williams, P. 2005. Australian consumers aresceptical about but influenced by claims about fat on food labels.Eur. J Clin. NutI'. 59: 148-151.
Ford, G, Hastak, M, Mitra, A & Ringold, D. 1996 Can consumersinterpret nutrition information in the presence of a health claim? Alaboratory investigation. J Pub. Pol. Marketing 15: 16-27.
Advertisers
3 Tech Pty Ltd 493Advancing Food Safety 506Agrifood Technology 482Alexium 507Appointments Group 489Arrow Scientific 485Bronson & Jacobs 496DSM Unlimited 519John Morris Scientific Pty Ltd 515Kelly Services 535KFSU FC 481Koelnmesse GmbH 499Kosher Australia Pty Ltd 487MEP Instruments Pty Ltd 497National Starch Food Innovation 511, 520Network Nutrition 521Peacock Brothers 498Rowe Scientific 495Shamrock Food Recruitment.. 503, 508Unimonde Pty Ltd 513University of Melbourne 502World Courier 536
Fullmer, S, Geigher, C & Parent, C. 1991. Consumers' knowledge,understanding and attitudes toward health claims on food labels. JAm. Diet. Assoc. 91: 166-171.
Garretson, J & Burton, S. 2000. Effects of nutrition facts panelvalues, nutrition claims, and health claims on consumer attitudes,perceptions of disease-related risks, and trust. J Pub. 1'01. Marketing.19: 213-227.
Hawkes, C. 2004. Nutrition labels and health claims: the globalregulatory environment. \X'HO, Geneva.
Health Canada. 2000. Health claims focus testing. A report preparedby Goldfard Consultants for Nutrition Evaluation Division, FoodDirectorate. Health Canada, Onawa.
Kellogg's. 1998. Facts for life index. Kellogg (Aust) Pty Ltd, SydneyLohmann, J & Kant, A. 2000. Comparison of food groups and health
claims appearing in food advertisements in 3 popular magazinecategories. J Am. Diet. Assoc. 100: 1396-1399.
Mazis, M & Raymond, M. 1997. Consumer perceptions of healthclaims in advertisements and on food labels. J Consum. Aff. 31:10-27.
McConnon, A, Fletcher, 1', Cade, J, Greenwood, D & Pearman, A.2004. Differences in perceptions offunctional foods: UK public vs.nutritionists. NutI'. Bull. 29: 11-18.
Murphy, D, Hoppcock, T & Rusk, M. 1998. Generic copy test of foodhealth claims in advertising. Bureau of Health Economics andConsumer Protection, Federal Trade Commission, Australia.
Radimer, K.1996. Are nutrition messages in popular women'smagazines consistent with dietary guidelines? Aust. J NutI'. Diet.53: 107-113.
Radimer, K & Harvey, P. 1995. Where do Queenslanders get nutritioninformation? Aust. J NutI'. Diet. 52: 94-99.
Roe, B, Levy, A & Derby, B. 1999. The impact of health claims onconsumer search and product evaluation outcomes: results fromFDA experimental data. J Pub. Pol. Marketing 18: 89-105.
Williams, P. 2005. Consumer understanding and use of health claimsfor foods. NutI'. Rev. 63: 256-264.
Williams, 1', TapseIl, L, Jones, S & McConville, K. 2007. Health claimsfor food made in Australian magazine advertisements, NutI'. Diet.64: 234-240.
Worsley, A. 1989. Perceived reliability of sources of health information.. Health Ed. Res. 3: 367-376.
Worsley, A & Lea, E. 2003. Consumers' personal values and sources ofnutritional information. Ecol. Food NutI'. 42: 129-151. 0
Need~ directions?
Let the food Australiawebsite guide you
Go towww.foodaust.com.au
• Ingredients Directory "• Dairy Services Directory
• Training &Recruitment
• Diary
www.foodaust.com.auFood Australia 60 (11) - November, 2008 533