Embed Size (px)
Citation preview

Alaska Health Care Commission
Health Care Finance 101
Ken Tonjes
CFO PeaceHealth Ketchikan Medical Center
June 20, 2013

Common Financial Terminology
Gross Charges (Revenue) – Total Patient Revenue generated (price x quantity)
Deductions from Revenue – Amount of gross charges not collected due to
- uncompensated care – charity and bad debt
- contractual allowances – difference between charges and payments for all
payers
Net Patient Service Revenue – Total amount of cash collected from gross charges
Income From Operations - Total Operating Revenue less Total Operating Expense (operations
bottom line)
Non Operating Revenue - Income from Non Operating Activities – such as investments,
gains/losses on disposal of assets, etc.
Net Income (Excess of Revenue over Expense) - Income from Operations plus Non
Operating Revenue
Days of Cash – Cash and Investments/ Average daily cash expenses
Price/Payment/Cost – Different Definition for provider vs payer vs patient
Basics: Glossary of Terms
2

Hospital Types
Hospitals register with American Hospital Association as one of
these 4 types:
(1) General - Provides both diagnostic and therapeutic patient services
for a variety of medical conditions
(2) Specialty - A specialty hospital is generally defined as a type
of hospital that restricts its admissions to a particular group
of persons or class of services (Surgical Centers e.g.)
(3) Rehab and Chronic Diseases* - Provides diagnostic and
treatment services to disabled individuals requiring restorative
and adjustive services
(4) Psychiatric* - Provides diagnostic and treatment services for
patients who require psychiatric –related services
*Can be set up as sub units within hospitals 3

Hospital Organization Structures
• Public - 2 types • Federal - run by the Military or VA
• Non- Federal - funded in part by a city, county, tax
district or State
* 21% in US ** 5% in Alaska
• Not-for-Profit - Tax exemption in exchange for providing
charitable services
* 58% in US ** 86.5% in Alaska
• For Profit (Investor-Owned) - Have shareholders, pay
income tax , still provide charitable services
* 21% in US **8.5% in Alaska
* AHA Annual Survey 2011
** ASHNHA June 2013 4

All different types of Affiliations are possible • Ownership
• Joint venture
• Independent
Home
Community Based/
Ambulatory
Post-Acute
Care Acute Care
E-
Visits
Wellness
and Fitness
Center
Retail
Pharmacy
and Clinics
Physician
Clinics
Diagnostic/
Imaging
Center
Urgent
Care
Center
Ambulatory
Procedure
Center
Hospital/ED IP
Rehab
OP
Rehab
Home
Health
SNF
LTACH
Assisted Living
Health Care Providers
5

Health Care Revenue

Total Patient Service Revenue: $107,101 (000’s Omitted)
Revenue Mix
Inpatient38,187 36%
Outpatient45,371 42%
Medical Group23,543 22%
Inpatient
Outpatient
Medical Group
Transitional Care Revenue makes
up 18% of Inpatient Revenue
7

Medicare 14,813 23%
Medicaid 8,508 13%Commercial
36,278 56%
Other 4,883
8%
Medicare 33,149 31%
Medicaid 20,666 19%
Commercial 38,510 36%
Other 14,776 14%
Gross Charges = 107,101
Deductions = 42,619
Payments = 64,482 (000’s omitted)
Gross Revenue
Payer Mix
KMC Payer Mix and Payments
Payments
Deduction % = 40%
Payment % = 60%
Commercial makes up 36% of Gross Revenue
yet accounts for 56% of Payments
8

Hospital Price Setting
Most health care providers use a hybrid approach incorporating aspects of
both resource based and market based methodologies in setting prices.
Resource Based
• RVU’s - Diagnostics
Medicare RVU weights multiplied by a conversion factor
• Cost - Room Charge
• Mark Up - Supplies and Drugs
• Time Studies - OR Minute Charges
Market Based Adjustments
• Competition
• Payer Mix/Payer Contracts
• Loss Leaders
CPT Description RVU’s Conversion Factor Price
73100 X-RAY EXAM OF WRIST .92 215 197.8
9
Conversion Factor – must cover both costs
and margin requirements
(deductions from revenue
and profit)
Theoretical – each procedure unique CF
Practical – overall CF applied, or hospital/Medical Group

Colonoscopy
Procedure
Colonoscopy
Alone
Total Charges
For Colonoscopy
Colonoscopy W Or Wo Bx 1,020 4,717
Colonoscopy With Polypectomy 1,190 7,106
Procedure Colonoscopy
Alone
Ancillary
Charges
Physician
Fees Anesthesia Pathology
Colonoscopy
W Or Wo Bx 1,020 1,879 395 1,198 225
Colonoscopy
With Polypectomy 1,190 2,506 1,987 1,198 225
Ancillary Charges include: Recovery room, pharmacy, etc.
10

Cost Shifting
Cost Shifting in simple terms is the practice of raising overall prices to
improve payment from a group of payers (Commercial) to offset
payment shortfalls from other payers (Medicare/Medicaid, Self Pay)
Medicare Pays:
Cost + 1%
2 % Margin
Commercial Pays:
Cost +3%
Commercial Pays 3 times Medicare
to achieve margin of 2% 11
50/50 Payer Mix

Negative Margins Positive Margins
- Medical Group + Imaging
- Transitional Care Unit + Surgery
- Home Health + Pharmacy
- Intensive Care Unit + Women’s Health
- Emergency Department + Lab
- Therapies + Pathology
Service Mix
12
Positive Margin Service Lines subsidize Negative Margin Service lines
Traditionally, Surgery and Imaging Service Lines most profitable

13
Payment Mechanisms

Medicare Payment Methodologies Quick Overview
MedicareHospital PPS
Reimbursement Methodology
Inpatient DRG Prospective Payment System Relative Weight of DRG x Base Rate
Outpatient APC Prospective Payment System
Critical Access Hospital
Inpatient Cost Calculated from Medicare Cost Report
Outpatient Cost Calculated from Medicare Cost Report
Sole Community Hospital
Inpatient Cost Calculated from Base year cost per discharge inflated forward
Outpatient APC Prospective Payment System
Skilled Nursing Facility RUGS Prospective Payment System Per Discharge
Physician Clinics
Provider Based Clinics Hospital Outpatient Departments Follow methodology for Hospital Outpatient Type
Freestanding Clinics Fee Schedule
14

The DRG payment for a Medicare patient is determined by multiplying the relative weight for the DRG by the
hospital’s blended rate: DRG PAYMENT = WEIGHT x RATE
• The weight indicates the relative costs for treating patients
• The Base Rate is defined by Federal regulations and includes Operating and Capital Payments with local
adjustments for: Wage Index, Geographic Factor, Disproportionate share of financially indigent patients
Medicare - IP
15
Sample Case:
DRG 194 SIMPLE PNEUMONIA & PLEURISY W CC
Weight = 0.9996
Total Charges = $16,082.00
CAH Reimbursement:
Contractual Adjustment = $5,580.32
PPS Reimbursement:
DRG Weight .9996
X
Base Rate $7,040.99
=
$7,038.17
Contractual Adjustment = $9,043.83
SCH Reimbursement:
DRG Weight .9996
X
Hospital Specific Base
Rate $7,478.14
=
$7,475.15
Contractual Adjustment = $8,606.85
Department Charges Payment
Routine Charges Per Diem
Room Charge (LOS 3) 6,066.00 1,898 5,694.00
Ancillary Charges RCC
Lab 660.10 48% 316.85
CT 2,585.20 48% 1,240.90
Radiology 354.40 48% 170.11
Pharmacy 1,866.40 48% 895.87
Respiratory 4,549.90 48% 2,183.95
Total 16,082.00 10,501.68

16
Medicare - OP
The APC payment for a Medicare patient is determined by multiplying the relative weight for the APC by
the adjusted conversion factor:
APC PAYMENT = WEIGHT x CONVERSION FACTOR
Outpatient services are grouped into ambulatory payment classifications (APCs) on the basis of clinical
and cost similarity.
The relative weight for an APC measures the resource requirements of the service and is based on the
median cost of services in that APC.
The conversion factor is adjusted for geographic differences and the hospital wage index.
CPT Based Payment: Outpatient Services (Imaging, PT, ED, etc)
Charge PPS/SCH CAH
CPT Description Amount Payment Payment
93017 CARDIAC STRESS W/O INTERP $ 375.70 $178.58 $ 180.34
A9579 NM MYO PERF W SPECT/WALL/EF $2,186.10 $686.45 $1,049.33
TOTAL $2,561.80 $865.03 $1,229.67
APC Payment
Cost
Reimbursement:
Charge x RCC

17
Medicare - Clinic
Medicare pays for Clinic Charges
Based on each billed CPT Code
Clinic charges are reimbursed 3 different ways:
1. Free Standing Clinic
2. OPPS Provider Based Entity
3. CAH with Method II
CPT Based Payment:
1. FSC - Physician Fee Schedule Global Payment = Facility + Professional
2. OPPS PBE - Facility Portion paid based on APC and Professional Portion paid
based on Physician Fee Schedule
3. CAH with Method II – Facility Portion paid based on Cost and Professional Portion
paid based on Physician Fee Schedule plus 15%
.

Medicaid Payment Methodologies
18
Medicaid
Hospital Reimbursement Methodology
Inpatient Per Diem
Cost Based from Base year
Medicare Cost Report Rebased every four years 2011--> 2013-2016
Outpatient % of Charges
Cost Based from Base year
Medicare Cost Report Rebased every four years 2011--> 2013-2016
Skilled Nursing Facility
SNF Per Diem
Cost Based from Base year
Medicare Cost Report Rebased every four years 2011--> 2013-2016
Physician Clinics
Provider Based Clinics Fee Schedule
Freestanding Clinics Fee Schedule
Inpatient:
Medicaid Days
x
Per Diem
=
IP Medicaid Payment
Outpatient:
Charges
x
RCC
=
OP Medicaid Payment
Clinic:
Pro
Fac
Global

Commercial Payers Pay Based on:
• Percentage of Charges
• Case Rate
• Fee Schedule
• Per Diem
• Capitated
19
Commercial Payment Methodologies

Health Care Costs

Labor Costs (Salaries, Benefits, and Contract Labor) = 59%
Salaries
29,301
45%
Benefits
8,353
13%
Contract Labor
832
1%
Supplies
5,546
9%
Purchased Services
15,357
24%
Other
3,209
5%
Depreciation
1,799
3%Interest
6
0%
Salaries
Benefits
Contract Labor
Supplies
Purchased Services
Other
Depreciation
Interest
21
Operating Costs
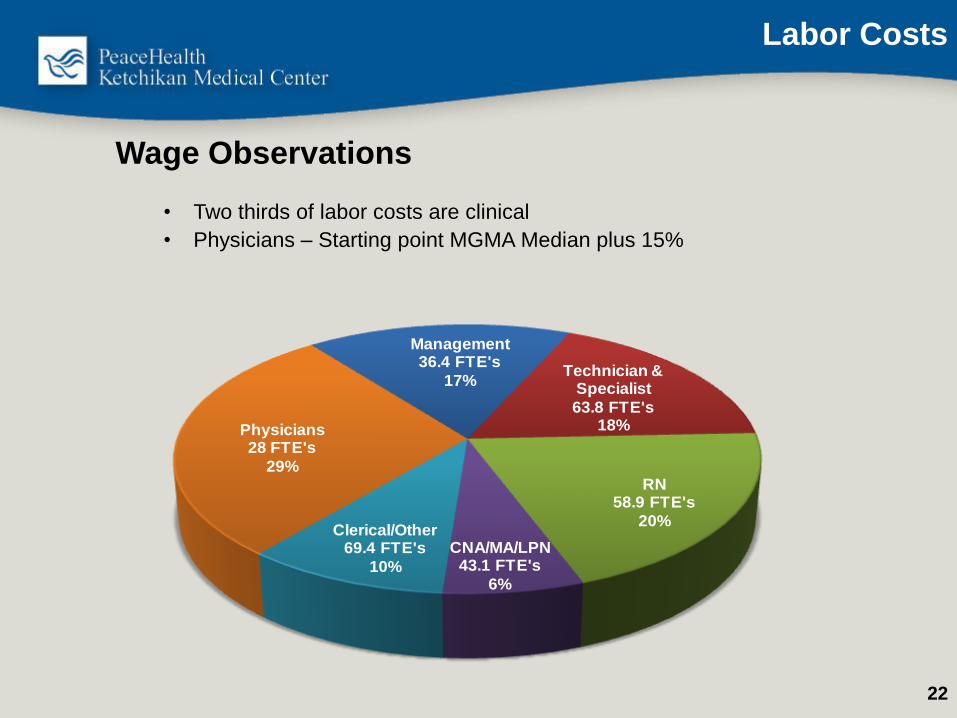
Wage Observations
• Two thirds of labor costs are clinical
• Physicians – Starting point MGMA Median plus 15%
Management 36.4 FTE's
17%Technician &
Specialist
63.8 FTE's18%
RN 58.9 FTE's
20%
CNA/MA/LPN 43.1 FTE's
6%
Clerical/Other 69.4 FTE's
10%
Physicians 28 FTE's
29%
22
Labor Costs

Career Years Post HS Median Gross $ at the 50th
percentile of the market
RN 2-4 Years $80,000
Rad Tech 2 years $62,000
Ultrasound Tech 2 years $82,000
Med Tech (Lab) 4 - 5 years $68,000
Nurse Practitioner/
Physician Assistant/
CNM/CRNA
6 -8 years $110,000 - $192,000
Physical Therapist 6 - 8 years $82,000
Pharmacist 6 - 8 years $120,000
Physician 10+ years $250,000 - $600,000+
What a difference an education can make!
23
Healthcare Salaries

Cost Pressures
• Contract Labor - Essential staff (Providers, nursing, clinical, etc.)
terminate, requiring coverage through agency staffing at a premium
(35-100%)
• Recruitment /Retention - Costs to recruit high, long duration,
limited labor pool
• Cost of Living - Higher in Alaska, requires higher wages and
moving allowances
• Lower volumes - Lower volumes restrict efficiency resulting in
lower productivity
• Supply costs - Barged or flown in to all Alaskan communities
• Construction Costs - 25% higher in Alaska than lower 48 ($300/sq ft vs
$240/sq ft)
Alaska Providers face different challenges:
24

Bad Debt and Charity Trend
2008 Actual 2009 Actual 2010 Actual 2011 Actual 2012 Actual2013
Projected2014 Budget
Charity $1,916 $2,350 $2,856 $2,360 $3,243 $3,280 $3,749
Bad Debt $3,122 $3,914 $4,241 $4,129 $4,205 $3,964 $4,820
Total Uncomp Care $5,038 $6,264 $7,097 $6,489 $7,449 $7,245 $8,568
% of Gross Charges 6.95% 7.85% 8.03% 7.09% 7.84% 7.31% 8.00%
6.95%
7.85%
8.03%
7.09%
7.84%
7.31%
8.00%
5.00%
5.50%
6.00%
6.50%
7.00%
7.50%
8.00%
8.50%
9.00%
$-
$1,000
$2,000
$3,000
$4,000
$5,000
$6,000
$7,000
$8,000
$9,000
(000’s omitted)
25

Other Information

What is a Charge Description Master? The Charge Description Master (CDM) is primarily a list of
services/procedures, room accommodations, supplies,
drugs/biologics, and/or radiopharmaceuticals that may be billed
to a patient registered as an inpatient or outpatient on a claim.
Charge Master - What it is and What it Does
The CDM may also contain/be used for the following: • Statistical tracking line items
• Used to capture labor for budgetary purposes
• No dollars, CPT/HCPCS or revenue code attached
• Payment and adjustment codes
27

Charge Master Common Elements
The core group of data elements that typically resides within a CDM are:
Example:
• CDM numbers 30000612
• Charge Descriptions XR WRIST RIGHT 2 VIEWS
• Charge amounts $186.10
• Revenue codes 320
• Department numbers 41400
• CPT/HCPCS codes 73100
• Modifiers RT
• Relative Value Units (Statistical measures) 0.71
5600 charge items on KMC’s charge master
28

Medicare Cost Reports - An annual report required of all institutions participating
in the Medicare program, which records each institution's total costs and charges
associated with providing services, the portion of those costs and charges
allocated to Medicare patients, and the Medicare payments received.
The cost report contains provider information such as:
• Facility characteristics
• Utilization data
• The cost and charges by cost center (in total and for Medicare)
• Medicare settlement data
• Financial statement data.
Primary reimbursement determined via the cost report for:
CAH
Calculate Cost Based
Reimbursement
PPS/SCH
• Bad Debt
• Disproportionate Share
• Medical Education
Cost Report
29

Total
Expenses
-Adjustments
-Reclasses
Allowable
Expenses
Overhead
Allocations
Total
Revenue
-Physician Rev
-Non-Allowable
Adjusted
Revenue
Fully Loaded
Cost by
Department
Ratio of Cost
to Charges
Ancillary
Medicare
Program
Charges
Ancillary
Medicare
Cost
Cost Per
Diem
Medicare
Program
Days
Routine
Medicare
Program Cost
Total
Medicare
Program
Cost
Cost Report Flow Chart
Inputs from entity
financial statements
Adjustments based
on cost report
parameters
30

Patient Access Service Delivery Revenue Realization
Referral
Scheduling
Insurance
Verification
Pre-Registration Pre-Service
Collections
Patient
Liability
Determination
Registration and
POS Collections
Financial
Counseling
Utilization
Review
Charge
Capture
Coding
Clinical
Documentation Claim Editing
and Submission
Bill Hold
Resolution
Exception Based
Follow-up
Customer
Service Payment
Variance
Processing
Transaction
Posting
admit discharge
Revenue Cycle
31

Trend Penalty
Hospitals
Impacted Date
ICD-10 Requirement 10/1/14 All 10/1/14
Inpatient Quality Reporting 2% IPPS FY12
OP Quality Reporting 2% OPPS FY12
Value Based Purchasing 2% IPPS 1% FY13→2%FY17
Hospital Acquired Conditions
/Present on Admission
1% IPPS 1% FY15
Readmissions 3% IPPS FY13, 3 Year Phase-In
Meaningful Use Loss of Incentive All 10/1/12
HIPAA 5010 Denied Claims All 10/1/12
ACA All Must Comply All
Trends Influencing Health Care
32

Presentation Summary
Health Care Finance is complicated due to:
• Each input is unique, therefore care delivery must be flexible (variable)
• Physician orders drive provision of care adding to that variability
• Payment is also variable depending on:
• Insurance coverage
• Negotiated Rates
• Payer Mix
• Regulation is high
• Technology changes rapidly requiring intensive capital investment
• Many players in Health Care, from capital equipment vendors to
Pharmaceutical companies to agency staffing making it difficult to control all
aspects of Costs