Embed Size (px)
Citation preview

Anthony Wright Executive Director March 18th, 2015
HEALTH CARE COSTS: A Consumer Perspective
www.health-access.org
www.facebook.com/healthaccess
www.twitter.com/healthaccess
BFD
Biggest Congressional Action for Consumer Protections; Coverage Expansion; Cost Containment
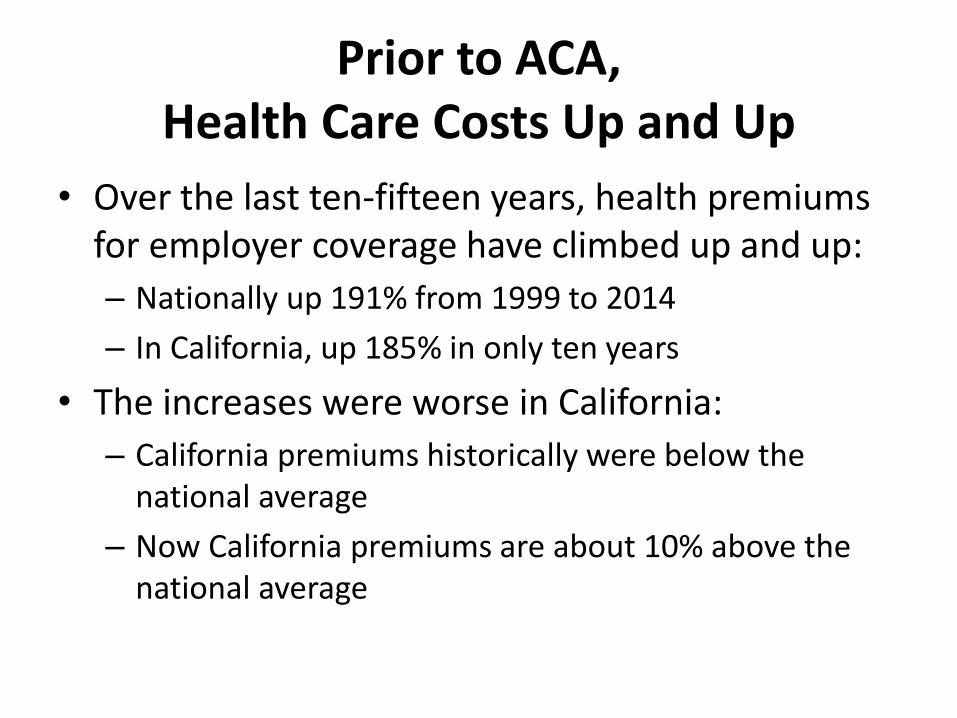
Prior to ACA, Health Care Costs Up and Up
• Over the last ten-fifteen years, health premiums for employer coverage have climbed up and up:
– Nationally up 191% from 1999 to 2014
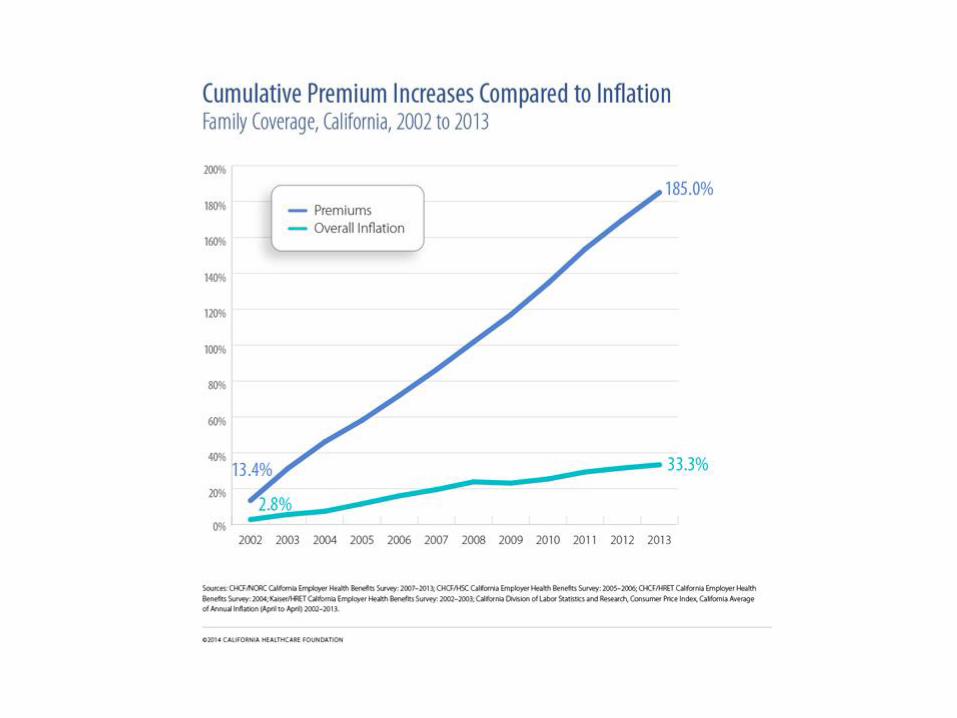
– In California, up 185% in only ten years
• The increases were worse in California:
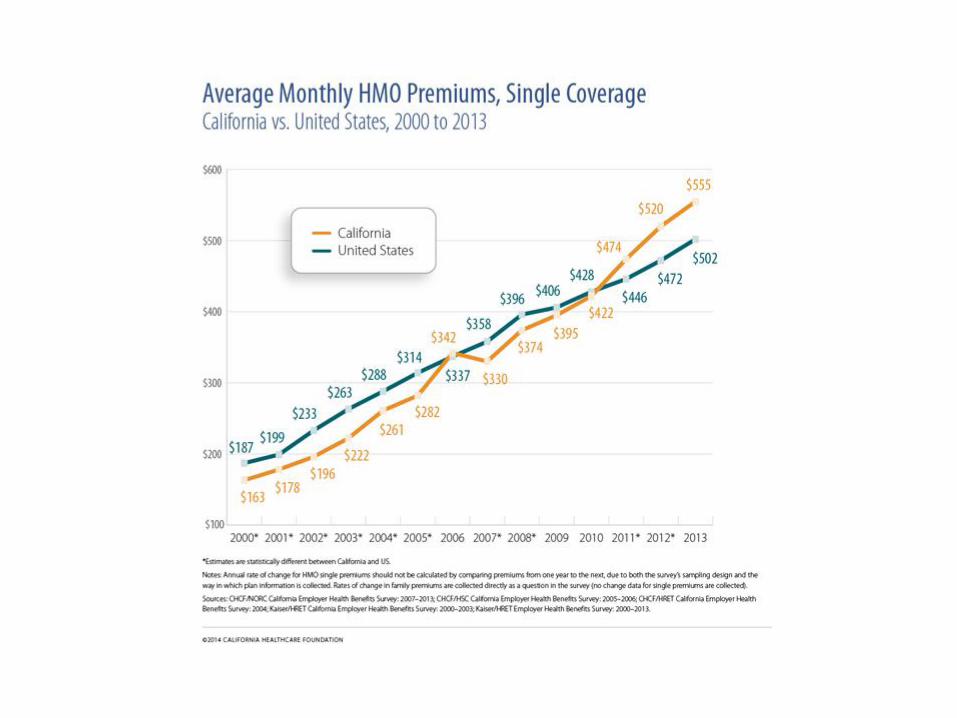
– California premiums historically were below the national average
– Now California premiums are about 10% above the national average
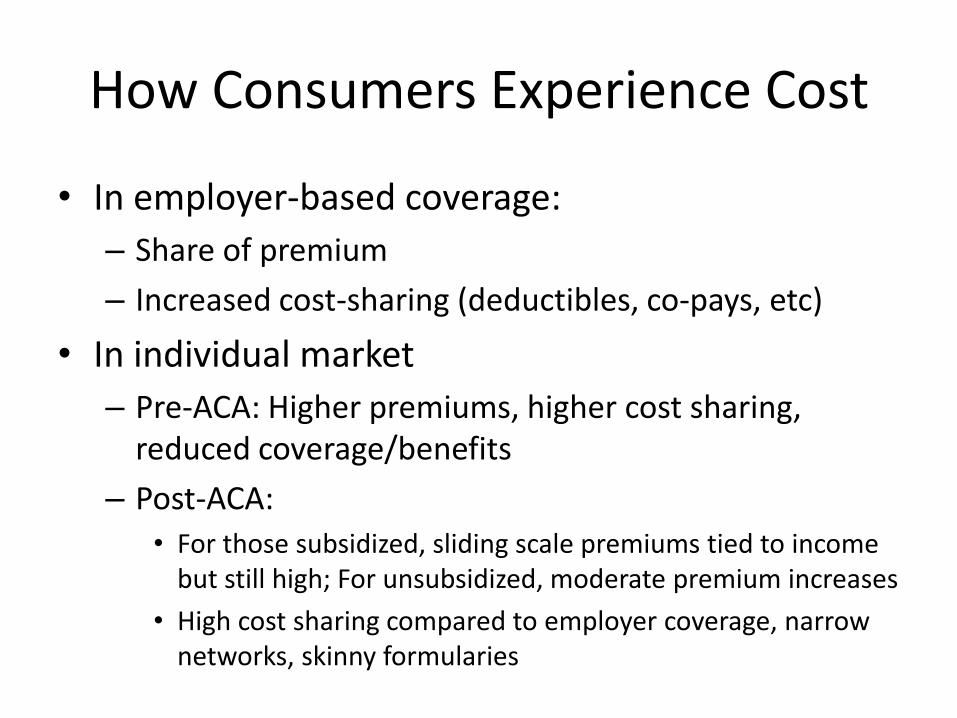
How Consumers Experience Cost
• In employer-based coverage:
– Share of premium
– Increased cost-sharing (deductibles, co-pays, etc)
• In individual market
– Pre-ACA: Higher premiums, higher cost sharing, reduced coverage/benefits
– Post-ACA:
• For those subsidized, sliding scale premiums tied to income but still high; For unsubsidized, moderate premium increases
• High cost sharing compared to employer coverage, narrow networks, skinny formularies

Cumulative Increases in Health Insurance Premiums, Workers’ Contributions to Premiums, Inflation, and Workers’ Earnings, 1999-2014
131%
191%
72%
127%
212%
17%
38%
54%
13%
28%
43%
0%
50%
100%
150%
200%
250%
1999 2000 2001 2002 2003 2004 2005 2006 2007 2008 2009 2010 2011 2012 2013 2014
Health Insurance Premiums
Workers' Contribution to Premiums
Workers' Earnings
Overall Inflation
SOURCE: Kaiser/HRET Survey of Employer-Sponsored Health Benefits, 1999-2014. Bureau of Labor Statistics, Consumer Price Index, U.S. City Average of Annual Inflation (April to April), 1999-2014; Bureau of Labor Statistics, Seasonally Adjusted Data from the Current Employment Statistics Survey, 1999-2014 (April to April).

Employers Cost Shift to Workers Sometimes Faster than Premiums Rise • As premiums in California climbed from $163 per
month to $555 per month , 185% in the last decade, employers have shifted a higher and higher proportion of costs to workers, increasing – Worker share of premium – Deductibles, including mega-deductibles of $2,000
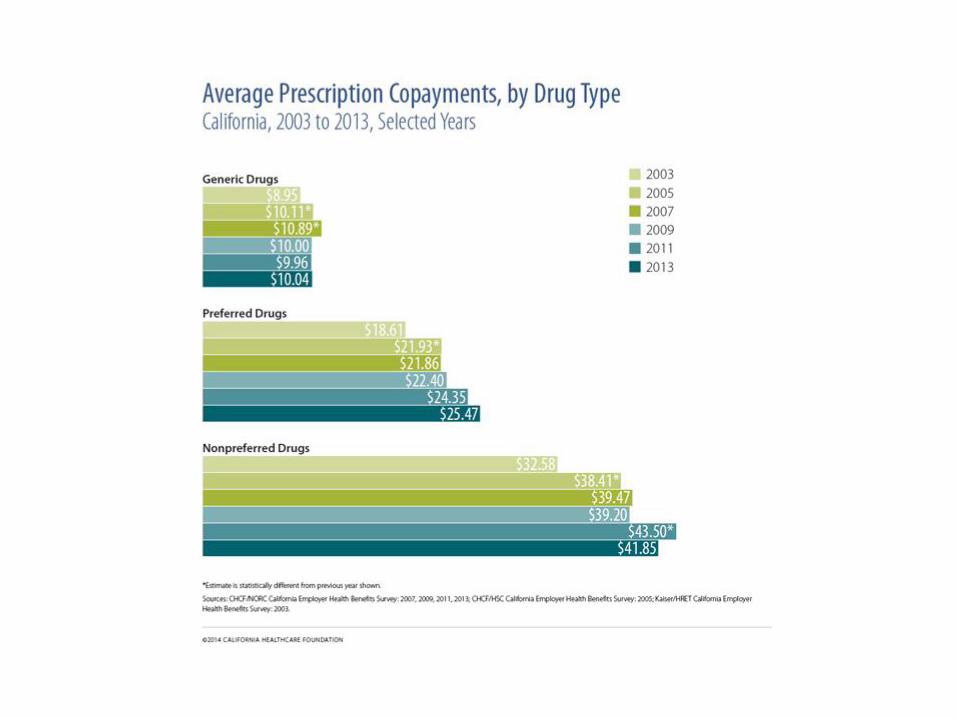
plus – Copays for drugs and other care
• Californians with employer based coverage are paying more for the same or more limited benefits.


Cost Sharing: Benefit Design Matters HOW CONSUMERS EXPERIENCE COSTS: • Cost-Sharing: Not Just Shifting Costs, Impacts Accessing Care.
• Reduces Utilization of Services—Including Needed Care • Individuals Have Limited Market Power & Information & Ability to Shop for
Value—CalPERS with Its Substantial Market Share still Struggles • Consumers Aren’t Clinicians—They Rely on Clinicians for Guidance • Can Be Prohibitive for Consumers with Lower Incomes
• Platinum/Gold/Silver/Bronze trade-off: premium vs. cost-sharing • ACA included some overall limits/standards
• Minimum Benefit Standards • Actuarial Value – 60% • Out-of-pocket maximum at $6,350/individual • Standardized benefits in Covered California
• Ongoing issues with cost-sharing—unfair, unclear or surprise bills: • Co-insurance • In-network vs. out-of-network cost sharing • Prescription drug specialty tiers • Other issues (substandard/grandfathered coverage, etc.)
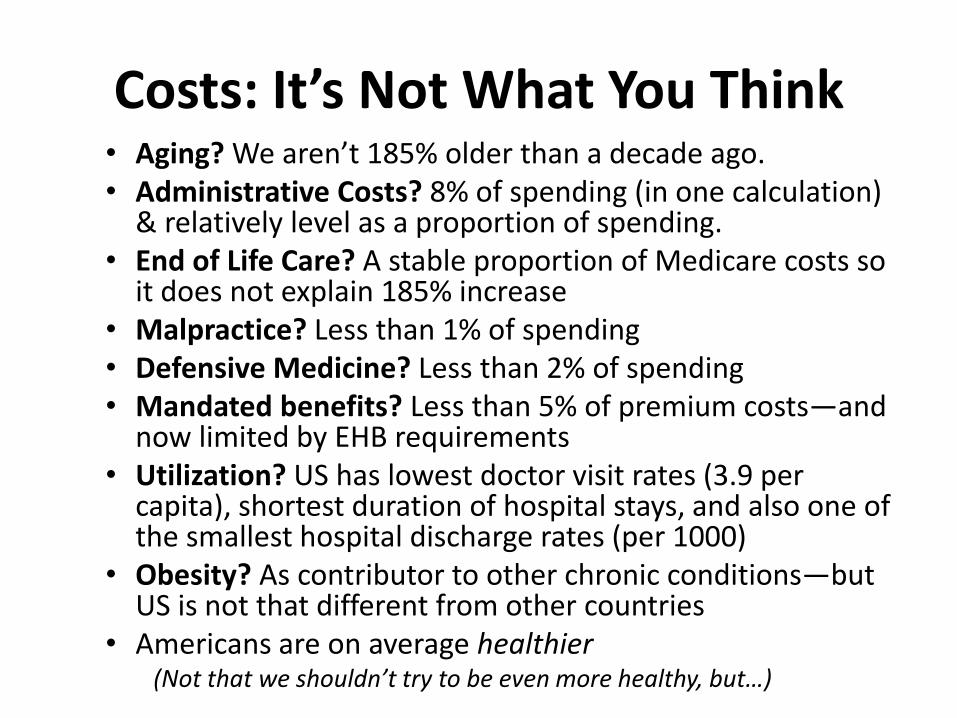
Costs: It’s Not What You Think • Aging? We aren’t 185% older than a decade ago. • Administrative Costs? 8% of spending (in one calculation)
& relatively level as a proportion of spending. • End of Life Care? A stable proportion of Medicare costs so
it does not explain 185% increase • Malpractice? Less than 1% of spending • Defensive Medicine? Less than 2% of spending • Mandated benefits? Less than 5% of premium costs—and
now limited by EHB requirements • Utilization? US has lowest doctor visit rates (3.9 per
capita), shortest duration of hospital stays, and also one of the smallest hospital discharge rates (per 1000)
• Obesity? As contributor to other chronic conditions—but US is not that different from other countries
• Americans are on average healthier (Not that we shouldn’t try to be even more healthy, but…)

Are U.S. Health Care Costs Higher Because Americans are Sicker?
14 SOURCE: Institute of Medicine (IOM). The Healthcare Imperative. Lowering Costs and Improving Outcomes. Workshop Series Summary, 2010 (p. 80).
U.S. disease prevalence compared to peer countries
* Includes 35 or 60 medical conditions surveyed by the U.S. Medical Expenditure Panel Survey; the costs of these diseases represent 35 percent of total U.S. health expenditures. ** Peer countries are France, Germany, Italy, Spain and the United Kingdom. *** Chronic obstructive pulmonary disease
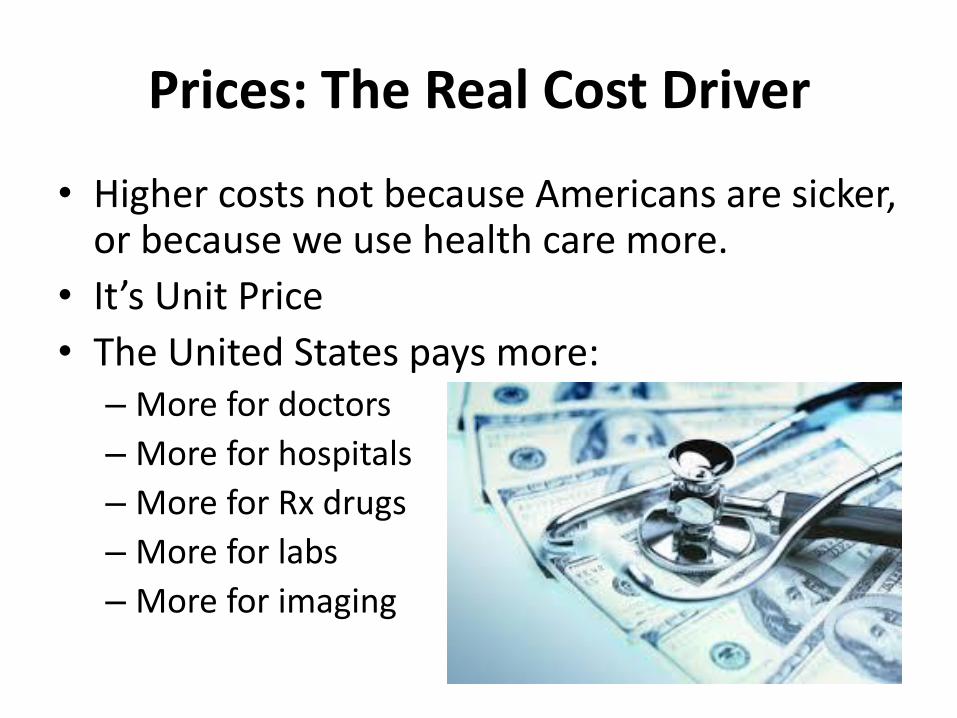
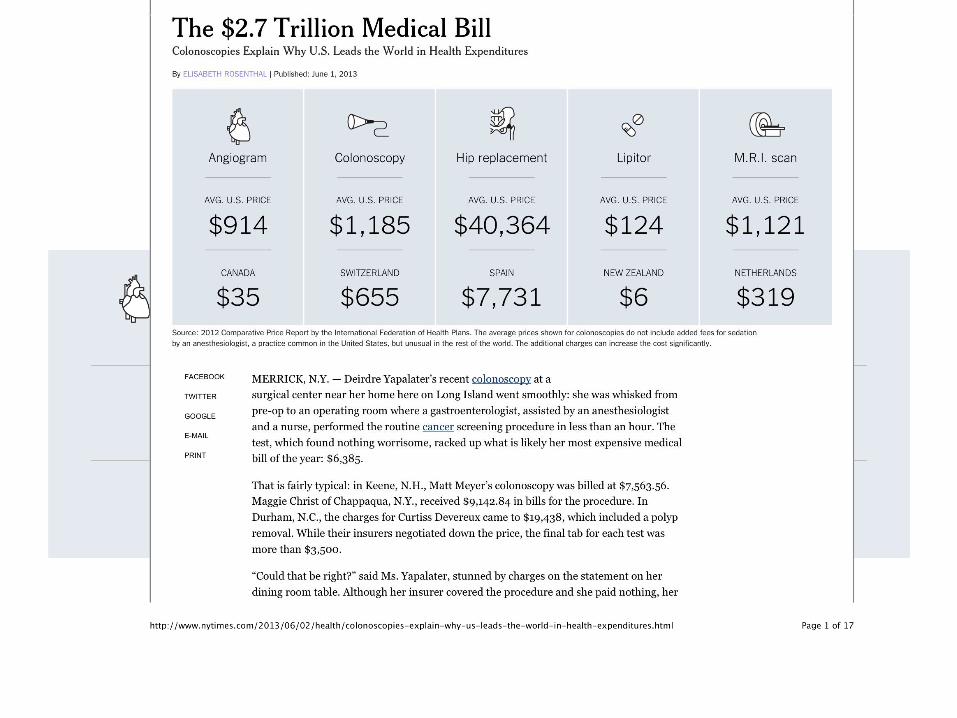
Prices: The Real Cost Driver
• Higher costs not because Americans are sicker, or because we use health care more.
• It’s Unit Price
• The United States pays more: – More for doctors
– More for hospitals
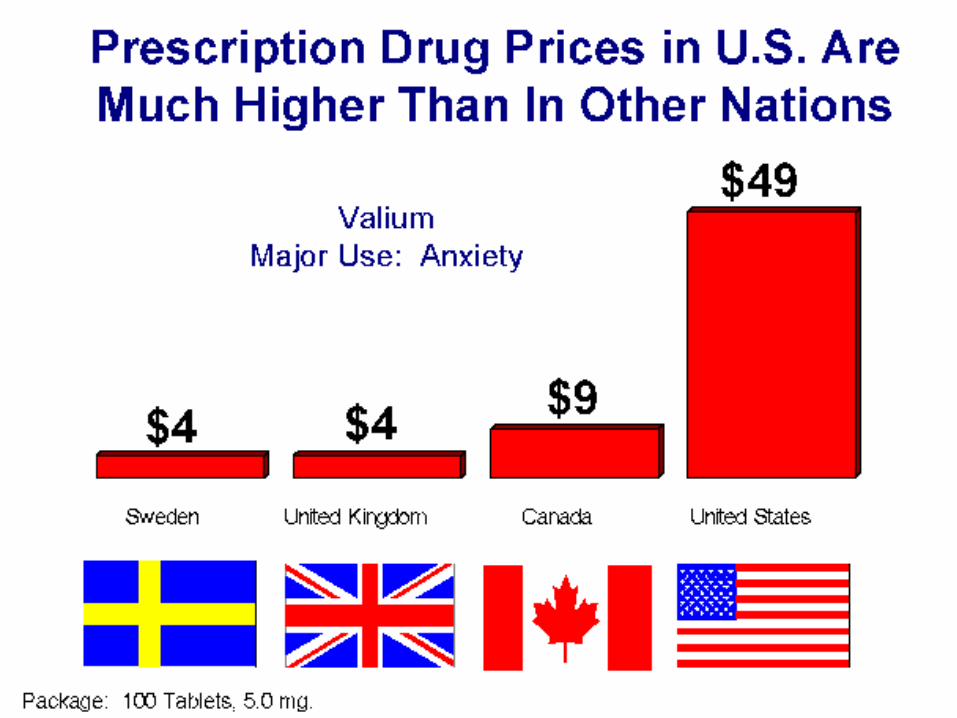
– More for Rx drugs
– More for labs
– More for imaging
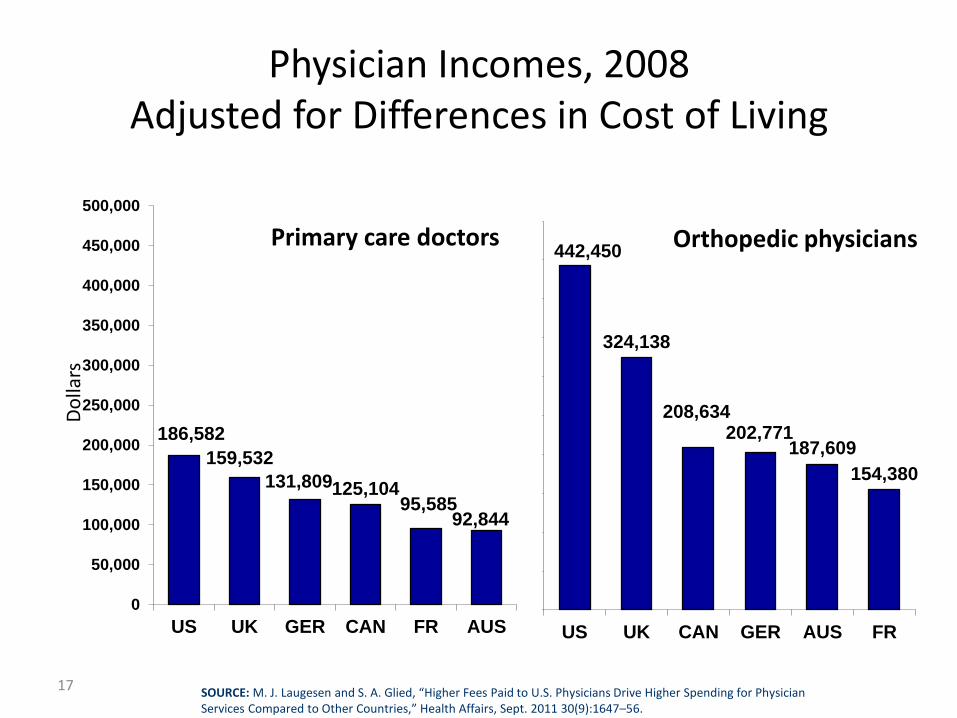
Physician Incomes, 2008 Adjusted for Differences in Cost of Living
17
186,582
159,532
131,809 125,104 95,585
92,844
0
50,000
100,000
150,000
200,000
250,000
300,000
350,000
400,000
450,000
500,000
US UK GER CAN FR AUS
442,450
324,138
208,634 202,771
187,609
154,380
US UK CAN GER AUS FR
Primary care doctors Orthopedic physicians
Do
llars
SOURCE: M. J. Laugesen and S. A. Glied, “Higher Fees Paid to U.S. Physicians Drive Higher Spending for Physician Services Compared to Other Countries,” Health Affairs, Sept. 2011 30(9):1647–56.
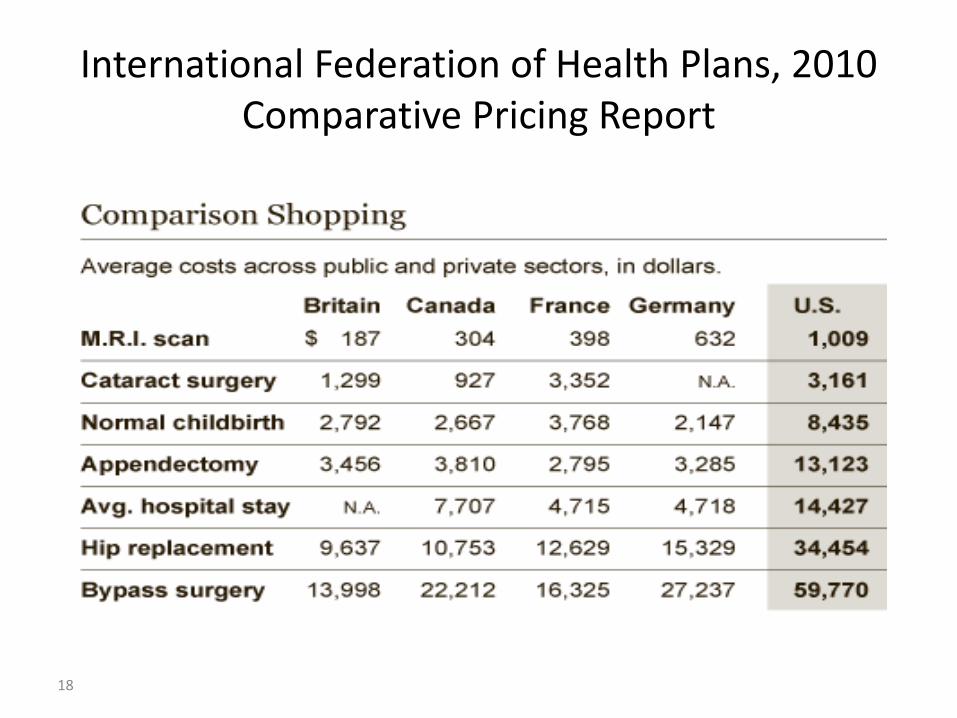
International Federation of Health Plans, 2010 Comparative Pricing Report
18

US: Unit Prices
Sovaldi on introduction:
• $84,000 in United States
• $66,000 in Germany
• $57,000 in France
• $55,000 in Canada
• $900 in India
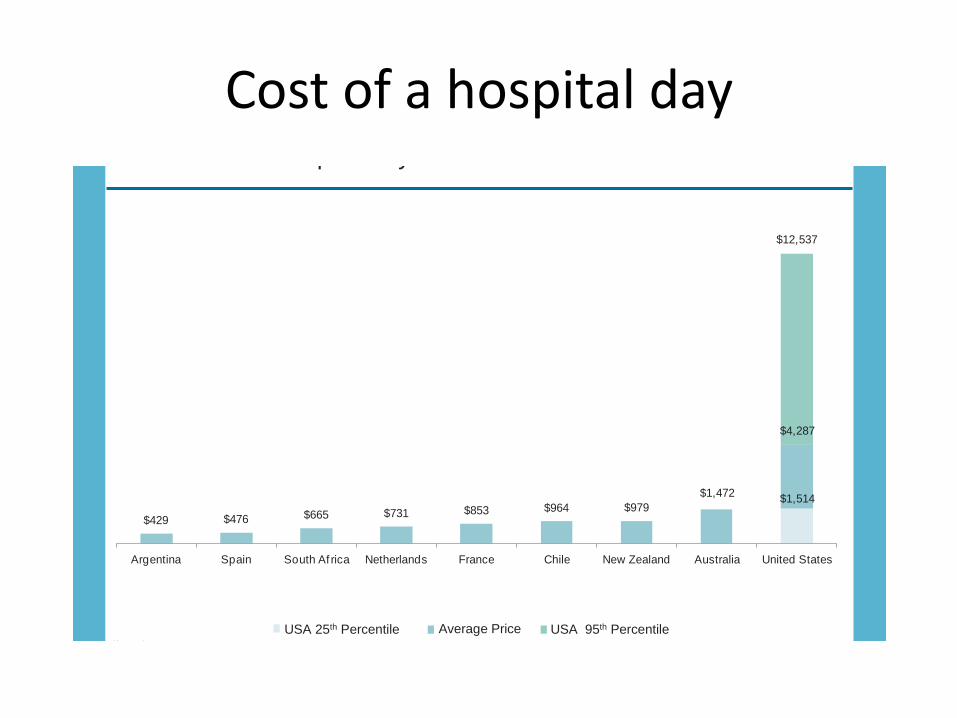
Cost of a hospital day
9
USA 25th Percentile Average Price USA 95th Percentile ($ USD)
2012 Cost Per Hospital Day
$1,472$1,514
$429 $476 $665 $731 $853 $964 $979
$4,287
$12,537
Argentina Spain South Af rica Netherlands France Chile New Zealand Australia United States
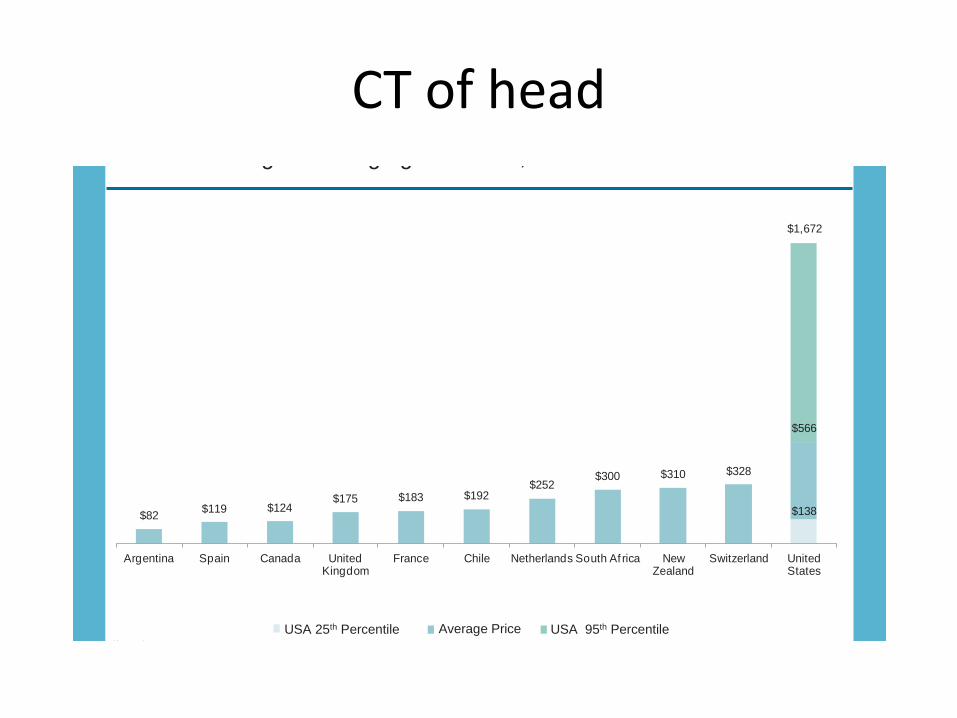
CT of head
6
USA 25th Percentile Average Price USA 95th Percentile ($ USD)
2012 Scanning and Imaging: CT Scan, Head
$138$82$119 $124
$175 $183 $192$252
$300 $310 $328
$566
$1,672
Argentina Spain Canada United Kingdom
France Chile Netherlands South Af rica New Zealand
Switzerland United States

Post-ACA: Spending Growth Slows “National Health Spending in 2013: Growth Slows, Remains in Step with the Overall Economy” Hartman et al, Health Affairs, Jan. 2015 “Health care costs have been rising more slowly than at any time in the last fifty years.. Our annual survey of premiums for employer based health insurance in 2013 told a similar story. Premiums rose just 4 percent. There is debate among experts about how much of the slowdown is due to the weak economy and how much is due to changes in the health care system but everyone agrees both factors have played a role. The government report says the slowdown is mainly due to the economy. Our own analysis also found that the economy explains most of the diminishing rate of growth but changes in health insurance and health care have also played a significant role. There is uncertainty about when and how rapidly costs will accelerate when the economy improves, but no one disputes that the slowdown is real.” –Drew Altman, Kaiser Family Foundation, March 2014. Economists debate if this is due to the ACA, the recession, demographic, economics, or industry cyclical trends, or some combination. CMS asks if “the historically low health spending growth from 2009 to 2013” is “the temporary aftermath of the great recession or the beginning of a new era.” December 2014
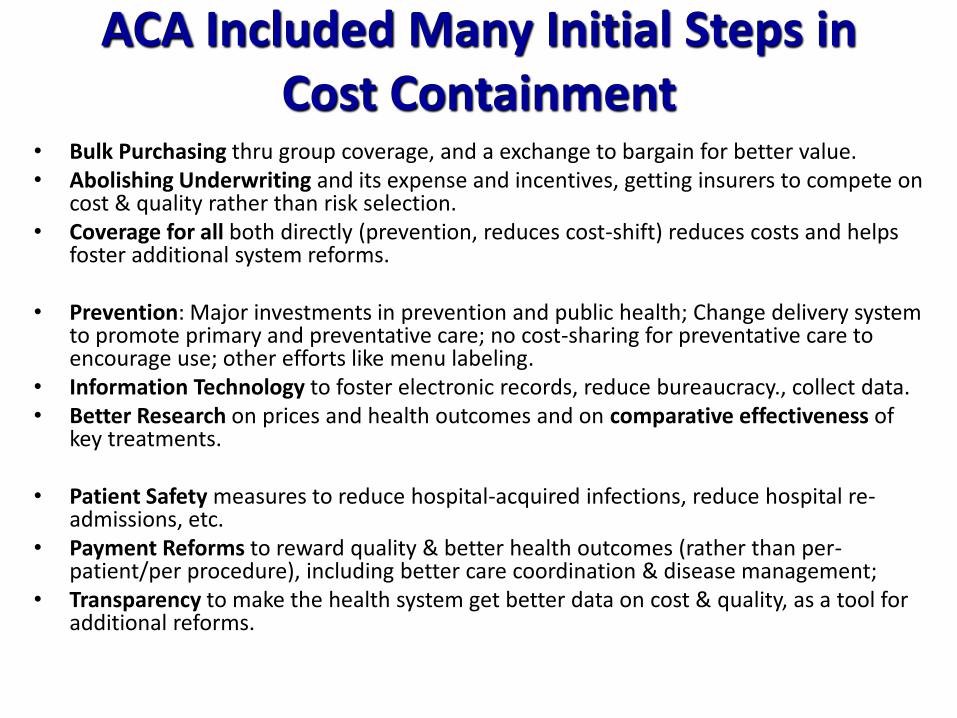
ACA Included Many Initial Steps in Cost Containment
• Bulk Purchasing thru group coverage, and a exchange to bargain for better value. • Abolishing Underwriting and its expense and incentives, getting insurers to compete on
cost & quality rather than risk selection. • Coverage for all both directly (prevention, reduces cost-shift) reduces costs and helps
foster additional system reforms. • Prevention: Major investments in prevention and public health; Change delivery system
to promote primary and preventative care; no cost-sharing for preventative care to encourage use; other efforts like menu labeling.
• Information Technology to foster electronic records, reduce bureaucracy., collect data. • Better Research on prices and health outcomes and on comparative effectiveness of
key treatments.
• Patient Safety measures to reduce hospital-acquired infections, reduce hospital re-admissions, etc.
• Payment Reforms to reward quality & better health outcomes (rather than per-patient/per procedure), including better care coordination & disease management;
• Transparency to make the health system get better data on cost & quality, as a tool for additional reforms.
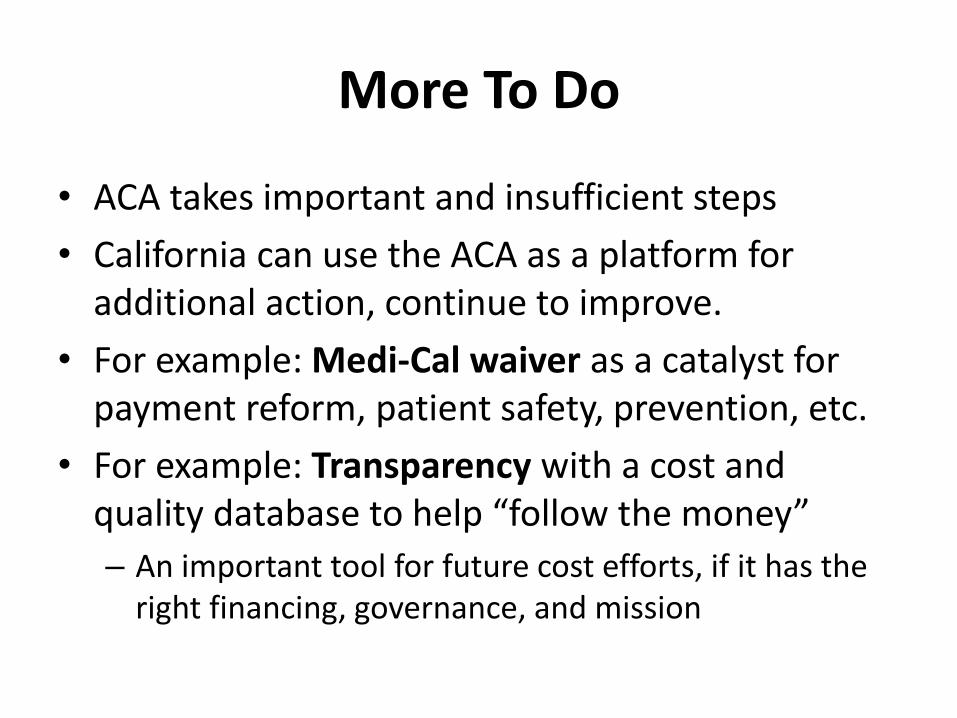
More To Do
• ACA takes important and insufficient steps
• California can use the ACA as a platform for additional action, continue to improve.
• For example: Medi-Cal waiver as a catalyst for payment reform, patient safety, prevention, etc.
• For example: Transparency with a cost and quality database to help “follow the money”
– An important tool for future cost efforts, if it has the right financing, governance, and mission
Sources
• California Employer Benefits Survey, 2014, http://www.chcf.org/publications/2014/01/employer-health-benefits
• Kaiser-HRET Survey of Employer Recent Trends in Employer-Sponsored Health Benefits, Nov., 2014,
• Marianne Udow-Phillips, Going Where the Money is: Health Care Cost Drivers, Center for Healthcare Research and Transformation, http://consumersunion.org/healthcosts/Udow-Phillips-Nov11.pdf
• Elisabeth Rosenthal, New York Times, Paying Till It Hurts, presentation to Consumers Union/Robert Wood Johnson convening, Nov. 2013.
• Hartman et al, “National Health Spending in 2013: Growth Slows, Remains in Step with the Overall Economy” Health Affairs, Jan. 2015
• Drew Altman, Kaiser Family Foundation, March 2014.

For more information Website: http://www.health-access.org Blog: http://blog.health-access.org Facebook: www.facebook.com/healthaccess Twitter: www.twitter.com/healthaccess
Health Access California 1127 11th Street, Suite 234, Sacramento, CA 95814 916-497-0923 414 13th Street, Suite 450, Oakland, CA 95612 510-873-8787 1930 Wilshire Blvd., Suite 916, Los Angeles, CA 90057 213-413-3587