Embed Size (px)
Citation preview

F e d e r a l C o m m u n i C a t i o n s C o m m i s s i o n | a u g u s t 2 0 1 0
o B i t e C h n i C a l P a P e r n o . 5
HealtH care BroadBand in
americaEarly analysis and a path forward
august 2010


o B i t e C h n i C a l P a P e r n o . 5
F e d e r a l C o m m u n i C a t i o n s C o m m i s s i o n | h e a l t h C a r e B r o a d B a n d i n a m e r i C a 3
tablE of ContEnts
Introduction . . . . . . . . . . . . . . . . . . . . . . . . . . . . . . . . . . . . . . . . . . . . . . . . . . . . . . . . . . . . . . . . . . . . . . . . . . . . . . . . . . . . . . . . . . . . . . . . . . . . . . . . . . . . . . .4
I. Health Care Providers’ Broadband Needs . . . . . . . . . . . . . . . . . . . . . . . . . . . . . . . . . . . . . . . . . . . . . . . . . . . . . . . . . . . . . . . . . . . . . . . . . . . .5
II. Broadband Connectivity Options . . . . . . . . . . . . . . . . . . . . . . . . . . . . . . . . . . . . . . . . . . . . . . . . . . . . . . . . . . . . . . . . . . . . . . . . . . . . . . . . . . . . .8
III. Gaps and Barriers Preventing Sufficient Broadband Levels . . . . . . . . . . . . . . . . . . . . . . . . . . . . . . . . . . . . . . . . . . . . . . . . . . . . . . . . . .9
Small Providers (Four or Fewer Physicians) . . . . . . . . . . . . . . . . . . . . . . . . . . . . . . . . . . . . . . . . . . . . . . . . . . . . . . . . . . . . . . . . . . . . . . . . . . . .9
Medium & Large Providers (Five or More Physicians) . . . . . . . . . . . . . . . . . . . . . . . . . . . . . . . . . . . . . . . . . . . . . . . . . . . . . . . . . . . . . . . . 10
Federally Funded Providers . . . . . . . . . . . . . . . . . . . . . . . . . . . . . . . . . . . . . . . . . . . . . . . . . . . . . . . . . . . . . . . . . . . . . . . . . . . . . . . . . . . . . . . . . 10
IV. Next Phase of Analysis . . . . . . . . . . . . . . . . . . . . . . . . . . . . . . . . . . . . . . . . . . . . . . . . . . . . . . . . . . . . . . . . . . . . . . . . . . . . . . . . . . . . . . . . . . . . . .12

4 F e d e r a l C o m m u n i C a t i o n s C o m m i s s i o n | W W W . B r o a d B a n d . g o V
h e a l t h C a r e B r o a d B a n d i n a m e r i C a
introduCtionThe National Broadband Plan lays out a bold roadmap to America’s future . “Chapter 10: Health Care” highlights how health infor-mation technology (IT) offers the potential to improve health care outcomes while simultaneously controlling costs and extending the reach of a limited pool of health care professionals .
Section 10 .5, “Closing the Health IT Broadband Connectivity Gap” presents an analysis of health care providers’ connectivity requirements and the ability of the country’s infrastructure to meet those needs . The analysis is discussed here in more detail, with a full explanation of assumptions and methodology used . However, this analysis is just the starting point . The goal in publishing this paper is to solicit feedback and new ideas for furthering the country’s understanding of health care connectivity issues .
The health care connectivity analysis encompasses four sections:
1 . Health Care Providers’ Broadband Needs 2 . Broadband Connectivity Options 3 . Gaps and Barriers Preventing Sufficient Broadband Levels 4 . Next Phase of Analysis
o B i t e C h n i C a l P a P e r n o . 5
F e d e r a l C o m m u n i C a t i o n s C o m m i s s i o n | h e a l t h C a r e B r o a d B a n d i n a m e r i C a 5
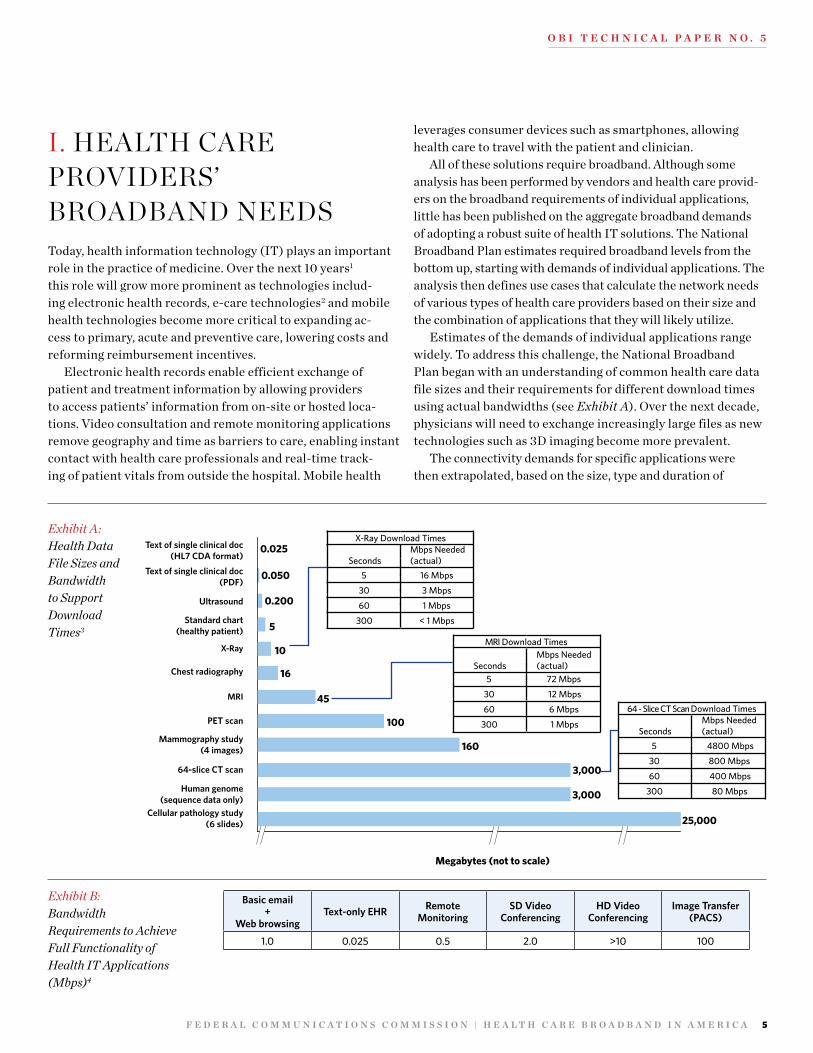
i. hEalth CarE providErs’ broadband nEEdsToday, health information technology (IT) plays an important role in the practice of medicine . Over the next 10 years1 this role will grow more prominent as technologies includ-ing electronic health records, e-care technologies2 and mobile health technologies become more critical to expanding ac-cess to primary, acute and preventive care, lowering costs and reforming reimbursement incentives .
Electronic health records enable efficient exchange of patient and treatment information by allowing providers to access patients’ information from on-site or hosted loca-tions . Video consultation and remote monitoring applications remove geography and time as barriers to care, enabling instant contact with health care professionals and real-time track-ing of patient vitals from outside the hospital . Mobile health
leverages consumer devices such as smartphones, allowing health care to travel with the patient and clinician .
All of these solutions require broadband . Although some analysis has been performed by vendors and health care provid-ers on the broadband requirements of individual applications, little has been published on the aggregate broadband demands of adopting a robust suite of health IT solutions . The National Broadband Plan estimates required broadband levels from the bottom up, starting with demands of individual applications . The analysis then defines use cases that calculate the network needs of various types of health care providers based on their size and the combination of applications that they will likely utilize .
Estimates of the demands of individual applications range widely . To address this challenge, the National Broadband Plan began with an understanding of common health care data file sizes and their requirements for different download times using actual bandwidths (see Exhibit A) . Over the next decade, physicians will need to exchange increasingly large files as new technologies such as 3D imaging become more prevalent .
The connectivity demands for specific applications were then extrapolated, based on the size, type and duration of
Exhibit A: Health Data File Sizes and Bandwidth to Support Download Times3
Text of single clinical doc(HL7 CDA format)
Text of single clinical doc(PDF)
Ultrasound
Standard chart(healthy patient)
X-Ray
Chest radiography
MRI
PET scan
Mammography study(4 images)
64-slice CT scan
Human genome(sequence data only)
Cellular pathology study(6 slides)
0.025
0.050
5
10
16
45
100
160
3,000
3,000
25,000
X-Ray Download Times
SecondsMbps Needed(actual)
5 16 Mbps
30 3 Mbps
60 1 Mbps
300 < 1 Mbps
MRI Download Times
SecondsMbps Needed(actual)
5 72 Mbps
30 12 Mbps
60 6 Mbps
300 1 Mbps
64 - Slice CT Scan Download Times
SecondsMbps Needed(actual)
5 4800 Mbps
30 800 Mbps
60 400 Mbps
300 80 Mbps
0.200
Megabytes (not to scale)
Basic email+
Web browsingText-only EHR Remote
MonitoringSD Video
ConferencingHD Video
ConferencingImage Transfer
(PACS)
1.0 0.025 0.5 2.0 >10 100
Exhibit B:Bandwidth Requirements to Achieve Full Functionality of Health IT Applications (Mbps)4

6 F e d e r a l C o m m u n i C a t i o n s C o m m i s s i o n | W W W . B r o a d B a n d . g o V
h e a l t h C a r e B r o a d B a n d i n a m e r i C a
Exhibit C: Health IT Use Cases and Associated Actual Broadband Requirements
Delivery Setting Use Profile Key Assumptions
Rec. Bandwidth
(Mbps)
Solo PrimaryCare Practice
• Supports practice management functions (billing, scheduling, etc.), email and web browsing
• Allows simultaneous use of EHR and high-quality SD video consultations
• Enables non real-time image downloads• Enables remote monitoring
• Three total users per doctor for EHR and other general web-based activities
• Image files (~10MB) should download in less than 30 seconds
≥ 4
Small PrimaryCare Practice
(2–4 physicians)
• Supports practice management functions (billing, scheduling, etc.), email and web browsing
• Allows simultaneous use of EHR and high-quality SD video consultations
• Enables non real-time image downloads• Enables remote monitoring• Makes possible use of HD video consultations
• Three total users per doctor for EHR and other general web-based activities
• Two simultaneous high-quality SD video consultations
• Image files (~10MB) should download in less than 30 seconds
≥ 10
Nursing Home
• Supports facility management functions, email and web browsing
• Enables remote monitoring of resident population• Allows simultaneous use of EHR and high-quality
SD video consultations
• Enables non real-time image downloads• Makes possible use of HD video consultations
• Five simultaneous users of general facility management and web-based activities
• Two simultaneous high-quality SD video consultations
• Image files (~10MB) should download in less than 30 seconds
≥ 10
Rural Health Clinic(~5 practitioners)
• Supports clinic management functions (billing, scheduling, etc.), email and web browsing
• Allows simultaneous use of EHR and high-quality SD video consultations
• Enables non real-time image downloads• Enables remote monitoring• Makes possible use of HD video consultations
• Three total users per practitioner for EHR and other general web-based activities
• Two simultaneous high-quality SD video consultations
• Image files (~10MB) should download in less than 30 seconds
≥ 10
Clinic / LargePhysician Practice(5–25 physicians)
• Supports clinic management functions (billing, scheduling, etc.), email and web browsing
• Enables real-time image transfer• Allows simultaneous use of EHR and high-quality
SD video consultations
• Enables remote monitoring• Makes possible use of HD video consultations
• Specialty services (e.g., radiology, orthopaedics, dermatology) provided
• Three total users per practitioner for EHR and other general web-based activities
• Large image files (~20MB) should transfer in less than 10 seconds
• Five simultaneous high-quality SD video consultations
≥ 25
Hospital
• Supports hospital management functions (billing, scheduling, etc.), email and web browsing
• Enables real-time image transfer
• Allows simultaneous use of EHR and high-quality SD video consultations
• Enables continuous remote monitoring
• Makes possible use of HD video consultations
• PACS in place for real-time diagnostic imaging
• Very large image files (~50MB) should transfer in less than 5 seconds
• Mulitple simultaneous high-quality SD video consultations
≥ 100
Academic / Large Medical Center • Same as hospital
• Same as hospital, but scale of demands on largest medical centers drives exponential bandwidth needs
≥ 1 Gbps

o B i t e C h n i C a l P a P e r n o . 5
F e d e r a l C o m m u n i C a t i o n s C o m m i s s i o n | h e a l t h C a r e B r o a d B a n d i n a m e r i C a 7
data transmission associated with each . Extensive input from industry experts and health care professionals validated actual connectivity required to enable full functionality of health IT applications . Basic email plus web browsing, text-based EHRs, remote monitoring, standard definition videoconferencing, high definition videoconferencing and image transfer were evaluated (see Exhibit B) .
Health care institutions, depending on the type of facility, concurrently use a range of applications . The plan developed use cases to determine real-life guidelines of required actual bandwidths . The use cases examine seven common types of health care institutions: Solo Primary Care Practices, Small Primary Care Practices, Nursing Homes, Rural Health Clinics, Clinics/Large Physician Practices, Hospitals and Large Medical Centers . Based on the size and clinical practices of
Quality Metric Recommended Target*
Reliability (uptime) 99.9%
Latency <50 ms primary <120 ms back-up
Jitter <20 ms
Packet loss <1%
* Recommended targets reflect findings from interviews and submissions to the public record.
Exhibit D: Quality-of-Service Requirements
these different institutions, the use cases profile technologies each type of provider utilizes and the number of concurrent users to be supported, which translate into minimum actual broadband requirements .
Quality-of-service metrics are also crucial to health IT uti-lization . Latency, reliability, packet loss, and jitter can be even more important than bandwidth in supporting applications . Certain remote monitoring technologies, for instance, may require very low latency in order to pass through high priority events like alarms . Although the plan uses input from indus-try experts, health care practitioners and vendors to establish these quality-of-service requirements, further analysis is need-ed to refine them for specific provider types . General guidelines for quality-of-service metrics are shown in Exhibit D .

8 F e d e r a l C o m m u n i C a t i o n s C o m m i s s i o n | W W W . B r o a d B a n d . g o V
h e a l t h C a r e B r o a d B a n d i n a m e r i C a
ii. broadband ConnECtivity optionsMost businesses in the United States, health care institutions included, have two choices of broadband service categories: mass-market “small business” solutions or Dedicated Internet Access (DIA), such as DS3 or Gigabit Ethernet service . DIA solutions often offer higher bandwidth, and include broader and stricter Service Level Agreements (SLAs) by network operators .
According to the estimated actual broadband needs listed above, only smaller delivery settings can consistently adopt health IT using mass-market solutions . As mass-market solu-tions increasingly bring a reliable 50–100 Mbps to institutions, this may change . However, most larger practices currently must purchase Dedicated Internet Access . Within DIA options, T1s and most bonded T1s will not provide sufficient bandwidth levels; providers have to adopt more robust, often fiber-based, technologies .
It is important to note that bandwidth is just one metric affected by these different technologies . Latency, reliability, packet loss, and jitter also vary for each of the network tech-nologies listed in Exhibit E, independent of the bandwidth levels . Low latency, for instance, does not perfectly correlate with high bandwidth . DIA services offer a solution to this challenge by guaranteeing quality-of-service levels as well as bandwidth levels .
Unfortunately, DIA services are substantially more expen-sive than mass-market packages . For example, in Los Angeles, 10 Mbps Ethernet service with an SLA averages $1,044/month, while Time Warner Cable’s similar mass-market package, Business Class Professional, which offers 10 Mbps download speeds and 2 Mbps upload speeds, is approximately $400/month .5
Protocols Common Broadband Access/Circuit Types Common Associated Bandwidths
Mass Market Broadband (Consumer
or Business Class Internet Service)
ISDN
Speeds range greatly according to packageFixed Wireless Access
DSL
Cable (DOCSIS)
Dedicated Internet Access
Fractional T1 < 1.5 Mbps
T1 1.5 Mbps
Bonded T1 3–6 Mbps
Fractional DS3 6–45 Mbps
Fast Ethernet 10–100 Mbps
DS3 45 Mbps
OC3 155 Mbps
Gig Ethernet 100–1,000 Mbps
Satellite Speeds range
Exhibit E:Common Broadband Access Options for Health Care Providers6

o B i t e C h n i C a l P a P e r n o . 5
F e d e r a l C o m m u n i C a t i o n s C o m m i s s i o n | h e a l t h C a r e B r o a d B a n d i n a m e r i C a 9
iii. gaps and barriErs prEvEnting suffiCiEnt broadband lEvElsBecause broadband options vary greatly according to the type and size of a health care institution, the barriers associated with acquiring broadband also differ according to type and size . The National Broadband Plan analyzes connectivity barriers for three different segments of providers: Small Practices (one to four physicians, includes nursing homes), Large Practices (five physicians and more) and Federally Funded Providers .
Exhibit F approximates the health care landscape for those three segments . The overall count of physicians was gained courtesy of the American Medical Association’s “Physician Masterfile Database (2009) .” This one-of-a-kind database tracks the address of every location where physicians practice in the United States; it can also provide a count of the number of physicians practicing at each location . The federally funded provider segment that the National Broadband Plan considered included every Federally Qualified Health Center (FQHC),7 Rural Health Clinic (RHC),8 Critical Access Hospital (CAH)9
and Indian Health Service (IHS) location in the country . The count does not include Veterans Health Administration, Public Health Departments and federally funded mental health facili-ties due to the dificulty in obtaining their locations . These facilities should be included in future analyses .
Small ProviderS (Four or Fewer Physicians)In general, smaller providers can achieve satisfactory health IT adoption with mass-market “small business” packages of at least 4 Mbps for single physician practices and 10 Mbps for two-to-four physician practices, even though these solutions may not provide business-grade quality-of-service guarantees .10 Since most small physician offices do not provide acute care services, they do not require the same degree of instant and guaranteed responsiveness that large practices and hospitals require .
For small providers, the key connectivity consideration is whether or not they can access mass-market solutions of suf-ficient bandwidth . As long as they are within the mass-market infrastructure footprint, they are likely to have a more conve-nient and affordable option than the Dedicated Internet Access necessary for their larger peers (see pricing example for Los Angeles above) .
The National Broadband Plan completed the first estimate of how many small providers are located outside the mass-market infrastructure footprint . All AMA locations with four physicians or fewer were inputted into a new model developed by the Omnibus Broadband Initiative (OBI) . The model pre-dicts the availability of wired and wireless technologies at the census block level throughout the country .11 Please see working paper “The Broadband Availability Gap” (http://download .broadband .gov/plan/the-broadband-availability-gap-obi- technical-paper-no-1 .pdf ) for further discussion of this model .
Based on the requirements listed above, an estimated 3,600 out of approximately 307,000 small providers face a broadband connectivity gap (adequate mass-market broadband is not available to them) . The gap is particularly wide among provid-ers in rural areas . In rural areas, approximately seven percent of small physician offices are estimated to face a connectivity gap . In contrast, across all locations, only approximately one percent of physician offices face a connectivity gap (see Exhibit G) .12
Exhibit F:Approximate Count of Health Care Locations in the United States
Medium & Large Providers Federally Funded Providers*
13,00039,000
307,000
Small Providers
~346,000 Locations with Practicing Physicians* Federally FundedProviders is not a discrete category. Overlaps completely with the other two categories.

1 0 F e d e r a l C o m m u n i C a t i o n s C o m m i s s i o n | W W W . B r o a d B a n d . g o V
h e a l t h C a r e B r o a d B a n d i n a m e r i C a
medium & large ProviderS (Five or more PhySicianS) Larger physician offices, clinics and hospitals face connectivity barriers of a different nature . Because of their size and service offerings, these providers often cannot rely on mass-market broadband and must usually purchase DIA solutions .
One major difference between mass-market and DIA solutions is that DIA is available everywhere . Broadband service providers offer customized solutions for customers who are willing to pay for them, no matter where they are located . For instance, even in rural Alaska where no broadband infrastructure exists, clinics are able to pay for satellite connections equivalent to multi-bonded T1s, but these cost $10,000 or more per month .14
Therefore, the major barrier for medium and large providers is not access—it is price . As noted in the Los Angeles example above, DIA solutions are often significantly more expensive than mass-market solutions with similar bandwidths . Within DIA service offerings, prices jump substantially between T1 connections and higher levels of service such as DS3s . As a result, anecdotal data indicate that providers who purchase DIA solutions often buy connections that are too slow to meet their health IT needs . For instance, 92% of IHS sites and over 80% of institutions in the FCC’s Rural Health Care Program are purchasing T1s (1 .5 Mbps) when, ideally, they need 4–1,000 Mbps to meet their operational needs .15
DIA pricing also varies significantly by geography . Prices are determined on a case-by-case basis depending on factors such as capacity, type and length of the connection, type of service provider, and type of facility used . Exhibit H illustrates how widely DIA prices fluctuate in urban areas alone .
For two large physician offices seeking to capitalize on mean-ingful use incentives, a disparity of more than $27,000 per year16
in broadband costs could put one at a major disadvantage to the
other, possibly negates a significant portion of the incentives, and may prove an insurmountable obstacle to EHR adoption .
Moreover, rural and tribal areas are likely to face even great-er price inequities . There are more than 2,000 rural providers participating in the FCC’s Telecommunications Fund, and their broadband prices average two and a half times the price of ur-ban benchmarks .17 This analysis indicates that rural providers receive an average 60 percent discount on their cost of service, which reflects the rural/urban cost differential .18
In order to gain a more developed understanding of the price barriers for medium and large practices in various regions of the country, there must be better data19 on the nature of those barriers . These data would not only provide a more representa-tive picture of actual adoption rates of broadband services (as opposed to availability), but could show how wide and severe price disparities are across the country .
Federally Funded ProviderS The National Broadband Plan took a closer look at the feder-ally funded provider segment because it has a direct impact on the government’s costs and serves health care populations for whom the government assumes responsibility .
The Plan entered databases of Rural Health Clinics (RHC), Federally Qualified Health Centers (FQHC), Critical Access Hospitals (CAH) and Indian Health Service (IHS) locations into the predictive broadband availability model discussed above . This allowed a comparison between mass-market broadband availability for these locations and mass-market availability for all locations in the country . The analysis demonstrates that the four groups of providers analyzed face relatively greater chal-lenges in securing broadband (see Exhibit I) . This conclusion is not surprising, as these providers serve patient populations lo-cated in some of the most rural and economically disadvantaged
Exhibit G:Estimate of Small Physician Locations Without Mass-Market Broadband Availability13
0
1,000
2,000
3,000
4,000
5,000
Small PhysicianO�ces (non-rural)
All Small PhysiciansSmall PhysicianO�ces (rural)
Approx. Number of Locations
70% ofTotal
30% ofTotal
3,600
1,100
2,500

o B i t e C h n i C a l P a P e r n o . 5
F e d e r a l C o m m u n i C a t i o n s C o m m i s s i o n | h e a l t h C a r e B r o a d B a n d i n a m e r i C a 1 1
Exhibit H:Wide Fluctuations in Dedicated Internet Access Prices20
Wyoming Mississippi Kansas Vermont0
2,000
4,000
6,000
2,8003,680
4,2905,082
Monthly service cost ($)
$1.8x
Wyoming Mississippi Kansas Vermont0
2,000
4,000
6,000
225 336 390 586
$
2.6x
DS3(45 Mbps)
DS1(1.5 Mbps)
areas of the country . These challenges materialize in terms of ac-cess for small providers, and higher costs relative to their peers for medium and large providers . Importantly, providers in areas without mass-market broadband can still access connectivity via DIA solutions, albeit at a greater price .
A more precise analysis will be grounded in an under-standing of actual levels and cost of broadband purchased by federally funded providers . Indian Health Service, for instance, tracks the broadband type purchased and bandwidth levels
achieved for each of its sites . Its database shows that 92% of locations are purchasing T1 (1 .5 Mbps) connections or slower, and that it would cost $29 million to upgrade these ~630 sites to sufficient levels of connectivity .22 The same information is currently not available for FQHCs, RHCs or CAHs, but it should be collected . The analysis should also be widened to included VHA, BOP, NASA, and federally funded mental health facilities .
Exhibit I:Health Care Locations Without Mass-Market Broadband Availability21
3,700 670
All locations withPhysicians
FQHCs Critical AccessHospitals
Federally Funded Providers
Rural Health Clinics IHS Locations
Total Numberof Locations
With MassMarket Broadband(Estimated %)
Without MassMarket Broadband(Estimated %)
346,000 7,800 1,300
1%
99%
9%
91% 74% 71% 67%
26% 29% 33%

1 2 F e d e r a l C o m m u n i C a t i o n s C o m m i s s i o n | W W W . B r o a d B a n d . g o V
h e a l t h C a r e B r o a d B a n d i n a m e r i C a
iv. nExt phasE of analysisUnderstanding the state of broadband connectivity for health care providers is a relatively new, but important area of analy-sis . There is more to be done, especially as the need for better data continues to grow . As nascent health IT applications become more prevalent and the importance of wireless con-nectivity grows, an up-to-date understanding of broadband use cases and connectivity levels will be invaluable . Specific data needs and analyses are suggested in each of the sections above .

o B i t e C h n i C a l P a P e r n o . 5
F e d e r a l C o m m u n i C a t i o n s C o m m i s s i o n | h e a l t h C a r e B r o a d B a n d i n a m e r i C a 1 3
1 The National Broadband Plan set a goal for 2020 of 100 Mbps to over 100 million house-holds and 1 Gbps to at least one anchor institution in each community, such as a hospital . Omnibus Broadband Initiative, Federal Communications Commission, Connected America: The National Broadband Plan (2010), available at http://www.broadband.gov/plan/, at Chapter 2 . By then the health IT requirements outlined here will be out-of-date and likely too low . This paper’s primary concern is the needs of health care providers now and in the immediate future .
2 As used herein, “e-care technologies” includes remote monitoring, video consultations and remote image diagnostics .
3 GE Healthcare Comments in re NBP PN #17 (Comment Sought On Health Care Delivery Elements of National Broadband Plan – NBP Public Notice #17, GN Docket Nos . 09-47, 09-51, 09-137, WCB Docket No 02-60, Public Notice, 24 FCC Red 13728 (WCB 2009) (NBP PN #17)), filed Dec . 4, 2009, at 8; Euclid Seeram, Digital Image Compression, Radiologic Tech ., July–Aug . 2005, http://www .entrepreneur .com/tradejournals/article/ 134676840 .html; Human Genome Project Information, Frequently Asked Questions, http://www .ornl .gov/sci/techresources/Human_Genome/faq/faqs1 .shtml (last visited Jan . 31, 2010); Ichiro Mori et al ., Issues for Application of Virtual Microscopy to Cyto-screening, Perspectives Based on Questionnaire to Japanese Cytotechnologists, diagnosTic PaThology, July 15, 2008, http://www .diagnosticpathology .org/content/pdf/1746-1596-3-S1-S15 .pdf . See, e.g., DICOM sample image sets, http://pubimage .hcuge .ch:8080/ (last visited Jan . 31, 2010) .
4 Mbps recommendations reflect a compilation of the record . Numbers are guidelines, not precise measures . See Record in response to NBP PN #17 and ex parte filings (see, e.g., Letter from Alice Borelli, Director, Global Health Care and Workforce Policy, Intel Cor-poration, to Marlene H . Dortch, Secretary, FCC, GN Docket Nos . 09-47, 09-51, 09-137 WCB Docket No 02-60 (Dec . 16, 2009)) . See also, e.g., FibeRuTiliTies gRouP, a PRacTical Review oF bRoadband RequiRemenTs FoR healThcaRe clinical aPPlicaTions 6–7 (2009), available at http://www .fiberutilities .com/documents/FG_Press_Release_FCC_Brief-ing_Healthcare_Application_Requirements_for_Broadband_110609 .pdf .
5 TimeWarner Business Class Professional 10 x 2, listed at $399 .95 / month on TimeWar-ner Los Angeles website . Taxes and other surcharges not factored in . See Time Warner Cable Business Class, https://www .twcbc .com/LA/buyflow/buyflow .ashx (last visited Feb . 27, 2010) (requires providing additional information to access) .
6 For requirements, see Exhibit D and note 1 . 7 “FQHCs are ‘safety net’ providers such as community health centers, public housing cen-
ters, and programs serving migrants and the homeless . The main purpose of the FQHC Program is to enhance the provision of primary care services in underserved urban and rural communities .” Cms, FedeRally qualiFied healTh cenTeR FacT sheeT 1 (2009), http://www .cms .hhs .gov/MLNProducts/downloads/fqhcfactsheet .pdf . FQHCs qualify for cost-based CMS reimbursement and other benefits .
8 “The Rural Health Clinic Program was established in 1977 to address an inadequate sup-ply of physicians who serve Medicare and Medicaid beneficiaries in rural areas .” CMS, RuRal healTh clinic FacT sheeT 1 (2007), http://www .cms .hhs .gov/MLNProducts/Downloads/rhcfactsheet .pdf . Clinics must meet criteria established by HHS, includ-ing being located in rural area and in a Health Provider Shortage Area or a Medically Underserved Area . RHC institutions qualify for cost-based CMS reimbursement and other benefits .
9 Critical Access Hospitals are hospitals qualified to receive cost-based reimbursement from Medicare and are important components of states’ rural health networks . See gener-ally cms, cRiTical access hosPiTals FacT sheeT (2009) (discussing what qualifies as a Critical Access Hospital), available at http://www .cms .hhs .gov/MLNProducts/down-loads/CritAccessHospfctsht .pdf .
10 Statement reflects compilation of the record and is a guideline, not a comprehensive re-quirement . Record in response to NBP PN #17 and ex parte filings (see, e.g., Letter from Winifred Wu, MD, MPH, Director, Public Health Informatics, New York City Depart-ment of Health and Mental Hygiene, to Marlene H . Dortch, Secretary, FCC, GN Docket Nos . 09-47, 09-51, 09-137 WCB Docket No 02-60 (Feb . 26, 2010)) .
11 Please see working paper “The Broadband Availability Gap” (http://download .broad-band .gov/plan/the-broadband-availability-gap-obi-technical-paper-no-1 .pdf ) for further discussion of this model .
12 Access to mass-market broadband is used here to mean passed by terrestrial broadband access facilities such as those used to deliver DSL or cable modem service . This analysis does not predict how many of the 307,000 small providers purchase the appropriate level of broadband; only the mass-market broadband available to them . The analysis is a predictive estimate combining the FCC’s statistical network model and provider data-bases, as shown below . Gap is calculated based on connectivity requirement threshold of 4 Mbps for Single Physician Practices and 10 Mbps for all other practices . AMA small provider locations (four physicians or less) were assigned to an appropriate census block, based on their street address, and then reconciled with the model showing connectivity availability for that census block . About 24,000 (or 7%) of the health care locations in the AMA database had addresses that were impossible to convert accurately to census blocks; results for these locations were modeled to complete the analysis . A small percentage of the records (less than 1 .5%) were geographically located outside of the Master Broadband Availability data (e .g ., Puerto Rico), and therefore were dropped from consideration in the connectivity analysis . The analysis does not take into account other network quality requirements . Some of these locations may have alternative networks or commercial services, where residential broadband is unavailable .
• FCC Deployment Baseline Analysis: See omnibus bRoadband iniTiaTive, The bRoadband availabiliTy gaP (http://download .broadband .gov/plan/the-broadband-availability-gap-obi-technical-paper-no-1 .pdf ) . The OBI deployment team created a nationwide model for broadband availability from wired and wireless technologies .
• Database of all locations in the United States with practicing physicians: Am . Med . Ass’n, AMA Physician Masterfile Database (2009) (on file with the FCC) . The Physician Masterfile includes current and historical data for more than 940,000 residents and physicians and approximately 77,000 students in the United States . Includes all active practicing physicians in the US (655,630) and the addresses where they practice . Sorting by address sorts 655,630 physicians into 351,172 locations, with a size metric for each one based on how many physician entries are associated with each location entry . Removed 5,077 locations in Puerto Rico and other locations that were not included in the Statistical Model, leaving 346,095 loca-tions for our analysis . Detailed information on this database is available from the AMA . AMA Physician Masterfile, http://www .ama-assn .org/ama/pub/about-ama/physician-data-resources/physician-masterfile .shtml (last visited Feb . 27, 2010) .
• FCC’s Rural definition, 47 C .F .R . § 54 .5: “For purposes of the rural health care universal service support mechanism, a ‘rural area’ is an area that is entirely outside of a Core Based Statistical Area; is within a Core Based Statistical Area that does not have any Urban Area with a population of 25,000 or greater; or is in a Core Based Statistical Area that contains an Urban Area with a population of 25,000 or greater, but is within a specific census tract that itself does not contain any part of a Place or Urban Area with a population of greater than 25,000 . ‘Core Based Statistical Area’ and ‘Urban Area’ are as defined by the Census Bureau and ‘Place’ is as identified by the Census Bureau .”
13 Ibid . 14 Letter from Ellen Satterwhite, Policy Analyst, Omnibus Broadband Initiative to Marlene
H . Dortch, Secretary, FCC, GN Docket No . 09-51 (August 16, 2010) . 15 Letter from Theresa Cullen, MD, MS, RADM, U .S . Public Health Service Chief Information
Officer and Director, to Marlene H . Dortch, Secretary, FCC, GN Docket Nos . 09-47, 09-51, 09-137, WC Docket No . 02-60 (Feb . 23, 2010) Attach . (IHS Ex Parte) Indian Health Service calculated the annual cost to upgrade its broadband networks to the minimum require-ments in Exhibit C, supra . Estimates were made using median prices paid across its 600+ location system . Competitive bidding and selective network deployment similar to the FCC’s universal service programs will likely reduce prices . Also, as ARRA funding through BIP and BTOP is spent on Tribal lands, the prices for service may decline .
E n d n o t E s

1 4 F e d e r a l C o m m u n i C a t i o n s C o m m i s s i o n | W W W . B r o a d B a n d . g o V
h e a l t h C a r e B r o a d B a n d i n a m e r i C a
16 Difference between DS3 purchased in Wyoming versus Vermont for one year of service, according to rates listed in Exhibit H, supra, is $27,384 .
17 Letter from William England, Vice President, Rural Health Care Division, Universal Service Administrative Company, to Marlene H . Dortch, Secretary, FCC, GN Docket Nos . 09-47, 09-51, 09-137 (Feb . 23, 2010) (USAC Feb . 23, 2010 Ex Parte) at 1 . If locations in Alaska are excluded, the participants’ broadband price still averages 3x the price of their urban benchmarks .
18 See id .19 Specifically: 1) what type of broadband such providers are purchasing, 2) what actual
bandwidths and quality metrics they are realizing from their broadband, and 3) how much they are paying in overall broadband costs .
20 Wyoming, Mississippi, Kansas, and Vermont prices: USAC, Urban Rate Search Tool, http://www .usac .org/rhc/tools/rhcdb/UrbanRates/search .asp (last visited Feb . 8, 2010) (use 2009 data) .
21 Access to mass-market broadband is used here to mean passed by terrestrial broadband access facilities such as those used to deliver DSL or cable modem service . This analysis does not predict how many of the providers purchase the appropriate level of broadband; only the mass-market broadband available to them . The analysis is a predictive estimate combining the FCC’s statistical network model and provider databases as shown below . Gap is calculated based on connectivity requirement threshold of 4 Mbps for Single Physician Practices and 10 Mbps for all other practices . Health care locations were as-signed to an appropriate census block, based on their street address, and then reconciled with the model showing connectivity availability for that census block . For each database, a percentage of the health care locations had addresses that were impossible to convert accurately to census blocks; results for these locations were modeled to complete the analysis . For the AMA, this accounted for ~24,000 (or 7%) of total entries . For IHS, this accounted for ~350 (or 52%) of entries . Additionally, the FQHC database contained duplicate location records, which were excluded from the connectivity analysis . A small percentage of the records (less than 1 .5%) were geographically located outside of the Master Broadband Availability data (e .g ., Puerto Rico), and therefore were dropped from consideration in the connectivity analysis . The analysis does not take into account other network quality requirements . Some of these locations may have alternative networks or commercial services, where residential broadband is unavailable .
• FCC Deployment Baseline Analysis: see discussion ch . 3 endnotes, supra . The OBI deployment team created a nationwide model for broadband availability from wired and wireless technologies . Database of all locations in the United States with prac-ticing physicians: AMA, AMA Physician Masterfile Database (2009) (on file with the FCC), “The Physician Masterfile includes current and historical data for more than 940,000 residents and physicians and approximately 77,000 students in the United States .” Includes all active practicing physicians in the US and the addresses where they practice . Sorting by address sorts 655,630 physicians into 346,095 locations, with a size metric for each one based on how many physician entries are associated with each location entry . Removed 5,077 locations in Puerto Rico and other locations that were not included in the Statistical Model, leaving 346,095 loca-tions for our analysis . Detailed information on this database is available from the AMA . AMA Physician Masterfile, http://www .ama-assn .org/ama/pub/about-ama/physician-data-resources/physician-masterfile .shtml (last visited Feb . 27, 2010) .
• Federally Qualified Health Center Database: HRSA Electronic Handbooks, Bureau of Primary Health Care Management Information System, Scope Reposi-tory retrieved via the HRSA Geospatial Data Warehouse’s Health Care Service Delivery Sites report at http://datawarehouse .hrsa .gov/HGDWReports/RT_App .aspx?rpt=HS, retrieved on Oct . 24, 2009 .
• Rural Health Clinic Database: CMS, Name and Address Listing For Rural Health Clinic Database (accessed Oct . 6, 2009) . Updated versions are available at http://www .cms .hhs .gov/MLNProducts/downloads/rhclistbyprovidername .pdf .
• Critical Access Hospitals Database: HHS, Health Resources and Services Admin-istration, HRSA Geospatial Data Warehouse—Report Tool, http://datawarehouse .hrsa .gov/HGDWReports/RT_App .aspx?rpt=P2 (providing data snapshot from Sept . 30, 2009) .
• IHS Database: IHS Ex Parte, Attach . 22 IHS Ex Parte, Attach . Indian Health Service calculated the annual cost to upgrade its
broadband networks to the minimum requirements in Exhibit C, supra . Estimates were made using median prices paid across its 600+ location system . Competitive bidding and selective network deployment similar to the FCC’s universal service programs will likely reduce prices . Also, as ARRA funding through BIP and BTOP is spent on Tribal lands, the prices for service may decline .