Embed Size (px)
Citation preview

Kristin Gorski, Director, The Nielsen CompanySeptember 20, 2015
HEALTH CARE AND INDUSTRY TRENDS
2
Co
pyr
igh
t ©
2015
Th
e N
iels
en C
om
pan
y. C
on
fid
enti
al a
nd
pro
pri
etar
y.
AGENDA
U.S. Retail Hot Buttons: December 19, 2014
1. Retail/CPG Industry Overview
2. Private Label Overview
3. Population & Demographic Trends
4. Health Care Category Performance
5. Digital Shopping & Digital Retailing
6. Health & Wellness Trending
7. Key Takeaways & Closing Thoughts

INDUSTRY OVERVIEW
Co
pyr
igh
t ©
2015
Th
e N
iels
en C
om
pan
y. C
on
fid
enti
al a
nd
pro
pri
etar
y.
4
RETAIL HOT BUTTONS
Price & Value
Winning with Non-Edibles
Food Fight
Health & Wellness
Private Brands
Sustainability
Right-Sized Box
Experiential Retailing
Connecting with Shoppers That Matter
Digital Shopping
Co
pyr
igh
t ©
2015
Th
e N
iels
en C
om
pan
y. C
on
fid
enti
al a
nd
pro
pri
etar
y.
5
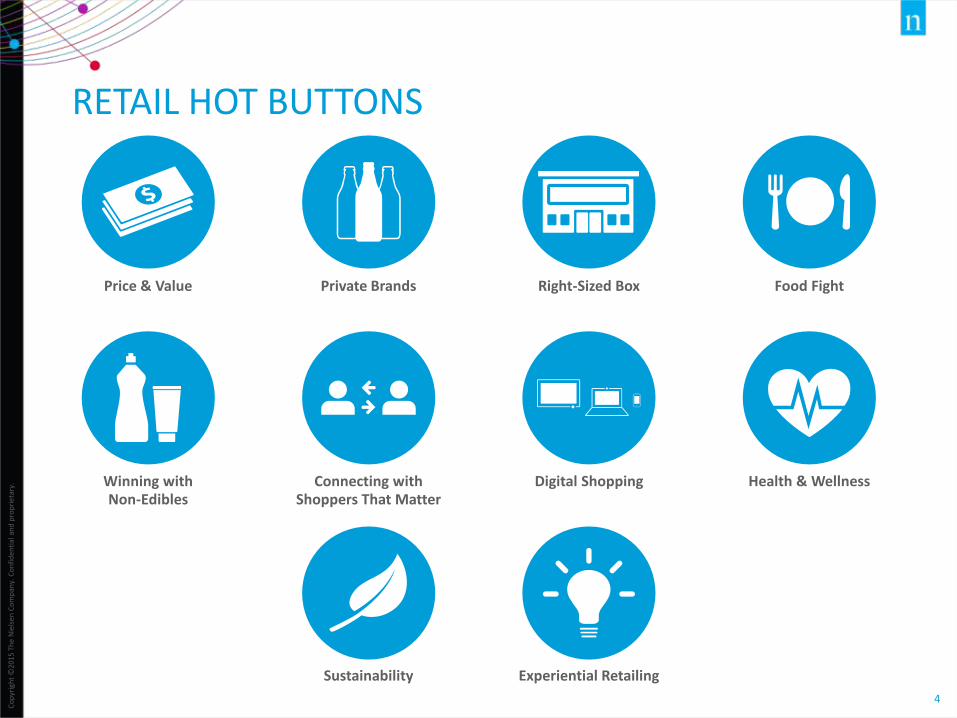
Units
“DEATH BY A 1,000 CUTS”
Aging population
Delayed family starts
Smaller households
Multicultural infants
Immigration
Job market Payroll taxesIncome squeeze
Food stamps Gas prices
Weather impact
Higher prices/reduced
promotions
Alternative channels
Away-from-home
consumption
Prepared meals
Consumption patterns
DIY movement

Co
pyr
igh
t ©
2015
Th
e N
iels
en C
om
pan
y. C
on
fid
enti
al a
nd
pro
pri
etar
y.
6
CONVENIENCE & VALUE WINNING, BUT NOT MUCH GROWTH GAP BETWEEN VALUE & SUPERMARKETSAll Departments – Dollar Sales & Trend
Source: Nielsen Answers, Total U.S., 52 weeks ending 06/27/2015 (vs. year ago); *Club Stores, Dollar Stores, Mass-Merchandisers, Supercenters, & Military
1.9%
0.1%
4.2%
2.8%
$0
$50
$100
$150
$200
$250
$300
$350
$400
Bill
ion
s Supermarkets
C-Stores
Drug Stores
Value*
Low Growth High Growth
Total measured channels: $811 Billion & up 2.5%
UPC-coded items

Co
pyr
igh
t ©
2015
Th
e N
iels
en C
om
pan
y. C
on
fid
enti
al a
nd
pro
pri
etar
y.
7
CONVENIENCE & VALUE DRIVE STORE EXPANSION
Source: Nielsen TDLinx
152,794
41,799
33,566
26,572
3,886
4,150
1,320
Convenience
Drug
Supermarkets $2MM+
Dollar Stores
Mass Merch
Supercenters
Warehouse Clubs2014
Expansion from all formats but Mass Merchandisers in 2014 vs. previous year
U.S. Store Counts
72% + of growth from niche formats
Value & Convenience
vs. 2005

8
Co
pyr
igh
t ©
2015
Th
e N
iels
en C
om
pan
y. C
on
fid
enti
al a
nd
pro
pri
etar
y.
Household Income
% of Households 30 34 36
RETAIL PERFORMANCE LINKED TO SPENDING POWER OF SHOPPERS
Source: Nielsen Homescan, Total U.S., excludes gas only or Rx only trips, 52-weeks ending 12/27/2014
24%
12%
17%
18%
24%
24%
29%
28%
46%
33%
28%
30%
31%
31%
33%
33%
36%
33%
44%
60%
53%
50%
46%
43%
38%
36%
21%
Total Outlets
Club
Pet
HHI
Online
Grocery
Drug
Mass
Dollar
$29k or less $30 - $69.9k $70k +
Share of Basket Ring Dollar Sales by Household Income

Co
pyr
igh
t ©
2015
Th
e N
iels
en C
om
pan
y. C
on
fid
enti
al a
nd
pro
pri
etar
y.
9
INFLATION & DEMAND DRIVING GROWTH
Source: Nielsen Answers, Total U.S. – All Outlets Combined (plus Convenience), 52 weeks ending 06/27/2015 (vs. year ago), UPC-coded
2%-2%
1%1%
1%2%
2%2%
2%3%
3%4%
5%5%
6%7%
Total All DepartmentsGeneral Merchandise
Frozen FoodsPet Care
Tobacco & AlternativesHousehold Care
GroceryBakery
Beauty CarePersonal Care
DairyAlcohol
DeliProduce
Health CareMeat
All departments except General Merchandise growing
All Outlets Combined (plus Convenience) – Dollar Trend
UPC-coded items
10
Co
pyr
igh
t ©
2015
Th
e N
iels
en C
om
pan
y. C
on
fid
enti
al a
nd
pro
pri
etar
y.
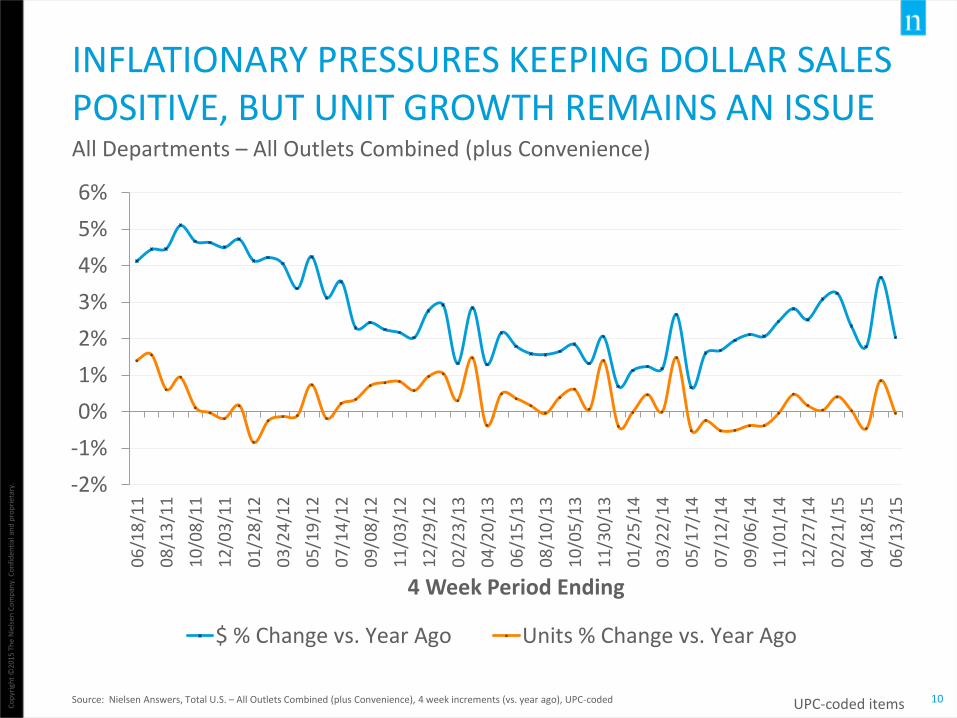
INFLATIONARY PRESSURES KEEPING DOLLAR SALES POSITIVE, BUT UNIT GROWTH REMAINS AN ISSUE
Source: Nielsen Answers, Total U.S. – All Outlets Combined (plus Convenience), 4 week increments (vs. year ago), UPC-coded
-2%
-1%
0%
1%
2%
3%
4%
5%
6%
06
/18
/11
08
/13
/11
10
/08
/11
12
/03
/11
01
/28
/12
03
/24
/12
05
/19
/12
07
/14
/12
09
/08
/12
11
/03
/12
12
/29
/12
02
/23
/13
04
/20
/13
06
/15
/13
08
/10
/13
10
/05
/13
11
/30
/13
01
/25
/14
03
/22
/14
05
/17
/14
07
/12
/14
09
/06
/14
11
/01
/14
12
/27
/14
02
/21
/15
04
/18
/15
06
/13
/15
4 Week Period Ending
$ % Change vs. Year Ago Units % Change vs. Year Ago
All Departments – All Outlets Combined (plus Convenience)
UPC-coded items
11
Co
pyr
igh
t ©
2015
Th
e N
iels
en C
om
pan
y. C
on
fid
enti
al a
nd
pro
pri
etar
y.
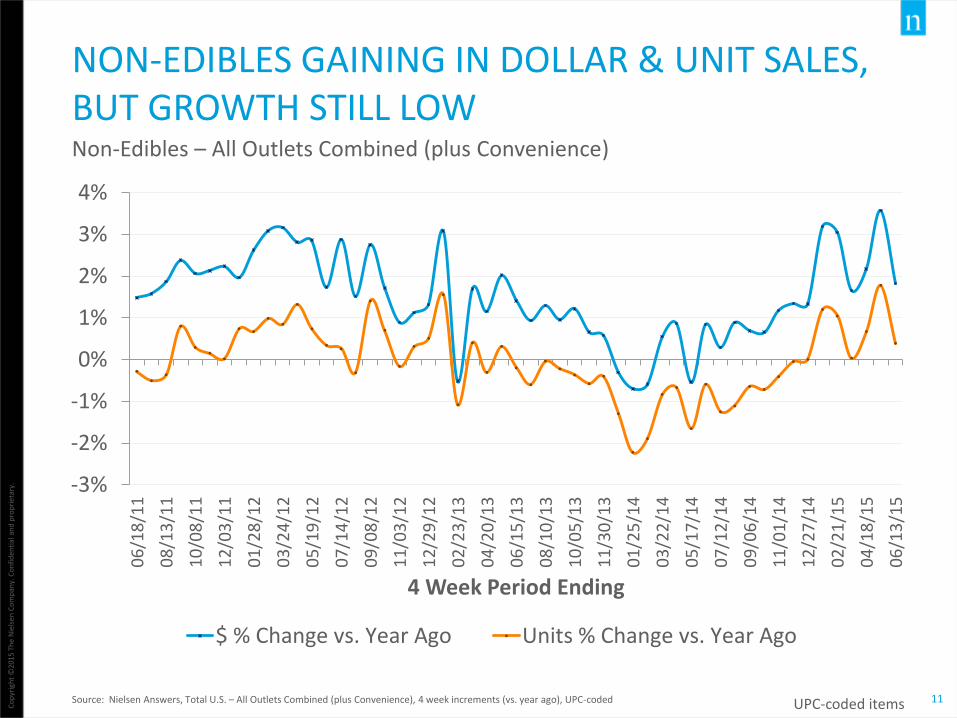
NON-EDIBLES GAINING IN DOLLAR & UNIT SALES, BUT GROWTH STILL LOW
Source: Nielsen Answers, Total U.S. – All Outlets Combined (plus Convenience), 4 week increments (vs. year ago), UPC-coded
-3%
-2%
-1%
0%
1%
2%
3%
4%
06
/18
/11
08
/13
/11
10
/08
/11
12
/03
/11
01
/28
/12
03
/24
/12
05
/19
/12
07
/14
/12
09
/08
/12
11
/03
/12
12
/29
/12
02
/23
/13
04
/20
/13
06
/15
/13
08
/10
/13
10
/05
/13
11
/30
/13
01
/25
/14
03
/22
/14
05
/17
/14
07
/12
/14
09
/06
/14
11
/01
/14
12
/27
/14
02
/21
/15
04
/18
/15
06
/13
/15
4 Week Period Ending
$ % Change vs. Year Ago Units % Change vs. Year Ago
Non-Edibles – All Outlets Combined (plus Convenience)
UPC-coded items

12
Co
pyr
igh
t ©
2015
Th
e N
iels
en C
om
pan
y. C
on
fid
enti
al a
nd
pro
pri
etar
y.
HEALTH CARE CATEGORIES ON RIGHT TREND
Source: Nielsen Answers, Total U.S. – All Outlets Combined (plus Convenience), 4 week increments (vs. year ago), UPC-coded
-6%
-4%
-2%
0%
2%
4%
6%
8%
10%
12%
06
/18
/11
08
/13
/11
10
/08
/11
12
/03
/11
01
/28
/12
03
/24
/12
05
/19
/12
07
/14
/12
09
/08
/12
11
/03
/12
12
/29
/12
02
/23
/13
04
/20
/13
06
/15
/13
08
/10
/13
10
/05
/13
11
/30
/13
01
/25
/14
03
/22
/14
05
/17
/14
07
/12
/14
09
/06
/14
11
/01
/14
12
/27
/14
02
/21
/15
04
/18
/15
06
/13
/15
4 Week Period Ending
$ % Change vs. Year Ago Units % Change vs. Year Ago
Health Care – All Outlets Combined (plus Convenience)
UPC-coded items
Co
pyr
igh
t ©
2015
Th
e N
iels
en C
om
pan
y. C
on
fid
enti
al a
nd
pro
pri
etar
y.
13
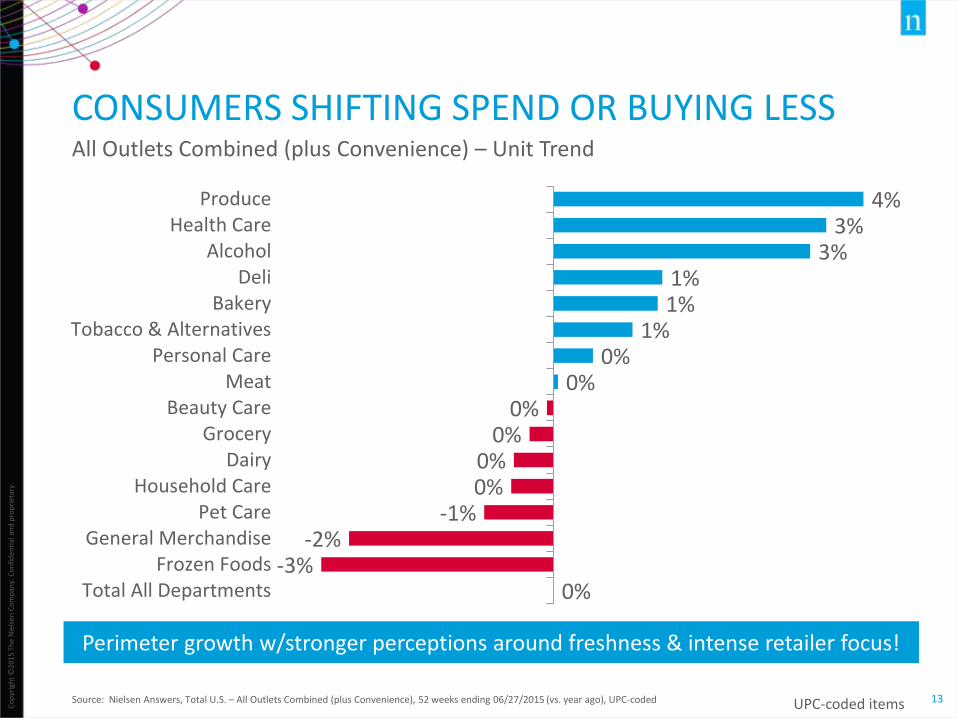
CONSUMERS SHIFTING SPEND OR BUYING LESS
Source: Nielsen Answers, Total U.S. – All Outlets Combined (plus Convenience), 52 weeks ending 06/27/2015 (vs. year ago), UPC-coded
0%-3%
-2%-1%
0%0%
0%0%
0%0%
1%1%1%
3%3%
4%
Total All DepartmentsFrozen Foods
General MerchandisePet Care
Household CareDairy
GroceryBeauty Care
MeatPersonal Care
Tobacco & AlternativesBakery
DeliAlcohol
Health CareProduce
Perimeter growth w/stronger perceptions around freshness & intense retailer focus!
All Outlets Combined (plus Convenience) – Unit Trend
UPC-coded items

Co
pyr
igh
t ©
2015
Th
e N
iels
en C
om
pan
y. C
on
fid
enti
al a
nd
pro
pri
etar
y.
14
TOTAL STORE GAINS LESS THAN SPECTACULAR
Source: Nielsen Answers, Total U.S. All Outlets Combined (plus Convenience), All Departments, All Brands, % Change, 52 week periods vs. year ago
$731 $762 $780 $791 $811
250 250 252 253 253
52 weeks ending07/02/2011
52 weeks ending06/30/2012
52 weeks ending06/29/2013
52 weeks ending06/28/2014
52 weeks ending06/27/2015
Bill
ion
s
Dollar Sales Unit Volume
Shouldn’t an economic recovery be delivering more growth?
All Departments
Dollar Trend +4 +2 +1 +2
Unit Trend +0 +1 +0 +0
Average U Price Trend +4 +2 +1 +2
Any Promo U Trend +1 +8 -6 -4
UPC-coded items
Co
pyr
igh
t ©
2015
Th
e N
iels
en C
om
pan
y. C
on
fid
enti
al a
nd
pro
pri
etar
y.
15
-6%
-4%
-2%
0%
2%
4%
6%
8%
10%
12%
Perc
ent
Ch
ange
vs.
Yea
r A
go
Frozen Foods
Deli
Grocery
Beauty Care
Total All Departments
Health Care
Household Care
Alcohol
Personal Care
Meat
Pet Care
Bakery
Produce
Tobacco & Alternatives
General Merchandise
Dairy
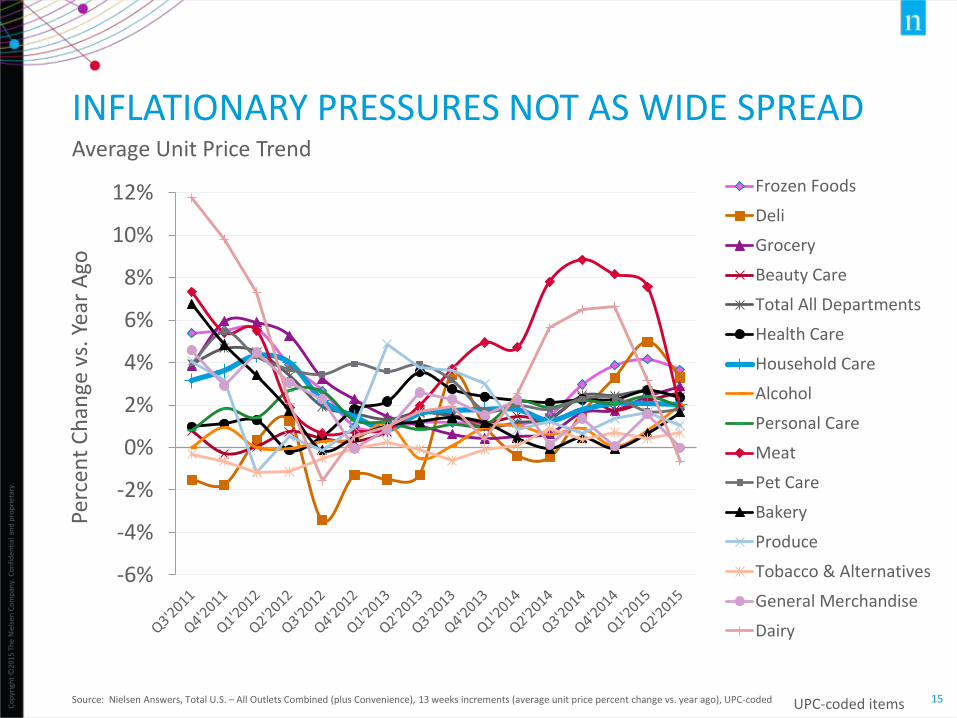
INFLATIONARY PRESSURES NOT AS WIDE SPREAD
Source: Nielsen Answers, Total U.S. – All Outlets Combined (plus Convenience), 13 weeks increments (average unit price percent change vs. year ago), UPC-coded
Average Unit Price Trend
UPC-coded items

Co
pyr
igh
t ©
2015
Th
e N
iels
en C
om
pan
y. C
on
fid
enti
al a
nd
pro
pri
etar
y.
16
$1
$2
$3
$4
$5
$6
$7
$8
U.S
. Do
llars
Alcohol
General Merchandise
Health Care
Tobacco & Alternatives
Beauty Care
Personal Care
Household Care
Meat
Pet Care
Frozen Foods
Total All Departments
Deli
Produce
Dairy
Bakery
Grocery
PRICES HAVE NEVER RETREATED
Source: Nielsen Answers, Total U.S. – All Outlets Combined (plus Convenience), 13 weeks increments, UPC-coded
Average Unit Price
UPC-coded items
17
Co
pyr
igh
t ©
2015
Th
e N
iels
en C
om
pan
y. C
on
fid
enti
al a
nd
pro
pri
etar
y.
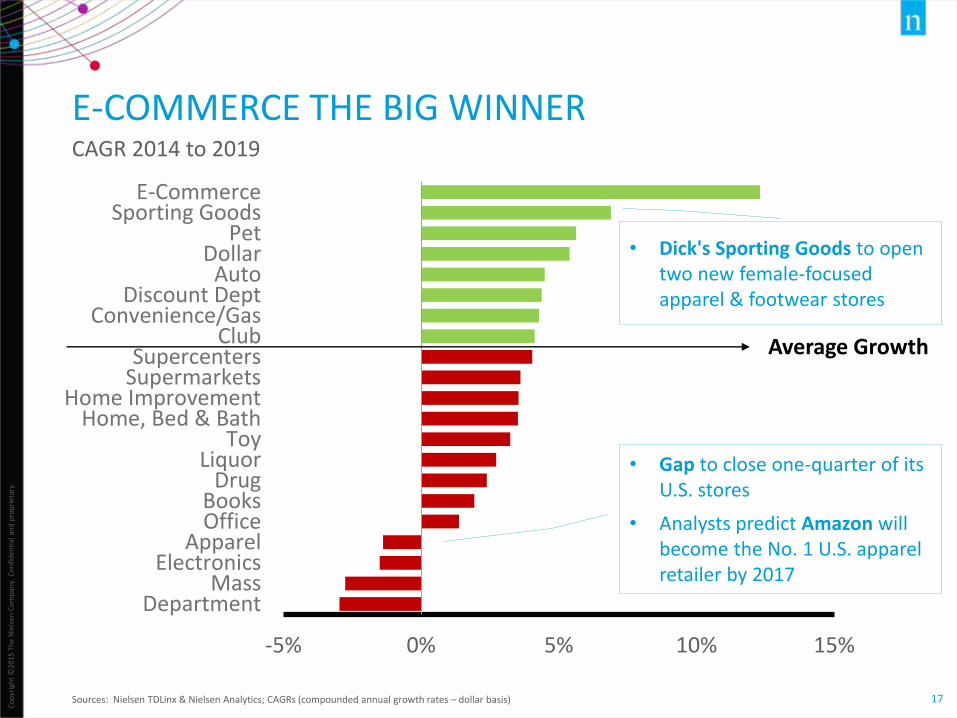
E-COMMERCE THE BIG WINNER
Sources: Nielsen TDLinx & Nielsen Analytics; CAGRs (compounded annual growth rates – dollar basis)
-5% 0% 5% 10% 15%
DepartmentMass
ElectronicsApparel
OfficeBooks
DrugLiquor
ToyHome, Bed & Bath
Home ImprovementSupermarketsSupercenters
ClubConvenience/Gas
Discount DeptAuto
DollarPet
Sporting GoodsE-Commerce
CAGR 2014 to 2019
Average Growth
• Gap to close one-quarter of its U.S. stores
• Analysts predict Amazon will become the No. 1 U.S. apparel retailer by 2017
• Dick's Sporting Goods to open two new female-focused apparel & footwear stores
Co
pyr
igh
t ©
2015
Th
e N
iels
en C
om
pan
y. C
on
fid
enti
al a
nd
pro
pri
etar
y.
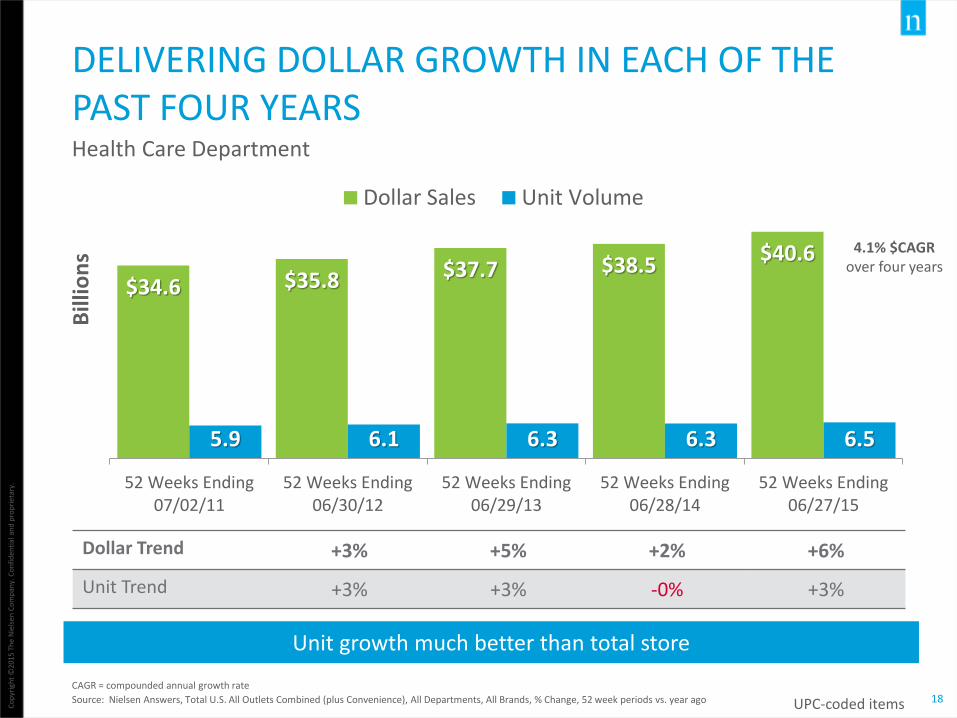
18
DELIVERING DOLLAR GROWTH IN EACH OF THE PAST FOUR YEARSHealth Care Department
CAGR = compounded annual growth rate
Source: Nielsen Answers, Total U.S. All Outlets Combined (plus Convenience), All Departments, All Brands, % Change, 52 week periods vs. year ago
$34.6 $35.8 $37.7 $38.5$40.6
5.9 6.1 6.3 6.3 6.5
52 Weeks Ending07/02/11
52 Weeks Ending06/30/12
52 Weeks Ending06/29/13
52 Weeks Ending06/28/14
52 Weeks Ending06/27/15
Bill
ion
s
Dollar Sales Unit Volume
Unit growth much better than total store
Dollar Trend +3% +5% +2% +6%
Unit Trend +3% +3% -0% +3%
UPC-coded items
4.1% $CAGR over four years

PRIVATE BRANDS OVERVIEW
Co
pyr
igh
t ©
2015
Th
e N
iels
en C
om
pan
y. C
on
fid
enti
al a
nd
pro
pri
etar
y.
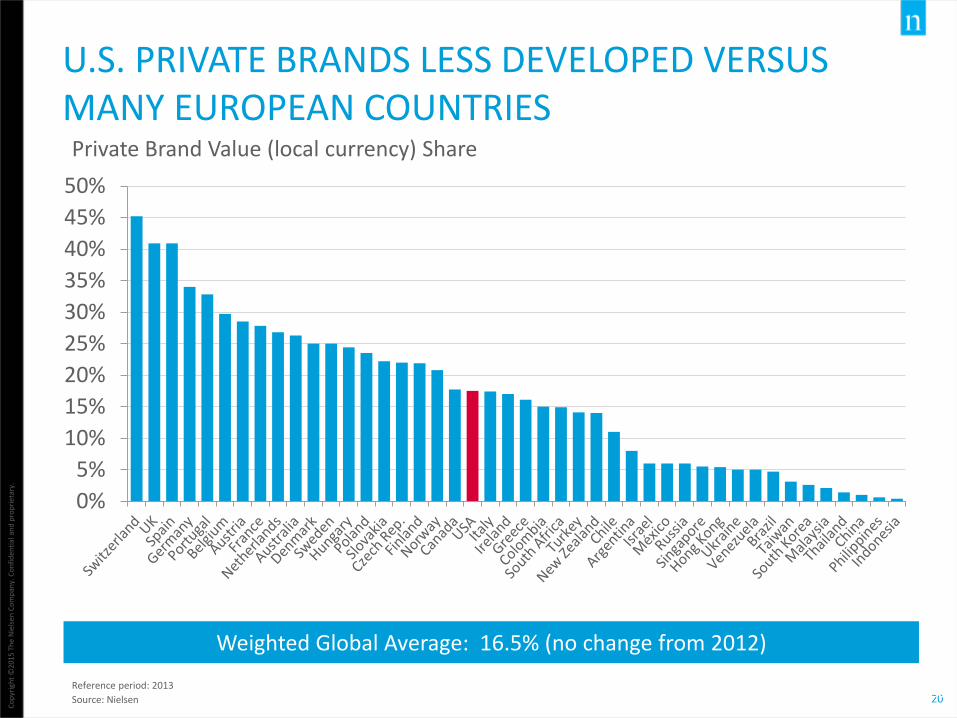
20
U.S. PRIVATE BRANDS LESS DEVELOPED VERSUS MANY EUROPEAN COUNTRIES Private Brand Value (local currency) Share
Reference period: 2013
Source: Nielsen
0%
5%
10%
15%
20%
25%
30%
35%
40%
45%
50%
Weighted Global Average: 16.5% (no change from 2012)
Page 20

21
Co
pyr
igh
t ©
2015
Th
e N
iels
en C
om
pan
y. C
on
fid
enti
al a
nd
pro
pri
etar
y.
BIGGER SHARE IN EDIBLE DEPARTMENTS; SHARE GROWTH NOT ALWAYS A FUNCTION OF SHARE
Source: Nielsen Answers, Total U.S. – All Outlets Combined (xAOC), 52 weeks ending 06/27/2015, UPC-coded
0
1
5
11
11
14
14
17
20
20
22
29
30
30
35
Tobacco & Alternatives
Alcohol
Beauty Care
General Merchandise
Personal Care
Grocery
Pet Care
Meat
Frozen Foods
Produce
Household Care
Health Care
Bakery
Deli
Dairy
Private Brands: Dollar Share & Point Change versus Year Ago
-0.7
-0.2
-0.1
-0.1
-0.1
-0.1
0.0
0.1
0.2
0.2
0.3
0.3
0.9
1.1
1.5
Health Care
Grocery
Dairy
Bakery
Personal Care
Alcohol
Tobacco & Alternatives
Produce
Pet Care
Frozen Foods
Deli
Beauty Care
Household Care
Meat
General Merchandise
All Departments Private Brands $ Share: 17.8%; up 0.2 points from year ago
UPC-coded items
Edibles Non-Edibles Share Loss Share Gain
22
Co
pyr
igh
t ©
2015
Th
e N
iels
en C
om
pan
y. C
on
fid
enti
al a
nd
pro
pri
etar
y.
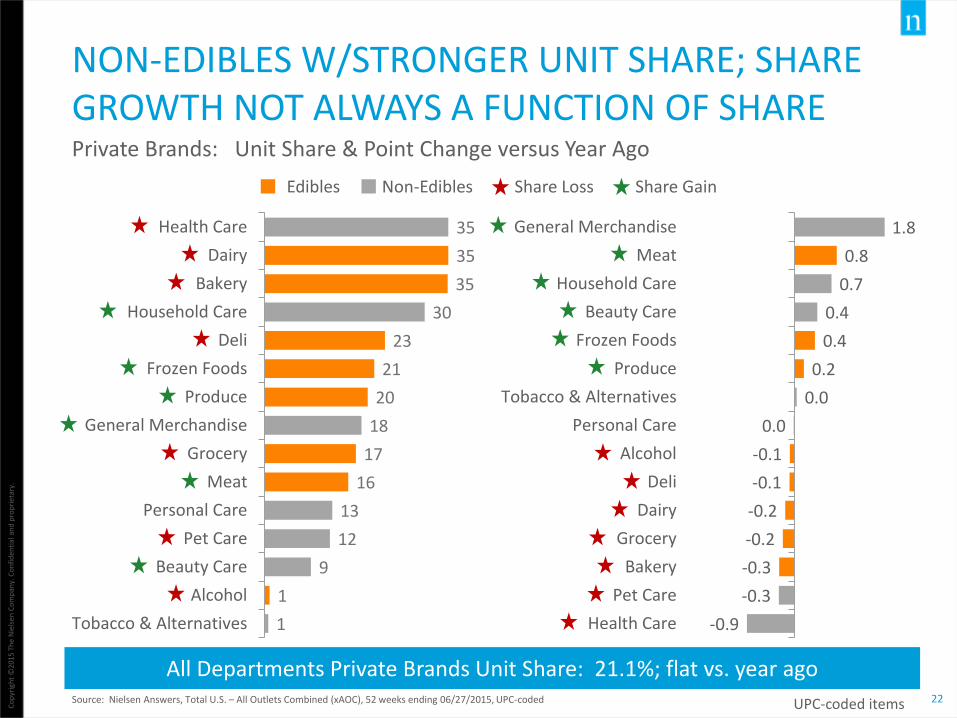
NON-EDIBLES W/STRONGER UNIT SHARE; SHARE GROWTH NOT ALWAYS A FUNCTION OF SHARE
Source: Nielsen Answers, Total U.S. – All Outlets Combined (xAOC), 52 weeks ending 06/27/2015, UPC-coded
1
1
9
12
13
16
17
18
20
21
23
30
35
35
35
Tobacco & Alternatives
Alcohol
Beauty Care
Pet Care
Personal Care
Meat
Grocery
General Merchandise
Produce
Frozen Foods
Deli
Household Care
Bakery
Dairy
Health Care
Private Brands: Unit Share & Point Change versus Year Ago
-0.9
-0.3
-0.3
-0.2
-0.2
-0.1
-0.1
0.0
0.0
0.2
0.4
0.4
0.7
0.8
1.8
Health Care
Pet Care
Bakery
Grocery
Dairy
Deli
Alcohol
Personal Care
Tobacco & Alternatives
Produce
Frozen Foods
Beauty Care
Household Care
Meat
General Merchandise
All Departments Private Brands Unit Share: 21.1%; flat vs. year ago
UPC-coded items
Edibles Non-Edibles Share Loss Share Gain

Co
pyr
igh
t ©
2015
Th
e N
iels
en C
om
pan
y. C
on
fid
enti
al a
nd
pro
pri
etar
y.
23
SUPERMARKETS GARNER HIGHEST PRIVATE BRAND SHARE; > SHARE GROWTH IN OTHER CHANNELS
Source: Nielsen Answers, Total U.S., UPC-coded;*Club Stores, Dollar Stores, Mass-Merchandisers, Supercenters, & Military
19.1
15.3
15.0
2.9
19.6
16.6
16.0
3.9
Supermarkets
Drug Stores
Value*
C-Stores
Private Brands Dollar Share
23.0
16.5
18.8
4.5
23.1
17.4
19.0
5.4
Supermarkets
Drug Stores
Value*
C-Stores
Private Brands Unit Share
52 Weeks Ending: 07/02/2011 06/30/2012 06/29/2013 06/28/2014 06/27/2015
UPC-coded items

Co
pyr
igh
t ©
2015
Th
e N
iels
en C
om
pan
y. C
on
fid
enti
al a
nd
pro
pri
etar
y.
24
Dollar Sales Percent Change vs. Year Ago
Private Brand +5% +8% +3% +3% +3% +3%
Branded +1% +3% +3% +2% +1% +2%
ON PAR WITH BRAND GROWTH SINCE 2012 WITH MODEST SHARE GROWTH IN 2013 & 2014All Departments
Sources: Nielsen Strategic Planner (2009 data) & Nielsen Answers (2010-2015 data), Total U.S. – All Outlets Combined (xAOC), Total All Departments,
16.2%
16.8%
17.4% 17.4% 17.6%17.8% 17.8%
2009 2010 2011 2012 2013 2014 52 W/E06/27/2015
Private Brand $ Share
UPC-coded items

Co
pyr
igh
t ©
2015
Th
e N
iels
en C
om
pan
y. C
on
fid
enti
al a
nd
pro
pri
etar
y.
25
NON-LEAD BRANDS WINNING SHAREUnit Share
Source: Nielsen Answers, Total U.S. – All Outlets Combined (xAOC) – based on approximately 50,000 top-selling brands
47.5% 47.9% 48.0%
21.2% 21.1% 21.1%
31.3% 31.0% 30.9%
52 weeks ending06/29/2013
52 weeks ending06/28/2014
52 weeks ending06/27/2015
Lead Brands*
Private Brands
Other Brands
*Lead brand could be #1 or 2 depending on private brand unit share
Unit SharePoint Change
versus two years ago
- 0.4
- 0.1
+ 0.5
UPC-coded items
Co
pyr
igh
t ©
2015
Th
e N
iels
en C
om
pan
y. C
on
fid
enti
al a
nd
pro
pri
etar
y.
26
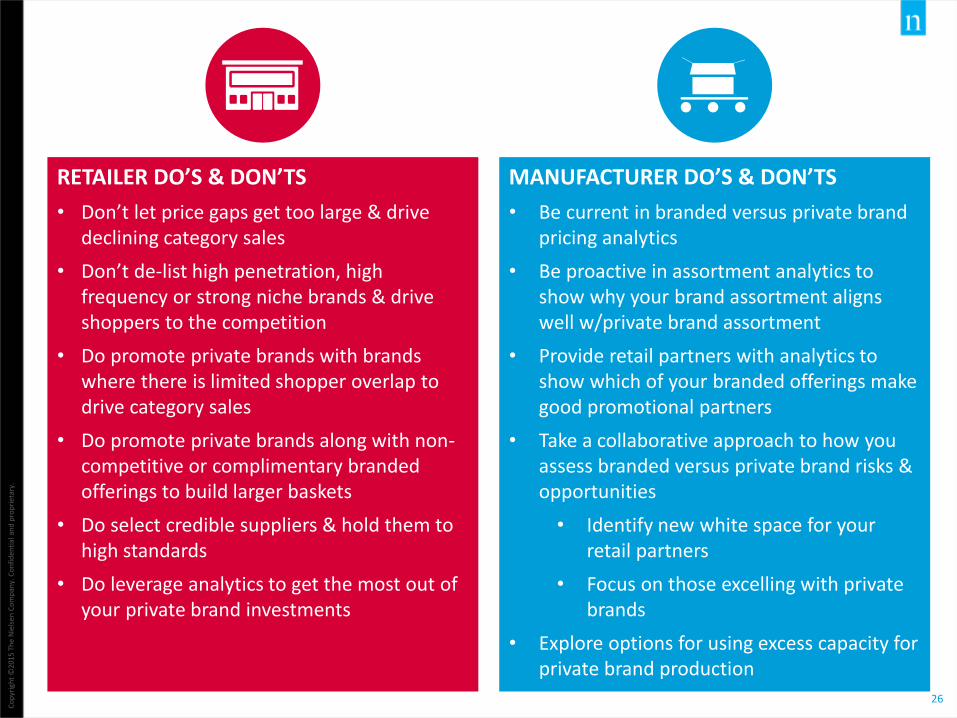
MANUFACTURER DO’S & DON’TS
• Be current in branded versus private brand pricing analytics
• Be proactive in assortment analytics to show why your brand assortment aligns well w/private brand assortment
• Provide retail partners with analytics to show which of your branded offerings make good promotional partners
• Take a collaborative approach to how you assess branded versus private brand risks & opportunities
• Identify new white space for your retail partners
• Focus on those excelling with private brands
• Explore options for using excess capacity for private brand production
RETAILER DO’S & DON’TS
• Don’t let price gaps get too large & drive declining category sales
• Don’t de-list high penetration, high frequency or strong niche brands & drive shoppers to the competition
• Do promote private brands with brands where there is limited shopper overlap to drive category sales
• Do promote private brands along with non-competitive or complimentary branded offerings to build larger baskets
• Do select credible suppliers & hold them to high standards
• Do leverage analytics to get the most out of your private brand investments

POPULATION AND DEMOGRAPHIC TRENDS

28
Co
pyr
igh
t ©
2015
Th
e N
iels
en C
om
pan
y. C
on
fid
enti
al a
nd
pro
pri
etar
y.
BY 2020, 57% OF U.S. POPULATION WILL BE MILLENNIALS OR YOUNGER
Source: U.S. Census Bureau (2014 National Population Projections); MM = million
02,500,000
Males (165 MM)
U.S. Population Projections – 2020: All Races/Ethnicities
0 2,500,000
05
101520253035404550556065707580859095
100
Females (169 MM)
Population
Millennials
Gen X
Boomers 38MM
25MM
40MM
34MM
24MM
41MM
Age
10MM 14MM
53MM56MMGen Z
Greatest Generation
In 2020,
57%of the U.S.
population will be
Millennials or younger, up from 50% in
2014
Co
pyr
igh
t ©
2015
Th
e N
iels
en C
om
pan
y. C
on
fid
enti
al a
nd
pro
pri
etar
y.
29
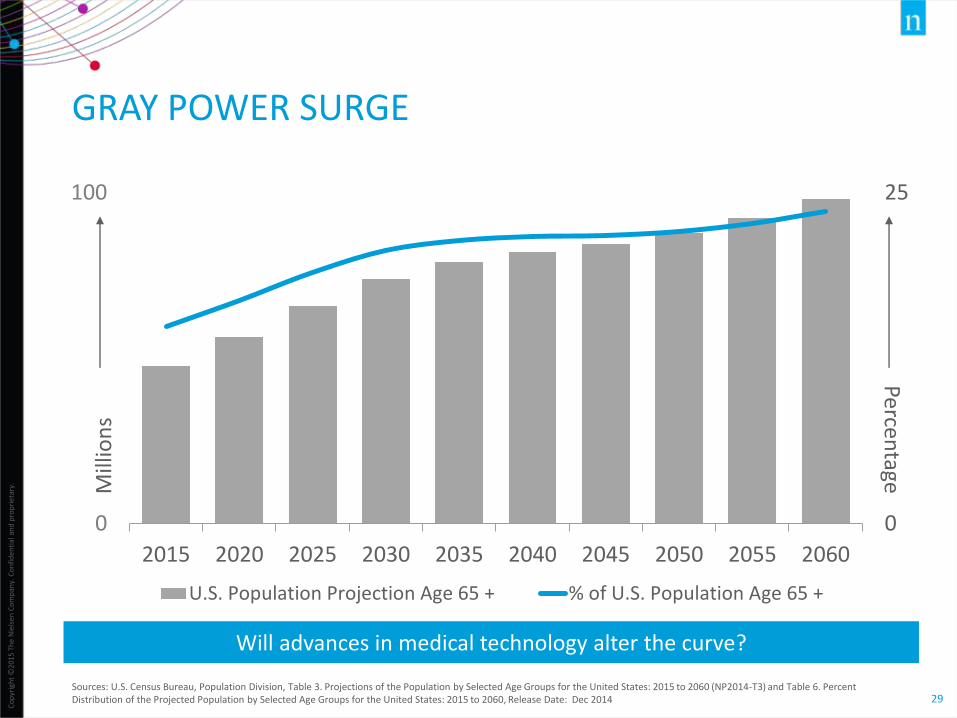
GRAY POWER SURGE
Sources: U.S. Census Bureau, Population Division, Table 3. Projections of the Population by Selected Age Groups for the United States: 2015 to 2060 (NP2014-T3) and Table 6. Percent Distribution of the Projected Population by Selected Age Groups for the United States: 2015 to 2060, Release Date: Dec 2014
0
25
0
100
2015 2020 2025 2030 2035 2040 2045 2050 2055 2060
U.S. Population Projection Age 65 + % of U.S. Population Age 65 +
Will advances in medical technology alter the curve?
Percentage
Mill
ion
s
Co
pyr
igh
t ©
2015
Th
e N
iels
en C
om
pan
y. C
on
fid
enti
al a
nd
pro
pri
etar
y.
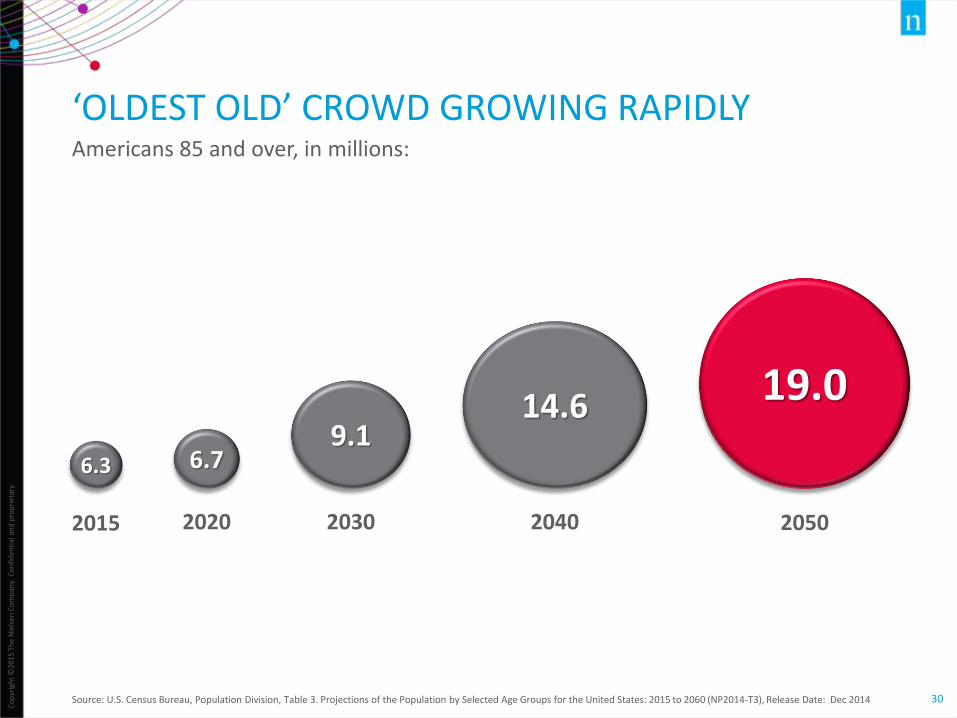
30Source: U.S. Census Bureau, Population Division, Table 3. Projections of the Population by Selected Age Groups for the United States: 2015 to 2060 (NP2014-T3), Release Date: Dec 2014
‘OLDEST OLD’ CROWD GROWING RAPIDLYAmericans 85 and over, in millions:
2015 2020 2030 20502040
6.3 6.79.1
14.6 19.0

Co
pyr
igh
t ©
2015
Th
e N
iels
en C
om
pan
y. C
on
fid
enti
al a
nd
pro
pri
etar
y.
31
OLDER MORE TRIPS; YOUNGER BIGGER BASKETS
Source: Nielsen Homescan, Total U.S. 52 weeks ending 12/27/2014, excludes gas only or Rx only trips; *UPC-coded products
Total Retail Channels
160
151
127
101
Greatest Gen
Boomers
Gen X
Millennials
Shopping Trips per Household
Deals matter to all!
$39
$47
$55
$57
Greatest Gen
Boomers
Gen X
Millennials
Basket Ring $ per Trip
$6,172
$7,081
$7,020
$5,710
Greatest Gen
Boomers
Gen X
Millennials
Basket Ring $ Per Household
25%
25%
25%
25%
Greatest Gen
Boomers
Gen X
Millennials
% Dollars on Deal*

Co
pyr
igh
t ©
2015
Th
e N
iels
en C
om
pan
y. C
on
fid
enti
al a
nd
pro
pri
etar
y.
32
DIVERSE CATEGORY NEEDS ACROSSGENERATIONAL SEGMENTS Where is your category or brand driving sales?
Source: Nielsen Homescan, Total U.S. 52 weeks ending 12/27/2014, UPC-coded products
GREATEST GEN BOOMERS GEN X MILLENNIALS
BABY FOOD 45 44 94 163
CEREAL 83 91 115 113
HAIR CARE 69 98 123 97
CARBONATED BEVERAGES
76 107 108 89
DETERGENTS 88 102 110 92
PET FOOD 111 122 90 55
VITAMINS 139 110 88 63
WINE 117 120 85 60
ICE CREAM 114 109 96 75
How can manufacturers & retailers collaborate on generational store sets?
$ Buying Rate Index
Co
pyr
igh
t ©
2015
Th
e N
iels
en C
om
pan
y. C
on
fid
enti
al a
nd
pro
pri
etar
y.
33
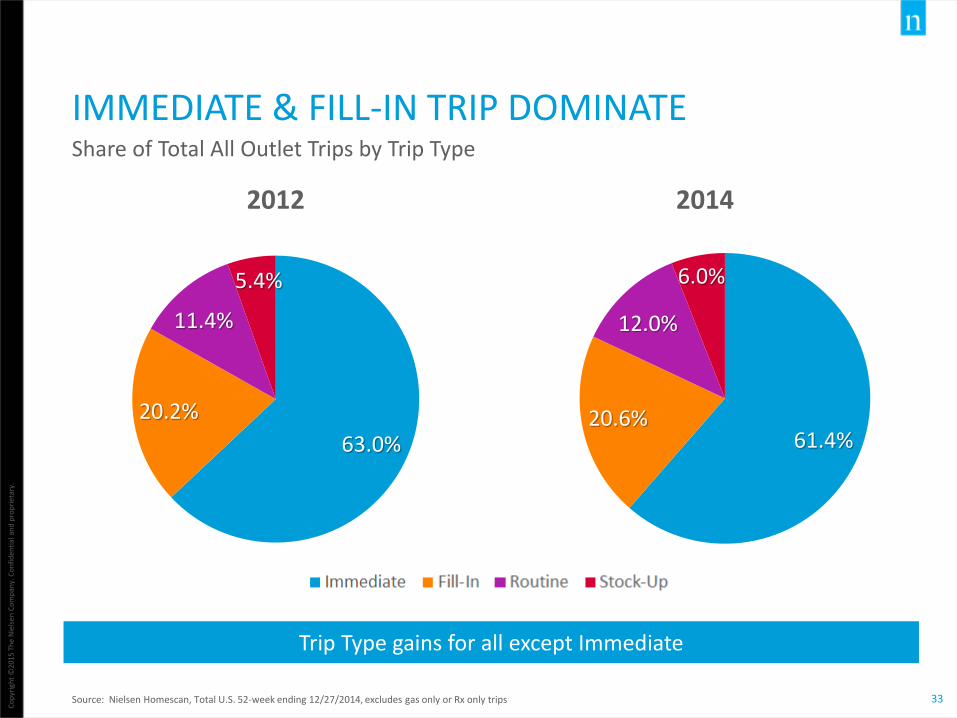
IMMEDIATE & FILL-IN TRIP DOMINATE
Source: Nielsen Homescan, Total U.S. 52-week ending 12/27/2014, excludes gas only or Rx only trips
63.0%
20.2%
11.4%
5.4%
2012
Immediate Fill-In Routine Stock-Up
Trip Type gains for all except Immediate
Share of Total All Outlet Trips by Trip Type
61.4%20.6%
12.0%
6.0%
2014
Immediate Fill-In

Co
pyr
igh
t ©
2015
Th
e N
iels
en C
om
pan
y. C
on
fid
enti
al a
nd
pro
pri
etar
y.
34
LARGER TRIPS GAINED IMPORTANCE IN OVERALL SALES TOO
Source: Nielsen Homescan, Total U.S. 52-week ending 12/27/2014, excludes gas only or Rx only trips
22.0%
23.7%
25.3%
29.0%
2012
Immediate Fill-In Routine Stock-Up
Larger trips the real drivers of retail sales
Share of Total All Outlet Dollars by Trip Type
20.8%
23.2%
25.7%
30.3%
2014
Immediate Fill-In Routine Stock-Up

Co
pyr
igh
t ©
2015
Th
e N
iels
en C
om
pan
y. C
on
fid
enti
al a
nd
pro
pri
etar
y.
35
FEMALES DRIVE TRIPS, BUT MALES GAININGShare of Retail Channel Shopping Trips
54
46
39
61
38
62
33
67
32
68
29
71
29
71
Mal
esFe
mal
es
54
46
37
63
37
63
34
66
30
70
25
75
26
74
Mal
esFe
mal
es
Mass
Dollar
Supers
Drug
Grocery
Club
C-Store
2004 2014
Source: Nielsen Homescan, Total U.S., excludes gas-only or Rx-only trips
Co
pyr
igh
t ©
2015
Th
e N
iels
en C
om
pan
y. C
on
fid
enti
al a
nd
pro
pri
etar
y.
36
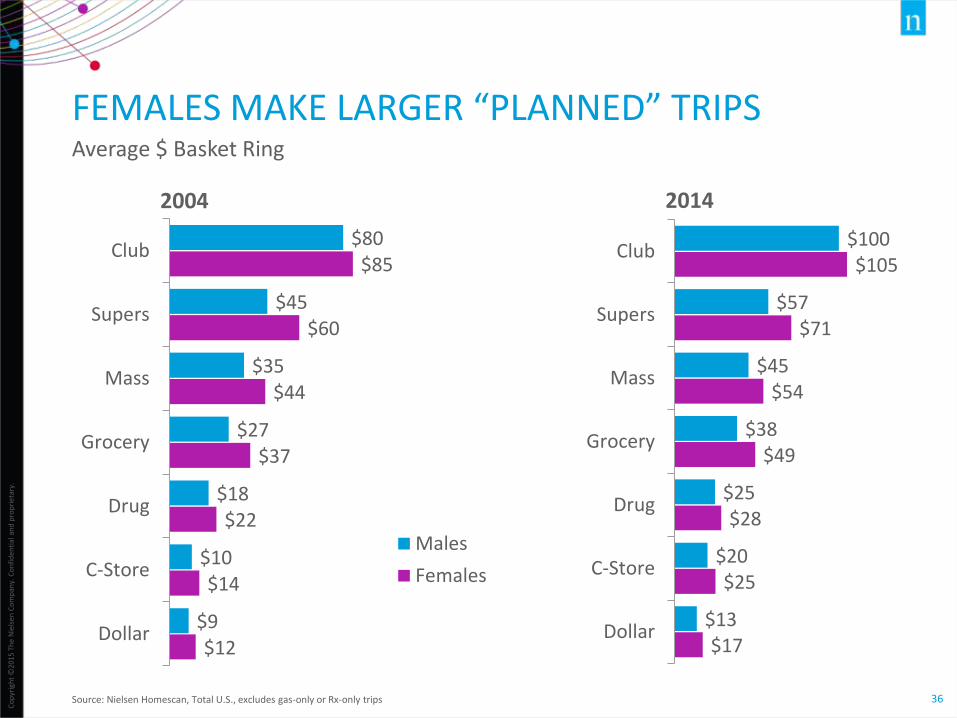
FEMALES MAKE LARGER “PLANNED” TRIPSAverage $ Basket Ring
$12
$14
$22
$37
$44
$60
$85
$9
$10
$18
$27
$35
$45
$80
Dollar
C-Store
Drug
Grocery
Mass
Supers
Club
Males
Females
$17
$25
$28
$49
$54
$71
$105
$13
$20
$25
$38
$45
$57
$100
Dollar
C-Store
Drug
Grocery
Mass
Supers
Club
Source: Nielsen Homescan, Total U.S., excludes gas-only or Rx-only trips
2004 2014
Co
pyr
igh
t ©
2015
Th
e N
iels
en C
om
pan
y. C
on
fid
enti
al a
nd
pro
pri
etar
y.
37
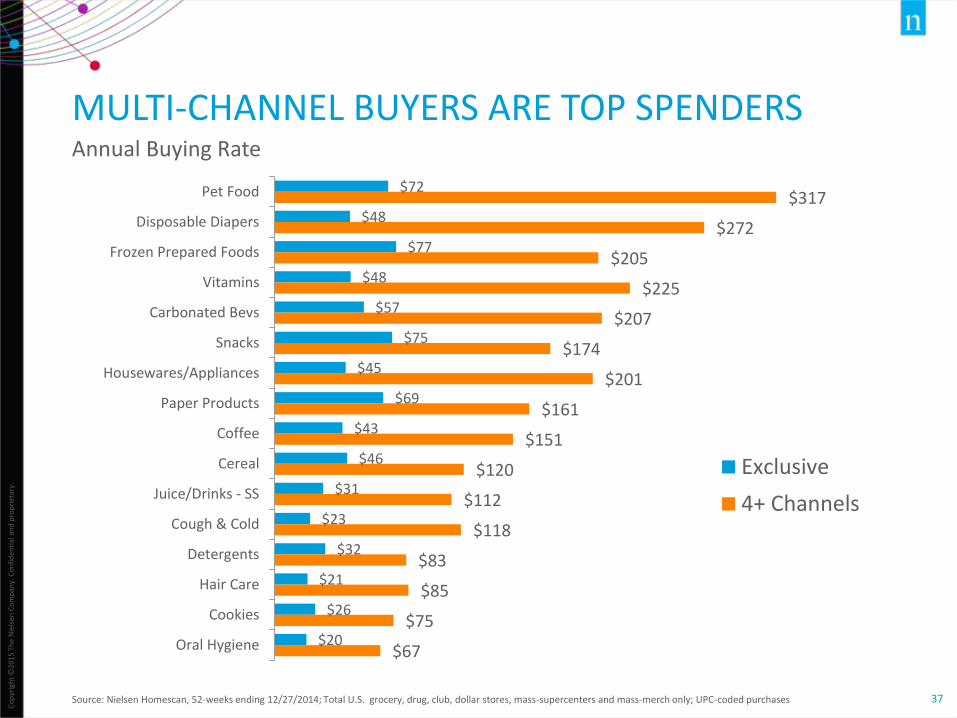
MULTI-CHANNEL BUYERS ARE TOP SPENDERS
Source: Nielsen Homescan, 52-weeks ending 12/27/2014; Total U.S. grocery, drug, club, dollar stores, mass-supercenters and mass-merch only; UPC-coded purchases
$72
$48
$77
$48
$57
$75
$45
$69
$43
$46
$31
$23
$32
$21
$26
$20
$317
$272
$205
$225
$207
$174
$201
$161
$151
$120
$112
$118
$83
$85
$75
$67
Pet Food
Disposable Diapers
Frozen Prepared Foods
Vitamins
Carbonated Bevs
Snacks
Housewares/Appliances
Paper Products
Coffee
Cereal
Juice/Drinks - SS
Cough & Cold
Detergents
Hair Care
Cookies
Oral Hygiene
Exclusive
4+ Channels
Annual Buying Rate

HEALTH CARE SEGMENT PERFORMANCE

Co
pyr
igh
t ©
2015
Th
e N
iels
en C
om
pan
y. C
on
fid
enti
al a
nd
pro
pri
etar
y.
39
CONSUMERS INCREASINGLY UNDERSTAND HEALTH IS WEALTH
• Yet face many hurdles in their pursuit of good health including: Busier lifestyles Rising costs of healthcare Affordable, healthful food options Access to reliable health education and information Increased lifespan
• Managing Chronic Conditions makes this even more difficult 7 out of 10 deaths are the result of a chronic illness in the U.S.* Aversion, treatment and maintenance all have implications when
comes to daily living, attitudes/preferences and purchase behaviors
*Quote source: http://www.cdc.gov/hrqol/pdfs/cdnrwinter03.pdf
Co
pyr
igh
t ©
2015
Th
e N
iels
en C
om
pan
y. C
on
fid
enti
al a
nd
pro
pri
etar
y.
40
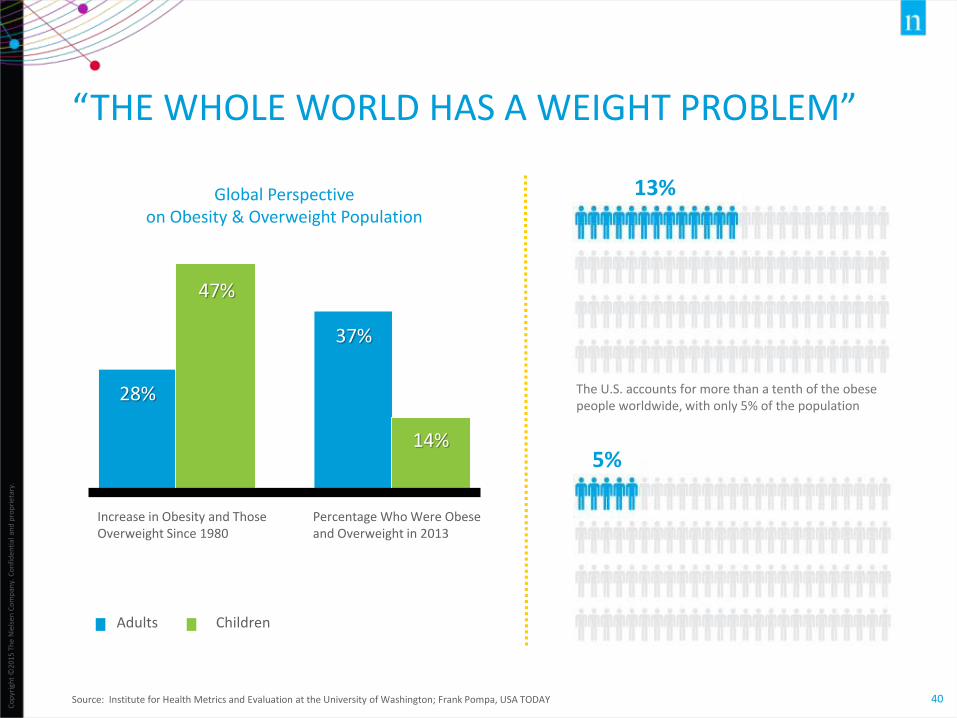
“THE WHOLE WORLD HAS A WEIGHT PROBLEM”
Source: Institute for Health Metrics and Evaluation at the University of Washington; Frank Pompa, USA TODAY
13%
5%
The U.S. accounts for more than a tenth of the obese people worldwide, with only 5% of the population
Increase in Obesity and Those Overweight Since 1980
Percentage Who Were Obese and Overweight in 2013
Global Perspective on Obesity & Overweight Population
28%
47%
37%
14%
Adults Children
Co
pyr
igh
t ©
2015
Th
e N
iels
en C
om
pan
y. C
on
fid
enti
al a
nd
pro
pri
etar
y.
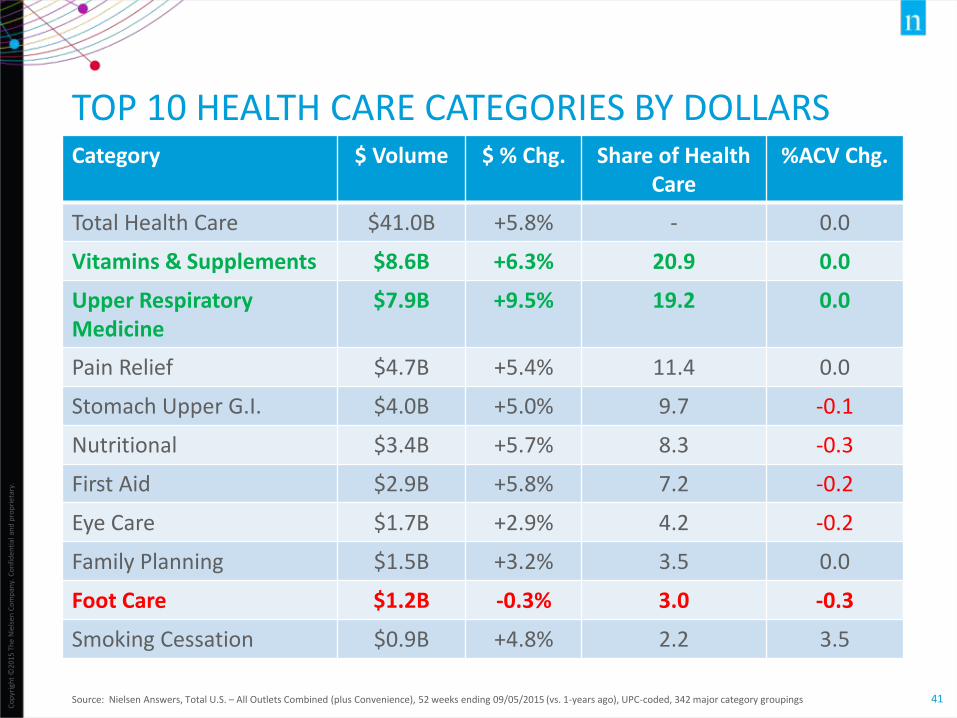
41Source: Nielsen Answers, Total U.S. – All Outlets Combined (plus Convenience), 52 weeks ending 09/05/2015 (vs. 1-years ago), UPC-coded, 342 major category groupings
TOP 10 HEALTH CARE CATEGORIES BY DOLLARSCategory $ Volume $ % Chg. Share of Health
Care%ACV Chg.
Total Health Care $41.0B +5.8% - 0.0
Vitamins & Supplements $8.6B +6.3% 20.9 0.0
Upper Respiratory Medicine
$7.9B +9.5% 19.2 0.0
Pain Relief $4.7B +5.4% 11.4 0.0
Stomach Upper G.I. $4.0B +5.0% 9.7 -0.1
Nutritional $3.4B +5.7% 8.3 -0.3
First Aid $2.9B +5.8% 7.2 -0.2
Eye Care $1.7B +2.9% 4.2 -0.2
Family Planning $1.5B +3.2% 3.5 0.0
Foot Care $1.2B -0.3% 3.0 -0.3
Smoking Cessation $0.9B +4.8% 2.2 3.5

Co
pyr
igh
t ©
2015
Th
e N
iels
en C
om
pan
y. C
on
fid
enti
al a
nd
pro
pri
etar
y.
42
TAKING CHARGE OF AILMENT TREATMENTS
Source: Nielsen Answers, Total U.S. – All Outlets Combined (plus Convenience), 52 weeks ending 06/27/2015 (vs. year ago), UPC-coded
5%5%5%5%6%6%6%6%8%8%10%11%12%
18%110%
Jock Itch Product
Nutritional
Pain Relief
Stomach Upper G.I.
Vitamins & Supplements
Diabetic
Antiseptics & Disinfectants
First Aid
Motion Sickness
Medical Accessory
Upper Respiratory Medicine
Home Health Testing
Lice Treatment
First Aid Other
Pain Relieving Device
Avoiding a visit to the doctor?
Fastest Growing ($) Health Care Categories: All Outlets Combined (plus Convenience)
UPC-coded items
Are Medicare recipients or households with minimal or full
health coverage behind the growth?
Co
pyr
igh
t ©
2015
Th
e N
iels
en C
om
pan
y. C
on
fid
enti
al a
nd
pro
pri
etar
y.
43
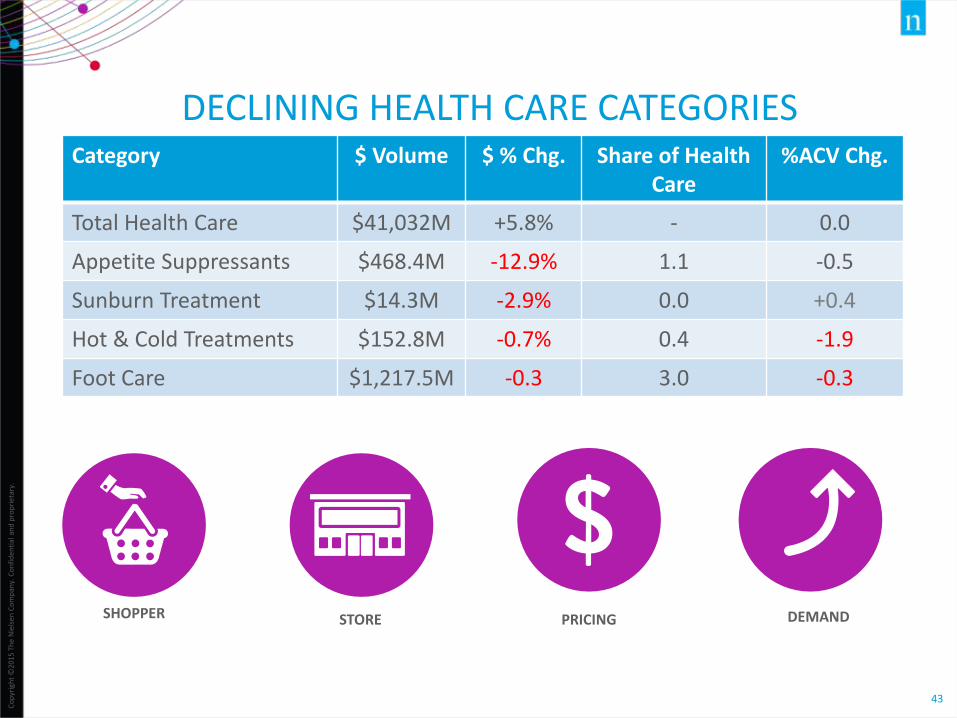
DECLINING HEALTH CARE CATEGORIESCategory $ Volume $ % Chg. Share of Health
Care%ACV Chg.
Total Health Care $41,032M +5.8% - 0.0
Appetite Suppressants $468.4M -12.9% 1.1 -0.5
Sunburn Treatment $14.3M -2.9% 0.0 +0.4
Hot & Cold Treatments $152.8M -0.7% 0.4 -1.9
Foot Care $1,217.5M -0.3 3.0 -0.3
SHOPPER STORE PRICING DEMAND
Co
pyr
igh
t ©
2015
Th
e N
iels
en C
om
pan
y. C
on
fid
enti
al a
nd
pro
pri
etar
y.
44
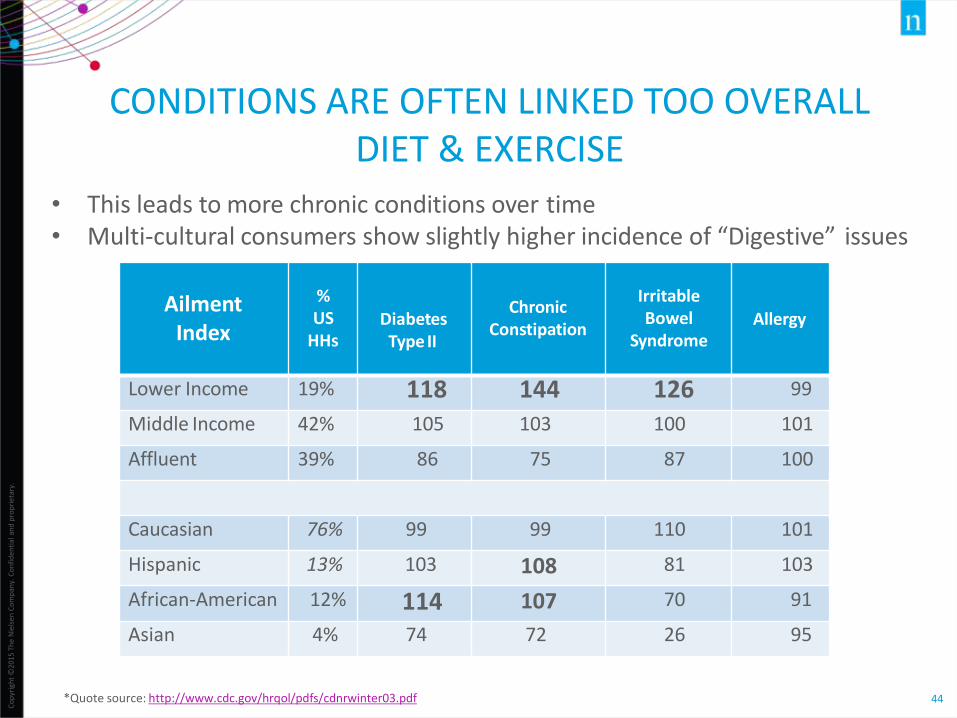
CONDITIONS ARE OFTEN LINKED TOO OVERALL DIET & EXERCISE
*Quote source: http://www.cdc.gov/hrqol/pdfs/cdnrwinter03.pdf
• This leads to more chronic conditions over time• Multi‐cultural consumers show slightly higher incidence of “Digestive” issues
Ailment Index
% US
HHsDiabetes
Type II
Chronic Constipation
Irritable Bowel
SyndromeAllergy
Lower Income 19% 118 144 126 99
Middle Income 42% 105 103 100 101
Affluent 39% 86 75 87 100
Caucasian 76% 99 99 110 101
Hispanic 13% 103 108 81 103
African‐American 12% 114 107 70 91
Asian 4% 74 72 26 95

Co
pyr
igh
t ©
2015
Th
e N
iels
en C
om
pan
y. C
on
fid
enti
al a
nd
pro
pri
etar
y.
45
DEMAND FOR OTC VARIES BY CONDITION
OTC $% US HH’s WITH SUFFERER SPEND INDEX* % US HH’s WITH SUFFERER
OTC $ SPEND INDEX*
ALLERGY
HIGH BLOOD PRESSURE
IMPERFECT VISION
ACID REFLUX
OBESITY
CHOLESTEROL
HEADACHE
JOINT/NECK/BACK PAIN
ANXIETY & DEPRESSION
INSOMNIA
37%
32%
34%
31%
27%
24%
23%
22%
17%
21%
119
117
116
123
115
124
108
113
114
120
OSTEO ARTHRITIS
MUSCLE PAIN SPASMS
TYPE II DIABETES
ACNE
SKIN ‐ NON ACNE
ASTHMA
MENOPAUSE
DRY EYE
OVERACTIVE BLADDER
LACTOSE INTOLERANCE
7%
7%
8%
9%
11%
13%
13%
14%
14%
16% 129
117
135
109
115
122
129
136
148
123
Source: Nielsen Health Survey 2015
*OTC $ PER HH AMONG SUFFERER GROUP DIVIDED BY TOTAL OTC $ PERHH*100
Co
pyr
igh
t ©
2015
Th
e N
iels
en C
om
pan
y. C
on
fid
enti
al a
nd
pro
pri
etar
y.
46
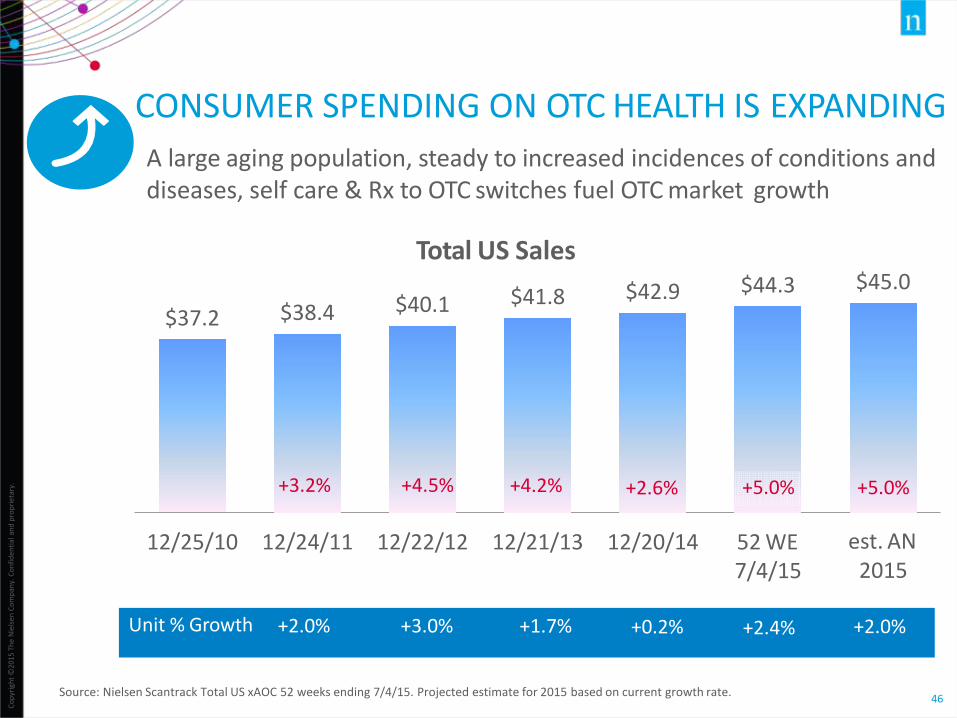
CONSUMER SPENDING ON OTC HEALTH IS EXPANDING
A large aging population, steady to increased incidences of conditions and diseases, self care & Rx to OTC switches fuel OTC market growth
Total US Sales
12/25/10 12/24/11 12/22/12 12/21/13 12/20/14 52 WE7/4/15
est. AN 2015
Unit % Growth +2.0% +3.0% +1.7% +0.2% +2.4% +2.0%
$37.2 $38.4 $40.1 $41.8 $42.9 $44.3 $45.0
+3.2% +4.5% +4.2% +2.6% +5.0% +5.0%
Source: Nielsen Scantrack Total US xAOC 52 weeks ending 7/4/15. Projected estimate for 2015 based on current growth rate.

Co
pyr
igh
t ©
2015
Th
e N
iels
en C
om
pan
y. C
on
fid
enti
al a
nd
pro
pri
etar
y.
47
HEAVIEST OTC USERS DRIVING GROWTH
Total Consumer Health $44.3B
Gen X Boomers
Millennials
$7.1B+2%
Greatest Generation
*Source: Nielsen Boomer Segmentation Homescan U.S. Mid‐Year 2015 proportions adjusted to Nielsen Scantrack OTC Therapeutic & Preventative $ Sales, % Change Based on Dollars Per HH
Segment Definitions: Gen Y Born ‘77 to ‘94, Gen X ‘65 to ‘76, Boomers ‘46 to ‘64, Greatest Generation Pre‐1946
% of US HH’s – Boomers 43%, Gen X 22%, Gen Y 22%, Greatest Gen 13%
$6.6B+1%
$21.3B+3%
$9.3B+2%

Co
pyr
igh
t ©
2015
Th
e N
iels
en C
om
pan
y. C
on
fid
enti
al a
nd
pro
pri
etar
y.
48
GROCERS AND DISCOUNT MAINTAIN A SIGNIFICANT PRICE ADVANTAGE
Total OTC% Change V Year Ago
0.6%
0%
‐0.4%
‐2%
Units
Dollars
10%
8%
6%
4%
2% 1.5%
4.7% 4.7%
2.3%
1.3%
4.6%
2.0%
4.7%
TOTAL MKT TOTAL DRUG INDEPENDENTS GROCERY DISCOUNT CHANNELS**
AvgUnitPrice
$6.45 $8.41 $7.46 $5.85 $5.56
Source: Nielsen Scantrack ‐ Total US 52 weeks ending 7/4/15 Total OTC Line includes Therapeutic MedicationsOnly **Includes Walmart, Target, Kmart, BJ’s, Sams, Dollar General Family Dollar andMilitary

DIGITAL SHOPPING & DIGITAL RETAILING

Co
pyr
igh
t ©
2015
Th
e N
iels
en C
om
pan
y. C
on
fid
enti
al a
nd
pro
pri
etar
y.
50
COUNTER TO BRICK & MORTAR, GREATER INTENT TO BUY NON-EDIBLES% intending to buy ONLINE in next 6 months:
0%
2%
4%
6%
8%
10%
12%
14%
16%
18%
20%
Bottom ten mostly edibles; intent to buy 10% or less for most categories
Source: Nielsen, E-Commerce, Digital Technology and Changing Shopper Preferences Around the World Report (April 2015)
Note: Category list is not exhaustive
Top 10
1. Shampoo /Conditioner2. Vitamins / Supplements3. Body Wash4. Deodorant5. Cosmetics6. Hand / Body Lotion7. Toothpaste8. Bar Soap9. Air freshener10.Cleaners
Bottom 10
1. Spirits2. Dog Food Wet3. Baby Formula / Food4. Pet Supplies / Litter5. Peanut Butter6. Frozen Appetizers7. Cat Food Wet8. Salad Dressing9. Packaged Bread10.Fresh Vegetables

HEALTH & WELLNESS TRENDING

Co
pyr
igh
t ©
2015
Th
e N
iels
en C
om
pan
y. C
on
fid
enti
al a
nd
pro
pri
etar
y.
52
HEALTH & WELLNESS OUTPACING RETAIL GROWTH
1Dollar sales $10 billion or more, 2Dollar sales $5 billion to $10 billion, 3Dollar sales less than $5 billion; Note: Health & Wellness claims are not additive
Source: Nielsen Answers, Wellness Track, Total U.S. – All Outlets Combined, plus Convenience, 52-weeks ending 06/27/2015, UPC-coded products only, CAGR = compound annual growth rate
Dollar growth
14%
Total store(52 weeks ending 6/27/2015 versus
year ago)
2%
Organic Content Presence1 claims
(4-YR CAGR)
Top 5 CAGR ($) over four years:
1. Corn Free3 49%2. Grain Free3 43%3. Low Glycemic3 24%4. Ancient Grains3 21%5. GMO Free1 17%
Top 5 Dollar Growth vs. year ago:
1. Grain Free3 95%2. Corn Free3 45%3. Ancient Grains3 32%4. Low Glycemic3 21%5. Stevia3 18%
Wellness claims not just for humans; majority of grain & corn free sales in pet food

Co
pyr
igh
t ©
2015
Th
e N
iels
en C
om
pan
y. C
on
fid
enti
al a
nd
pro
pri
etar
y.
53
HEALTH & WELLNESS CLAIMS: TOP RANKING
1Dollar sales $10 billion or more, 2Dollar sales $5 billion to $10 billion, 3Dollar sales less than $5 billion; Note: Health & Wellness claims are not additive
Source: Nielsen Answers, Wellness Track, Total U.S. – All Outlets Combined, plus Convenience, 52-weeks ending 06/27/2015, UPC-coded products only, CAGR = compound annual growth rate
$ % CHANGE VS. YEAR AGO
1. Grain Free3 94.9%2. Corn Free3 44.6%3. Ancient Grains3 31.9%4. Low Glycemic3 21.0%5. Stevia3 18.2%6. GMO Free1 17.0%7. Organic Content Presence1 16.0%8. Cough3 14.6%9. Gluten Free1 14.3%10. Hormone Antibiotic Free1 12.4%11. Sleeping Aid3 12.1%12. HFCS Free2 12.1%13. No MSG2 11.9%14. Natural11 11.9%15. Artificial Color Flavor1 11.2%16. Non Food Allergy3 9.9%17. Arthritis3 9.0%18. Fortified3 8.6%19. Heartburn Acid Reflux3 7.4%20. Preservative Presence1 6.7%21. Diabetes3 6.5%22. Lactose Presence2 6.1%23. Sweetener Presence2 5.2%24. Soy/Soy Free1 4.8%25. Flax or Hemp3 4.5%
DOLLAR SALES (billions)
1. Fat Presence $ 56.0 2. Soy/Soy Free 55.6 3. Vitamin/Mineral Presence 55.3 4. Gluten Free 46.4 5. Preservative Presence 41.3 6. Caffeine Presence 40.3 7. Calorie Presence 39.6 8. Natural 36.7 9. Salt or Sodium Presence 34.8 10. Artificial Color Flavor 33.5 11. Trans Fat Presence 23.5 12. Grain Type 20.9 13. Cholesterol Presence 19.4 14. Sugar Presence 18.9 15. Protein Presence 18.4 16. Calcium Presence 17.1 17. GMO Free 13.6 18. Organic Content Presence 13.2 19. Fiber Presence 10.6 20. Hormone Antibiotic Free 10.5 21. Omega 3 Type 9.3 22. Lactose Presence 8.5 23. Antioxidants 8.0 24. HFCS Free 7.8 25. Fruit & Veg Presence 7.4
4-YEAR $ CAGR
1. Corn Free3 49.5%2. Grain Free3 42.9%3. Low Glycemic3 24.1%4. Ancient Grains3 21.3%5. GMO Free1 17.3%6. Gluten Free1 16.8%7. Probiotic/Prebiotic3 14.4%8. Hormone Antibiotic Free1 14.4%9. Organic Content Presence1 13.8%10. Natural1 12.4%11. Artificial Color Flavor1 11.3%12. No MSG2 11.2%13. Sleeping Aid3 11.0%14. HFCS Free2 10.6%15. Bone Health3 10.0%16. Lactose Presence2 9.1%17. Stevia3 8.6%18. Soy/Soy Free1 8.2%19. Protein Presence1 7.8%20. Non Food Allergy3 7.4%21. Preservative Presence1 7.0%22. Cough3 6.5%23. Flax or Hemp3 5.8%24. Arthritis33 5.7%25. Fruit & Veg Presence2 5.1%
Average of 31% growth
UPC-coded items
54
Co
pyr
igh
t ©
2015
Th
e N
iels
en C
om
pan
y. C
on
fid
enti
al a
nd
pro
pri
etar
y.
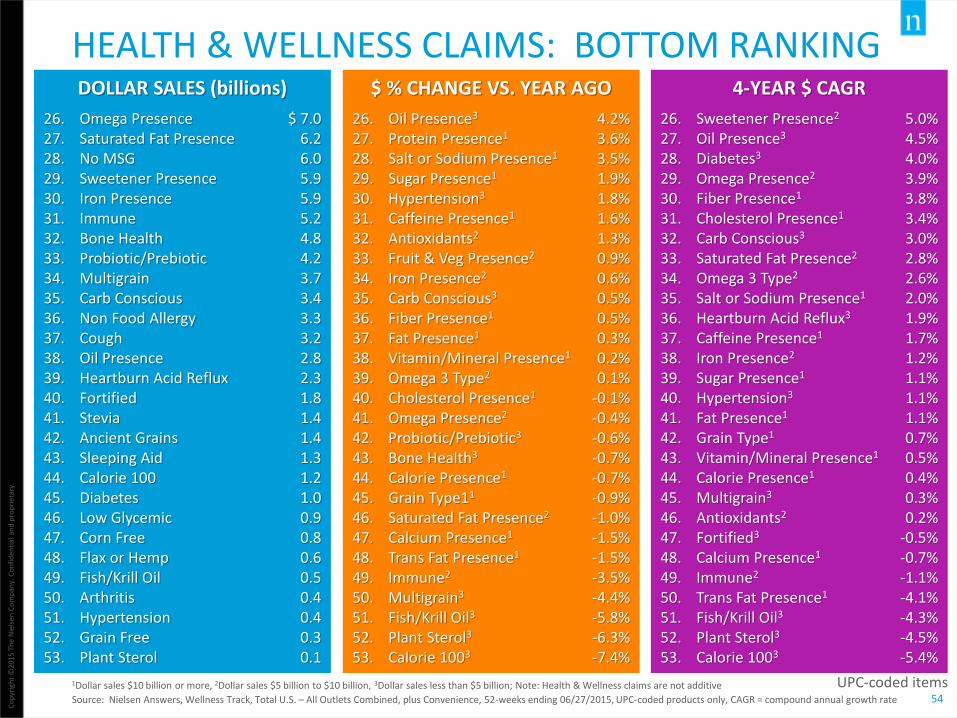
HEALTH & WELLNESS CLAIMS: BOTTOM RANKING
1Dollar sales $10 billion or more, 2Dollar sales $5 billion to $10 billion, 3Dollar sales less than $5 billion; Note: Health & Wellness claims are not additive
Source: Nielsen Answers, Wellness Track, Total U.S. – All Outlets Combined, plus Convenience, 52-weeks ending 06/27/2015, UPC-coded products only, CAGR = compound annual growth rate
$ % CHANGE VS. YEAR AGO
26. Oil Presence3 4.2%27. Protein Presence1 3.6%28. Salt or Sodium Presence1 3.5%29. Sugar Presence1 1.9%30. Hypertension3 1.8%31. Caffeine Presence1 1.6%32. Antioxidants2 1.3%33. Fruit & Veg Presence2 0.9%34. Iron Presence2 0.6%35. Carb Conscious3 0.5%36. Fiber Presence1 0.5%37. Fat Presence1 0.3%38. Vitamin/Mineral Presence1 0.2%39. Omega 3 Type2 0.1%40. Cholesterol Presence1 -0.1%41. Omega Presence2 -0.4%42. Probiotic/Prebiotic3 -0.6%43. Bone Health3 -0.7%44. Calorie Presence1 -0.7%45. Grain Type11 -0.9%46. Saturated Fat Presence2 -1.0%47. Calcium Presence1 -1.5%48. Trans Fat Presence1 -1.5%49. Immune2 -3.5%50. Multigrain3 -4.4%51. Fish/Krill Oil3 -5.8%52. Plant Sterol3 -6.3%53. Calorie 1003 -7.4%
4-YEAR $ CAGR
26. Sweetener Presence2 5.0%27. Oil Presence3 4.5%28. Diabetes3 4.0%29. Omega Presence2 3.9%30. Fiber Presence1 3.8%31. Cholesterol Presence1 3.4%32. Carb Conscious3 3.0%33. Saturated Fat Presence2 2.8%34. Omega 3 Type2 2.6%35. Salt or Sodium Presence1 2.0%36. Heartburn Acid Reflux3 1.9%37. Caffeine Presence1 1.7%38. Iron Presence2 1.2%39. Sugar Presence1 1.1%40. Hypertension3 1.1%41. Fat Presence1 1.1%42. Grain Type1 0.7%43. Vitamin/Mineral Presence1 0.5%44. Calorie Presence1 0.4%45. Multigrain3 0.3%46. Antioxidants2 0.2%47. Fortified3 -0.5%48. Calcium Presence1 -0.7%49. Immune2 -1.1%50. Trans Fat Presence1 -4.1%51. Fish/Krill Oil3 -4.3%52. Plant Sterol3 -4.5%53. Calorie 1003 -5.4%
DOLLAR SALES (billions)
26. Omega Presence $ 7.0 27. Saturated Fat Presence 6.2 28. No MSG 6.0 29. Sweetener Presence 5.9 30. Iron Presence 5.9 31. Immune 5.2 32. Bone Health 4.8 33. Probiotic/Prebiotic 4.2 34. Multigrain 3.7 35. Carb Conscious 3.4 36. Non Food Allergy 3.3 37. Cough 3.2 38. Oil Presence 2.8 39. Heartburn Acid Reflux 2.3 40. Fortified 1.8 41. Stevia 1.4 42. Ancient Grains 1.4 43. Sleeping Aid 1.3 44. Calorie 100 1.2 45. Diabetes 1.0 46. Low Glycemic 0.9 47. Corn Free 0.8 48. Flax or Hemp 0.6 49. Fish/Krill Oil 0.5 50. Arthritis 0.4 51. Hypertension 0.4 52. Grain Free 0.3 53. Plant Sterol 0.1
UPC-coded items

KEY TAKEAWAYS AND CLOSING THOUGHTS
Co
pyr
igh
t ©
2015
Th
e N
iels
en C
om
pan
y. C
on
fid
enti
al a
nd
pro
pri
etar
y.
56
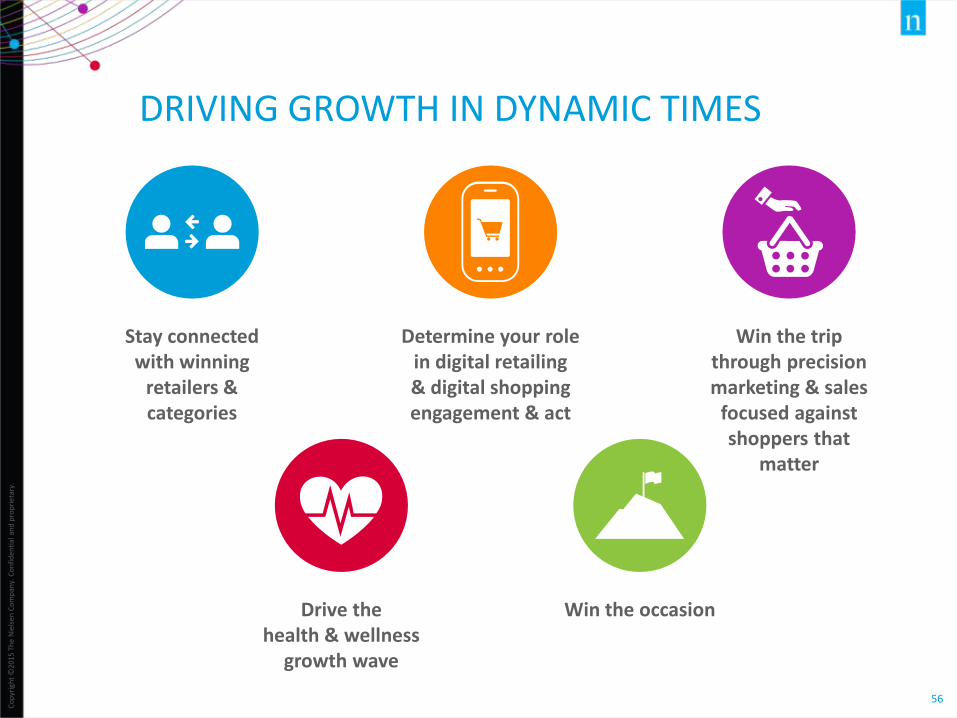
DRIVING GROWTH IN DYNAMIC TIMES
Stay connected with winning
retailers & categories
Determine your role in digital retailing & digital shopping engagement & act
Win the trip through precision marketing & sales
focused against shoppers that
matter
Drive the health & wellness
growth wave
Win the occasion
Co
pyr
igh
t ©
2015
Th
e N
iels
en C
om
pan
y. C
on
fid
enti
al a
nd
pro
pri
etar
y.
57
ACTIVATION
*Quote source: http://www.cdc.gov/hrqol/pdfs/cdnrwinter03.pdf
Retailers and manufacturers can drive topline growth with increased focus on the needs of chronic sufferers
- Who are they?- Where do they shop- What to the buy?- What are their needs (packaging, language, etc.)
Conditions are complex varying in size, age, socio‐economic status, level of Healthcare engagement and other factors
Co
pyr
igh
t ©
2015
Th
e N
iels
en C
om
pan
y. C
on
fid
enti
al a
nd
pro
pri
etar
y.
58
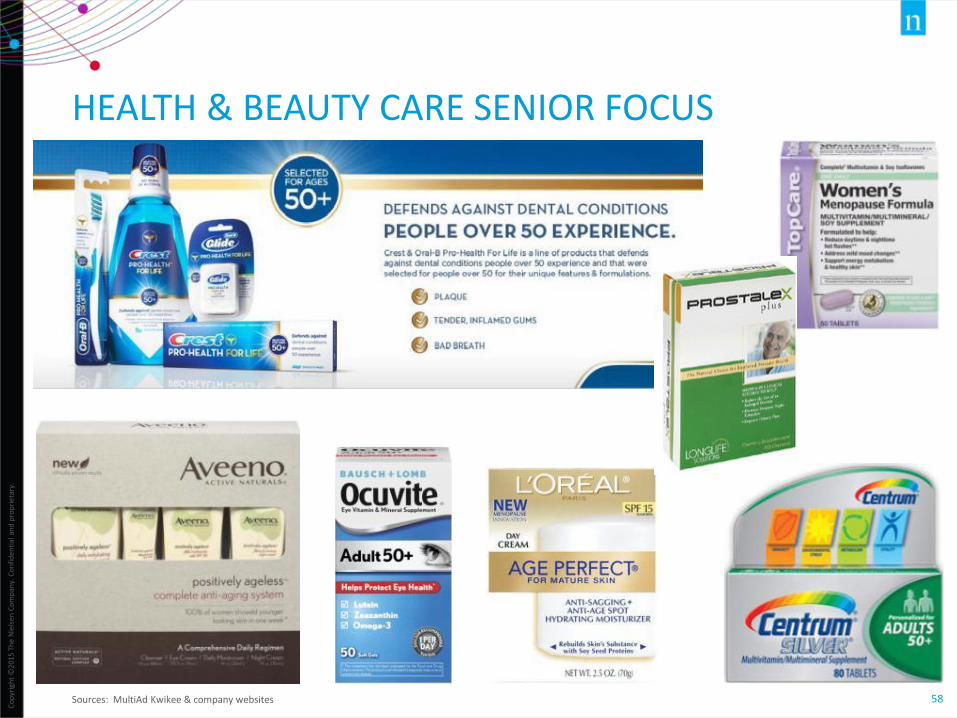
HEALTH & BEAUTY CARE SENIOR FOCUS
Sources: MultiAd Kwikee & company websites
Co
pyr
igh
t ©
2015
Th
e N
iels
en C
om
pan
y. C
on
fid
enti
al a
nd
pro
pri
etar
y.
59
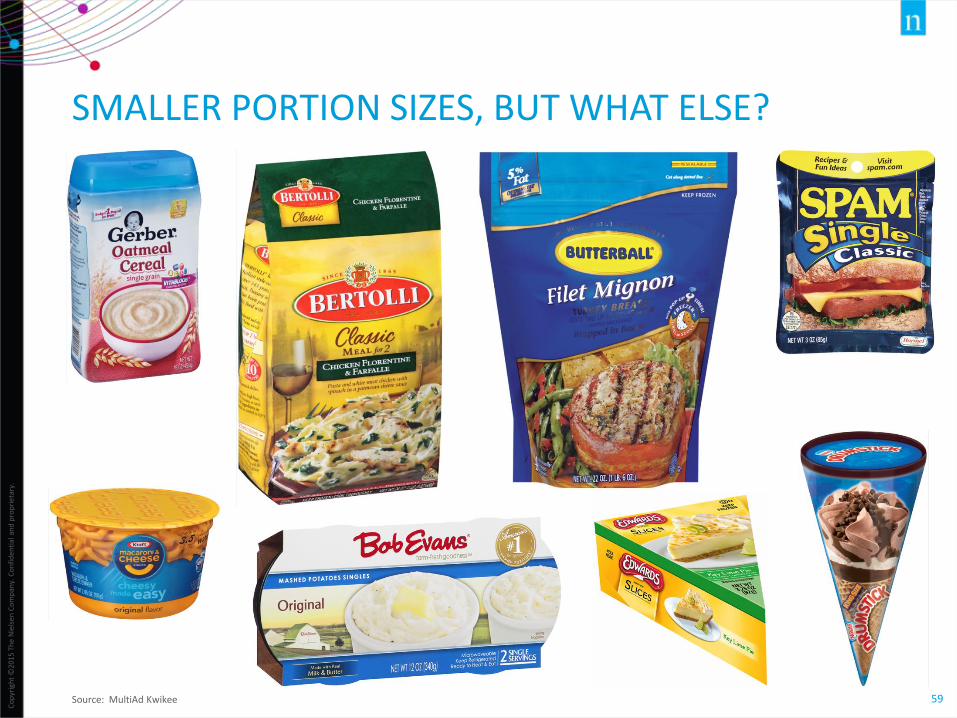
SMALLER PORTION SIZES, BUT WHAT ELSE?
Source: MultiAd Kwikee

Co
pyr
igh
t ©
2015
Th
e N
iels
en C
om
pan
y. C
on
fid
enti
al a
nd
pro
pri
etar
y.
60
INNOVATING FOR LOWER PRICE POINT
Source: MultiAd Kwikee
10 oz standup bag
5 oz
0.95 oz packets
10 oz
9 oz standup bag
61
Co
pyr
igh
t ©
2015
Th
e N
iels
en C
om
pan
y. C
on
fid
enti
al a
nd
pro
pri
etar
y.
CONSUMERS WILL PAY MORE IF THE BENEFITS OUTWEIGH THE PRICE
Sources: MultiAd Kwikee

Co
pyr
igh
t ©
2015
Th
e N
iels
en C
om
pan
y. C
on
fid
enti
al a
nd
pro
pri
etar
y.
62
ACTIVATION
Develop a marketing plan and retail activation plan- Set goals and objective- Collaborate with your retailer and manufacturer partners
Create measurable objectives and track and report- Sales and shares- Customers- Consumer basics and purchase habits

Co
pyr
igh
t ©
2015
Th
e N
iels
en C
om
pan
y. C
on
fid
enti
al a
nd
pro
pri
etar
y.
63
KEY TAKEAWAYSThe Spending Environment
• Socio-economic factors profoundly influence health behavior of chronic sufferers. The totalburden of healthcare falls on Genx & Boomers; Younger households see food as medicine
• Pocketbook Pressures: fixed expenses force some families to reduce household, food & discretionary spend
• What is the Spending Power Risk or Opportunity for your shoppers or consumers?
Co
pyr
igh
t ©
2015
Th
e N
iels
en C
om
pan
y. C
on
fid
enti
al a
nd
pro
pri
etar
y.
CLOSING THOUGHTS
• Win the Trip: through superior shopper or consumer connection, innovation &/or operating excellence
• Retailing @ the Extremes: drives store expansion & product innovation efforts. How can you capitalize with new store offerings and formats?
• Chronic sufferers vary in market size and OTC opportunity: Diabetes Type II, Overactive Bladder and Osteo-Arthritis are the most productive OTC conditions to build programs around
• Large Sufferer groups include allergy, high blood pressure, imperfect vision and acid reflux: All possess US HH penetrations greater than 36M, offering significant customer acquisition opportunity for retailers and manufacturers
64

Questions or requests for additional information:Kristin Gorski, Director, Business [email protected]

APPENDIX

67
Co
pyr
igh
t ©
2015
Th
e N
iels
en C
om
pan
y. C
on
fid
enti
al a
nd
pro
pri
etar
y.
SUMMARY OF U.S. RETAIL HOT BUTTONS
U.S. Retail Hot Buttons: July 27, 2015
Retail Landscape & Performance
Growth Challenges: Over the past four years, the only meaningful dollar growth (+4%) experienced by the (Nielsen-measured) fast-moving consumer-packaged goods market, was in the 52-week period ending June 30, 2012 when inflationary pressures had retailers accepting manufacturer price increases as well as passing on increases on their own-brand products. Over the past three 52-week periods, dollar sales grew by about 2%. Low unit sales growth has been more problematic with no growth over the last two 52-week periods. In an economic recovery, shouldn’t we expect more growth or is flat or slow growth the best we can expect?
Dollar sales across all measured channels grew 2.49% to $810.8 billion during 52-weeks ending June 27, 2015. Convenience and value-focused (i.e., club, dollar and mass-merchandisers) retail channels continue to show the strongest growth in dollar sales, up 4.2% and 2.8% respectively. Supermarkets (up 1.9%) aren’t lagging too far behind, while drug store sales were flat (up 0.1%).
New store openings and closings are key drivers of retail channel and retailer sales levels and trends. Most leading retailers within the major retail channels of mass-merchandisers, drugstores, warehouse clubs, and dollar stores have been expanding their store count over the past several years. The supermarket channel is the exception as store expansion has come mostly from niche players as well as from regional mainstream supermarkets.

68
Co
pyr
igh
t ©
2015
Th
e N
iels
en C
om
pan
y. C
on
fid
enti
al a
nd
pro
pri
etar
y.
SUMMARY OF U.S. RETAIL HOT BUTTONS
U.S. Retail Hot Buttons: July 27, 2015
Retail Landscape & Performance (con’t)
When we compare winning retailers with how the various retail channels are connected with households across the economic spectrum, retail performance is linked to the spending power of households who shop retail channels. That is, sales within club, pet, hardware/home improvement, and online retail channels are skewed to the more affluent shopper. Many retailers within those channels are driving stronger same-store-sales growth than retailers in channels where sales are driven by lower and middle income shoppers.
Retail 2019 – What’s In Store?
When we use historical data to project future retail channel growth, e-commerce will be the big winner, but sporting goods, pet, dollar, auto, discount department, convenience/gas, and club will also drive strong CAGRs (compounded annual growth rates – dollar basis) between 2014 and 2019 – between 12.3% and 4.1%, respectively and at or above the average for the industry (+4.1%).
As a retailer, do you know where your future competition is coming from? As a manufacturer, how are you managing your sales support with retail accounts where growth will either be an opportunity or a challenge?

69
Co
pyr
igh
t ©
2015
Th
e N
iels
en C
om
pan
y. C
on
fid
enti
al a
nd
pro
pri
etar
y.
SUMMARY OF U.S. RETAIL HOT BUTTONS (CON’T)
U.S. Retail Hot Buttons: July 27, 2015
What’s Selling – Long-Term Trends
Over the past four years, salty snacks, candy, beer & malt beverages and new age beverages had the biggest gains in absolute dollar sales, and demand shifts are behind those gains. Salty snacks growing as U.S. consumers have increased snacking occasions at the expense of main meals. Growth in fresh produce as we look to lead healthier lifestyles, but inflationary pressures at work here as well. Candy an coffee have experienced a lot of price pressure from high commodity input costs, but they have also responded with innovation – particularly in premium segments.
In terms of categories with the biggest losses, rather than purchasing recorded movies on DVDs, consumer demand has shifted to downloading via the internet. Smartphones are being used to take pictures, so camera and film sales have suffered. We are reading more on-line, so a decline in magazine sales. The cereal category is still huge, but consumers are changing their breakfast eating habits and the category is losing sales.

70
Co
pyr
igh
t ©
2015
Th
e N
iels
en C
om
pan
y. C
on
fid
enti
al a
nd
pro
pri
etar
y.
SUMMARY OF U.S. RETAIL HOT BUTTONS (CON’T)
U.S. Retail Hot Buttons: July 27, 2015
What’s Selling – Short-Term Trends
Inflationary pressures from rising commodity prices has driven growth in some major departments, but consumer demand and increased retailer focus are driving forces too, particularly in departments like alcoholic beverages and perimeter fresh departments including prepared snacks and meals. Elevated prices and increased demand in some segments are behind the growth in fresh meat, but an increase in fixed-weight/prepackaged fresh meat is a factor too. The net impact is that some retailers are winning away-from-home eating occasions, but at the expense of center store categories used to prepare meals and snacks. As one industry analyst claimed, the “power of now” is a driver of consumer spending.
In terms of unit trends, trends are generally softer versus dollar trend metrics as consumers continue to make trade-offs or buy less – particularly in center store categories.