Embed Size (px)
Citation preview

Health Behav& Pub Health 2012 2(2): 35-45
A©ademy Journals 2012
ISSN 2146 9334
Health Behaviour& Public Health
www.academyjournals.net
Original Article
Using Quantile Regression to Measure the Differential Impact of
Economic and Demographic Variables on Obesity
Eric J. BELASCO
1; Benaissa CHIDMI
2; Conrad P. LYFORD
2; and Margil FUNTANILLA
2
1Montana State University, Department of Agricultural Economics and Economics, Bozeman, MT, USA 2Texas Tech University, Department of Agricultural and Applied Economics, Lubbock, TX, USA
Received: 15.08.2011 Accepted: 25.08.2012 Published: 25.09.2012
Abstract
The fight against obesity in the U.S. has become a pressing priority for policy makers due to many undesirable outcomes including escalating
health care costs, reduced quality of life and increased mortality. This analysis uses data from the 2007 Behavioral Risk Factor Surveillance
System (BRFSS) to evaluate the relationship between behavioral, economic, and demographic factors with BMI while explicitly accounting
for systematic heterogeneity using a quantile regression. Results suggest that the effect of exercise, smoking, occupation, and race vary by
sizeable amounts from high to low BMI-quantiles. This strongly indicates that future research efforts and policy responses to obesity need to
account for these differences in order to develop more effective policies.
Key words:Consumer Heterogeneity, Obesity, Quantile Regression
*Corresponding Author: E.J. Belasco, e-mail: [email protected], Phone:406-994-3706.
INTRODUCTION
Obesity is considered to have reached epidemic levels
throughout the United States (U.S.) with more than 34% of
adults over age 20 and between 12-17% of children and
adolescents being obese (National Center for Health Statistics
2007). Current estimates indicate that obesity not only has a
long range impact on the health and well-being of persons of
all ages, but the impact also extends to economic issues
including rapid escalation in health care costs and the loss of
productivity. These costs and related quality of life effects
have led to a number of research efforts and policy responses
on obesity including taxing high calorie food (Schroeter and
Lusk 2008), taxing sugar-sweetened beverages (Brownell et
al. 2009), encouraging increased physical activity (Roux
2008), as well as changes to the food environment (Morland
et al. 2006), advertising (Chou et al. 2004), and nutrition
labeling (Kuchler et al. 2005). A common potential problem
in estimating the relative effectiveness of these approaches is
that consumers are considered to be relatively homogeneous
as weight status changes. Conceptually, this would mean that
individuals who are underweight would achieve the same
result from a change in activity (e.g. nutrition changes,
increasing activity, and smoking) as overweight or obese
individuals. This assumption manifests itself in the form of
using ordinary least squares (OLS) to regress BMI on
demographic and economic factors, as in Chou et al. (2004).
To evaluate this conceptual and largely ignored issue, this
article usesquantile regression. With quantile regression,
systematic regressions are completed for each portion of the
BMI distribution to enable a direct evaluation of the
heterogeneity question. This paper demonstrates that
considerable heterogeneity exists between BMI quantiles.
This study aims to reveal the more comprehensive link
between obesity and socio-demographic, economic, and
health factors in order to assist in making potential policies to
combat obesity more effective. Recent health-related studies
that have used quantile regressions include topics such as the
relationship between BMI and income (Joliffe 2010), child
nutritional outcomes (Averett and Stifel 2009; Boorah 2005),
and the relationship between sleep duration and BMI in
Taiwan (Chen et al. 2011).

Health Behav& Pub Health 2012 2(2): 35-45 E.J. Belasco et al.
36 A©ademy Journals 2012
Information regarding consumer heterogeneity allows
policy makers to draft more informed policy in order to more
accurately link a proposed policy to thepotential impact on
individuals at the individual-level, rather than at a more
aggregated level. Further, it allows for policy to be more
effectively linked to high-risk portions of the population. In
this study, we use quantile regression to more accurately
evaluate the effect of behavior and demographics upon body
mass index (BMI), while implicitly assuming that these
relationships may change according to an individual’s BMI.
This offers more flexibility, than typical least squares
regression approaches, for modeling data with heterogeneous
conditional distributions (Chen 2004).
Data for this study are from the Behavioral Risk Factor
Surveillance System (BRFSS). The BRFSS is an annual
telephone survey on individuals in all 50 states using
stratified sampling weights and include information regarding
health factors (height, weight, access to health care, exercise,
medical history, etc.), demographic factors (race, marital
status, income, etc.), and location identifiers. Past studies
have used data from the BRFSS to measure the average
impact of economic factors on individual health outcomes
(Schroeter and Lusk 2008; Chou et al. 2004).
There have been several studies that aim to address the
issue of the prevalence of obesity. These studies can be
grouped in several categories. In one category, the focus is on
identifying the determinants of increase in obesity rates. For
instance, Chou et al. (2004) test the hypothesis that an
increase in the prevalence of obesity is the result of several
economic changes that have altered the lifestyle of
Americans.Such changes include the increase in women’s
time value, increase in the demand for convenience and fast
food, the rise in the cost of cigarette, and the increasing
availability of fast-food restaurants. In this regard, Curie et al.
(2009), in a study of the effect of fast food restaurants on
obesity, find that at least a 5.2% increase in obesity rates
among 9th
grade children is associated with the presence of a
fast food restaurant within a tenth of a mile of a school.
Similarly, Davis and Carpenter (2009) find that students
attending schools with fast-food restaurants nearby consume
fewer fruits and vegetables, more soda, and are more likely to
be overweight than those whose schools are not near fast-food
restaurants.In addition, Chou et al. (2008) find a strong
positive effect between the probability that children and
adolescents are overweight and the exposure to fast-food
restaurant advertising. Similarly, Robinson et al. (2007) find
that the aggressive marketing to children of foods and
beverages induce children age 3 to 5 to choose items
perceived to be from McDonald’s. Another factor that has
been linked to obesity in the literature is maternal
employment. Anderson et al. (2003) find that the likelihood
of a child being overweight is positively related to the number
of hours per week and the intensity of work for the mother.
Their findings are corroborated by Cawley and Liu (2007)
who conclude that increases in female labor force
participation led to an increase in childhood obesity.
Another category of factors that explain the increase in
the prevalence of obesity concerns food prices, food
availability and variety, and the price of physical activity. For
a variety of reasons, food prices have been declining. For
example, the ratio of food prices to the price of all other
goods fell by 12% between 1952 and 2003 (Variyam 2005).
According to Epstein et al. (2007), purchases of low-energy-
density and high-density-energy foods are reduced when their
prices are increased.1Asfaw (2006) uses an Egyptian
integrated household survey to analyze the effect of the
Egyptian food subsidy program on obesity prevalence among
mothers. The study finds that BMI is inversely related to the
price of subsidized energy-dense foods and directly related to
the price of high diet quality.However, Schroeter and Lusk
(2008) find that decreasing the price of food at home
(supposed to be healthier) is a relatively efficient way of
decreasing body weight.
Finally, many studies link the prevalence of obesity to
physical activity and the increase in its cost. Varyiyam (2005)
argues that the increase in the cost of physical activity either
through direct cost (joining gym or health club) or through the
opportunity cost (the value of the time foregone while
exercising) alters the incentives for energy expenditure.
Whatever the cause, over half of adults do not exercise
consistently (Centers for Disease Control, 2009).
A second category of studies deals with policies that can
alleviate the incidence of obesity and reduce its prevalence.
For instance, Roux et al. (2008) show that physical activities
reduce disease incidence and are cost-effective compared to
other preventive strategies. Jacobson and Brownell (2000)
suggest imposing taxes on soft drinks, snack, and foods of
low nutritional value and using the revenues to fund health
promotion programs. However, Kuchleret al. (2009) find that
lowering tax rates by 1 cent per pound and by 1 percent of
value would not alter consumption of salty snacks. Asfaw
(2006) concludes that the Egyptian subsidy program should
be redirected toward basic healthy foods by lowering prices
of micronutrient-rich foodstuff not the starchy and fatty food
items. Furthermore, Schroeter and Lusk (2008) conclude that
taxing food away from home leads to weight increase.
While a large body of research exists to support the
impact of certain covariates on overall BMI, these estimates
are typically found based on a single linear regression that
does not fully characterize consumer heterogeneity.
For example,Goel and Ram (2004) determined that
individuals who consume higher amounts of cigarettes have a
significantly higher elasticity when compared to those who
consume relatively low amounts. One can make the same
Health Behav& Pub Health 2012 2(2): 35-45 E.J. Belasco et al.
37 A©ademy Journals 2012
argument regarding lifestyle choices such that individuals
who tend to make relatively unhealthier choices are more
likely to be less sensitive to make lifestyle choices that are
more typical of healthier groups. In this study, we look to
compare the sensitivity of individuals in higher BMI ranges
with that of individuals in lower BMI ranges in order to
determine the variability in modeling outcomes and policy
responses.
DATA
This paper utilizes the rich collection of health data from
the Centers for Disease Control and Prevention’s Behavioral
Risk Factor Surveillance System (BRFSS). Data are annually
collected from all fifty states through cross-sectional
telephone surveys targeting adults eighteen years or older.
Demographic information, self-reported body weight and
height, and other health-related information of individuals
contained in the BRFSS’ 2007 survey are combined with
Consumer Price Indices from the U.S. Department of Labor-
Bureau of Labor Statistics (BLS). The BRFSS is a survey
conducted by the Center for Disease Control (CDC) in
cooperation with each state and uses a disproportionate
stratified sampling design method.
Because the observations are not a random subsample,
stratification weights are used in computing the summary
statistics reported in Table 1. We also test whether the
sample weighted and unweighted parameter estimates are
statistically different as proposed by DuMouchel and Duncan
(1983). Test results indicate that the two are not statistically
differentwhen using quantile regression, meaning both are
consistent and implying the unweightedquantile regression is
preferred because it is more efficient. Further support for not
using weights within the regressions is provided by
DuMouchel and Duncan (1983) who state that weights are not
necessary when samples are exogenously stratified, as in the
case of quantile regression.
The metropolitan city-level price indices considered in
this paper are particular to the total expenditures for food at
grocery stores and food prepared by the consumer unit on
trips, or more commonly referred to as food-at-home, and to
food-away-from-home, respectively. Food-away-from-home
includes expenditures on all meals in fast-food, take-out,
delivery, concession stands, buffet and cafeteria, full-service
restaurants, and at vending machines and mobile vendors,
among others. Both expenditure levels are stated in terms of $
in 1998. As pointed out in Schroeter and Lusk (2008), the
distinction between the two price indices are used because at-
home foods are thought to be healthier than away from home
foods, which include food from restaurants and fast-food
chains. To capture non-linear impacts from these prices, a
squared term is used with each price index.
A total of 430,902 individuals participated in the 2007
BRFSS survey. However, the merged data set was trimmed to
253,941 after eliminating observations due to omitted
responses regarding relevant questions used in this
analysis.2Further, regional binary variables were included and
based on U.S. Census Bureau regional specifications for
Northeast, Midwest, South, and West. Regional and
metropolitanstatistical areas (MSA) classifications are used in
order to identify differences in regional location and
population density, respectively. This variable identifies the
difference between individuals living in city centers, outside
city centers, in suburban counties, and MSA that do not have
a center city. The inclusion of these variables is intended to
identify differences in food availability and variety across
different geographical areas.The number of fast food
restaurants for each county was based on North American
Industry Classification System (NAICS)code722211 of the
U.S. Censusper 10,000 inhabitants. This includes fast food
restaurants, pizza parlors, carryout restaurants, and any
limited service restaurant.
BMI is computed based on reported height and weight
and can be used to classify individuals into 4 main weight
categories: underweight (BMI< 19), ideal (19<BMI<25),
overweight (25<BMI<30), and obese (BMI > 30). As in
Dunn (2010), we omit individuals with a BMI below 12 or
above 90, eliminating 28 observations. In this data, 27.4% of
the weighted respondents are classified as obese, while 36.9%
are classified as overweight, 34.3% are classified within the
ideal BMI range, while 1.5% are underweight. This implies
that the top 3 quantiles (.7, .8, .9) correspond to individuals in
the obese category, while the 3 middle quantiles (.4, .5, .6)
correspond to individuals in the overweight category. In our
analysis, this allows us to focus on the difference in the
marginal impacts from different factors for each group and
within each group. An important question part of this
analysis is evaluating which segments of the population are
impacted by behavioral or price changes.
Individuals are also asked questions regarding the
servings of vegetables they consume as well as how much
physical activity they participate in on a weekly basis. Daily
servings of vegetables exclude carrots and potatoes, where the
mean amount is 1.41 servings of vegetables per day. Physical
activities are broken into moderate and vigorous physical
activity, which has a recommended level of 30 minutes for 5
or more days of moderate activity and 20 minutes for 3 or
more days for vigorous activities. Of the surveyed
respondents, 15.4% met both recommended levels for
moderate and vigorous activities (All Act), while 33.1% met
only one recommended level (Some Act), 38.7% reported
insufficient activity for both types of physical activity
(Insufficient Act), and 12.8% reported no physical activity.
Additional individual-specific information includes the use of

Health Behav& Pub Health 2012 2(2): 35-45 E.J. Belasco et al.
38 A©ademy Journals 2012
a health care plan, diagnosis of asthma, and cigarette smoking
frequency (everyday, someday, former, never). Also,
demographic information, such as marital status, cultural
heritage, education, gender, income, and type of employment
are included in the data and provide important control
variables for variation in BMI.
METHODS
Typical least squares methods are based on finding
optimal parameter estimates by minimizing the sum of
squared errors, such that
∑
(1)
where such that and are individual scalar
values and is (1xk) while is (kx1) and contain regressors
that are expected to impact . OLS estimates for within
this context can be thought of as average estimates across the
population. However, a richer characterization of the data
can be found through the use of quantile regression. This is
because individuals of different levels of BMI are
hypothesized to respond differently to the regressor variables.
For example, exercise may have a small marginal impact on
individuals with low BMI and a significantly larger impact
for individuals with higher BMI. Other advantages of quantile
regression include the additional robustness to outliers as well
as the weak assumptions needed for consistent estimation
(Cameron and Trivedi 2005).
A quantile regression allows us to identify the
heterogeneity regarding health outcomes from different
economic factors and assess the differences in sensitivity to
economic factors among BMI levels. In deriving the quantile
regression it is important to point out that we can obtain the
median of a random variable by minimizing the sum of
absolute deviations. As Koenker and Hallock (2001) point
out, we can also obtain the quantile ( ) by minimzing the sum
of asymmetrically weighted absolute residuals, where positive
residuals are weighted with and negative residuals are
weighted with ( ). This can be written as
∑
(2)
where ( ) is the asymmetrically
weighted function with equal to 1 when is
negative and zero otherwise. Notice that there is an optimal
for each specified quantile, which in the case of this
study includes 9 quantile points: { } .
Since we obtain parameters that are from a set of equations,
we use the argmin function above. The weighting function
can alternatively be written as
{
| |
| |
(3
)
Within each quantile, BMI is conditional on , which includes
demographic, economic, and health factors that influence
BMI. More specifically,
[ | ]
(4)
where [ | ] is the th conditional quantile of
BMI, is the regression intercept while , which
are of size (nxkd), (nxke), and (nxkh) such ,
and are coefficients corresponding to demographic (age,
gender, ethnicity), economic (“at-home” food price index,
“away-from-home” food price index), and health (exercise,
access to a health insurance plan) variables, respectively. The
coefficients represent the marginal impact on BMI from
covariates at the th quantile.
Each quantile corresponds to a unique estimate for ,
which allows for an examination into the economic impacts
of obesity by BMI. For example, Schroeter and Lusk (2008)
estimate the elasticity of BMI to changes in fast food price
index to be -0.048 for all individuals in the survey. This
implies that an increase of 10% in the price of fast food prices
results in a drop in individual BMI by an average of about
0.5%. However, this elasticity can be viewed as an average
elasticity across the population. From a policy perspective, it
would also be useful to know which segments of the
population have more elastic demands for such foods.
Another example is the potential for a subsidy on foods
deemed healthy, such as fruits and vegetables. Would such a
policy have the desired impacts on the high risk (obese or
overweight) proportion of the population?
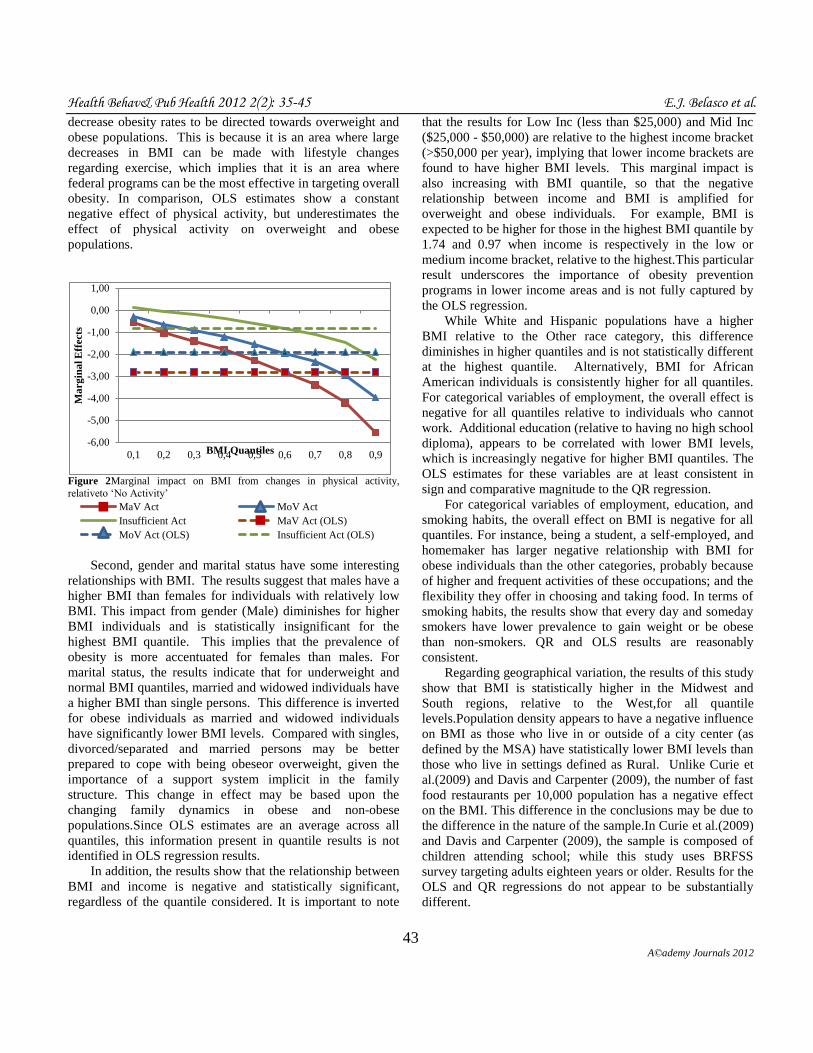
First, notice that for all quantiles and in the OLS estimate,
the parameter of the variableage is positive and statistically
significant, implying that the BMI increases as age increases.
However, the positive association with age increases as the
BMI increases in QR. Figure 1 (as well as Figures 2 and 3)
plots the marginal effects associated with different quantiles,
as well as the OLS results which are denoted with a dotted
line. As shown in Figure 1, the marginal effect of age (at the
mean age of 53.2) on BMI for individuals in lower quantilesis
insignificant, while this effect is more substantial for the
highest quantile (-0.0644), which includes obese individuals.
This implies that a one-year increase in Age correlates with a
reduction of 6.4% in BMI. Additionally, ages at the top and
lowest quantiles were used to illustrate the nonlinear impact
of age on BMI. For example, the impact for individuals 25-
years old are quite different, where the average marginal

Health Behav& Pub Health 2012 E.J. Belasco et al.
39 A©ademy Journals 2012
Table 1 2007 Weighted Summary Statistics (N =275,698)
Variable Units Mean Q1 Q3
BMI kg/m2 27.61 23.62 30.43
Age Years 53.17 41.00 65.00
Children Number of children in household 0.62 0.00 1.00
Vegetable Servings Servings per day 1.41 0.86 2.00
Fast Food Per Capita stores per 1,000 residents 6.97 6.00 7.98
Food At-Home Price in 1998 $ 189.70 177.00 208.20
Food Away From Home
Price in 1998 $ 195.90 179.90 224.80
Weighted Proportion of Sample
HealthPlan 1 = yes, if health care coverage; 0 = no 86.38%
All Act 1 = yes, if meets recommended moderate and vigorous physical
activity levels; 0 = no
17.09%
Some Act 1 = yes, if meets recommended moderate or vigorous physical activity
levels; 0 = no
32.90%
Insufficient Act 1 = yes, if insufficient moderate or vigorous physical activity; 0 = no 38.39%
No Act 1 = yes, if no physical activity reported; 0 = no 11.61%
Asthma 1 = yes, if ever had asthma; 0= no 12.85%
Male 1 = yes, if male; 0 = no 50.92%
Low Inc 1 = yes, if annual household income < $25,000; 0 = no 22.14%
Mid Inc 1 = yes, if annual household income $25,000-$50,000; 0 = no 25.90%
High Inc 1 = yes, if annual household income > $50,000; 0 = no 51.96%
Employed 1= yes, if employed for wages; 0=no 55.48%
Self-Employed 1 = yes, if self-employed; 0 = no 9.26%
Out of Work 1 = yes, if out of work < 1 year; 0 = no 4.38%
Homemaker 1 = yes, if homemaker; 0 = no 7.35%
Student 1 = yes, if student; 0 = no 3.93%
Retired 1 = yes, if retired; 0 = no 14.99%
Unable To Work 1 = yes, if unable to work; 0 = no 4.60%
Less than High School 1 = yes if no high school diploma; 0 = no 9.24%
High School Graduate 1 = yes, if completed; 0 = no 52.90%
College Graduate 1 = yes, if completed; 0 = no 37.86%
Northeast 1 = yes; 0 = no 19.06%
Midwest 1 = yes; 0 = no 20.97%
South 1 = yes; 0 = no 33.88%
West 1 = yes; 0 = no 26.09%
City Center 1 = yes; 0 = no 42.42%
Outside City Center 1 = yes; 0 = no 32.27%
Suburb 1 = yes; 0 = no 12.98%
No City Center 1 = yes; 0 = no 1.25%
Rural 1 = yes; 0 = no 11.08%
White 1 = yes; 0 = no 69.16%
African American 1 = yes; 0 = no 9.77%
Other race 1 = yes, if from any other race; 0 = no 7.54%
Hispanic 1 = yes; 0 = no 13.53%
Married 1 = yes; 0 = no 62.35%
Divorces/Separated 1 = yes; 0 = no 11.28%
Widowed 1 = yes; 0 = no 5.51%

Health Behav& Pub Health 2012 E.J. Belasco et al.
40 A©ademy Journals 2012
While past research has estimated the likelihood of
obesity, conditional on economic and demographic factors
using a binary choice model (Chou et al. 2004), the use of
quantile regression seems to be more appropriate in the sense
that it provides more details regarding all weight cate-
goriesusing a parsimonious model. In order to compute
standard errors associated with estimated parameters, we use
the Markov chain marginal bootstrap (MCMB) method
developed by He and Hu (2002). This resampling method
overcomes many of the issues associated with other methods
of computing standard errors for quantile regression, such as
sparcity and rank inversion methods, and is preferred when
the number of observations or independent variables is large.
Further, the MCMB method is computationally more efficient
than many other bootstrap methods because it avoids
computing a full set of parameter estimates for each bootstrap
sample; rather it relies on solving one-dimensional equations.
ESTIMATION AND RESULTS
Table 2 provides a direct comparison of the quantile
regression (QR) results for BMI quantiles 0.1-0.9 against
ordinary least squares regression (OLS) results. OLS
implicitly assumes that the effects of the different variables
have is consistent across BMI quantiles. Results show the
parameter estimates and bootstrapped standard errors for the
QR of key variables upon BMI, including exercise (All Act,
Some Act, Insufficient Act), the number of children in the
household (Children), food at home price index, food away
from home price index, income (Low Inc, Mid Inc), and
education (High School, College Graduate). Both QR and
OLS parameter estimates are highly significant and have
significance for key independent variables that have been
known to affect BMI.Overall, the results show that the effect
of many key variables clearly varies by quantile, indicating
that there is substantial heterogeneity identified in the QR.
Most significantly, a number of variables have increasingly
strong effects upon BMI as quantile increases, and a few
variables in which the sign changes as BMI quantile
increases. Results that are relevant for obesity studies and
policy proposals are highlighted below.
Table 2 Quantile Regression Results from BMI regressions
BMI Quantile
Variables OLS
0.1 0.2 0.3 0.4 0.5 0.6 0.7 0.8 0.9
Intercept 25.9315* 16.852* 19.7744* 21.0071* 22.2866* 23.7614* 25.7021* 28.2030* 31.8883* 38.9622*
(47.02) (33.28) (38.12) (42.88) (39.96) (41.40) (40.30) (36.30) (39.58) (30.56)
Age 0.3115* 0.1827* 0.2143* 0.2363* 0.2553* 0.2760* 0.2981* 0.3196* 0.3526*
0.4035* 0.3115*
(70.72) (43.01) (54.46) (63.06) (61.15) (60.21) (63.74) (60.14) (57.65) (47.75)
Age2 -0.0032* -0.0017* -0.0020* -0.0022* -0.0024* -0.0027* -0.003* -0.0033* -0.0037* -0.0044*
(-74.68) (-40.72) (-53.72) (-63.49) (-64.1) (-60.73) (-68.1) (-65.95) (-63.72) (-58.79)
HealthPlan 0.1665* 0.1851* 0.1441* 0.1581* 0.1220* 0.0928 0.1455* 0.1889* 0.1780* 0.0532
(4.14) (4.74) (3.74) (3.73) (3.00) (1.92) (3.04) (3.40) (2.38) (0.52)
Vegetable 0.1063* -0.0002 0.0134 0.0251* 0.0459* 0.0675* 0.0859* 0.1305* 0.1861* 0.2396*
(9.45) (-0.02) (1.24) (2.56) (3.81) (6.20) (7.04) (7.30) (9.98) (9.31)
All Act -2.8206* -0.5530* -1.0272* -1.4008* -1.7862* -2.2856* -2.8183* -3.3932* -4.2033* -5.5539*
(-63.08) (-13.13) (-27.85) (-33.82) (-38.93) (-53.62) (-56.53) (-59.47) (-63.75) (-52.24)
Some Act -1.9101* -0.2968* -0.6651* -0.9124* -1.2050* -1.5464* -1.9536* -2.3489* -2.9618* -3.962*
(-49.99)
(-7.40) (-19.67) (-23.56) (-26.71) (-39.11) (-43.58) (-44.97) (-47.04)
(-42.50)
(-49.99)
Insufficient Act -0.8484*
0.1015* -0.0796* -0.1975* -0.3644* -0.5922* -0.8403* -1.0964* -1.4894* -2.256*
(-22.87) (2.57) (-2.22) (-5.23) (-8.35) (-14.62) (-18.18) (-19.27) (-22.86)
(-23.99)
1.4764*
Asthma 1.4764* 0.3545* 0.5850* 0.7976* 1.0059* 1.2302* 1.4323* 1.6979* 2.0489* 2.5248*
(43.79) (10.00) (17.08) (22.68) (25.15) (29.52) (32.19) (31.06) (33.17) (28.24)
Children
0.0054
(0.43)
0.0033
(0.25)
0.0164
(1.51)
0.0247*
(2.01)
0.0141
(1.11)
0.0216
(1.66)
0.0192
(1.23)
0.0073
(0.42)
-0.0017
(-0.07)
-0.0437 0.0054
(-1.53)
Male 0.981* 1.9382* 1.8801* 1.7371* 1.5647* 1.3666* 1.1642* 0.9140* 0.5763* 0.0661
(40.1) (85.68) (92.95) (80.37) (66.28) (53.03) (42.82) (27.88) (16.16) (1.29)

Health Behav& Pub Health 2012 2(2): 35-45 E.J. Belasco et al.
41 A©ademy Journals 2012
Table 2 (Continued)
Variables OLS 0.1 0.2 0.3
BMI Quantile
0.6 0.7 0.8 0.9 0.4 0.5
Low Inc 0.8926* -0.0709 0.1875* 0.3451* 0.5066* 0.672* 0.9013* 1.0558* 1.3163* 1.7393*
(23.97) (-1.86) (5.49) (9.27) (13.52) (16.08) (21.53) (23.02) (20.42) (17.55)
Mid Inc 0.5972* 0.1014* 0.2139* 0.3112* 0.4094* 0.4722* 0.5983* 0.638* 0.7389* 0.9722*
(20.3) (3.68) (8.02) (10.65) (15.02) (16.23) (19.66) (18.57) (14.87) (15.57)
Employed -1.4801* 0.0934 -0.2930* -0.6266* -0.9121* -1.1733* -1.5528* -1.8688* -2.3905*
-3.2406* -1.4801*
(-27.79) (1.52) (-5.33) (-11.19) (-14.91) (-19.42) (-20.26) (-23.30) (-21.75) (-20.47)
Self-Employed -2.0687* -0.1956* -0.6262* -1.027* -1.3701* -1.7009* -2.0991* -2.4908* -3.1347* -4.2207*
(-32.7) (-2.97) (-10.15) (-16.30) (-18.48) (-23.8) (-26.63) (-27.79) (-25.81) (-26.31)
Out of Work -1.223* -0.0565 -0.3666* -0.6728* -0.9327* -1.1824* -1.4330* -1.5347* -1.9243* -2.395*
(-15.74) (-0.68) (-4.09) (-8.34) (-11.04) (-11.55) (-12.56) (-12.04) (-12.58) (-10.48)
Homemaker -1.9723* -0.4102* -0.8440* -1.1688* -1.5031* -1.8058* -2.1334* -2.408* -2.9345* -3.8292*
(-29.57) (-5.80) (-12.66) (-16.04) (-21.18) (-24.2) (-25.12) (-23.31) (-21.75) (-21.61)
Student -2.1657* -0.2605* -0.7245* -1.1742* -1.6127* -1.9543* -2.5156* -2.7591* -3.2539* -4.1941*
(-20.31) (-2.28) (-7.94) (-12.5) (-16.12) (-20.09) (-21.35) (-16.84) (-14.91) (-15.39)
Retired -1.3137* 0.0857 -0.2817* -0.5882* -0.8705* -1.0986* -1.449* -1.7391* -2.2424* -3.0768*
(-22.71) (1.36) (-4.85) (-9.93) (-13.1) (-16.41) (-18.55) (-20.8) (-20.89) (-20.32)
High School
Graduate -0.2179* -0.0446 -0.0537 -0.07 -0.1001* -0.1265* -0.1793* -0.2522* -0.3443* -0.4689*
(-4.86) (-0.89) (-1.2) (-1.58) (-2.02) (-2.55) (-3.06) (-4.58) (-4.82) (-4.65)
College Graduate -1.2677* -0.678* -0.8073* -0.9467* -1.0132* -1.1342* -1.21* -1.3976* -1.5833* -1.9028*
(-25.69) (-12.64) (-17.12) (-20.76) (-19.41) (-19.98) (-21.6) (-22.92) (-19.57) (-17.16)
White 0.3124* 0.4208* 0.4379* 0.4146* 0.3702* 0.3277* 0.2535* 0.2108* 0.1893* 0.1528
(5.88) (8.93) (8.32) (7.86) (6.87) (5.23) (3.7) (2.79) (1.98) (1.30)
African American 2.0414* 1.5015* 1.8585* 2.0447* 2.1217* 2.1654* 2.1593* 2.2989* 2.3629* 2.4273*
(30.44) (22.67) (25.73) (28.35) (31.17) (28.65) (25.23) (24.72) (18.84) (13.87)
Hispanic 0.6789* 1.0047* 1.0367* 0.9771* 0.9373* 0.8785* 0.671* 0.6062* 0.3909* 0.0869
(9.66) (16.79) (13.98) (14.69) (12.19) (9.93) (7.45) (6.45) (3.14) (0.52)
Married -0.3784* 0.3646* 0.2468* 0.1542* 0.064 -0.027 -0.165* -0.3607* -0.5996* -1.1648*
(-9.87) (9.32) (7.3) (4.37) (1.85) (-0.6) (-3.72) (-7.41) (-8.85) (-11.98)
Divorces/Separated -0.5768* 0.0935* -0.0196 -0.1459* -0.2088* -0.3145* -0.4099* -0.5143* -0.7276* -1.1922*
(-13.27) (2.11) (-0.48) (-3.49) (-4.79) (-6.05) (-7.46) (-7.99) (-10.36) (-10.65)
Widowed -0.2644* 0.3247* 0.2762* 0.2227* 0.1891* 0.0965 0.0092 -0.1906* -0.4428* -0.9711*
(-5.02) (5.91) (5.84) (4.60) (3.73) (1.54) (0.14) (-3.02) (-5.32) (-8.01)
Everyday Smoker -1.6797* -1.2303* -1.286* -1.2889* -1.3327* -1.3736* -1.4602* -1.5495* -1.7073* -2.0364*
(-47.52) (-34.49) (-35.09) (-36.63) (-37.10) (-32.60) (-35.31) (-34.10) (-30.84) (-28.1)
Someday Smoker -1.2648* -0.6951* -0.7055* -0.7166* -0.7693* -0.9189* -1.0416* -1.2343* -1.4373* -1.8482*
(-22.74) (-13.15) (-11.91) (-13.29) (-16.50) (-17.82) (-16.65) (-16.35) (-17.89) (-14.4)
Former Smoker 0.2859* 0.2773* 0.2714* 0.2798* 0.2694* 0.2971* 0.2889* 0.318* 0.3369* 0.3005*
(10.74) (10.67) (12.44) (13.26) (11.82) (10.62) (10.16) (9.94) (8.75) (5.43)
Northeast
-0.0065 (-0.18)
0.0687* (2.04)
0.0513 (1.74)
0.0686* (2.02)
0.0711 0.0509 0.0003 (0.01)
-0.0702 (-1.56)
-0.0666 (-1.22)
-0.122 (-1.57) (1.94) (1.43)
Midwest 0.4826* 0.2158* 0.3059* 0.3741* 0.4395* 0.4722* 0.4964* 0.5504* 0.6656* 0.7355*
(12.68) (5.68) (8.76) (9.79) (11.14) (12.00) (11.43) (11.09) (10.88) (8.44)
South 0.1922* 0.1303* 0.1753* 0.2218* 0.2311* 0.2498* 0.2248* 0.2344* 0.2337* 0.2078*
(5.45) (3.71) (5.94) (6.35) (6.57) (7.11) (5.67) (5.1) (4.53) (2.84)
City Center -0.2137* -0.1402* -0.1657* -0.1863* -0.1986* -0.2364* -0.2541* -0.282* -0.2682* -0.2506*

Health Behav& Pub Health 2012 2(2): 35-45 E.J. Belasco et al.
42 A©ademy Journals 2012
Note: t-values are reported in parenthesis and "*" indicates statistical significance at 0.05.
is 0.11 and 0.17 for the highest 3 quantiles. This implies that
individuals in higher BMI categories also increase weight
over time at a significantly higher rate. In this context, a 10
year increase in age corresponds to an increase of 1.1% and
1.7%, respectively. This trend is inverted for individuals with
ages of 70, where losses in BMI increase at a rate greater than
0.20, which is substantially larger than 0.06 for individuals in
healthy weight quantiles. This is the difference between an
increase of 10 years resulting in a 2.0% or 0.6% decrease in
BMI. This implies that natural growth patterns over one’s life
cycle are accentuated with age for people already having
overweight or obesity problems. These results underscore the
importance of efforts to lower BMI for individuals of younger
ages in order to minimize the natural increase in BMI due to
age.Since OLS estimates are essentially an average estimate
across the quantiles, OLS estimate overestimates the effect of
age on BMI for underweight individuals and overestimates its
effect on overweight individuals.
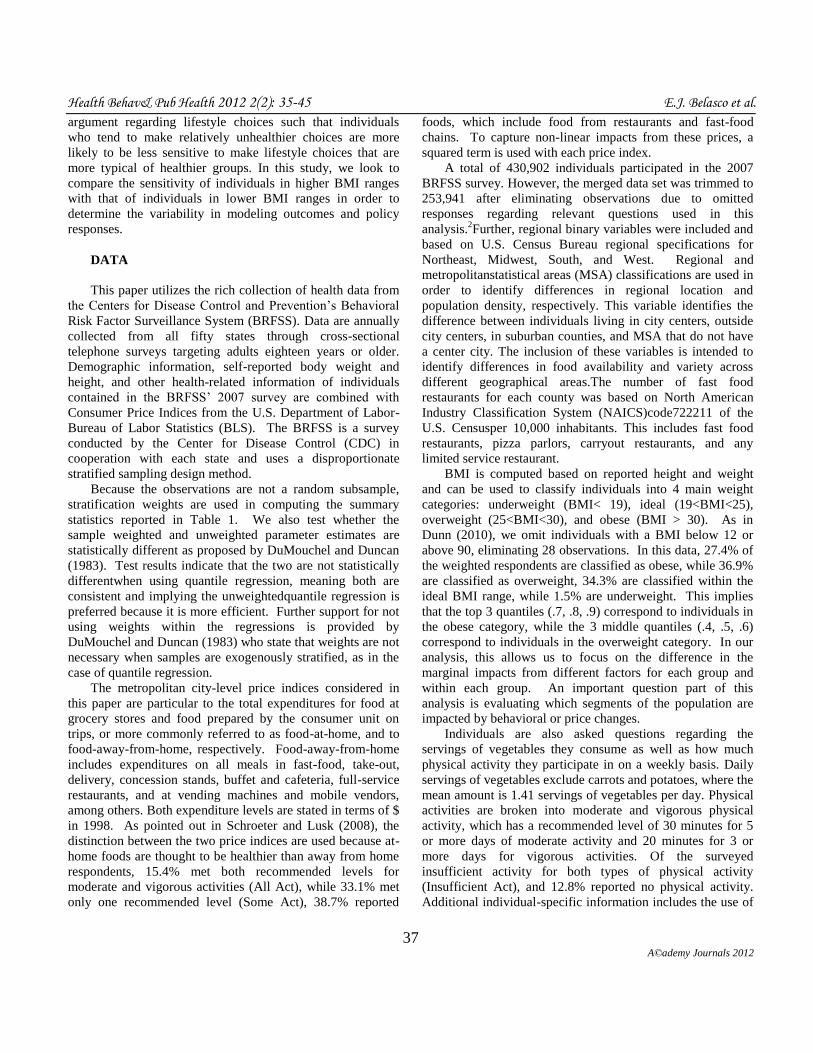
Physical activity is associated with a decrease inBMI for
all individuals, except underweight individuals, as indicated
by the negatively statistically significant parameter of the
physical activity variables.The correlation between exercise
and BMI is stronger with overweight and obese individuals
than with underweight and normal weight individuals as
shown in Figure 2. This is illustrated with the downward
slope of each line showing that as BMI increases the marginal
impact of additional exercise has a stronger impact on
lowering BMI. For example, an individual in the highest
Figure 1 Marginal impact on BMI from a one-unit change in age, by BMI
quantile
weight category is expected to decrease BMI by 5.55 units
when the individual goes from no exercise to exceeding
recommended vigorous and moderate amounts of exercise
(All Act). Some exercise, even if insufficient relative to
recommended amounts (Insufficient Act), appears to have a
significant impact on decreasing BMI for this highest BMI
category. The reported marginal impacts are relative to no
physical activity and demonstrate the importance of
efficiently marketing policy aimed at using exercise to
-0,25
-0,15
-0,05
0,05
0,15
0,25
0,1 0,2 0,3 0,4 0,5 0,6 0,7 0,8 0,9
Ma
rg
ina
l E
ffects
BMI Quantiles
Age = 25 Age = 53.17
Age = 70 Age = 25 (OLS)
Age = 53.17 (OLS) Age = 70 (OLS)
Table 2 (Continued)
BMI Quantile
Variables OLS 0.1 0.2 0.3 0.4 0.5 0.6 0.7 0.8 0.9
City Center -0.2137* -0.1402* -0.1657* -0.1863* -0.1986* -0.2364* -0.2541* -0.282* -0.2682* -0.2506*
(-7.14) (-4.96) (-5.6) (-6.64) (-7.63) (-7.26) (-7.79) (-7.21) (-4.81) (-3.55)
Outside City Center -0.1374* -0.0513 -0.0662* -0.0653* -0.1152* -0.1522* -0.1602* -0.1481* -0.1367* -0.1847*
(-4.22) (-1.79) (-2.22) (-2.29) (-3.7) (-4.73) (-4.7) (-3.57) (-2.63) (-2.67)
Suburb -0.115* -0.0414 -0.0627 -0.0854* -0.0999* -0.1246* -0.133* -0.1488* -0.1612* -0.1454
(-3.03) (-1.17) (-1.73) (-2.66) (-2.83) (-2.83) (-2.92) (-3.07) (-2.71) (-1.82)
No City Center -0.0307 -0.0572 0.009 -0.092 -0.1278 -0.1566 -0.1 -0.0266 0.1063 0.1557
(-0.27) (-0.55) (0.09) (-1.04) (-1.49) (-1.3) (-0.82) (-0.2) (0.5) (0.6)
Fast Food per cap -0.0798* -0.0434* -0.0599* -0.0675* -0.0694* -0.0709* -0.0758* -0.0955* -0.1021* -0.1038*
(-12.52) (-7.61) (-9.37) (-11.93) (-10.73) (-10.07) (-10.93) (-11.96) (-11.7) (-7.68)
Food At-Home Price -0.0664* -0.0309* -0.0521* -0.0509* -0.0485* -0.0428* -0.0466* -0.0585* -0.0739* -0.1166*
(-5.01) (-2.54) (-4.25) (-4.53) (-3.61) (-3.17) (-3.06) (-3.03) (-3.47) (-3.7)
(Food At-Home
Price)2
0.0002* 0.0001* 0.0001* 0.0001* 0.0001* 0.0001* 0.0001* 0.0002* 0.0002* 0.0003*
(5.16) (2.46) (4.38) (4.65) (3.64) (3.36) (3.23) (3.22) (3.62) (3.88)
Food Away From
Home Price
0.0362* 0.0211* 0.0251* 0.0253* 0.0252* 0.0202 0.0234* 0.0322* 0.039* 0.0585*
(3.61) (2.26) (2.68) (2.98) (2.53) (1.96) (2.09) (2.25) (2.51) (2.55)
(Food Away From
Home Price)2
-0.0001* <0.0001* -0.0001* -0.0001* -0.0001* -0.0001 -0.0001* -0.0001* -0.0001* -0.0001*
(-3.63) (-2.11) (-2.54) (-2.89) (-2.43) (-1.93) (-2.18) (-2.37) (-2.63) (-2.66)
Health Behav& Pub Health 2012 2(2): 35-45 E.J. Belasco et al.
43 A©ademy Journals 2012
decrease obesity rates to be directed towards overweight and
obese populations. This is because it is an area where large
decreases in BMI can be made with lifestyle changes
regarding exercise, which implies that it is an area where
federal programs can be the most effective in targeting overall
obesity. In comparison, OLS estimates show a constant
negative effect of physical activity, but underestimates the
effect of physical activity on overweight and obese
populations.
Figure 2Marginal impact on BMI from changes in physical activity,
relativeto ‘No Activity’
Second, gender and marital status have some interesting
relationships with BMI. The results suggest that males have a
higher BMI than females for individuals with relatively low
BMI. This impact from gender (Male) diminishes for higher
BMI individuals and is statistically insignificant for the
highest BMI quantile. This implies that the prevalence of
obesity is more accentuated for females than males. For
marital status, the results indicate that for underweight and
normal BMI quantiles, married and widowed individuals have
a higher BMI than single persons. This difference is inverted
for obese individuals as married and widowed individuals
have significantly lower BMI levels. Compared with singles,
divorced/separated and married persons may be better
prepared to cope with being obeseor overweight, given the
importance of a support system implicit in the family
structure. This change in effect may be based upon the
changing family dynamics in obese and non-obese
populations.Since OLS estimates are an average across all
quantiles, this information present in quantile results is not
identified in OLS regression results.
In addition, the results show that the relationship between
BMI and income is negative and statistically significant,
regardless of the quantile considered. It is important to note
that the results for Low Inc (less than $25,000) and Mid Inc
($25,000 - $50,000) are relative to the highest income bracket
(>$50,000 per year), implying that lower income brackets are
found to have higher BMI levels. This marginal impact is
also increasing with BMI quantile, so that the negative
relationship between income and BMI is amplified for
overweight and obese individuals. For example, BMI is
expected to be higher for those in the highest BMI quantile by
1.74 and 0.97 when income is respectively in the low or
medium income bracket, relative to the highest.This particular
result underscores the importance of obesity prevention
programs in lower income areas and is not fully captured by
the OLS regression.
While White and Hispanic populations have a higher
BMI relative to the Other race category, this difference
diminishes in higher quantiles and is not statistically different
at the highest quantile. Alternatively, BMI for African
American individuals is consistently higher for all quantiles.
For categorical variables of employment, the overall effect is
negative for all quantiles relative to individuals who cannot
work. Additional education (relative to having no high school
diploma), appears to be correlated with lower BMI levels,
which is increasingly negative for higher BMI quantiles. The
OLS estimates for these variables are at least consistent in
sign and comparative magnitude to the QR regression.
For categorical variables of employment, education, and
smoking habits, the overall effect on BMI is negative for all
quantiles. For instance, being a student, a self-employed, and
homemaker has larger negative relationship with BMI for
obese individuals than the other categories, probably because
of higher and frequent activities of these occupations; and the
flexibility they offer in choosing and taking food. In terms of
smoking habits, the results show that every day and someday
smokers have lower prevalence to gain weight or be obese
than non-smokers. QR and OLS results are reasonably
consistent.
Regarding geographical variation, the results of this study
show that BMI is statistically higher in the Midwest and
South regions, relative to the West,for all quantile
levels.Population density appears to have a negative influence
on BMI as those who live in or outside of a city center (as
defined by the MSA) have statistically lower BMI levels than
those who live in settings defined as Rural. Unlike Curie et
al.(2009) and Davis and Carpenter (2009), the number of fast
food restaurants per 10,000 population has a negative effect
on the BMI. This difference in the conclusions may be due to
the difference in the nature of the sample.In Curie et al.(2009)
and Davis and Carpenter (2009), the sample is composed of
children attending school; while this study uses BRFSS
survey targeting adults eighteen years or older. Results for the
OLS and QR regressions do not appear to be substantially
different.
-6,00
-5,00
-4,00
-3,00
-2,00
-1,00
0,00
1,00
0,1 0,2 0,3 0,4 0,5 0,6 0,7 0,8 0,9
Ma
rg
ina
l E
ffects
BMI Quantiles
MaV Act MoV Act
Insufficient Act MaV Act (OLS)
MoV Act (OLS) Insufficient Act (OLS)

Health Behav& Pub Health 2012 2(2): 35-45 E.J. Belasco et al.
44 A©ademy Journals 2012
Finally, the marginal impacts from price levels are shown
to be somewhat ambiguous and are shown in Figure 3.
Increases to food-away-from-home prices are shown to have
positive and negative impacts across BMI quantiles in a sharp
fashion. Food at-home has a slightly more clear impact as
most lowerquantiles (0.2 – 0.6) show a negative impact from
prices, with a steep increase for the 0.7 quantile, while the
impact of food at-home has a statistically insignificant impact
on BMI for the highest two quantiles. These are surprising
results as we assume that food consumed at home are
supposed to be healthier than food away from home; and any
increase in the price of these food would lead consumers to
consume more food away from home, and increase the BMI.
Results from the QR and OLS are consistent.
Figure 3.Marginal impact on BMI from a one-unit change in price indices, by BMI quantile
Note: Marginal Impact is evaluate at mean price index levels; At-Home =
189.7, Away-From-Home = 195.9.
This last result implies that taxing food typically
consumed at home would decrease the BMI for quantiles 0.2 -
0.6 by an average of 0.19 for a 10% increase in the food at-
home price index at the mean price level. Alternatively, this
same tax increase is expected to correspond with an increase
in BMI of 0.10 for the highest 3 quantiles which are defined
as ‘obese’. Taxing food away from home by 10% is expected
to increase BMI by 0.40 for the median quantile while
negatively related for most other quantiles. However, these
results should be carefully interpreted. First, food at home
cannot be blindly assumed healthier than food away from
home. Many foods prepared and taken at home include
energy-dense and nutrient-poor food items such chips, sodas,
canned food, and starchy foods that provide cheap sources of
calorie intake.Therefore, taxing this type of food items would
certainly reduce the overweight and obesity prevalence.
Second, many food away from home might include
healthy food items such salads, vegetables, and nutrient-rich
food items. Any tax increase on these food items would
certainly decrease their consumption and therefore, increase
the obesity prevalence. Unfortunately, the data at hand does
not provide an appropriate tool to make policy decision in
terms of taxing unhealthy food items and subsidizing healthy
ones. Specific food intake and prices are needed in order to
draft policy that could help prevent the obesity issue.
CONCLUSION
This research uses BRFSS data to evaluate the
relationship between individual BMI levels with
demographics, economic factors, and choices. Unlike
previous studies, this study takes into account the
heterogeneity of individuals in the survey by using quantile
regression. The results show generally similar results to
earlier studies, but obese respondents often are impacted
substantially differently than other respondents with a greater
impact of some variables (e.g. exercise, income, education,
smoking) and a different relationship for other variables
altogether (e.g. gender, marital status).
These heterogeneous effects should be considered when
developing future research and policy that is designed to
reduce obesity and suggests that a targeted and tailored
approach would be most effective. For example, programs
aimed at promoting exercise would have the largest impact if
targeted toward obese and overweight populations. More
specific data is needed to evaluate and simulate the effect of
any pricing policy on obesity.
As with any study, marginal effects must be interpreted
with care as they inform regarding correlations and not causal
relationships. Thus, one limitation of this study is that results
do not necessary indicate that changes in the independent
variables of interest will lead to changes in BMI, but rather
that these variables tend to move systematically together. A
second limitation of this study is that it is based on data from
a phone survey which may contain potential biases in how
individuals report behavioral and individual characteristics.
A key issue for future research is utilizing data designed
to capture the effect of various potential policy changes upon
BMI. Available data sets, such as is available from BRFSS or
NHANES among others, provide researchers mounds of
individual information that has been used to inform policy
makers and researchers regarding important questions in the
fight against obesity. However, in order to model and draft
policy that is able to effectively target high-risk segments of
the population, research needs to be more specific in
identifying policy instruments or latent sub-groups and their
responsiveness to changes.
The analysis here strongly suggests that heterogeneity in
responses by BMI weight category should be addressed.
When informative data sources are coupled with the many
recent advances in econometrics, economists are no longer
-0,02
-0,01
0,00
0,01
0,02
0,1 0,2 0,3 0,4 0,5 0,6 0,7 0,8 0,9
Ma
rg
ina
l E
ffect
BMI Quantiles
At-Home Away-From-Home
At-Home (OLS) Away-From-Home (OLS)

Health Behav& Pub Health 2012 2(2): 35-45 E.J. Belasco et al.
45 A©ademy Journals 2012
constrained to make oversimplifying assumptions about a
population when more information can be revealed.
Endnotes 1.
In Epstein et al. (2007), mothers were randomly assigned to
price conditions in a laboratory conditions. 2.
Although BRFSS collects data from Puerto Rico, Guam,
and U.S. Virgin Islands, observations from these countries
were also not included in the final data set given that U.S.
DOL-BLS measures of food-away-from home and food-at-
home are not available for these locations. Also, individuals
who reported being pregnant were also omitted from this
sample.
REFERENCES
Anderson P, Butcher K, Levine P, 2003.Maternal Employment and Overweight Children.Journal of Health Economics22:477-504
Asfaw A, 2006. The Role of Food Price Policy in Determining the
Prevalence of Obesity: Evidence from Egypt. Review of Agricultural Economics 28: 305-312
Averett S, Stifel D, 2009. Childhood Overweight in the United States: A
Quantile Regression Approach.Economics and Human Biology 3: 45–65
Boorah V, 2005. The height-for-age of Indian children.Economics and
Human Biology 3: 45–65
Brownell K, Farley T, Willett W, Popkin B, Chaloupka F, Thompson J,
Ludwid D, 2009. The Public Health and Economic Benefits of Taxing
Sugar-Sweetened Beverages.The New England Journal of Medicine 361: 1599-1605
Cameron AC, TrivediPK, 2005.Microeconometrics: Methods and
Applications. Cambridge University Press, New York, NY, USA Cawley J, Liu F, 2007. Maternal Employment and Childhood Obesity: A
Search for Mechanisms in Time Use Data. NBER Working Paper #13600
Centers for Disease Control and Prevention, 2009.Estimated County-Level
Prevalence of DiabetesandObesity- United States, 2007.Morbidity and Mortality Weekly Report58, Issue 45
Center for the Study of Rural America, 2006. Obesity: America's Economic
Epidemic. The Main Street Economist, Issue II: 1-5 Chen C-M, Chang C-K, Yeh C-Y, 2012.A quantile regressionapproach to re-
investigate the relationship between sleep duration and body mass
index inTaiwan.International Journal of Public Health 57: 485-493 ChouS,Grossman M, Saffer H, 2004. An Economic Analysis of Adult
Obesity: Results from the Behavioral Risk Factor Surveillance System.
Journal of Health Economics 23: 565-587 Chou S, Rashad I, Grossman M, 2008. Fast-Food Restaurant Advertising on
Television and its Influence on Childhood Obesity.TheJournal of Law
and Economics 51: 599-618 Curie J, Della Vigna S, Moretti E, Pathania V, 2009. The Effect of Fast Food
Restaurants on Obesity.American Association of Wine Economics
Working Paper # 33 DuMouchel WK, Duncan GJ, 1983. Using Sample Survey Weights in
Multiple Regressions Analyses of Stratified Samples.Journal of the
American Statistical Association 78: 535-543 Davis B, Carpenter C, 2009.Proximity of Fast-Food Restaurants to Schools
andAdolescent Obesity.American Journal of Public Health 99: 505-510
Dunn R, 2010. The Effect of Fast-Food Availability on Obesity: An Analysis
by Gender, Race, and Residential Location. American Journal of
Agricultural Economics 92: 1149-1164
Epstein LH, Dearing KK, Paluch RA, Roemmich JN, Cho D, 2007. Price and
Maternal Obesity Influence Purchasing of Low- and High-Energy-
Dense Foods.The American Journal ofClinical Nutrition 86: 914-922 Goel RK, Ram R, 2004. Quantile-Regression Estimates of Cigarette Demand
Elasticities for the United States.Journal of Economics and Finance28:
413-421 He X, Hu F, 2002.Markov Chain Marginal Bootstrap.Journal of the
American Statistical Association97: 783-795 Jacobson MF, Brownell, KD, 2000.Small Taxes on Soft Drinks and Snack
Foods toPromote Health.American Journal of Public Health90:854-57
Jolliffe D, 2010.Overweight and Poor?: On the Relationship between Income and Body Mass Index. IZA Discussion Paper No. 5366
KoenkerR, Hallock F, 2001. Quantile Regression. Journal of Economic
Perspectives 15: 143-156 KuchlerF,Golan E, Variyam J, Crutchfield S, 2005. Obesity Policy and
theLaw of Unintended Consequences.Amber Waves3: 26-33
Kuchler F, Tegene A, Harris JM, 2004. Taxing Snack Foods: What to Expect for Diet and TaxRevenues.Agriculture Information Bulletin 747-08
Morland K, Roux A, Wing S, 2006. Supermarkets, Other Food Stores, and
Obesity. American Journal of Preventative Medicine30:333-339 National Center for Health Statistics, 2007.New CDC study finds no increase
in obesity among adults; but levels still high.
http://www.cdc.gov/nchs/ressroom/07newsreleases/obesity.htm.Accessed 29 May 2009
Robinson T, Borzekowski D, Matheson D, Kraemer H, 2007.Effects of Fast
Food Branding on Young Children’s Taste Preferences.Archives of Pediatric and Adolescent Medicine161: 792-797
Roux L, 2008.Cost Effectiveness of Community-Based Physical Activity
Interventions. American Journal of Preventive Medicine 35: 578-588 SchroeterC,Lusk J, 2008. Economic Factors and Body Weight.Journal of
Agricultural and Applied Economics40: 523-538
Variyam J, 2005. The Price Is Right. Amber Waves3: 20-27