Embed Size (px)
Citation preview

Research report
Health and well-being at work: a survey of employees by Viv Young and Claire Bhaumik
Department for Work and Pensions
Research Report No 751
Health and well-being at work: a survey of employees Viv Young and Claire Bhaumik
A report of research carried out by GfK NOP Social Research on behalf of the Department for Work and Pensions

© Crown copyright 2011.
You may re-use this information (not including logos) free of charge in any format or medium, under the terms of the Open Government Licence. To view this licence, visit http://www.nationalarchives.gov.uk/doc/open-government-licence/ or write to the Information Policy Team, The National Archives, Kew, London TW9 4DU, or email: [email protected].
This document/publication is also available on our website at: http://research.dwp.gov.uk/asd/asd5/rrs-index.asp
Any enquiries regarding this document/publication should be sent to us at: Department for Work and Pensions, Commercial Support and Knowledge Management Team, Upper Ground Floor, Steel City House, West Street, Sheffield S1 2GQ
First published 2011.
ISBN 978 1 84712 985 7
Views expressed in this report are not necessarily those of the Department for Work and Pensions or any other Government Department.

iiiContents
ContentsAcknowledgements ................................................................................................................................. vii
The Authors .............................................................................................................................................. viii
Summary .....................................................................................................................................................1
1 Introduction .........................................................................................................................................5
1.1 Background and survey objectives ......................................................................................5
1.1.1 HSE .............................................................................................................................5
1.1.2 HWWB..........................................................................................................................5
1.2 Overview of the survey method ...........................................................................................6
1.3 The research series .................................................................................................................9
2 Health and well-being at work ...................................................................................................... 10
2.1 Health and well-being initiatives and support ............................................................... 10
2.1.1 Takeupofhealthandwell-beinginitiativesorbenefits................................ 13
2.2 Flexible working .................................................................................................................... 15
2.3 Attendance management .................................................................................................. 16
2.3.1 Returntoworkassistance.................................................................................... 16
2.3.2 Jobadjustments..................................................................................................... 17
2.4 Stress management ........................................................................................................... 18
3 Relationships at work and work culture ...................................................................................... 20
3.1 Line managers or supervisors ............................................................................................ 20
3.2 Senior managers ................................................................................................................... 22
3.3 Relationships with staff ...................................................................................................... 24
3.4 Other colleagues .................................................................................................................. 26
3.5 Organisational culture ........................................................................................................ 27
4 Key employee findings .................................................................................................................... 30
4.1 Sickness absence .................................................................................................................. 30
4.2 Presentee-ism ....................................................................................................................... 32
4.3 Well-being .............................................................................................................................. 33
4.4 Engagement .......................................................................................................................... 33

iv Contents
4.5 Retention ............................................................................................................................... 35
5 Other aspects of working life ........................................................................................................ 36
5.1 Pay ........................................................................................................................................... 36
5.1.1 ‘IampaidfairlyfortheworkthatIdo’............................................................. 36
5.1.2 ‘IamsatisfiedwiththepayandbenefitsIreceiveinthisjob’..................... 36
5.2 Sick pay .................................................................................................................................. 37
5.3 Concerns about job security ............................................................................................... 40
5.4 Retirement plans .................................................................................................................. 40
5.5 Self-reported rating for health ........................................................................................... 41
5.6 Health symptoms, their causes and impacts on work ................................................. 41
5.7 Stress outside of work ......................................................................................................... 43
6 Conclusions ........................................................................................................................................ 45
6.1 Health and well-being initiatives and support ............................................................... 45
6.2 Flexible working .................................................................................................................... 45
6.3 Stress management ............................................................................................................ 46
6.4 Attendance management .................................................................................................. 46
6.5 Sickness absence ................................................................................................................. 46
6.6 Next steps .............................................................................................................................. 46
Appendix A Other questions relating to health .............................................................................. 48
Appendix B Further details on method ............................................................................................ 53
Appendix C Sample profile .................................................................................................................. 62
Appendix D Index calculation ............................................................................................................ 65
Appendix E Approach to multivariate analysis ............................................................................. 67
Appendix F Advance letter, contact sheet and survey questionnaire ...................................... 74
List of tables
Table 1.1 Sample profile: selected characteristics .......................................................................8
Table 2.1 Provision of health and well-being initiatives or benefits ...................................... 12
Table 2.2 Average number of health and well-being initiatives provided ........................... 13
Table 2.3 Provision and take up of health and well-being initiatives or benefits ............... 14

v
Table 2.4 Summary of characteristics of respondents with higher/lower likelihood of working for an organisation that offers flexible working options ........................ 16
Table 2.5 Measures used to help employees with five or more days of continuous absence back to work .................................................................................................... 17
Table 3.1 Levels of agreement and disagreement with statements about line manager/supervisor ....................................................................................................... 21
Table 3.2 Levels of agreement and disagreement with statements about line manager/supervisor ....................................................................................................... 23
Table 3.3 Levels of agreement and disagreement with statements about relationships with staff .......................................................................................................................... 25
Table 3.4 Levels of agreement and disagreement with statements about others in organisation ................................................................................................................. 26
Table 3.5 Levels of agreement and disagreement with statements about the employing organisation ................................................................................................ 28
Table 3.6 Levels of agreement and disagreement with the statement ‘There are few opportunities for me to learn and grow in this organisation’ ................ 29
Table 3.7 Levels of agreement and disagreement with the statement ‘This organisation fails to reward extra effort made by staff’ ........................................ 29
Table 4.1 Summary findings relating to incidence of any sickness absence and mean number of days’ absence .............................................................................................. 31
Table 4.2 Profile of employees in large public sector and large private sector organisations by gender and age ............................................................................... 32
Table 4.3 Levels of agreement and disagreement with statements about engagement .................................................................................................................... 34
Table 5.1 Sick pay in first seven days of absence, by establishment size, organisation type and hours worked ................................................................................................. 38
Table 5.2 Sick pay in first seven days of absence, by industry sector ................................... 39
Table 5.3 Intended age for retirement by gender ..................................................................... 40
Table 5.4 Health symptoms experienced ................................................................................... 41
Table 5.5 Health symptoms and their relationship to work .................................................... 43
Table A.1 Summary of scores for BMI .......................................................................................... 48
Table A.2 Summary of scores for body mass index, Health Survey for England, 2008 ..... 49
Table B.1 Quality of Working Life (agreement) statements .................................................... 55
Table B.2 Screening response rate ................................................................................................ 58
Table B.3 Main interview response rate ....................................................................................... 58
Table C.1 Sample profile: organisational characteristics ......................................................... 62
Table C.2 Sample profile: personal demographics .................................................................... 63
Contents

vi
List of figures
Figure 2.1 Provision of health and well-being initiatives or benefits (% of respondents citing each) ....................................................................................................................... 11
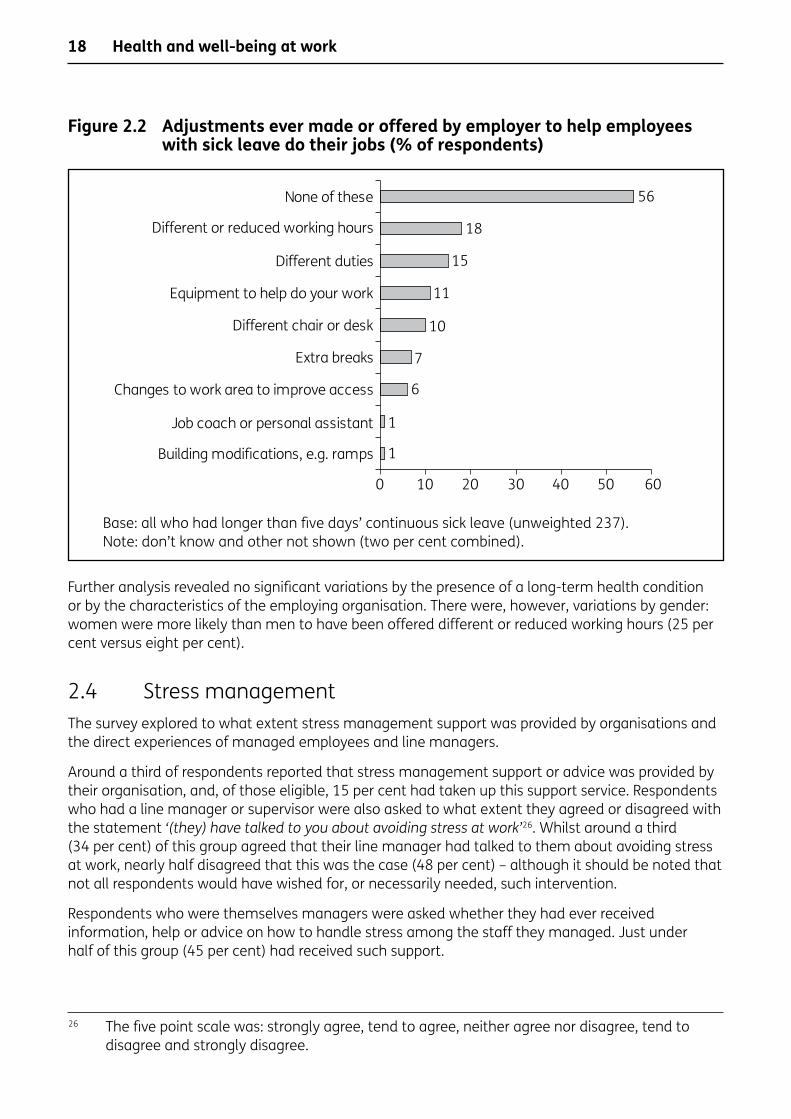
Figure 2.2 Adjustments ever made or offered by employer to help employees with sick leave do their jobs (% respondents) ................................................................... 18
Figure 3.1 Level of agreement (%) with statements about senior managers, by size of organisation ................................................................................................................ 24
Figure 5.1 Sick pay in first seven days of absence ...................................................................... 37
Figure A.1 Frequency of employee physical activity (%) ........................................................... 50
Figure A.2 Smoking prevalence by annual income (%, after Tax and NI) .............................. 51
Figure E.1 Dummy example of a CHAID tree output displaying multiple ‘splits’ ................. 70
Figure E.2 Summary of factors associated with the ‘optimum’ employee experience ..... 72
Contents
vii
AcknowledgementsThis research was commissioned by the Health and Safety Executive (HSE) and the cross-government Health, Work and Well-being Strategy Unit, which comprises representatives from the Department for Work and Pensions, the Department for Health, HSE, the Scottish Government and the Welsh Assembly.
We would like to thank Isobel Swarc at the Department for Work and Pensions and David Riley and Alison Higgins at HSE for their advice and guidance throughout this project.
We extend our special thanks to all the employees who gave their time to take part in this project.
Acknowledgements
viii
The AuthorsViv Young is a Research Director at GfK NOP Social Research, with 15 years’ experience of working with public sector clients. Viv specialises in research with businesses, particularly in the areas of well-being and learning and skills.
Claire Bhaumik is a Research Manager at GfK NOP Social Research. Claire has over six years’ experience, working with a wide range of public sector organisations, including research amongst employees and employers about the employee experience of health and well-being at work.
The Authors
1
SummaryBackground and survey objectivesThe Health and Well-being Employee Survey was jointly funded by the Health and Safety Executive (HSE) and the Cross-Government Health, Work and Well-being Strategy Unit (HWWB). The HWWB is sponsored by five government partners: the Department for Work and Pensions (DWP), the Department of Health (DH), HSE, the Scottish Government and the Welsh Government. This report focuses specifically on HWWB’s objectives for the research.
In March 2008, Dame Carol Black’s review of the health of Britain’s working age population was published1. This review recognised the beneficial impact that work can have on an individual’s state of health and that work is generally good for both physical and mental health. The response to Dame Carol Black’s review2 was published in November 2008 and identified seven key indicators to develop baselines for and measure progress against. The second of the indicators was ‘improving the promotion of health and well-being at work’, which has several sub-indicators:
• Health and well-being initiatives and support.
• Flexible working policies.
• Stress management standards.
• Attendance management (in terms of helping employees back to work or making adjustments to jobs to keep them in work).
• Employee engagement.
The survey meets HWWB’s objectives for the research, by:
• Developing the evidence base around work and health and workplace health initiatives from the employee perspective.
• Providing baseline data so that progress on health and well-being at work can be measured and monitored over time.
Research methodThe survey used a random probability sample design. Interviews averaging 35 minutes in length were administered in employees’ homes by GfK NOP’s field force between October and December 2009. In total 2,019 interviews were achieved with paid employees, working in all sectors of the economy.
The survey data are representative of paid employees in GB aged 16+, meaning that we can draw conclusions from the data about the population of employees in Great Britain3.
1 http://www.dwp.gov.uk/docs/hwwb-working-for-a-healthier-tomorrow.pdf2 http://www.dwp.gov.uk/docs/hwwb-improving-health-and-work-changing-lives.pdf3 The findings discussed in the report are based on significance testing at a 95 per cent
confidence interval.
Summary

2
Setting the sceneTo set the findings in context, this section summarises some key information about the survey respondents.
General health and well-beingNinety per cent of respondents said their general health was either very good or fairly good, younger respondents were more likely than older respondents to describe their health in this way (see Section 5.5).
Thirty per cent of respondents said their life outside work was not at all stressful, whilst just over four in ten (44 per cent) described it as mildly stressful (see Section 5.7).
Respondents’ overall well-being was assessed using the Warwick-Edinburgh Mental Well-being Scale (WEMWBS)4. Across the sample, the average well-being score was 26 out of 35 (see Section 4.2). Broadly speaking, as many people sat above the average score as sat below it, so there was not a situation in which a few people had exceptionally high or low well-being scores.
Pay and future plansRespondents held positive views about pay and benefits; 59 per cent agreed that they were satisfied with the pay and benefits they received in their job, and those in the top income brackets tended towards higher levels of agreement. Public sector respondents and those working in medium or large establishments tended to be most satisfied with their pay and benefits (see Section 5.1).
Retention was assessed in terms of whether or not employees had thought about leaving their employer in the past year: 40 per cent of respondents had thought of doing so (see Section 4.5).
Thirteen per cent of respondents thought that losing their current job in the next 12 months was very or fairly likely; those working in Manufacturing/Utilities and Transport/Communications were among those most likely to feel this was the case (see Section 5.3).
Most people intended to retire from paid work between the ages of 60 and 65 (see Section 5.4).
Sickness and sick pay5
Forty-four per cent of respondents said that they had gone to work in the past 12 months when, in their opinion, they should have taken sick leave, which could be considered evidence of ‘presentee-ism’. On average, respondents had gone to work on two days in the past 12 months when, in their opinion, they were really too sick to do so (see Section 4.2).
Forty-eight per cent of respondents had taken some sick leave in the last 12 months; the average number of days’ sick leave was 4.9 days (see Section 4.1).
For 65 per cent of all respondents, sick pay was paid at their normal rate of pay during their first seven days of absence, but ten per cent did not know their organisation’s policy on sick pay (see Section 5.2).
4 WEMWBS measures subjective well-being and psychological functioning, see http://wrap.warwick.ac.uk/543/1/WRAP_Stewart_Brown_Warwick_Edinburgh.pdf
5 Figures for sickness absence and ‘presentee-ism’ are based on respondents who worked for their organisation for one year or more unless otherwise stated.
Summary
3
Health and well-being at work
Health and well-being initiativesFrom a list of twenty support measures incorporating the whole spectrum of initiatives designed to promote worker safety, healthy lifestyles and well-being6, those most commonly cited as being provided by organisations in the last 12 months were more than 20 days’ holiday (excluding bank holidays) and an employer pension scheme, cited by 84 per cent and 70 per cent of respondents respectively (see Section 2.1).
Considering only those respondents who were eligible to take up an initiative or benefit, those most commonly used in the last 12 months were7: subsidised canteens or restaurants, healthy food choices in vending machines/canteens and employer pension schemes (Section 2.1.2). It is important to remember that not all initiatives and benefits would have been applicable or useful to all employees (e.g. programmes to help people give up smoking, weight management programmes, etc), and, correspondingly, these had lower take up levels.
Flexible working optionsFifty-seven per cent of respondents said their organisation offered at least one flexible working practice8, and this was more likely to be the case for respondents working in very large, public sector organisations (see Section 2.2).
Attendance managementAttendance management was examined in terms of assisting people back to work after illness or injury, or making adjustments to jobs to help people stay in work. Among respondents who reported more than five days’ continuous sickness absence, around half (48 per cent) had received assistance to return to work, and the most commonly identified measures were reduced working hours or days (20 per cent), access to occupational health measures (19 per cent) and reduced workloads (19 per cent) (see Section 2.3.1).
Respondents who had experienced more than five days’ continuous sick leave were asked whether their organisation had ever made, or offered to make, any adjustments to their job at any point, not just on their return from sick leave. Forty-four per cent of respondents in this group had received or been offered adjustments to their job, and the most common measures were different or reduced working hours (18 per cent) and different duties at work (15 per cent) (see Section 2.3.2).
Stress management Thirty-two per cent of respondents said that stress management support or advice was provided to employees and/or managers within their organisation. In terms of direct experience, around a third of respondents with a line manager or supervisor (34 per cent) agreed that this person had talked to them about avoiding stress at work, and just under half of line managers themselves (45 per cent) reported that they had received information, help or advice on managing stress among their employees.
6 For a full list of the initiatives and support measures see Section 2.1.7 Respondents who mentioned that their organisation offered ‘more than 20 days’ holiday,
excluding bank holidays’ were not then asked questions about levels of take up.8 For more information about the index please see: http://www.civilservice.gov.uk/about/
improving/engagement/index.aspx. The statements are detailed in Section 4.4.
Summary

4
Employee engagementAt least fifty-nine per cent of respondents strongly agreed or tended to agree with the five statements making up the employee engagement question battery9. Agreement was highest, at 69 per cent, for the statement: My organisation inspires me to do the best in my job. Responses to the five statements were summed and an average score calculated for the whole sample; when scaled up, the overall level of employee engagement was 67 out of 100.
Relationships at work and work cultureMost respondents were positive about their relationships with colleagues, with some of the most positive views related to the help and support received from other colleagues in their organisation. High levels of positive feeling were recorded for relationships with line managers (70 per cent or more returned positive ratings on all but one measure10). There was, however, some criticism of senior managers, particularly in terms of delivering on promises (47 per cent said they failed to do so; see Section 3.2).
In terms of organisational culture, respondents were most negative about statements relating to how employees were rewarded and developed, with 39 per cent saying that their organisation failed to reward extra effort made by staff (see Section 3.5).
ConclusionsThis survey has provided baseline evidence of activity, across organisations of all sizes and in all sectors, for the indicator ‘Improving the promotion of health and well-being at work’ and several of its sub-indicators. There are some clear patterns in the data that show that provision is more prevalent in large organisations, especially those in the public sector and those with trade union presence.
As well as providing data to support the government’s commitment to monitoring employee health and well-being at work, the survey has provided evidence that may be of interest to policy makers responsible for the promotion of good work and employee engagement, as illustrated by the recommendations of the Marmot Review11 and Macleod Review12 respectively.
9 For more information about the index please see: http://www.civilservice.gov.uk/about/improving/engagement/index.aspx. The statements are detailed in Section 4.4.
10 On the negatively phrased statement ‘your line manager expects you to work too hard’, 55 per cent disagreed that this was the case.
11 http://www.marmotreview.org/AssetLibrary/pdfs/Reports/FairSocietyHealthyLives.pdf12 http://www.bis.gov.uk/files/file52215.pdf
Summary
5
1 Introduction1.1 Background and survey objectivesThe Health and Well-being Survey of Employees was jointly funded by the Health and Safety Executive (HSE) and the Cross-Government Health, Work and Well-being Strategy Unit (HWWB). HWWB is sponsored by five government partners: the Department for Work and Pensions (DWP), the Department of Health, HSE, the Scottish Government and the Welsh Government. The development of the survey was initiated by HSE with HWWB’s involvement commencing at the questionnaire design phase.
As funders of the survey, the objectives of HSE and HWWB were complementary but each had a slightly different perspective. Whilst this report focuses solely on the findings that relate to HWWB’s objectives, the following sections summarise the context in which the survey was commissioned from the perspective of each respective body.
1.1.1 HSEThe role of HSE is to ensure that risks to people’s health and safety from work activities are properly controlled. However, in an increasingly service-focused business landscape, HSE recognised that safeguarding and promoting the health and safety of employees required the examination of ‘softer’ aspects of the workplace experience. In 2008, GfK NOP was commissioned to develop a ‘quality of working life’ survey of employees to explore the relationships between a wide range of aspects of working life, objective measures of employee support (e.g. working practices) and other areas of interest including the incidence of sickness absence, employee retention, employee engagement, presentee-ism13 and the mental and physical health of employees.
In summary, HSE’s specific objectives for the survey were to:
• measure objective factors about employees’ working lives, e.g. whether they were offered flexible working, other benefits, etc;
• measure subjective factors, e.g. attitudes towards working with line managers and colleagues, views on the culture of the employing organisation;
• explore the links between the objective and subjective measures and specific items of interest, such as mental and physical health, the incidence of sickness absence, presentee-ism, employee engagement and retention.
1.1.2 HWWBIn March 2008, Dame Carol Black’s review of the health of Britain’s working age population was published14. The review recognised the beneficial impact that work can have on an individual’s health and that work is generally good for both physical and mental health. It also identified the importance of healthy workplaces designed to protect and promote good health, and the central role that such workplaces play in preventing illness arising in the first place.
13 The definition of presentee-ism used in this report is when someone who is ill goes to work when, in their opinion, they should have taken sickness absence.
14 http://www.dwp.gov.uk/docs/hwwb-working-for-a-healthier-tomorrow.pdf. Op cit
Introduction

6
The response to Dame Carol Black’s review15 was published in November 2008 and identified seven key indicators to develop baselines for and measure progress against. The second of the indicators was ‘improving the promotion of better health and well-being at work’, which has several sub-indicators:
• Health and well-being initiatives and support.
• Flexible working policies.
• Stress management.
• Attendance management programmes.
• Employee engagement.
• Satisfaction with work16.
This survey develops the evidence base and explores the links between health and work, as well as providing baseline data so that progress on health and well-being at work can be measured and monitored over time.
1.2 Overview of the survey methodThe survey used a clustered, two-stage probability sample design, with Lower Super Output Areas as the primary sampling unit. Sampled addresses were screened for eligibility, and where there was more than one adult eligible for interview, one person was selected at random from each screened household. The eligibility criteria were:
• Aged 16+ but no upper age limit.
• In paid employment for seven or more hours across a week.
• Employed rather than self-employed17.
• Working for an organisation where two or more people were in employment.
• Employed by an organisation rather than directly by a private household.
• Had been in work during the preceding month.
Interviewing took place in people’s homes and was undertaken by GfK NOP’s field force between October and December 2009. It is worth mentioning that the survey followed a period of economic recession, which saw a large number of private sector redundancies, but it preceded announcements of funding cuts within the public sector. All of the fieldworkers working on the study
15 http://www.dwp.gov.uk/docs/hwwb-improving-health-and-work-changing-lives.pdf. Op cit16 In terms of a satisfaction with work measure, the Employee Survey did not include a single
job satisfaction metric, but there is an intention to review the attitude statements relating to different aspects of work to assess whether a measure for satisfaction may be constructed; this will be informed by the latest literature relating to job satisfaction.
17 Self-employed was defined as where the individual was responsible for tax and National Insurance contributions.
Introduction

7
were fully trained and Interviewer Quality Control Scheme (IQCS)18 qualified and all attended a formal briefing given in person by members of the GfK NOP executive team.
The final questionnaire averaged 35 minutes in length and comprised five sections as follows:
1 Organisation and job characteristics. Information about the nature of the respondent’s (main) job, hours worked and details on their employing organisation (e.g. Standard Industrial Classification (SIC)19, size, multiple sites, managerial structure, etc).
2 Attitude statements. Fifty-seven attitude statements (with a five point agreement scale) divided into nine subsections: the work itself, the workplace, work/life balance, organisational culture/ values, relationships with line manager, relationships with senior managers, peer relationships, relationships with those managed and external relationships.
3 Key employee measures. A variety of employee measures were explored including retention, sickness absence, presentee-ism and engagement as well as mental well-being (using the Warwick-Edinburgh Mental Well-being Scale20), a self reported measure of health, health symptoms and health behaviour measures. Answers to more sensitive questions (such as height, weight, alcohol consumption and the well-being attitude statements) were collected using a self-completion module, whereby the interviewer ‘taught’ the respondent to use the laptop to enter their answers and then left him/her to complete the section in their own time21.
4 Objective measures of support, covering: pay and benefits and the provision and take up of benefits or initiatives with a possible connection to well-being (for example, flexible working, employee assistance programmes, canteen facilities, fitness programmes).
5 Personal demographics, e.g. age, gender, ethnic background, income level and caring responsibilities.
The final survey questionnaire is included in the appendices.
In total 2,019 interviews were achieved with paid employees. The survey data were weighted to correct for probability of selection (in some households more than one adult would have been eligible for interview), and secondly, to ensure the data were representative of paid employees in GB aged 16+. For the latter, the data were profiled against filtered information from the latest Labour Force Survey22 and weighted to ensure that they were representative by gender, age, hours worked, industry sector and region. Further details about the data collection and preparation methods and the final profile of the sample are provided in the appendices to this report.
18 IQCS is an independent organisation, working with providers and buyers of social and market research fieldwork to develop and maintain high standards of data collection in the social and market research Industry. Clients can be reassured that member companies’ processes facilitate the collection of high quality robust data.
19 The United Kingdom SIC of Economic Activities is used to classify business establishments and other standard units by the type of economic activity in which they are engaged.
20 http://wrap.warwick.ac.uk/543/1/WRAP_Stewart_Brown_Warwick_Edinburgh.pdf21 Data collected on height, weight, alcohol consumption, diet, smoking and exercise have not
been used in this report but will form part of HSE’s analysis of the data.22 Labour Force Survey, see http://www.ons.gov.uk/about-statistics/user-guidance/lm-guide/
sources/household/lfs/about/index.html
Introduction
8
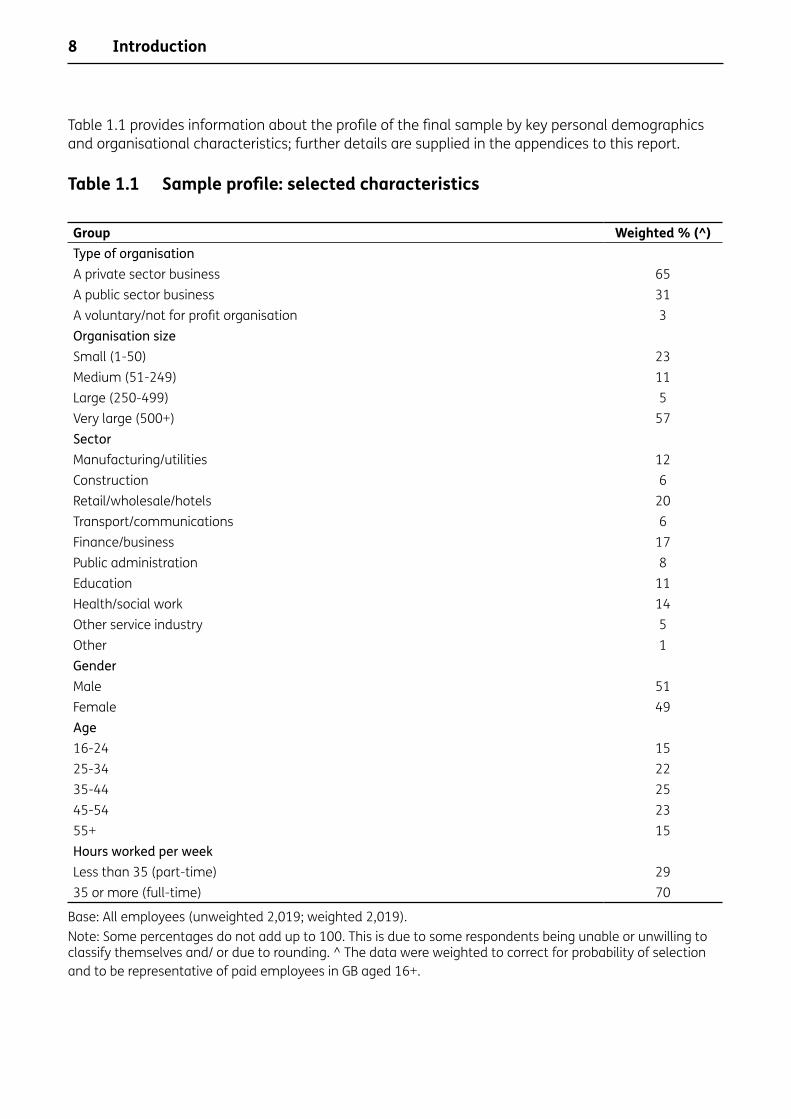
Table 1.1 provides information about the profile of the final sample by key personal demographics and organisational characteristics; further details are supplied in the appendices to this report.
Table 1.1 Sample profile: selected characteristics
Group Weighted % (^)Type of organisation A private sector business 65A public sector business 31A voluntary/not for profit organisation 3Organisation sizeSmall (1-50) 23Medium (51-249) 11Large (250-499) 5Very large (500+) 57SectorManufacturing/utilities 12Construction 6Retail/wholesale/hotels 20Transport/communications 6Finance/business 17Public administration 8Education 11Health/social work 14Other service industry 5Other 1GenderMale 51Female 49Age16-24 1525-34 2235-44 2545-54 2355+ 15Hours worked per weekLess than 35 (part-time) 2935 or more (full-time) 70
Base: All employees (unweighted 2,019; weighted 2,019).Note: Some percentages do not add up to 100. This is due to some respondents being unable or unwilling to classify themselves and/ or due to rounding. ^ The data were weighted to correct for probability of selection and to be representative of paid employees in GB aged 16+.
Introduction

9
1.3 The research series The Employee Survey forms part of a wider programme of research encompassing:
• an HWWB-sponsored survey of employers;
• and an HSE-sponsored survey of line managers; the findings from that study will be examined alongside further analysis of the Employee Survey data.
This report is the first output from the Employee Survey and focuses solely on the HWWB’s objectives for the research, presenting baseline findings for the key sub-indicators already detailed.
The remainder of this report is divided into five chapters. The next chapter provides a discussion of the evidence relating to health and well-being at work. Chapter 4 covers findings concerning relationships at work and the culture of the workplace. Key employee findings are examined in Chapter 5, namely well-being, engagement, sickness absence and retention. Chapter 6 covers other aspects of working life of interest to HWWB. The final chapter provides concluding thoughts about the findings and next steps.
Unless otherwise stated, the report focuses only on findings that were found to be statistically significant (based on a confidence interval of 95 per cent) after the effects of weighting and data clustering had been taken into account.
Introduction
10
2 Health and well-being at workSummary This chapter looks at health and well-being at work and covers health and well-being initiatives/support, flexible working, stress management and attendance management.
Some of the key findings are:
• The most commonly cited health and well-being initiatives were more than 20 days’ holiday (excluding bank holidays) and an employer pension scheme. Access to counselling/an employee assistance programme was provided for 40 per cent of respondents and access to occupational health services to 38 per cent of respondents.
• Fifty-seven per cent of respondents said their organisation made use of flexible working practices, such as flexi-time, working from home, job sharing, working condensed hours or changing working patterns. Respondents working for very large public sector organisations were more likely to say that such practices were used in their organisation.
• Among respondents who had had five or more days of continuous absence in the previous 12 months, 48 per cent had received some type of assistance to help them back to work. The most common types were reduced working hours or days, access to occupational health services and reduced workloads. Such measures were more likely to be cited by public sector workers.
• Thirty two per cent of respondents said that stress management support or advice was provided to employees and managers in their organisation, and 34 per cent of those with a line manager/supervisor reported that this person had talked to them about avoiding stress at work.
• Among line managers, 45 per cent had received information, help or advice about managing stress among their employees, and this was more prevalent among those working in the public sector and in large organisations.
2.1 Health and well-being initiatives and supportThis section assesses to what extent employees reported the presence of initiatives used to promote or encourage healthy lifestyles and improved well-being in their organisation, as well as looking at levels of take up.
A list of 20 initiatives and support measures were explored, which incorporated a wide spectrum of initiatives designed to promote worker safety, healthy lifestyles and well-being. The initiatives fell into four broad categories:
• ‘Traditional’ benefits: e.g., more than 20 days’ holiday excluding bank holidays, company pension, private medical insurance, subsidised canteen or restaurant.
• Traditional health and safety initiatives: e.g., work area assessments and adjustments, training in injury prevention.
• Dedicated employee support services: e.g. a well-being intranet site, occupational health services, access to counselling and other employee assistance programmes, stress management support and advice, health screening and health checks.
• Proactive lifestyle initiatives: e.g. healthy food choices in vending machines, fitness classes, loans for bicycle purchase, schemes to help people undertake voluntary work in work time.
Health and well-being at work

11
Respondents were asked to identify which of the initiatives their organisation had provided in the last 12 months, regardless of whether the initiatives were provided to all staff or just some, or whether the respondent had used them or not. Figure 2.1 shows the initiatives and benefits in descending order of provision.
Figure 2.1 Provision of health and well-being initiatives or benefits (% of respondents citing each)
The main areas of provision were so called ‘traditional’ benefits; 84 per cent of respondents cited more than 20 days of holiday excluding bank holidays being provided by their employer, and 70 per cent mentioned an employer pension scheme. Traditional health and safety initiatives were also commonly provided: around half of employees mentioned training in injury prevention (51 per cent) and work area assessments and adjustments (48 per cent).
Dedicated employee support service benefits were cited by smaller proportions of employees: 40 per cent mentioned access to counselling or other employee assistance programmes and 38 per cent cited occupational health services. Health screening and health checks, however, were mentioned by just under a quarter of respondents (24 per cent).
Initiatives that related to employees’ lifestyles were mentioned by less than a quarter of respondents: 23 per cent mentioned a free or subsidised gym membership and 22 per cent mentioned a loan or discount towards a bicycle purchase. It should be noted, however, that whilst these were relatively low proportions, they represented many tens of thousands of employees in Great Britain.
Health and well-being at work
Weight loss/management advice or programmesFitness classes at work
Dedicated health and wellbeing intranet siteSchemes to undertake voluntary work in work time
Measures to encourage running, cycling, walking etcFree health advice/events about healthy lifestyles
Programmes, advice or support to help give up smokingLoan towards or discounts on bicycle purchases
Free or subsided gym membershipPrivate medical insurance
Healthy food choices in vending machines/staff canteenHealth screening or health checks
Stress management support or adviceSubsidised canteen or restaurant
Access to occupational health servicesCounselling/other employee assistance programme
Work area assessment and adjustments Training in injury prevention
Pension schemeMore than 20 days of holiday excluding bank holidays
99
1314
1820212223232424
3233
3840
4851
7084
0 10 20 30 40 50 60 70 80 90
Base: all respondents (unweighted base: 2,019).

12
An important finding (and one that is repeated throughout the survey data) is that the size of the organisation the respondent worked for had an impact on the results: those working for medium and large organisations were more likely to mention almost all benefits and initiatives compared with those working in small organisations (see Table 2.1). Many benefits and initiatives were more likely to be provided to public sector workers than to those working in the private sector (the exceptions were private medical insurance, subsidised canteen/restaurant, schemes to undertake voluntary work and weight loss advice/programmes). It is worth pointing out, however, that these characteristics are linked: public sector workers were more likely than private sector workers to work in organisations with 250+ employees.
Table 2.1 Provision of health and well-being initiatives or benefits
Organisation sizeOrganisation
type
Total %
Small (1-50)
%
Medium (51-249)
%
Large (250-499)
%
Very large (500+)
%Private
%Public
%More than 20 days’ holiday excluding bank holidays
84 69 85 86 91 79 94
Pension scheme 70 35 66 72 87 58 95Training in injury prevention 51 32 43 49 61 48 56Work area assessments and adjustments
48 26 39 51 59 42 59
Counselling/other employee assistance programme
40 11 26 38 55 28 62
Access to occupational health services 38 10 27 36 52 26 63Subsidised canteen or restaurant 33 15 23 28 44 33 34Stress management support or advice 32 11 17 26 45 23 49Healthy food choices 29 12 27 22 38 25 38Health screening or health checks 24 5 11 33 34 21 30Free or subsidised gym membership 23 6 17 23 33 19 33Private medical insurance 23 11 25 31 28 30 10Loan or discounts on bicycle purchases 22 6 15 21 30 16 32Programmes, advice or support to help give up smoking
21 6 14 15 29 15 33
Free health advice/events about healthy lifestyles
20 5 9 19 28 15 29
Measures to encourage running, cycling, walking, etc
18 4 14 13 26 13 29
Schemes to undertake voluntary work in work time
14 4 8 11 19 13 14
Health and wellbeing intranet site 13 2 4 8 21 10 20Weight loss/management advice or programmes
9 3 5 6 14 8 12
Fitness classes at work 9 3 4 8 12 6 14
Unweightedbase 2,019 474 225 107 1,131 1,274 661
Base: All.
Health and well-being at work
13
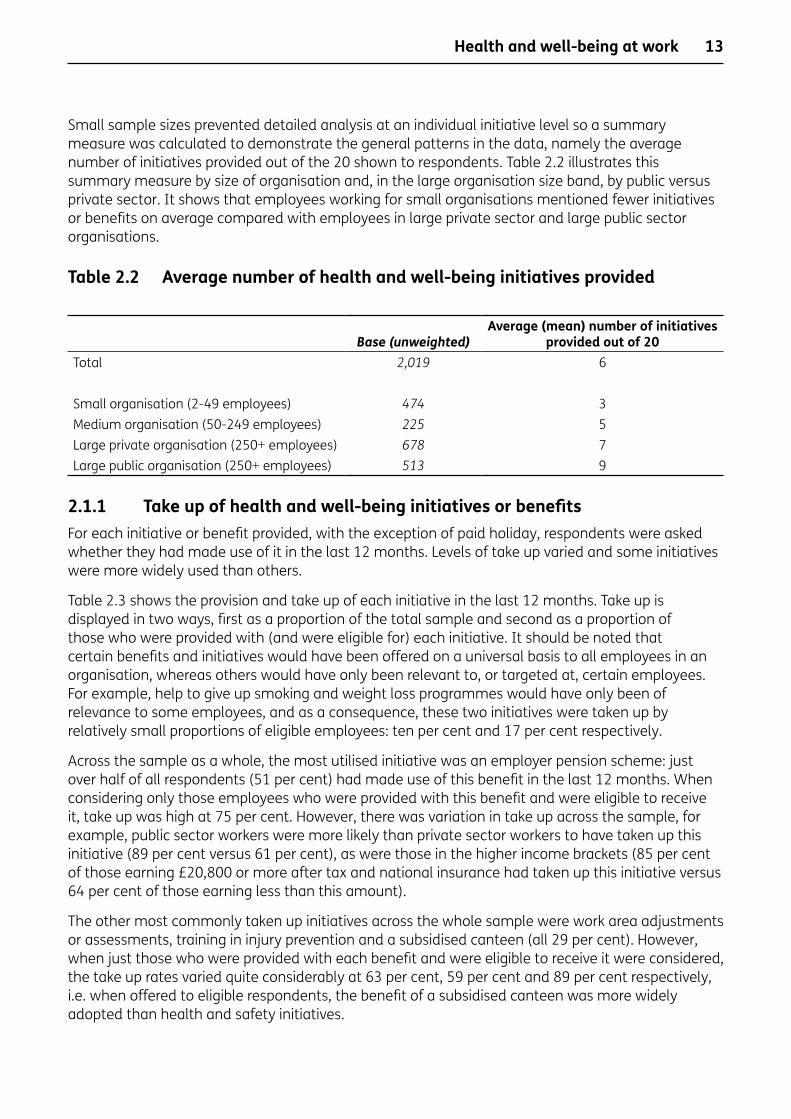
Small sample sizes prevented detailed analysis at an individual initiative level so a summary measure was calculated to demonstrate the general patterns in the data, namely the average number of initiatives provided out of the 20 shown to respondents. Table 2.2 illustrates this summary measure by size of organisation and, in the large organisation size band, by public versus private sector. It shows that employees working for small organisations mentioned fewer initiatives or benefits on average compared with employees in large private sector and large public sector organisations.
Table 2.2 Average number of health and well-being initiatives provided
Base (unweighted)Average (mean) number of initiatives
provided out of 20 Total 2,019 6
Small organisation (2-49 employees) 474 3Medium organisation (50-249 employees) 225 5Large private organisation (250+ employees) 678 7Large public organisation (250+ employees) 513 9
2.1.1 Take up of health and well-being initiatives or benefitsFor each initiative or benefit provided, with the exception of paid holiday, respondents were asked whether they had made use of it in the last 12 months. Levels of take up varied and some initiatives were more widely used than others.
Table 2.3 shows the provision and take up of each initiative in the last 12 months. Take up is displayed in two ways, first as a proportion of the total sample and second as a proportion of those who were provided with (and were eligible for) each initiative. It should be noted that certain benefits and initiatives would have been offered on a universal basis to all employees in an organisation, whereas others would have only been relevant to, or targeted at, certain employees. For example, help to give up smoking and weight loss programmes would have only been of relevance to some employees, and as a consequence, these two initiatives were taken up by relatively small proportions of eligible employees: ten per cent and 17 per cent respectively.
Across the sample as a whole, the most utilised initiative was an employer pension scheme: just over half of all respondents (51 per cent) had made use of this benefit in the last 12 months. When considering only those employees who were provided with this benefit and were eligible to receive it, take up was high at 75 per cent. However, there was variation in take up across the sample, for example, public sector workers were more likely than private sector workers to have taken up this initiative (89 per cent versus 61 per cent), as were those in the higher income brackets (85 per cent of those earning £20,800 or more after tax and national insurance had taken up this initiative versus 64 per cent of those earning less than this amount).
The other most commonly taken up initiatives across the whole sample were work area adjustments or assessments, training in injury prevention and a subsidised canteen (all 29 per cent). However, when just those who were provided with each benefit and were eligible to receive it were considered, the take up rates varied quite considerably at 63 per cent, 59 per cent and 89 per cent respectively, i.e. when offered to eligible respondents, the benefit of a subsidised canteen was more widely adopted than health and safety initiatives.
Health and well-being at work

14
Whilst only 29 per cent of employees reported healthy food choices being made available in vending machines or the staff canteen by their organisation, three-quarters of eligible employees (75 per cent) took advantage of this initiative. In the case of private medical insurance, across the whole sample take up was relatively low at 12 per cent. However, among those who were provided with the benefit and were eligible for it, take up stood at 58 per cent (i.e. on a par with other, more widely available benefits).
Table 2.3 Provision and take up of health and well-being initiatives or benefits
Organisation provides Take up in the last 12 months
All respondents (unweighted 2,019)
%
All respondents (unweighted 2,019)
%
All provided with and eligible for the
initiative (base varies) %
Subsidised canteen or restaurant 33 29 89Healthy food choices available in vending machines or staff canteen
29 22 75
Employer pension scheme 70 51 75Work area assessment and adjustments
48 29 63
Training in injury prevention 51 29 59Private medical insurance 23 12 58Health screening or health checks 24 10 44Dedicated health and well-being intranet site
13 5 41
Measures to encourage activities such as running, cycling and walking
18 7 36
Free health advice or events to raise awareness about healthy lifestyles
20 7 35
Free or subsided gym membership 23 7 32Fitness classes at work 9 2 27Access to occupational health services
38 10 26
Schemes to help employees undertake voluntary work in work time
14 3 21
Weight loss or weight management advice or programmes
9 2 17
Stress management support or advice
32 5 15
Loan towards or discounts on bicycle purchases
22 3 12
Programmes, advice or support to help people give up smoking
21 2 10
Access to counselling or other employee assistance programme
40 3 8
Base: All.Note: Take up is shown in two ways, first as a proportion of the total sample, and second as a proportion of those who were provided with and were eligible for the initiative or service.
Health and well-being at work
15
2.2 Flexible workingFlexible working is generally upheld as a positive working practice as it allows people with family or other caring commitments to fit work around other responsibilities, whilst for those without specific caring commitments, such working arrangements may be adopted as a lifestyle choice.
The survey explored how many employees worked for organisations that offered flexible working practices, where flexible working was taken to cover a range of practices including flexi-time, working from home, job sharing and the ability to change hours, work condensed hours or change working patterns23.
Almost six in ten respondents (57 per cent) said their organisation offered flexible working24, and Table 2.4 summarises the types of respondents more or less likely to report flexible working options being provided by their employing organisation.
Respondents working for public sector, very large organisations (with 500+ employees) and organisations in which there was trade union presence were among those most likely to report the presence of flexible working options. As already mentioned, there is some linkage between these factors: public sector organisations tend to be larger and to be characterised by a trade union presence.
Perhaps reflecting the nature of their work, respondents working as skilled tradesmen, process, plant, machine operatives and those in elementary occupations were less likely than respondents working in managerial, associate professional and administrative roles to be working for organisations that offered flexible working.
In terms of income, those earning £20,800 per annum or more (after tax and national insurance) were more likely than lower paid respondents to report that their organisation offered flexible working practices. Finally, respondents who reported flexible working options in their organisations often held more positive views about various aspects of their working life.
23 Flexibility was also examined in terms of the practices used by employers to help people back to work after illness and to facilitate their ability to do their job on a day to day basis (see Section 3.3).
24 It is not possible to put this figure in context with other findings from either the Labour Force Survey or Workplace Employment Relations Survey (WERS); both surveys measure employees’ actual (or potential) use of an array of flexible working options, rather than an organisation’s provision of flexible working practices per se.
Health and well-being at work

16
Table 2.4 Summary of characteristics of respondents with higher/lower likelihood of working for an organisation that offers flexible working options
Flexible working options offered by employing organisation Analysis variable More likely Less likelyType of organisation Public (63 per cent) Private (53 per cent)Trade union presence Yes (62 per cent) No (51 per cent)Organisation size Very large (500+ employees) (64 per
cent)Organisations with <500 employees (50 per cent or less)
Income (after tax and National Insurance)
>= £20,800 (65 per cent) < £20,800 (53 per cent)
Occupation Managerial, associate professional and administrative (all 66 per cent)
Skilled tradesmen, process, plant, machine operatives and elementary occupations (41 per cent, 37 per cent and 40 per cent respectively)
2.3 Attendance managementKeeping people in work is a key policy objective, various policy documents point to the links between working and beneficial health outcomes25. In this survey, attendance management was examined in terms of an organisation’s flexibility when faced with people returning to work after illness or injury, or making adjustments to jobs to help people stay in work.
2.3.1 Return to work assistanceWe asked what employers had done to help respondents with more than five days’ continuous sick leave back to work, various types of assistance were explored.
Among this group of respondents, half (48 per cent) said their employer had used one or more measures to help them back to work (see Table 2.5). The most commonly reported were: being allowed to work reduced hours or fewer days (20 per cent); access to occupational health services (19 per cent); or, having workloads reduced (19 per cent). Smaller proportions mentioned a meeting at home or at work to discuss what extra help or support they might need, independent counselling, advice or information to help with work-related, health-related, legal, financial or domestic issues and reduced responsibilities at work.
25 For example the Black Review, the 2010 Marmot Review (op cit)
Health and well-being at work
17
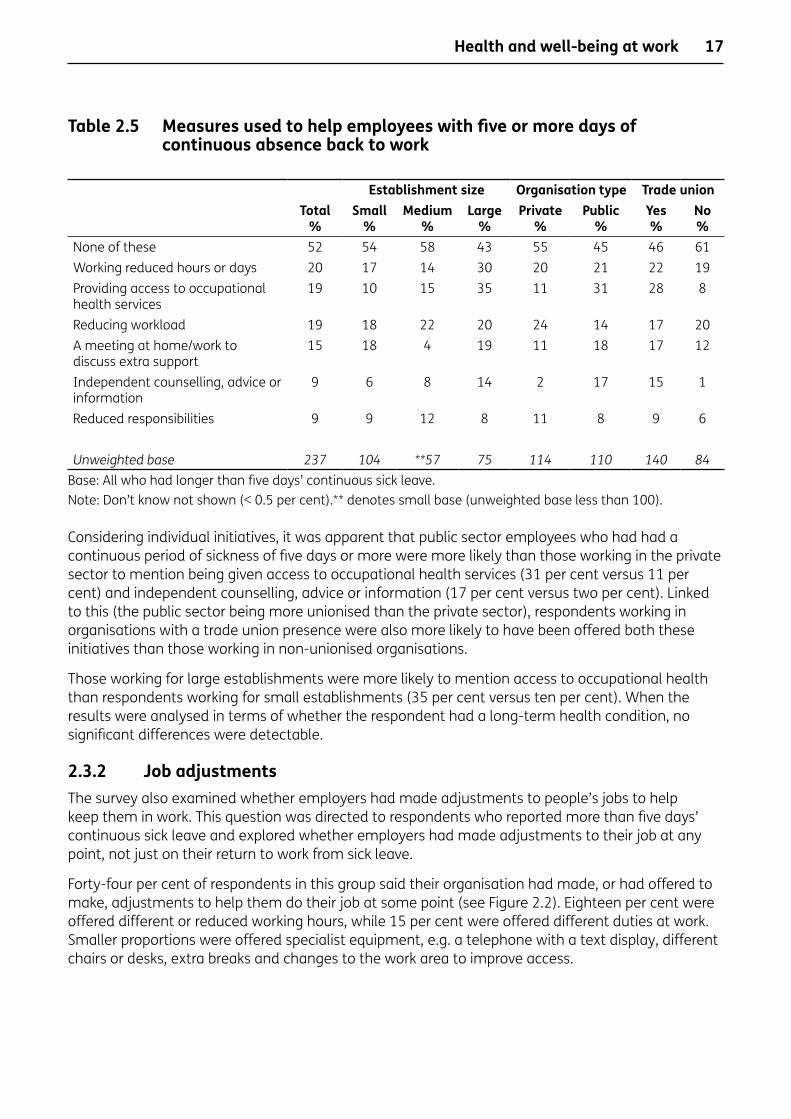
Table 2.5 Measures used to help employees with five or more days of continuous absence back to work
Establishment size Organisation type Trade unionTotal
%Small
%Medium
% Large
%Private
%Public
%Yes %
No %
None of these 52 54 58 43 55 45 46 61Working reduced hours or days 20 17 14 30 20 21 22 19Providing access to occupational health services
19 10 15 35 11 31 28 8
Reducing workload 19 18 22 20 24 14 17 20A meeting at home/work to discuss extra support
15 18 4 19 11 18 17 12
Independent counselling, advice or information
9 6 8 14 2 17 15 1
Reduced responsibilities 9 9 12 8 11 8 9 6
Unweightedbase 237 104 **57 75 114 110 140 84Base: All who had longer than five days’ continuous sick leave.Note: Don’t know not shown (< 0.5 per cent).** denotes small base (unweighted base less than 100).
Considering individual initiatives, it was apparent that public sector employees who had had a continuous period of sickness of five days or more were more likely than those working in the private sector to mention being given access to occupational health services (31 per cent versus 11 per cent) and independent counselling, advice or information (17 per cent versus two per cent). Linked to this (the public sector being more unionised than the private sector), respondents working in organisations with a trade union presence were also more likely to have been offered both these initiatives than those working in non-unionised organisations.
Those working for large establishments were more likely to mention access to occupational health than respondents working for small establishments (35 per cent versus ten per cent). When the results were analysed in terms of whether the respondent had a long-term health condition, no significant differences were detectable.
2.3.2 Job adjustmentsThe survey also examined whether employers had made adjustments to people’s jobs to help keep them in work. This question was directed to respondents who reported more than five days’ continuous sick leave and explored whether employers had made adjustments to their job at any point, not just on their return to work from sick leave.
Forty-four per cent of respondents in this group said their organisation had made, or had offered to make, adjustments to help them do their job at some point (see Figure 2.2). Eighteen per cent were offered different or reduced working hours, while 15 per cent were offered different duties at work. Smaller proportions were offered specialist equipment, e.g. a telephone with a text display, different chairs or desks, extra breaks and changes to the work area to improve access.
Health and well-being at work
18
Figure 2.2 Adjustments ever made or offered by employer to help employees with sick leave do their jobs (% of respondents)
Further analysis revealed no significant variations by the presence of a long-term health condition or by the characteristics of the employing organisation. There were, however, variations by gender: women were more likely than men to have been offered different or reduced working hours (25 per cent versus eight per cent).
2.4 Stress management The survey explored to what extent stress management support was provided by organisations and the direct experiences of managed employees and line managers.
Around a third of respondents reported that stress management support or advice was provided by their organisation, and, of those eligible, 15 per cent had taken up this support service. Respondents who had a line manager or supervisor were also asked to what extent they agreed or disagreed with the statement ‘(they)havetalkedtoyouaboutavoidingstressatwork’26. Whilst around a third (34 per cent) of this group agreed that their line manager had talked to them about avoiding stress at work, nearly half disagreed that this was the case (48 per cent) – although it should be noted that not all respondents would have wished for, or necessarily needed, such intervention.
Respondents who were themselves managers were asked whether they had ever received information, help or advice on how to handle stress among the staff they managed. Just under half of this group (45 per cent) had received such support.
26 The five point scale was: strongly agree, tend to agree, neither agree nor disagree, tend to disagree and strongly disagree.
56
100 20 30 40 50 60
Building modifications, e.g. ramps
Job coach or personal assistant
Changes to work area to improve access
Extra breaks
Different chair or desk
Equipment to help do your work
Different duties
Different or reduced working hours
None of these
18
15
11
10
7
6
1
1
Base: all who had longer than five days’ continuous sick leave (unweighted 237). Note: don’t know and other not shown (two per cent combined).
Health and well-being at work
19
Some familiar patterns were evident:
• Respondents working in the public sector were more likely than those working in the private sector to say that stress management support measures were in place.
• Respondents in larger organisations and in organisations with a trade union presence tended to be more likely to report stress management support measures or interventions than those in small organisations or those in organisations without a trade union presence.
The survey did not collect reasons for sickness absence in the past year, but depression, bad nerves or anxiety were reported as the most common symptoms of ill health caused by work. Further analysis, however, did not reveal any evidence, that this group of respondents had been targeted for support from their line manager, i.e. they were just as likely as other employees to say that their line manager had spoken to them about managing stress. It is important to note that line managers may not have been aware of such health symptoms among their staff.
Health and well-being at work

20
3 Relationships at work and work culture
SummaryThis chapter explores how employees felt about relationships at work and the culture of their organisation. Relationships with line managers, those managed, senior managers and other colleagues are examined, while organisational culture is considered in terms of the employer’s vision and values, consultation practices, reward and development and general working culture.
Some of the key findings are:
• The majority of respondents were positive about many aspects of their relationships with different groups of colleagues. Some of the most positive views related to the help and support received from work colleagues. There was, however, some criticism of senior managers, particularly in terms of delivering on promises.
• Workers in small organisations appeared to be able to foster more positive working relationships with those at a senior management level and were more positive about the time they were able to devote to staff management. Respondents’ views about line managers did not vary by organisation or establishment size.
• Public sector managers were more negative than private sector managers about the time available for managing staff.
• In terms of organisational culture, respondents were most negative about issues relating to reward and development, with 39 per cent agreeing that their organisation failed to reward extra effort made by staff.
3.1 Line managers or supervisorsThe survey examined workers’ views on their line manager or supervisor using eight agreement statements as follows27, (they):
• give you help and support;
• give constructive feedback on the work you do;
• expect you to work too hard;
• show they care about you as a person;
• are unwilling to listen to your problems;
• encourage you at work;
• treat you unfairly;
• encourage you to develop your skills.
27 Respondents who did not have a line manager or supervisor were not asked these questions.
Relationships at work and work culture

21
Table 3.1 shows the proportions of respondents who agreed with each statement. It should be noted that the three statements at the bottom of the table were all negatively phrased, so low levels of agreement are a positive finding. From the table it is clear that line managers and supervisors were positively regarded: over 70 per cent of respondents agreed to some extent with all the positively phrased statements, and a quarter or less agreed with the negatively phrased statements about working too hard, line managers being unwilling to listen to problems, and unfair treatment (eight per cent of respondents agreed they were treated unfairly, although this does, of course, equate to many thousands of employees when grossed up to a total population level).
Table 3.1 Levels of agreement and disagreement with statements about line manager/supervisor
Strongly agree
%
Tend to agree
%
Neither agree nor disagree
%
Tend to disagree
%
Strongly disagree
%
All agree
%
All disagree
%Give you help and support 35 43 11 7 4 78 11Encourage you at work 35 41 14 8 3 76 11Encourage you to develop your skills 36 38 14 8 3 75 11Give constructive feedback on the work you do 33 40 12 10 6 72 16Show they care about you as a person 30 41 14 9 6 71 15Expect you to work too hard 8 17 21 35 19 25 55Are unwilling to listen to your problems 5 10 11 37 37 15 74Treat you unfairly 3 6 8 31 53 8 84
Base: All who are managed or supervised (unweighted: 1,907).Note: Percentages in table are row percentages; individual percentages may not tally with grouped figures due to rounding.
Analysis of the eight statements showed no significant variations in levels of agreement when public/private sector, industry sector and occupation splits were examined.
In terms of personal demographics, women were more likely than men to perceive that their line manager or supervisor was willing to listen to their problems: 42 per cent of women strongly disagreed that their line manager or supervisor was ‘unwillingtolistentoyourproblems’ compared with 32 per cent of men. The findings also varied by the age of the respondent: across the positively worded statements there was a tendency for levels of agreement to decrease with age. For example in the case of ‘(they)encourageyouatwork’, 86 per cent of those aged 16-24 agreed with this statement, reducing to 70 per cent of those aged 45 or older.
There were no other significant demographic differences, but it appeared to be the case that respondents who said that flexible working was offered by their employer had a greater tendency to be positive: they were more likely to agree with all the positively worded statements than other respondents. This pattern was also carried through to the negatively worded statements, for example in the case of ‘(they)expectyoutoworktoohard’, 31 per cent of respondents in organisations with flexible working strongly disagreed with the statement versus 20 per cent of those in organisations without flexible working practices.
Relationships at work and work culture
22
3.2 Senior managersGiven that senior managers are influential within an organisation but may be more ‘remote’ to employees (particularly in large organisations), the survey aimed to explore respondents’ views of this group28.
Respondents who reported that they had had contact with senior managers in the last year, or whose line manager was part of the senior management team, or who were themselves part of the senior management team were asked to what extent they agreed or disagreed with six statements about senior managers29 as follows, (they):
• are difficult to communicate with;
• show they listen to junior staff;
• fail to seek the views of staff;
• respond to suggestions from staff;
• deliver on their promises;
• treat employees unfairly.
Table 3.2 summarises the findings and, whilst the general picture is one of positivity, it is clear that levels of agreement with the positively phrased statements are not as high as was the case with the positive statements relating to line managers. Over half of employees agreed that senior managers responded to suggestions from staff (58 per cent), showed they listened to junior members of staff (55 per cent), and encouragingly, less than a fifth of employees (16 per cent) agreed that senior managers treated employees unfairly (although this is a slightly higher percentage than that recorded in relation to unfair treatment by line managers).
Respondents were less positive, however, about senior managers delivering on their promises: less than half (47 per cent) agreed with this statement and three in ten employees were critical in terms of senior managers seeking staff views (29 per cent said they failed to seek the view of staff). Around a quarter (26 per cent) thought that senior managers were difficult to communicate with.
28 In the survey, senior managers were defined as follows: ‘a senior manager may be someone more senior than the person who manages or supervises you, right through to those at the top of your organisation. They may or may not work at your site’. Those without a line manager or supervisor were asked whether they were themselves part of the senior management team, and those who said they had a line manager but no senior managers were asked whether their line manager was part of the most senior team in their organisation.
29 This equated to a majority of respondents answering this section of the survey (89 per cent).
Relationships at work and work culture

23
Table 3.2 Levels of agreement and disagreement with statements about line manager/supervisor
Strongly agree
%
Tend to agree
%
Neither agree nor disagree
%
Tend to disagree
%
Strongly disagree
%
All agree
%
All disagree
%Respond to suggestions from staff 16 43 20 15 7 58 22Show they listen to junior staff 16 39 20 17 8 55 25Deliver on their promises 12 35 28 17 8 47 25Fail to seek the views of staff 9 20 16 36 19 29 55Are difficult to communicate with 8 18 14 35 25 26 60Treat employees unfairly 4 12 16 38 29 16 68
Base: All having contact with senior managers in past year/whose line manager part of senior management team/who were themselves part of the senior management team (unweighted: 1,796).Note: Percentages in table are row percentages; individual percentages may not tally with grouped figures due to rounding.
Further analysis showed that gender appeared to have no influence on respondents’ views of senior managers. Age had an impact in the case of listening to junior staff: 67 per cent of respondents aged 16-24 agreed with the statement versus 53 per cent or less of older respondents.
There was some evidence that smaller organisations were able to foster better communications between staff at different levels. For example, in the case of senior managers showing they listened to junior staff, respondents working in small organisations were more likely than those working in the very largest organisations (with 500+ employees) to agree that this was the case (64 per cent versus 53 per cent respectively – see Figure 3.1). In the case of senior managers responding to suggestions from staff, 22 per cent of respondents working in small organisations strongly agreed with this statement, versus 13 per cent of respondents working in organisations with 500+ employees. This, perhaps, points to an issue of greater interaction with senior staff in smaller workplaces.
Relationships at work and work culture

24
Figure 3.1 Level of agreement (%) with statements about senior managers, by size of organisation
Patterns also emerged with trade union presence: where no trade union was present, some ratings for senior managers were higher than those organisations with trade union presence. For example, 62 per cent of respondents in organisations with no trade union presence agreed that senior managers responded to staff suggestions compared with 53 per cent of organisations with a trade union presence. This linked with the size of the organisation, as respondents in smaller organisations were less likely to report trade union presence30.
3.3 Relationships with staff The experience of managing staff was also covered by the survey. No minimum or maximum size of team was specified in the survey questions; it was hypothesised that teams of all sizes could have a positive or negative impact on a manager’s experience at work.
30 Seventeen per cent of employees in small organisations reported the presence of a trade union, compared with at least 32 per cent of those working in larger organisations.
Relationships at work and work culture
55
100 20 30 40 50 60 70
Treat employeesunfairly
Are difficult tocommunicate with
Fail to seekthe views of staff
Deliver on theirpromises
Show they listento junior staff
Respond to suggestionsfrom staff
Percentage agree very largePercentage agree largePercentage agree mediumPercentage agree small
5360
65
5348
5564
454344
56
293433
27
2727
2623
1618
1316
Base: all having had contact with senior managers in past year, or whose line manager was part of senior management team, or who were themselves part of the senior management team (unweighted bases: small (419), medium (207), large (90), very large (1,009)).

25
Respondents who had a management or supervisory responsibility31 were asked to what extent they agreed or disagreed with the following four statements:
• My staff are difficult to manage.
• My staff give me positive feedback.
• My staff are unwilling to share their problems with me.
• I have enough time to manage my staff.
Table 3.3 shows that over eight in ten respondents (84 per cent) agreed that their staff gave them positive feedback. Meanwhile just seven per cent agreed that their staff were unwilling to share their problems (82 per cent disagreed with this statement) and 11 per cent agreed that their staff were difficult to manage (77 per cent disagreed). In terms of having enough time to manage or supervise staff, six in ten respondents (63 per cent) were positive in this regard but a quarter (25 per cent) were negative, and this was the highest level of negativity across the four statements.
Table 3.3 Levels of agreement and disagreement with statements about relationships with staff
Strongly agree
%
Tend to agree
%
Neither agree nor disagree
%
Tend to disagree
%
Strongly disagree
%
All agree
%
All disagree
%My staff give me positive feedback 25 59 11 4 1 84 5I have enough time to manage my staff 20 42 12 20 5 63 25My staff are difficult to manage 1 10 12 40 37 11 77My staff are unwilling to share their problems with me 2 6 11 47 35 7 82
Base: All responsible for managing or supervising staff (unweighted: 845).Note: Percentages in table are row percentages; individual percentages may not tally with grouped figures due to rounding.
Levels of agreement to most statements did not tend to vary by organisational characteristics, with one exception: managers in private sector organisations were much more likely than those in the public sector to say they had enough time to manage their staff (71 per cent versus 51 per cent). As already mentioned, public sector organisations tend to be trade unionised, so it followed that managers in organisations with a trade union presence were less likely than other managers to agree that they had sufficient time for staff management.
Analysis by personal demographics shows that age was important in some instances. In the case of feedback, those aged 35 and older were more likely than those aged 25-34 to agree that their staff gave them positive feedback (at least 85 per cent versus 74 per cent). However, in terms of having sufficient time to manage, younger respondents aged 16-34 were more likely than those aged 35+ to agree that they had enough time (72 per cent agreed versus 59 per cent of those aged 35 or older); these findings may relate to those observed for the public/private sector, as the public sector is characterised by an older workforce.
31 Respondents were asked ‘In your job, do you regularly have any formal responsibility for supervising the work of other employees?’ and interviewers were provided with a list of exclusions. Please see questionnaire in the appendices for further details.
Relationships at work and work culture
26
Analysis by gender showed that women were more positive than men regarding the willingness of their staff to share their problems, but men were more positive than women about having sufficient time to manage their staff. The latter finding may have related to the fact that women were more likely than men to work part-time; part-time managers were less positive than those working full-time about having enough time to manage their staff, and 44 per cent of women worked part-time (compared with 12 per cent of men).
3.4 Other colleagues Relationships with other people in the organisation were investigated using five statements, as follows:
• I get the help and support I need from colleagues at work.
• I am subject to unkind words or behaviour at work.
• There is friction or anger between colleagues at work.
• I enjoy good relations with my work colleagues.
• My colleagues are unwilling to listen to my work related problems.
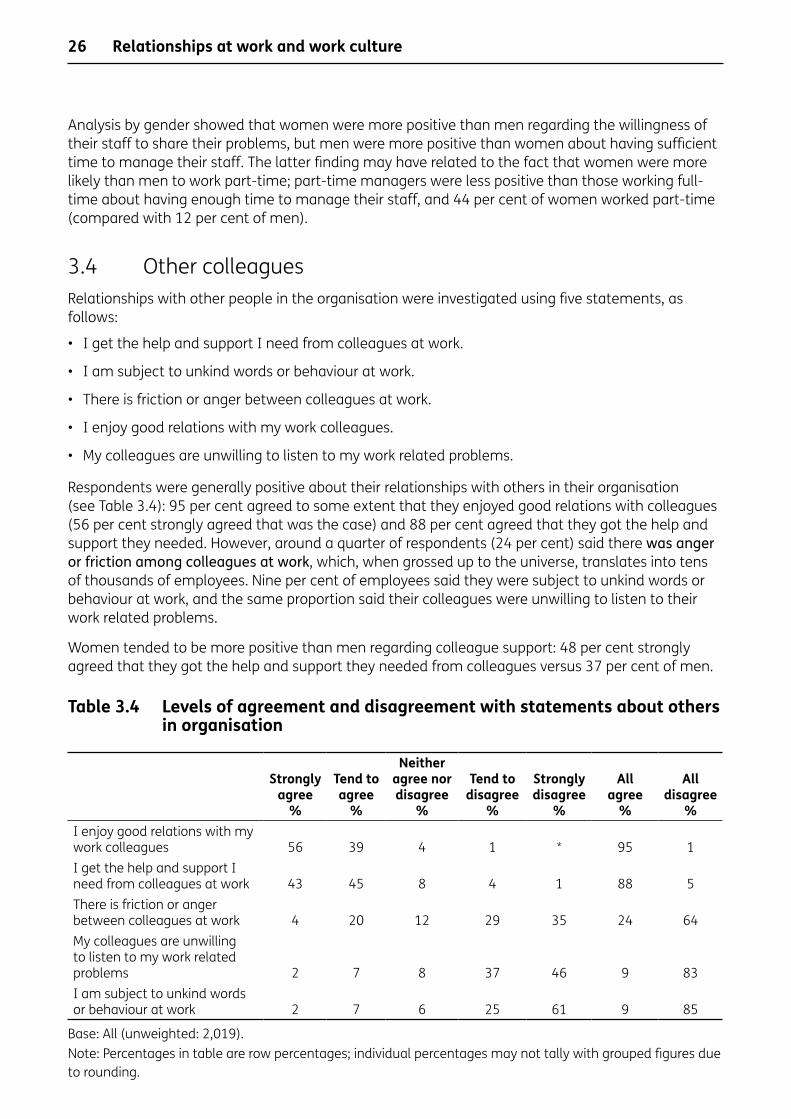
Respondents were generally positive about their relationships with others in their organisation (see Table 3.4): 95 per cent agreed to some extent that they enjoyed good relations with colleagues (56 per cent strongly agreed that was the case) and 88 per cent agreed that they got the help and support they needed. However, around a quarter of respondents (24 per cent) said there was anger or friction among colleagues at work, which, when grossed up to the universe, translates into tens of thousands of employees. Nine per cent of employees said they were subject to unkind words or behaviour at work, and the same proportion said their colleagues were unwilling to listen to their work related problems.
Women tended to be more positive than men regarding colleague support: 48 per cent strongly agreed that they got the help and support they needed from colleagues versus 37 per cent of men.
Table 3.4 Levels of agreement and disagreement with statements about others in organisation
Strongly agree
%
Tend to agree
%
Neither agree nor disagree
%
Tend to disagree
%
Strongly disagree
%
All agree
%
All disagree
%I enjoy good relations with my work colleagues 56 39 4 1 * 95 1I get the help and support I need from colleagues at work 43 45 8 4 1 88 5There is friction or anger between colleagues at work 4 20 12 29 35 24 64My colleagues are unwilling to listen to my work related problems 2 7 8 37 46 9 83I am subject to unkind words or behaviour at work 2 7 6 25 61 9 85
Base: All (unweighted: 2,019).Note: Percentages in table are row percentages; individual percentages may not tally with grouped figures due to rounding.
Relationships at work and work culture

27
3.5 Organisational culture Respondents’ feelings about and views on their employing organisation were examined using ten agreement statements, which can be divided into four broad categories as follows:
• Vision and values:
– I share the values of the organisation I work for;
– this organisation inspires my confidence;
– this organisation lacks a clear vision for the future;
• Worker consultation:
– I can ask questions about change at work;
– I am consulted about changes in my workplace that affect me;
– when changes are made at work, I am unclear how they will affect me;
• Reward and development:
– the organisation fails to reward extra effort by staff;
– there are few opportunities for me to learn and grow within this organisation;
• Cultural environment:
– this is a fun place to work;
– there are poor relations between managers and employees in this organisation.
Table 3.5 displays the level of agreement with each statement. There was some considerable variation in respondents’ views, for example, 84 per cent of workers agreed that they were able to ask questions about change at work and 72 per cent said that they shared the values of their employing organisation. Six in ten or more agreed that they were consulted about changes that affected them (64 per cent), that their workplace was a fun place to work (60 per cent) and that their organisation inspired their confidence (60 per cent).
In terms of the negatively worded statements, a fifth of respondents agreed that the organisation lacked a clear vision for the future (19 per cent), whilst around a quarter said that when changes were made, they were unclear how these would affect them (23 per cent) and that there were poor relations between managers and workers (26 per cent). Greatest negativity, however, was observed in relation to reward and development: 29 per cent of respondents said there were few opportunities to learn and grow in their organisation, and nearly four in ten (39 per cent) reported that their organisation failed to reward extra effort made by staff.
Relationships at work and work culture

28
Table 3.5 Levels of agreement and disagreement with statements about the employing organisation
Strongly agree
%
Tend to agree
%
Neither agree nor disagree
%
Tend to disagree
%
Strongly disagree
%
All agree
%
All disagree
%I can ask questions about change at work 34 50 8 6 3 83 9I share the values of the organisation I work for 29 43 18 7 3 72 10Consulted about changes in my workplace that affect me 24 40 13 16 8 64 24This is a fun place to work 19 41 21 11 8 60 19This organisation inspires my confidence 22 38 21 15 5 60 20This organisation fails to reward extra effort by staff 13 26 16 28 17 40 45Few opportunities to learn and grow within this organisations 9 20 13 32 25 30 57Poor relations between managers and employees 9 17 16 34 24 26 58When changes are made, I am unclear how they will affect me 5 18 18 38 21 23 59This organisation lacks a clear vision for the future 6 13 16 33 32 19 65
Base: All (unweighted: 2,019).Note: Percentages in table are row percentages; individual percentages may not tally with grouped figures due to rounding.
Looking in more detail at statements relating to vision and values, those working in the public sector were more positive than other workers about the sharing their organisation’s values (78 per cent versus 68 per cent of private sector respondents). Apparent differences by personal demographics such as gender were not found to be statistically significant.
No significant differences were detected by organisational characteristics or personal demographics in relation to the statements regarding the cultural environment and worker consultation. The exception was for respondents with a long-term health condition: they were more likely than other respondents to agree that there were poor relations between managers and employees in the organisation where they worked (32 per cent versus 23 per cent respectively) as well as being more likely than other respondents to agree with the statement, when changes are made at work, I am unclear how they will affect me (30 per cent versus 19 per cent respectively).
In terms of reward and development, it was a mixed picture. Public sector workers were more likely than those in the private sector to agree that their organisation failed to reward extra effort by staff, but were less likely to agree that there were few opportunities to learn and grow (see Tables 3.6 and 3.7). Opportunities for development were also felt to be lacking in small organisations when compared with very large organisations. In terms of personal demographics, those on lower incomes were less positive than other respondents about development opportunities.
Relationships at work and work culture

29
Table 3.6 Levels of agreement and disagreement with the statement ‘There are few opportunities for me to learn and grow in this organisation’
Organisation type Organisation size Income
Total %
Private %
Public %
Small (1-50)
%
Medium (51-249)
%
Large (250-499)
%
Very large
(500+) %
Low – Up to
£15,599 %
High – £20,800+
%Strongly agree 9 11 7 14 18 11 6 11 7Tend to agree 20 22 17 24 20 20 18 24 17Neither agree nor disagree 13 13 13 16 13 11 12 14 12Tend to disagree 32 31 35 26 26 32 36 28 37Strongly disagree 25 23 28 21 23 25 28 24 47All agree 30 33 25 37 38 32 24 35 25All disagree 57 54 63 47 50 57 63 52 64
Unweightedbase 2,019 1,274 661 474 225 107 1,131 773 728
Base: All.Note: Individual percentages may not tally with grouped figures due to rounding.
Table 3.7 Levels of agreement and disagreement with the statement ‘This organisation fails to reward extra effort made by staff’
Organisation type Trade unionAny sickness absence
in past year Total
%Private
%Public
%Yes %
No %
Yes %
No %
Strongly agree 13 12 15 14 14 17 12Tend to agree 26 24 31 30 22 31 24Neither agree nor disagree 16 14 18 16 15 16 15Tend to disagree 28 29 25 27 29 25 30Strongly disagree 17 20 10 13 20 10 20All agree 40 36 46 44 36 48 36All disagree 45 49 36 40 49 36 49
Unweightedbase 2,019 1,274 661 1,023 854 843 925
Base: All32.Note: Individual percentages may not tally with grouped figures due to rounding.
32 The base for ‘any sickness absence in past year’ is all those who have worked for their organisation for more than 12 months.
Relationships at work and work culture

30
4 Key employee findingsSummaryThis chapter provides a discussion of: sickness absence, presentee-ism, well-being, employee engagement and retention.
Some of the key findings are:
• Across the sample, 48 per cent of respondents had taken some sick leave in the past 12 months and the average number of days’ leave across the whole sample was 4.9 days.
• Forty-four per cent of respondents had gone to work in the past 12 months when, in their opinion, they should have taken sick leave. On average, respondents went to work on two days in the past 12 months when they thought they were too sick to do so.
• The average well-being score was 26 out of 35, using the seven item Warwick-Edinburgh Mental Well-being Scale (WEMWBS) measure33.
• An engagement index was created from levels of agreement to five statements. Across the sample the average level of employee engagement was 67 out of 100.
• Forty per cent of respondents had thought about leaving their current employer in the past 12 months.34
4.1 Sickness absenceThe survey investigated the incidence of absence due to illness or injury among employees in the previous 12 month period and Table 4.1 summarises the findings.35
Overall, 48 per cent of respondents had taken some sick leave in the past year and this was more likely to be the case among employees working in the public sector and those working in large rather than small establishments. Respondents in younger age groups were also more likely to have had some sickness absence in the past year (55 per cent of those aged 34 or younger compared with 45 per cent of those aged 35+). Females were more likely than males to have taken some sickness absence.
When the average duration of sickness absence was considered older employees (aged 55+) had a higher average number of days’ sickness than younger employees. So, although they were less likely to take any sick leave, when they did, older employees were, on average, absent from work for a longer period than younger workers. In terms of average number of days, sickness was almost double in the public sector when compared with the private sector.
As a further observation, the data suggested that respondents who were not paid during their sick leave were less likely than those who received full pay for the first seven days of absence to have had any sick leave during the past year and to have had fewer average days’ sickness absence. Whilst these differences were not found to be statistically significant once the data had been
33 Warwick-Edinburgh Mental Well-being Scale. Op cit.34 Or if the employee had been in their job for less than 12 months, since they started their job.35 All sickness absence figures are based on respondents who had worked for their employer for
12 months or more.
Key employee findings
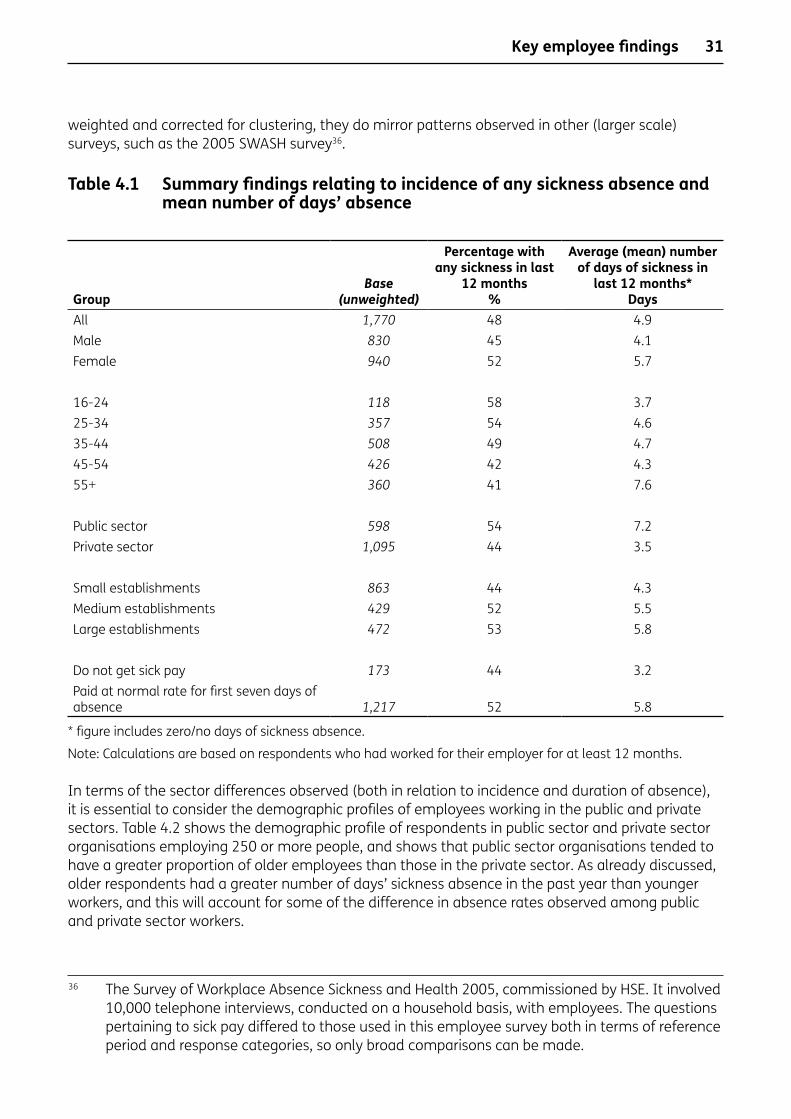
31
weighted and corrected for clustering, they do mirror patterns observed in other (larger scale) surveys, such as the 2005 SWASH survey36.
Table 4.1 Summary findings relating to incidence of any sickness absence and mean number of days’ absence
GroupBase
(unweighted)
Percentage with any sickness in last
12 months %
Average (mean) number of days of sickness in
last 12 months* Days
All 1,770 48 4.9Male 830 45 4.1Female 940 52 5.7
16-24 118 58 3.725-34 357 54 4.635-44 508 49 4.745-54 426 42 4.355+ 360 41 7.6
Public sector 598 54 7.2Private sector 1,095 44 3.5
Small establishments 863 44 4.3Medium establishments 429 52 5.5Large establishments 472 53 5.8
Do not get sick pay 173 44 3.2Paid at normal rate for first seven days of absence 1,217 52 5.8
* figure includes zero/no days of sickness absence.
Note: Calculations are based on respondents who had worked for their employer for at least 12 months.
In terms of the sector differences observed (both in relation to incidence and duration of absence), it is essential to consider the demographic profiles of employees working in the public and private sectors. Table 4.2 shows the demographic profile of respondents in public sector and private sector organisations employing 250 or more people, and shows that public sector organisations tended to have a greater proportion of older employees than those in the private sector. As already discussed, older respondents had a greater number of days’ sickness absence in the past year than younger workers, and this will account for some of the difference in absence rates observed among public and private sector workers.
36 The Survey of Workplace Absence Sickness and Health 2005, commissioned by HSE. It involved 10,000 telephone interviews, conducted on a household basis, with employees. The questions pertaining to sick pay differed to those used in this employee survey both in terms of reference period and response categories, so only broad comparisons can be made.
Key employee findings

32
Table 4.2 Profile of employees in large public sector and large private sector organisations by gender and age
GroupLarge (250+ employees)
public sector %Large (250+ employees)
private sector %GenderMale 32 57Female 68 43Age16-24 3 925-34 16 2335-44 31 2945-54 28 2255+ 22 16
Base(unweighted) 466 596
Note: calculations are based on respondents who had worked for their employer for at least 12 months.
As already mentioned, patterns for ‘any’ and the average duration of leave by various employer and personal demographics were also observed in the SWASH study. It should be noted, however, that in the SWASH study once the profiles of employees working in the public and private sectors were standardised in terms of age, gender and size of employing organisation, the differences observed in terms of sickness absence largely disappeared37. Similar analyses performed on data from the Employee Survey showed working in the public sector had a stronger association with higher than average sickness absence than age or gender.
It is important to emphasise that the Employee Survey comprised a much smaller sample than that covered by SWASH (over 10,000 respondents). It could be hypothesised that the differences between public and private sectors may have reflected the economic situation at the time of the survey, which, as already mentioned, followed a period of private sector job cuts but preceded the announcement of funding cuts in the public sector (i.e. private sector may have felt vulnerable and been less inclined to be absent from work). However, recently published data from the Labour Force Survey38 suggests that, if anything, sickness absence levels fell in the private and the public sector over the course of 2009 (although there were higher levels of sickness in the public sector, as evidenced in the Employer Survey).
37 Survey of Workplace Absence Sickness and Health (SWASH) 2005: Report on emergent findings, HSE.
38 http://www.statistics.gov.uk/downloads/theme_labour/Sicknessabsence.xls
Key employee findings

33
4.2 Presentee-ismThe survey also explored to what extent employees went to work when, in their opinion, they were really too sick to do so, a concept commonly referred to as ‘presentee-ism’. Forty-four per cent of respondents39 said that they had gone to work in the past 12 months when they felt they should have taken sick leave and the groups more likely to report presentee-ism included:
• respondents with a long-term health condition (who were also more likely to have had a high number of days off sick);
• those aged between 25 and 54 (versus those aged 55 or older).
When the results were analysed in terms of how employees were paid when they took sick leave, no patterns in the data were discernable. For example, those who did not receive sick pay were no more likely than those who were paid at their normal rate during the first seven days of absence to report presentee-ism.
Among those who reported presentee-ism, the average number of days in the past 12 months on which they went to work when they were really too sick to do so was five. Across the sample as a whole, this equated to two days on average. Respondents with a long-term health condition were more likely than those without to report more days on which they went to work when they were really too ill to do so (3.4 days versus 1.6 days respectively).
4.3 Well-beingWell-being was measured using the WEMWBS. This is a fourteen item scale (or, as used in this survey, a seven item scale) covering subjective well-being and psychological functioning, in which all items are worded positively and address aspects of positive mental health. The responses to the items are summed to give an overall score and details about the calculation of this score are provided in the appendices.
For this survey, the shortened version of the measure was administered using Computer Aided Self Interview (CASI)40. Respondents were asked to respond to each of the following statements using the scale: none of the time, rarely, some of the time, often, all of the time:
• I’ve been feeling optimistic about the future;
• I’ve been feeling useful;
• I’ve been feeling relaxed;
• I’ve been dealing with problems well;
• I’ve been thinking clearly;
• I’ve been feeling close to other people;
• I’ve been able to make up my own mind about things.
39 All ‘presentee-ism’ figures are based on those respondents who had worked for their organisation for 12 months or more.
40 CASI; whereby the respondent enters their answers directly onto the laptop without the interviewer’s involvement. This is used where questions are deemed to be very personal or sensitive to the respondent, and there is a danger of embarrassment or the provision of socially acceptable answers if the interviewer were to pose the questions directly.
Key employee findings

34
For an individual, the range of scores was seven to 35. When the scores were summed across the whole sample, the average score was 26 (out of 35), showing that people tended towards the upper end of the well-being scale. Broadly speaking, as many people sat above the average score as sat below it, so there was not a situation in which a few people had exceptionally high or low well-being scores.
4.4 EngagementThere is no single definition that describes an engaged workforce. The Macleod review41 found over fifty definitions when researching the topic, but settled on describing it as ‘aworkplaceapproachdesignedtoensurethatemployeesarecommittedtotheirorganisation’sgoalsandvalues,motivatedtocontributetoorganisationalsuccess,andareableatthesametimetoenhancetheirownsenseofwell-being.’ The same review discussed how the concept of engagement could be viewed in different ways: an attitude, behaviour or an outcome or, indeed, all three.
In this report we discuss engagement as an outcome in its own right and the survey used the ‘Say, Stay, Strive’ framework42. It comprises five agreement statements as follows:
Say (employees identify themselves as part of the organisation and promote it as a great employer):
• I am proud when I tell others I work for this organisation.
• I would recommend this organisation as a great place to work.
Stay (employees feel a sense of personal attachment to their organisation):
• I feel a strong personal attachment to the organisation.
Strive (employees feel encouraged to support their organisation to deliver and succeed):
• My organisation inspires me to do the best in my job.
• My organisation motivates me to help it achieve its objectives.
Table 4.3 shows the proportion of those who said they strongly or tended to agree with each statement. The highest level of agreement was for the ‘strive’ statement my organisation inspires me to do the best in my job, which 69 per cent of respondents agreed with. Around two-thirds of respondents agreed with the ‘strive’ statement my organisations motivates me to help it achieve its objectives and both the ‘say’ statements concerning recommendation and pride. Whilst the lowest level of agreement was for the ‘stay’ statement, it was still the case that the majority of respondents (59 per cent) reported feeling a strong personal attachment to their organisation.
41 http://www.bis.gov.uk/files/file52215.pdf42 This was also used in the 2009 Civil Service People Survey. For more information please see:
http://www.civilservice.gov.uk/about/improving/engagement/index.aspx
Key employee findings
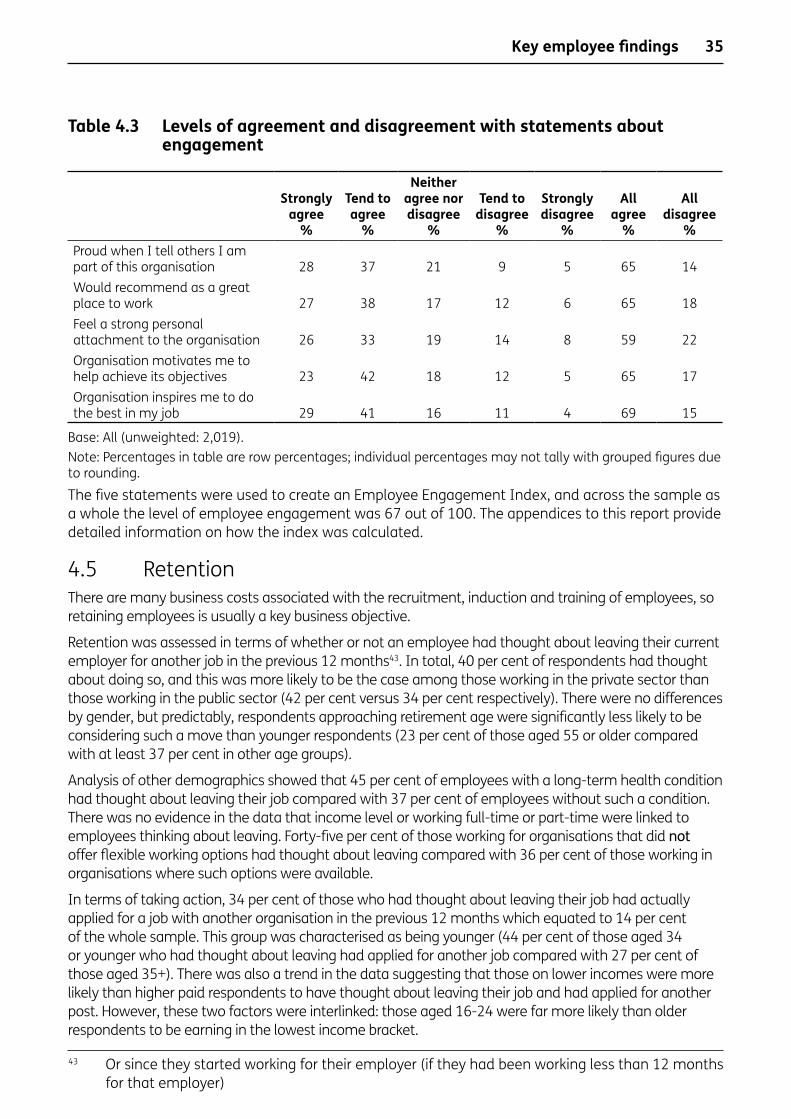
35
Table 4.3 Levels of agreement and disagreement with statements about engagement
Strongly agree
%
Tend to agree
%
Neither agree nor disagree
%
Tend to disagree
%
Strongly disagree
%
All agree
%
All disagree
%Proud when I tell others I am part of this organisation 28 37 21 9 5 65 14Would recommend as a great place to work 27 38 17 12 6 65 18Feel a strong personal attachment to the organisation 26 33 19 14 8 59 22Organisation motivates me to help achieve its objectives 23 42 18 12 5 65 17Organisation inspires me to do the best in my job 29 41 16 11 4 69 15
Base: All (unweighted: 2,019).Note: Percentages in table are row percentages; individual percentages may not tally with grouped figures due to rounding.
The five statements were used to create an Employee Engagement Index, and across the sample as a whole the level of employee engagement was 67 out of 100. The appendices to this report provide detailed information on how the index was calculated.
4.5 Retention There are many business costs associated with the recruitment, induction and training of employees, so retaining employees is usually a key business objective.
Retention was assessed in terms of whether or not an employee had thought about leaving their current employer for another job in the previous 12 months43. In total, 40 per cent of respondents had thought about doing so, and this was more likely to be the case among those working in the private sector than those working in the public sector (42 per cent versus 34 per cent respectively). There were no differences by gender, but predictably, respondents approaching retirement age were significantly less likely to be considering such a move than younger respondents (23 per cent of those aged 55 or older compared with at least 37 per cent in other age groups).
Analysis of other demographics showed that 45 per cent of employees with a long-term health condition had thought about leaving their job compared with 37 per cent of employees without such a condition. There was no evidence in the data that income level or working full-time or part-time were linked to employees thinking about leaving. Forty-five per cent of those working for organisations that did not offer flexible working options had thought about leaving compared with 36 per cent of those working in organisations where such options were available.
In terms of taking action, 34 per cent of those who had thought about leaving their job had actually applied for a job with another organisation in the previous 12 months which equated to 14 per cent of the whole sample. This group was characterised as being younger (44 per cent of those aged 34 or younger who had thought about leaving had applied for another job compared with 27 per cent of those aged 35+). There was also a trend in the data suggesting that those on lower incomes were more likely than higher paid respondents to have thought about leaving their job and had applied for another post. However, these two factors were interlinked: those aged 16-24 were far more likely than older respondents to be earning in the lowest income bracket.
43 Or since they started working for their employer (if they had been working less than 12 months for that employer)
Key employee findings

36
5 Other aspects of working life SummaryThis chapter covers some other aspects of working life; pay, sick pay, job security, retirement plans and self-reported measures of health.
Some of the key findings are:
• Ninety per cent of employees said their general health was either very good or fairly good, and this was more likely to be the case among younger respondents.
• A quarter of respondents (25 per cent) said their life outside work was moderately, very or extremely stressful.
• Sixty-two per cent of respondents agreed they were paid fairly for the work they did, and 59 per cent agreed that they were satisfied with the pay and benefits they received in their job. Those in the top income brackets tended towards higher levels of agreement with both statements.
• Thirteen per cent of respondents thought that losing their current job in the next 12 months was very or fairly likely, leaving the vast majority saying it was not very or not at all likely.
• Forty-eight per cent of respondents intended to retire from paid work between the ages of 60 and 65.
5.1 PayThe issue of pay was investigated by means of two attitude statements; the results for each are described below.
5.1.1 ‘I am paid fairly for the work that I do’Sixty-two per cent of respondents agreed that they were paid fairly for the work they did, with 20 per cent strongly agreeing. There were no significant differences observed by gender and age, but predictably income level had an impact: those earning in excess of £31,200 per annum (after tax and National Insurance) were much more likely than those earning less than this amount to strongly agree with the statement (31 per cent versus 19 per cent or less respectively).
Turning to organisational characteristics, no significant differences in response were observed when the data were analysed by public and private sector and size of establishment.
5.1.2 ‘I am satisfied with the pay and benefits I receive in this job’About six in ten respondents (59 per cent) agreed that they were satisfied with the pay and benefits they received in their job, whilst around a third (31 per cent) disagreed and ten per cent gave a neutral response. Similar patterns to those noted in relation to fair pay were seen in the data, for example, there were no significant differences by age or gender, but those in the highest income bracket were most likely to strongly agree with the statement. Linked with this, those who worked as managers or senior officials were most likely to agree with the statement when compared to other occupational groups.
Public sector respondents were more likely than those working in the private sector to agree that they were satisfied with their pay and benefits (64 per cent versus 56 per cent respectively). Further analysis by size of establishment revealed that those working in small establishments were less
Other aspects of working life

37
likely than those working in medium or large establishments to be satisfied with their pay and benefits (53 per cent versus 63 per cent and 65 per cent respectively).
5.2 Sick pay All respondents were asked about pay arrangements in the first seven days of absence due to sickness, regardless of whether they had taken any sick leave in the past year. It is worth noting that at the time of the survey, employers were legally required to pay Statutory Sick Pay (SSP) as a minimum to their workforce as long as employees met certain eligibility criteria and qualifying conditions44.
As shown in Figure 5.1, ten per cent of employees did not know their organisation’s policy and this was more likely to be the case among the youngest respondents: 18 per cent of those aged 16-24 gave this response compared with nine per cent of those aged 25+. Sixty-five per cent of employees were paid at the normal rate for all seven days, seven per cent were paid at a lower than normal rate for the whole of the period, whilst a further seven per cent were paid at a lower rate than normal for a part of that period.
Eleven per cent of respondents reported that they did not get paid at all when they were off sick. This may have been because the employee did not meet the eligibility criteria or qualifying conditions.
Figure 5.1 Sick pay in first seven days of absence
44 Employees were eligible for SSP as long as they had average weekly earnings equal to or more than the Lower Earnings Limit (LEL). SSP was paid after sickness of at least four days in a row (including weekends and bank holidays and days that the employee did not normally work) for qualifying days. Qualifying days are days on which the employee normally works. No payment is made for the first three qualifying days which are referred to as ‘waiting days’. More information may be obtained from http://www.direct.gov.uk/en/MoneyTaxAndBenefits/BenefitsTaxCreditsAndOtherSupport/Illorinjured/DG_175843
Other aspects of working life
Don't know 10%
No pay 11%
Less than full pay all seven days
7%
Less than full pay for part
of first seven days 7%
Full pay
65%
Full pay 65%
Base: All respondents (unweighted base: 2,019).

38
Looking at the two extremes, i.e. payment at full pay and no pay during the first seven days of absence, some clear patterns emerged in the data. As shown in Table 5.1, respondents working in large and medium establishments were more likely than those working in small establishments to say they received full pay during the specified period (77 per cent and 69 per cent versus 57 per cent respectively). Linked to this, those in the public sector (where over three-quarters of employees worked for organisations with 250+ employees) were more likely than those in the private sector to report full pay for this period (86 per cent versus 54 per cent), whereas those in the private sector were more likely to say they did not receive any pay when they were off sick (15 per cent versus three per cent). These findings were broadly in line with those found in Survey of Workplace Absence Sickness and Health (SWASH)45.
Employees working for 20 hours or less a week were more likely than those working for a greater number of hours to say they received no pay when they were off sick (23 per cent versus nine per cent of those working 21+ hours per week). This may have been because a greater proportion of employees working for 20 hours or less a week did not meet the eligibility criteria or qualifying conditions.
Table 5.1 Sick pay in first seven days of absence, by establishment size, organisation type and hours worked
Establishment size Organisation type Hours worked
Total %
Small (1-50)
%
Medium (51-249)
%
Large (250+)
%Private
%Public
%
20 or less %
21+ %
All at the normal rate 65 57 69 77 54 86 47 67Some of the seven days at a lower rate
7 7 7 6 9 2 7 7
All of the seven days at a lower rate
7 8 5 7 9 3 5 8
Do not get paid when off sick
11 15 10 5 15 3 23 9
Don’t know 10 13 9 6 13 6 18 9
Unweightedbase 2,019 1,007 486 515 1,274 661 295 1,715
Base: All.
Analysis by industry sector showed that those working in Public Administration were more likely than employees in most other sectors to say they received full pay during the first seven days of absence (92 per cent; Table 5.2).
45 SWASH, Op cit.
Other aspects of working life

39Ta
ble
5.2
Sick
pay
in fi
rst s
even
day
s of
abs
ence
, by
indu
stry
sec
tor Se
ctor
Tota
l %
Man
ufac
turin
g/
utili
ties
%Co
nstr
uctio
n %
Reta
il/w
hole
sale
/ho
tels
%
Tran
spor
t/co
mm
unic
atio
ns
%
Fina
nce/
busi
ness
%
Publ
ic
adm
in
%Ed
ucat
ion
%
Heal
th/
soci
al
wor
k %
Othe
r se
rvic
e %
All a
t the
nor
mal
rate
6565
4940
5771
9283
7266
Som
e of
the
seve
n da
ys
at a
low
er ra
te7
86
119
61
16
4Al
l of t
he s
even
day
s at
a
low
er ra
te7
1215
711
62
16
9Do
not
get
pai
d w
hen
off s
ick
118
1919
169
16
1010
Don’
t kno
w10
712
227
84
86
11
Unw
eigh
ted
base
2,01
931
9**
9634
211
031
115
023
633
1**
90Ba
se: A
ll.N
ote:
** d
enot
es s
mal
l bas
e (u
nwei
ghte
d ba
se le
ss th
an 1
00).
Other aspects of working life

40
A discussion about sick pay and its bearing on the incidence of sick leave is covered in Section 5.1.
5.3 Concerns about job securityAs already mentioned the survey took place against a backdrop of a period of job cuts in the private sector and explored whether respondents had concerns about their job over the next year. Respondents were asked all things considered, how likely do you think you are to lose your current job in the next 12 months? Five per cent of respondents said it was very likely that they would lose their job and eight per cent said it was fairly likely, leaving the vast majority (87 per cent) saying it was not very or not at all likely.
Analysis by sector showed that those working in Manufacturing/ Utilities and Transport/ Communications were among those most likely to say they were very or fairly likely to lose their job, while 56 per cent of respondents working in the Education and Health/ Social work sectors said it was not at all likely that they would lose their job in the next 12 months (the highest proportions across all industry sectors).
5.4 Retirement plansIn order to gauge people’s intentions for when they might leave the job market altogether, respondents were asked ‘Taking everything into account, at what age do you think that you personally will completely stop paid work?’ Around a tenth of respondents (12 per cent) didn’t know when they would retire from paid work and this was far more likely to be the response among those aged 16-24 (22 per cent compared with 11 per cent of those aged 25+). Notably, those aged 55 or older were no less likely than most other age groups to give a ‘don’t know’ response; given the timings of the survey in 2009, this may reflect the reports in the media regarding changes to the state pension age, which may have resulted in some uncertainty.
Most people intended to retire from paid work between the ages of 60 and 65: 22 per cent said they would retire at 60 (significantly more women than men gave this response) and 36 per cent said they would retire at 65 (there were no significant differences by gender for this finding). Just 14 per cent of respondents said they planned to retire from paid work after the age of 65. Table 5.3 summarises the findings.
Table 5.3 Intended age for retirement by gender
Total %
Male %
Female %
Under 60 12 12 1260 22 18 2661-64 4 4 465 36 39 34Over 65 14 16 11Don’t know 12 11 14
Unweightedbase 2,019 950 1,069
Base: All.
Other aspects of working life

41
Respondents earning in the highest income bracket (in excess of £31,200+ per annum after tax and national insurance) were more likely than those with lower incomes to be intending to retire from paid work before the age of 60: 19 per cent of the highest income bracket intended to retire early compared with 12 per cent or less of other respondents.
5.5 Self-reported rating for healthOverall, 90 per cent of employees said their general health was either very good or fairly good. As would be expected, those with a long-term health condition were significantly less likely to say their health was either fairly or very good (79 per cent) compared with those who did not suffer from such a condition (96 per cent). Likewise, those who had taken six or more days off work due to sickness or injury in the past 12 months46 were significantly less likely than those who had been absent for less time to report good health (77 per cent versus at least 90 per cent respectively).
Gender had no impact on respondents’ self reported health rating, but age was important. Younger respondents were generally more likely to describe their health as good or very good than older respondents (for example, 55 per cent of those aged 16-24 described their health as very good compared with 43 per cent of those aged 25 or older).
5.6 Health symptoms, their causes and impacts on workWhen presented with a list of 17 ailments47, more than half of respondents (55 per cent) said they had not suffered from any in the past 12 months.
Table 5.4 summarises the findings and from this it is clear that the most common symptom suffered was depression/bad nerves/anxiety, mentioned by ten per cent of respondents. This was followed by problems/disabilities connected with the back or neck (nine per cent), chest or breathing problems/asthma/bronchitis (eight per cent) and heart/blood pressure/blood circulation problems (eight per cent).
Table 5.4 Health symptoms experienced
All respondents %
Any symptom 45Depression, bad nerves or anxiety 10Problems/disabilities (including arthritis or rheumatism) connected with your back or neck 9Chest or breathing problems, asthma, bronchitis 8Heart, blood pressure or blood circulation problems 8Problems/disabilities (including arthritis or rheumatism) connected with your legs or feet 7Other health problems or disabilities 7Stomach, liver, kidney or digestive problems 6Problems/disabilities (including arthritis or rheumatism) connected with your arms or hands
5
Unweightedbase; 2,019
Note: The table displays symptoms with mentions of five per cent or more.
46 Based on those who had worked for their employer for 12 months or more.47 This list was the same as that used in the Labour Force Survey when investigating long term
health conditions.
Other aspects of working life
42
Those most likely to have suffered any symptoms in the past 12 months:
• were older: 64 per cent of those aged 55+ said they had suffered one or more symptoms in the past 12 months compared with 41 per cent among younger respondents;
• had taken six or more days off due to sickness or injury: in the past 12 months48 67 per cent of this group suffered one or more symptoms in the past 12 months compared with 42 per cent among those taking less time off due to sickness.
Respondents were asked whether their health symptoms were caused by work and/or made worse by work or unrelated to their work. A summary of symptoms and their reported causes is provided in Table 5.5. It should be noted that respondents were able to say that a symptom was caused by and made worse by work, in other words, these were not independent categories.
The trend across most symptoms appeared to be that employees were more likely to say that their symptom was made worse by work than to say it was caused by work. The symptoms that were most likely to be reported as being caused by work were related to mental ill health and musculoskeletal symptoms, and these findings mirrored the broad findings of the Fit3 Survey49.
Depression, bad nerves or anxiety and problems or disabilities connected with the back or neck were the symptoms most frequently cited as being caused by work (36 and 35 per cent respectively). Patterns of response in terms of whether these symptoms were made worse by work or unrelated to work were very similar: 55 per cent of those who suffered from depression, bad nerves or anxiety said that it was made worse by work (40 per cent said it was unrelated to work), and the same was true for 57 per cent of those suffering from problems connect to their back or neck (36 per cent said this symptom was unrelated to work).
Seventy-seven per cent of those who had suffered from any of the listed health symptoms in the past 12 months said that this was a long-term condition (this equated to 34 per cent of the whole sample), and the likelihood of having a long-term condition increased with age. Sixty-nine per cent of those aged 16 to 24 with health symptoms had a long-term health condition compared with 86 per cent of those aged 55 or older with health symptoms.
A quarter (25 per cent) of those who had suffered from any health symptom in the past 12 months said that this had affected either the amount or the type of work they could do. Small base sizes limited the potential for subgroup analysis.
48 Based on those who had worked for their employer for 12 months or more.49 The Fit for work, Fit for life, Fit for tomorrow (Fit3) employee surveys were carried out to
assess the impact of the Fit3 interventions for the Health and Safety Executive (HSE) and were longitudinal in design. The baseline survey consisted of a clustered probability sample of employees in GB using a multi-stage design, with postcode sectors as the Primary Sampling Units (PSUs). Wave 1 (2006) had 9,127 respondents, Wave 2 (2007) had 5,083 respondents, and the final Wave (2008) had 3,581 respondents. Among other issues, the study measured changes in workplace attitudes and behaviours, work-related sickness absence, health conditions and injury.
Other aspects of working life

43
Table 5.5 Health symptoms and their relationship to work
Symptom
Base: Unweighted (varies by symptom)
Caused by work
%
Made worse by
work %
Unrelated to work
%Depression, bad nerves or anxiety 195 36 55 40Problems/disabilities (including arthritis or rheumatism) connected with your back or neck
175 35 57 36
Problems/disabilities (including arthritis or rheumatism) connected with your arms or hands
102 25 44 50
Other health problems or disabilities 103 25 35 61Problems/disabilities (including arthritis or rheumatism) connected with your legs or feet
134 21 33 65
Heart, blood pressure or blood circulation problems 162 15 25 70Chest or breathing problems, asthma, bronchitis 166 11 18 79Stomach, liver, kidney or digestive problems 116 11 16 79
Note: Table shows row percentages. It was possible to say that a symptom was both caused by and made worse by work, so row percentages do not sum to 100 per cent. Only symptoms mentioned by more than 100 respondents are shown. Don’t know responses are not displayed in the table.
5.7 Stress outside of workThe survey explored respondents’ stress levels outside work as it was hypothesised that this could have an impact on the quality of their working life. Across the whole sample, three in ten respondents (30 per cent) said their life outside work was not at all stressful, whilst just over four in ten (44 per cent) described it as mildly stressful. A fifth (20 per cent) said life outside work was moderately stressful and five per cent described it as very or extremely stressful, meaning that around a quarter had moderate to extreme levels of stress in their lives outside work.
The following patterns were observed in the data:
• Respondents with children, with caring responsibilities and those working part time were more likely to report a life outside of work that was moderately, very or extremely stressful; these groups were characterised by a greater proportion of women than men. Men were significantly more likely than women to describe their life outside work as not at all stressful, 37 per cent versus 23 per cent respectively.
• Those on incomes of up to £10,399 per annum (after tax and national insurance) were more likely than those earning in excess of £10,399 per annum to describe their life outside of work as moderately, very or extremely stressful (34 per cent versus 24 per cent respectively).
• Respondents with a long-term health condition were more likely to describe life outside work as moderately stressful (26 per cent versus 17 per cent of those with no long-term health condition). In contrast, those who did not report suffering from a long-term health condition were more likely than respondents who did to describe their life outside work as not at all stressful (33 per cent versus 25 per cent).
• The presence of flexible working practices in the organisation had no discernable association with the findings for stress levels outside of work.
Other aspects of working life
44
Those who described their life outside work as mildly or not at all stressful were less likely than those who said it was very or extremely stressful to agree with statements to do with work impacting on their personal life (or their personal life impacting on work). It is notable that among those who experienced a very or extremely stressful life outside of work, 24 per cent said their work suffered because of their personal life, but a greater proportion – 44 per cent – of the same group said that their personal life suffered because of their work responsibilities.
Other aspects of working life

45
6 Conclusions A key aim of the survey was to provide baseline data so that progress on health and well-being at work could be measured and monitored over time.
This survey has provided evidence of activity, across organisations of all sizes, for this indicator and several of its sub-indicators. There are some clear patterns in the data that show that provision is more prevalent in large organisations, especially those in the public sector and those with trade union presence. Given the Public Sector as an Exemplar initiative50, these are positive findings.
6.1 Health and well-being initiatives and supportThe response to Dame Carol Black’s review51 identified seven key indicators to develop baselines for and measure progress against. The second of the indicators was ‘improving the promotion of better health and well-being at work’, which incorporated the sub-indicator ‘health and well-being initiatives and support’.
The wide ranging nature of health and well-being initiatives that could potentially fall under this sub-indicator was reflected in the list of 20 initiatives and support measures drawn up for exploration by the survey. This incorporated the whole spectrum of measures designed to promote worker safety, healthy lifestyles and well-being, for example, training in injury prevention, promoting healthy food choices and lifestyles, interventions to give up smoking and services such as counselling.
At the time of interview, an average of six health and well-being initiatives were reported as having been provided by employing organisations within the previous 12 months, with a higher than average number observed among employees of larger organisations (with over 250 employees). The most commonly provided measures were more than 20 days’ holiday (excluding bank holidays) and employer pensions.
6.2 Flexible workingFlexible working is generally upheld as a positive working practice and the survey explored how many employees worked for organisations that offered flexible working practices, such as flexi-time, working from home, job sharing and the ability to change hours, work condensed hours or change working patterns.
Over half of respondents (57 per cent) said that flexible working practices operated in their organisation, and this was more likely to be the case among employees of larger organisations and those in the public sector. The presence of flexible working practices was found to positively associate with several other aspects of the employee experience, raising the question of whether the provision of flexible working practices may have an ameliorating effect on employees’ views of their employer.
50 http://www.dwp.gov.uk/health-work-and-well-being/our-work/public-sector-exemplar/51 http://www.dwp.gov.uk/docs/hwwb-improving-health-and-work-changing-lives.pdf. Op cit
Conclusions
46
6.3 Stress managementThe survey provided evidence that steps were being taken to manage stress in the workplace, both at an organisation-wide level and at the individual level. For example, 32 per cent of respondents said that stress management support or advice was provided to employees and/or managers within their organisation. At the level of individual experience, around a third of respondents with a line manager or supervisor (34 per cent) agreed that this person had talked to them about avoiding stress at work, and just under half of line managers themselves (45 per cent) reported that they had received information, help or advice on managing stress among their employees.
Again, large employers, public sector organisations and those with a trade union presence performed well, with interventions regarding stress management more prevalent in these workplaces.
6.4 Attendance managementAttendance management programmes were examined in terms of measures to support employees returning to work after illness or injury and adjustments made to jobs to enable people to stay in work.
There was evidence that employees with continuous sickness absence of five or more days had received help via these support measures, and the most common interventions related to reduced working days or hours, or changed duties or workloads. In the case of return to work initiatives, such practices were found to be more prevalent in the public sector.
6.5 Sickness absence In addition to meeting its key objectives, the survey has also furthered the debate about sickness absence among employees. The finding of the 2005 Survey of Workplace Absence Sickness and Health (SWASH)52 survey (in which higher than average levels of sickness absence in the public sector were largely explained away by controlling for demographic factors) has not been replicated in the current Employee Survey. This may be due to the smaller sample size or it may reflect the timing of the survey, which coincided with an economic downturn which initially impacted on the private sector (and may, therefore, have resulted in private sector workers being less inclined to take time off due to sickness). It will be interesting to explore to what extent the planned public sector cuts impact on sick leave within the public sector, and whether this has the effect of minimising the discrepancies observed in relation to sickness absence in the private and public sectors in this survey.
6.6 Next stepsIt has always been Health, Work and Well-being Strategy Unit’s (HWWB’s) intention to repeat the employee survey and, by tracking key measures over time, inform the extent to which the well-being agenda is being embedded among employers and reaching those at the frontline, i.e. employees. The challenge going forward will be to transfer examples of best practice from larger organisations to Small and Medium Sized Enterprises (SMEs), which are often less able to invest in health and well-being interventions. However, SMEs may have an advantage over larger organisations, in that their less formal structures of communication and reduced layers of ‘remote’ senior management appeared to result in more positive views of senior managers.
52 Op cit
Conclusions

47
The findings from this research suggest that the health and well-being agenda should, therefore, continue to focus on the business case for the promotion of a positive organisational culture featuring supportive colleagues, senior managers visibly demonstrating integrity and good relations between managers and staff, as well as the provision of objective measures of support, particularly flexible working options.
In terms of additional activities, this report is the first output from the employee survey. Further analyses of the employee dataset are currently underway, led by HSE, who are, in tandem, exploring the findings from a survey which considers line managers’ views of their team’s quality of working life.
HWWB has commissioned a further survey which will present evidence from the employer perspective about the extent to which health and well-being is a priority for organisations and the types of initiatives and benefits in place. This survey also looks in more detail at the nature of sickness absence within organisations and the extent to which employers offer occupational sick pay to their workforces.
As well as providing data to support the government’s commitment to monitoring employee health and well-being at work, the surveys provided evidence that may be of interest to policy makers responsible for the promotion of good work (linking to health outcomes) and employee engagement, as illustrated by the recommendations of the Marmot Review53 and Macleod Review54 respectively.
53 Op cit.54 Op cit.
Conclusions
48
Appendix A Other questions relating to health The survey contained a number of questions about health behaviours as well as collecting data on height and weight. All these questions were posed using Computer Aided Self Interviewing (CASI), i.e. the respondent had privacy when supplying their answers. Nonetheless, it is recognised that respondents tend to underestimate some behaviours (e.g. alcohol consumption, numbers of cigarettes smoked) and overestimate other behaviours (e.g. level of exercise, content of diet), and this should be taken into account when considering the findings.
A.1 Body mass indexBody mass index (BMI) is a statistical measurement which compares a person’s weight and height; this tool is widely used to estimate a healthy body weight based on how tall a person is. BMI is calculated using the following equation:
BMI = weight (kg) Height² (metres²)
Once the BMI score has been calculated, a person is assigned to a weight category dependent on their score.
In the survey, respondents were asked to enter their height and weight into the laptop, in private, and a BMI score was calculated for each respondent who provided details on both measures. Table A.1 summarises the results.
Almost half of respondents (43 per cent) fell within the ‘ideal’ BMI category. However, just over a third (35 per cent) were ‘overweight’ and a further 16 per cent were ‘obese or very obese’.
Table A.1 Summary of scores for BMI
BMI description1 BMI score (%)Underweight (under 18.5) 1Ideal (18.5 to less than 25) 43Overweight (25 to less than 30) 35Obese (30 to less than 40) 14Very obese (40 or over) 2
Base: All (unweighted base 2,019). Note: ‘not stated’ not shown (five per cent).1 Categories taken from the NHS Choices website, see
http://www.nhs.uk/chq/pages/3215.aspx?categoryid=52&subcategoryid=143
In terms of gender, males were significantly more likely than females to be overweight (42 per cent compared with 28 per cent). Females were significantly more likely to have an ideal BMI (50 per cent compared with 36 per cent).
Appendices – Other questions relating to health
49
Those who suffered from a long-term health condition were significantly more likely than other respondents to be obese (19 per cent compared with 12 per cent). In line with this, those who do not suffer any long-term health condition were significantly more likely than those who do to have an ideal BMI (47 per cent compared with 36 per cent).
It should be noted that unless exact measurements are made by interviewers, it is known that respondents will underestimate their weight and overestimate their height. There was not scope for interviewer-administered measurement in the QWL Employee Survey. However, to set the results in context, the following table summarises the findings from the 2008 Health Survey for England (filtered so that the data corresponds to our survey population), in which height and weight measurements were taken by a nurse.
Table A.2 Summary of scores for body mass index, Health Survey for England, 200855
BMI description BMI score (%)Underweight (under 18.5) 1Ideal (18.5 to less than 25) 35Overweight (25 to less than 30) 38Obese (30 to less than 40) 24Very obese (40 or over) 2
Base: Those aged 16+ in paid employment, working at least seven hours a week (excluding self employed).
From this, it is clear that there are clear differences between the Employee Survey and a survey that uses exact measurements. For example, in the Employee Survey, 43 per cent of respondents had an ‘ideal’ BMI, but in the Health Survey for England, just 35 per cent of employees fell in this range. Further, whilst 16 per cent of respondents in the Employee Survey were obese, the corresponding figure from the Health Survey for England was 26 per cent.
A.2 Exercise and physical activityWithin the self-completion section of the survey, a number of questions were asked about the type and amount of exercise and physical activity that respondents did in a typical week.
Put in the context of doing an activity to ‘thepointwhereyouareslightlysweaty,breathingfasterthanusualandyourheartisbeatingfaster’ respondents were asked which activities they did in a typical week. The majority did at least one activity in a typical week and 12 per cent did none. The most popular activity was brisk walking (50 per cent), followed by other exercises (e.g. keep fit, aerobics, weight training) (23 per cent) and jogging/running (19 per cent).
Taking all of the activities they did together, respondents were asked how many times in a week they usually did these activities, again to ‘thepointwhereyouareslightlysweaty,breathingfasterthanusualandyourheartisbeatingfaster’. The majority of respondents who did at least one activity said that they did this more than three times a week (69 per cent) (see Figure A.1). Four per cent of respondents said that they did an activity less than once a week. No significant differences were
55 Health Survey for England, 2008 (see http://www.ic.nhs.uk/statistics-and-data-collections/health-and-lifestyles-related-surveys/health-survey-for-england). It should be noted that the findings are for England only, whereas the Employer Survey covered Great Britain.
Appendices – Other questions relating to health

50
detected when the following analysis variables were considered: age, gender, the presence of a long-term health condition and income.
Figure A.1 Frequency of employee physical activity (%)
A.3 Smoking prevalenceAround a quarter of respondents were smokers: 23 per cent smoked cigarettes/hand rolled cigarettes and a further two per cent smoked in another form. This was slightly higher than the national average of 22 per cent that was recorded on the Health Survey for England, conducted in 200856.
Age had an impact: those aged 16-44 more likely to smoke than those aged 55+. Smoking prevalence could also be linked to income, with those in the top annual income brackets significantly less likely than those earning £20,799 or less per annum to smoke (see Figure A.2).
56 Health Survey for England, 2008 (see http://www.ic.nhs.uk/statistics-and-data-collections/health-and-lifestyles-related-surveys/health-survey-for-england). It should be noted that the findings are for England only, whereas the Employer Survey covered Great Britain.
0 5 10 15 20 25
Don't know
Rarely or never
Less than once a week
Once a week
Twice a week
Three times a week
Four times a week
Five times a week
Six or more times a week 18
15
14
22
16
10
3
1
1
Base: those who, in a typical week, do activities to the point where they are slightly sweaty, breathing faster than usual and their heart is beating faster (unweighted base: 1,763).
Appendices – Other questions relating to health
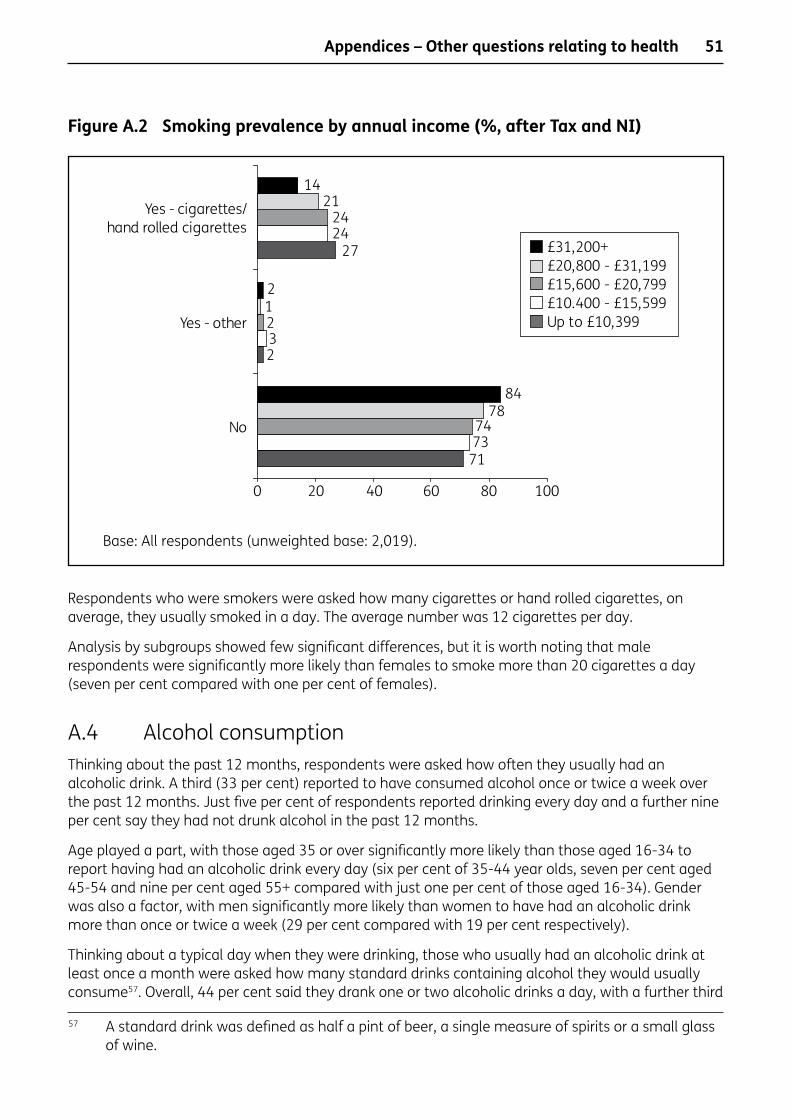
51
Figure A.2 Smoking prevalence by annual income (%, after Tax and NI)
Respondents who were smokers were asked how many cigarettes or hand rolled cigarettes, on average, they usually smoked in a day. The average number was 12 cigarettes per day.
Analysis by subgroups showed few significant differences, but it is worth noting that male respondents were significantly more likely than females to smoke more than 20 cigarettes a day (seven per cent compared with one per cent of females).
A.4 Alcohol consumptionThinking about the past 12 months, respondents were asked how often they usually had an alcoholic drink. A third (33 per cent) reported to have consumed alcohol once or twice a week over the past 12 months. Just five per cent of respondents reported drinking every day and a further nine per cent say they had not drunk alcohol in the past 12 months.
Age played a part, with those aged 35 or over significantly more likely than those aged 16-34 to report having had an alcoholic drink every day (six per cent of 35-44 year olds, seven per cent aged 45-54 and nine per cent aged 55+ compared with just one per cent of those aged 16-34). Gender was also a factor, with men significantly more likely than women to have had an alcoholic drink more than once or twice a week (29 per cent compared with 19 per cent respectively).
Thinking about a typical day when they were drinking, those who usually had an alcoholic drink at least once a month were asked how many standard drinks containing alcohol they would usually consume57. Overall, 44 per cent said they drank one or two alcoholic drinks a day, with a further third
57 A standard drink was defined as half a pint of beer, a single measure of spirits or a small glass of wine.
0 20 40 60 80 100
No
Yes - other
Yes - cigarettes/hand rolled cigarettes
£31,200+£20,800 - £31,199£15,600 - £20,799£10.400 - £15,599Up to £10,399
1421
2424
27
21232
8478
7473
71
Base: All respondents (unweighted base: 2,019).
Appendices – Other questions relating to health
52
(31 per cent) saying three or four, 20 per cent reported consuming between five and nine drinks, and just five per cent said ten drinks or more.
Levels of drinking decreased with age: those aged 25 and older were significantly more likely than those aged 16-24 to drink just one or two alcoholic drinks in a typical day, and those aged 44 or under were significantly more likely than their older counterparts to drink ten or more alcoholic drinks in a typical day. Gender influenced the findings: men were significantly more likely than women to consume seven or more standard drinks in a typical day when they were drinking (18 per cent compared with four per cent respectively).
A.5 Diet: fruit and vegetable intakeThe survey asked how many portions of fruit and vegetables were usually eaten on a typical day. A quarter (26 per cent) of respondents reported that they ate the recommended five or more portions a day. There were no gender differences in the findings, but there was a clear trend that older respondents were more likely than younger employees to say that they ate five or more fruit and vegetables on a typical day.
Appendices – Other questions relating to health

53
Appendix B Further details on method B.1 The HSE and HWWB quality of working life employee surveyHealth and Safety Executive (HSE) has long recognised that safeguarding and promoting the health and safety of employees required the examination of ‘softer’ aspects of the workplace experience (for example, the experience of actually doing a job, cultural aspects of an employing organisation and relationships with co-workers), as well as the ways in which specific risks are assessed and controlled in the workplace.
HSE hypothesised that improved management of these aspects of working life may result in a variety of better outcomes for employees. In 2008, GfK NOP was commissioned to develop a ‘quality of working life’ survey of employees to explore the relationships between a wide range of aspects of working life, objective measures of employee support (e.g. working practices) and specific factors of interest including the incidence of sickness absence, employee retention, employee engagement, presentee-ism and the mental58 and physical health of employees. In summary, HSE’s specific objectives for the survey were to:
• measure objective factors about employees’ working lives, e.g. whether they were offered flexible working, other benefits provided, etc;
• measure subjective issues, e.g. attitudes towards working with line managers and colleagues, views on the culture of the employing organisation;
• explore the links between the objective and subjective measures and specific items of interest, such as mental and physical health, the incidence of sickness absence, presentee-ism, employee engagement and retention.
The initial thoughts regarding the shape of the survey emerged from HSE’s analysis of the third wave of the Fit3 employee survey data (described more fully in Section B.7). This suggested that nine statements to do with the quality of working life were associated with key employee attitudes or behaviours, e.g. sickness absence, retention, engagement. This provided a basis for the section of the survey devoted to the quality of working life variables (Section B of the questionnaire).
As already detailed, the Health, Work and Well-being Strategy Unit (HWWB’s) motivation for the survey was driven by the government’s response to Dame Carol Black’s review59, in which an indicator of progress was ‘improving the promotion of better health and well-being at work’. The Employee Survey was, therefore, designed to collect baseline data to support this indicator and its sub-components, as well as provide evidence of other objective measures of support provided by employers and to measure incidence of sickness absence, well-being, retention and employee engagement.
58 Presentee-ism: when someone who is ill goes to work when they should have taken sickness absence.
59 Op cit.
Appendices – Further details on method

54
B.1.1 Questionnaire developmentIn developing the questionnaire, GfK NOP worked closely with the project teams at HSE and HWWB. Many of the questions used in the survey had provenance, having been used in other surveys (e.g. Fit3, the Workplace Employment Relations Survey, the Labour Force Survey, etc). The new material developed was tested using a substantial three-stage piloting exercise consisting of 60 interviews in total.
During the first pilot phase, all interviewers were personally briefed by the executive team before going out into the field. To ensure that all the areas covered in the questionnaire were relevant and that there was consistent understanding of the issues discussed in the interview, the first stage included a cognitive element, and the team was instructed to administer a series of probing questions after the survey had been administered.
The cognitive element of the pilot aimed to provide greater understanding in terms of what respondents thought certain questions to mean, what processes they followed when answering certain questions (i.e. how they came to their answer) and the ease of use of different versions of scales used in the survey, and a mixture of proactive and reactive approaches were used. Two of the interviewing team were accompanied by members of the executive team who took the lead during the cognitive probing.
All interviewers working on the pilot were debriefed face to face by the executive project team and the resulting feedback led to a number of changes to question wording and the questionnaire structure, which were tested in a second pilot phase. Again a process of debriefing took place and further changes to survey questions were agreed with the clients. These final changes were tested by way of a small, third pilot.
Over the course of the three pilot stages, 60 interviews were undertaken with respondents living in areas deemed to be either ‘white collar’ or ‘blue collar’; a range of respondent ages and genders were covered to ensure that the survey was understood across all groups of employees. The first and second pilot stages took place in a variety of geographical locations across Great Britain.
The final questionnaire averaged 35 minutes in length and comprised five sections, one of which included a self completion sub-section (questions C22 to C37) during which the interviewer handed their laptop to the respondent to input their answers in private. A copy of the questionnaire is provided in Appendix F.
B.1.2 The Quality of Working Life statementsA series of 57 agreement statements were designed under nine categories; all were answered using a five point agreement scale: strongly agree, tend to agree, neither agree nor disagree, tend to disagree and strongly disagree. For reference the statements used are summarised in the following table.
Appendices – Further details on method

55
Table B.1 Quality of Working Life (agreement) statements
Actual Work Feelings about employing organisationI never seem to have enough time to get my work done
The organisation fails to reward extra effort by staff
I can decide when to take a break during my working day
I share the values of the organisation I work for
I am pressured to work long hours This organisation inspires my confidenceI have a choice in deciding what I do at work This organisation lacks a clear vision for the futureI can make my own decisions about how I do my work
This is a fun place to work
The pace of my work is too fast I can ask questions about change at workI know how to go about getting my job done I am consulted about changes in my workplace that
affect meI understand how my work contributes to the objectives for my organisation
There are poor relations between managers and employees in this organisation
I am unclear about what’s expected of me at work When changes are made at work, I am unclear how they will affect me
I do not have the right resources or equipment to do my job
There are few opportunities for me to learn and grow within this organisation
I am gaining valuable experience in my job Relationship with line manager/supervisor Relationship with senior managersGive you help and support Are difficult to communicate withGive constructive feedback on the work you do Show they listen to junior staffExpect you to work too hard Fail to seek the views of staffShow they care about you as a person Respond to suggestions from staffAre unwilling to listen to your problems Treat employees unfairlyEncourage you at workTreat you unfairlyEncourage you to develop your skillsHave talked to you about avoiding stress at workPhysical environment Balance between home and work lifeMy workspace is badly designed for the work that I do
My personal life suffers because of my work responsibilities
I find it comfortable to work in the physical environment where I usually do my job
Work stops me from spending as much time as I’d like with family or friends
This is a physically unsafe place to work I never worry about my work outside working hoursPhysically, it is a healthy place to work I can choose when I take time off workI can adapt my workspace to suit my needs My work suffers because of responsibilities in my
personal lifeGetting on with others in organisation Getting on with those outside the organisationI get the help and support I need from colleagues at work
They are often unreasonable
I am subject to unkind words or behaviour at work They give me feedback about my workThere is friction or anger between colleagues at work They appreciate the work I doI enjoy good relations with my work colleagues My colleagues are unwilling to listen to my work related problems
Continued
Appendices – Further details on method

56
Table B.1 Continued
Getting on with staff they manage or superviseMy staff are difficult to manageMy staff give me positive feedbackMy staff are unwilling to share their problems with meI have enough time to manage my staff
B.2 Sampling The survey used a clustered, two-stage probability sample design, with Lower Super Output Areas (LSOAs) as the Primary Sampling Unit (PSU).
A total of 200 points were drawn across Great Britain, each with 48 or 56 addresses selected (the latter related to points in London where more ‘deadwood’, e.g. empty properties, and lower response rates were anticipated). In total, 9,800 addresses were selected.
All selected addresses were enumerated and one eligible adult was selected at random from each screened household (one adult, rather than more than one, was chosen to reduce clustering effects in the data). The eligibility criteria for inclusion were:
• aged 16+ but no upper age limit;
• in paid employment for seven or more hours across a week (not necessarily in one continuous shift);
• is employed rather than self-employed60;
• works for an organisation where two or more people are employed;
• employed by an organisation rather than directly by a private household;
• been in work during the preceding month.
B.3 Fieldwork Interviewing took place in people’s homes and was undertaken by GfK NOP’s interviewing field force between October and December 2009. All of the fieldworkers working on the study were fully trained and Interviewer Quality Control Scheme (IQCS)61 qualified and all attended a formal briefing given in person by members of the GfK NOP executive team. This briefing covered the background to the survey, the content of the questionnaire, how to make contact with respondents, as well as methods of maximising response and avoiding refusals. All interviewers were taken through the survey during the briefing by the project team so that they understood the routes through the survey and the nature of the topics covered.
60 Self employed was defined as where the individual was responsible for tax and National Insurance contributions, i.e. telling HM Revenue & Customs (HMRC) about their income by filling in a Self Assessment tax return.
61 IQCS, op cit.
Appendices – Further details on method

57
All sampled addresses were sent a letter prior to data collection, explaining the survey and providing details of who to contact if there was no-one working in that household (i.e. to opt out) or if there were any queries regarding the survey. This freephone number was managed by GfK NOP.
All interviewers were issued with an interviewing pack containing contact sheets for all selected addresses in their point. Each was printed with full address details. Following the advance mailing, interviewers were informed if any of their sampled addresses were not eligible for the survey or had refused to take part on the basis of contact via the freephone number.
The remaining addresses per point were screened by the interviewing team. In the small minority of cases where more than one dwelling unit was found at the selected address, interviewers chose one dwelling unit at random using a Kish selection grid62. Similarly, in a small minority of cases, within a dwelling unit some interviewers found more than one household. In such cases, it was also necessary to select one household at random using a Kish selection procedure.
Once the household for inclusion had been determined, the interviewer established eligibility for the survey using a series of questions on the contact sheet; where more than one adult was eligible for interview (on the basis of the criteria listed in Section B.2), a Kish selection procedure was followed; no substitutions were permitted.
Once they had established who should take part in the survey, interviewers were instructed to make at least six attempts to contact the respondent, recording their call pattern on the contact sheet. All calls were spread over at least a 21 day period and over different times of the day and the weekend. Given the nature of the sample, most interviewing took place during evenings and weekends in order to maximise response; as a minimum, interviewers were instructed to make at least two calls on a weekday evening after 6pm and at least two calls at the weekend.
Where interviewers encountered a household where no one spoke English they made use of a language card to establish which language was spoken by the household. The language card contained a list of languages and the householder was able to point to which language on the card they wished to use; this was recorded on the contact sheet. If an interviewer was able to speak this preferred language, they were instructed to continue with the interview, translating in real time. Otherwise, they were permitted to use another adult, friend or neighbour to translate.
In addition to filling out details on the paper contact sheets, all interviewers were instructed to update the GfK NOP field department on a daily basis by means of the Electronic Sample Management System (ESMS). This system is effectively a copy of the paper contact sheet and allowed the field department and the executive team to monitor progress across all points during the data collection period.
All contact sheets contained a final outcome grid; in this interviewers were instructed to code the outcome for that household (e.g. interview, refusal, no contact, empty property, etc).
Copies of the advance letter and contact sheets are provided in Appendix F.
B.4 ResponseIn total, 2,019 interviews were achieved with paid employees. Screening data was obtained from just over eight in ten occupied residential addresses and full interviews took place in 60 per cent of households where someone was eligible for the survey. It should be noted that this is a much harder
62 A widely used technique in survey research, whereby interviewers who have been issued with a sample of household addresses can make a random selection of a dwelling or individual on the doorstep. Each selection follows simple and rigorous rules: a list of eligible units (dwellings or individuals) is made, consistently ordered (e.g. in the case of individuals, by age or in alphabetical order of first name), and the selection is made by comparing the total number of units against a pre-printed list of randomly generated numbers. The system is devised so that all units have an equal chance of selection.
Appendices – Further details on method

58
group to research than an all-adult sample, as the latter includes households that are easier to reach, such as pensioners and workless households.
Two response rates have been calculated for the study. Table B.2 shows the screening response rate: an adjusted response rate of 79 per cent was achieved. Table B.3 shows the adjusted response rate for the main interview, which was 60 per cent.
Table B.2 Screening response rate
Addresses issued 9,800Total invalid addresses (deadwood) 570Property vacant 288Not found – no trace of address 103Non residential property 89Property demolished/ derelict 66Institution – no private household 21Property not yet built 3Valid addresses 9,230 100%
Did not complete screening questionnaire
Away during fieldwork 68 0.7%
Entry to block or scheme refused 26 0.3%Mother tongue interviewer required 35 0.4%Occupied, non contact at address after 6+ calls 325 3.5%Occupier in but not answering door after 6+ calls 53 0.6%Other 160 1.7%Official refusal/ unknown reason for withdrawal 137 1.5%Refused before working out number of eligible respondents 892 9.6%Too ill to participate 20 0.2%Unsure if occupied, no contact after 6+ calls 253 2.7%Completed screening questionnaire 7,261 79%
Table B.3 Main interview response rate
7,261 100%Ineligible households 3,896 54%Eligible households 3,365 46% 100%
Refused/non contact 1,346 40%Successful interview 2,019 60%
B.5 Data edits
B.5.1 Interview responsesIt was necessary to perform some edits on the data as follows:
• The question concerning the sector people worked in required a degree of editing due to some misinterpretation, for example there were cases of people who worked in supermarkets saying they were part of the public sector.
Appendices – Further details on method

59
• Seven respondents said they worked less than seven hours in their job each week at question A12. As one of the eligibility criteria for the survey was that someone must work seven hours across a week, these respondents’ answers were removed from the data.
B.5.2 Screening information In a small minority of cases, interviewers were required to randomly select a dwelling and/or household in which to do an interview (see Section B.3). When this was required, checks were made, in conjunction with the field department, to ensure that the interviewer was making the correct assumptions about the number of dwellings and/or households that they found at that particular address.
B.6 Weighting
B.6.1 Initial weighting stagesThe survey data were weighted to correct for probability of selection (in some households more than one adult would have been eligible for interview), and secondly, to ensure the data were representative of paid employees in GB aged 16+. For the latter, HSE provided GfK NOP with Labour Force Survey (LFS) statistics from Quarter 3 of 2009 (the latest available statistics at the time of weighting). The statistics were filtered on those aged 16+ in paid employment in Great Britain, excluding self employed. The following key measures were provided in order to weight the survey results:
• Country and standard region England.
• Gender by age.
• Standard Industrial Classification of economic activities 2003 (at section level).
• Hours worked across a week.
Details of the unweighted and weighted profiles of the survey respondents may be found later in the appendices.
B.6.2 Final weighting stage The final weight applied to the data was a design weight to take into account the clustering effect of the sample design. This was calculated by dividing the actual variance by the theoretical variance from a simple random sample, where the actual variance is calculated by:
For the QWL Employee Survey, the design weight was 2.09.
GfK NOP, London, March 2011, Job no. 451514, page 68
9.6 WEIGHTING
9.6.1 Initial weighting stages The survey data were weighted to correct for probability of selection (in some households more than one adult would have been eligible for interview), and secondly, to ensure the data were representative of paid employees in GB aged 16+. For the latter, HSE provided GfK NOP with Labour Force Survey (LFS) statistics from Quarter 3 of 2009 (the latest available statistics at the time of weighting). The statistics were filtered on those aged 16+ in paid employment in Great Britain, excluding self employed. The following key measures were provided in order to weight the survey results:
Country and standard region England Gender by age Standard Industrial Classification of economic activities 2003 (at section level) Hours worked across a week
Details of the unweighted and weighted profiles of the survey respondents may be found later in the appendices.
9.6.2 Final weighting stage The final weight applied to the data was a design weight to take into account the clustering effect of the sample design. This was calculated by dividing the actual variance by the theoretical variance from a simple random sample, where the actual variance is calculated by:
For the QWL Employee Survey, the design weight was 2.09.
9.7 USE OF FIT3 DATA IN THE QUESTIONNAIRE DESIGN
A short module of questions on the quality of working life (QWL) was included in the final wave of the HSE’s Fit3 employee survey55. The aim was to assess which dimensions of the workplace experience were associated with key findings for employees, namely:
Retention Sickness absence Presentee-ism Being relaxed (as a proxy for good mental well-being) Doing one’s best (used as a proxy for engagement)
A series of questions were devised, drawing on existing surveys, including a battery of nine statements about the quality of working life, as follows:
Please can please can you tell me how you feel about each of the following things? (Response scale: very negative, quite negative, neither negative or positive, quite
55 Op cit.
Appendices – Further details on method
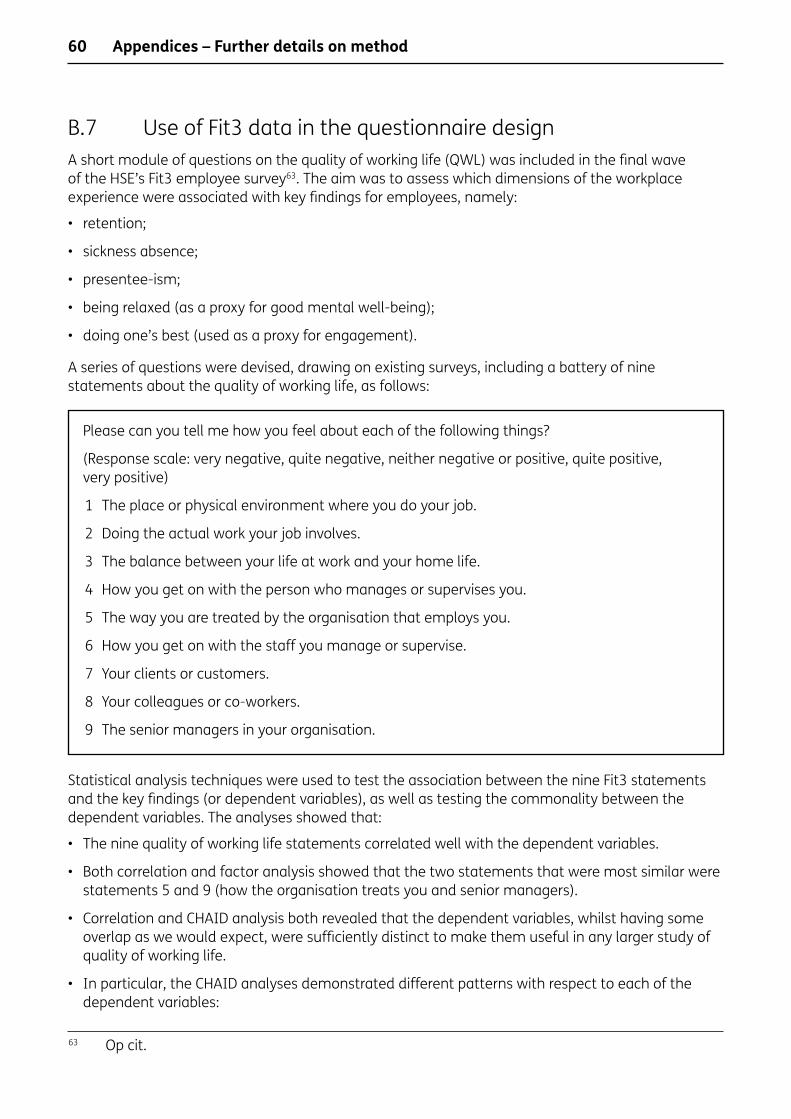
60
B.7 Use of Fit3 data in the questionnaire designA short module of questions on the quality of working life (QWL) was included in the final wave of the HSE’s Fit3 employee survey63. The aim was to assess which dimensions of the workplace experience were associated with key findings for employees, namely:
• retention;
• sickness absence;
• presentee-ism;
• being relaxed (as a proxy for good mental well-being);
• doing one’s best (used as a proxy for engagement).
A series of questions were devised, drawing on existing surveys, including a battery of nine statements about the quality of working life, as follows:
Please can you tell me how you feel about each of the following things?
(Response scale: very negative, quite negative, neither negative or positive, quite positive, very positive)
1 The place or physical environment where you do your job.
2 Doing the actual work your job involves.
3 The balance between your life at work and your home life.
4 How you get on with the person who manages or supervises you.
5 The way you are treated by the organisation that employs you.
6 How you get on with the staff you manage or supervise.
7 Your clients or customers.
8 Your colleagues or co-workers.
9 The senior managers in your organisation.
Statistical analysis techniques were used to test the association between the nine Fit3 statements and the key findings (or dependent variables), as well as testing the commonality between the dependent variables. The analyses showed that:
• The nine quality of working life statements correlated well with the dependent variables.
• Both correlation and factor analysis showed that the two statements that were most similar were statements 5 and 9 (how the organisation treats you and senior managers).
• Correlation and CHAID analysis both revealed that the dependent variables, whilst having some overlap as we would expect, were sufficiently distinct to make them useful in any larger study of quality of working life.
• In particular, the CHAID analyses demonstrated different patterns with respect to each of the dependent variables:
63 Op cit.
Appendices – Further details on method

61
– Satisfaction with work/life balance was a predictor for all the dependent variables except sickness. However, only for presentee-ism was it the chief discriminator.
– The way employees were treated by the organisation appeared in all models, though again with varying levels of importance.
– How you feel about your manager uniquely appeared as a second level predictor in the CHAID tree for retention, whereas physical environment appeared as low level predictors for retention and being relaxed. However, for sickness it was the main predictor (in a model which is generally difficult to predict).
– Doing the actual work your job involves was a middle-level predictor for retention and being relaxed, but it was the main predictor for doing one’s best.
• The correlations of the main QWL statements with the ‘stress outside work’ question showed extremely weak correlations between the two, although they were universally in the same direction, indicating that all the variables were mildly positively associated with less stress outside work. The strongest correlation was between work/life balance, indicating that respondents who were happy with their work/life balance were less likely to experience stress outside of work (although we cannot infer causality). The correlations with the existing outcome measures were also generally weak. The strongest was being relaxed. This indicated that less stress outside work was associated with being relaxed at work. There was also some weak negative association with presentee-ism.
• As discussed above, the factor analysis was conducted with the aim of determining whether any of the nine questions were measuring the same dimension and, hence, prime candidates for being combined. Using the number of eignevalues64 as a guide for the number of underlying dimensions, we arrived at two, one being mainly correlated with senior management and supervisors and the other being connected with colleagues, clients, suppliers and subordinates. However, there were a number of statements (e.g. physical environment) which didn’t fit well into either. When forcing a nine-factor solution, every statement fitted neatly into a factor of its own (which isn’t invariably the case with factor analysis) and had a high factor loading. This indicated that all of the nine statements were uncorrelated with each other. As discussed above, and consistent with the findings from the other analyses (such as the correlation), this indicates that they were all measuring valid and distinct dimensions.
64 Eigenvalues are a statistical measure used in the context of factor analysis to determine the degree of extra variation explained by creating an additional factor. Traditionally, if the eigenvalue associated with a particular factor solution is greater than one, this could indicate that there is a disproportionate amount of extra variation that could be explained by creating an additional factor. However, an eigenvalue of less than one could indicate that the ‘cost’ of creating an additional factor outweighs the extra variation being explained. Therefore, we tend to think of a statistically optimum solution as occurring when the number of eigenvalues just exceeds one. (However, this is not always necessarily the most interpretable solution.)
Appendices – Further details on method

62
Appendix C Sample profileThis section of the report looks at the weighted profile of the sample, in terms of organisation and personal characteristics. At the data processing stage, the data was weighted to ensure the sample was representative of the employee population, as reflected in the latest Labour Force Survey profiles.
Table C.1 Sample profile: organisational characteristics
GroupUnweighted
nWeighted
nWeighted
%Type of organisation A private sector business 1,274 1,309 65A public sector business 661 633 31A voluntary/not for profit organisation 71 66 3Organisation sizeSmall (1-50) 474 469 23Medium (51-249) 225 215 11Large (250-499) 107 100 5Very large (500+) 1,131 1,159 57Establishment sizeSmall (1-50) 1,007 1,024 51Medium (51-249) 486 485 24Large (250+) 515 502 25Presence of Trade Union in organisationsYes 1,020 1,020 51No 834 834 41Standard Occupational Classification (soc)Managers and Senior Officials 299 287 14Professional Occupations 283 275 14Associate professional and technical occupations 320 320 16Administrative and secretarial occupations 257 251 12Skilled trades occupations 161 175 9Personal service occupations 190 167 8Sales and customer service occupations 154 186 9Process, plant and machine operatives 138 129 6Elementary occupations 214 225 11
Continued
Appendices – Sample profile
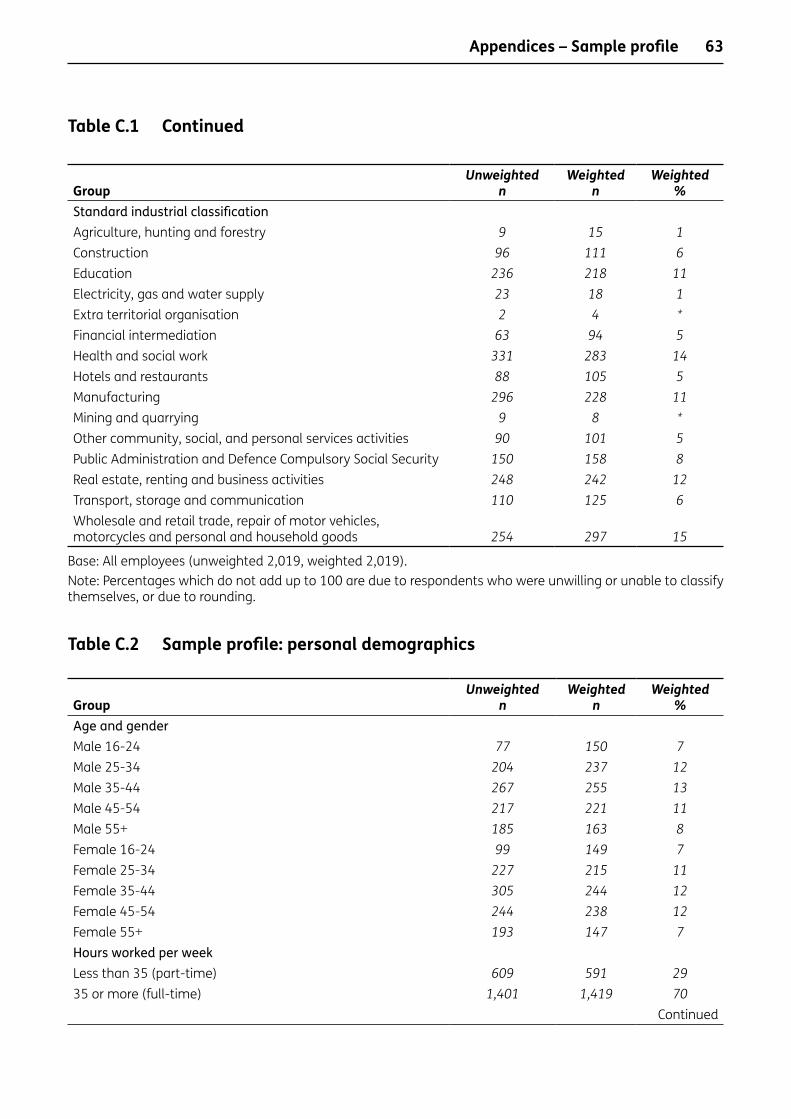
63
Table C.1 Continued
GroupUnweighted
nWeighted
nWeighted
%Standard industrial classificationAgriculture, hunting and forestry 9 15 1Construction 96 111 6Education 236 218 11Electricity, gas and water supply 23 18 1Extra territorial organisation 2 4 *Financial intermediation 63 94 5Health and social work 331 283 14Hotels and restaurants 88 105 5Manufacturing 296 228 11Mining and quarrying 9 8 *Other community, social, and personal services activities 90 101 5Public Administration and Defence Compulsory Social Security 150 158 8Real estate, renting and business activities 248 242 12Transport, storage and communication 110 125 6Wholesale and retail trade, repair of motor vehicles, motorcycles and personal and household goods 254 297 15
Base: All employees (unweighted 2,019, weighted 2,019).Note: Percentages which do not add up to 100 are due to respondents who were unwilling or unable to classify themselves, or due to rounding.
Table C.2 Sample profile: personal demographics
GroupUnweighted
nWeighted
nWeighted
%Age and genderMale 16-24 77 150 7Male 25-34 204 237 12Male 35-44 267 255 13Male 45-54 217 221 11Male 55+ 185 163 8Female 16-24 99 149 7Female 25-34 227 215 11Female 35-44 305 244 12Female 45-54 244 238 12Female 55+ 193 147 7Hours worked per weekLess than 35 (part-time) 609 591 2935 or more (full-time) 1,401 1,419 70
Continued
Appendices – Sample profile

64
Table C.2 Continued
GroupUnweighted
nWeighted
nWeighted
%Length of time in organisationLess than 1 year 12 269 131 to less than 2 years 12 276 142 to less than 5 years 23 485 245 to less than 10 years 430 404 2010 years or more 629 586 29Long-term health conditionYes 736 691 34No 1,283 1,328 66Annual income (net) per annumUp to £10,399 402 413 20£10,400-£15,599 371 393 19£15,600-£20,799 340 346 17£20,800-£31,199 404 387 19£31,200+ 324 308 15Caring responsibilitiesYes 269 252 12No 1,750 1,767 88Living with partnerYes 1,340 1,339 66No 679 680 34Dependent children in householdYes – aged 0 – 15 716 649 32Yes – aged 16+ 237 237 12No 1,155 1,217 60Government office regionEast 161 198 10East Midlands 160 157 8London 238 254 13North East 90 85 4North West 214 228 11Scotland 191 182 9South East 291 295 15South West 193 176 9Wales 96 93 5West Midlands 186 178 9Yorkshire and Humberside 199 174 9
Base: All employees (unweighted 2,019, weighted 2,019).Note: Percentages which do not add up to 100 are due to respondents who were unwilling or unable to classify themselves, or due to rounding.
Appendices – Sample profile
65
Appendix D Index calculationD.1 Warwick-Edinburgh Mental Well-Being Scale
65
Warwick-Edinburgh Mental Well-Being Scale (WEMWBS) is a 14 item scale of mental well-being covering subjective well-being and psychological functioning, in which all items are worded positively and address aspects of positive mental health. A shortened, seven item versions also exists; that version was used in the Employee Survey.
The scale is scored by summing responses to each item answered on a five point Likert scale. Each of the item responses in WEMWBS are scored from one (none of the time) to five (all of the time) and a total scale score is calculated by summing together the individual item scores. For the shortened version, the minimum scale score is therefore seven and the maximum is 35. WEMWBS has been validated for use in the UK with those aged 16 and above.
The question and seven statements used in the shortened version are:
Belowaresomestatementsaboutfeelingsandthoughts.Pleaseselecttheanswerthatbestdescribesyourexperienceofeachoverthelasttwoweeks.
(Responseoptions:noneofthetime,rarely,someofthetime,often,allofthetime)
• I’ve been feeling optimistic about the future.
• I’ve been feeling useful.
• I’ve been feeling relaxed.
• I’ve been dealing with problems well.
• I’ve been thinking clearly.
• I’ve been feeling close to other people.
• I’ve been able to make up my own mind about things.
In the Employee Survey, the average (mean) score was 26 out of 35; broadly speaking, the scores had a normal distribution.
D.2 Employee Engagement IndexThe index was based on that used by the Civil Service People Survey66 and was calculated using the responses to five agreement statements as follows:
• I am proud when I tell others I am part of this organisation.
• I would recommend this organisation as a great place to work.
• I feel a strong personal attachment to the organisation.
65 WEMWBS, op cit.66 Op cit.
Appendices – Index calculation

66
• My organisation inspires me to do the best in my job.
• My organisation motivates me to help it achieve its objectives.
It should be noted that the agreement scale used in the Employee Survey was a five point scale that used a ‘tend to’ phrase in order to harmonise with the rest of the survey, as follows: strongly agree, tend to agree, neither agree nor disagree, tend to disagree, strongly disagree.
The calculation of the index involved the following steps:
1 A value was assigned to each of the engagement question using the scale: strongly agree = 5, tend to agree = 4, neither = 3, tend to disagree = 2, strongly disagree = 1
2 For each respondent that answered all five engagement questions, an Employee Engagement Mean (EEM) score was calculated.
3 The EEM was converted into an Employee Engagement Score (EES) for each respondent using the following formula:
EMS = (EEM – 1) x 25
4 The Employee Engagement Index (EEI) was calculated as an average of engagement scores:
EEI = ∑EES
n
5 Individuals who did not respond to all five engagement questions had their EEM and EES coded as a missing values and were excluded from the EEI calculations.
Appendices – Index calculation

67
Appendix E Approach to multivariate analysis As an additional exercise, GfK NOP undertook more detailed analysis of the Employee Survey data to seek to understand what aspects of an employee’s experience of work were associated with certain findings, namely sickness absence, well-being, engagement and retention. These analyses were exploratory and may be useful in pin pointing areas for exploration in the future.
It should be noted that the findings cannot be said to infer causality; we are merely identifying variables that associate with the items of interest.
E.1 First stage of analysisIn consultation with the Health, Work and Well-being Strategy Unit (HWWB) project team, the dependent variables and other key metrics were isolated:
Step 1: The dependent variables were identified as:
• C15 Days in total off work from current job due to sickness/injury;
• C35 Well-being;
• B5: Employee engagement;
• C2/C3 Thought about leaving/applied for another job.
Other key metrics:
• D6: Pay during sickness absence;
• D2: Does organisation provide flexible working practices?
• D3/D4: Health and well-being initiatives provided (count);
• D5: Take up of health and well-being initiatives (count);
• B12. Received advice on how to manage stress among employees?
Step 2: A factor analysis of the Section B statements was conducted (excluding B5, the employee engagement questions). We also included question D1 (perception of salary). This was in order to reduce the dimensionality of the Section B statements using a data-driven approach. The following factors were isolated:
• Factor 1: Senior managers listen and deliver.
• Factor 2: Good line manager.
• Factor 3: Poor work/life balance.
• Factor 4: Good physical environment.
• Factor 5: Inspiring organisation.
Appendices – Approach to multivariate analysis
68
• Factor 6: Poor personal relationships at work.
• Factor 7: Autonomous at work.
• Factor 8: Understand my role.
• Factor 9: Paid fairly.
• Factor 10: Get good feedback as a manager.
• Factor 11: Good client/customer contact.
• Factor 12: Customers unreasonable.
This factor solution represented 56 per cent of the variance explained in the 61 statements. This is broadly what we would expect for a factor analysis comprising this many input variables.
Step 3: Initially a correlation analysis was performed between, firstly, all the dependent variables and other key metrics (referenced at step 1) with all the statements and all the factors (referenced at step 2). The purpose of this was to give us an indication of the strength and direction of association between the statements and these metrics. This was retained for reference during the remainder of the analysis.
A correlation analysis was also performed between all the dependent variables with themselves, again to allow us to examine patterns of relationships between all these metrics. In particular, it allowed us to form a view about the potential similarities between certain metrics and allow for this in the second stage of our analysis.
E.2 Second stage of analysisThe CHAID technique was used to identify variables that influenced the four key dependent variables (sickness absence, employee engagement, well-being and propensity to leave). This technique was chosen since it can capture relationships that standard linear models do not easily or automatically handle, such as complex interactions.
One of the chief deficiencies of CHAID as a method is that it only picks the most predictive variable at each stage of the tree. Hence, it is possible that a very predictive variable, which happens to be closely associated with another which ends up being selected in the model, fails to appear.
The way around this is to run multiple models where either the most predictive variable is stripped out, to allow other variables to come through, or to separate out the predictor variables into different groups to allow as many different possible predictors to explain the dependent metric. We used a combination of these approaches, along with some specific bivariate analysis among some subgroups where we hypothesised there may be a difference, to tease out the strongest predictors.
The dependent variables that were included in our final analyses were:
• sickness absence (whether there was any or not)67;
• sickness absence (number of days)68;
• well-being Warwick-Edinburgh Mental Well-being Scale (WEMWBS) (scale);
• well-being (WEMWBS, as a categorical variable, split by the median score);
67 Based on those who had worked for their employer for 12 months or more.68 ibid
Appendices – Approach to multivariate analysis

69
• employee Engagement (scale);
• employee Engagement (as a categorical variable, split by the median score);
• leaving (whether considered leaving or applied for another job).
In all, at least six models were run on each occasion. Each dependent metric was run in a CHAID analysis against:
• all the Section B statements (excluding B5) and D1 statements;
• all the 12 factors described above at step 2;
• all the indicator variables, i.e.:
– employee engagement (except when engagement was the dependent metric);
– B12 Stress management;
– D3/D4 Availability of health and well-being initiatives;
– D5 Take-up of health and well-being initiatives;
– D2 Flexible working;
• the other dependent variables, i.e.:
– sickness absence;
– well-being;
– employee engagement (except where one of these is the dependent metrics, where it was excluded);
• all demographic variables, i.e.:
– A2. How long have you been with your current employer?
– A3. And does your job have a permanent or temporary contract?
– occupation;
– industry;
– organisation size;
– establishment size;
– public/private sector;
– presence of trade union in organisation;
– age;
– gender;
– annual income (after Tax and NI);
– A12. How many hours, do you usually work in your job each week?
– A14. Do you regularly have any formal responsibility for supervising?
– E7. Are you the chief income earner in your household?
– E8. Do you live with a partner, either as a married or unmarried couple or in a civil partnership?
– e09_10: Any dependent children/Are you a carer (combined variable);
Appendices – Approach to multivariate analysis

70
• all variables combined, meaning all the statements (not factors), indicator variables, other outcome variables, all demographics as well as two others:
– C2/C3 Thought about leaving/applied for another job;
– D6: Level of pay during sickness absence.
There were some other exceptions to this. For instance, in the employee engagement models, two of the Section B4 questions were very similarly worded and also highly correlated with the component questions of employee engagement (question B5) and so were excluded as independent metrics.
Each model resulted in an output known as a CHAID ‘tree’ and Figure E.1 provides a dummy example of such a tree. From this it is clear that there are a number of levels where the tree ‘splits’.
Figure E.1 Dummy example of a CHAID tree output displaying multiple ‘splits’
On a number of the models, employee engagement was the first level split and we took the decision to remove it from the analysis on several occasions to examine the next level splits. This ensured that engagement (which had a strong association) wasn’t masking any other associations which might also tell an interesting story, but weren’t as strong as engagement.
All the trees were examined in order to determine the main factors associated with the dependent variable. We studied the splits of the trees, at what level they occurred (higher splits indicate stronger associations) as well as the different values of the dependent variables. A large difference in the values of the predictor variable along a particular split may indicate a strong association.
Total sample55% at risk
Under 25 years60% at risk
>25 years42% at risk
Male72% at risk
Female52% at risk
Income >£4582% at risk
Income <£4526% at risk
No children68% at risk
Have children43% at risk
This tree shows that males that are under 25 years, and those aged >25 years with no children earning >£45K are more likely to be ‘at risk’ than any other groups of people.
Appendices – Approach to multivariate analysis

71
E.3 Findings from the CHAID analysis
E.3.1 Factors associated with lower than average sickness absenceWe wished to identify which factors, if any, were associated with respondents reporting no sickness absence in the previous 12 months. Softer aspects of the workplace culture were important, namely good relations between managers and employees. To summarise, factors that associated with no sickness absence were:
• good relations between managers and employees (i.e. low levels of agreement with the statement there are poor relations between managers and employees in this organisation);
• senior managers seeking staff views (more specifically, strong disagreement with the statement senior managers fail to seek the views of staff);
• generally positive views as a whole across statements concerning work life balance.
In addition, lower than average incidence of sickness absence was associated with an Employee Engagement score of 70 or higher (Section D.2 provides further information on the Engagement index).
When the actual number of sick days taken in the last 12 months was considered, the average across those who had been with their employer for at least 12 months was 4.9 days, including respondents who took no time off sick in the previous 12 months. A lower than average number of sick days was associated with:
• working in the private sector;
• senior managers delivering on their promises.
E.3.2 Factors associated with higher than average well-beingHigher than average well-being scores were associated with colleagues being helpful and supportive, and, for managers, having received advice and guidance on managing stress among their staff. Five days’ sick leave or less in the previous 12 months also associated with higher than average well-being, as did high scores on the Engagement index.
In contrast, lower than average well-being scores were largely associated with opposing factors.
E.3.3 Factors associated with higher than average employee engagementHigher than average levels of employee engagement related strongly to the organisational culture of a workplace in terms of it being viewed of as a ‘fun’ place to work. In addition, higher than average engagement was associated with respondents strongly agreeing that senior managers deliver on their promises. Those in the most senior and skilled occupational groups (managers and senior officials) were more likely than other occupational groups to have higher than average engagement scores, although the reverse was not true, i.e. lower than average engagement scores did not associate with less senior or less skilled occupational roles.
Other factors found to associate with higher than average engagement scores were a lack of any sickness absence in the past 12 months and the provision of information, help or advice to line managers on managing stress among their staff.
As mentioned earlier, well-being and engagement were highly correlated: higher than average well-being scores were associated with high levels of engagement and vice versa.
Appendices – Approach to multivariate analysis

72
E.3.4 Factors associated with higher than average retentionRetention was defined in terms of whether or not a respondent had thought about leaving their job in the previous 12 months (or since they started their employment) and 40 per cent had done so across the whole sample. Analysis revealed that a higher than average retention (i.e. few people thinking about leaving) was associated with an organisational culture where the workplace was seen as a fun place to work, generally positive views about work-life balance, and working in organisations where flexible working options were in place. Higher than average retention was also associated with high scores on the employee engagement index. It was also predictable that higher than average retention was associated with older respondents, i.e. those approaching retirement.
In terms of what was associated with people being more likely than average to have thought about leaving, the situation was the mirror image of the above.
E.3.5 Exploring the ‘optimal’ employee experienceIf an ‘optimal’ employee experience was defined as the combination of high well-being, high employee engagement, higher than average retention and low sickness absence, an overview of the analysis shows that such a situation would feature various demographic, attitudinal and behavioural characteristics, as shown in Figure E.2 and described in the previous sections.
Figure E.2 Summary of factors associated with the ‘optimum’ employee experience
Higher than average well-being
Higher than average employee
engagement
Higher than average retention
Lower than average absence*
•Supportive colleagues
•< Five sick days in last 12 months
•Employee engagement scores of 80+
•Information on managing staff stress
•Fun place to work
•Senior managers delivering on promises
•No sick days in last 12 months
•Well-being scores of >28
•Working as a manager/senior official
•Information on managing staff stress
•Good relations between managers and employees
•Employee engagement scores of 95+
•Flexible working
•Older workers (aged 55+)
•Good relations between managers and employees
•Senior managers delivering on promises and seeking staff views
•Employee engagement scores of 70+
•No sick pay
•Working <1year
•Private sector
*Lower than average in terms of any absence or average number sick days.
Appendices – Approach to multivariate analysis

73
The figure shows that these four aspects of the employee experience were inter-linked, as high employee engagement associated with the other three findings, suggesting that this was a key element of that experience. In seeking to understand the ‘optimal’ employee experience, the analysis has shown that this would be associated with the following workplace characteristics:
• the workplace being a ‘fun place to work’;
• senior managers being seen to deliver on promises and seeking staff views;
• a culture in which there are generally good relations between managers and employees;
• supportive colleagues.
From an interventions perspective, a flexible working policy appeared to correlate positively with many survey findings, inferring that offering such options had an ameliorating effect on employees’ opinions of different aspects of their working lives. The analysis supported this finding, showing that the presence of flexible working options was associated with employee retention. In addition, the analysis showed that the provision of information, advice and guidance to line managers on managing employee stress was positively associated with several aspects of the optimal experience.
The analysis of the survey data also showed that low levels of sickness absence were associated with employees working in the private sector. However, as already discussed, these findings contradict those of Survey of Workplace Absence Sickness and Health (SWASH), and the timing of the two surveys may, in part, explain this disparity (i.e. at the time of the employee survey, private sector workers may have been feeling the effects of the recession and may have been less willing to take sick leave).
As noted earlier, it is important to remember that in discussing these optimal workplace characteristics we are not suggesting causality, i.e. we are not stating that the combination of these would inevitably lead to high levels of well-being, low sickness, etc; rather they are simply the characteristics that are most commonly associated with this situation. It may be that the optimal situation itself is ‘causing’ the characteristics, or that some other unobserved conditions are creating both the characteristics and the ‘optimal’ experience.
Appendices – Approach to multivariate analysis

74
Appendix F Advance letter, contact sheet and survey questionnaire Advance letter
Appendices – Advance letter, contact sheet and survey questionnaire
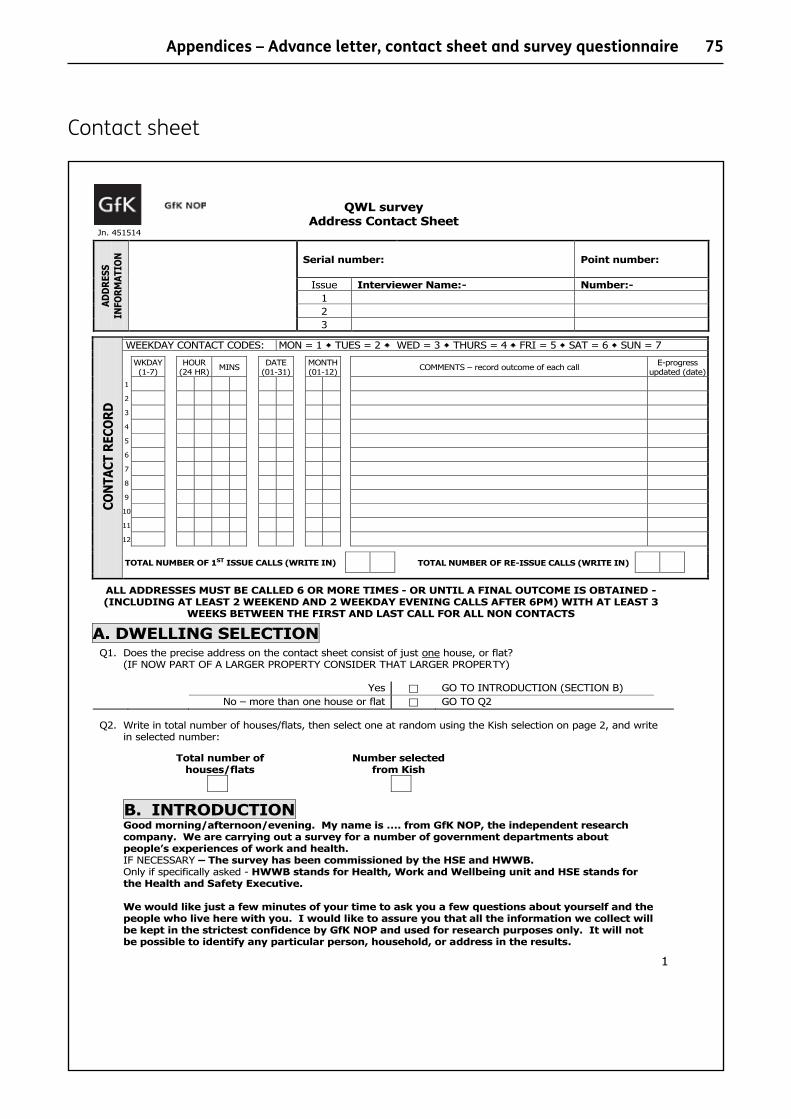
75
Contact sheet
Appendices – Advance letter, contact sheet and survey questionnaire

76 Appendices – Advance letter, contact sheet and survey questionnaire

77Appendices – Advance letter, contact sheet and survey questionnaire

78 Appendices – Advance letter, contact sheet and survey questionnaire
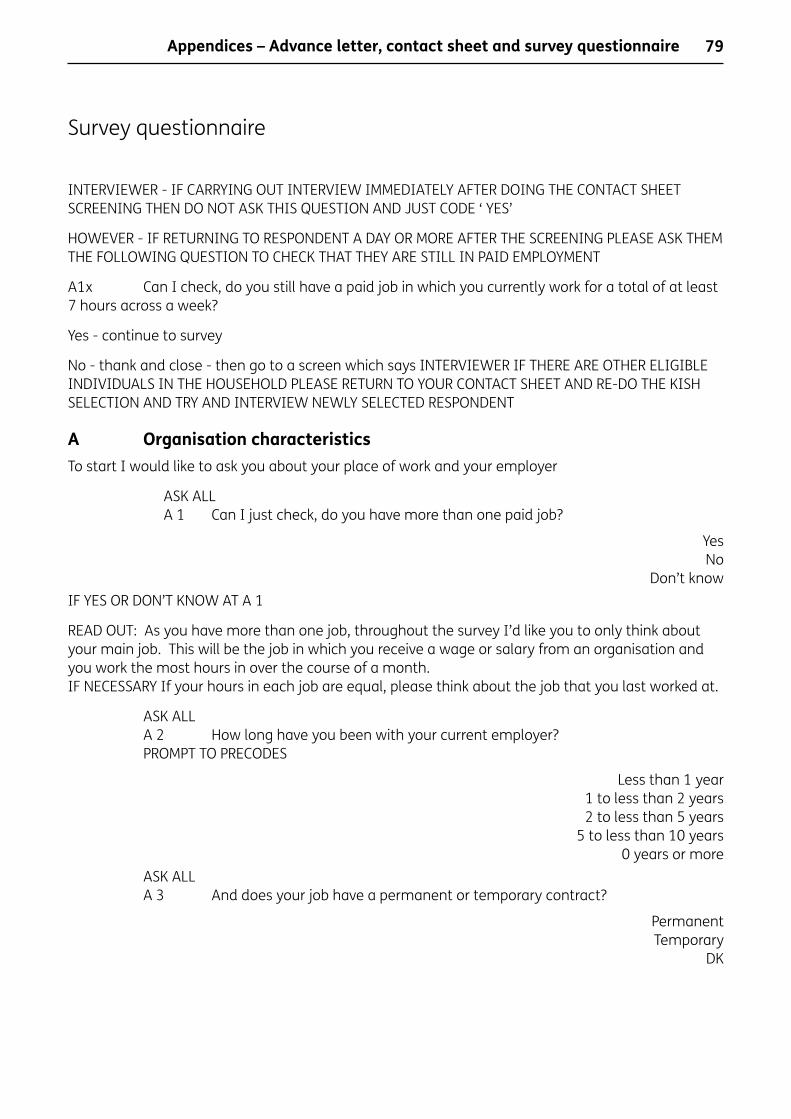
79
Survey questionnaire
INTERVIEWER - IF CARRYING OUT INTERVIEW IMMEDIATELY AFTER DOING THE CONTACT SHEET SCREENING THEN DO NOT ASK THIS QUESTION AND JUST CODE ‘ YES’
HOWEVER - IF RETURNING TO RESPONDENT A DAY OR MORE AFTER THE SCREENING PLEASE ASK THEM THE FOLLOWING QUESTION TO CHECK THAT THEY ARE STILL IN PAID EMPLOYMENT
A1x Can I check, do you still have a paid job in which you currently work for a total of at least 7 hours across a week?
Yes - continue to survey
No - thank and close - then go to a screen which says INTERVIEWER IF THERE ARE OTHER ELIGIBLE INDIVIDUALS IN THE HOUSEHOLD PLEASE RETURN TO YOUR CONTACT SHEET AND RE-DO THE KISH SELECTION AND TRY AND INTERVIEW NEWLY SELECTED RESPONDENT
A Organisation characteristics To start I would like to ask you about your place of work and your employer
ASK ALL A 1 Can I just check, do you have more than one paid job?
Yes No
Don’t knowIF YES OR DON’T KNOW AT A 1
READ OUT: As you have more than one job, throughout the survey I’d like you to only think about your main job. This will be the job in which you receive a wage or salary from an organisation and you work the most hours in over the course of a month. IF NECESSARY If your hours in each job are equal, please think about the job that you last worked at.
ASK ALL A 2 How long have you been with your current employer? PROMPT TO PRECODES
Less than 1 year 1 to less than 2 years 2 to less than 5 years
5 to less than 10 years 0 years or more
ASK ALL A 3 And does your job have a permanent or temporary contract?
Permanent Temporary
DK
Appendices – Advance letter, contact sheet and survey questionnaire
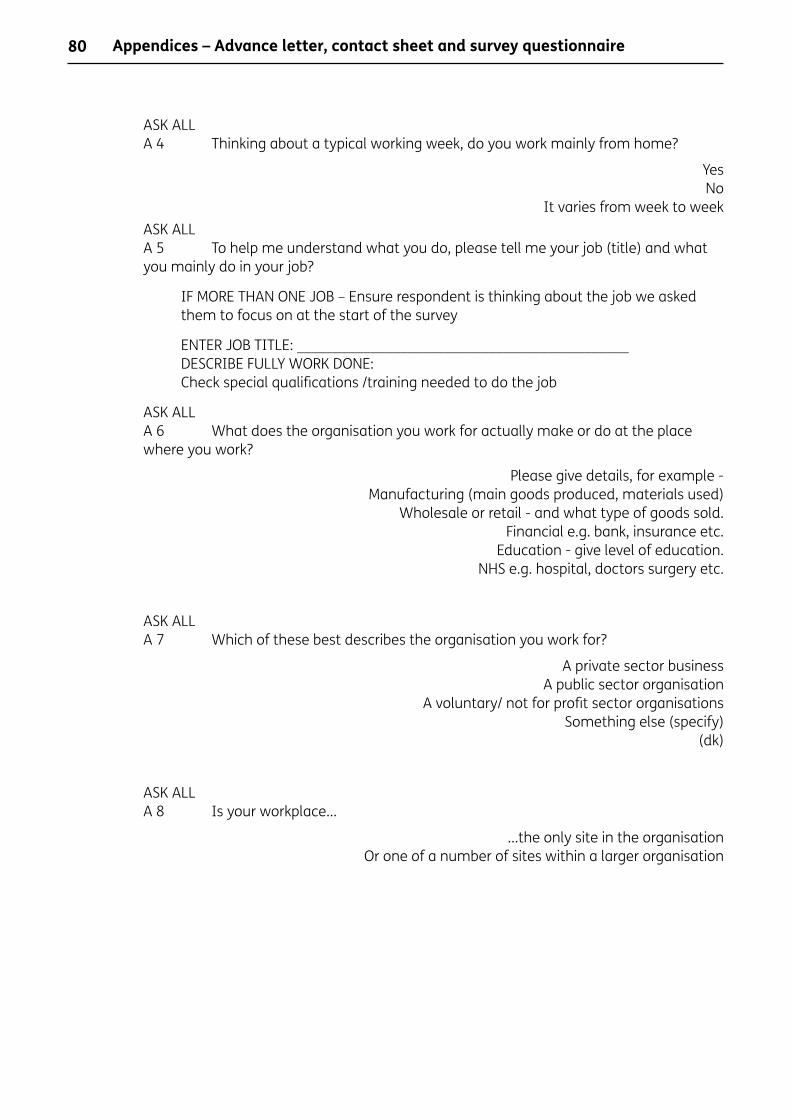
80
ASK ALL A 4 Thinking about a typical working week, do you work mainly from home?
Yes No
It varies from week to weekASK ALL A 5 To help me understand what you do, please tell me your job (title) and what you mainly do in your job?
IF MORE THAN ONE JOB – Ensure respondent is thinking about the job we asked them to focus on at the start of the survey
ENTER JOB TITLE: _____________________________________________ DESCRIBE FULLY WORK DONE: Check special qualifications /training needed to do the job
ASK ALL A 6 What does the organisation you work for actually make or do at the place where you work?
Please give details, for example - Manufacturing (main goods produced, materials used)
Wholesale or retail - and what type of goods sold. Financial e.g. bank, insurance etc.
Education - give level of education. NHS e.g. hospital, doctors surgery etc.
ASK ALL A 7 Which of these best describes the organisation you work for?
A private sector business A public sector organisation
A voluntary/ not for profit sector organisations Something else (specify)
(dk)
ASK ALL A 8 Is your workplace…
…the only site in the organisation Or one of a number of sites within a larger organisation
Appendices – Advance letter, contact sheet and survey questionnaire

81
ASK IF CODE 2 AT A 8
A 9 Approximately how many people work in the UK for the company or organisation that pays your wages at all of its sites or offices, NOT just the place where you work or in your department?
IF RESPONDENT SAYS DON’T KNOW ASK THEM TO ESTIMATE WHETHER IT IS UNDER 50, BETWEEN 50 AND 250 OR OVER 250
SHOW CARD 1 1-5
6-10 11-24 25-50
51-249 250 – 499
500+IF DON’T KNOW -
Don’t know but under 50 Don’t know but between 50 and 250
Don’t know but over 250 Don’t know
ASK ALL A 10 How many people work for your employer at the place where you work? We are interested in the location where your job is mainly carried out - normally this will consist of a single building, part of a building, or at the largest a self contained group of buildings
IF RESPONDENT SAYS DON’T KNOW ASK THEM TO ESTIMATE WHETHER IT IS UNDER 50, BETWEEN 50 AND 250 OR OVER 250
SHOWCARD 11-5
6-10 11-24 25-50
51-249 250 – 499
500+IF DON’T KNOW -
Don’t know but under 50 Don’t know but between 50 and 250
Don’t know but over 250 Don’t know
Appendices – Advance letter, contact sheet and survey questionnaire

82
INTERVIEWER READ OUT: From this point on, I will use the word ‘organisation’ when I am talking about your employer.
ASK ALL A 11 Are there any trade unions in your organisation?
‘If necessary: a trade union is a group of employees who act collectively to negotiate with employers and the Government regarding wages and conditions of employment.’
Yes No
Don’t knowASK ALL A 12 How many hours, including overtime or extra hours, do you usually work in your job each week? Please exclude meal breaks and time taken to travel to work.
Hours per week (to nearest hour)ASK ALL A 13 How many overtime or extra hours do you usually work each week, whether paid or unpaid?
Enter number None
Don’t knowASK ALL A 14 In your job, do you regularly have any formal responsibility for supervising the work of other employees?
INTERVIEWER Do not include: • supervisors of children, for example, teachers, nannies, childminders • supervisors of animals • people who supervise security or buildings only, for example, caretakers, security guards
Yes No
ASK ALL A 15 Can I just check, is there someone who manages or supervises you? This may be someone who gives you work, supervises your work or is responsible for telling you how you are doing in your job?
Yes No
ASK ALL A 16 Are there senior managers in your organisation? A senior manager MAY be someone more senior than the person who manages or supervises you, right through to those at the top of your organisation. They may or may not work at your site.
Yes No
Don’t know
Appendices – Advance letter, contact sheet and survey questionnaire
83
If no at A15 AND yes at A16 or no at A15 and no at A16
A16b You said that no-one supervises or manages your work. May I just check, are you part of the senior management team or are you the only senior manager in your organisation?
Yes part of senior management team– ask B3 (but don’t ask B2, line management questions) Yes only senior manager - route past B3 and B2
No – route past B2 If yes at A15 and yes at A16 or if no at A16b
A16a Within the last year, have you come into contact with senior managers in your organisation? This contact could have taken any form, from personal communication with you to staff-wide events or other staff-wide communications.
Yes No
Don’t knowIf yes at A15 AND no at A16
A16c You’ve told me that you have a line manager and that there are no senior managers in your organisation. May I just check, is your line manager at the most senior level in your organisation?
yes - route to B2 and B3 no - route to B2 but skip B3 dk – route to B2 but skip B3
B Quality of Working Life [Capi: please rotate the order of the subsections in Section B. Please always keep B4 and B5 in same order (qs about organisation) and these should come after B3 (relationships with senior managers) which should always come after B2 (relationship with line manager). B8 (relationships with others in organisation) should always come before B9 (relationships with those outside organisation).]
DOING THE WORK THE JOB INVOLVES
Now I’d like to ask some questions about your working life. Firstly, I’d like to ask you about the actual work you do.
ASK ALL B 1 For each of the following statements please tell me how much you agree or disagree …
SHOWCARD AStrongly agree Tend to agree
Neither agree nor disagree Tend to disagree
Strongly disagree
Appendices – Advance letter, contact sheet and survey questionnaire
84
CAPI ROTATE ORDER OF STATEMENTS
a. I never seem to have enough time to get my work doneb. I can decide when to take a break during my working dayc. I am pressured to work long hoursd. I have a choice in deciding what I do at worke. I can make my own decisions about how I do my work f. The pace of my work is too fast g. I know how to go about getting my job doneh. I understand how my work contributes to the objectives for my organisationi. I am unclear about what’s expected of me at workj. I do not have the right resources or equipment to do my jobk. I am gaining valuable experience in my job
RELATIONSHIP WITH LINE MANAGER / SUPERVISOR
IF YES AT A 15
B 2 Now thinking about your line manager or supervisor, to what extent do you agree or disagree that they
Showcard AStrongly agree Tend to agree
Neither agree nor disagree Tend to disagree
Strongly disagreeCAPI ROTATE ORDER OF STATEMENTS
a. give you help and supportb. give constructive feedback on the work you doc. expect you to work too hardd. show they care about you as a persone. are unwilling to listen to your problemsf. encourage you at workg. treat you unfairlyh. encourage you to develop your skillsi. have talked to you about avoiding stress at work
RELATIONSHIPS WITH SENIOR MANAGERS
Ask all with senior managers (code 1 at A 16a)
B 3 Earlier you told me you had come into contact with senior managers in the last year. How much do you agree or disagree that senior managers…
Appendices – Advance letter, contact sheet and survey questionnaire
85
If no at A15 AND yes at A16 and yes code 1 at A16b You told me you are part of the senior management team, thinking generally about senior managers how much do you agree or disagree they…
If yes at A15 AND no at A16 and yes at A16c You said that your line manager is at the most senior level in your organisation. Thinking about your line manager as the senior manager please me tell whether they …
Showcard AStrongly agreeTend to agree
Neither agree nor disagreeTend to disagree
Strongly disagreeCAPI ROTATE ORDER OF STATEMENTS
a. …are difficult to communicate with b. …show they listen to junior staffc. ...fail to seek the views of staffd. …respond to suggestions from staffe. …deliver on their promisesf. …treat employees unfairly
TREATMENT BY, AND FEELINGS TOWARDS, EMPLOYER ORGANISATION
ASK ALL B 4 Thinking about the organisation you work for, how much do you agree or disagree with the following:
Showcard AStrongly agreeTend to agree
Neither agree nor disagreeTend to disagree
Strongly disagreeCAPI ROTATE ORDER OF STATEMENTS
a. The organisation fails to reward extra effort by staffb. I share the values of the organisation I work for c. This organisation inspires my confidenced. This organisation lacks a clear vision for the futuree. This is a fun place to workf. I can ask questions about change at work g. I am consulted about changes in my workplace that affect meh. There are poor relations between managers and employees in this organisation i. When changes are made at work, I am unclear how they will affect mej. There are few opportunities for me to learn and grow within this organisation
Appendices – Advance letter, contact sheet and survey questionnaire

86
ASK ALL
B 5 And still thinking about the organisation you work for, how much do you agree or disagree with the next statements:
Showcard AStrongly agreeTend to agree
Neither agree nor disagreeTend to disagree
Strongly disagreeCAPI ROTATE ORDER OF STATEMENTS
a. I am proud when I tell others I am part of this organisationb. I would recommend this organisation as a great place to workc. I feel a strong personal attachment to the organisation d. My organisation inspires me to do the best in my jobe. My organisation motivates me to help it achieve its objectives
THE PLACE OR PHYSICAL ENVIRONMENT WHERE YOU DO YOUR JOB
B6b ‘Which of these best describes the place where you do most of your work?
SHOW CARD 2 Office areaManufacturing/ production/ processing area (e.g. factory/plant)Warehouse/ stores/ distribution loading areaKitchen/ catering areaCare /treatment areas (e.g. hospital/medical room)Other mixed public/ employee space (e.g. shop/ restaurant/ job centre/ schools)Outside work area (e.g. farm/ park/ garden /glasshouse)On transport/ roadsPrivate householdsWorking in own homeOther (specify)’
ASK ALL B 6 Thinking about where you usually do your job, please tell me whether you agree or disagree with the following:
Appendices – Advance letter, contact sheet and survey questionnaire

87
Showcard AStrongly agreeTend to agree
Neither agree nor disagreeTend to disagree
Strongly disagree
CAPI ROTATE ORDER OF STATEMENTS
a. My workspace is badly designed for the work that I dob. I find it comfortable to work in the physical environment where I usually do my job c. This is a physically unsafe place to workd. Physically, it is a healthy place to worke. I can adapt my workspace to suit my needs
THE BALANCE BETWEEN HOME LIFE AND WORK LIFE
ASK ALL B 7 Thinking about the balance between your work and personal life, how much do you agree or disagree with the following statements:
Showcard AStrongly agreeTend to agree
Neither agree nor disagreeTend to disagree
Strongly disagree
CAPI ROTATE ORDER OF STATEMENTS
a. My personal life suffers because of my work responsibilities b. Work stops me from spending as much time as I’d like with family or friends c. I never worry about my work outside working hoursd. I can choose when I take time off worke. My work suffers because of responsibilities in my personal life
HOW YOU GET ON WITH OTHERS IN THE ORGANISATION
ASK ALL B 8 To what extent do you agree or disagree with the following statements about your relationships with other people who work in your organisation?
Appendices – Advance letter, contact sheet and survey questionnaire

88
Showcard AStrongly agreeTend to agree
Neither agree nor disagreeTend to disagree
Strongly disagreeCAPI ROTATE ORDER OF STATEMENTS
a. I get the help and support I need from colleagues at work b. I am subject to unkind words or behaviour at workc. There is friction or anger between colleagues at workd. I enjoy good relations with my work colleagues e. My colleagues are unwilling to listen to my work related problems
HOW YOU GET ON WITH THOSE OUTSIDE YOUR ORGANISATION
ASK ALL B 9 Does your job involve providing a service on a REGULAR basis to customers, clients or members of the public? This could be face to face, on the phone or by email.
YesNo
SHOW CARD 3 - delete
ASK IF YES AT B 9
B 10 Thinking about [customers, clients or members of the public you have regular direct contact with, to what extent do you agree with the following statements?
Showcard AStrongly agreeTend to agree
Neither agree nor disagreeTend to disagree
Strongly disagreeCAPI ROTATE ORDER OF STATEMENTS
a. They are often unreasonable b. They give me feedback about my workc. They appreciate the work I do
Appendices – Advance letter, contact sheet and survey questionnaire
89
HOW YOU GET ON WITH STAFF YOU MANAGE OR SUPERVISE
ASKED ONLY OF THOSE WHO MANAGE OTHERS (CODE 1 at A 14)
B 11 Thinking about the person or people that you manage or supervise, to what extent do you agree with the following statements?
Showcard AStrongly agreeTend to agree
Neither agree nor disagreeTend to disagree
Strongly disagreeCAPI ROTATE ORDER OF STATEMENTS
a. My staff are difficult to manageb. My staff give me positive feedbackc. My staff are unwilling to share their problems with med. I have enough time to manage my staff
ASKED ONLY OF THOSE WHO MANAGE OTHERS (CODE 1 at A 14)
B 12 Have you ever received information, help or advice on how to manage stress amongst the employees that you manage?
YesNoDK
ASK ALL
B 13 From this Showcard, please tell me which THREE things are most important to you in your working life:
SHOW CARD 4 Liking the actual work I do
Having a good relationship with the person who manages meBeing treated well by senior managers in my organisation
Being treated well by the organisation that employs me (including pay and benefits)Having a good physical environment in which to work
Having the right balance between my personal life and my work lifeGetting on well with colleagues
Getting on well with the clients/members of the public in the course of my jobGetting on well with the people I manage
Appendices – Advance letter, contact sheet and survey questionnaire

90
C Outcomes
Engagement
ASK ALL
C 1 MOVED TO SELF COMP SECTION
Retention
ASK ALL
C 2 [Within the last year / Since starting your current job1 ] have you thought about leaving your current employer for another job? INTERVIEWER - IF RESPONDENT SAYS ‘IT DEPENDS’ PLEASE CODE AS YES
YesNo
IF YES AT C 2
C 3 And have you applied for a job in another organisation within the last 12 months / since starting your job?
YesNo
ASK ALL
C 4 All things considered, how likely do you think you are to lose your current job in the next 12 months?
SHOW CARD 5 Very likely
Fairly likelyNot very likely
Not at all likely
Work plans
ASK ALL
C 5 Taking everything into account, at what age do you think that you personally will completely stop paid work? Interviewer note: the age you retire could be different from the state pension age Enter age (may be an estimate)
Appendices – Advance letter, contact sheet and survey questionnaire
1 For all those code 1 at A2

91
Health
The next questions are about your health and lifestyle.
ASK ALL
C 6 In general, how would you say your health is?
SHOW CARD 6 Very good
Fairly goodNeither good nor bad
Fairly badVery bad
Don’t knowASK ALL
C 7 Within the last twelve months have you suffered from any of the following health symptoms on this list? Just read out the number from the show card
SHOW CARD 7 1 problems or disabilities (including arthritis or rheumatism) connected with
your arms or hands 2 ...legs or feet
3 ...back or neck4 do you have difficulty in seeing (while wearing spectacles or contact lenses)
5 difficulty in hearing6 a speech impediment
7 severe disfigurement, skin conditions, allergies8 chest or breathing problems, asthma, bronchitis
9 heart, blood pressure or blood circulation problems10 stomach, liver, kidney or digestive problems
11 diabetes12 depression, bad nerves or anxiety
13 epilepsy14 severe or specific learning difficulties (mental handicap)
15 mental illness or suffer from phobias, panics or other nervous disorders16 progressive illness not included elsewhere (e.g. cancer not included elsewhere,
multiple sclerosis, symptomatic HIV, Parkinson’s disease, muscular dystrophy)17 other health problems or disabilities
FOR EACH SYMPTOM MENTIONED AT C 7
C 8 You say you’ve suffered from health symptom number [Feed forward code number only] on the show card within the last twelve months. Was this caused and / or made worse by work, or was it unrelated to work?
Caused by workMade worse by work
Unrelated to workDon’t know
Appendices – Advance letter, contact sheet and survey questionnaire
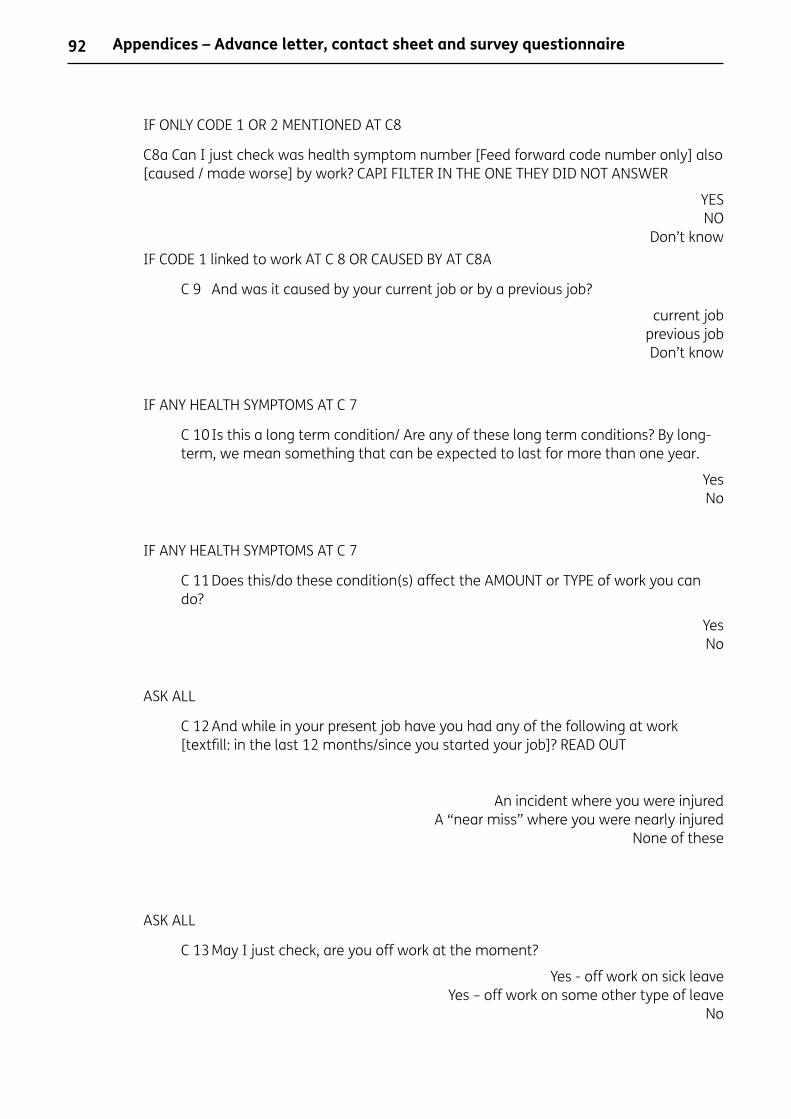
92
IF ONLY CODE 1 OR 2 MENTIONED AT C8
C8a Can I just check was health symptom number [Feed forward code number only] also [caused / made worse] by work? CAPI FILTER IN THE ONE THEY DID NOT ANSWER
YESNO
Don’t knowIF CODE 1 linked to work AT C 8 OR CAUSED BY AT C8A
C 9 And was it caused by your current job or by a previous job?
current jobprevious jobDon’t know
IF ANY HEALTH SYMPTOMS AT C 7
C 10 Is this a long term condition/ Are any of these long term conditions? By long-term, we mean something that can be expected to last for more than one year.
YesNo
IF ANY HEALTH SYMPTOMS AT C 7
C 11 Does this/do these condition(s) affect the AMOUNT or TYPE of work you can do?
YesNo
ASK ALL
C 12 And while in your present job have you had any of the following at work [textfill: in the last 12 months/since you started your job]? READ OUT
An incident where you were injuredA “near miss” where you were nearly injured
None of these
ASK ALL
C 13 May I just check, are you off work at the moment?
Yes - off work on sick leaveYes – off work on some other type of leave
No
Appendices – Advance letter, contact sheet and survey questionnaire
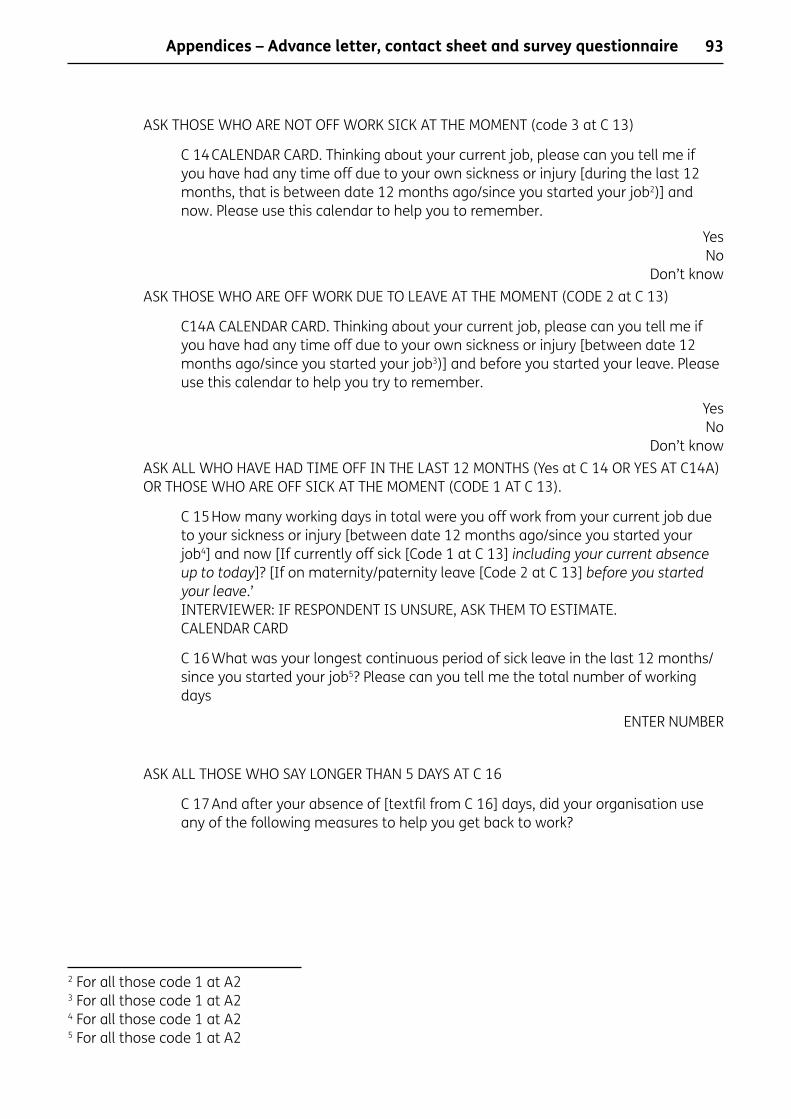
93
ASK THOSE WHO ARE NOT OFF WORK SICK AT THE MOMENT (code 3 at C 13)
C 14 CALENDAR CARD. Thinking about your current job, please can you tell me if you have had any time off due to your own sickness or injury [during the last 12 months, that is between date 12 months ago/since you started your job2)] and now. Please use this calendar to help you to remember.
Yes No
Don’t knowASK THOSE WHO ARE OFF WORK DUE TO LEAVE AT THE MOMENT (CODE 2 at C 13)
C14A CALENDAR CARD. Thinking about your current job, please can you tell me if you have had any time off due to your own sickness or injury [between date 12 months ago/since you started your job3)] and before you started your leave. Please use this calendar to help you try to remember.
Yes No
Don’t knowASK ALL WHO HAVE HAD TIME OFF IN THE LAST 12 MONTHS (Yes at C 14 OR YES AT C14A) OR THOSE WHO ARE OFF SICK AT THE MOMENT (CODE 1 AT C 13).
C 15 How many working days in total were you off work from your current job due to your sickness or injury [between date 12 months ago/since you started your job4] and now [If currently off sick [Code 1 at C 13] includingyourcurrentabsenceuptotoday]? [If on maternity/paternity leave [Code 2 at C 13] beforeyoustartedyourleave.’INTERVIEWER: IF RESPONDENT IS UNSURE, ASK THEM TO ESTIMATE. CALENDAR CARD
C 16 What was your longest continuous period of sick leave in the last 12 months/since you started your job5? Please can you tell me the total number of working days
ENTER NUMBER
ASK ALL THOSE WHO SAY LONGER THAN 5 DAYS AT C 16
C 17 And after your absence of [textfil from C 16] days, did your organisation use any of the following measures to help you get back to work?
Appendices – Advance letter, contact sheet and survey questionnaire
2 For all those code 1 at A23 For all those code 1 at A24 For all those code 1 at A25 For all those code 1 at A2

94
SHOW CARD 8 a) A meeting at your home or at work to discuss what extra help and support you might need
b) Allowing you to work reduced hours or fewer daysc) Reducing your responsibilities
d) Reducing your workloade) Providing access to occupational health services
f) Independent counselling, advice or information to help with work-related, health-related, legal, financial or domestic issues
None of theseASK ALL THOSE WHO SAY LONGER THAN 5 DAYS AT C 16
C 18 Has your organisation ever made, or offered to make, any of the following adjustments to help you do your job?
SHOW CARD 9 1. Different or reduced working hours
2. Extra breaks at work 3. Different duties
4. Changes to the work area to improve access 5. A job coach or personal assistant (e.g. a sign-language interpreter for meetings)
6. Equipment to help you do your work (e.g. a telephone with text display) 7. Building modifications e.g. handrails or ramps, easy-to-access work area, toilets or lift
8. A different chair or desk Other (please say)
(None of these) Don’t know
ASK ALL
C 19 Thinking about the last 12 months while working/Since starting6 in the job that we have been talking about, were there any occasions when you went to work when you were really too ill and should have taken sick leave? CALENDAR CARD
Yes No
Don’t knowIF YES AT C 19
C 20 How many days in total were you in work when you were really too ill and should have taken sick leave? INTERVIEWER: IF RESPONDENT IS UNSURE, ASK THEM TO ESTIMATE.
ASK ALL
C 21 In the last 12 months, have you done any of the following because of your illness and injury whether in work time or outside of work time? INTERVIEWER: READ OUT LIST AND PROMPT FOR YES OR NO TO EACH
YesNo
(don’t know)
Appendices – Advance letter, contact sheet and survey questionnaire
6 For all those code 1 at A2

95
CAPI ROTATE LISTCalled NHS Direct on your own behalf
Spoken to a family doctor or practice nurse on your own behalf, either by telephone or in personVisited a hospital or clinic as an outpatient e.g. to attend an appointment or receive treatment but
without admission to a wardVisited a hospital as an inpatient in other words, admitted to a ward for planned treatment or tests
that may have involved an overnight stayBeen admitted to an Accident and Emergency (A&E) unit
Self completion section
READ OUT: I’d now like you to answer some questions on the laptop. This is so that you can answer the questions in private. We can go through the first question together so I can show you how to use the laptop.
Interviewer: the next question will be used as the example question. Please go through the question with the respondent, showing them how to use the CAPI machine
C 22 The first question is about your height. How would you prefer to give your answer? Choose one answer
Feet and inchesMetres and centimetresDon’t know my height (follow up question: are you able to give an estimate of your height, even if you don’t know for sure?)Prefer not to answer
Route into next question based on answer to C 22
C 23 Please enter how tall you are without shoes in the boxes below
[capi – allow feet/inches and metres/cms]
C 24 Are you fairly sure of your height, or is that an estimate? Choose one answer
Fairly sureEstimate
INTERVIEWER READ OUT: PLEASE ANSWER THE NEXT FEW QUESTIONS IN YOUR OWN TIME. IF YOU HAVE ANY PROBLEMS PLEASE ASK ME AND I WILL BE HAPPY TO HELP YOU.
ASK ALL
C 25 The next question is about your weight. How would you prefer to give your answer? Choose one answer
Stones and poundsKilogramsDon’t know my weight (follow up question: are you able to give an estimate of your weight, even if you don’t know for sure?)Prefer not to answer
Appendices – Advance letter, contact sheet and survey questionnaire
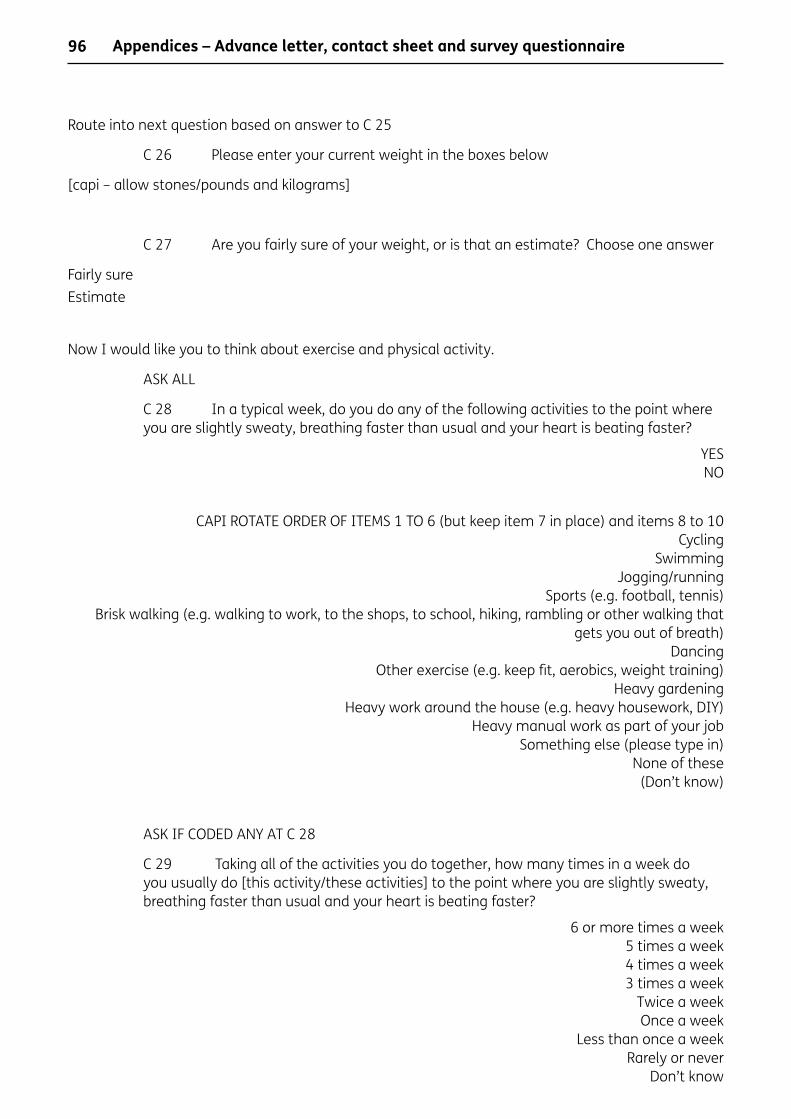
96
Route into next question based on answer to C 25
C 26 Please enter your current weight in the boxes below
[capi – allow stones/pounds and kilograms]
C 27 Are you fairly sure of your weight, or is that an estimate? Choose one answer
Fairly sureEstimate
Now I would like you to think about exercise and physical activity.
ASK ALL
C 28 In a typical week, do you do any of the following activities to the point where you are slightly sweaty, breathing faster than usual and your heart is beating faster?
YESNO
CAPI ROTATE ORDER OF ITEMS 1 TO 6 (but keep item 7 in place) and items 8 to 10 Cycling
SwimmingJogging/running
Sports (e.g. football, tennis)Brisk walking (e.g. walking to work, to the shops, to school, hiking, rambling or other walking that
gets you out of breath)Dancing
Other exercise (e.g. keep fit, aerobics, weight training)Heavy gardening
Heavy work around the house (e.g. heavy housework, DIY)Heavy manual work as part of your job
Something else (please type in)None of these
(Don’t know)
ASK IF CODED ANY AT C 28
C 29 Taking all of the activities you do together, how many times in a week do you usually do [this activity/these activities] to the point where you are slightly sweaty, breathing faster than usual and your heart is beating faster?
6 or more times a week 5 times a week4 times a week3 times a week
Twice a weekOnce a week
Less than once a weekRarely or never
Don’t know
Appendices – Advance letter, contact sheet and survey questionnaire
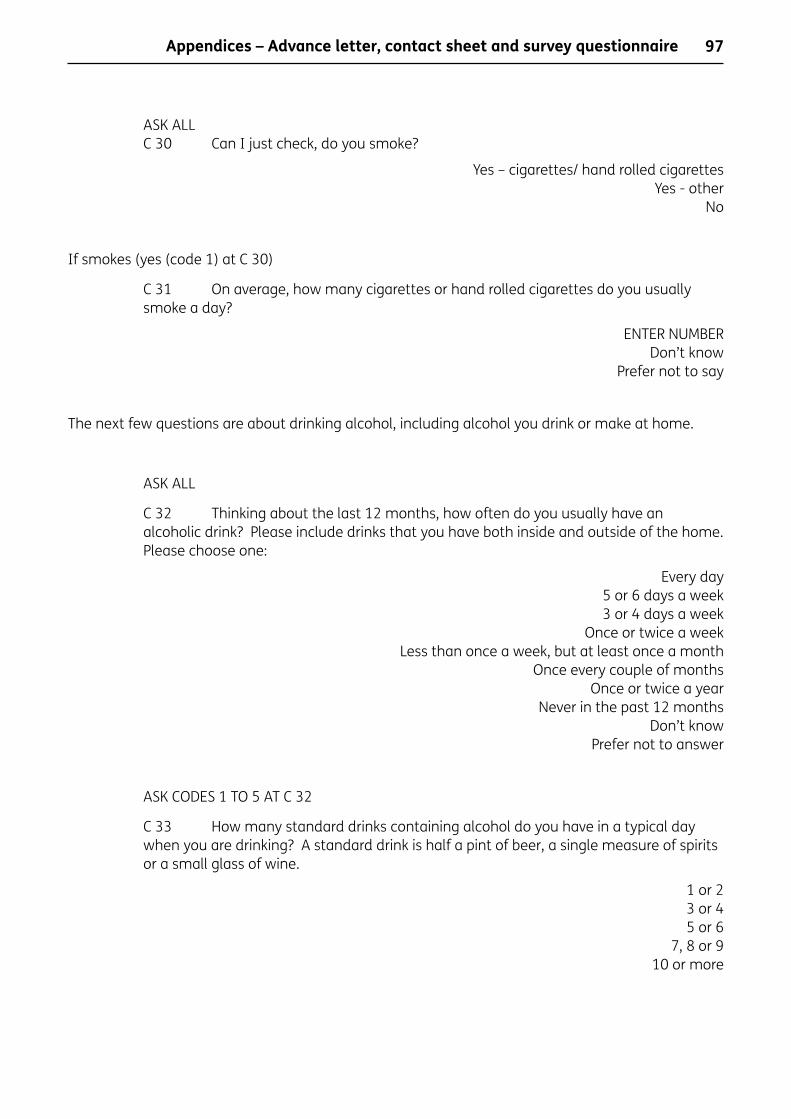
97
ASK ALL C 30 Can I just check, do you smoke?
Yes – cigarettes/ hand rolled cigarettesYes - other
No
If smokes (yes (code 1) at C 30)
C 31 On average, how many cigarettes or hand rolled cigarettes do you usually smoke a day?
ENTER NUMBERDon’t know
Prefer not to say
The next few questions are about drinking alcohol, including alcohol you drink or make at home.
ASK ALL
C 32 Thinking about the last 12 months, how often do you usually have an alcoholic drink? Please include drinks that you have both inside and outside of the home. Please choose one:
Every day5 or 6 days a week3 or 4 days a week
Once or twice a weekLess than once a week, but at least once a month
Once every couple of monthsOnce or twice a year
Never in the past 12 monthsDon’t know
Prefer not to answer
ASK CODES 1 TO 5 AT C 32
C 33 How many standard drinks containing alcohol do you have in a typical day when you are drinking? A standard drink is half a pint of beer, a single measure of spirits or a small glass of wine.
1 or 23 or 4 5 or 6
7, 8 or 9 10 or more
Appendices – Advance letter, contact sheet and survey questionnaire
98
ASK ALL
C 34 Thinking about what you eat on a typical day, how many portions of fruit or vegetables do you usually eat?
A portion is about a handful, and could include fresh, frozen, chilled, canned or dried fruit either eaten separately or as an ingredient in a meal. This also includes 100% juice and smoothies
None1234
5 or more(DK)
ASK ALL
C 35 Below are some statements about feelings and thoughts. Please select the answer that best describes your experience of each over the last 2 weeks.
a. I’ve been feeling optimistic about the future b. I’ve been feeling useful c. I’ve been feeling relaxed d. I’ve been dealing with problems well e. I’ve been thinking clearly f. I’ve been feeling close to other people g. I’ve been able to make up my own mind about things
None of the timeRarely
Some of the timeOften
All of the time
ASK ALL
C 36 In general, how you would you say that your life OUTSIDE work is? CODE ONE ONLY
Not at all stressfulMildly stressful
Moderately stressfulVery stressful
Extremely stressfulEngagement
Appendices – Advance letter, contact sheet and survey questionnaire

99
ASK ALL
C 37 Thinking about your job again, on the days that you work how often do you
Every dayMost days
Some daysRarelyNever
(dk)CAPI ROTATE ORDER OF STATEMENTS
a. feel you accomplish your best at workb. not work as hard as you couldc. put in extra effort at workd. strive to do your very best for your organisation
End of self completion section. Please hand the laptop back to the Interviewer, thank you.
INTERVIEWER - WAS THE SELF COMPLETION COMPLETED BY THE RESPONDENT OR YOU?
RESPONDENT COMPLETED INTERVIEWER ADMINISTERED
D Objective measures of supportASK ALL
D 1 Moving onto pay and work related benefits, to what extent do you agree or disagree with the following statements?
SHOWCARD AStrongly agreeTend to agree
Neither agree nor disagreeTend to disagree
Strongly disagreeCAPI PLEASE ROTATE STATEMENTS
a. I am paid fairly for the work that I do b. I am satisfied with the pay and benefits I receive in this job
Appendices – Advance letter, contact sheet and survey questionnaire

100
ASK ALL
D 2 Does your organisation provide any flexible working practices? For example this might mean flexi - time, working from home, job sharing, ability to change hours / work condensed hours or change working patterns
Yes – anyNo
(don’t know)
D6 If you are off work sick, do you get paid at a lower than normal rate of pay on any of the first 7 days of absence?
Interviewer note: if respondent gets Statutory sick pay (SSP) on all or some of the first 7 days’ absence, their response should be codes 1 or 2 (as appropriate)
If yes - ‘Is that only some of the 7 days at a lower rate or all 7?’
Yes - some of the 7 days at a lower rateYes - all 7 days at a lower rate
No - all at the normal rateDo not get paid when off sick
Don’t know my employer’s policy
ASK ALL
D 3 Looking at this showcard, please tell me whether your organisation provides any of the things listed, whether or not you use them. If there are items that are provided to some employees but not to others, please still include them.:
SHOW CARD 10
More than 20 days of holiday, excluding bank holidaysAccess to occupational health services
Health screening or health checks (e.g. blood pressure, BMI, cholesterol)Private medical insurance
Stress management support or advice for employees and / or managersAccess to counselling or other employee assistance services
Training in injury preventionWork area assessments and adjustments (e.g. checking / adjusting equipment such as your chair)
Schemes to help employees undertake voluntary work in work timePension scheme
D 4 And again, please tell me whether your organisation provides any of the things listed on this card:
Appendices – Advance letter, contact sheet and survey questionnaire

101
SHOW CARD 11 Subsidised canteen or restaurant
Healthy food choices available in vending machines or staff canteenProgrammes, advice or support to help people give up smoking
Weight loss or weight management advice or programmeFree health advice or events to raise awareness about healthy lifestyles
Dedicated health and wellbeing intranet siteLoan towards or discount on bicycle purchase
Measures to encourage activity such as running, walking, cycling Free or subsidised gym membership
Fitness classes at work
For each coded at D 3 or D 4 except code 1, 4 and 10 at D3
D 5 And have you personally made use of [item] in the last 12 months?
If no - Is that because you decided not to make use of it or because you are not entitled or eligible to it?
YesNo
No - because not entitled to use itDon’t know
If code 4 at D3
D5b And have you personally been a member of the private medical insurance scheme in the last 12 months?
If no - Is that because you decided not be a member or because you are not entitled or eligible to become one?
YesNo
No - because not entitled to use itDon’t know
If code 10 at D3
D5c And have you been a member of the pension scheme in the last 12 months?
If no - Is that because you decided not become a member or because you are not entitled or eligible to become a member?
YesNo
No - because not entitled to use itDon’t know
Appendices – Advance letter, contact sheet and survey questionnaire
102
E Personal circumstancesFinally I’d like to ask some questions about you so that we can classify your answers
ASK ALL
E 1 Could you please tell me how old you were on your last birthday?
Enter actual age: REF
IF REFUSED AT E 1
E 2 Which of these categories does your age fall into?
SHOW CARD 12 16 – 2425 - 3435 -4445 -5455-5960-65
Older than 65 REF
E 3 Interviewer – record sex of respondent
MaleFemale
ASK ALL
E 4 Could you look at this card please and tell me to which of these groups you consider you belong?
SHOW CARD 13 a) White – British
b) White – Irishc) Any other white background (specify)
d) Mixed – White and Black Caribbeane) Mixed – White and Black African
f) Mixed – White and Asiang) Any other mixed background (specify)
h) Asian/Asian British – Indiani) Asian/Asian British – Pakistani
j) Asian/Asian British – Bangladeshik) Any other Asian background (specify)
l) Black/Black British – Caribbeanm) Black/Black British – African
n) Any other Black background (specify)o) Chinese
p) Any other background (PLEASE GIVE DETAILS)(Refused)
Appendices – Advance letter, contact sheet and survey questionnaire

103
ASK ALL
E 5 Please could you tell me which letter on this card represents how much you get paid in your job AFTER tax and national insurance contributions have been deducted? If your pay varies from week to week because of overtime, or because you work different hours, think about what you earn on average.
SHOW CARD 14 ABCDEFGHIJKL
Don’t know Refused
WEEKLY MONTHLY YEARLY
B Up to £49 Up to £216 Up to £2,599
E £50 up to £99 £217 up to £432 £2,600 up to £5,199
I £100 up to £199 £433 up to £866 £5,200 up to £10,399
A £200 up to £299 £876 up to £1,299 £10,400 up to £15,599
H £300 up to £399 £1,300 up to £1,732 £15,600 up to £20,799
L £400 up to £499 £1,733 up to £2,166 £20,800 up to £25,999
G £500 up to £599 £2,167 up to £2,599 £26,000 up to £31,199
K £600 up to £699 £2,600 up to £3,032 £31,200 up to £36,399
C £700 up to £799 £3,033 up to £3,466 £36,400 up to £41,599
J £800 up to £899 £3,467 up to £3,899 £41,600 up to £46,799
F £900 up to £990 £3,900 up to £4,332 £46,800 up to £51,999
D £1,000 or more £4,333 or more £52,000 or more
Appendices – Advance letter, contact sheet and survey questionnaire
104
ASK ALL
ASK IF > 1 PERSON AGED 16+ AT E 6
E 7 Are you the chief income earner in your household, that is the person with the largest income, whether from employment, pensions, state benefits, investments or any other source.
YesNo
ASK ALL
E 8 Can I just check, do you live with a partner, either as a married or unmarried couple or in a civil partnership?
YesNo
ASK ALL
E 9 And do you have any dependent children living with you in the household? IF YES - PROMPT FOR AGES
No dependent childrenYes, aged 0 – 15 years
Yes, aged 16+ASK ALL
E 10 Do you regularly look after any ill, disabled or elderly relatives or friends who need care, without being paid?
YesNo
ASK ALL
E 11 GfK NOP may wish to talk to you again about the issues we have discussed in this interview. Are you happy for us to contact you again?
YesNo
IF YES AT E 11
E 12 Can I take your full name please?
E 13 May I take a phone number that we could contact you on if necessary?
Yes [record phone number]No
That brings us to the end of the survey. On behalf of GfK NOP thank you very much for your time.
Appendices – Advance letter, contact sheet and survey questionnaire

Health and Well-being at work, a survey of employees was jointly funded by the Health and Safety Executive and the Cross-Government Health, Work and Well-being Strategy Unit. A survey of 2,019 employees, aged 16 +, was conducted between October and December 2009. The survey objectives were to:• Develop the evidence base around work and health and workplace health initiatives
from the employee perspective.• Provide baseline data so that progress on health and well-being at work can be
measured and monitored over time.
If you would like to know more about DWP research, please contact: Kate Callow, Commercial Support and Knowledge Management Team, Upper Ground Floor, Steel City House, West Street, Sheffield, S1 2GQ.http://research.dwp.gov.uk/asd/asd5/rrs-index.asp
Published by the Department for Work and PensionsJuly 2011www.dwp.gov.ukResearch report no. 751 ISBN 978-1-84712-985-7