Embed Size (px)
Citation preview
Health and active transportation: an inventory of municipal data collection and needs in the Lower Mainland of B.C.
Erna van Balen, MSc, MPhil Meghan Winters, PhD
Acknowledgements
We would like to thank the municipalities that participated in the interviews. We are also grateful for the time and effort provided by our Advisory Committee members:
Dale Bracewell, Manager Active Transportation, City of Vancouver
Don Buchanan, Transportation Planner, City of Surrey
John Carsley, Medical Health Officer, Vancouver Coastal Health
Tannis Cheadle, Manager Population and Public Health, Provincial Health Services Authority
Rahul Chhokar, Epidemiologist, Fraser Health
Gene Chin, Project Manager, Healthy Canada by Design CLASP initiative, Heart and Stroke Foundation
Claire Gram, Population Health Policy Consultant, Vancouver Coastal Health
Raymond Kan, Senior Regional Planner, Metro Vancouver
Emily Laflamme, Regional Epidemiologist, Vancouver Coastal Health
Alice Miro, Project Manager, Heart and Stroke Foundation
Mike Pennock, Population Health Epidemiologist, Ministry of Health
Chris Quigley, Senior Planner, Translink
Helena Swinkels, Medical Health Officer, Fraser Health
Oonagh Tyson, Manager, Health Protection, Fraser Health
Production of this report has been made possible through a financial contribution from Health Canada,
through the Canadian Partnership Against Cancer. The views expressed in this report represent the
views of Healthy Canada by Design and do not necessarily represent the views of the project funder.
Table of Contents Executive summary ....................................................................................................................................... 1
1. Introduction .......................................................................................................................................... 4
2. Methodology ......................................................................................................................................... 5
3. PART 1: Data collection and needs ....................................................................................................... 6
3.1 Overview ............................................................................................................................................. 6
3.2 Data collected by municipalities: interview results ............................................................................ 8
3.2.1 Traffic count data ......................................................................................................................... 8
3.2.2 Road infrastructure and parking supply .................................................................................... 14
3.3 Data collected by other organizations .............................................................................................. 14
3.3.1 Crashes and injuries ................................................................................................................... 14
3.3.2 Physical activity, obesity, and chronic disease data .................................................................. 16
3.3.3 Transit ........................................................................................................................................ 17
3.3.4 Trip to work data ........................................................................................................................ 18
3.3.5 Bike to work week ...................................................................................................................... 18
3.3.6 Provincial traffic counts ............................................................................................................. 18
3.3.7 Air quality ................................................................................................................................... 19
3.3.8 Regional summary reports ......................................................................................................... 19
3.4 Data needs ........................................................................................................................................ 19
3.4.1 Sharing data and accessibility .................................................................................................... 19
3.4.2 Linking health and transportation ............................................................................................. 20
3.4.3 Technology & best practices of data collection ......................................................................... 20
3.4.4 Data on transportation modes................................................................................................... 20
3.4.5 Data on infrastructure ............................................................................................................... 20
3.4.6 Data on injuries and safety ........................................................................................................ 21
4. PART 2: Promising practices of data collection and sharing ............................................................... 22
4.1 Data collection: National Count Day ................................................................................................. 22
4.2 Data sharing: Peel Data Centre ......................................................................................................... 22
4.3 Visualization: Diabetes in Toronto ICES Atlas ................................................................................... 23
4.4 Visualization: Crash and injury maps ................................................................................................ 24
4.5 Assessing health impacts: Health economic assessment tool for cycling and walking (HEAT) ........ 25
4.6 Assessing health impacts of transportation plans: Health Impact Assessment ............................... 26
5. PART 3: Recommendations to address data needs ............................................................................ 27
5.1 Region-wide recommendations ........................................................................................................ 27
5.1.1 Establish a regional approach to data collection for transportation and health ....................... 27
5.1.2 Establish a regional data base of transportation and health data ............................................. 28
5.1.3 Leverage funding and resources ................................................................................................ 28
5.1.4 Enhance knowledge exchange between municipalities ............................................................ 28
5.2 Tiered recommendations .................................................................................................................. 28
5.2.1 Expand existing municipal intersection counts to include active transportation (tier 1, 2) ...... 29
5.2.2 Use sources of information already available (tier 2, 3) ............................................................ 29
5.2.3 Add health-related questions to Trip Diary Survey and transportation questions to local health
surveys (tier 3) .................................................................................................................................... 29
5.2.4 Assess impacts using HEAT and HIA (tier 3) ............................................................................... 30
5.2.5 Make use of advancing technology (tier 3) ................................................................................ 30
6. Discussion ............................................................................................................................................ 32
6.1 Opportunities .................................................................................................................................... 32
6.2 Challenges ......................................................................................................................................... 33
6.3 Next steps ......................................................................................................................................... 34
References .................................................................................................................................................. 35
1
Executive summary
The lack of knowledge about and access to transportation- and health-related data being collected in different sectors has been identified as a by gap public health and transportation practitioners. Addressing this gap is important to adequately monitor the health impacts of transportation decisions, and to inform standardized data collection efforts for future transportation decisions. Therefore, the aim of this project was to:
1) Document data collection efforts related to transportation and health across various sectors in the Lower Mainland of B.C., including the availability, utility, and breadth of these datasets,
2) Document the data needs of these organizations, 3) Describe promising practices from other Canadian centres for the collection and presentation of
data, and 4) Identify synergies, opportunities for coordination, gaps and recommended actions to improve
monitoring of the health impacts of previous and future transportation decisions, and related communications or presentation of data to lay language audiences.
Fifteen municipalities, two health authorities, two regional districts, Translink, BC Transit, the Insurance Corporation of British Columbia (ICBC) and the B.C. Injury Research and Prevention Unit (BCIRPU), all located in the Lower Mainland of B.C., were interviewed about their data collection efforts and needs related to active transportation and health metrics. For example, transportation engineers in municipal governments were asked about their traffic data count programs, including walking and cycling levels, while health authorities, ICBC and BCIRPU were asked about injury databases they hold and other health metrics they collect or obtain through national and local health surveys. Participants were also asked about data on infrastructure, air quality, transit ridership and travel behaviour. Interview results and sources of data Most municipalities (12 of 15) interviewed have at least some kind of traffic monitoring program, for example through automatic hose counts, manual intersection counts or screen line counts. In nine of those programs, cyclist and/or pedestrian counts are included and virtually all municipalities count cyclists and pedestrians on an ad-hoc or project basis. Five municipalities have systematic data collection programs specifically aimed at active transportation. Regional sources include automatic visitor counters at regional park entrances (Metro Vancouver), and modal share data from Translink’s Trip Diary Survey, conducted every five years. In addition, other identified data sources were ICBC crash data, which many municipalities do obtain, and injury data compiled by health authorities and BCIRPU, which are not as well used by all municipalities. It appears that most transportation engineers in municipalities mainly obtain data from within their own sector (i.e., transportation), but are not aware of or lack the knowledge to access other sources of health information other than injuries. Health data collected by Statistics Canada and available through health authorities is not being used as commonly. Data needs Indeed, among the needs expressed by municipalities was better access to existing data sources. Also, a regional approach to data collection and maintenance was on the wish list of several municipalities, and related to this, a desire for a standardized method of collecting transportation data.
2
The need for better linking the health impacts of transportation decisions was stronger in some municipalities than in others: municipalities that already have extensive data collection programs were typically more interested in assessing health impacts than municipalities that only do basic traffic monitoring. Finally, many municipal needs related to having more and better data (beyond volumes) about transportation modes, infrastructure amenity tracking and injuries. Promising practices Five practices that were considered ‘promising’ were identified. Promising practices were not selected based on specific quality criteria; they are merely intended to serve as inspiration. Practices can be ‘promising’ in different ways, for example as standardized data collection, informative ways of data sharing through maps, sharing data through centralized database and standardized methods to assess and monitor health impacts of transportation plans. The examples include a National Count Day, as is done in the U.S. Counts of cyclists and pedestrians are conducted in a standardized way during the same annual count periods; the Peel Region Open Data Centre, as a promising practice related to regionally accessible data for (active) transportation, health and land use data; mapping health and transportation-related indicators such as Montreal’s injury maps, ICBC’s interactive crash maps and Toronto’s built environment and diabetes map; and methods to assess health impacts of transportation plans, such as the Health Economic Assessment Tool for cycling and walking, and health impact assessments (HIA).
Recommendations Some general region-wide recommendations can be derived from the data needs and the promising practices:
1) Establish a regional approach to data collection for transportation and health 2) Establish a regional database of transportation and health data 3) Leverage funding and resources across sectors 4) Enhance knowledge exchange between municipalities
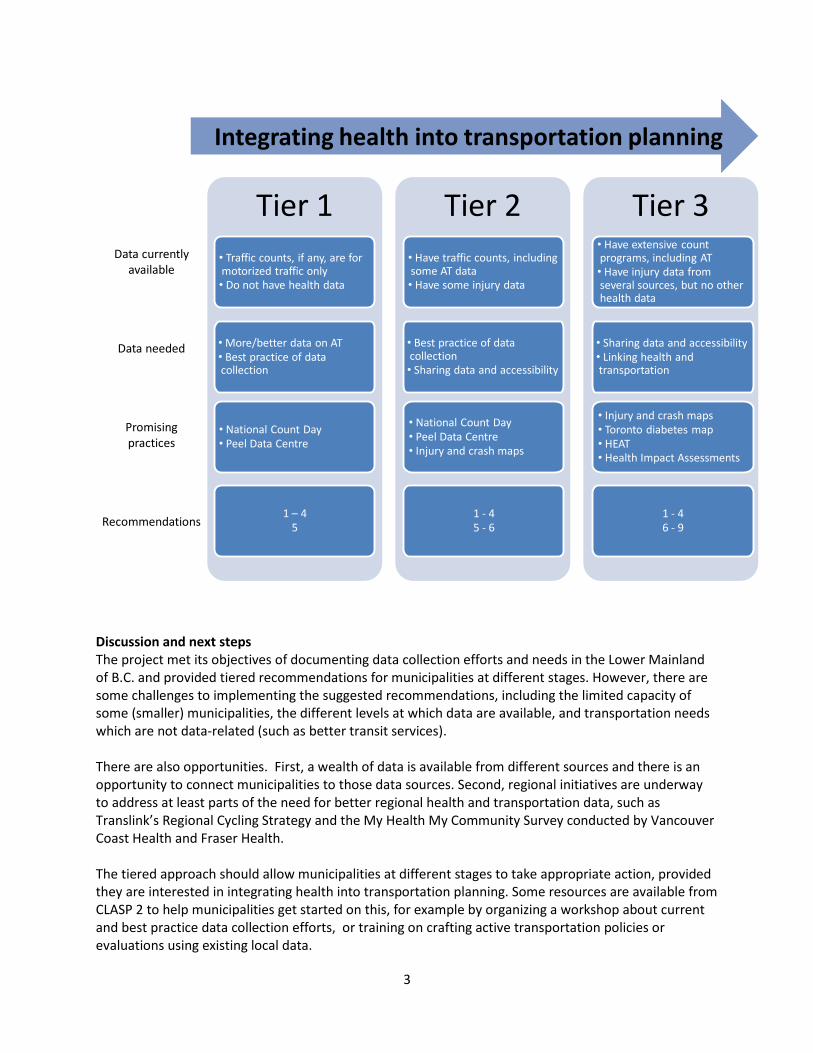
Given the fact that municipalities have different levels of interest and capacity to integrate health into transportation planning, a tiered approach is proposed, as depicted below. Municipalities can place themselves along a continuum. Most municipalities appear to be at an intermediate stage (around tier 2), with some municipalities such as the Districts of Mission and Kent at more initial stages (tier 1) and Vancouver at an advanced stage (tier 3). Recommendations for next steps for each of these stages, or tiers, are as follows:
5) Expand existing municipal intersection counts to include active transportation (tier 1, 2) 6) Access sources of health information already available (tier 2, 3) 7) Add health-related questions to transportation surveys, and transportation questions to local
health surveys (tier 3) 8) Carry out health impact assessments (tier 3) 9) Make use of advancing technology (tier 3)
3
Tier 1
• Traffic counts, if any, are for motorized traffic only• Do not have health data
• More/better data on AT• Best practice of data collection
• National Count Day• Peel Data Centre
1 – 45
Tier 2
• Have traffic counts, including some AT data• Have some injury data
• Best practice of data collection• Sharing data and accessibility
• National Count Day• Peel Data Centre• Injury and crash maps
1 - 45 - 6
Tier 3• Have extensive count programs, including AT• Have injury data from several sources, but no other health data
• Sharing data and accessibility• Linking health and transportation
• Injury and crash maps• Toronto diabetes map • HEAT• Health Impact Assessments
1 - 46 - 9
Data currently available
Data needed
Promising practices
Recommendations
Integrating health into transportation planning
Discussion and next steps The project met its objectives of documenting data collection efforts and needs in the Lower Mainland of B.C. and provided tiered recommendations for municipalities at different stages. However, there are some challenges to implementing the suggested recommendations, including the limited capacity of some (smaller) municipalities, the different levels at which data are available, and transportation needs which are not data-related (such as better transit services). There are also opportunities. First, a wealth of data is available from different sources and there is an opportunity to connect municipalities to those data sources. Second, regional initiatives are underway to address at least parts of the need for better regional health and transportation data, such as Translink’s Regional Cycling Strategy and the My Health My Community Survey conducted by Vancouver Coast Health and Fraser Health. The tiered approach should allow municipalities at different stages to take appropriate action, provided they are interested in integrating health into transportation planning. Some resources are available from CLASP 2 to help municipalities get started on this, for example by organizing a workshop about current and best practice data collection efforts, or training on crafting active transportation policies or evaluations using existing local data.
4
1. Introduction
This project in British Columbia is part of the second phase of the Healthy Canada by Design CLASP1 project, which proposed to build on the tools, expertise, networks, lessons learned, and promising practices generated through CLASP 1, to further accelerate the integration of health considerations into built environment and transportation policy and practice and to address challenges identified. Specifically, one of the focus activities of CLASP 2 is to improve the translation of data into action. Within CLASP 2, the current project focuses on transportation and health, in particular public and active transportation, such as walking and biking, including transit. During the first phase of Healthy Canada by Design CLASP, many agencies across the country have described challenges in implementing healthy community design policies due to a lack of meaningful data to inform decision-making. In fact, there is a wealth of data gathered on health and transportation indicators that could inform decision-making and assist in communicating to local stakeholders the health impacts of transportation decisions. However, these data collection efforts take place within specific agencies and sectors, and may not be known or readily available for use by other sectors. In addition, existing data are not always clearly communicated to policy makers and decision makers. In order to improve the monitoring of health impacts associated with transportation initiatives, this project aims to:
1) Document data collection efforts related to transportation and health across various sectors in the Lower Mainland of B.C., including the availability, utility, and breadth of these datasets,
2) Document the data needs of these organizations, 3) Describe promising practices from other Canadian centres for the collection and presentation of
data, and 4) Identify synergies, opportunities for coordination, gaps and recommended actions to improve
monitoring of the health impacts of transportation decisions, and related communications or presentation of data to lay language audiences.
This report features municipal data collection and is primarily intended for transportation planners in municipalities to learn what other municipalities are doing in terms of data collection. It also provides an overview of health data currently available from health agencies, described in section 3.3. However, the two health authorities in the region may also want to use this report to gain insight into standard transportation engineering practices for data collection, described in section 3.2. The report may also be useful to health authorities, planners and transportation professionals across the country who are trying to improve active transportation in their communities. While the specifics will be different, the approach, data sought, and promising practices should be common across the country. This report consists of three parts: The first part of this report consists of municipal data collection efforts and needs, whereas the second part describes a number of promising practices of data collection and sharing. The third and last part describes recommendations derived from the data collection efforts and needs inventory.
1 Coalitions Linking Action and Science for Prevention
5
2. Methodology An advisory committee helped guide the project and identify key individuals involved in (active) transportation and health data collection efforts. The advisory committee consists of epidemiologists, public health practitioners, planners, transportation engineers, policy analysts and researchers. The role of the advisory committee was to:
- Provide general guidance on the project scope and direction - Help identify key individuals who gather or maintain data - Help identify key data needs and issues (e.g., data ownership, representativeness) - Help identify other cities that have promising practices for data collection and sharing - Review and provide guidance on project deliverables, including (1) an inventory of data being
collected and (2) a final report with recommendations.
In order to identify data collection efforts and needs around active and public transportation, interviews were conducted with municipalities, regional governments, health authorities, the South Coast British Columbia Transportation Authority (Translink) and BC Transit. Advisory Committee members helped identify individuals responsible for active transportation in each of these organizations, typically transportation planners or transportation engineers. They were consulted over the phone or in person in small focus groups or individually, using a semi-structured interview format, as described below. Not all questions were used in all interviews. Interviews lasted 20-60 minutes. Most interviews were recorded and transcribed. Municipalities were asked what data they collect on active modes of transportation and related topics, for example what data they collect on:
- Walking: how many people, duration of trips, distance of trips, demographic breakdown, purpose of trips (commuting/to school/recreational/appointments)
- Cycling: how many people, duration of trips, distance of trips, demographic breakdown, purpose of trips (commuting/to school/recreational/appointments)
- Modal split - Infrastructure: sidewalk coverage, kms of bicycle lanes/streets/paths, bicycle parking,
bikeability, walkability, transit accessibility - Crashes: by mode, seriousness, cyclist safety - Public transit: ridership, transfers, boardings per stop/route - Air quality
Municipalities were also asked about their data needs. Promising practices Promising practices were identified through Advisory Committee members and our own networks. Promising practices were not selected based on specific quality criteria; they are merely intended to serve as inspiration.
6
3. PART 1: Data collection and needs
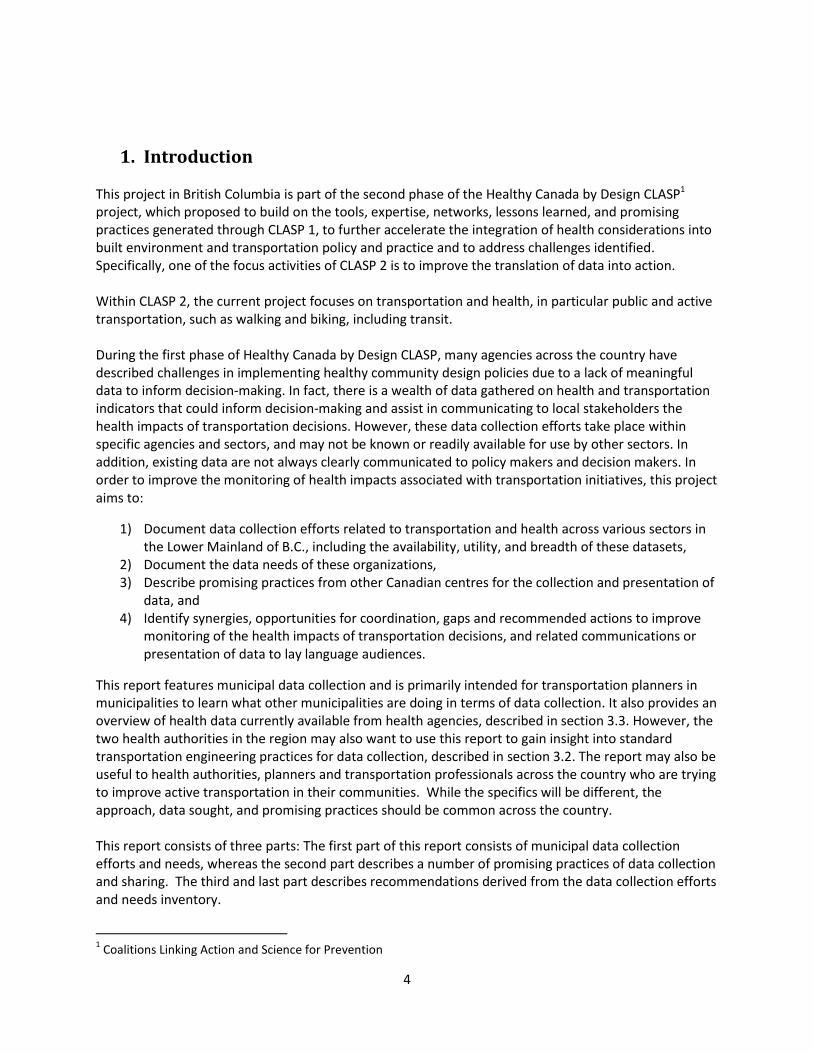
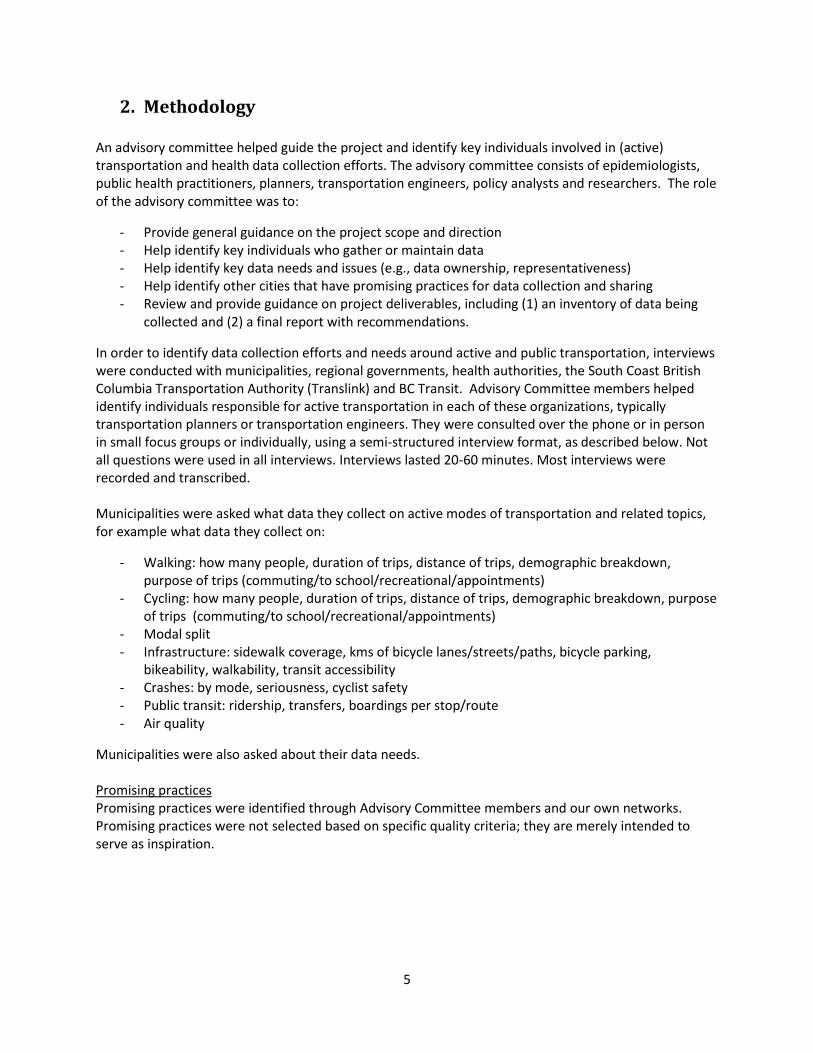
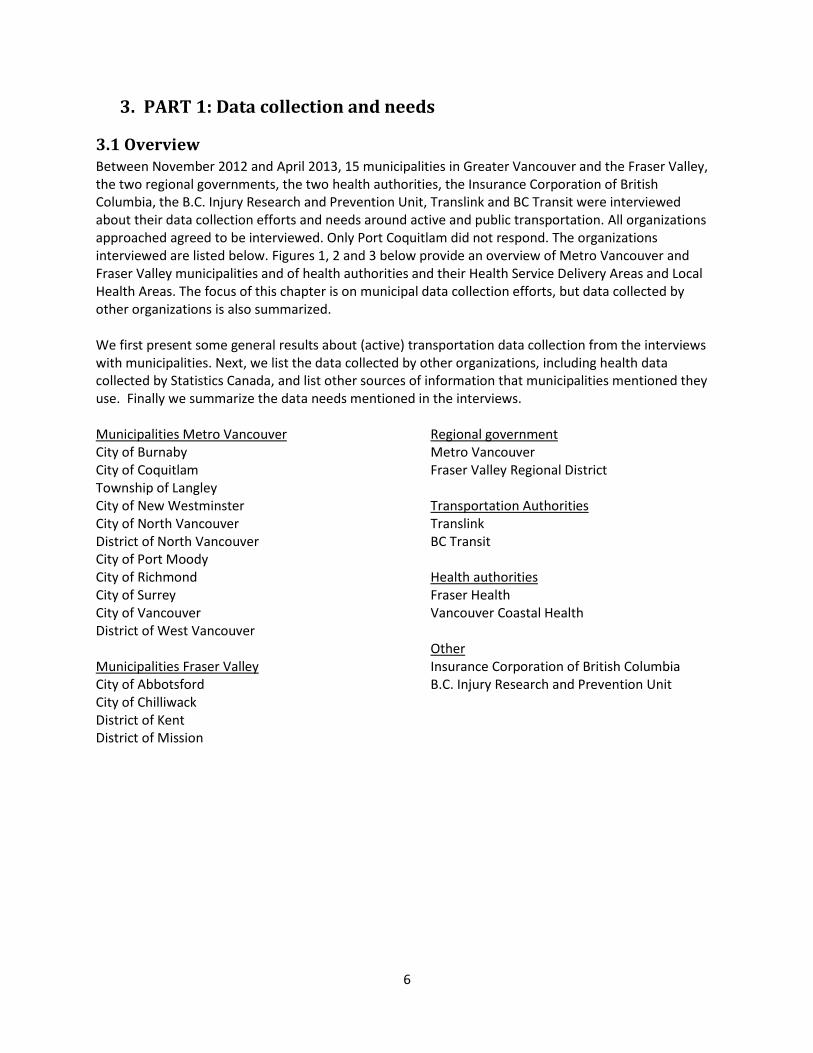
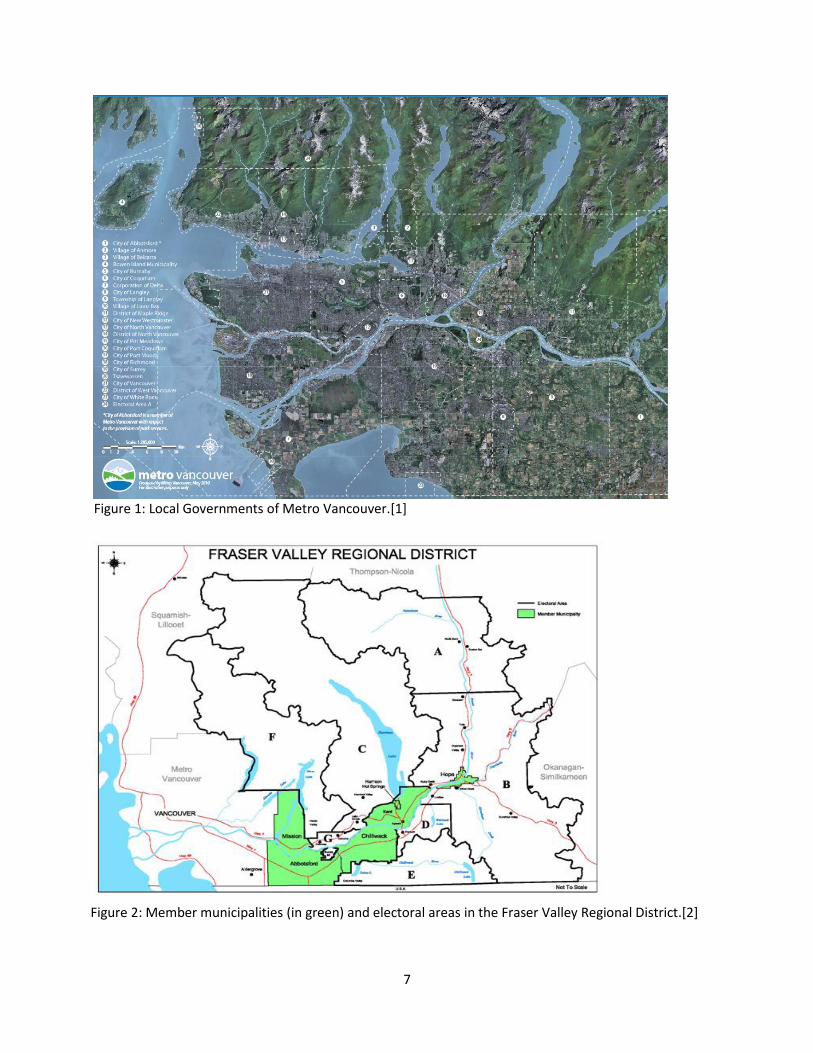
3.1 Overview Between November 2012 and April 2013, 15 municipalities in Greater Vancouver and the Fraser Valley, the two regional governments, the two health authorities, the Insurance Corporation of British Columbia, the B.C. Injury Research and Prevention Unit, Translink and BC Transit were interviewed about their data collection efforts and needs around active and public transportation. All organizations approached agreed to be interviewed. Only Port Coquitlam did not respond. The organizations interviewed are listed below. Figures 1, 2 and 3 below provide an overview of Metro Vancouver and Fraser Valley municipalities and of health authorities and their Health Service Delivery Areas and Local Health Areas. The focus of this chapter is on municipal data collection efforts, but data collected by other organizations is also summarized. We first present some general results about (active) transportation data collection from the interviews with municipalities. Next, we list the data collected by other organizations, including health data collected by Statistics Canada, and list other sources of information that municipalities mentioned they use. Finally we summarize the data needs mentioned in the interviews. Municipalities Metro Vancouver City of Burnaby City of Coquitlam Township of Langley City of New Westminster City of North Vancouver District of North Vancouver City of Port Moody City of Richmond City of Surrey City of Vancouver District of West Vancouver Municipalities Fraser Valley City of Abbotsford City of Chilliwack District of Kent District of Mission
Regional government Metro Vancouver Fraser Valley Regional District
Transportation Authorities Translink BC Transit Health authorities Fraser Health Vancouver Coastal Health Other Insurance Corporation of British Columbia B.C. Injury Research and Prevention Unit
7
Figure 1: Local Governments of Metro Vancouver.[1]
Figure 2: Member municipalities (in green) and electoral areas in the Fraser Valley Regional District.[2]
8
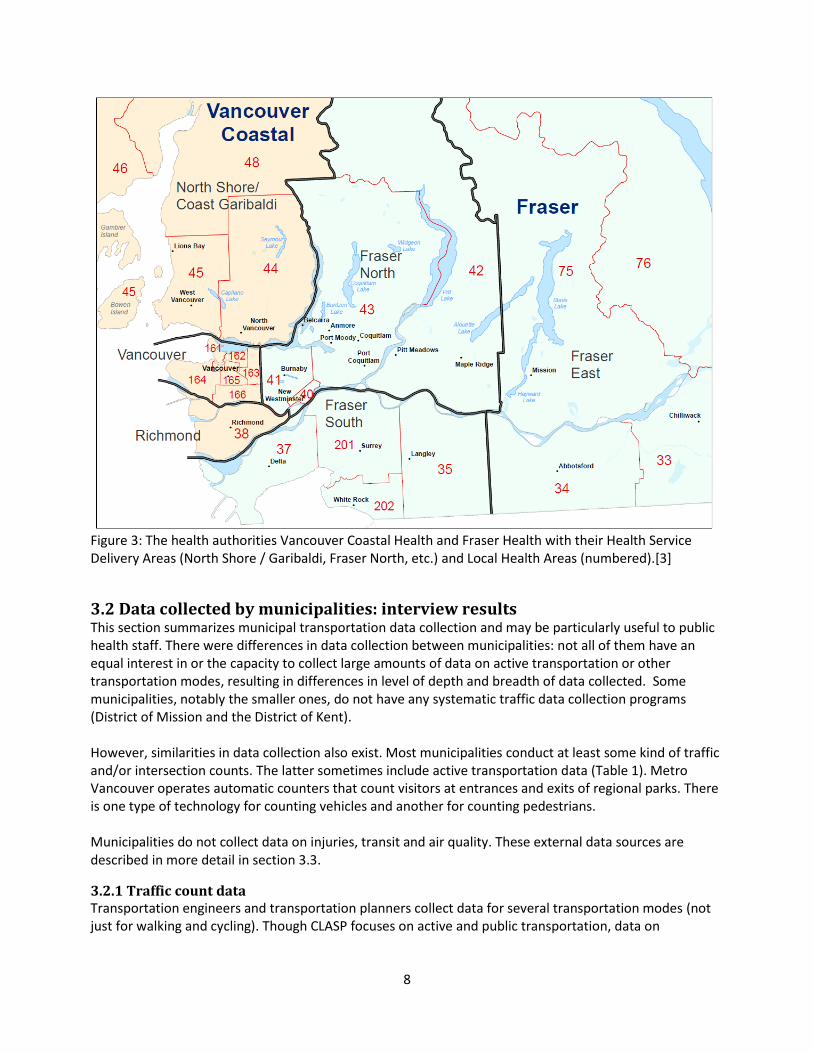
Figure 3: The health authorities Vancouver Coastal Health and Fraser Health with their Health Service Delivery Areas (North Shore / Garibaldi, Fraser North, etc.) and Local Health Areas (numbered).[3]
3.2 Data collected by municipalities: interview results This section summarizes municipal transportation data collection and may be particularly useful to public health staff. There were differences in data collection between municipalities: not all of them have an equal interest in or the capacity to collect large amounts of data on active transportation or other transportation modes, resulting in differences in level of depth and breadth of data collected. Some municipalities, notably the smaller ones, do not have any systematic traffic data collection programs (District of Mission and the District of Kent). However, similarities in data collection also exist. Most municipalities conduct at least some kind of traffic and/or intersection counts. The latter sometimes include active transportation data (Table 1). Metro Vancouver operates automatic counters that count visitors at entrances and exits of regional parks. There is one type of technology for counting vehicles and another for counting pedestrians. Municipalities do not collect data on injuries, transit and air quality. These external data sources are described in more detail in section 3.3.
3.2.1 Traffic count data Transportation engineers and transportation planners collect data for several transportation modes (not just for walking and cycling). Though CLASP focuses on active and public transportation, data on
9
systematic motorized traffic counts are presented to provide an overview of municipal count data (Table 1). Active transportation data collection programs are the focus of Tables 2 and 3.
Cyclist and pedestrian counts
Only Burnaby, Coquitlam, the City of North Vancouver, Richmond and Vancouver have systematic data collection programs specifically aimed at collecting active transportation data (walking and/or cycling). Tables 2 and 3 contain details on these walking and cycling count programs. Municipalities that do not have systematic programs specific to active transportation data collection do generally collect some pedestrian and cyclist volume data as part of other traffic monitoring programs such as intersection counts. Counts are done at an hourly basis for 24 hours a day and allow Metro Vancouver to assess daily and seasonal use. Most of municipalities conduct manual counts of pedestrians on an as-needed or project-specific basis (see Tables 1 and 2), for example for crosswalk installation or upgrade, or when there are complaints or concerns from local residents. Municipal pedestrian counts are usually done manually, as automatic count systems (e.g. infrared or cameras) are generally unreliable for groups of pedestrians and/or labour intensive to analyze. For some municipalities, notably the smaller ones, these project counts are the only source of walking information. Some project counts record additional data on users such as age groups and sex. Some municipalities (Richmond, Port Moody) have used pedestrian signal activations as an indicator of walking levels, although this is not very accurate. Metro Vancouver also takes a role, as it has automatic visitor counters for pedestrians at regional park entrances. For cycling, manual and automatic counts are also done on a project-basis. Some municipalities only collect cycling data on a project basis (Surrey, Richmond, Township of Langley, Abbotsford) or when there is a particular concern (Chilliwack). Demographic data are only rarely recorded for cyclists, but the City of Vancouver does collect demographic data (age, sex, cycling with children). Though technology is improving, automatic counters are usually not able to distinguish cyclists from other modes of travel, which makes them useful only if they are used at locations with separated cycling facilities. Some municipalities conduct manual counts of cyclists regularly, but not necessarily as part of a program. This is the case in New Westminster and Burnaby.
Motor vehicle traffic counts
Motor vehicle traffic counts are done automatically using cameras, hose counts or inductive loops. The count systems can be temporary or permanent. Count cycles are typically between 2 and 5 years, where a number of locations are counted each year. Municipalities that have traffic counts are displayed in Table 1.
Intersection counts
Intersection counts are manual or automatic counts of traffic movements through major intersections in which volumes of each mode and their turning movements are recorded. Manual intersection counts may provide information on numbers of pedestrians and cyclists, although this is not standard practice in transportation planning. For example in West Vancouver, cyclist and pedestrian counts were added in 2012. Age and sex are generally not recorded for active modes of transportation. Intersection counts are conducted more or less regularly (varying from once a year to cycles of a couple of years), usually for one day (7h), or during morning and afternoon peak hours. They do not provide 24-hour data. Table 1 lists municipalities that conduct intersection counts and specifies if pedestrians and cyclists are included.
Screenline counts
10
Screenline counts are a type of manual traffic count that records all traffic crossing a hypothetical line. Automatic counts (loop detector) are also used for vehicle volumes to verify the manual counts. The data collected in manual screenline counts include active modes of transportation, the number of cars and buses, and an estimation of the number of people in these, as well as the number and type of trucks. Screenline counts are primarily a regional effort, with Translink conducting counts every 2-3 years at 33 locations. The screenline survey captures all traffic movements across municipal boundaries and bridge crossings. The season of data collection has been somewhat inconsistent. The most recent counts were done in 2004, 2008 and 2011. The 2011 counts were conducted to coincide with the trip diary survey (a typical weekday in fall 2011). Screenline data are available in an aggregated form in a formal report that municipalities can use.[4] Vancouver is the only city that conducts its own screenline counts at the city and downtown boundaries. All traffic and people going into and out of the city and downtown are counted on an annual basis over a 16h counting period. These data are used to compare years and assess trends (e.g. changes in modal split). Screenline data, in particular the proportions of different types of traffic, could also serve as input for air quality modelling that assesses the impacts of transportation-related emissions.
11
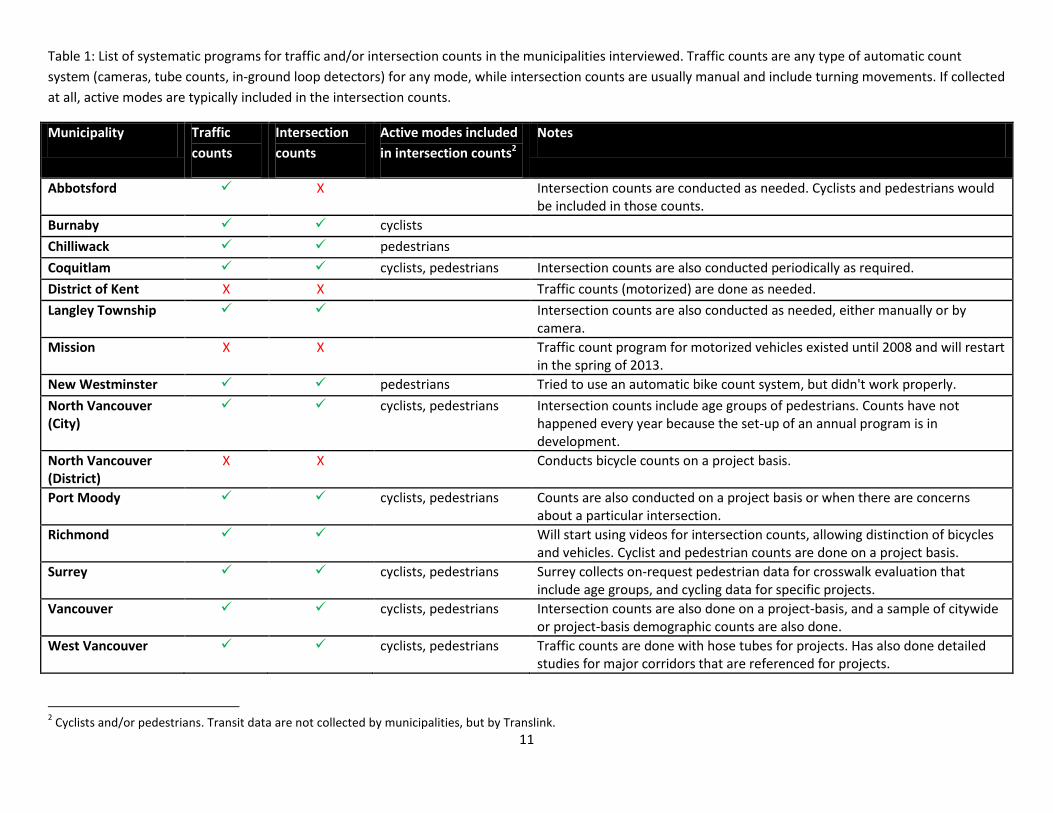
Table 1: List of systematic programs for traffic and/or intersection counts in the municipalities interviewed. Traffic counts are any type of automatic count
system (cameras, tube counts, in-ground loop detectors) for any mode, while intersection counts are usually manual and include turning movements. If collected
at all, active modes are typically included in the intersection counts.
Municipality Traffic
counts
Intersection
counts
Active modes included
in intersection counts2
Notes
Abbotsford X Intersection counts are conducted as needed. Cyclists and pedestrians would be included in those counts.
Burnaby cyclists
Chilliwack pedestrians
Coquitlam cyclists, pedestrians Intersection counts are also conducted periodically as required.
District of Kent X X Traffic counts (motorized) are done as needed.
Langley Township Intersection counts are also conducted as needed, either manually or by camera.
Mission X X Traffic count program for motorized vehicles existed until 2008 and will restart in the spring of 2013.
New Westminster pedestrians Tried to use an automatic bike count system, but didn't work properly.
North Vancouver (City)
cyclists, pedestrians Intersection counts include age groups of pedestrians. Counts have not happened every year because the set-up of an annual program is in development.
North Vancouver (District)
X X Conducts bicycle counts on a project basis.
Port Moody cyclists, pedestrians Counts are also conducted on a project basis or when there are concerns about a particular intersection.
Richmond Will start using videos for intersection counts, allowing distinction of bicycles and vehicles. Cyclist and pedestrian counts are done on a project basis.
Surrey cyclists, pedestrians Surrey collects on-request pedestrian data for crosswalk evaluation that include age groups, and cycling data for specific projects.
Vancouver cyclists, pedestrians Intersection counts are also done on a project-basis, and a sample of citywide or project-basis demographic counts are also done.
West Vancouver cyclists, pedestrians Traffic counts are done with hose tubes for projects. Has also done detailed studies for major corridors that are referenced for projects.
2 Cyclists and/or pedestrians. Transit data are not collected by municipalities, but by Translink.
12
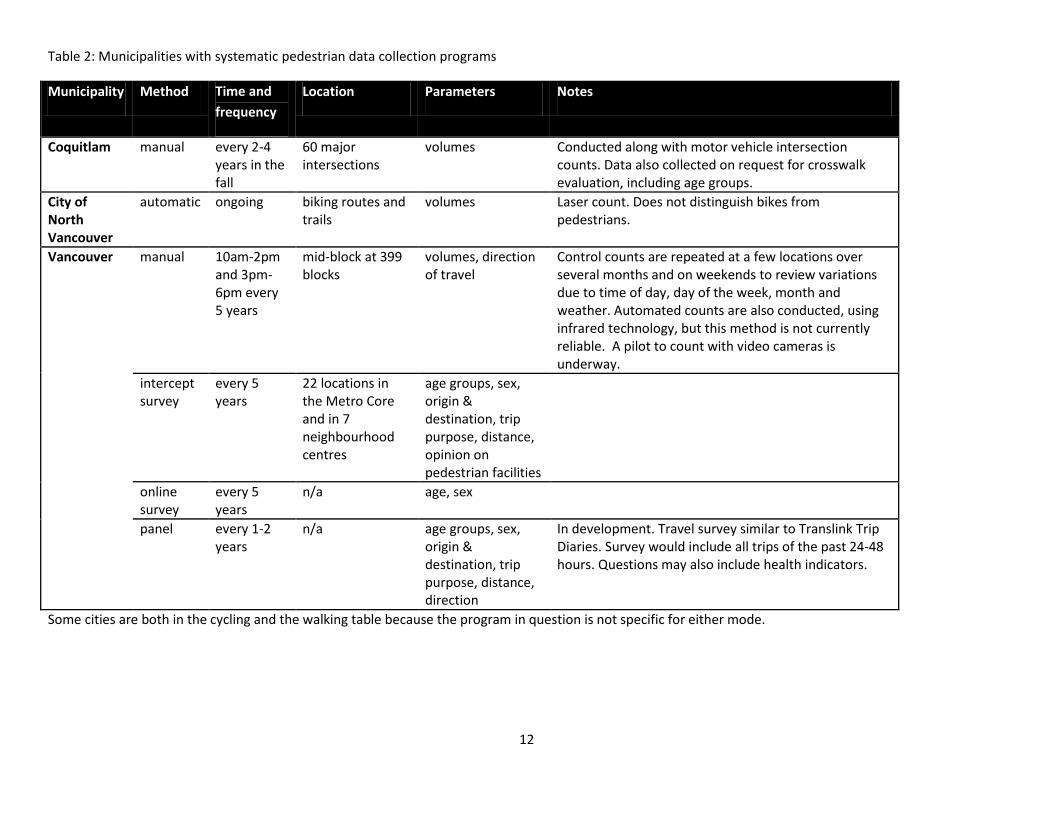
Table 2: Municipalities with systematic pedestrian data collection programs
Municipality Method Time and
frequency
Location Parameters Notes
Coquitlam manual every 2-4 years in the fall
60 major intersections
volumes Conducted along with motor vehicle intersection counts. Data also collected on request for crosswalk evaluation, including age groups.
City of North Vancouver
automatic ongoing biking routes and trails
volumes Laser count. Does not distinguish bikes from pedestrians.
Vancouver manual 10am-2pm and 3pm-6pm every 5 years
mid-block at 399 blocks
volumes, direction of travel
Control counts are repeated at a few locations over several months and on weekends to review variations due to time of day, day of the week, month and weather. Automated counts are also conducted, using infrared technology, but this method is not currently reliable. A pilot to count with video cameras is underway.
intercept survey
every 5 years
22 locations in the Metro Core and in 7 neighbourhood centres
age groups, sex, origin & destination, trip purpose, distance, opinion on pedestrian facilities
online survey
every 5 years
n/a age, sex
panel every 1-2 years
n/a age groups, sex, origin & destination, trip purpose, distance, direction
In development. Travel survey similar to Translink Trip Diaries. Survey would include all trips of the past 24-48 hours. Questions may also include health indicators.
Some cities are both in the cycling and the walking table because the program in question is not specific for either mode.

13
Table 3: Municipalities with systematic cycling data collection programs.
Municipality Method Time and
frequency
Location Parameters Notes
Burnaby manual 5-7 consecutive days in summer
several cycling facilities
volumes
automatic (hose)
ongoing off-street urban trials
volumes
City of North Vancouver
automatic ongoing biking routes and trails
volumes Laser counts. Does not distinguish bikes from pedestrians.
Richmond automatic ongoing major new greenway
volumes Will be installed 2014, depending on funding. Richmond also does cyclist counts on a project basis.
Vancouver automatic temporary changing locations volumes
automatic permanent 15-20 locations on cycling facilities
volumes Data are supplemented on a project basis by manual counts that include age groups and sex.
manual Age groups, sex, sidewalk riding, riding with children
panel every 1-2 years
all trips of the past 24-48h
age groups, sex, origin & destination, trip purpose, distance, direction
In development. Travel survey similar to Translink Trip Diaries. Survey would include all trips of the past 24-48 hours. Questions may also include health indicators.
Some cities are both in the cycling and the walking table because the program in question is not specifically for either mode.
14
3.2.2 Road infrastructure and parking supply While a comprehensive inventory of built environment data was not a primary goal of this project, it did come up in most interviews. Most municipalities have GIS data to inventory infrastructure amenities such as sidewalks, bike paths, wheelchair ramps, city-owned parking, transit stops and traffic signals, but what information is available differs between municipalities. These geospatial data are sometimes publicly accessible and may be available open access in some cases, such as City of Vancouver’s Open Data Catalogue, or the City of Coquitlam’s counts data on their website. These datasets are used to keep track of newly added facilities, and to set priorities for repairs and replacement. Translink compiled an inventory of sidewalks in the region, which will become available in 2013. The data come from municipal GIS files and from Google Streetview. Each street segment is coded as to whether it has a sidewalk on one side of the street, both sides of the street or no sidewalk. The data include concrete sidewalks only, but not pedestrian shortcuts, shared multi-user pathways, cul-de-sac connectors, and sidewalks on private roads. This dataset is accessible through a data sharing agreement with Translink. Note that generally speaking the quality of the built environment data may vary across data holders, but an assessment of this is beyond the scope of this project.
3.3 Data collected by other organizations The traffic counts that municipalities have are often supplemented with data from other sources. This next section summarizes data municipalities mentioned they rely on as external data sources when developing their active transportation plans and policies. Many smaller municipalities indicated that they do not have capacity to analyze these data sources in depth. This section also introduces several other sources of information that is potentially useful for municipalities, but that were not mentioned in the interviews, such as air quality monitoring and health data from health authorities.
3.3.1 Crashes and injuries Several provincial, regional and local organizations collect data on crashes and/or injuries.
Insurance Corporation of British Columbia (ICBC)
ICBC crash data are gathered from reports made to ICBC by insured registered vehicle owners, drivers, pedestrians and cyclists. ICBC has data on all crashes involving motor vehicles that are claimed, such as details on when and where a crash happened (most crashes are geocoded to latitude and longitude, and aggregated to intersection or mid-block location in analyses), type of crash, driver and vehicle data, what entities (e.g. vehicle, pedestrian, cyclist) were involved and the severity of injuries. Some data on crashes come from police or RCMP. It should be noted that the ICBC data do not represent all crashes. They miss information on single crashes, crashes that do not involve motorized vehicles, and crashes that are not claimed. Municipalities often have agreements with ICBC to provide regular updates on an annual or semi-annual basis. Requests for data vary by municipality, but usually include the vehicle population and crash details. Municipalities are interested in the hot spots for crashes in their area, which capitalizes on the geographic locations of the crashes available in ICBC’s database.
15
Some of the data are summarized in ICBC’s quick statistics report that contains information on crashes in different regions of the province, and statistics on numbers of injuries, crashes per transportation mode, as well as the top-10 crash intersections. It also contains data on the number of vehicle registrations and active driver’s licences. Factsheets are available showing basic statistics of the number of crashes, the number of injured victims and pedestrian crashes by municipality (in Greater Vancouver and Fraser Valley).[5] New since 2007, interactive crash maps are also available on the website, which can visualize crashes involving cyclists and pedestrians by year and city in Metro Vancouver. An example of such a crash map is included in the promising practices, section 4.4. B.C. Injury Research and Prevention Unit (BCIRPU) The BCIRPU is a research organization that aims to reduce the societal and economic burden of injuries in B.C. BCIRPU has developed an Injury Data On-line Tool (iDOT), compiling data from B.C. Vital Statistics (mortality), the Discharge Abstract Database from the Ministry of Health (by ICD-10 codes) and ICBC’s Traffic Accident System (crashes, injuries and contributing factors), making it one of the most complete data sets on injuries. iDOT can be used to gain insight into transportation-related injuries at different geographies (for example Health Authority, Health Service Delivery Area or Local Health Area). These areas do not always coincide with municipal boundaries, but municipalities can seek assistance from BCIRPU to locate injury data for their area of interest. BCIRPU receives requests for data from health authorities on a regular basis, but not from municipalities directly. The tool is available from the BCIRPU website.[6] Although BCIRPU has a very complete dataset, it would be useful to have B.C. Ambulance data and data from the B.C. Trauma Registry. BCIRPU is working on obtaining those data.
Vancouver Coastal Health (VCH) VCH receives emergency room information from 9 of 13 hospitals in the VCH area for the purposes of injury monitoring and surveillance. Data include emergency room visits and hospital admissions data, with some demographic data and information on the nature of the visit, such as ICD-10 codes, where applicable. In the case of emergency room visits, visits coded as injuries may sometimes have information in the free text fields on the nature of the injury, which body part was affected, and how the injury occurred. It may include data on whether the injury was transportation-related. However, the detail of this section varies by hospital and by doctor, and standardization of collecting this type of data may not be attainable due to the nature of emergency room pressures. The database can be queried for injuries related to transportation. Vancouver Coastal Health does not have access to B.C. Ambulance data and the B.C. Trauma Registry, but is working on obtaining access to those data.
Fraser Health
Fraser Health has B.C. Trauma Registry data from two hospitals and can get hospital discharge data from all its hospitals. These systems use external cause codes based on ICD-10 Coding Classification System. It also has injury surveillance data for non-admitted trauma patients and Emergency Department deaths through the National Ambulatory Care Reporting System (NACRS): injury surveillance data for non-admitted trauma patients and Emergency Department deaths. Injuries are grouped by fatal versus nonfatal, age group of victim and major injury types, i.e. transportation, accidental poisonings, accidental falls. Data are currently available at the Local Health Area, Health Service Delivery Area and Health Authority level. In the future, Fraser Health hopes to add a tracking mechanism for injuries to an
16
Emergency Room data surveillance system that is currently being developed for communicable diseases. Fraser Health does not currently have an injury portfolio so this health indicator is not tracked as frequently as other indicators: only yearly or less frequent. Fraser Health does not routinely track transportation-related injuries as health indicators, but it is currently producing a report on motor vehicle collisions. Fraser Health does not currently have B.C. Ambulance call data.
Police and RCMP data Certain municipalities used to get crash data from their local police or RCMP on request, but in 2008, legislation changed so that police are no longer required to attend all crashes and attendance is at their discretion. Typically only the more serious crashes involving injury or fatality are attended.
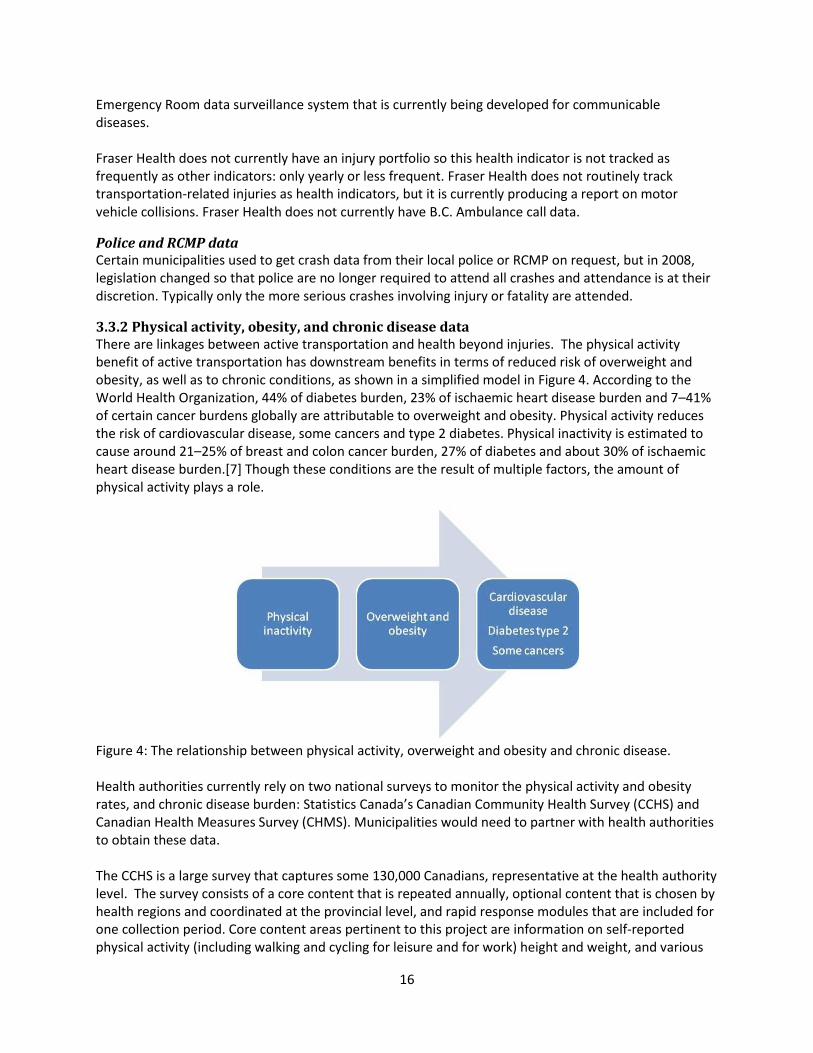
3.3.2 Physical activity, obesity, and chronic disease data There are linkages between active transportation and health beyond injuries. The physical activity benefit of active transportation has downstream benefits in terms of reduced risk of overweight and obesity, as well as to chronic conditions, as shown in a simplified model in Figure 4. According to the World Health Organization, 44% of diabetes burden, 23% of ischaemic heart disease burden and 7–41% of certain cancer burdens globally are attributable to overweight and obesity. Physical activity reduces the risk of cardiovascular disease, some cancers and type 2 diabetes. Physical inactivity is estimated to cause around 21–25% of breast and colon cancer burden, 27% of diabetes and about 30% of ischaemic heart disease burden.[7] Though these conditions are the result of multiple factors, the amount of physical activity plays a role.
Figure 4: The relationship between physical activity, overweight and obesity and chronic disease. Health authorities currently rely on two national surveys to monitor the physical activity and obesity rates, and chronic disease burden: Statistics Canada’s Canadian Community Health Survey (CCHS) and Canadian Health Measures Survey (CHMS). Municipalities would need to partner with health authorities to obtain these data. The CCHS is a large survey that captures some 130,000 Canadians, representative at the health authority level. The survey consists of a core content that is repeated annually, optional content that is chosen by health regions and coordinated at the provincial level, and rapid response modules that are included for one collection period. Core content areas pertinent to this project are information on self-reported physical activity (including walking and cycling for leisure and for work) height and weight, and various
17
chronic conditions. The 2011 rapid response module contained questions about neighbourhood built environment. In the past, the province of B.C. paid for oversampling of the CCHS so data could be utilized at regional and local levels (health service delivery areas and local health areas).[8] The CHMS is a smaller but more in depth survey. Data collection occurs every two years and consists of a household questionnaire and clinical measurements. Pertinent to this project, the household questionnaire gathers information related to medical history, current health status, lifestyle and physical activity, the environment and housing characteristics, as well as demographic and socioeconomic variables. Clinical measurements include blood pressure, height, weight and physical fitness.[9] Statistics Canada’s health profile application gives information on health status and is designed to give quick access to the latest health-related data for a selected health region or census metropolitan area, providing the corresponding provincial data by default, but users can easily select a different area for comparison. The Health Profile features sub-provincial data from a number of sources including Statistics Canada's vital statistics, Canadian Cancer Registry, the Canadian Community Health Survey, and Census of Population, as well as hospitalization data from the Canadian Institute for Health Information.[10, 11] this source may not be as useful for municipalities. Moving forward, the health authorities are embarking on local surveys to enhance the availability of health data at local levels. Vancouver Coastal Health launched the Healthy Richmond and North Shore Community Wellness surveys in 2012 that collected local level data on health and built environment, including data on transportation modes. These two were pilots for a larger, region-wide (Vancouver Coastal Health and Fraser Health) initiative called My Health My Community that will include a number of built environment and (active) transportation indicators. This survey will be conducted in the summer of 2013 and will be an important future source of local health data.
3.3.3 Transit Transit data are collected by Translink and BC Transit. Municipalities can use these data.
Trip diaries Translink conducts trip diary surveys every 4-5 years on weekdays in the fall (travel peak season). Surveys are conducted through phone interviews and online surveys to assess travel behaviour in Metro Vancouver and the Fraser Valley Regional District, including in areas where Translink does not provide service. Approximately 2 per cent (20,000 households) of the population is sampled, but some municipalities pay Translink for oversampling in order to be able to draw meaningful conclusions at smaller geographies. Trip Diary data include mode share, origin and destination of trips, purpose of trip, start and end time, and personal and demographic data. Trip dairy data are an important source of information for most municipalities, although some indicated that they do not have the resources to analyze these data. Aggregate (city-level) analyses are publicly accessible, but not the data itself. Municipalities and other organizations that have a valid reason can request data through a data sharing agreement, which most municipalities interviewed do. Results and analyses are not automatically shared with health authorities, but they could request information on mode share, walking distance etc, from Translink.
Transit usage counts
Both Translink and BC Transit collect data about transit ridership in their service areas.
18
Each of the 16 stations of the Canada Line is equipped with automatic passenger counters (APCs). They are located at access points of the station (elevators, staircases). The APCs provide very reliable transit data for Skytrains (100 per cent sample). Translink also conducted manual station counts in the fall of 2011 for the Expo and Millennium lines. The data collected include the number of people entering and exiting SkyTrain Stations and the train link loads between stations.
Most of the buses operated by Translink and BC Transit are not equipped with APCs (20 per cent of BC Transit’s fleet have APCs). The data inferred from APC counts range from line level ridership statistics down to bus stop statistics. Translink publishes an annual summary of bus route boarding data, which municipalities can access.[12] BC Transit data are not readily available, but municipalities and health authorities can request data. BC Transit is working to expand its data collection, storage, analysis, and access to information capabilities with the resources currently available. The Farebox also provides information on boardings, but not on the location of the boarding.
The Fare Gates and introduction of the Compass Card, which will be introduced in 2013, will provide more information on transit ridership.
3.3.4 Trip to work data The Census collects some data relevant to transportation. Until 2006, the long-form census questionnaire included questions about the place of work and the mode of transportation to work. Together with Translink’s Trip Dairy data, the Census is an important source of modal split data for municipalities. In the 2011 Census, the information previously collected by the long-form census questionnaire was collected as part of the new voluntary National Household Survey (NHS). Representativeness and quality (due to a lower response rate) are concerns. This questionnaire covers most of the same topics as the 2006 Census. Results have not been released yet, and will not be comparable to previous Census data. Another limitation is that Census data only provide information on the trip to work, not any other trip purpose, which may either underestimate or overestimate trips made by active transportation. Census data are publically accessible, but some municipalities and Metro Vancouver acquire customized data sets through the Canadian Data Consortium. This allows for an assessment of modal split by factors such as age group or by location of residence and location of work, at pertinent geographical scales. These analyses are not publicly accessible.
3.3.5 Bike to work week The Vancouver-based cycling organization HUB organizes Bike to Work Week events twice a year. Participants can map and track their trips, enter prize draws and compete with other organizations. Some municipalities (New Westminster, Vancouver) that participated in HUB’s Bike to Work Week get some information on counts from HUB. However, these counts may not be systematic, or representative of cycling rates outside of the event week, and include trip purposes beyond only “Bike to Work”.[13]
3.3.6 Provincial traffic counts The B.C. Ministry of Transportation and Infrastructure collects several types of data on roads throughout the province: volume, speed, length, axle class, and weigh-in-motion (WIM) of motorized traffic. A small selection of these is major roads in the Lower Mainland. The website contains user documentation that explains the terminology and the types of interactive reports that can be created on the website.[14]
19
3.3.7 Air quality Metro Vancouver is responsible for air quality monitoring in the region. Every 5 years, Metro Vancouver produces an emissions inventory to determine the different sources of air pollutants, including transportation-related emissions that are derived from U.S. EPA models. The emissions inventory is used by Environment Canada for comparison between urban centres in Canada and to track progress on air quality goals in Metro Vancouver's Integrated Air Quality and Greenhouse Gas Management Plan and the Regional Growth Strategy. Metro Vancouver also operates 26 air quality monitoring stations throughout the region (22 in Metro Vancouver and 4 in the Fraser Valley Regional District). Stations measure gaseous and particulate air pollutants. Monitoring stations are typically not along roads, but in the community to estimate residents’ exposure. Reports with the monitoring data are released annually to the public, researchers and politicians and are used to track progress on air quality goals and trends over the years. Metro Vancouver also publishes hourly Air Quality Health Indices (AQHI) for six zones in the Metro Vancouver and Fraser Valley Regional District areas.[15]
3.3.8 Regional summary reports
Both Metro Vancouver and the Fraser Valley Regional District (FVRD) have some useful summary reports about transportation and health. Metro Vancouver key facts include data on registered vehicles, transit ridership, travel times survey and demographics. Data sources are from the Census, Translink and ICBC (amongst others).[16] The FVRD produced snapshots that provide an overview of health and active living[17] and commuting and places of work[18] in the region, based on Census data and Translink’s Trip Diaries. They are used as a communication tool to link transportation and health.
3.4 Data needs When municipalities were asked about their needs for data, they listed different types of needs, varying from more and better data collection to better access to existing data sources. Most needs relate to transportation data, and only a few municipalities expressed an explicit need for health data. The needs in this section are grouped according to type. The needs listed below are not a ranking of needs, nor are they a comprehensive assessment of the most-mentioned needs. If one municipality indicated something as a particular need, this does not mean that other municipalities did not have that need, but simply that it did not come up in the interview. There is an indication of how many organizations expressed a particular need: * = one organization, ** = a few organizations, *** = many organizations and **** = most organizations. Some smaller municipalities indicated that they did not have any data needs, because they would not have the capacity and resources to collect, process and analyze additional data. However, they indicated that in an ideal world, it would be useful to have data on active transportation.
3.4.1 Sharing data and accessibility
More and better data at city level/ better access to data from Trip Diaries **
One keeper of data that municipalities have access to *
Better regional health data **
Better collaboration on data collection with the health authorities on crashes, in particular crashes that do not involve motor vehicles *
Knowledge of and access to data from health authorities **
20
Make health data accessible and understandable for planners, the public and political decision makers *
Share information from Bike to Work Week organized by HUB *
3.4.2 Linking health and transportation
What health metrics to use, link transportation to health ****
Cost-benefit of investments related to (long-term) health outcomes **
Physical activity level data to assess the impacts of transportation projects **
Health outcomes related to living near arterials, health data and local air quality measurements **
3.4.3 Technology & best practices of data collection
Align efforts: Make data collection more comparable and standardized between cities in the region and Canada-wide: ask the right and similar questions in municipal surveys, such as trip and health surveys ***
A comprehensive regional traffic count system for all modes because municipal boundaries are artificial. A regional count system would provide insight into the number of kilometers traveled, and allows comparison of modelled and actual data ***
How to monitor changes in transit use *
Better screenline data that separate cyclists and pedestrians *
A regional interception survey where cyclists are asked about their opinions and concerns *
What are the most useful/meaningful data not currently collected? *
3.4.4 Data on transportation modes
Better information on pedestrians: o counts ** o demographics * o movements: who travels where and why ** o 24h volume data *
Better data about cyclists o automated count systems ** o demographics * o counts crossing municipal boundaries ** o 24h volume data * o use of new cycling facilities *
Data on non-commuting trips for which Translink’s Trip Diary samples are too small **
Information on distance and purpose of trips made by active transportation and other modes **
Capacity to collect, monitor and analyze traffic data, including expanding data on pedestrians and cyclists ***
Pedestrian and cyclist counts on recreational trails and other locations without traffic counts *
Bus stop volume for the busiest 10-20 bus stops to determine if infrastructure improvements are needed *
More information on transit ridership *
3.4.5 Data on infrastructure
Regular data collection on wheelchair ramps *
Better data on sidewalks *

21
More information on quality and type of walking facilities *.
What type of facilities or infrastructure do people prefer **.
Data on parking supply and use *
Data on on-street parking demand/use on streets identified as potential cycling routes *
3.4.6 Data on injuries and safety
Better information on crashes and injuries, especially of pedestrians and cyclists and non-reported crashes **
Data on severity of injuries **
Injury data other than ICBC collision data *
Insight into travel behavior and the link between perceived and actual safety: why people walk or bike and why they do so along particular streets *
22
4. PART 2: Promising practices of data collection and sharing With the help of Advisory Committee members and our networks, we identified a number of promising practices related to transportation and health data collection, data sharing, visualization and monitoring health impacts of transportation decisions. The examples included in this section may meet some of the needs that municipalities and Advisory Committee members expressed.
4.1 Data collection: National Count Day Some municipalities indicated in their interviews that they are interested in a regional approach to data collection, using standardized methods. A regional count day would help solve some of the needs for better and more standardized active transportation data. The U.S.-based National Bicycle & Pedestrian Documentation Project is an effort to provide a consistent model of data collection and ongoing data for use by planners, governments, and bicycle and pedestrian professionals. The second week in September is proposed as the official annual national bicycle and pedestrian count and survey week. Participants in the National Documentation Project shall pick at least one weekday and a Saturday following or preceding the official count dates. Optional counts can be conducted in January, May and July to understand seasonal changes in walking and cycling. Counts should be done manually through screen line counts or intersection counts, and may be done by staff or volunteers. The project website contains data collection instructions, forms and data entry spread sheets that municipalities could use to collect data in a standardized method. Note that municipalities would have to decide on count locations, but suggested criteria for this are also provided on the website.[19]
4.2 Data sharing: Peel Data Centre The Advisory Committee and municipalities expressed the need for a regional holder of transportation data that is publicly accessible. An example of such a regional data holder is the Region of Peel that houses the Peel Data Centre, which provides data to decision-makers as well as to the broader community. The region compiles data including health status, health behaviours, preventive health practices and health-care utilization collected by Ontario’s health units. It also includes transportation data from the Transportation Tomorrow Survey (comparable to Translink’s Trip Diaries), and traffic counts, including full (every 5 years) and partial (more frequent) traffic counts from the Peel Region, the Greater Toronto Area Regional municipalities, and the Ontario Ministry of Transportation.[20] In addition to providing transportation and health data, the Peel Data Centre disseminates GIS and tabular data and Census data specific for the region that can be useful for transportation planners in municipalities. Certain municipalities in the Lower Mainland have made progress to share their count and GIS data in a publicly accessible system, but there are no regional initiatives at this time.
23
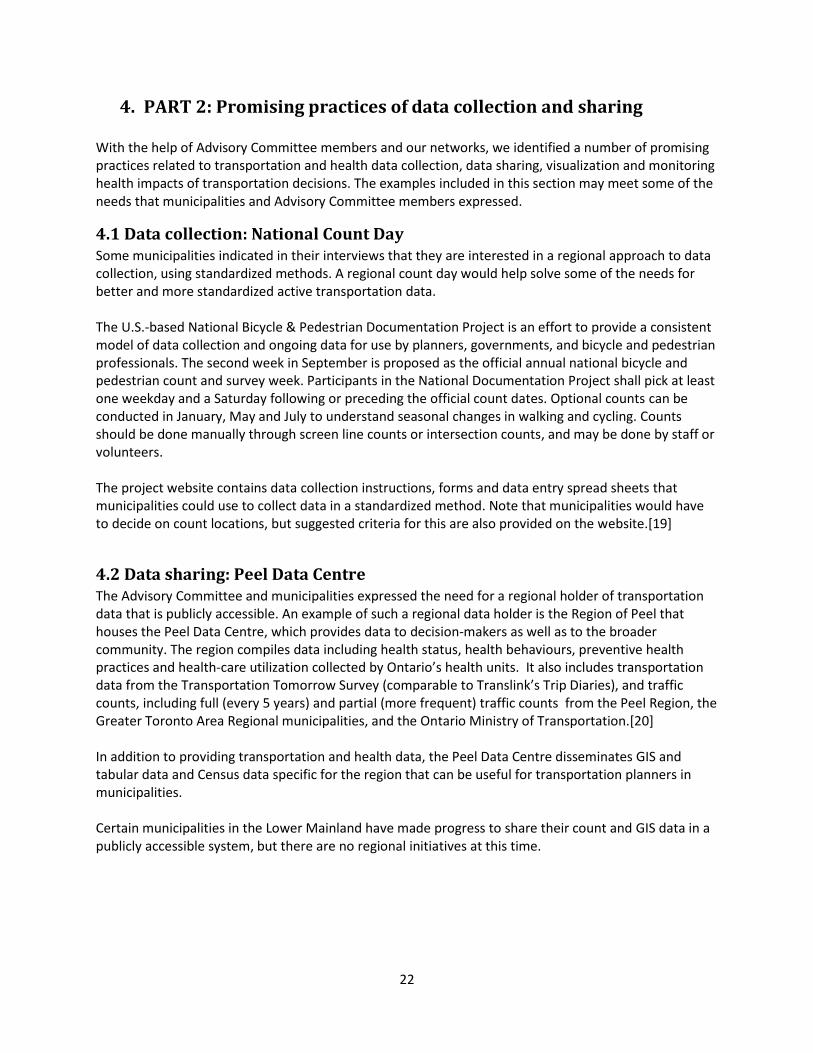
4.3 Visualization: Diabetes in Toronto ICES Atlas The Advisory Committee expressed a wish for better sharing data collected in a way that is understandable for different (non-expert) audiences. Maps have been used in several instances to achieve this. An example is the ‘Diabetes in Toronto Atlas’, produced by the Institute for Clinical Evaluative Sciences (ICES), see Figure 5 below. This example shows the relationship between diabetes rates and neighbourhood activity friendliness. In dozens of maps, the Atlas presents visually the relationship between neighbourhood characteristics and the local prevalence of diabetes, illustrating and measuring patterns in and across Toronto’s 140 neighbourhoods. These spatial concepts and approaches help quantify and better understand how the urban environment influences lifestyle choices and how this might impact rates of diabetes. Using different sources of information, such as municipal land use data, the Census and data from several ministries, the Atlas looks at the following factors related to diabetes prevention and control in Toronto: population density, service density and dispersion, immigration, socioeconomic status, ethnic composition, crime rate, car ownership, access to healthy and unhealthy food, opportunities for physical activity, and access to health care and its relationship to diabetes.[21]
Figure 5: map showing the spatial relationship between diabetes rates and activity friendliness in Toronto. Mapping exercises have also been done in B.C. An example is the B.C. Wellness Atlas, which has over 400 maps that show a large variety of indicators that provide an overview of wellness in B.C. The Atlas
24
uses a positive approach in that it maps wellness indicators instead of disease rates. For example, it maps healthy weights instead of obesity levels and smoke-free rates instead of smoking rates, making it possible to focus on health and wellness generating factors. Wellness assets include families and income, housing characteristics, social connections, aspects of improving health, education, culture and arts, volunteerism, and safety. The Atlas was described as an innovative approach to knowledge development and transfer by the Public Health Agency of Canada in 2009.[22] The Atlas is a good start in visualizing data, but it may not be suitable for municipalities because it is not at the scale they are interested in: The geographical unit used in most maps is the Health Service Delivery Area, which usually spans several municipalities (as shown in figure 3).
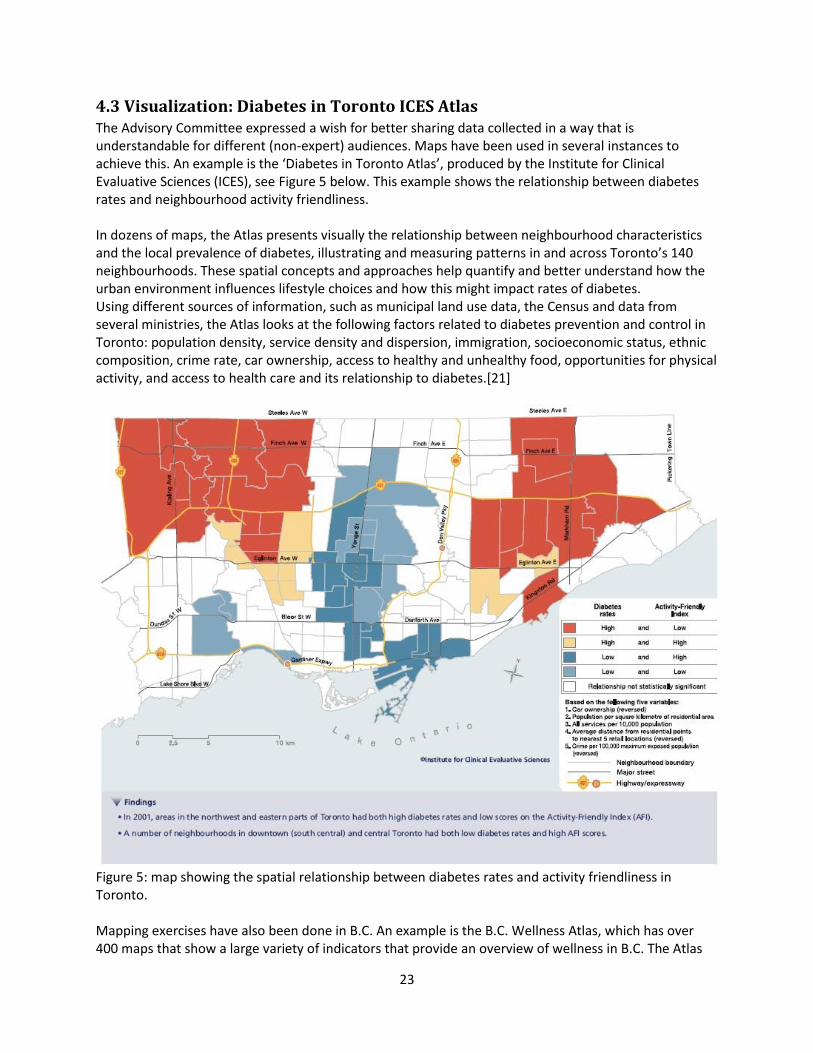
4.4 Visualization: Crash and injury maps Another mapping example is that of road traffic injuries. Montreal Public Health mapped the geographic distribution of pedestrian crash sites in the city, based on information from Montreal Ambulance services. Crash sites involving pedestrians are mapped below in Figure 6. This map has been very compelling for communicating with decision makers about injury risks.
Figure 6: Distribution of pedestrian victims in Rosemont, Montreal.[23] In B.C., ICBC has also initiated crash mapping tools. The ICBC website contains links to an externally managed website with interactive maps. Users can generate maps for crashes at intersections (in municipalities within Metro Vancouver and the Fraser Valley), crashes involving cyclists (municipalities in
25
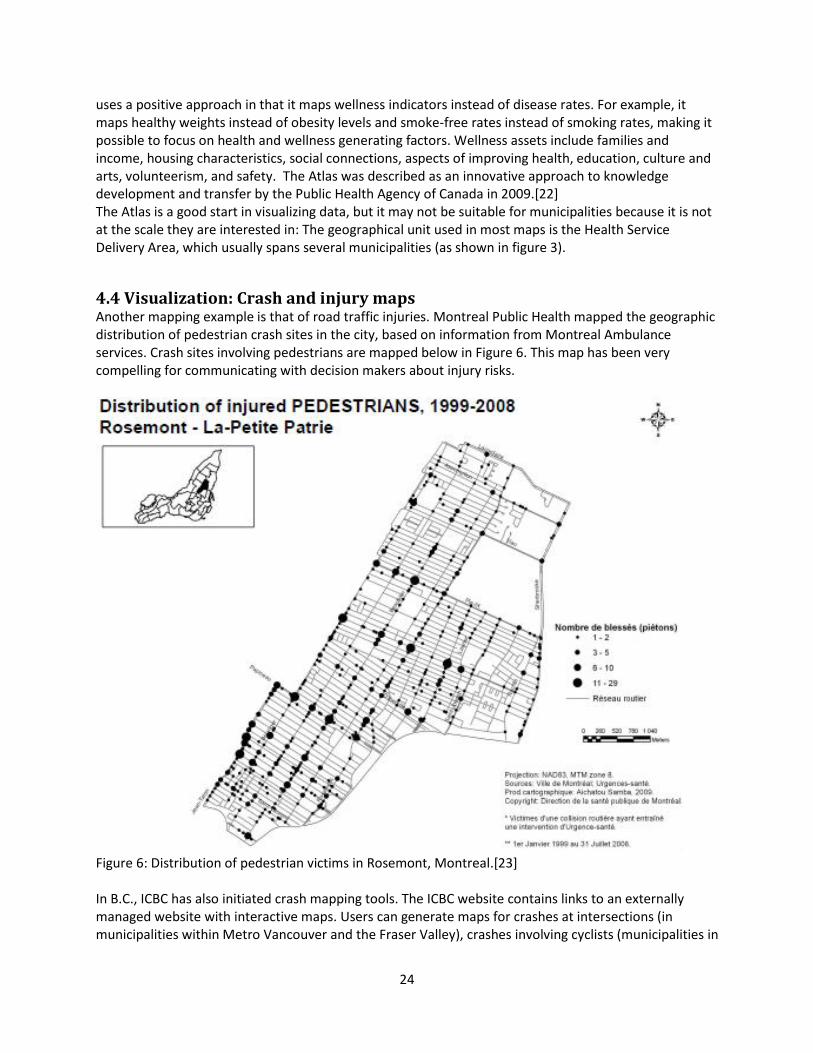
Metro Vancouver) and crashes involving pedestrians (municipalities in Metro Vancouver and the Fraser Valley). The pedestrian and cyclist crash maps only include crashes where sufficient location information is available to determine a latitude and longitude. Locations are approximate and ‘snap’ to the nearest intersection or mid-block. Maps can be customized by city, year and month. Figure 7 below is an example of a map showing crashes involving pedestrians in New Westminster from 2007- 2011.[24]
Figure 7: Map of crashes involving pedestrians in New Westminster 2007-2011.
4.5 Assessing health impacts: Health economic assessment tool for cycling and walking (HEAT) Some municipalities would like to better assess the health impacts of transportation decisions. HEAT is an online tool, developed by the World Health Organization, which quantifies the economic value of the health-related benefit from a given level of walking or cycling, based on reduced mortality. It can be used to assess the health-related impact of changes in walking and cycling (modeled or measured) which result from changes to the built environment, for example after implementing a new policy or building new infrastructure. There are separate tools for walking and for cycling (HEAT for Walking and HEAT for Cycling).[25] HEAT for cycling is being used in several countries within and outside the European Region, including Austria, the Czech Republic, Sweden, the United Kingdom and New Zealand. The Centers for Disease Control and Prevention are adapting the tool for use in the United States of America.
As an example of the utility of the tool, Austria had a cycling modal share of currently 5%, with an average trip length of 2 km. Calculations made with the HEAT tool estimate that this level of cycling saves 412 lives every year owing to regular physical activity. The corresponding average annual savings for Austria from this reduced mortality are estimated to amount to €405 million.
26
In Canada, Toronto Public Health relied on this tool in its report “Road to Health: Improving Walking and Cycling in Toronto”.[26] It has also been used by the Ontario Public Health Association for active transportation planning in Ottawa. HEAT can also be used to provide input into more comprehensive cost-benefit analyses, or prospective health impact assessments: for instance, to estimate the mortality benefits from achieving national targets to increase cycling or walking, or to illustrate potential cost consequences of a decline in current levels of cycling or walking. The WHO-HEAT website contains a methodology and user guide on how to use HEAT and examples of countries that applied the tool. Like any other tool, HEAT has its limitations. However, it is likely the most comprehensive tool currently available. The HEAT tools require several data inputs, which are listed below along with possible data sources for the Lower Mainland:
- How many people are walking/cycling (Translink Trip Diaries, municipal counts) - Average duration of walking/cycling per person: distance per day/week, or the duration per day,
or the number of trips per person/day/week, or the number of steps taken per day (Translink Trip Diaries)
- Crude mortality rate (can use default value, or access through Statistics Canada/health authorities)
- Value of a statistical life (can use default value) - Time period over which health benefits will be calculated - Discount rate (to allow a calculation of the net present value)
4.6 Assessing health impacts of transportation plans: Health Impact Assessment Any plan or policy, including decisions made in transportation planning, has the potential to affect health, and several municipalities indicated they want to better assess the impacts of transportation plans. An increasingly popular method to assess health impacts is through a health impact assessment (HIA), which is best defined as:
‘A combination of procedures, methods and tools by which a policy, program or project may be judged as to its potential effects on the health of a population, and the distribution of those effects within the population.'
Health Impact Assessment (HIA) is a means of assessing the health impacts of policies, plans and projects in diverse economic sectors using quantitative, qualitative and participatory techniques. HIAs screen potential -sometimes unintended- health impacts from a broad perspective. An HIA typically consists of six steps: screening, scoping, assessment, recommendations, reporting and monitoring and evaluation. HIAs can take anywhere from a couple of days (rapid HIA) to several months or years if new data are collected. HIAs can be qualitative or quantitative. Quantitative HIAs are heavily data-driven, but impacts can also be assessed in terms of small, medium and large. Predictions are made by systematically exploring the different causal pathways by which a proposal could affect health. HIAs are being used widely in Europe and in the U.S. to assess the impacts of transportation plans and policies.[27, 28] A related CLASP project in Montreal will look at the data needed to carry out HIAs in transportation scenarios.
27
An example of a Health Impact Assessment in North America is the Community Transportation Plan in the City of Decatur (GA, U.S.A.), where a rapid HIA was conducted. The HIA focused on potential health impacts related to safety, social connections and physical activity that may be affected by the Community Transportation Plan. The HIA found that the Plan may ultimately lead to a slight reduction in car use and thus a reduction in health problems that have been related to car use, such as injuries and the risk of obesity. Additionally, there would be immediate benefits from the increase in biking and walking leading to increased levels of physical activity and social capital. To best leverage potential health benefits, the HIA recommended: 1) developing of a community-wide campaign to promote physical activity; 2) partnering with local schools to promote childhood physical activity; 3) developing intersections to be compliant with Accessible Design Standards; 4) emphasizing the mobility of Decatur's most vulnerable populations; and 5) prioritizing connectivity throughout the city. After completion of the Community Transportation Plan, the City of Decatur created an Active Living Division to provide support services that contribute to the quality of life of its citizens.[29]
5. PART 3: Recommendations to address data needs This chapter connects the municipal data needs and promising practices with specific recommendations for different municipalities. A tiered approach is proposed for the recommendations, depending on the level of health and transportation data collection, data needs and capacity of each of the municipalities. The tiered approach is depicted in figure 8. Some general, region-wide recommendations can be derived from the data needs and promising practices; they are described first, followed by the tiered recommendations.
5.1 Region-wide recommendations
5.1.1 Establish a regional approach to data collection for transportation and health A regional count day could be established, following the example of National Count Day in the U.S. A regional count day (Promising Practice 4.1) would make data across the region (and internationally!) comparable and it would provide insight into regional traffic patterns crossing municipal boundaries, which many municipalities indicated was a need. Some municipalities indicated they were interested in a regionally standardized approach to data collection and could take the lead. The City of Vancouver is currently developing its own travel survey that other municipalities could follow once they are at the stage of collecting better travel data. Also, existing committees (for example the Bicycle Working Group and/or the Major Road Transportation Advisory Committee) could help start this conversation. Community organizations and residents could be engaged as volunteers to assist with counts and surveys. Adopting a regional count day may result in a change in methodology from what has been done previously. However, a regional count program could be adopted over the years, for example when new OCPs or long term transportation plans are being developed. The methodology could be an add-on for municipalities that already have established programs, and could incorporate volunteer counters, as has been done in Portland, Oregon.
28
Health data will soon be collected regionally through the My Health My Community survey being developed by Vancouver Coastal Health and Fraser Health. The region should aim to agree on a long-term health metric.
5.1.2 Establish a regional data base of transportation and health data
Once a regional approach to data collection has been established, data from different sources could be stored in one location, for example a (existing) website. A next step would be to establish a regional holder of the data that could include crash report summaries, health survey data from Statistics Canada and health authorities and Census data, as is done in the Peel Region. A regional data base would address the need for better regional data and accessibility of data. Making data more open access can attract researchers and skilled citizens to use the data, and may bring added value for municipalities, especially the ones that lack resources to fully analyze their data. A regional database would be the natural result of a regional approach to data collection, and would allow transportation planners and public health staff to view data compiled in different sectors in a one-stop shop. As was suggested in the proposed Bicycle Monitoring Program report prepared for Translink, Translink could take on this role.
5.1.3 Leverage funding and resources Municipalities expressed a need for more funding and resources to carry out comprehensive transportation monitoring. Available funding and resources could be leveraged across health and transportation sectors, for example by establishing a regional approach to data collection and create more consistency in what data are collected.
5.1.4 Enhance knowledge exchange between municipalities Municipalities are using different methods to count traffic; this could be more streamlined. For example, CLASP could organize a workshop on data collection methods used across municipalities, similar to what Translink did for its Bicycle Monitoring Program report. Municipalities could share their knowledge and know-how through existing committees (for example the Bicycle Working Group and/or the Major Road Transportation Advisory Committee) or platforms so they could align their data collection efforts. An example would be to align the questions asked in Vancouver’s travel survey (to be developed) and Vancouver Coast Health’s My Health My Community survey that is currently being developed and to share experience and learn from one another. In knowledge exchange meetings, municipalities could also try to agree on a common health metric that should be tracked over time to monitor the health impact of transportation decisions, even if not all municipalities are at the stage of tracking health metrics yet.
5.2 Tiered recommendations Because of the large differences between municipalities in terms of data collected and data needed to better integrate health into transportation plans, some of the recommendations are tiered. This should be viewed along a continuum, where there is no strict separation between tiers, and recommendations and promising practices overlap. This approach will allow municipalities to place themselves along the continuum illustrated in Figure 8. Tier 1 proposes recommendations for municipalities that collect limited or no transportation data and that are interested in collecting better data on active transportation. Municipalities that are at this initial stage of integrating health into transportation planning would likely also benefit from the National
29
Count Day promising practice. The District of Mission and the District of Kent may fall under this category. Tier 2 municipalities are those that collect some active transportation data, and are interested in standardizing their data collection and link their outcomes with comprehensive data on injuries and other health outcomes. They may or may not be very familiar with existing sources of health and injury data and would like to have better access to these sources. They would likely benefit from promising practices such as National Count Day, the Peel Data Centre and interactive crash and injury maps available. Most municipalities interviewed are likely at this stage. Tier 3 municipalities typically have a lot of transportation data and the capacity to analyze them. They have a good understanding of how transportation impacts health and they are very familiar with injury data, but would like to expand to other health indicators. The City of Vancouver is at this stage, and several other cities are likely approaching it, such as Burnaby, Coquitlam, New Westminster and Surrey. Specific recommendations for each of the tiers are described in this section.
5.2.1 Expand existing municipal intersection counts to include active transportation (tier 1, 2) In those municipalities where intersection counts are done manually and where an interest exists in monitoring health outcomes of transportation planning, active modes of transportation could be included. Not all municipalities at the earlier stages have intersection counts and/or active transportation data collection. Methodology to include or expand intersection counts could be adopted from the municipalities that do have these counts, or from the National Count Day resources described in section 4.1. Demographic data for cyclists could also be recorded in these expanded intersection counts. For smaller municipalities with limited resources and capacity, counts could be taken on by community groups and/or volunteers. Expanding existing intersection counts would address the need for more and better data on active transportation. Though doing this will not solve all data needs in municipalities, it is a good start for collecting active transportation data in a standardized manner. 5.2.2 Use sources of information already available (tier 2, 3) Some of the needs listed by municipalities can be addressed by connecting them to existing sources of health data that municipalities may not be familiar with, as described in this report. While most municipalities appear to have agreements with ICBC to obtain injury data, other sources of injury data may not be used as extensively. For example, the B.C. Injury Research and Prevention Unit (BCIRPU) and health authorities have databases, regular reports and interactive maps with transportation-related and other injuries that municipalities can use. Health authorities also have data on other health indicators than injuries from national surveys conducted by Statistics Canada. The data collected are typically collected at Health Service Delivery Area or Local Health Area, but BCIRPU and health authorities can help municipalities translate these data to the municipal level. Translink has information about transit ridership from its manual Skytrain counts and automatic passenger counts on Skytrains and buses that may also be useful to health authorities and municipalities.
5.2.3 Add health-related questions to Trip Diary Survey and transportation questions to local health surveys (tier 3) Trip Diary surveys currently document transportation behaviour, but can potentially be expanded to include some health indicators, such as weight or chronic disease status. Translink indicated that adding

30
questions to the Trip Diary survey is not done on a request basis, but if there was a request from multiple municipalities for the same question to be added, this might be considered for inclusion in future surveys. If downstream health benefits are the interest, one possibility would be to ask for personal health number, so travel behaviour could potentially be linked to medical services usage. This would partly address the need to connect transportation with health indicators. Similarly, transportation questions could be added to local health surveys, as is being done in the My Health My Community Survey being developed by Vancouver Coastal Health. Another idea would be initiate a National ‘Health’ Count Day, perhaps in concert with World Health Day in April, where municipalities could ask their residents to submit their physical activity data for one weekday and one weekend day.
5.2.4 Assess impacts using HEAT and HIA (tier 3) Health impact assessments (HIAs) can help address the need to connect health outcomes to transportation decisions. The Health Economic Assessment Tool (HEAT) has been used in quantifying the economic value of health impacts, and data currently collected in the Lower Mainland could focus on the active travel behaviour inputs required for this tool, as described in section 4.5. Many of these data are already available from Translink’s Trip Diaries. Using HEAT would allow for tracking AT investment and the health impacts it has on residents. Importantly, the inputs required (mode share, trip distance) are already available to municipalities from the Trip Diary Survey. The HEAT tool may be particularly valuable when modeling long range scenarios, such as Transportation 2040 plans.
5.2.5 Make use of advancing technology (tier 3) In the future, new technologies could be used to better collect person-travel data, such as GPS loggers and smart phone applications. However, new technologies will also create additional data that would need to be processed and analyzed. Approaches such as crowd-sourcing could be explored for crash and injury data, albeit these new methods may bring their own quality concerns.
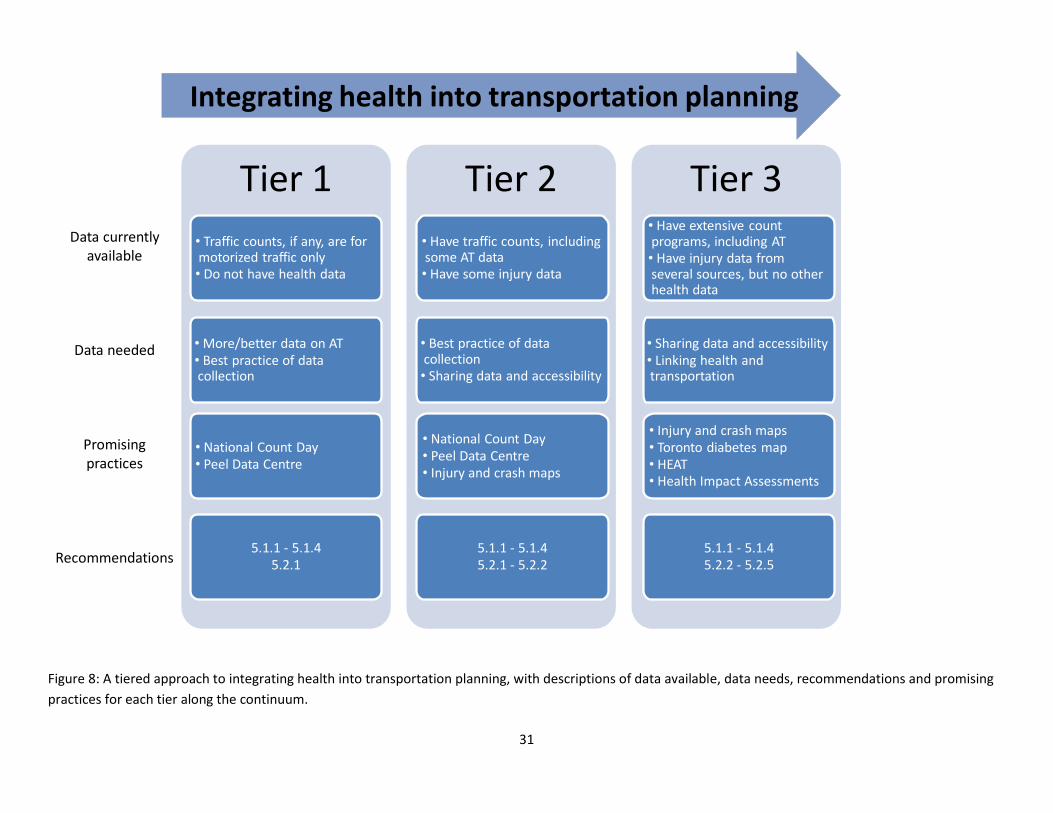
31
Tier 1
• Traffic counts, if any, are for motorized traffic only• Do not have health data
• More/better data on AT• Best practice of data collection
• National Count Day• Peel Data Centre
5.1.1 - 5.1.45.2.1
Tier 2
• Have traffic counts, including some AT data• Have some injury data
• Best practice of data collection• Sharing data and accessibility
• National Count Day• Peel Data Centre• Injury and crash maps
5.1.1 - 5.1.45.2.1 - 5.2.2
Tier 3• Have extensive count programs, including AT• Have injury data from several sources, but no other health data
• Sharing data and accessibility• Linking health and transportation
• Injury and crash maps• Toronto diabetes map • HEAT• Health Impact Assessments
5.1.1 - 5.1.45.2.2 - 5.2.5
Data currently available
Data needed
Promising practices
Recommendations
Integrating health into transportation planning
Figure 8: A tiered approach to integrating health into transportation planning, with descriptions of data available, data needs, recommendations and promising
practices for each tier along the continuum.
32
6. Discussion The first phase of the Healthy Canada by Design CLASP created tools, expertise, networks, lessons learned, and promising practices for connecting health and the built environment. The aim of the second phase of CLASP is to further accelerate the integration of health considerations into built environment and transportation policy and practice and to address challenges identified. Specifically, one of the focus activities of CLASP 2 is to improve the translation of data into action. The CLASP project in B.C. focuses specifically on integrating health into transportation planning. One of the gaps that was identified previously was the lack of knowledge about and access to transportation- and health-related data being collected in different sectors, needed to adequately monitor the health impacts of transportation decisions. Therefore, the aims of this project were to document (active) transportation data collection efforts and needs, describe promising practices for the collection and presentation of data and recommend actions to improve monitoring of the health impacts of transportation decisions over time. In completing these aims, we found there were large differences in the amount of data that municipalities collect. Some already collect and have access to a lot of data, and want to better link their active transportation investments to a range of health outcomes. Others collect only basic traffic information, and would like to know what and how to measure to get meaningful data for transportation planning to eventually monitor health impacts. And finally, there are municipalities that do not have the capacity or interest to collect any active transportation data. These findings illustrated that there are different viewpoints on the need for health at the table in transportation planning. To address the needs of municipalities at these different stages, a tiered approach is proposed to link data needs, promising practices and appropriate recommendations. Another clear finding was that a regional strategy may be preferable to delineation along municipal boundaries: for example, differences in transportation patterns between urban, suburban, and rural environments may be much more relevant than differences between municipalities. In the desire for better health data, it should be noted that health impacts are not the same as health outcomes. Health impacts refer to the determinants of health, for example the amount of physical activity a person gets. Health outcomes, or health effects, refer to more downstream diseases and conditions such as cardiovascular disease, obesity levels, cancer rates and diabetes levels. Health impacts may result in health outcomes. Health outcomes, especially at the population level, are difficult to directly link with transportation planning, because they are the result of multiple factors, including lifestyle. In addition, health outcome data may not be available at the local level. Instead, health impacts are often assessed in relation to transportation planning, because these data may be easier to measure (e.g., physical activity, or levels of walking and cycling) and are easier to link with transportation measures.
6.1 Opportunities As anticipated, transportation engineers may not be aware of data being collected in the health sector, while public health staff may not have access to transportation data (Trip Diaries, ICBC data). This report highlights that some expressed needs can be solved fairly easily by sharing data sources and
33
connecting municipalities to existing sources of information. This report is intended to facilitate this process by listing relevant sources of (health) information (see section 3.3). For example, municipalities can get injury data from their health authorities and BCIRPU and other health data from national surveys through their health authorities. Translink’s Regional Cycling Strategy, released in 2011, may provide an opportunity for standardized data collection that would collect better information on where and why people cycle. What this strategy will look like is yet to be determined, but work will be done in 2013. In the meantime, the City of Vancouver is also working on its own travel survey for all transportation modes, and may be able to serve as an example for the rest of the region. Another regional data collection effort will provide an opportunity for better access to health data, that being the My Health My Community Survey being developed by VCH and FH, specifically to provide richer local health data. Until data from that survey are available, municipalities will need to continue to rely on data collected nationally through the Canadian Community Health Survey (CCHS) and the Canadian Health Measures Survey (CHMS).
6.2 Challenges There will be challenges in reaching a full integration of health into transportation planning, that is, moving along tiers, and even beyond tier 3. One challenge is the geographic level at which data are available. Transportation data are collected at the municipal level whereas health data are available for Health Service Delivery Areas (HSDAs) and the smaller Local Health Areas (LHAs). The health administrative boundaries do not always correspond to municipal and regional districts administrative boundaries. Except for the City of Vancouver that consists of several local health areas, most municipalities in the Lower Mainland are grouped together in one LHA. However, health agencies (Health Authorities and BCIRPU) can assist municipalities with obtaining health data at the municipal level where possible. Also, while planning and transportation intersect in areas of active transportation, such as greenway development, at the regional level the two sectors are separate, with Translink covering regional transportation, and Metro Vancouver and the Fraser Valley Regional District responsible for regional planning. This landscape may not facilitate consistent approaches to integrating health and transportation sectors. Finally, municipalities appear to be using different technologies for automatic count programs, such as laser counters, on-street eco-counters, infrared counters and video cameras that each have their limitations and hinder comparison. In addition, automatic count technologies may be insufficient: they don’t capture direction of travel, cannot distinguish bikes and pedestrians from other modes and are not accurate enough (e.g. infrared technology). Note that some of the needs mentioned by municipalities were not about having more or better data. For example, some municipalities expressed a wish for better transit services in their municipality. Another example is the change in law that means police no longer attend all crashes, and the impacts that this has on data completeness and consistency.
34
Some data will be hard to come by and will require new champions. For instance, parking usage will not be available unless someone is out there to assess use. Pedestrian and cycling crash and injury data typically only capture the most serious injuries (requiring emergency room visit) or those that are motor-vehicle involved. Many events go unreported and this cannot be easily changed. Resource limitations mean that some municipalities have limited capacity to analyze existing data, let alone collect and analyze new data. Without strong champions and/or directed funding, some of these challenges will remain.
6.3 Next steps The tiered approach should allow municipalities at different stages to take appropriate action, provided they are interested in integrating health into transportation planning. Some resources are available from CLASP 2 to help municipalities get started on this, for example by organizing a workshop about current and best practice data collection efforts, or training on crafting active transportation policies or evaluations using existing local data.

35
References 1. Metro Vancouver. Metro Vancouver Local Government Boundaries, 2010. Available from:
http://www.metrovancouver.org/about/maps/Pages/default.aspx 2. Fraser Valley Regional District. FVRD Member Municipalities, 2008; Available from:
http://www.fvrd.bc.ca/AboutUs/FVRDMemberMunicipalities/Pages/default.aspx. 3. B.C. Stats & Ministry of Labour and Citizens' Services. Health Administrative Boundaries and
Maps, 2008. Available from: http://www.bcstats.gov.bc.ca/statisticsbysubject/geography/referencemaps/Health.aspx
4. Translink. TransLink 2008 Regional Screenline Survey – Final Report Executive summary, 2008. Available from: http://www.translink.ca/~/media/Documents/plans_and_projects/trip_diary/TransLink%202008%20Regional%20Screenline%20Survey%20%20Executive%20Summary.ashx.
5. Insurance Corporation of British Columbia. Quick Statistics, 2012. Available from: http://www.icbc.com/about-ICBC/news_room/icbc_stats. .
6. Ministry of Health. Discharge Abstract Database, 2011; Available from: Injury Data Online Tool (iDOT) http://www.injuryresearch.bc.ca/?idot=injury-hospitalizations.
7. World Health Organization. Global health risks: Mortality and burden of disease attributable to selected major risks., eds. WHO: Geneva: WHO Press; 2009. Available from: http://www.who.int/healthinfo/global_burden_disease/global_health_risks/en/index.html.
8. Statistics Canada. Canadian Community Health Survey - Annual Component (CCHS), 2012 November 27; Available from: http://www23.statcan.gc.ca/imdb/p2SV.pl?Function=getSurvey&SDDS=3226&Item_Id=50653&lang=en.
9. Statistics Canada. Canadian Health Measures Survey (CHMS), 2012 September 19; Available from: http://www23.statcan.gc.ca/imdb/p2SV.pl?Function=getSurvey&SDDS=5071&Item_Id=129548&lang=en.
10. Statistics Canada. Health, 2013 May 2; Available from: http://www5.statcan.gc.ca/subject-sujet/subtheme-soustheme.action?pid=2966&id=2966&lang=eng&more=0
11. Statistics Canada. Health Profile, January 2013 2013 January 13; Available from: http://www12.statcan.gc.ca/health-sante/82-228/index.cfm?Lang=E.
12. Translink. Bus system performance review, 2011. Available from: http://www.translink.ca/en/Plans-and-Projects/Managing-the-Transit-Network/Transit-System-Performance.aspx.
13. HUB. Bike to work week, 2009; Available from: http://www.biketoworkmetrovan.ca/ 14. B.C. Ministry of Transportation and Infrastructure. Traffic data program, 2013; Available from:
http://www.th.gov.bc.ca/trafficdata/tradas/mainmap.asp. 15. Metro Vancouver. Air quality monitoring, 2011; Available from:
http://www.metrovancouver.org/services/air/monitoring/Pages/default.aspx. 16. Metro Vancouver. Metro Vancouver key facts, 2011; Available from:
http://www.metrovancouver.org/about/statistics/Pages/KeyFacts.aspx. 17. Fraser Valley Regional District. Health and Active Living in the Fraser Valley Regional District:
Chilliwack: 2011. Available from: http://www.fvrd.bc.ca/AboutUs/Pages/DistrictStatistics.aspx 18. Fraser Valley Regional District. Commuting and Places of Work in the Fraser Valley Regional
District, 2009. Available from: http://www.fvrd.bc.ca/AboutUs/Pages/DistrictStatistics.aspx. 19. Alta Planning + Design. National Bicycle and Pedestrian Documentation Project, 2013; Available
from: http://bikepeddocumentation.org/.
36
20. Region of Peel. Peel Data Centre; Available from: http://www.peelregion.ca/planning/pdc/data/. 21. Booth, G.L., et al. Chapter 6: Neighbourhood Infrastructure and Health, in: Neighbourhood
environments and resources for healthy living – A focus on diabetes in Toronto. R.H. Glazier, et al., eds. Institute for Clinical Evaluative Sciences: Toronto: 2007. Available from: http://www.ices.on.ca/webpage.cfm?site_id=1&org_id=67&morg_id=0&gsec_id=0&item_id=4406&type=atlas.
22. Foster, L.T., et al. The British Columbia Atlas of Wellness: Victoria: 2011. Available from: http://www.geog.uvic.ca/wellness/wellness2011/index.html.
23. Morency, P. and F. Tessier. Geographic distribution of injured road users in Montreal (1999-2008). Unpublished data, Direction de santé publique de Montréal
24. Insurance Corporation of British Columbia. Statistics: Crash maps, 2012; Available from: http://www.icbc.com/about-ICBC/news_room/icbc_stats.
25. World Health Organization. Health economic assessment tool (HEAT) for cycling and walking, 2011; Available from: www.euro.who.int/HEAT.
26. Toronto Public Health. Road to Health: Improving walking and cycling in Toronto, in: Healthy Toronto by Design. Toronto: 2012. Available from: http://www.toronto.ca/health/hphe/built_environment.htm.
27. Public Health England. HIA Gateway, 2007; Available from: http://www.apho.org.uk/default.aspx?RID=40141.
28. World Health Organization. Health Impact Assessment, 2013; Available from: http://www.who.int/hia/en/.
29. City of Decatur. Pathways to a Healthy Decatur: A Rapid Health Impact Assessment of the City of Decatur Community Transportation Plan 2007. Available from: http://www.healthimpactproject.org/hia/us/city-of-decatur-community-transportation-plan.