Embed Size (px)
Citation preview

H E A L T HE F F E C T SINSTITUT E
R E S E A R C H R E P O R T
Charlestown Navy Yard
120 Second Avenue
Boston MA 02129-4533 USA
+1-617-886-9330
www.healtheffects.org
H E A L T HE F F E C T SINSTITUT E
R E S E A R C HR E P O R T
Number 114February 2003
Number 114
February 2003
A Personal Particle Speciation SamplerSusanne Hering, Nathan Kreisberg, and Walter John
fold line

H E A L T HE F F E C T SI N S T I T U T E
The Health Effects Institute, established
in 1980, is an independent and unbiased
source of information on the health
effects of motor vehicle emissions. HEI
studies all major pollutants, including
regulated pollutants (such as carbon
monoxide, ozone, nitrogen dioxide, and
particulate matter) and unregulated
pollutants (such as diesel engine exhaust,
methanol, and aldehydes). To date, HEI
has supported more than 200 projects at
institutions in North America and Europe
and has published over 130 research
reports.
Typically, HEI receives half its funds
from the US Environmental Protection
Agency and half from 28 manufacturers
and marketers of motor vehicles and
engines in the United States.
Occasionally, funds from other public
and private organizations either support
special projects or provide resources for
a portion of an HEI study. Regardless of
funding sources, HEI exercises complete
autonomy in setting its research
priorities and in reaching its
conclusions. An independent Board of
Directors governs HEI. The Institute’s
Health Research and Health Review
Committees serve complementary
scientific purposes and draw
distinguished scientists as members.
The results of HEI-funded studies are
made available as Research Reports,
which contain both the Investigators’
Report and the Review Committee’s
evaluation of the work’s scientific quality
and regulatory relevance.
Mark J Utell ChairProfessor of Medicine and Environmental Medicine, University of Rochester
Melvyn C BranchJoseph Negler Professor of Engineering, Mechanical EngineeringDepartment, University of Colorado
Kenneth L DemerjianProfessor and Director, Atmospheric Sciences Research Center,University at Albany, State University of New York
Peter B FarmerProfessor and Section Head, Medical Research Council Toxicology Unit,University of Leicester
Helmut GreimProfessor, Institute of Toxicology and Environmental Hygiene, TechnicalUniversity of Munich
Rogene HendersonSenior Scientist and Deputy Director, National EnvironmentalRespiratory Center, Lovelace Respiratory Research Institute
Stephen I RennardLarson Professor, Department of Internal Medicine, University ofNebraska Medical Center
Howard RocketteProfessor and Chair, Department of Biostatistics, Graduate School ofPublic Health, University of Pittsburgh
Jonathan M SametProfessor and Chairman, Department of Epidemiology, BloombergSchool of Public Health, Johns Hopkins University
Frank E SpeizerEdward H Kass Professor of Medicine, Channing Laboratory, HarvardMedical School and Department of Medicine, Brigham and Women’sHospital
Clarice R WeinbergChief, Biostatistics Branch, Environmental Diseases and MedicineProgram, National Institute of Environmental Health Sciences
BOARD OF DIRECTORS
HEALTH RESEARCH COMMITTEE
HEALTH REVIEW COMMITTEE
OFFICERS & STAFFDaniel S Greenbaum PresidentRobert M O’Keefe Vice PresidentJane Warren Director of ScienceSally Edwards Director of PublicationsJacqueline C Rutledge Director of Finance and AdministrationRichard M Cooper Corporate SecretaryCristina I Cann Staff ScientistAaron J Cohen Principal ScientistMaria G Costantini Principal Scientist
Debra A Kaden Senior ScientistGeoffrey H Sunshine Senior ScientistAnnemoon MM van Erp Staff ScientistTerésa Fasulo Senior Administrative AssistantGail A Hamblett Office and Contracts ManagerL Virgi Hepner Senior Science EditorJenny Lamont Science EditorFrancine Marmenout Senior Executive AssistantTeresina McGuire Accounting Assistant
Daniel C Tosteson ChairProfessor of Cell Biology, Dean Emeritus, Harvard Medical School
Ross AndersonProfessor and Head, Department of Public Health Sciences, St George’s Hospital Medical School, London University
John C Bailar IIIProfessor Emeritus, The University of Chicago
John R HoidalProfessor of Medicine and Chief of Pulmonary/Critical Medicine,University of Utah
Thomas W KenslerProfessor, Division of Toxicological Sciences, Department ofEnvironmental Sciences, Johns Hopkins University
Brian LeadererProfessor, Department of Epidemiology and Public Health, YaleUniversity School of Medicine
Thomas A LouisProfessor, Department of Biostatistics, Bloomberg School of PublicHealth, Johns Hopkins University
Edo D PellizzariVice President for Analytical and Chemical Sciences, ResearchTriangle Institute
Nancy ReidProfessor and Chair, Department of Statistics, University of Toronto
William N RomProfessor of Medicine and Environmental Medicine and Chief ofPulmonary and Critical Care Medicine, New York UniversityMedical Center
Sverre VedalProfessor, University of Colorado School of Medicine; Senior Faculty,National Jewish Medical and Research Center
Richard F Celeste ChairPresident, Colorado College
Donald Kennedy Vice ChairEditor-in-Chief, Science; President (Emeritus) and Bing Professor ofBiological Sciences, Stanford University
Archibald Cox Chair Emeritus Carl M Loeb University Professor (Emeritus), Harvard Law School
Purnell W ChoppinPresident Emeritus, Howard Hughes Medical Institute
Alice HuangSenior Councilor for External Relations, California Institute of Technology
Richard B StewartUniversity Professor, New York University School of Law, and Director,New York University Center on Environmental and Land Use Law
Robert M WhitePresident (Emeritus), National Academy of Engineering, and SeniorFellow, University Corporation for Atmospheric Research
fold line

Synopsis of Research Report 114S T A T E M E N T
This Statement, prepared by the Health Effects Institute, summarizes a research project funded by HEI and conducted by Dr Susanne Hering atAerosol Dynamics Inc, Berkeley CA. The following Research Report contains both the detailed Investigators’ Report and a Critique on the studyprepared by the Institute’s Health Review Committee.
A Personal Particle Speciation SamplerParticulate matter (PM) in ambient air is a complex
mixture containing particles of different sizes andchemical composition. Characterizing the composi-tion of particles and linking it to toxicity may helpreveal the underlying biological mechanisms ofhealth effects, and in turn that information may pointthe regulatory community to the types of particlesmost likely associated with toxic effects. In addition,characterizing particles may help to trace particlesback to their sources.
Epidemiology studies often use area measures ofexposure as surrogates for personal exposure mea-surements. Exposure of individuals reflects localconditions and time-activity patterns that can varygreatly from exposure measured by the centrallybased monitors. Personal monitors can better repre-sent such actual individual exposure and thus havebeen incorporated into some studies examining PM.Because the components of PM responsible foradverse health effects are not always evident, how-ever, personal monitors are needed that can collectinformation on different aspects of PM, includingphysical and chemical constituents—both organicand inorganic. This information is important both tocomplement epidemiology studies and to understandhow different sources contribute to an individual’soverall exposure. However, no single method allowsdetermination of all characteristics of PM, and dif-ferent sampling substrates are needed for assessingthe presence and concentrations of the PM constitu-ents of interest. The Health Effects Institute fundedthe study described in this report to design a personalmonitor that addresses these needs.
APPROACH
Dr Susanne Hering of Aerosol Dynamics Inc and hercolleagues set out to design and validate a personalsampler for particles smaller than 2.5 µm (PM2.5) thatis suitable for subsequent chemical speciation work.Specifically, the sampler was intended to meet themeasurement needs for PM2.5 mass concentration andseveral of its major constituents (including elementalcarbon, organic carbon, sulfates, and nitrates). To
allow personal monitoring, the device had to be por-table and capable of battery operation for 8 continuoushours. In developing the personal particle speciationsampler, Dr Hering and her colleagues selected andtested individual components of the sampler and thenperformed limited field tests of a prototype that incor-porated the selected components.
The overall design of the personal particle specia-tion sampler consists of a size-selective inlet to removeall particles larger than 2.5 µm in aerodynamic diam-eter, 2 sampling channels, a flow controller, and apump. An oilless, greaseless, size-selection inletallows precise measurement of organic carbonwithout the contamination problems that often occurwhen oil or grease is used. The 2 sampling channelsallow use of quartz and Teflon filters so that PM massconcentrations and specific chemical constituentscan be determined by applying a variety of filter-based analytic methods. The investigators decided touse a single pump to keep weight and noise to a min-imum. Design of the personal particle speciationsampler also included the option for a denuder (adevice used to remove interfering vapors) and forrecapture of semivolatile components of the parti-cles, such as nitrate. Finally, to allow detection ofmass in the small sample volume obtained by the per-sonal samplers, the personal particle speciation sam-pler design was made compatible with � gaugedetermination of PM mass, a technique that measuresthe attenuation of � particles through a blank-loadedand PM-loaded filter and associates the measured dif-ference in � attenuation to PM mass.
RESULTS
Investigators evaluated several designs for each ofthese objectives and ultimately selected the mostappropriate components. Three types of size-selec-tive PM inlets were tested: microtrap, spiral, andcompact cyclone—a modification of the cycloneimpactor. Of these, the compact cyclone inlet waschosen because it performed closest to the federalreference method and provided the best exclusion oflarger particles.
Research Report 114
Copyright © 2003 Health Effects Institute, Boston MA USA. Cameographics, Union ME, Compositor. Printed at Capital City Press, Montpelier VT.Library of Congress Catalog Number for the HEI Report Series: WA 754 R432.The paper in this publication meets the minimum standard requirements of the ANSI Standard Z39.48-1984 (Permanence of Paper) effective withReport 21 in December 1988; and effective with Report 92 in 1999 the paper is recycled from at least 30% postconsumer waste with Reports 25, 26,32, 51, 65 Parts IV, VIII, and IX, 91 and 105 excepted. These excepted Reports are printed on acid-free coated paper.
To measure the total mass and chemical componentsof PM in their sampler, Dr Hering used 2 samplingchannels: one with quartz filters used to measure ele-mental and organic carbon and one with Teflon filtersto measure particle mass and inorganic anions (such assulfate, nitrate, and ammonium). A cellulose backupfilter impregnated with sodium chloride was includeddownstream from the Teflon filter to capture volatilenitrate that might be stripped from the primary filter.
Of the two denuders evaluated, the activated carbonhoneycomb denuder was chosen because it was morecompact and more effective at removing nitric acid thanthe aluminum denuder coated with magnesium oxide.The only disadvantage of this denuder was that itrequired periodic regeneration (heating to 100�C for atleast 1 hour) to prevent release of nitric acid. Four sys-tems for using the � gauge technique were assessed forstability, precision, and effects of loading andunloading filter cassettes. Investigators chose the AT100� source and an integrated solid-state detection systembecause of its strong � source (providing good countingstatistics) and long-term stability.
IMPLICATIONS
For analysis of personal PM exposure, it is increas-ingly important to get speciation data from personal
monitors. The careful attention to the weight and sizeelements, and the ability to measure PM2.5 mass con-centration, elemental carbon, organic carbon, sulfates,and nitrates in the same instrument, may make the per-sonal sampler described by Dr Hering and colleagues avaluable addition to personal monitoring tools. Oncevalidated, this sampler could allow measurement ofpersonal exposures to fine PM over relatively shortperiods of time (ie, 8 hours) and could measure impor-tant PM characteristics such as size and chemical con-stituents. The lightweight, compact design makes itsuitable for widespread use, including personal moni-toring for children and the elderly.
The study met the 5 design requirements that it set:2-channel sampling; an oilless, greaseless inlet; provi-sion for denuders; compatibility with � gauging; andsingle-pump operation. However, issues such as satu-ration still need to be addressed (as in environmentshigh in tobacco smoke, ammonia, or nitric acid). Beforebeing used widely, the sampler needs more compre-hensive laboratory and controlled field testing, as iscurrently underway. This sampler therefore holdspromise but is not yet ready for population studies.

CONTENTSResearch Report 114
H E A L T HE F F E C T SINSTITUT E A Personal Particle Speciation Sampler
Susanne Hering, Nathan Kreisberg, and Walter John
Aerosol Dynamics Inc, Berkeley, California; and Particle Science, Walnut Creek, California
HEI STATEMENTThis Statement is a nontechnical summary of the Investigators’ Report and the Health Review Committee’s Critique.
INVESTIGATORS’ REPORTWhen an HEI-funded study is completed, the investigators submit a final report. The Investigators’ Report is first examined by three outside technical reviewers and a biostatistician. The Report and the reviewers’ comments are then evaluated by members of the HEI Health Review Committee, who had no role in selecting or managing the project. During the review process, the investigators have an opportunity to exchange comments with the Review Committee and, if necessary, revise the report.
Abstract . . . . . . . . . . . . . . . . . . . . . . . . . . . . . . . . . . . . . . 1Introduction . . . . . . . . . . . . . . . . . . . . . . . . . . . . . . . . . . 1Specific Aims . . . . . . . . . . . . . . . . . . . . . . . . . . . . . . . . . 2Methods . . . . . . . . . . . . . . . . . . . . . . . . . . . . . . . . . . . . . 3
Overall Approach for PPSS Development . . . . . . 3PM2.5 Inlet Tests of Particle Penetration . . . . . . . 3Denuder Tests of Nitric Acid
Capture Efficiency . . . . . . . . . . . . . . . . . . . . . . . . . 5Filter Selection Tests . . . . . . . . . . . . . . . . . . . . . . . . 5Aerosol Mass Determination . . . . . . . . . . . . . . . . . 6Prototype Testing . . . . . . . . . . . . . . . . . . . . . . . . . . . 7
Results . . . . . . . . . . . . . . . . . . . . . . . . . . . . . . . . . . . . . . . 8
Selection of Filter Media, Spot Size, and Sampler Flow Rate . . . . . . . . . . . . . . . . . . . . . . . . . 8
Inlet Evaluation. . . . . . . . . . . . . . . . . . . . . . . . . . . . . 9Denuder Performance. . . . . . . . . . . . . . . . . . . . . . 11� Attenuation Experiments . . . . . . . . . . . . . . . . . 12Prototype Design . . . . . . . . . . . . . . . . . . . . . . . . . . 14Prototype Field Evaluation . . . . . . . . . . . . . . . . . . 15
Discussion . . . . . . . . . . . . . . . . . . . . . . . . . . . . . . . . . . 18Acknowledgments . . . . . . . . . . . . . . . . . . . . . . . . . . . 19References . . . . . . . . . . . . . . . . . . . . . . . . . . . . . . . . . . 19Appendix A. Other � Gauge Systems . . . . . . . . . . . 20About the Authors. . . . . . . . . . . . . . . . . . . . . . . . . . . . 27Abbreviations and Other Terms. . . . . . . . . . . . . . . . 27
CRITIQUE Health Review CommitteeThe Critique about the Investigators’ Report is prepared by the HEI Health Review Committee and Staff. Its purpose is to place the study into a broader scientific context, to point out its strengths and limita-tions, and to discuss remaining uncertainties and implications of the findings for public health.
Introduction . . . . . . . . . . . . . . . . . . . . . . . . . . . . . . . . . 29Scientific Background . . . . . . . . . . . . . . . . . . . . . . . . 29Technical Evaluation . . . . . . . . . . . . . . . . . . . . . . . . . 30
Aims and Objectives. . . . . . . . . . . . . . . . . . . . . . . . 30Study Design and Results . . . . . . . . . . . . . . . . . . . 30
Inlets . . . . . . . . . . . . . . . . . . . . . . . . . . . . . . . . . . . 31Sampling Channels . . . . . . . . . . . . . . . . . . . . . . 31Denuder . . . . . . . . . . . . . . . . . . . . . . . . . . . . . . . . 31Filters . . . . . . . . . . . . . . . . . . . . . . . . . . . . . . . . . . 31Filter Area. . . . . . . . . . . . . . . . . . . . . . . . . . . . . . . 31
Assays for PM Mass Determination . . . . . . . . 31The Prototype PPSS . . . . . . . . . . . . . . . . . . . . . . 32
Discussion . . . . . . . . . . . . . . . . . . . . . . . . . . . . . . . . 32Denuder . . . . . . . . . . . . . . . . . . . . . . . . . . . . . . . . 32Assays for PM Mass Determination . . . . . . . . 32The Prototype PPSS . . . . . . . . . . . . . . . . . . . . . . 32
Conclusion. . . . . . . . . . . . . . . . . . . . . . . . . . . . . . . . 32Summary . . . . . . . . . . . . . . . . . . . . . . . . . . . . . . . . . . . 33Acknowledgments . . . . . . . . . . . . . . . . . . . . . . . . . . . 33References . . . . . . . . . . . . . . . . . . . . . . . . . . . . . . . . . . 33
RELATED HEI PUBLICATIONS

Publishing History: This document was posted as a preprint on www.healtheffects.org and then finalized for print.
Citation for whole document:
Hering S, Kreisberg N, John W. 2003. A Personal Particle Speciation Sampler. Research Report 114. Health Effects Institute, Boston MA.
When specifying a section of this report, cite it as a chapter of the whole document.
Health Effects Institute Research Report 114 © 2003 1
INVESTIGATORS’ REPORT
A Personal Particle Speciation Sampler
Susanne Hering, Nathan Kreisberg, and Walter John
ABSTRACT
Fuller understanding of personal exposures to particu-late matter with aerodynamic diameters below 2.5 µm(PM2.5*) requires a personal sampler suitable for assayingnot only PM2.5 mass but also its major chemical constitu-ents: elemental carbon, organic carbon, sulfates, andnitrates. The goal to measure these constituents simulta-neously imposes several constraints on personal samplerdesign. The aim of this project was to develop a samplerwithin these constraints that would be suitable for per-sonal monitoring over 8 hours. In addition, with the intentto improve the precision of mass measurements, we inves-tigated offline use of � attenuation.
The personal particle speciation sampler (PPSS)includes an inlet to remove particles larger than 2.5 µm, 2sampling channels, and a pump with flow control. Onechannel serves for measuring particle mass and inorganicions; the other, for measuring organic carbon and ele-mental carbon. Denuders can be placed in either channelor both channels. A backup filter can be placed on thedenuded channel to collect volatilized particulate nitrate.Two prototype PPSS units were built and tested. Theresults of both laboratory testing of key PPSS componentsand a limited field study of the prototype in comparison toan AIHL (Air and Industrial Hygiene Laboratory) cyclone-based sampler are reported.
INTRODUCTION
Personal monitoring has long been recognized as a crit-ical aspect of exposure assessment. An important constit-uent of environmental exposure is PM2.5, which isassociated with combustion sources and photochemicalprocesses. These fine particles have been implicated inhealth effects and are currently regulated by the US Envi-ronmental Protection Agency (EPA). Yet technical con-straints have limited most personal monitoring of particleexposures to measures of either particle mass or mass andionic constituents. As the parameter subject to environ-mental regulation, mass is certainly of interest, but it is anincomplete characterization of airborne particles.
PM2.5 comprises many chemical constituents includingsulfates, nitrates, organic carbon, soot-like carbon, andmetals, and they vary in size and morphology. Which ofthe many particle parameters are important to humanhealth is not known (EPA 1996). For example, someresearch has suggested that the smallest particles, thosebelow 0.1 µm, are important to health effects (Peters et al1997). Other research has implicated particle acidity(Dockery et al 1996; Spengler et al 1996). Morphology mayplay a role, as in cases of asbestos exposure, and thehypothesis that chemical composition affects toxicity iscertainly plausible.
Apart from its possible health implications, particlechemistry is a valuable tool for identifying sources of par-ticle exposure. For many years chemical mass balanceshave been used to trace the sources of particles found inambient air. Similar methods can be applied to indoor airor personal exposure samples. For example, sulfate hasvery few indoor sources, and in many homes it is a goodtracer for outdoor particles. Soot-like carbon results fromcombustion processes, including outdoor sources such asvehicular exhaust and indoor sources such as cookingfumes. With chemical information one can begin to assessthe fraction of particle exposure attributable to outdoorambient particles.
To understand the exposure of individuals to the partic-ular constituents of PM2.5, a personal monitor suitable forassaying all of its major chemical constituents, as well as itsmass, is necessary. In current personal samplers particles
* A list of abbreviations and other terms appears at the end of the Investiga-tors’ Report.
This Investigators’ Report is one part of Health Effects Institute ResearchReport 114, which also includes a Critique by the Health Review Committeeand an HEI Statement about the research project. Correspondence concern-ing the Investigators’ Report may be addressed to Susanne Hering, AerosolDynamics Inc, 2329 Fourth St, Berkeley CA 94710.
Although this document was produced with partial funding by the UnitedStates Environmental Protection Agency under Assistance AwardR82811201 to the Health Effects Institute, it has not been subjected to theAgency’s peer and administrative review and therefore may not necessarilyreflect the views of the Agency, and no official endorsement by it should beinferred. The contents of this document also have not been reviewed by pri-vate party institutions, including those that support the Health Effects Insti-tute; therefore, it may not reflect the views or policies of these parties, andno endorsement by them should be inferred.
2
A Personal Particle Speciation Sampler
are collected onto a single Teflon filter. The samples maybe assayed gravimetrically for mass and extracted for anal-ysis of inorganic ions such as sulfate, but it is not possibleto determine their complete chemistry. Specifically, thesesamples are not suitable for accurate assay of particulatenitrate or carbon.
Techniques for measuring the different chemical constitu-ents of PM2.5, including semivolatile species such as nitratecompounds, have been developed through many samplingprograms (Fitz and Zwicker 1988; Solomon et al 1988, 1989;Chow et al 1993). These studies have shown that differenttypes of filters and sampling approaches are required forassaying different chemical constituents of PM2.5.
Gravimetric mass is measured on Teflon filters becausethey are not hygroscopic, do not adsorb sulfur dioxide orother vapors, and are mechanically stable. In contrast, anal-ysis of carbon requires a noncarbonaceous substrate such asquartz, which can be cleaned before sampling by baking at500°C. Quartz filters are analyzed by thermal evolution ofthe deposited aerosol with direct nondispersive infrareddetection of carbon dioxide, or flame ionization detectionafter conversion of evolved carbonaceous vapors tomethane. Because of their mechanical instability, quartz fil-ters cannot be used to determine gravimetric mass.
Teflon filters do not efficiently retain volatile speciessuch as ammonium nitrate. Sampling systems for nitrateconsist of a denuder to strip out vapor-phase nitric acidfollowed by an absorbing filter medium that retains nitrateand nitric acid (Forrest et al 1982; Possanzini et al 1983;Appel et al 1984; Ferm 1986; Allegrini et al 1987; Ferm etal 1988). The wall of the denuder has an adsorbing coatingthat captures nitric acid by diffusion while allowing parti-cles to penetrate (by virtue of their lower diffusion coeffi-cient). The particles are then collected on the filter. Anadsorbing filter medium can be selected such that anynitrate that disassociates during sampling is immediatelyrecaptured. The Harvard personal sampler (Koutrakis et al1988; Brauer et al 1989) uses a denuder filter system foraccurate collection of particle nitrate and associated gases(ammonia, nitric acid, and sulfur dioxide).
Another issue for particle sampling is the inlet. All PM2.5samplers have an inlet to exclude particles above 2.5 µm indiameter. For its precut device, the PM2.5 federal referencemethod (FRM) sampler uses a well impactor consisting of aheavily oiled filter that sits in a cup upon which theincoming airstream impinges. Other samplers such as thepersonal environmental monitor (PEM, MSP Corp, Minne-apolis MN) and the Harvard personal sampler (Brauer et al1989) use a flat-plate impactor with an oiled impaction sur-face. The oil is used to prevent rebound and subsequentpenetration of coarse particles to the fine particle sample.
Yet possible contamination by the oil is a concern in mea-surements of organic constituents.
The small volume of air that is obtained by personalsamplers makes precise measurements at low levels ofexposure difficult. One of the more challenging parametersto measure with precision is the gravimetric mass. Filterstability and weight capability limit the precision of massmeasurements to within several micrograms. For personalsampling, with sample sizes of 1 to 2 m3, this translates toa few micrograms per cubic meter of air. An alternativemethod for assaying mass is � gauging. This method hasbeen used for many years for real-time mass measurementof ambient air samples. These gauges measure the attenua-tion of � particles (energetic free electrons) through thefilter sample. The � particles are scattered by the electroncloud of the filter and particle deposit. The scatteringresponse is largely independent of the sample’s chemicalcomposition. The method is sensitive to the particle massper unit area and can be adapted to very small samples. Assuch, offline � gauging is an attractive alternative to gravi-metric mass determinations, but its use requires that thepersonal sampler be configured to ensure consistent orien-tation of the filter during gauging.
For these reasons, currently available personal samplersare not well suited for measurement of both the carbonaceousand inorganic ion fractions of PM2.5. First, current samplerscollect onto a single filter, and no single filter medium is suit-able for all analytes. For example, the quartz filter mediarequired for carbon analysis are too friable for gravimetricmass determinations. Second, only the Harvard personalsampler provides for retention of volatile constituentsthrough a denuded adsorbing filter such as is used forambient measurements of nitrates. Third, the commonlyused oiled inlets are not desirable for carbon analysis becauseof the potential for contamination. Finally, even mass mea-surement is difficult because of the uncertainties imposed bythe small sample sizes inherent with personal monitoring.
SPECIFIC AIMS
The objective of this project was to develop a personalmonitor to meet measurement needs for each of the majorparameters of PM2.5: mass and content of elemental carbon,organic carbon, sulfates, and nitrates. The goal of simulta-neously measuring all of these species as well as massimposes several constraints on the sampler design. The aimof this project was to develop a sampler within these con-straints while suitable for personal PM2.5 monitoring over8 hours. The specific design requirements for a PPSS, andthe reasons for them are as follows:

3
S Hering et al
• Two-channel sampling is required because no single filter medium is compatible with every analyte detec-tion method. Determination of total organic carbon can only be done using quartz filters, which are friable and thus not compatible with gravimetric mass deter-minations (or with � attenuation owing to their thick-ness). Measurement of both carbon and particulate mass requires parallel collection on a Teflon filter and a quartz filter.
• An oilless, greaseless PM2.5 inlet is desirable for pre-cise measurements of organic carbon. Many of the commonly used inlets, such as the FRM sampler or single-stage impactors, use oil or grease to prevent particle rebound. When organic carbon is measured, this potential source of contamination should be avoided.
• Provision for incorporating denuders on each channel is required for accurate measurement of semivolatile constituents such as ammonium nitrate. A denuder is used to remove interfering vapors, and the primary fil-ter (or alternatively a backup filter) usually consists of a reactive or adsorbing filter medium to prevent evap-oration of deposited particles during sampling. Denuder filter methods are well developed for nitrate and are evolving for organic measurements as well.
• Compatibility with � gauging is necessary because precise mass measurements are difficult with the small sample volumes collected by personal samplers, especially for samplers with flow split between 2 channels. The ability to gauge the attenuation of � par-ticles in samples used for mass determination offers a potentially more precise alternative to gravimetric mass measurements.
• Single-pump operation of both flow channels is dic-tated by size, weight, and noise limitations for per-sonal samplers. All the components must be packaged in a sampler small enough to be worn, and permit 8-hour operation with a battery-powered personal sam-pling pump.
To address precision and accuracy, specific performanceobjectives were defined for the PPSS: independent tests forinlet function, denuder function, and � gauging as well asside-by-side precision testing and comparison with a refer-ence sampler. Specific performance objectives incorporatedgoals for accuracy and precision: penetration efficiencywithin 5% of the published PM2.5 FRM cutpoint for bothliquid and solid particles; removal of more than 95% of thenitric acid upstream of the filters used for nitrate; detectionlimit defined at a 2 SD level of 1 µg/m3 for mass, at 0.3 µg/m3
for sulfate and nitrate, and at 0.5 µg/m3 for organic carbon
and elemental carbon; and precision of 8% for side-by-sidesampling at levels above the detection limit.
METHODS
OVERALL APPROACH FOR PPSS DEVELOPMENT
The individual components of the PPSS are an inlet toremove particles above 2.5 µm, 2 sampling channels, and apump with flow control (Figure 1). One channel serves formeasurement of mass and inorganic ions; the other, fororganic carbon and elemental carbon. Denuders can beplaced above either channel or both channels. A backupfilter on the denuded channel collects the volatilized par-ticulate nitrate. This basic scheme fulfills the design con-straints outlined above.
The first step in the PPSS development was to select andtest the individual components. These tests focused oninlet, nitric acid denuder, filter media, filter deposit area,and � gauge technology. In the second step the compo-nents were incorporated into a complete prototype PPSS.The precision and accuracy of the prototype were testedthrough field measurements with comparison to a refer-ence sampler. The final step, field testing by an indepen-dent investigator, is being addressed in an ongoing studyat Johns Hopkins University.
The experimental methods for testing each componentand assessing the prototype performance are described inthe next section.
PM2.5 INLET TESTS OF PARTICLE PENETRATION
Performance of the PM2.5 inlets was evaluated for bothliquid and solid particles generated in the laboratory. Bothtypes of tests are necessary to assess inlet efficiency. Solidparticles are prone to bounce and reentrainment, leadingto penetration of particles larger than the 2.5-µm cutpoint.
Figure 1. PPSS components.
4
A Personal Particle Speciation Sampler
These larger particles are then collected on the samplefilter, leading to artifactual oversampling. Liquid particlesare most likely to be lost during transport, and liquid par-ticles smaller than the 2.5-µm cutpoint may be lost in theinlet. These losses lead to undersampling. Reliable perfor-mance of the inlet requires nearly equal performance forliquid particles and solid particles.
For candidate inlets, laboratory measurements were madeof the penetration as a function of particle aerodynamicdiameter using polydisperse and monodisperse test particlesand an aerodynamic particle sizer (APS; model 3320, TSI, StPaul MN), as described by John and Kreisberg (1999). Thesize-dependent penetration efficiency was determined bycomparing particle-size distributions measured before andafter particles passed through the inlet being tested.
Solid particle tests were done using polydisperse poly-styrene latex (Duke Scientific, Palo Alto CA) and polydis-perse aluminum oxide (Micro Abrasives Corp, WestfieldMA). The latex particles were in the form of a dry powderwith particle diameters ranging from 1 to 20 µm. The alu-minum oxide was also a dry powder. These powders wereaerosolized using a fluidized bed constructed in our labo-ratory. A flanged tube sealed to the back half of a standardGelman filter holder (Pall Corp, Ann Arbor MI) formed thechamber of the fluidized bed. The tube was clear to permitvisual observation. The fluidized bed particles were glassbeads 320 to 420 µm in diameter (sieve size 60/80; part5420, Alltech, Deerfield MI). These beads are normallyused for gas chromatography; they are clean and relativelyfree of fine particles. The glass beads, which were less mas-sive than the large metallic beads that are typically used influidized beds and could damage the latex particles, werestill capable of deagglomerating the test particles. The bedheld approximately 17 g of the beads, which were sup-ported by a 47-mm etched stainless steel screen supportinga glass fiber filter. The support screen and filter werereversed from the normal mounting to provide protectionagainst breakage of the filter. For particle generation approx-imately 20 mg of the latex or aluminum oxide was added asa batch to the bed, and the fluidized bed was slightly shakento mix with the particles. The bed airflow was increaseduntil the bed had the appearance of boiling. Flow ratesthrough the fluidized bed varied from 1 to 5 L/min.
Liquid aerosol tests were performed using oleic acidparticles generated by direct nebulization or as a monodis-perse aerosol generated by a vibrating-orifice aerosol gen-erator (VOAG; model 3350, TSI). To maximize theresulting particle size, no solvent was used in the nebuli-zation solution. To enhance the concentration of largerparticles, output flow from the nebulizer was passedthrough a virtual impactor fashioned from a tee and 2 thin-walled brass tubes with 0.25-inch outside diameter and
separated by approximately 0.125 inch. The particle flowentered the tee through the first thin-walled tube at1.1 L/min and exited through the second thin-walled tubeat 0.1 L/min, with the excess being dumped through theside of the tee. Because of inertia, the larger particles wereconcentrated in the 0.1 L/min exit flow.
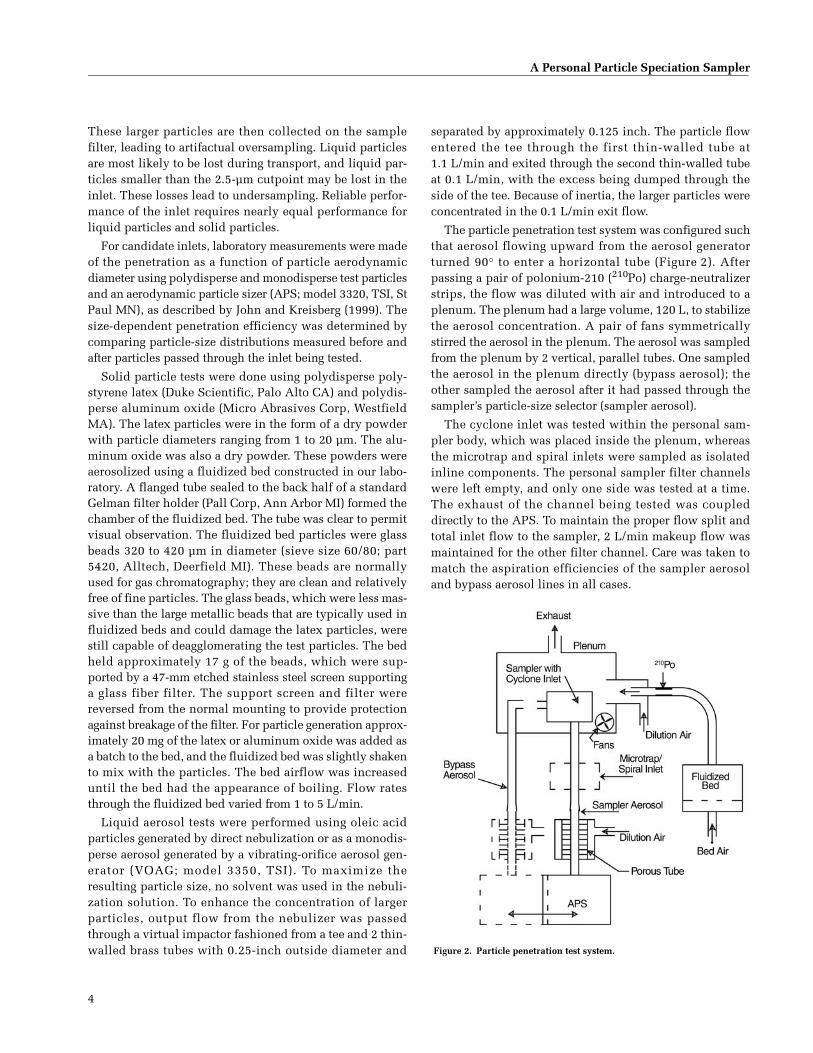
The particle penetration test system was configured suchthat aerosol flowing upward from the aerosol generatorturned 90° to enter a horizontal tube (Figure 2). Afterpassing a pair of polonium-210 (210Po) charge-neutralizerstrips, the flow was diluted with air and introduced to aplenum. The plenum had a large volume, 120 L, to stabilizethe aerosol concentration. A pair of fans symmetricallystirred the aerosol in the plenum. The aerosol was sampledfrom the plenum by 2 vertical, parallel tubes. One sampledthe aerosol in the plenum directly (bypass aerosol); theother sampled the aerosol after it had passed through thesampler’s particle-size selector (sampler aerosol).
The cyclone inlet was tested within the personal sam-pler body, which was placed inside the plenum, whereasthe microtrap and spiral inlets were sampled as isolatedinline components. The personal sampler filter channelswere left empty, and only one side was tested at a time.The exhaust of the channel being tested was coupleddirectly to the APS. To maintain the proper flow split andtotal inlet flow to the sampler, 2 L/min makeup flow wasmaintained for the other filter channel. Care was taken tomatch the aspiration efficiencies of the sampler aerosoland bypass aerosol lines in all cases.
Figure 2. Particle penetration test system.

5
S Hering et al
Figure 3. Test system for measuring denuders’ HNO3-capture efficiency.HNO3 = nitric acid.
An APS was used to measure the particle size distribu-tions. To avoid losses and possible biases associated withvalves and tube connections, APS collection was simplyswitched between the 2 sampling lines. A short piece ofconducting silicone tubing was used to enable fast connec-tions. Because the APS sampled at a fixed flow rate of 5L/min, it was necessary to augment or dilute the aerosolflow, depending on the flow rate of the sampler beingtested. This flow compensation was achieved by intro-ducing flow of 1 to 3 L/min from a porous tube sur-rounding the inlet of the APS (see Figure 2).
A measurement consisted of taking a 1-minute count ofthe bypass aerosol, followed by a 1-minute count of thesampler aerosol, and then another 1-minute count of thebypass aerosol. The 2 counts of bypass aerosol were aver-aged to compensate for changes in aerosol concentration(in each particle-size bin) during the measurements. Themeasurement was discarded if the change was more thanapproximately 15%. The sampling efficiency was obtainedby dividing the sampler aerosol counts by the averagedbypass aerosol counts in each particle-size increment.
Penetration tests for ultrafine aerosols were made on theprototype personal sampler using a condensation particle(nuclei) counter (CPC; model 3760, TSI). Flow was drawnthrough the sampler equipped for normal operation minusfilters and into the CPC to measure total particle counts.The penetration of particles below approximately 0.1 µm(the ultrafine mode that dominates particle counts inatmospheric sampling) was measured by comparing theparticle counts emerging from the prototype sampler withthose from directly drawn room air. The outlet of onechannel of the sampler was configured to couple directlyto the CPC through a short conducting tube that was alter-nately disconnected from the sampler and used to sampleroom air directly. The rated lower limit of detection of thisCPC was 0.014 µm, and the estimated loss to diffusion ofparticles of this size through the inlet tubing used for sam-pling was a mere 1.1% (but sharply decreased as particlesize increased). The flow drawn by the CPC was 1.5 L/min,so 2.5 L/min makeup flow was drawn through the secondchannel to produce the normal total sampler inlet flow.The lower channel flow used by the CPC ensured that themeasured diffusion losses within the sampler were at theupper limit of those expected during normal operation.
DENUDER TESTS OF NITRIC ACID CAPTURE EFFICIENCY
Two types of multitube denuders were tested for nitricacid penetration. One type of denuder was a magnesiumoxide coating on an aluminum lattice manufactured byHexcel (Dublin CA). The aluminum material was provided
in 2 lengths: 6 mm and 25 mm, with 216 and 271 cells,respectively, after being cut to mount in Teflon collars.The magnesium oxide coating was created by pressing 12 gmagnesium oxide through a 150-mesh screen into 25 mL ofethanol, dipping the denuder into the resulting slurry, anddrying it with compressed air. One day later compressedair was used to blow excess magnesium oxide out of thedenuder.
The other denuder type consisted of an activated carbonhoneycomb manufactured by Mast Carbon Ltd (Guildford,UK). The carbon honeycombs required no preparationother than mounting in a Teflon collar. This material isproduced in monoliths, 29 mm in diameter and upward of25 cm long, that can be cut to different lengths. Lengths of1 cm with approximately 200 cells each were used in all ofthe tests. The manufacturer activated the surface of thesamples through heating.
Laboratory testing was done using nitric acid generatedby a permeation tube (VICI Metronics, Santa Clara CA),evolving into a scrubbed, dry airflow. A mass flow con-troller regulated the source flow. Catalyst-equippedchemiluminescent nitrogen oxide analyzers were used todetect the nitric acid upstream and downstream of thedenuder (Figure 3). The denuder was mounted in a Teflon-lined chamber, and Teflon gas transport lines were usedthroughout. Cross comparisons between the 2 analyzerswere performed with no denuder in place to correct forbiases. An allowance of 60 minutes per configuration wasused to reach internal equilibrium. Collection efficiencywas determined by comparison of upstream and down-stream readings on the nitrogen oxide analyzers.
FILTER SELECTION TESTS
For both carbon analysis and � gauging, detection limitsdepend on the amount of sample deposited per unit area of
6
A Personal Particle Speciation Sampler
filter. Confining the deposit increases sensitivity, butresults in a greater pressure drop across the filter. Theoptimal trade-off between filter medium, deposit area,pressure drop, and attainable flow rate was evaluatedthrough direct measurements of different filter media andpersonal sampling pumps.
Pressure drops were measured as a function of filter facevelocity using a magnehelic differential pressure gauge(Dwyer, Michigan City IN). Flow control was provided bypersonal sampling pumps (Air-Chek-2000, SKC, EightyFour PA). Volumetric flow rates were verified using a flow-meter (Dry-Cal, Bios, Pomton Plains NJ). Stainless steelmasks placed on either side of the filters were used to deter-mine filtration areas. The masks were fabricated from0.010-inch stainless steel shim stock using a hole punch todefine the exposed area. For each of 4 types of filters, mea-surements were made at 3 flow rates (1, 2, and 3 L/min) andat 4 filtration areas (0.495, 0.710, 0.968, 1.26, and 3.60 cm2).
AEROSOL MASS DETERMINATION
� Attenuation Technique
The use of �-radiation attenuation to measure aerosolmass collected on a surface by filtration or impaction datesback to the early 1970s (Lilienfeld 1970; Lin et al 1973;Macias and Husar 1976). The � particles are high-energyelectrons that are scattered by the electron cloud in matter.This scattering depends on the electron cloud density andis largely independent of the chemical composition of thematter (Jaklevic et al 1981). Transmitted intensity of � par-ticles follows a simple exponential attenuation of the form
I = I0e−µx,
where I and I0 are the transmitted and incident �-par-ticle count rates, x is the areal mass density of the absorber,and µ is the mass absorption factor for the absorber, whichis constant at approximately 0.26 cm2/mg.
The � penetration is measured first through the blankfilter and then again after aerosol collection. The depositedmass depends logarithmically on the ratio of initial �intensity to final � intensity. The � gauges are calibratedusing standard absorption strips and comparing the resultswith gravimetric measurements to obtain the effectivevalue of µ for ambient aerosol. Linear approximations ofthe logarithmic ratio are acceptable for narrow ranges ofdensity measurements as would be the case with smalladditions of aerosol mass to a filter.
Four � attenuation systems were tested in an effort toextend this method of aerosol mass determination to light
filter loads: (1) a commercial instrument called the � atten-uation monitor (BAM-1020, Met One Instruments, GrantsPass OR); (2) a custom � gauge built by Aerosol Dynamics;(3) a custom system built by University of California (DavisCA); and (4) a commercial � gauge called the AT100 (Adap-tive Technologies Inc [ATI], Rockville MD). Table A.1 sum-marizes the specifications for these different systems.
Test methods varied depending on the particularsystem. In general, the limit of precision was tested bymonitoring the � attenuation of a static filter in placebetween the source and detector for more than 12 hours.Intervals for averaging were then selected to provide ade-quate counting accuracy (based on Poisson statistics) tojudge the inherent stability of a given system. The level ofprecision for active gauging of filters, with the necessaryrepeated insertion and removal of filters, can only equal orfall below the precision level for this base case. Of the 4systems, only the AT100 � gauge proved sensitive enoughto approach our detection limit goal of 1 µg/m3 for a 1-m3
sample. Details of the test methods and results for therejected systems are described in Appendix A.
AT100 � Gauge
The AT100 � gauge is a commercial unit sold for moni-toring thin film thickness in a manufacturing environment.Because rapid measurements are required to provide accu-rate thickness readings of film passing between rollers, thissystem’s activity source (3 mCi of promethium-147 [147Pm],half-life of 2.5 years) is higher than those of the other �gauge systems by a factor of 3000. 147Pm is a pure � emitterlike 14C but with slightly higher mean energies. The detec-tion system consists of a proprietary silicon diode com-bined with an integrated pulse counter, all housed in awell-shielded case. A digital serial communication lineconnects with a computer to complete the system. ATI lentus a demonstration unit for evaluation during our PPSSdevelopment.
The gauge and custom filter-mounting jig were placedinside a custom-built clear plastic glove box (100-Lcapacity) built to provide sufficient thermal insulationfrom the room and human operator (a significant source ofheat and humidity). This thermally decoupled arrange-ment allowed gauging of pairs of filters with shifts of lessthan 0.2°C or 0.1% relative humidity for the time neededto recalibrate the gauge and to gauge a pair of filters.
Tests performed with this system included precisiontests on static filters, tests of repeatability in gauging rein-serted filters (with and without aerosol loads), and testscomparing measurements of sampled ambient aerosolmasses obtained by � gauging and by gravimetry.

7
S Hering et al
Ambient samples were collected with a single PPSSsampler loaded with 2 Fiberfilm filters (T60A20, PallCorp) for a mass measurement method comparison. By uti-lizing both channels of a single sampler, we could avoidthe small uncertainties introduced by the passive flowsplit (previously shown to be less than 1%) because the 2Fiberfilm filters should load similarly. To provide a gravi-metric comparison, the filters were first weighed using amicrobalance (model MC-5, Sartorius, Edgewood NY)before being loaded in the PPSS filter cassettes. To reducefilter shifting from compression within the PPSS, the cas-settes were first loaded and then unloaded into the PPSSfilter channel before the first gauging.
PROTOTYPE TESTING
Field performance of the PPSS was tested throughambient sampling in the area of Berkeley, California. Mostsamples were collected inside our laboratory directlybeneath a ceiling air vent through which outdoor air couldbe drawn into the laboratory space. Two sets of sampleswere collected inside the Caldecott Tunnel, a freewaycommuter tunnel to the east of Berkeley.
To evaluate precision, samples were collected with apair of collocated prototype PPSSs. To evaluate accuracy,comparison was made with reference samples collectedsimultaneously using 47-mm Gelman filter holders withthe AIHL cyclone providing the 2.5-µm precut. The AIHLcyclone is used in the IMPROVE monitoring network, theCaltech sampler, and the EPA speciation sampler mar-keted by Thermo Andersen (Smyrna GA). As such, thisinlet has had extensive field evaluation and serves as agood reference standard for particle-size selection.
Because of delays in development of the � gauge system,mass measurements for comparing � gauging and gravim-etry were made on a separate set of ambient samples(described as part of laboratory testing previously) takenafter the field sampling was completed.
PPSS Sampling
For the PPSS the samples for mass determinations andinorganic ion analysis were collected on Fiberfilm filters.These were used as provided by the manufacturer. Thebackup filter used to capture of volatilized nitrate was aWhatman 41 cellulose filter impregnated with a 2% solu-tion of sodium chloride in 50:50 water-methanol dried in alow-temperature oven. Samples for organic analysis werecollected on Tissuequartz filters (2500QAT, Pall Corp).These were cleaned before sampling by prefiring at 500°Cto 600°C for 2 or more hours. The total flow through thePPSS and the flow split between the 2 channels werechecked at the beginning and end of each sampling period.The parts of the PPSS in contact with filter medium were
cleaned between each run by rinsing in isopropanol anddistilled water.
AIHL Cyclone Sampler
For the AIHL cyclone sampler, mass and ions were col-lected on preweighed Teflo filters provided by DesertResearch Institute (Reno NV). This was followed by a cellu-lose filter (Whatman 31ET) impregnated with 2% sodiumchloride in water-methanol. Samples for organic analysiswere collected on a pair of quartz filters operated in series.These were prefired in the same manner as for the PPSS.The cyclone was configured with a tee that split the flowbetween the 2 sampling lines. The flow through each sam-pling line was indicated by an inline rotameter downstreamof each filter set. These were calibrated to provide accuratereadings at the reduced pressure downstream of the filters,and differential pressure readings were obtained at thebeginning and end of each run with magnehelic differentialpressure gauges (Dwyer). The AIHL cyclone sampler usedfilters that were 47 mm in diameter and operated at approx-imately 6 times the flow rate of the PPSS. These quartz fil-ters were masked to a diameter of 20 mm so that the facevelocity would match the face velocity for the quartz filterof the PPSS to within 5%.
Fiberfilm filters were weighed in our laboratory using amicrobalance (Sartorious MC-5) with a sensitivity of 1 µg.
Treatment of Samples
All samples were refrigerated before shipment to labora-tories for analysis. Quartz filters for carbon analysis werestored in petri dishes lined with aluminum foil that hadbeen baked at 300°C. Samples were shipped for analysis incontainers with blue ice via priority overnight carrier.
Mass was determined gravimetrically after equilibrationto 35% relative humidity and 22°C for 24 hours in accor-dance with EPA specifications. Sulfate and nitrate ionswere measured by ion chromatography. Desert ResearchInstitute performed all of the mass and inorganic chemicalanalyses and the carbon analysis for the first 5 of the 10filter sets. Because of scheduling constraints at DesertResearch Institute, Sunset Laboratories (Forest Grove OR)performed the carbon analysis for the remaining filtersets. Both laboratories use thermal desorption from thequartz substrate with analysis of the evolved carbondioxide. Differences in methods led to systematic differ-ences in the allocation of carbon mass as organic carbon orelemental carbon. Because each set of quartz filter sam-ples was analyzed at one laboratory, however, precisiontests for differences within a given set were not affected bythese systematic differences in methods.
8
A Personal Particle Speciation Sampler
� Gauge Sampling
Six samples were taken in a separate evaluation of the �gauge method. A single prototype PPSS was used with bothchannels configured to collect mass on Fiberfilm filters.This approach eliminated uncertainties arising from differ-ential filter loading in the channels and consequent changesin flow split. Each filter was weighed before and after sam-pling using the microbalance and the AT100 � gauge. Boththe balance and the � gauge were housed in a clear polycar-bonate box that was constantly purged with dry, filtered air.A small filter/blower maintained good circulation of dust-free air within the box. Relative humidity and temperaturewere monitored using a Humitter probe (Vaisala, WoburnMA). Static charge effects were minimized using poloniumstrips (NRD, Grand Islands NY) inside the box.
RESULTS
SELECTION OF FILTER MEDIA, SPOT SIZE, AND SAMPLER FLOW RATE
The first step in the design of the PPSS was to examinethe detection limits, analyze the compatibility of filtermedia, and evaluate the gain that might be expected fromconcentrating the sample in a collection area on the filter.These analyses determined not only the sampling mediabut also the flow rate of the PPSS. As the inlet performanceand denuder performance both depend on flow rate, thesesteps had to be resolved first.
Analytic detection limits for the filter analysis, mostlytaken from the guidance document for PM2.5 speciation(Chow and Watson 1998), are listed in Table 1, which
shows that detection limits are better for inorganic ionsthan for mass or organic and elemental carbon. Becausedetection limits for organic and elemental carbon dependon the sample deposited per unit area of filter, we investi-gated the approach of concentrating the sample. Similarly,the sensitivity of � gauge methods for particle massdepends on the areal density of the particle deposit. Thusdetection limits can be improved by concentrating particlesamples onto a smaller deposit area than is the currentusual practice. However, pressure drop considerationslimit the extent to which sample size can be reduced.
Pressure drop was measured as a function of facevelocity for 4 types of filters: 0.6-µm pore size Nuclepore,Tissuequartz, and Fiberfilm; and 3-µm Teflo. Nucleporefilters are attractive for � attenuation measurementsbecause they have low areal density and are mechanicallystable (ie, they are not easily compressed). Tissuequartzfilters are used for carbon measurement. The Teflo andFiberfilm filters may be useful for mass and inorganic ionanalyses in that the Teflon substrate of these filters avoidsgas-phase adsorption artifacts.
The pressure drop was plotted as a function of the facevelocity, defined as the volumetric flow rate divided by thespot area (Figure 4). Although highly uniform and thereforeattractive for � attenuation purposes, Nuclepore filters werequickly eliminated for displaying an excessively large pres-sure drop. Teflo filters are the standard for mass measure-ments. They resulted in small pressure drops but were toouneven in areal density for use in a � gauge.
The � gauges were capable of assaying spots with diam-eters on the order of 1 cm. This diameter translated into aface velocity of 20 to 60 cm/sec for the range of the SKCpump, 1 to 3 L/min (see vertical dashed lines in Figure 4).
Table 1. Analytic Detection Limits
Species Analytic MethodMethod Limit of
DetectionaDetection Limit for
(1 m3 air)/(1-cm2 filter)b
Mass Gravimetryc 3.5 µg/filter (47-mm diameter)
3.5 µg/m3
BAM-1020 � gauge 2.0 µg/cm2 2.0 µg/m3
Nitrate Ion chromatography 0.05 µg/mL 0.2 µg/m3
Sulfate Ion chromatography 0.05 µg/mL 0.2 µg/m3
Ammonium ion Autocolorimetry 0.05 µg/mL 0.2 µg/m3
Organic carbon Thermal optical analysis 0.8 µg/cm2 0.8 µg/m3
Elemental carbon Thermal optical analysis 0.2 µg/cm2 0.2 µg/m3
a From Chow and Watson (1998).b Corresponds to 2 L/min flow through 1 cm2 for 8 hours.c Improvements in microbalances have reduced these limits by approximately a factor of 4, substituted here, compared with the original
published values of 15 µg per filter.
9
S Hering et al
Both Fiberfilm, best for � gauging, and Tissuequartz, bestfor analysis of organic and elemental carbon, had pressuredrops well within the limits of the SKC pump for samplingrates of 2 L/min. At 3 L/min, the Tissuequartz pressuredrop exceeded the water limit of 15 inches for this partic-ular pump although the Fiberfilm remained at half thatlevel. The SKC pump is representative of current personalsampling pumps in its limitations.
The effect of loading on these pressure drops was testedusing a 25-mm Fiberfilm filter loaded with aluminumoxide particles generated by a dust-disperser system. Atotal mass of 167 µg was collected, which is equivalent toan areal density of 46 µg/cm2. This density is conserva-tively high for that likely to be encountered by a personalsampler with a flow rate of 2 L/min through a 1-cm spot for8 hours, for a total sample volume of roughly 1 m3. Thepressure drop before and after collections was measured tobe 3.0 inches of water, indicating no measurable change.
On the basis of these tests, we selected Fiberfilm andTissuequartz filters with collection diameters of 7 and8 mm, respectively, and with 2 L/min flow through eachchannel. The result was a deposit area of 0.38 and 0.50 cm2
for inorganic and carbon samples, respectively, and thesample volume for an 8-hour collection was 1 m3/channel.The corresponding detection limits expected from thevalues given in Table 1 were 0.1 µg/m3 for elementalcarbon, 0.4 µg/m3 for organic carbon, and 0.8 µg/m3 formass determined by � attenuation.
INLET EVALUATION
Three types of inlets were examined for use in the PPSS:particle microtrap, spiral, and cyclone. The first 2 typeswere new and thus untested but offered the advantage ofcompactness. The cyclone was more difficult to package ina compact sampler but had repeatedly been shown to pro-vide good cutpoints for both liquid and solid particles.
Microtrap Inlet
An existing microtrap particle collector was modified foruse as a prospective precut device for the PPSS. Themicrotrap collector consists of a staggered array of circularjets stationed above a second array of receiving cups ormicrotraps. The particle-laden airstream passes through thejets and makes a sharp turn over the microtraps. As a resultof the particles’ inertia, particles above a well-defined aero-dynamic size, the cutpoint, are deposited into the collectionmicrotraps situated directly beneath each jet orifice. Theresulting penetration of solid, polydisperse polystyrenelatex particles at a total flow rate of 2 L/min using 24 jetswas determined. The average of 2 runs is shown by thedotted line in Figure 5, with error bars indicating ± 1 SDaccording to Poisson counting statistics. The 50% aerody-namic cutpoint is at 2.5 µm as desired, but approximately5% penetration is indicated for particles above roughly4 µm in diameter. Without further refinements or the addi-tion of a second precut device upstream of the microtrap
Figure 4. Pressure drop of unloaded filters versus face velocity.
Figure 5. Laboratory measurements of penetration of solid, polydispersepolystyrene latex spheres through a particle microtrap at 2 L/min flowrate. Each circle is the average of 2 runs (points) and circles are shownwith ± 1 SD Poisson error bars based on raw counts in each APS size bin.
10
A Personal Particle Speciation Sampler
targeting particles of 4 µm or larger, the microtrap could notreliably provide 100% collection of these larger particles.Significant impact on PM2.5 mass collected can result witheven a low but finite penetration of large particles. There-fore, the microtrap in its current configuration does not sat-isfy the PPSS design goal for mass.
Spiral Inlet
The spiral inlet consists of a curving spiral channel thatprovides inertial removal of large particles with relativelygentle impact to avoid bounce and disaggregation. Exten-sive laboratory tests had shown the spiral inlet to be effec-tive at removing both liquid and solid bouncy particlesand its performance to be equivalent to the EPA FRMPM2.5 standard. However, ambient field tests we per-formed with the spiral inlet in certain locations (eg,Phoenix AZ) showed the presence of soil dust elementsand larger masses than were obtained by collocatedcyclone sampling, indicating coarse particle penetration.Although this effect was never reproduced in the labora-tory owing to the difficulty in producing large enough par-ticles, this consistent field observation indicated thenecessity of taking precautionary measures.
Preliminary work was started on testing a precut devicebased on a virtual cyclone designed by Walter John fol-lowing the work of Torczynski and Rader (1997), with theobjective to eliminate large-particle penetration. Chen et al(1999) reported on a virtual cyclone for personal samplingthat provided a respirable (4-µm) particle cutpoint. This vir-tual cyclone could be placed ahead of the spiral or microtrapto exclude the largest particles. Laboratory measurementsindicated that the use of a virtual impactor precut deviceeliminated coarse particle penetration without influencingthe cutpoint characteristics of the spiral inlet. With the addi-tion of a second precut device, however, the advantage ofcompactness was lost. Therefore the spiral inlet was nolonger satisfactory for use in the PPSS.
Cyclone Inlet
While the filter channel design was under development,it became clear that a parallel, cylindrical precut devicewould best complement the evolving PPSS design. The useof a compact cyclone approach, suggested by Walter Johnand following the design of Kenny and Gussman (1997) wastherefore adopted. Using Kenny’s proportions and designcriteria, we built a cyclone to provide a 2.5-µm cutpoint at 4L/min (the combined flow for the 2 channels of the PPSS).
Two operating configurations for the sampler were evalu-ated: one direct and the other with inlet tubing. In the directconfiguration the PPSS was placed inside the test chamber,and the challenge aerosol was aspirated directly into theinlet port on the face of the sampler. This configuration is
analogous to the PPSS being worn on the subject’s torso. Inthe second configuration particles were sampled through a46-cm-long, flexible, electrically conducting tube attachedto the PPSS inlet. This second configuration mimics place-ment of the PPSS in a small waist pouch or backpack with atube extending to the vicinity of the breathing zone.
The collection efficiency of the cyclone inlet was testedwith the cyclone mounted inside the sampler. The 2 filterchannels were empty, enabling measurement of particlepenetration through the cyclone and plenum into the filterchamber. Calibration tests were done with solid, polydis-perse polystyrene latex particles and with liquid, mono-disperse oleic acid particles. Owing to limitations of theAPS, calibration with polydisperse oleic acid could not beperformed, as described in the Methods section.
Calibration results are shown in Figure 6. Each set ofpoints represents the average of 6 individual penetrationcurves for samples obtained using the direct configurationor 5 individual curves for samples obtained using the con-figuration with inlet tubing. For direct sampling the cut-point (the diameter of particles collected with 50%efficiency) was 2.55 µm. The geometric standard deviation(GSD), given by the square root of the ratio of particlediameters for collection efficiencies of 84% and 16%, was1.24. No difference was evident between liquid and solidparticles. Sampling with inlet tubing resulted in a cutpointof 2.50 µm with a GSD of 1.25. Within the accuracy of the
Figure 6. Penetration of solid, polydisperse polystyrene latex (poly-PSL)spheres and liquid, monodisperse oleic acid particles through the com-pact cyclone inlet and empty PPSS body at 4 L/min. Direct sampling andsampling through a conducting, flexible inlet tube were tested. Curve fitto the direct polydisperse polysterene latex case is shown in comparisonwith the FRM PM2.5 penetration standard. D50 is the particle diameter col-lected with 50% efficiency.

11
S Hering et al
measurements, these 2 cyclone inlet configurations wereequivalent. For comparison, the solid line in Figure 6shows the FRM standard curve for PM2.5 sampling, whichhas a cutpoint of 2.5 µm and a GSD of 1.18 (Peters et al2001). By comparison with the FRM curve, the PPSScyclone allowed somewhat more penetration of particlesin the aerodynamic diameter range of 3 to 4 µm.
The degree of agreement with the FRM standard forPM2.5 sampling was quantified following the procedureoutlined in US Code of Federal Regulations (40 CFR, Part53, Subpart F). The code defines 3 bimodal size distribu-tions, labeled coarse, typical, and fine, for which the frac-tion of particle mass that penetrates through the idealizedFRM inlet is 13.8%, 34.3%, and 78.5%, respectively, of thetotal. A cutpoint curve is considered equivalent to the FRMcurve if, for each of these 3 distributions, the mass thatpenetrates falls between 95% and 105% of that which pen-etrates the FRM inlet, and if the cutpoint is between 2.3 µmand 2.7 µm. To test the PPSS cyclone, the polydispersepolystyrene latex penetration data for direct sampling (cir-cles in Figure 6) were fit to an equation of the same formused by Peters and colleagues (2001) to describe the FRMcurve. The resulting fit (dotted line in Figure 6) was thenevaluated at the 43 discrete sizes defined in the FederalRegistry, multiplied by the particle mass listed for that sizeand distribution, and summed. For the 3 idealized distri-butions, coarse, typical, and fine, the calculated mass pen-etrating to the collecting filters was 1.045%, 1.015%, and1.007%, respectively, of that calculated for the FRM sam-pler. In each case the bias in penetrating mass relative tothe FRM standard was within the allowed 5%.
Because the liquid particle tests were limited to a fewparticle sizes, the possibility of inertial losses was investi-gated further. The most likely location for inertial losseswas the upper plenum surface where the exit flow from thecyclone had to make a sharp turn to enter the filter cham-bers. To test for losses at the cyclone exit, we greased theinterior plenum surface and measured the penetration ofArizona road test particles through the cyclone and intothe filter chambers. Results were compared with thoseobtained from a sampler without greased surfaces. Thesetests were done at the end of the project with a newly fab-ricated, plastic-body PPSS, containing an aluminumcyclone of the same dimensions as that used to obtain thedata in Figure 6. No systematic difference was seen in thepenetration curves. Fits to the data, with and withoutgrease on the plenum, gave equivalent cutpoints to within0.6% and identical GSD values. These differences arewithin the margin of experimental error.
Finally, we investigated the efficiency of transport ofultrafine particles through the inlet and into the filterchambers. Ultrafine particles are subject to diffusional
losses, which are larger at low sampling flow rates. Pene-tration of ultrafine particles was measured with the proto-type sampler configured for normal sampling operationthat included the compact cyclone, Teflon denuder holder,filter support rings, and channel screw caps, but withoutfilters. Room air, which had a maximum in the number dis-tribution below 0.1 µm, was used as the challenge aerosol.The PPSS was operated at a flow rate of 4 L/min through thecyclone, but only 1.5 L/min through the test channel, so as tomatch the flow rate of the CPC. Alternate sampling for 20-second periods of room air and at the exit of the filterchannel of the prototype resulted in average concentrationsof 4410 particles/cm3 and 4320 particles/cm3, respectively.The average penetration was 98% with an SE of 1.6%. Addi-tion of the carbon denuder reduced penetration of ultrafineparticles to 93% ± 1.8% SE.
Selection of Cyclone Inlet
On the basis of measurements for the microtrap, spiral,and cyclone inlets, the cyclone was selected as the 2.5-µmprecut device for the PPSS. Of the 3 inlets tested, its pene-tration curve was closest to that of the FRM fine particlestandard. In addition, it offered the advantage of being themost-tested approach for exclusion of coarse particles.This was important because laboratory evaluation of theeffectiveness of the test inlets for excluding very large par-ticles was difficult. The one disadvantage of the cyclone,its size, was circumvented through the compact design forthe sampler proposed by Walter John. The penetrationcurve for the cyclone met the criteria defined in the Fed-eral Register for PM2.5 samplers. Performance was equalfor both liquid and solid particles. Explicit tests for pene-tration of ultrafine particles placed lower penetrationlimits of 98% for operation without the denuder and 93%with the denuder. Finally, we found that the PPSS inletcould be operated with flexible, electrically conductingtubing attached to the inlet with no degradation in the sizeselection characteristics. This offers the opportunity forthe sampler to be placed in a small waist pouch or back-pack, rather than worn directly.
DENUDER PERFORMANCE
Nitric acid capture efficiency was measured in the labora-tory for 2 types of denuders (Table 2). In these tests the acti-vated carbon denuder was more efficient at removing nitricacid than the magnesium-oxide–coated aluminum denuder,requiring less than half the length to achieve the same levelof efficiency. The relevant control parameter for gas captureby diffusion within laminar tube flow is the flow rate perunit length. Thus the carbon denuder has the advantage ofbeing more compact. After prolonged use the carbon
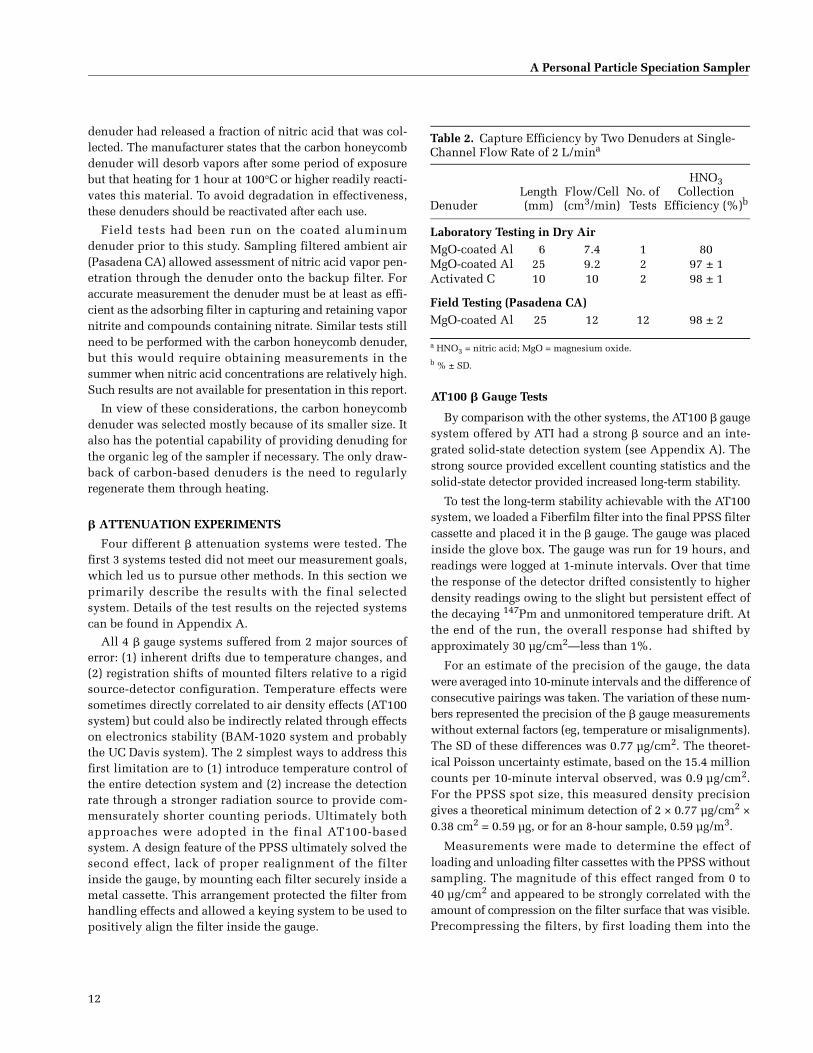
12
A Personal Particle Speciation Sampler
denuder had released a fraction of nitric acid that was col-lected. The manufacturer states that the carbon honeycombdenuder will desorb vapors after some period of exposurebut that heating for 1 hour at 100°C or higher readily reacti-vates this material. To avoid degradation in effectiveness,these denuders should be reactivated after each use.
Field tests had been run on the coated aluminumdenuder prior to this study. Sampling filtered ambient air(Pasadena CA) allowed assessment of nitric acid vapor pen-etration through the denuder onto the backup filter. Foraccurate measurement the denuder must be at least as effi-cient as the adsorbing filter in capturing and retaining vapornitrite and compounds containing nitrate. Similar tests stillneed to be performed with the carbon honeycomb denuder,but this would require obtaining measurements in thesummer when nitric acid concentrations are relatively high.Such results are not available for presentation in this report.
In view of these considerations, the carbon honeycombdenuder was selected mostly because of its smaller size. Italso has the potential capability of providing denuding forthe organic leg of the sampler if necessary. The only draw-back of carbon-based denuders is the need to regularlyregenerate them through heating.
� ATTENUATION EXPERIMENTS
Four different � attenuation systems were tested. Thefirst 3 systems tested did not meet our measurement goals,which led us to pursue other methods. In this section weprimarily describe the results with the final selectedsystem. Details of the test results on the rejected systemscan be found in Appendix A.
All 4 � gauge systems suffered from 2 major sources oferror: (1) inherent drifts due to temperature changes, and(2) registration shifts of mounted filters relative to a rigidsource-detector configuration. Temperature effects weresometimes directly correlated to air density effects (AT100system) but could also be indirectly related through effectson electronics stability (BAM-1020 system and probablythe UC Davis system). The 2 simplest ways to address thisfirst limitation are to (1) introduce temperature control ofthe entire detection system and (2) increase the detectionrate through a stronger radiation source to provide com-mensurately shorter counting periods. Ultimately bothapproaches were adopted in the final AT100-basedsystem. A design feature of the PPSS ultimately solved thesecond effect, lack of proper realignment of the filterinside the gauge, by mounting each filter securely inside ametal cassette. This arrangement protected the filter fromhandling effects and allowed a keying system to be used topositively align the filter inside the gauge.
AT100 � Gauge Tests
By comparison with the other systems, the AT100 � gaugesystem offered by ATI had a strong � source and an inte-grated solid-state detection system (see Appendix A). Thestrong source provided excellent counting statistics and thesolid-state detector provided increased long-term stability.
To test the long-term stability achievable with the AT100system, we loaded a Fiberfilm filter into the final PPSS filtercassette and placed it in the � gauge. The gauge was placedinside the glove box. The gauge was run for 19 hours, andreadings were logged at 1-minute intervals. Over that timethe response of the detector drifted consistently to higherdensity readings owing to the slight but persistent effect ofthe decaying 147Pm and unmonitored temperature drift. Atthe end of the run, the overall response had shifted byapproximately 30 µg/cm2—less than 1%.
For an estimate of the precision of the gauge, the datawere averaged into 10-minute intervals and the difference ofconsecutive pairings was taken. The variation of these num-bers represented the precision of the � gauge measurementswithout external factors (eg, temperature or misalignments).The SD of these differences was 0.77 µg/cm2. The theoret-ical Poisson uncertainty estimate, based on the 15.4 millioncounts per 10-minute interval observed, was 0.9 µg/cm2.For the PPSS spot size, this measured density precisiongives a theoretical minimum detection of 2 × 0.77 µg/cm2 ×0.38 cm2 = 0.59 µg, or for an 8-hour sample, 0.59 µg/m3.
Measurements were made to determine the effect ofloading and unloading filter cassettes with the PPSS withoutsampling. The magnitude of this effect ranged from 0 to40 µg/cm2 and appeared to be strongly correlated with theamount of compression on the filter surface that was visible.Precompressing the filters, by first loading them into the
Table 2. Capture Efficiency by Two Denuders at Single-Channel Flow Rate of 2 L/mina
Denuder Length (mm)
Flow/Cell(cm3/min)
No. of Tests
HNO3 Collection
Efficiency (%)b
Laboratory Testing in Dry AirMgO-coated Al 6 7.4 1 80MgO-coated Al 25 9.2 2 97 ± 1Activated C 10 10 2 98 ± 1
Field Testing (Pasadena CA)MgO-coated Al 25 12 12 98 ± 2
a HNO3 = nitric acid; MgO = magnesium oxide. b % ± SD.

13
S Hering et al
PPSS and unloading them, eliminated this bias as long as thefilters were not loaded into the sampler with excessive force.
To reduce the chance of introducing unwanted loadingerrors, an additional step was taken. An extra retainingshim ring was inserted into the filter cassette to increaseslightly the gap between the sealing faces of the supportrings and thereby decrease the amount of compression.This effectively eliminated the variability of loading forceused by the operator. Sharp deposit edges were observedin all cases except one in which the deposit area exhibiteda slightly wavy border. Even in this case, however, thespread of the sample was negligible and should not haveaffected the � gauge measurement.
For 5 pairs of ambient samples collected in our laboratory,mass determinations by � gauging and gravimetry were com-pared (Figure 7A) and measurement precision was tested(Figure 7B). Sample duration varied from 1 to 10 hours toprovide a wide range of total aerosol loads. The range ofabsolute deposited mass was 2 to 50 µg as measured by �gauging and 2 to 70 µg as measured by gravimetry. The rangeof aerosol concentrations was 14 to 70 µg/m3. To allowdirect comparisons of collected mass, each sample was nor-malized by the measured average flow rate for each channel.Both graphs show general well-correlated trends betweenthe 2 PPSS units, but higher correlations in the �-� case(Figure 7B) than in the �-gravimetry case (Figure 7A).
The mean ratio of � mass to gravimetric mass for theentire set was 0.80, which increased to 0.93 when onlythose points (half) for which the gravimetric samples werewithin 12% agreement with each other were considered.Figure 7A shows good agreement between �-gauged massand gravimetry mass when the collected mass was lessthan about 25 µg but revealed a bias toward low agreementfor samples with mass greater than about 50 µg. Thisobservation is consistent with the known effect that mate-rials with smaller bulk densities (mass per unit volumeinstead of area) have an enhanced � attenuation factor.One can speculate that aerosol may deposit on the fibers ofthe Fiberfilm filter in such a way as to create a ramifiedstructure that possesses a lower areal density than a com-parable uniform deposit on the bulk of the filter. Moreover,because the calibration was based on Mylar films ofvarying thickness rather than particle deposits, one wouldexpect increasing relative errors for larger deposits. Fur-ther ambient measurements are necessary to accuratelydetermine this empirical correction factor.
Much of the above data were collected over very shortsampling periods so as to assess precision at low levels ofcollected particles. To assess the corresponding precisionfor the planned use of the personal sampler (that is, for
8-hour monitoring), we examined the precision expressedin terms of the mass collected (Table 3), rather than massconcentration. The apparent outlier in Figure 7B, forwhich the relative difference between the paired � gaugemeasurements was 10 times the next-largest relative differ-ence, was excluded from the precision analysis. With thisexclusion, the measured precision for mass by � attenua-tion, as indicated by the pooled SDs, was within 0.8 µg, or3% of the mean measured mass. For 8-hour collection thecorresponding sample volume would be 1 m3, yielding anexpected measurement precision of 0.8 µg/m3 at 1 SD. Ourgravimetric precision was much poorer (3.7 µg), which mayhave resulted from extra handling of the filters in obtainingboth � attenuation and gravimetric measurements.
Figure 7. A: Comparison of PPSS filter mass determinations by gravim-etry and by the AT100 � gauge system; B: Precision of sample mass deter-minations by gravimetry and � gauging. Samples were collected from2 channels of a single PPSS prototype. Each sample was normalized bythe measured average flow rate for each channel (normM).

14
A Personal Particle Speciation Sampler
Figure 8. Prototype PPSS.
Selection of � Gauge System
Of the 4 systems evaluated, satisfactory results wereobtained only with the AT100 � gauge system. The long-term stability of the BAM-1020 system was poor, requiringa 2-spot assay system for accurate measurements. This wasboth cumbersome and time-consuming, requiring repeatedmeasurements on the sample filters. The AerosolDynamics custom-built system provided the long-term sta-bility desired but was subject to short-term drift that lim-ited its sensitivity to 1 part in 1000. The UC Davis systemshowed the potential for providing accurate measurement,but most likely would have required temperature controlthat was not easily adapted to this system.
In contrast, the AT100 system provided stability ofapproximately 1 part in 4000. The uncertainty from thecounting statistics reduced the required measurement timefor a single sample to 10 minutes. Further, tests to comparemeasurement precision over a variety of sampling dura-tions yielded a mass precision of 0.8 µg or 3% of theaverage measured mass of 23.6 µg. For 8-hour sampling thesample volume was 1 m3, giving an indicated measure-ment precision of 0.8 µg/m3. For these reasons the AT100� gauge system was deemed to be the best.
PROTOTYPE DESIGN
On the basis of the component testing described above, aprototype was constructed using (1) cyclone precut, (2)carbon honeycomb denuders, (3) Tissuequartz filter with8-mm spot size, and (4) Fiberfilm filter with 7-mm spot sizefollowed by a paper filter impregnated with sodium chloride.
In the prototype PPSS (Figure 8), the cyclone precutdevice is at the center of the sampler. The 2 filter channelsare housed on either side, oriented vertically. Eachchannel is designed to hold one or two 25-mm–diameterfilters and one denuder. Airflow enters at the side port,passes through the cyclone, exits into the upper plenum,splits between the 2 denuder–filter channels, and finallyrecombines and exits through the outflow plenum. Asingle personal sampling pump draws flow through the2 channels. The design flow rate through each channel is 2L/min with a combined flow of 4 L/min. The overalldimensions are 11 cm × 5.4 cm × 4.5 cm. This prototypewas fabricated from aluminum (density 2.7 g/cm3) andweighed 550 g. Subsequent fabrication of selected partsfrom plastic has reduced this weight to 220 g.
The inlet is located on the front face of the PPSS body.The PPSS can be operated with the inlet face open if it is tobe attached via a harness to the subject’s torso. Alterna-tively, sampling can be conducted through low-particle-loss conducting tubing by means of an adapter inserted
Table 3. Precision of Mass Measurements by Gravimetry and AT100 � Gauge by Channel
Average Volume
(m3)
Gravimetric Mass (µg)
� Gauge AT-100 Mass (µg)
1 2 1 2
Run1 1.11 55.5 65.8 39.0 37.22 0.77 53.6 52.7 47.2 45.74 0.26 14.7 14.0 13.6 13.45 0.89 18.3 20.7 19.3 19.66 0.12 1.7 6.5 2.0 2.2
Mean mass (µg) 30.3 23.9
Pooled SD (µg) 3.7 0.8
Coefficient of variation (%) 12.2 3.2
a Reported mass has been corrected to average sample volume for the 2 channels: mass reported = mass measured (V1 + V2)/(2Vi), where V1 and V2 are sample volumes for channels 1 and 2, and i = channel reported.

15
S Hering et al
into the sampler’s inlet. This option allows sampling inthe breathing zone, which may be more representative ofthe subject’s exposure.
During normal sampling operation, the exhaust of thePPSS is a single combined outlet from the 2 filter channelsthat are connected to a personal sampling pump. For flowchecks the PPSS bottom may be removed and 2 plugs withtubes can be inserted into each filter channel to allowdirect simultaneous measurement of the 2 flow rates.
The PPSS is designed for a single quartz filter (eg, Tis-suequartz) for particulate carbon sampling and a denudedTeflon-impregnated glass fiber filter (eg, Fiberfilm) formass and inorganic ion determinations. A backup cellu-lose filter impregnated with sodium chloride is placeddownstream of the Teflon filter to capture the volatilenitrate that is lost from the Teflon filter during sampling.Nitrate-specific filter media such as those impregnatedwith sodium chloride often offer advantages over moregenerally adsorbing media such as nylon (Chow andWatson 1998). The impregnated filters have the additionaladvantage of a lower pressure drop at the same facevelocity when compared with nylon filters. Each channelis sized to accommodate a 27-mm–diameter denuder asmuch as 25 mm in length. Each channel holds 25-mm fil-ters of each type that are masked to increase sensitivityand improve detection limits.
With 2 L/min flow per channel, the sample volumewithin an 8-hour period is 1 m3. The 8-mm spot on thequartz filter is the sample size that Desert Research Insti-tute currently uses for elemental and organic carbon anal-yses when these samples are analyzed. With analyticdetection limits of 0.2 µg/cm2 for elemental carbon and0.8 µg/cm2 for organic carbon, the PPSS limit of detectionfor these species is 0.1 and 0.4 µg, respectively. With theTeflon filter, the smaller filter deposit improves the detec-tion limit for � attenuation determinations of particle mass.The small Teflon filter is easily extracted in 5 mL. At nom-inal ion chromatography detection limits of 0.05 µg/mL, thedetection limit is 0.3 µg/m3.
The flow split between the 2 channels is handled pas-sively, based on measured flow-dependent pressure dropsacross the filter media. The masked filter area is madelarger on the quartz-filtered carbon side relative to theTeflon-filtered inorganic side to help equalize the pressuredrops at 2 L/min flow. For particulate carbon sampling an8-mm spot size is used, whereas for ion and mass samplinga 7-mm spot size is used. To provide the balance of thepressure drop equalization, an annular shim with 8 mminternal diameter is placed over the paper backup filter onthe inorganic side. Tests with ambient particulate loadings
up to 100 µg per filter showed that the flow balance wasmaintained to within 5%.
Although not yet implemented, there is provision in thePPSS design to accommodate a denuder ahead of thequartz filter for organic carbon analysis. Unlike nitratemeasurements, there is as yet no accepted means to accu-rately collect carbon particles. The baked quartz filtersreadily adsorb many organic vapor constituents, resultingin a positive artifact (McDow and Huntzicker 1990; Turpinet al 1994). Also, organic aerosols contain volatile constit-uents that may be lost during sampling (just as ammoniumnitrate can be lost; Eatough et al 1993). Considerabledebate can be found in the literature as to which of theseeffects dominates. Recently some investigators have beenusing denuders ahead of quartz filters for carbon analysis.The PPSS is designed to accommodate a carbon honey-comb denuder ahead of the quartz filter to remove organicvapors that might otherwise collect on the filter, as doneby Kreiger and Hites (1992). However, this aspect has notyet been tested with the PPSS.
PROTOTYPE FIELD EVALUATION
Precision of Passive Flow Split
The prototype employs a passive flow split between the2 channels. In other words, only the total flow is con-trolled, and the split between the 2 channels depends onthe relative flow resistance of the 2 sets of filter media.This flow split can change if the filters load at differentrates—in other words, if the relative pressure drop acrossone increases with loading faster than across the other.The question we address here is the precision with whichthe flows are known with this passive flow split.
In field testing the individual flows for each channelwere measured at the beginning and end of each sample.Figure 9 shows the fractions of the total flow constitutedby the initial and final flow through the Fiberfilm channel.Consistently we found that the relative fraction of the flowthrough the Fiberfilm filter decreased. This was becausethe pressure drop across the Fiberfilm filter increased withparticle loading somewhat more quickly than the pressuredrop across the Tissuequartz filter, leading to a higher pro-portion of the flow passing through the latter filter by theend of the sample period. With the exception of the 2 sam-ples collected in the freeway tunnel, the total change in thepressure drop across the PPSS was less than 1 inch ofwater. Anomalously large pressure drops relative to thecollected mass for the tunnel samples may be attributableto volatile organic species lost subsequent to sampling.
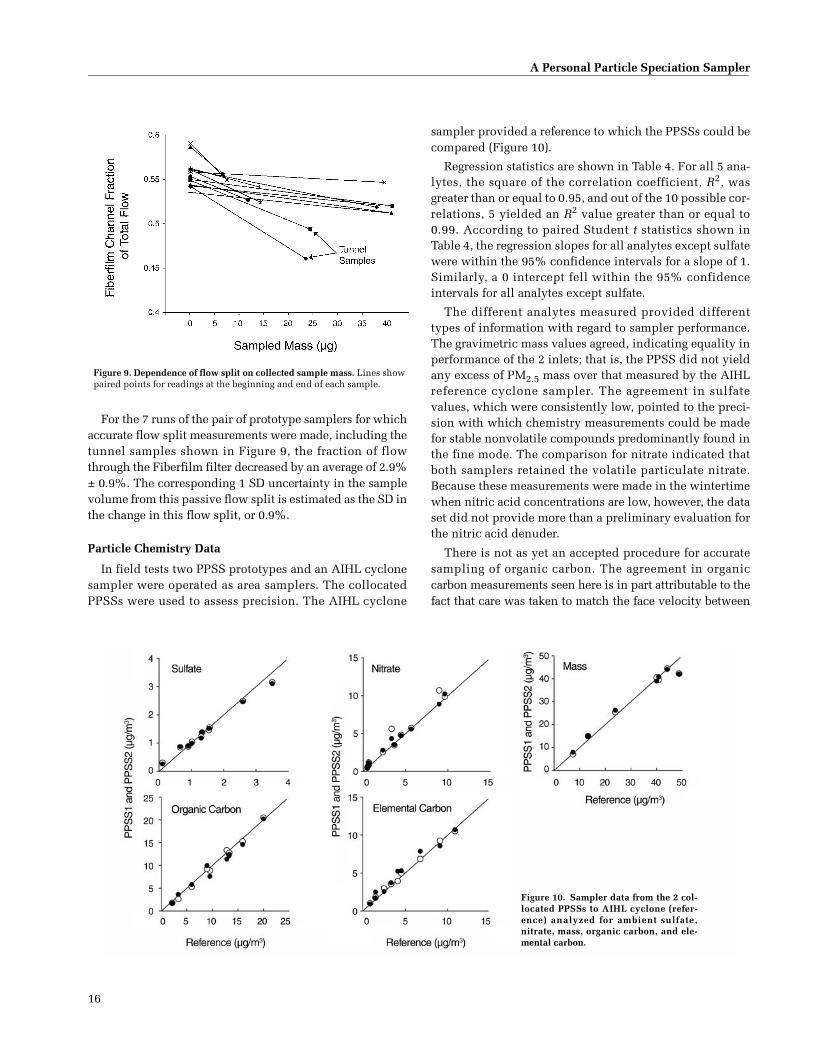
16
A Personal Particle Speciation Sampler
For the 7 runs of the pair of prototype samplers for whichaccurate flow split measurements were made, including thetunnel samples shown in Figure 9, the fraction of flowthrough the Fiberfilm filter decreased by an average of 2.9%± 0.9%. The corresponding 1 SD uncertainty in the samplevolume from this passive flow split is estimated as the SD inthe change in this flow split, or 0.9%.
Particle Chemistry Data
In field tests two PPSS prototypes and an AIHL cyclonesampler were operated as area samplers. The collocatedPPSSs were used to assess precision. The AIHL cyclone
sampler provided a reference to which the PPSSs could becompared (Figure 10).
Regression statistics are shown in Table 4. For all 5 ana-lytes, the square of the correlation coefficient, R2, wasgreater than or equal to 0.95, and out of the 10 possible cor-relations, 5 yielded an R2 value greater than or equal to0.99. According to paired Student t statistics shown inTable 4, the regression slopes for all analytes except sulfatewere within the 95% confidence intervals for a slope of 1.Similarly, a 0 intercept fell within the 95% confidenceintervals for all analytes except sulfate.
The different analytes measured provided differenttypes of information with regard to sampler performance.The gravimetric mass values agreed, indicating equality inperformance of the 2 inlets; that is, the PPSS did not yieldany excess of PM2.5 mass over that measured by the AIHLreference cyclone sampler. The agreement in sulfatevalues, which were consistently low, pointed to the preci-sion with which chemistry measurements could be madefor stable nonvolatile compounds predominantly found inthe fine mode. The comparison for nitrate indicated thatboth samplers retained the volatile particulate nitrate.Because these measurements were made in the wintertimewhen nitric acid concentrations are low, however, the dataset did not provide more than a preliminary evaluation forthe nitric acid denuder.
There is not as yet an accepted procedure for accuratesampling of organic carbon. The agreement in organiccarbon measurements seen here is in part attributable to thefact that care was taken to match the face velocity between
Figure 10. Sampler data from the 2 col-located PPSSs to AIHL cyclone (refer-ence) analyzed for ambient sulfate,nitrate, mass, organic carbon, and ele-mental carbon.
Figure 9. Dependence of flow split on collected sample mass. Lines showpaired points for readings at the beginning and end of each sample.

17
S Hering et al
the personal and reference samplers. If the face velocitiesare equal, then the organic vapor adsorption artifact, as wellas any loss due to vaporization, will be approximately thesame. To assess the magnitude of organic vapor artifact, thereference sampler was operated with a quartz backup filter,which collected organic material from the adsorption ofvapors onto the quartz filter medium. Some of the organicvapor may have been in the gas phase initially, and somemay have resulted from vaporization of particles collectedon the primary filter. In our experiments the organic carbon
collected on the backup filter was 11% ± 4% of that on thefront filter. The 11% value we obtained is similar to thatreported by McDow and Huntzicker (1990) for urban sam-pling in Portland, Oregon, and somewhat lower than the16% value reported by Kirchstetter and colleagues (1999)for freeway tunnel measurements.
In the results from collocated PPSSs (Figure 11), precisionwas generally better for sulfate and elemental carbon thanfor nitrate or organic carbon. Pooled SDs were 0.03 µg/m3 forsulfate, 0.5 µg/m3 for nitrate, 0.6 µg/m3 for organic carbon,
Table 4. Regression Statistics for PPSS Versus AIHL Reference Cyclone Sampler
Sulfate NitrateOrganicCarbon
ElementalCarbon
GravimetricMass
No. of measurements 10 10 10 10 8Mean reference concentration (µg/m3)
1.5 4.0 10.5 4.5 31.2
R2 for PPSS1 0.99 0.95 0.99 1.00 0.98R2 for PPSS2 0.99 0.99 0.97 0.97 0.98
Slope for PPSS1 0.85 ± 0.05 1.06 ± 0.19 1.04 ± 0.07 0.96 ± 0.05 1.08 ± 0.19Slope for PPSS2 0.84 ± 0.07 0.99 ± 0.09 0.96 ± 0.13 0.95 ± 0.13 1.11 ± 0.19
Intercept for PPSS1 (µg/m3) 0.20 ± 0.09 0.27 ± 0.98 �0.72 ± 0.81 0.33 ± 0.26 �1.75 ± 6.26Intercept for PPSS2 (µg/m3) 0.19 ± 0.11 0.29 ± 0.45 �0.18 ± 1.53 0.63 ± 0.71 �2.75 ± 6.44
Ratio of MeansPPSS1 to reference 0.98 1.13 0.97 1.03 0.98PPSS2 to reference 0.97 1.07 0.94 1.09 0.98
Figure 11. Measurements for sulfate,nitrate, mass, organic carbon, and ele-mental carbon in samples from the twocollocated PPSSs.

18
A Personal Particle Speciation Sampler
0.4 µg/m3 for elemental carbon, and 0.8 µm/m3 for mass(Table 5). Sample durations varied from 4 to 16 hours with amean sample volume of 1.1 m3 per channel. Thus, onaverage, these precision values correspond to what could beexpected for 8-hour sampling with a 1-m3 collection persampling channel. The measured precisions met the 8%precision level targeted at the outset of the study with theexception of nitrate, for which the measured precision was11% (see Table 5). Absolute precision was better than targetdetection limits for sulfate and comparable to target levelsfor organic carbon, elemental carbon, and mass. Again,nitrate values were somewhat less precise.
DISCUSSION
A PPSS has been developed that meets the major designobjectives set forth in the proposal for precise measure-ment of all primary constituents of ambient particles. Spe-cifically, the PPSS possesses 2 channels to accommodate aTissuequartz filter, compatible with organic carbon anal-ysis, and a Fiberfilm filter, which is suitable for nitrate,other inorganic species, and total mass determinations by� gauging or gravimetry. The PPSS utilizes a compactcyclone to deliver a bounce-free, greaseless size fraction-ation that accurately matches the EPA FRM for PM2.5 sam-pling while remaining compatible with organic carbonanalysis, and it accommodates the use of carbon honeycombor magnesium-oxide–coated aluminum denuders for accu-rate sampling of nitrate-containing species without interfer-ence from nitric acid. The unit can be operated with apassive flow split and a single pump to provide a total flowof 4 L/min, split nearly evenly between 2 filter chambers andis compatible with mass determination by � attenuation.
The specific performance goals for the PPSS were for themost part met by laboratory tests and the first field test.
The nitric acid exposure tests showed that the carbon hon-eycomb denuder reached 99% efficiency at removingnitric acid. The passive flow split was shown to be con-stant (on average to within a few percentage points withSD less than 1%). The AT100 � gauge in a small series oftests, excluding one outlier, possessed a pooled SD of1 µg/m3 that translates into a limit of detection of 2 µg/m3
for mass. Initial estimates of the PPSS analyte-specificdetection limits based on the pooled SDs of collocatedfield measurements were 0.058 µg/m3 for sulfate,1.0 µg/m3 for nitrate, 1.3 µg/m3 for organic carbon,0.88 µg/m3 for elemental carbon, and 1.7 µg/m3 for mass(via gravimetry). These values are nearly uniformly doublethe original goals. Precision for side-by-side samplingduring the initial study, as taken by the pooled SD dividedby the mean concentration of a given analyte, ranged from2% for sulfate to 11% for nitrate. The PPSS performancehas been well characterized through laboratory and lim-ited field testing; however, further testing should be under-taken to more rigorously define the range of applicabilityof this sampler for personal exposure or microenviron-mental studies. Therefore, the following tests are recom-mended prior to routine use of the PPSS.
In a mode that uses gravimetric assay, we suggest fieldtesting of denuder performance for nitric acid under con-ditions of high ambient nitric acid, with attention tocapacity and efficiency; more extensive field testing in avariety of environmental conditions and locations to betterestablish detection limits and precision; testing on thelighter, plastic-body prototype; and testing as a personalsampler. Further work is needed to refine the �-mass mea-surement, specifically to resolve the mass discrepancy forthe � gauging through empirical calibration of mass by �gauging with laboratory and atmospheric aerosols.
Table 5. Measured Precision for Collocated PPSS Samples Compared with Target Detection Limits and Precision
Measurement
Coefficient of Determination
(R2)Pooled SDa
(µg/m3)
Target Detection Limit
(µg/m3)
Coefficientb
of Variation(%)
Target Precision
(%)
Sulfate 1.00 0.032 0.3 2 8Nitrate 0.97 0.51 0.3 11 8Organic carbon 0.98 0.64 0.5 6 8Elemental carbon 0.97 0.44 0.5 9 8Mass 0.99 0.85 1.0 3 8
a Measured instrument detection limit.b Measured instrument precision.

19
S Hering et al
Future efforts that would further improve the samplerinclude testing of carbon denuders for organic vaporremoval; testing with a conducting, flexible, inlet tube;and possible development of a 2-channel pump to avoidthe ambiguities in passive split of the sample flow.
ACKNOWLEDGMENTS
We thank Met One Instruments and ATI, which bothprovided � gauges for use in this project. We thank TomCahill of UC Davis for his input and use of his facilities.We thank Desert Research Institute and Sunset Laborato-ries for the prompt analyses of our filter samplers. Wethank Fred Lurmann and Alison Geyh for their useful com-ments on sampler design.
REFERENCES
Allegrini I, DeSantis F, DiPallo V, Febo A, Perrino C, Pos-sanzini M, Liberti A. 1987. Annular denuder method forsampling reactive gases and aerosols in the atmosphere.Sci Total Environ 67:1–16.
Appel BR, Wall SM, Haik M, Kothny EL, Tokiwa Y. 1984.Simultaneous nitric acid, particulate nitrate and aciditymeasurements in ambient air. Atmos Environ 18(2):409–416.
Brauer M, Koutrakis P, Wolfson JM, Spengler JD. 1989.Evaluation of the gas collection of an annular denudersystem under simulated atmospheric conditions. AtmosEnviron 23:1981–1986.
Chen CC, Huang SH, Lin WY, Shih TS, Jeng FT. 1999. TheVirtual Cyclone as a Personal Respirable Sampler. AerosolSci Technol 31:422–432.
Chow JC, Watson JG. 1998. Guideline on Speciated Partic-ulate Monitoring, draft report. Prepared for the Office ofAir Quality Planning and Standards MD-14, US Environ-mental Protection Agency, February 9. OAQPS, ResearchTriangle Park NC.
Chow JC, Watson JG, Lowenthal DH, Solomon PA,Maliano K, Ziman S, Richards LW. 1993. PM1 and PM2.5compositions in California’s San Joaquin Valley. AerosolSci Technol 18:105–128.
Dockery DW, Cunningham J, Damokosh AI, Neas LM,Spengler JD, Koutrakis P,Ware JH, Raizenne M, Speizer FE.1996. Health effects of acid aerosols on North Americanchildren: Respiratory symptoms. Environ Health Perspect104(5):500–505.
Eatough DJ, Wadsworth A, Eatough DA, Crawford JW,Hansen LD, Lewis EA. 1993. A multiple system, multi-channel diffusion denuder sampler for the determinationof fine particulate organic material in the atmosphere.Atmos Environ 27A:12113–12119.
Environmental Protection Agency (US). 1996. Air QualityCriteria for Particulate Matter. EPA/600/P-95/001aF.National Service Center for Environmental Publications,Cincinnati OH.
Ferm M. 1988. A Na2CO3 coated denuder and filter fordetermination of gaseous HNO3 a particulate NO3
� in theatmosphere. Atmos Environ 30:1193–1201.
Ferm M, Areskog H, Hanssen JE, Hilbert G. 1988. Fieldintercomparison of measurement techniques for totalNH4
+ and total NO3� in ambient air. Atmos Environ 22:
2275–2281.
Fitz D, Zwicker J. 1988. Design and Testing of the SCAQSSampler for the SCAQS Study, 1987. California AirResources Board, Sacramento CA.
Forrest J, Spandau DJ, Tanner RL, Newman L. 1982. Deter-mination of atmospheric nitrate and nitric acid employinga diffusion denuder with a filter pack. Atmos Environ16:1473–1485.
Jaklevic JM, Gatti RC, Goulding FS, Loo BW. 1981. A β-gauge method applied to aerosol samples. Environ SciTechnol 15:680–686.
John W, Kreisberg NM. 1999. Calibration and testing ofsamplers with dry, polydisperse latex. Aerosol SciTechnol 31: 221–225.
Kenny LC, Gussman RA. 1997. Characterization and mod-elling of a family of cyclone aerosol preseparators. JAerosol Sci 28:677–688.
Kirchstetter TW, Harley RA, Kreisberg NM, StolzenburgMR, Hering SV. 1999. On-road measurement of fine par-ticle and nitrogen oxide emissions from light- and heavy-duty motor vehicles. Atmos Environ 33:2955–2968.
Koutrakis P, Wolfson JM, Slater JL, Brauer M, Spengler JD.1988. Evaluation of an annular denuder filter pack systemto collect acidic aerosols and gases. Environ Sci Technol22:1463–1468.
Kreiger MS, Hites RA. 1992. Diffusion denuder for the col-lection of semi-volatile organic compounds. Environ SciTechnol 10:187–189.
Lilienfeld P. 1970. Beta-absorption–impactor aerosol massmonitor. Am Ind Hyg Assoc J 31:722–729.

20
A Personal Particle Speciation Sampler
Lin CI, Baker M, Charlson RJ. 1973. Absorption coefficientof atmospheric aerosol: A method of measurement. ApplOpt 12:1356–1362.
Macias ES, Husar RB. 1976. A review of atmospheric par-ticulate mass measurements via the beta attenuation tech-nique. In: Fine Particles (Liu BY, ed), pp 535–564.Academic Press, New York NY.
McDow SR, Huntzicker JJ. 1990. Vapor adsorption artifactin the sampling of organic aerosol: Face velocity effects.Atmos Environ 24A:2563–2572.
Peters A, Wichmann HE, Tuch T, Heinreich J, Heyder J.1997. Respiratory effects are associated with the number ofultrafine particles. Am J Respir Crit Care Med 155:1376–1383.
Peters TM, Gussman RA, Kenny LC, Vanderpool RW.2001. Evaluation of PM2.5 size selectors used in speciationsamplers. Aerosol Sci Technol 34:422–429.
Possanzini M, Febo A, Liberti A. 1983. New design of ahigh-performance denuder for the sampling of atmo-spheric pollutants. Atmos Environ 17:2605–2610.
Solomon PA, Fall T, Salmon L, Cass GR, Gray HA, DavisonA. 1989. Chemical characteristics of PM10 aerosols col-lected in the Los Angeles area. J Air Pollut Control Assoc39:154–163.
Solomon PA, Larson SM, Fall T, Cass GR. 1988. Basinwide nitric acid and related species concentrationsobserved during the Claremont nitrogen species compar-ison study. Atmos Environ 22:1587–1594.
Spengler JD, Koutrakis P, Dockery DW, Raizenne M,Speizer FE. 1996. Health effects of acid aerosols on NorthAmerican children: Air pollution exposures. EnvironHealth Perspect 104(5):492–499.
Torczynski JR, Rader DJ. 1997. The virtual cyclone: Adevice for nonimpact particle separation. Aerosol SciTechnol 26:560–573.
Turpin BJ, Huntzicker JJ, Hering SV. 1994. Investigation oforganic aerosol sampling artifact in the Los Angeles Basin.Atmos Environ 28: 3061–3071.
APPENDIX A. OTHER � GAUGE SYSTEMS
Four different � attenuation systems were tested in thecourse of this study. Only the ATI AT100 system wasfound to be suitable for application to the small samplesizes expected for the PPSS. The test methods and resultsfor the remaining systems are given here. Table A.1 out-lines the main specifications of all of the � attenuation sys-tems explored. They were (1) a commercial instrumentcalled the BAM-1020, (2) a custom � gauge built byAerosol Dynamics, (3) a custom system built by UC Davis,and (4) a commercial � gauge by ATI called the AT100.
TEST METHODS
Met One BAM-1020
Met One Instruments provided for use in this project aBAM-1020 designed for continuous ambient aerosol massmonitoring. This unit, which incorporates a scintillatorand photomultiplier-tube–based detector with a 60-µCi14C source, was evaluated to determine its stability and themass detection limits that could be expected for this appli-cation. Some effort was devoted to better understand thedetails of its operation. Met One also provided an indepen-dent detector with circuit board and mounting block thatwas more easily tailored to the needs of this project.
Precision tests were made on stationary filters placedwithin the instrument and monitored over long periods of
Table A.1. Specifications for � Gauge Systems
System � Source Detector Signal
BAM-1020Met One Instruments, Grants Pass OR
60 µCi 14C Scintillator/photomultiplier tube Pulses
Aerosol Dynamics custom,IRD components
60 µCi 14C Integrating silicon diode Current
UC Davis custom,Ortec components
100 µCi 14C Ion-implantation silicon diode Pulses
AT100ATI, Rockville MD
3 mCi 147Pm Silicon diode Pulses
21
S Hering et al
time. By comparing successive measurements and subdi-viding and averaging counts, we could explore the effect ofsampling period on precision. To test for temperature andhumidity correlations with � gauge readings, measurementswith a Vaisala Humitter were recorded simultaneously withcount readings from the � gauge. Tests on the reproduc-ibility of readings were obtained by using a pair of filter-mounting carriages that rigidly hold a single filter in placewhile the operator slides them in and out of the gauge.
A more elaborate means of controlling the registration offilters with respect to the detector-source axis was used foran initial attempt at � gauging the collected aerosol mass.Filters were permanently mounted between stainless steelshims with a punched spot size of 1.3 cm (1.3-cm2 area)that provided a rigid support for positive centering. A V-notch cut into the edge of this metal disk encapsulating thefilter engaged a pin in the filter support plate. The carriagethen slides in and out of the detector frame extracted fromthe BAM-1020 that holds the detector and source in place.
The indicated mass from the BAM-1020 was comparedwith gravimetric determinations made using a SartoriusMC-5 microbalance for several types of clean filter mate-rials and for laboratory-generated aerosol collected onFiberfilm filters.
Aerosol Dynamics � Gauge System
A custom � gauge was built in-house at Aerosol Dynamicsaround a device manufactured by International RadiationDetectors (IRD, Torrance CA) that produces silicon diodedetectors with minimal surface barriers for high-sensitivitydetection of charged particles. The incident � particles pro-duce an integrated current, as opposed to discrete pulsesthat must be counted, which can be converted to analogoutput using a suitable electrometer. The Met One 60-µCi14C source was used with this detector, and the resultingoutput voltage was read with a digital voltmeter.
The first set of tests of this detector was to connectdirectly to the input of an Analog Devices electrometerwith integral Faraday cage taken from another instrument(TSI electrical aerosol analyzer). Although this approachprovided sufficient electromagnetic (including ambientlight) shielding, the electrometer was deemed too noisy toprovide an adequate test of the detector. Since the prospectof direct analog output and multidiode sensors held thepotential for long-term advantages, a second set of tests wasconducted using a charge preamplifier manufactured byIRD with direct diode mounting. By reducing lead lengthsand utilizing special printed-circuitboard shielding, thiscombination provided the best hope for eliminatingexternal noise intrusion. A test was conducted to measurethe inherent noise of the detection system minus the effectsof the inherent noise of the sensor (or the random signal
produced by the � particle generation through radioactivedecay). By attaching a stable picoamp current source builtfor this test to the input of the preamp, the noise level of theamplifier, cabling, and voltmeter can be measured. A castaluminum instrumentation enclosure was used to provideshielding of radio frequency interference and visible light.Rigidly mounted inside this enclosure is a mount for thedetector, preamplifier, and source, along with the filtermount used in the previous BAM-1020 �-gauge tests.
UC Davis � Gauge System
Professor Tom Cahill of the University of California atDavis provided us onsite access to a � detection systembased on Ortec (formally EG&G) technology. This systemincludes an ion-implantation silicon detector (BU-13-150-300-5) combined with a charge preamplifier and pulse-counting electronics (amplifier, discriminator, and sca-lars). All of the components were selected for compati-bility with low-energy electron detection and the countingrates encountered with a 100-µCi 14C source, which wasalso available for our use.
Two field tests were conducted with this system to mea-sure ambient loadings on filters using � attenuation. Threesamples were collected in parallel at a flow rate of 7 L/minfor each channel. The combined flow of 21 L/min was drawnthrough an AIHL cyclone to provide a fine fraction. The 50%cutpoint resulting from this flow rate was 3 µm. Two of thesamples were collected on 25-mm Fiberfilm filters mountedinside a cylindrical canister with the same internal diameteras the PPSS, to allow for using the filter cassettes and sup-port rings from the PPSS prototype. For a reference sample,another 25-mm Fiberfilm filter was used with a Gelman filterholder and a pair of stainless steel shims to mask the filterdown to 7.9 mm, to better match the PPSS spot size.
Comparisons to gravimetric mass were made as mea-sured by a Sartorius MC5 microbalance in our laboratory.After the gravimetric masses were measured, the filterswere mounted in the PPSS prototype cassettes. Sufficientcompression was achieved through the use of stainlesssteel shims to eliminate any rotation of the filter oncemounted. To provide reproducible � gauging, a 2-piecemating jig was built to sandwich the filter cassettes betweenthe Ortec detector and 14C source. To avoid rotations of the2 basic parts, a pin and mating socket are employed. Simi-larly, a registration hole on the backside of the filter cassettemates with a fixed pin protruding from the base plate of thejig, thereby providing positive alignment during gauging.After � gauging the filters were removed from the cassettesand reweighed using the microbalance. Tests of loading andunloading filters without sampling demonstrated that the
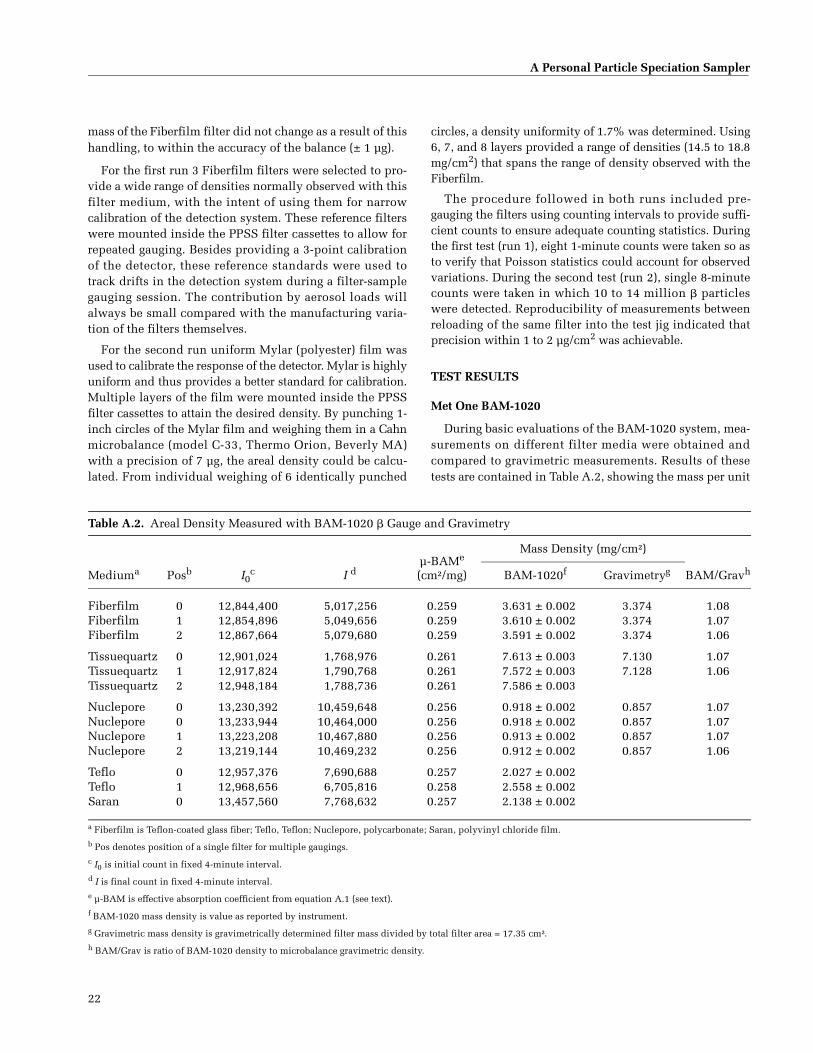
22
A Personal Particle Speciation Sampler
mass of the Fiberfilm filter did not change as a result of thishandling, to within the accuracy of the balance (± 1 µg).
For the first run 3 Fiberfilm filters were selected to pro-vide a wide range of densities normally observed with thisfilter medium, with the intent of using them for narrowcalibration of the detection system. These reference filterswere mounted inside the PPSS filter cassettes to allow forrepeated gauging. Besides providing a 3-point calibrationof the detector, these reference standards were used totrack drifts in the detection system during a filter-samplegauging session. The contribution by aerosol loads willalways be small compared with the manufacturing varia-tion of the filters themselves.
For the second run uniform Mylar (polyester) film wasused to calibrate the response of the detector. Mylar is highlyuniform and thus provides a better standard for calibration.Multiple layers of the film were mounted inside the PPSSfilter cassettes to attain the desired density. By punching 1-inch circles of the Mylar film and weighing them in a Cahnmicrobalance (model C-33, Thermo Orion, Beverly MA)with a precision of 7 µg, the areal density could be calcu-lated. From individual weighing of 6 identically punched
circles, a density uniformity of 1.7% was determined. Using6, 7, and 8 layers provided a range of densities (14.5 to 18.8mg/cm2) that spans the range of density observed with theFiberfilm.
The procedure followed in both runs included pre-gauging the filters using counting intervals to provide suffi-cient counts to ensure adequate counting statistics. Duringthe first test (run 1), eight 1-minute counts were taken so asto verify that Poisson statistics could account for observedvariations. During the second test (run 2), single 8-minutecounts were taken in which 10 to 14 million � particleswere detected. Reproducibility of measurements betweenreloading of the same filter into the test jig indicated thatprecision within 1 to 2 µg/cm2 was achievable.
TEST RESULTS
Met One BAM-1020
During basic evaluations of the BAM-1020 system, mea-surements on different filter media were obtained andcompared to gravimetric measurements. Results of thesetests are contained in Table A.2, showing the mass per unit
Table A.2. Areal Density Measured with BAM-1020 � Gauge and Gravimetry
µ-BAMe
(cm²/mg)
Mass Density (mg/cm²)
BAM/GravhMediuma Posb I0c I d BAM-1020f Gravimetryg
Fiberfilm 0 12,844,400 5,017,256 0.259 3.631 ± 0.002 3.374 1.08Fiberfilm 1 12,854,896 5,049,656 0.259 3.610 ± 0.002 3.374 1.07Fiberfilm 2 12,867,664 5,079,680 0.259 3.591 ± 0.002 3.374 1.06
Tissuequartz 0 12,901,024 1,768,976 0.261 7.613 ± 0.003 7.130 1.07Tissuequartz 1 12,917,824 1,790,768 0.261 7.572 ± 0.003 7.128 1.06Tissuequartz 2 12,948,184 1,788,736 0.261 7.586 ± 0.003
Nuclepore 0 13,230,392 10,459,648 0.256 0.918 ± 0.002 0.857 1.07Nuclepore 0 13,233,944 10,464,000 0.256 0.918 ± 0.002 0.857 1.07Nuclepore 1 13,223,208 10,467,880 0.256 0.913 ± 0.002 0.857 1.07Nuclepore 2 13,219,144 10,469,232 0.256 0.912 ± 0.002 0.857 1.06
Teflo 0 12,957,376 7,690,688 0.257 2.027 ± 0.002Teflo 1 12,968,656 6,705,816 0.258 2.558 ± 0.002Saran 0 13,457,560 7,768,632 0.257 2.138 ± 0.002
a Fiberfilm is Teflon-coated glass fiber; Teflo, Teflon; Nuclepore, polycarbonate; Saran, polyvinyl chloride film. b Pos denotes position of a single filter for multiple gaugings.c I0 is initial count in fixed 4-minute interval.d I is final count in fixed 4-minute interval.e µ-BAM is effective absorption coefficient from equation A.1 (see text).f BAM-1020 mass density is value as reported by instrument.g Gravimetric mass density is gravimetrically determined filter mass divided by total filter area = 17.35 cm².h BAM/Grav is ratio of BAM-1020 density to microbalance gravimetric density.

23
S Hering et al
area for several spots on each filter and the correspondinggravimetric density obtained by dividing the total mass bythe filter’s area. The data are highly correlated over a rangeof values (R2 > 0.999) although BAM-1020 values are 7%higher on average. Table A.2 also shows the raw � counts,both with (I0) and without (I) the filter present. The corre-sponding statistical uncertainty, calculated from Poissonstatistics, is 2 to 3 µg/cm2, which is in accordance withmanufacturer’s specifications.
In addition, the areal mass densities reported by theBAM-1020 were compared with those computed from therelation published by Macias and Husar (1976):
m = µ−1 [ln(I0) − ln(I)] (A.1)
Here I0 and I are the initial and final count rates, respec-tively; m is the indicated mass per unit area and µ is themass attenuation coefficient. From this relation it wasdetermined that the manufacturer’s algorithm uses acount-specific value for µ although all are close to thevalue of 0.26 cm2/mg used by Macias and Husar (1976).
Several measurements were made of the � instrumentstability. These are relevant to the 2-spot method for �
mass determinations outlined in our proposal. Ourapproach is to � gauge 2 spots on the filter, prior to sam-pling, confine the particle deposit to 1 of these 2 spots, andthen assay both spots again at the end of sampling. Withthis approach the hope is to minimize error due to varia-tions in laboratory conditions and instrument responsebetween the initial and final assays.
An example of repeated 4-minute counts of the � pene-tration through a blank Fiberfilm filter is shown in FigureA.1. These data were collected over 24 hours withoutremoving the filter from the gauge. Essentially they corre-spond to variations in the blank value, which is a majorcomponent of the measurement precision. The right-handaxis shows the individual counts I for each 4-minuteperiod referenced to the average count rate for the entire24-hour period, I0, and expressed as a mass areal densityusing equation A.1 with µ = 0.26 cm2/mg. The right-handaxis mass density values show the variation in indicatedmass density of this filter if one were to use a fixed refer-ence value. As anticipated, this variation is higher than isacceptable for this application. Evaluation of temperature
Figure A.1. Variation in � gauge readings for blank Fiberfilm filter over 24 hours. Counts are summed into groups to simulate longer sampling periodsfor improved statistics.

24
A Personal Particle Speciation Sampler
and humidity data collected simultaneously with the �gauge counts showed that the variability was not due tochanges in the air density in the air gap but rather to elec-tronic drift in the instrument.
Analogous to the reference spot technique, the left-handaxis of Figure A.1 shows the variability in indicated massareal density obtained from paired readings. The smalldots show data from 1 pair of consecutive 4-minute read-ings wherein the I0 and I values used in Equation A.1 arefrom consecutive readings. The large dots show data from8 pairs of readings wherein the value for I0 is the sum ofevery other count, and the I is the sum from the other set ofalternating counts. For 1 pair of counts, the measured SDwas 1.1 µg/cm2; and for 8 pairs of counts, 0.4 µg/cm2. Asshown below, the longer counting times give bettercounting statistics and hence more precise values.
The decay rate of the � source is not absolutely steadybut rather is an unsteady statistical process governed by aPoisson distribution. Accordingly, the 1 SD fluctuation ina reading of I or I0 is the square root of N, where N is thenumber of counts. By propagation of errors, the SD for theindicated mass density calculated from equation A.1 is(1/µ)(1/N1 + 1/N2)½ ≅ (1/µ)(2/N)½, where N1 and N2 are the2 sets of counts for I and I0, both approximately equal to N.The actual count rates for this � gauge with the filter inplace were 5.3 × 10⁶ per 4-minute period, which corre-sponds to a 1-SD value of 1.2 µg/cm2 for 1 pair of counts,and 0.4 µg/cm2 for the 8 pairs of counts. These are essen-tially the same as that measured. Thus we see that theshort-term fluctuations in the measurements are consistentwith Poisson statistics.
Further experiments were done with repeated removaland replacement of the filter, and this showed no furtherincrease in the standard deviation of the counts. With thecurrent � gauge configuration with Teflon-coated glass-
fiber filters (Fiberfilm) and with a combined countingperiod of eight 4-minute pairs of data, the 1-SD precisionfor mass is ± 0.4 µg/cm2. We anticipate collecting 1 m3 airon a single 1-cm2 spot, and this translates to ± 0.4 µg/m3.The counting time required can be reduced with a stronger� source. The current source is 60 µCi, which is muchsmaller than the 3-mCi sources used by Macias and Husar(1976) in a � gauge. Because the source is easy to change,and because shorter measurement times would decidedlyhelp, the possibility of a larger source was investigated,but no suppliers could be located.
The last experiment performed with the BAM-1020 �gauge was to measure filter densities with aerosol sampledeposits. A pair of samples was exposed to nebulized oleicacid aerosol through a personal PM2.5 spiral filter sampler(SKC). Gravimetric measurements were made with the Sar-torius microbalance of the entire encapsulated filter. Toreduce filter-handling effects on the microbalance mea-surements, the following measurement sequence wasused: pregauge, preweigh, sample, postweigh, postgauge.
Results shown in Table A.3 indicate that for appreciablemass loading (approximately 0.12 mg/cm2) agreementbetween mass density using the BAM-1020–derived µfactor and gravimetric mass density is consistent with filtermedia measurements (BAM/Grav = 5% for large loading inTable A.3 versus 7% in Table A.2). Light loading (approxi-mately 40 µg/cm2) shows roughly twice the relative differ-ence for � gauging relative to gravimetry (18%). Whetherthis difference stems from real differences in � attenuationresponse to light loadings or to measurement error cannotbe determined from 2 data points. This experiment didserve to demonstrate that a reference Fiberfilm could beused to gauge changes in the system response and that towithin the Poisson uncertainty, the measured density for
Table A.3. Density of Deposited Oleic Acid Aerosol onto Fiberfilm Filters Measured with BAM-1020 � Gaugeand Gravimetry
Media I0a Ib
Density (mg/cm2)
BAM/GravBAM-1020 Correctedc Gravimetric
Reference Fiberfilm 5,613,268 5,614,812 �0.0010 ± 0.0023Fiberfilm + oleic acid aerosol
5,608,347 5,430,444 0.1221 ± 0.0023 0.1231 ± 0.0033 0.1173 1.05
Reference Fiberfilm 5,616,692 5,614,812 0.0013 ± 0.0023Fiberfilm + oleic acid aerosol
5,608,981 5,549,729 0.0402 ± 0.0023 0.0390 ± 0.0033 0.0331 1.18
a I0 is initial count in fixed 4-minute interval.b I is final count in fixed 4-minute interval.c Uncertainties given are ± 1 SD based on Poisson statistics.

25
S Hering et al
the fixed reference filter did not change between presam-pling and postsampling.
Although these experiments suggest a near attainmentof the desired precision for the PPSS, certain aspects ofthis system are troublesome. Inherent instability of theelectronics, as evidenced by systematic drifting (unrelatedto air density effects) and occasionally abrupt changes ininstrument response, requires frequent switching betweenthe sample and the reference standard. Because filter regis-tration is a significant source of error based on the rela-tively large density variation of the Fiberfilm media itself,this process of swapping in and out of the sample and ref-erence increases the chance of operator-introduced error.Attempts at improving the system stability in conjunctionwith the manufacturer were not fruitful. Possibly, moreelaborate temperature control measures could fix thisdrawback, but these were not undertaken given budgetaryconstraints. For these reasons, other approaches to �gauging were attempted.
Aerosol Dynamics � Gauge System
In key respects the IRD sensor used in the AerosolDynamics � gauge system was an improvement over theBAM-1020 detector. The increased short-term stability pro-vided better precision through reduced handling of filtersduring gauging. Unlike the detector with scintillator andphotomultiplier tube, the solid-state sensor enables a singlemeasurement to be used for each gauged filter, rather thanthe previous method of switching back and forth between asample and a reference filter to track drifting. Because eachinsertion of a filter into any type of mounting device intro-duces variation, a solid-state detector with its inherentlygreater stability is preferable (indeed, Macias and Husararrived at this conclusion in the 1970s). For our goal of adetection limit on the order of 1 µg per spot, a precision of1 part in 4000 or 0.25 parts per thousand is required.Because the required precision was never achieved with a
stationary filter, only static exposure tests were conductedwith this system as summarized in Table A.4.
Initially, the output of the IRD sensor was measured byan electrometer. With a Fiberfilm filter placed between thedetector and 14C source, the output voltage from the elec-trometer was recorded every 10 seconds over night. Theresulting data were then averaged down to 10-minuteintervals to provide an equivalent sampling period of thatduration. The average voltage (Vavg) and root meansquared (rms) deviation over a 12-hour period (Vrms) aregiven in Table A.4 with a resulting relative noise level of1.9 parts per thousand, nearly an order of magnitude toohigh. When the data were smoothed to derive a slowlychanging baseline that was then subtracted from the orig-inal data, the resulting rms noise was the same. Thismerely demonstrates the inherent stability of this detector.
To isolate potential sources of noise, measurementswere made with no signal input (only the detector’s darkcurrent) and with 2 different-sized resistors replacing thedetector. All 3 of these tests possessed comparable relativenoise levels to that of the 14C-Fiberfilm combination, sug-gesting that the electrometer was the major source of noise.
The final set of tests with the IRD sensor involvedreplacing the electrometer with a matched preamplifierand integrator built specifically for this sensor. The voltageoutput was measured with the voltage mode of a digitalvoltmeter (Fluke model 877), comparable to the previousmeasurements with the Analog Devices electrometer. Theentire source, filter mount, detector, and amplifierensemble was housed inside a shielded enclosure andplaced inside a thermally isolating box.
Measurements were made with just an air gap and witha Fiberfilm filter in direct contact between the source anddetector (ie, with a minimum air gap of less than 2 mm).Similar results to those with the electrometer tests(1.3 parts per thousand) were obtained for both of thesecases. Finally, a stable picoampere current source was
Table A.4. Summary of Results with Aerosol Dynamics � Gauge System
Signal Amplifier Media Vavg (mV) Vrms (mV) Vrms/Vavga
14C Electrometer Fiberfilm �7166 13.9 1.94Dark current Electrometer Steel �3092 21.0 6.8Resistor Electrometer 100 M� �314.9 0.92 2.9Resistor Electrometer 11.2 M� �2747.2 4.3 1.614C IRD preamp Air gap 1210.4 1.6 1.3Test current IRD preamp ~93 pA 929.3 0.23 0.2514C IRD preamp Fiberfilm in contact 1313.1 1.7 1.3
a Parts per thousand.
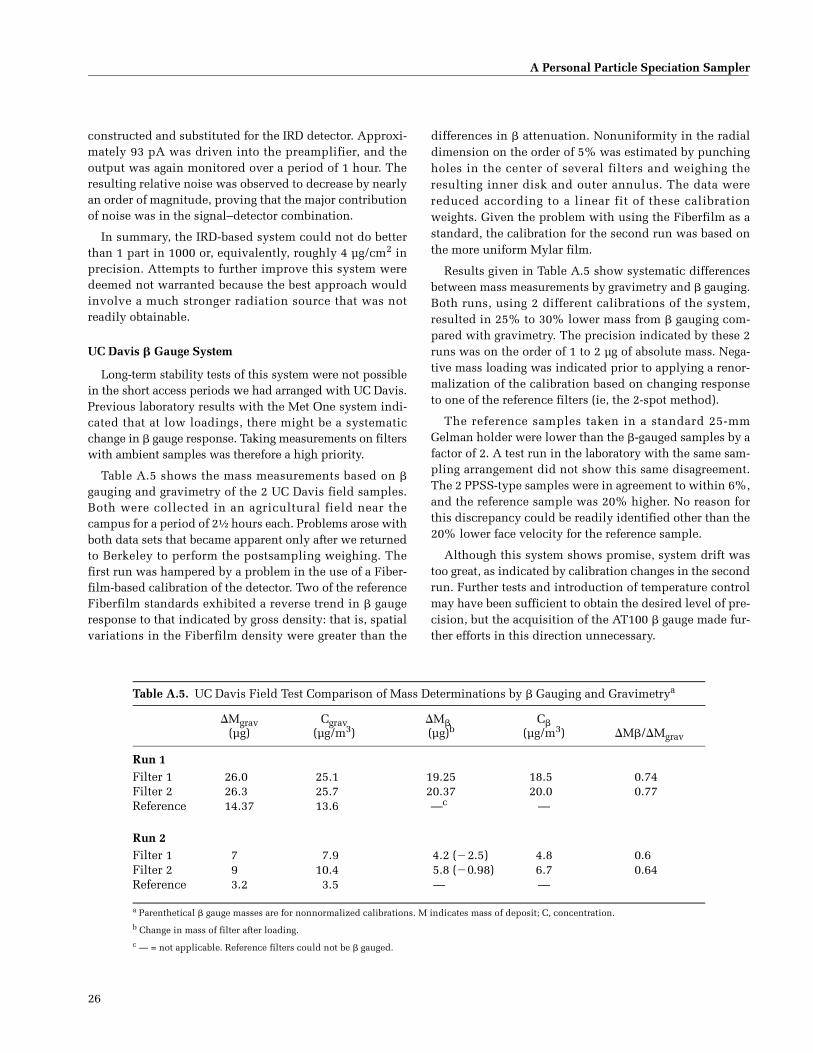
26
A Personal Particle Speciation Sampler
constructed and substituted for the IRD detector. Approxi-mately 93 pA was driven into the preamplifier, and theoutput was again monitored over a period of 1 hour. Theresulting relative noise was observed to decrease by nearlyan order of magnitude, proving that the major contributionof noise was in the signal–detector combination.
In summary, the IRD-based system could not do betterthan 1 part in 1000 or, equivalently, roughly 4 µg/cm2 inprecision. Attempts to further improve this system weredeemed not warranted because the best approach wouldinvolve a much stronger radiation source that was notreadily obtainable.
UC Davis � Gauge System
Long-term stability tests of this system were not possiblein the short access periods we had arranged with UC Davis.Previous laboratory results with the Met One system indi-cated that at low loadings, there might be a systematicchange in � gauge response. Taking measurements on filterswith ambient samples was therefore a high priority.
Table A.5 shows the mass measurements based on �gauging and gravimetry of the 2 UC Davis field samples.Both were collected in an agricultural field near thecampus for a period of 2½ hours each. Problems arose withboth data sets that became apparent only after we returnedto Berkeley to perform the postsampling weighing. Thefirst run was hampered by a problem in the use of a Fiber-film-based calibration of the detector. Two of the referenceFiberfilm standards exhibited a reverse trend in � gaugeresponse to that indicated by gross density: that is, spatialvariations in the Fiberfilm density were greater than the
differences in � attenuation. Nonuniformity in the radialdimension on the order of 5% was estimated by punchingholes in the center of several filters and weighing theresulting inner disk and outer annulus. The data werereduced according to a linear fit of these calibrationweights. Given the problem with using the Fiberfilm as astandard, the calibration for the second run was based onthe more uniform Mylar film.
Results given in Table A.5 show systematic differencesbetween mass measurements by gravimetry and � gauging.Both runs, using 2 different calibrations of the system,resulted in 25% to 30% lower mass from � gauging com-pared with gravimetry. The precision indicated by these 2runs was on the order of 1 to 2 µg of absolute mass. Nega-tive mass loading was indicated prior to applying a renor-malization of the calibration based on changing responseto one of the reference filters (ie, the 2-spot method).
The reference samples taken in a standard 25-mmGelman holder were lower than the �-gauged samples by afactor of 2. A test run in the laboratory with the same sam-pling arrangement did not show this same disagreement.The 2 PPSS-type samples were in agreement to within 6%,and the reference sample was 20% higher. No reason forthis discrepancy could be readily identified other than the20% lower face velocity for the reference sample.
Although this system shows promise, system drift wastoo great, as indicated by calibration changes in the secondrun. Further tests and introduction of temperature controlmay have been sufficient to obtain the desired level of pre-cision, but the acquisition of the AT100 � gauge made fur-ther efforts in this direction unnecessary.
Table A.5. UC Davis Field Test Comparison of Mass Determinations by � Gauging and Gravimetrya
�Mgrav(µg)
Cgrav(µg/m3)
�M�(µg)b
C�(µg/m3) �M�/�Mgrav
Run 1Filter 1 26.0 25.1 19.25 18.5 0.74Filter 2 26.3 25.7 20.37 20.0 0.77Reference 14.37 13.6 —c —
Run 2Filter 1 7 7.9 4.2 (�2.5) 4.8 0.6Filter 2 9 10.4 5.8 (�0.98) 6.7 0.64Reference 3.2 3.5 — —
a Parenthetical � gauge masses are for nonnormalized calibrations. M indicates mass of deposit; C, concentration.b Change in mass of filter after loading. c — = not applicable. Reference filters could not be � gauged.

27
S Hering et al
ABOUT THE AUTHORS
Suzanne Hering is founder and president of AerosolDynamics Inc, a small research firm specializing in thedevelopment of measurement methods for fine, airborneparticles. She holds an AB in physics from the University ofCalifornia at Santa Cruz and a doctorate in physics in 1974from the University of Washington, with an experimentalthesis in the field of low-temperature physics. At AerosolDynamics Inc she codeveloped an automated system forhigh-time resolution measurement of fine particulate nitrateand sulfate (commercialized by Rupprecht and Patashnick)and a two-week integrated sampler for ambient fine particlemass and ionic species. She has directed numerous airquality field studies and is currently president of the Amer-ican Association for Aerosol Research.
Nathan Kreisberg received an AB in physics from the Uni-versity of California at Berkeley in 1983 and a PhD inphysics from the University of Texas at Austin in 1991. Hispostdoctoral work was conducted at Los Alamos NationalLaboratory from 1991 to 1993 in numerical simulations ofaerosol particle transport. Employed at Aerosol DynamicsInc since 1994, he is involved with development of aerosolmeasurement techniques for atmospheric and laboratorysampling of airborne particles. His current research inter-ests include the measurement of aerosol mass through �attenuation, personal sampling techniques, and air purifi-cation technology targeting airborne microorganisms.
Walter John has a BS in physics from California Institute ofTechnology and a PhD in physics from the University ofCalifornia at Berkeley. He was an instructor at the Univer-sity of Illinois and professor and chairman of the PhysicalSciences Department, California State College at Stanis-laus. His principal career appointments were at theLawrence Livermore National Laboratory from 1958 to1971, where he was Nuclear Reactor Research Group leader
and at the California Department of Health Services from1974 to 1992, where he headed the aerosol and microscopylaboratories. He is presently retired and consults part timeon the development of aerosol sampling instruments. Hisresearch interests include studies of the basic properties ofaerosols in the laboratory and in the atmosphere as well asthe technology of aerosol sampling and analysis. He hasbeen a director of the American Association for AerosolResearch and on the editorial boards of several journals. Hehas over 100 publications in journals and books. He is afellow of the American Physical Society.
ABBREVIATIONS AND OTHER TERMS
AIHL Air and Industrial Hygiene Labora-tory (California State Health Depart-ment)
APS aerodynamic particle sizer
ATI Adaptive Technologies Inc
BAM � attenuation monitor
CPC condensation particle counter
EPA Environmental Protection Agency (US)
FRM federal reference method
GSD geometric standard deviation
IRD International Radiation Detectors
PM2.5 particulate matter with an aerody-namic diameter below 2.5 µm
poly-PSL polydisperse polystyrene latex
PPSS personal particle speciation sampler
rms root mean squared
UC Davis University of California at Davis

Health Effects Institute Research Report 114 © 2003 29
CRITIQUEHealth Review Committee
INTRODUCTION
Epidemiology studies have shown associations betweenshort-term increases in particulate matter (PM*) air pollu-tion and increases in adverse health effects (Katsouyanniet al 1990; Dockery and Pope 1994; Schwartz 1994; Popeand Dockery 1999; Samet et al 2000). Among these healtheffects are mortality and morbidity from cardiovascularand respiratory disease, and worsening symptoms inpeople with asthma (Dockery et al 1989; Pope et al 1991;Fosberg et al 1993; Yang and Yang 1994). Many studiesconducted over the past decade have investigated mecha-nisms of PM toxicity and what particle constituents areassociated with this toxicity (discussed in HEI 2002).
PM is a complex mixture of particles in the atmosphere.The size, chemical composition, and other physical andbiological properties of these particles are highly variablebecause of differences in sources, geographic conditions,weather, and seasonal patterns (both in different regionsand at different times in the same region). Although parti-cles range in size up to an aerodynamic diameter of greaterthan 50 �m, attention has focused in recent years on thepossible health effects of smaller particles with an aerody-namic diameter of 2.5 �m and smaller (PM2.5). PM2.5 con-tains many chemical constituents, including organiccarbon (which contains a large number of organic com-pounds), soot-like elemental carbon, absorbed and con-densed hydrocarbons, water-soluble oxidants, sulfates,nitrates, and metals. Characterizing the composition ofparticles and linking it to toxicity may help reveal theunderlying biological mechanisms of health effects, and inturn that information may point the regulatory communityto the types of particles most likely associated with toxiceffects. In addition, characterizing particles may help totrace particles back to their sources. For example, sulfatehas few indoor sources (with the possible exception of ker-osene heat sources) and thus can be used as a good tracerfor outdoor sources. Examining combinations of constitu-ents, like the proportion of organic carbon to elementalcarbon, can also yield useful information.
Through its Request for Preliminary Applications pro-cess, HEI supports studies that are compatible with itsoverall research priorities but lie outside the areas defined
in its focused Requests for Applications. In January 1999,Dr Hering submitted a preliminary application proposingto design and validate a small, pump-driven, personalsampler that would concurrently measure several of themajor constituents of PM2.5. After evaluating Dr Hering'spreliminary application, entitled “A Personal Particle-Spe-ciation Sampler,” the HEI Health Research Committeerequested a full application and subsequently recom-mended funding the study. The Committee believed such asampler could be beneficial to the research community,particularly those scientists who do not have the expertiseto develop their own PM speciation sampler, and viewedthe design ideas as promising. The study, which wasdesigned as a 1-year study, began in July 1999.† (Theauthors were given a 4-month extension, and the finalstudy lasted 16 months.)
This Critique is intended to aid HEI sponsors and thepublic by highlighting the strengths of the study, pointingout alternative interpretations, and placing the research inscientific perspective.
SCIENTIFIC BACKGROUND
Epidemiology studies often use area measures of expo-sure as surrogates for personal exposure measurements.Exposures to individuals reflect local exposures and time-activity patterns, however, and can vary greatly from expo-sures measured by centrally based monitors. Personal mon-itors better represent actual exposure for an individual andhave been incorporated into some studies examining PMexposure (Brauer et al 1989; Clayton et al 1993; Demokritouet al 2001). Because it is not clear which components of PMare responsible for adverse health effects, personal moni-tors are needed that can collect information on differentaspects of PM, including physical and chemical constitu-ents—both organic and inorganic. This information isimportant both to complement epidemiology studies and tounderstand how different sources contribute to an indi-vidual’s exposures. However, no single method allowsdetermination of all characteristics of PM, and differentsampling substrates are needed for assessing the presenceand concentrations of the PM constituents of interest.
* A list of abbreviations and other terms appears at the end of the Investiga-tors’ Report.
This document has not been reviewed by public or private party institu-tions, including those that support the Health Effects Institute; therefore, itmay not reflect the views of these parties, and no endorsements by themshould be inferred.
† Dr Hering's study, A Personal Particle Speciation Sampler, began in July1999. Total expenditures were $156,480. The draft Investigators’ Reportfrom Dr Hering and colleagues was received for review in January 2001. Arevised report, received in September 2001, was accepted for publication inJanuary 2002. During the review process, the HEI Health Review Committeeand the investigators had the opportunity to exchange comments and toclarify issues in both the Investigators’ Report and in the Review Commit-tee’s Critique.

30
Critique
Ambient sampling systems generally involve largepumps and collect large volumes of air whereas a suc-cessful personal sampler must be small, lightweight, andnonintrusive. These requirements pose a challengebecause PM sampling requires a pump to draw the airthrough the sampler. Personal pumps weigh 3 to 4 poundsand have a maximum volume of 5 L/min. Subjects willusually agree to wearing only one such pump. Therefore,traditional PM monitoring has focused on measuring asingle characteristic of PM, usually integrated mass, lim-iting the exposure information that can be obtained froman individual at any one time.
Although it is a challenge to produce a small personalsampler for measuring exposure to PM2.5 and capturing itsorganic and inorganic constituents, some are already avail-able. Several groups have modified the basic PM monitorsin order to measure multiple pollutants and used them infield studies. One example is the Harvard personal sampler(Koutrakis et al 1988; Brauer et al 1989), which provides anaccurate collection of particle nitrate and associated gases(including ammonia, nitric acid, and sulfur dioxide) aswell as particle mass. Another example is the personalexposure monitor (PEM, MSP Corp, Minneapolis MN),which can be fitted with small inertial impactors to mea-sure size-specific personal PM exposure (Clayton et al1993; Thomas et al 1993). Turpin and colleagues used aPEM to measure particle mass concentration, 26 individualpolycyclic aromatic hydrocarbon species, and 5 metal spe-cies using a combination of Fourier transform infraredspectroscopy, inductively coupled plasma mass spectrom-etry, and gas chromatography–mass spectrometry (Carltonet al 1999). Koutrakis and colleagues (Demokritou et al2001) have recently modified the PEM to monitor multiplepollutants. This monitor, the multipollutant personal sam-pler (MPPS), splits airflow from a single pump either to asecond impactor for simultaneous measurement of PM2.5and PM10 (PM less than or equal to 10 �m in aerodynamicdiameter) or to a second filter that can be used to measureelemental and organic carbon. Passive filters that cansimultaneously sample air for ozone, sulfur dioxide, andnitrogen dioxide can also be attached to the unit. Thesepersonal monitors are still bulky, however, and are limitedin the range of constituents they can measure.
TECHNICAL EVALUATION
AIMS AND OBJECTIVES
The objective of this 16-month study was to design andvalidate a personal PM2.5 sampler suitable for subsequent
chemical speciation work. Specifically, the sampler was tomeet the measurement needs for PM2.5 mass concentrationand several major constituents of PM2.5 (including , ele-mental carbon, organic carbon, sulfates, and nitrates). Toallow personal monitoring, the device had to be portableand capable of battery operation for 8 continuous hours.The investigators specified 5 design requirements for thispersonal particle speciation sampler (PPSS):
• 2-channel sampling to allow use of both quartz and Te-flon filters so that concentrations of both PM and itsconstituents can be determined;
• oilless, greaseless, size-selection inlet to allow precisemeasurement of organic carbon without the contami-nation problems that often occur when oil or grease isused;
• provision for a denuder (a device used to remove inter-fering vapors) and for recapture of semivolatile com-ponents of the particles, such as nitrate;
• compatibility with �� gauge determination, a tech-nique that measures PM mass by examining the scatterof � particles caused by the electron cloud associatedwith PM on a filter; and
• single-pump operation to keep weight and noise to aminimum.
The investigators set 5 objectives to assess the accuracyand precision of PPSS performance:
• penetration efficiency (an indication of penetration ofparticles larger than the 2.5-�m selection cutpoint)within 5% of the published PM2.5 federal referencemethod cutpoint for both liquid and solid particles;
• removal of more than 95% of nitric acid upstream ofthe filters used for nitrate anion;
• a detection limit capable of capturing 95% of the sam-ples with a mass of 1 �g/m3 or greater;
• detection limits of 0.3 �g/m3 for sulfate and nitrate an-ions and 0.5 �g/m3 for organic and elemental carbon;and
• precision of 8% for side-by-side sampling using dupli-cate PPSSs when measured constituents are present atlevels above the detection limit.
STUDY DESIGN AND RESULTS
In developing the PPSS, Dr Hering and her colleaguesselected and tested individual components of the samplerand then performed limited field tests of a prototype thatincorporated the selected components.
The overall design of the PPSS consists of a size-selec-tive inlet to remove all particles larger than 2.5 �m in
31
Health Review Committee
diameter, 2 sampling channels, a flow controller, and apump (seen in Figure 1 of the report). In this study, DrHering and her colleagues tested the following compo-nents of the sampler: inlet for efficiency in selecting PM2.5;denuder for efficiency in capturing nitrate; filter selectionfor allowing measurement of a broad range of PM constitu-ents; and filter sampling area to allow measurements onthe small sample volumes obtained using personal sam-plers. In addition, they evaluated different methods formeasuring PM mass.
Inlets
Three types of size-selective PM inlets were tested:microtrap, spiral, and compact cyclone—a modification ofthe cyclone impactor. Of these 3, the compact cyclone inletperformed closest to the federal reference method andtherefore was selected for use. In addition, the compactcyclone inlet provided the best exclusion of larger particles.Figure 6 of the Investigators' Report shows the penetrationof test particles, by size, using the compact cyclone inlet.
Sampling Channels
In order to measure both physical and chemical compo-nents of PM in their sampler, Dr Hering used 2 samplingchannels. One sampling channel collected samples formeasurement of mass and inorganic anions such as sulfate,nitrate, and ammonium, and the other channel collectedsamples for analysis of elemental and organic carbon.
Denuder
Many of the volatile compounds in the PM mixture canbe present in either the vapor or particle phase. Use of adenuder coated with the appropriate material to eliminateselected components and placed upstream of the filter canaid in their accurate measurement. For example, detectionof nitrate in the filter-collected mass sample requires strip-ping out vapor-phase nitrogen compounds, such as nitricacid, before they impact the filter. Collection of particle-phase nitric acid on the filters also requires stripping outammonia prior to the filter.
In Dr Hering's study, 2 types of denuder were evaluatedfor their efficiency in removing nitric acid: an activatedcarbon honeycomb denuder, and an aluminum denudercoated with magnesium oxide. The investigators chose thecarbon honeycomb denuder because it was more compactand more effective at removing nitric acid. The only disad-vantage of this denuder was that it required regular regen-eration (heating to 100�C for at least 1 hour) to preventrelease of collected gas phase constituents.
Filters
Different filter media allow measurement of differentcomponents of PM. For example, Teflon-coated filters canbe weighed for mass concentration and then extracted foranalysis of inorganic ions such as sulfates or analyzed formetals using x-ray fluorescence or inductively coupledplasma mass spectrometry. Other particle constituents,such as elemental and organic carbon, cannot be measuredfrom Teflon-coated filters but instead require a noncarbon-aceous filter substrate such as quartz. These filters are firstbaked at 500�C to volatilize lower molecular weight spe-cies. They are then analyzed by thermal evolution of thedeposited aerosols with nondispersive infrared detectionof carbon dioxide or with flame ionization detection afterconversion of evolved carbonaceous vapors to methane.Similarly, quartz filters cannot be used for the measure-ment of mass by gravimetric analysis.
Dr Hering selected quartz filters for one channel to mea-sure elemental and organic carbon and Teflon-coated glass(Fiberfilm) filters for the other channel to measure particlemass and ions.
A backup filter coated or impregnated with appropriatechemicals, downstream of the primary Teflon-coated orquartz filter, can capture volatile material that might bestripped from the primary filter. For example, a backupfilter impregnated with sodium chloride or carbonate cancollect nitrate that might volatilize off a primary Teflon-coated filter. For the PPSS, Dr Hering and associatesincluded a cellulose backup filter impregnated withsodium chloride downstream from the Teflon filter. Cap-tured sulfate and nitrate were measured by ion chromatog-raphy; ammonium was measured by autocolorimetry; andsulfur was measured by x-ray fluorescence.
Filter Area
A sampling area with a diameter of 8 mm was used forthe quartz filter. A sampling area with a diameter of 7 mmwas used for the Teflon-coated filter. Sampling areas wereisolated by use of a circular mask over the filter.
Assays for PM Mass Determination
There are many different methods for determining PMmass concentration. Among them are photometric tech-niques, gravimetric analysis, and methods based on use ofa � gauge. Photometric determination measures the attenu-ation of a light beam transmitted through a filter while theaerosol is sampled; gravimetric analysis weighs a Teflon-coated filter using a microbalance; and the � gauge tech-nique measures the scatter of � particles by the electroncloud in the PM on a filter. (This scattering is largely inde-pendent of the chemical composition of the PM.) The �

32
Critique
gauge technique is approximately 100-fold more sensitiveto very low levels of PM than gravimetric techniques andcan measure submicron amounts of carbon. Dr Hering andher colleagues therefore chose the � gauge technique tomeasure PM2.5 mass.
Four systems for using the � gauge technique wereassessed for stability, precision, and the effects of loadingand unloading filter cassettes. Investigators chose theAT100 � source and an integrated solid-state detectionsystem because of its strong � source (providing goodcounting statistics) and long-term stability. Details of theAT100 system are described in the report; details of theother 3 systems are presented in Appendix A.
The Prototype PPSS
The selected components of the PPSS were incorporatedinto a complete prototype PPSS. In the second step of thestudy, this prototype PPSS was field-tested for ambient airin Berkeley, California; in addition, 2 samples were col-lected inside the Caldecott Tunnel, a freeway commutertunnel east of Berkeley. The prototype was tested againstreference samplers. The prototype PPSS, with dimensionsof 11 cm � 5.4 cm � 4.5 cm, was made from aluminum andweighed 550 g. A personal sampling pump was used todraw flow through 2 filter channels, the flow split was pas-sive, and the resulting flow rate was 2 L/min. A second-generation prototype, in which some metal parts werereplaced with plastic, was developed at the end of thestudy and weighed 220 g. Further field tests on the second-generation prototype are being conducted in a follow-onstudy by Dr Alison Geyh at Johns Hopkins University.
DISCUSSION
Most of the specific performance goals for the PPSS weremet as determined by both laboratory and field tests. Theconflicts and problems associated with achieving suchobjectives are well described in the report.
Denuder
The denuder selection criteria and validation of perfor-mance were appropriate. The nitric acid exposure testshowed that the carbon honeycomb denuder was 99% effi-cient at removing nitric acid. Other than the backup filter,however, there appears to have been no consideration ofthe potential for loss of filter-captured nitrate or sulfateduring extended sampling periods or of potential influenceby environmental conditions during sampling. The use ofchemically impregnated reference filters as nitrate and sul-fate sinks to prevent their volatilization could have beenconsidered a separate issue.
Assays for PM Mass Determination
This study used �-attenuation techniques to overcomethe problem of low sampling volumes required for per-sonal sampling. The Adaptive Technologies Inc � gaugewas selected based on a pooled standard deviation of1 �g/m3 for a series of tests that excluded one outlier value,resulting in a 2-�g/m3 limit of detection for mass. Theseresults were comparable to those obtained using the goldstandard, gravimetric analysis. The average ratio of mass asdetermined by the 2 methods was 0.80. This ratioincreased to 0.93 when only samples for which duplicatesamplers agreed within 12% (as measured by gravimetricanalysis) were considered.
Figure 7 of the report shows significant equivalent massvariation for a passive filter over 24 hours, particularly rel-ative to the quoted limits of detection for the method. Theuse of reference filters to correct for drift is discussed, butit would have been useful not only to consider the medianof paired samples but also to address the implications ofthe limit of detection for the range of drift observed. Figure8A of the report suggests an underrecovery of mass by �attenuation relative to gravimetry at higher loadings, con-sistent with past observations for � attenuation.
The Prototype PPSS
Initial estimates of the PPSS species-specific detectionlimits were based on the pooled standard deviations of col-located field measurements. The values were 0.6 �g/m3 forsulfate, 1.0 �g/m3 for nitrate, 1.2 �g/m3 for organic carbon,and 0.8 �g/m3 for elemental carbon. As Dr Hering pointsout, these detection limits are nearly twice as high as thelimits outlined in the goals set forth in her original pro-posal. Even within these detection levels, however, thedata are quite useful.
Personal field experience with aluminum personal sam-plers has shown corrosion developing with prolonged use.It would be useful to know if there is any evidence of suchwear on the aluminum portions of the prototype samplerand if so whether consideration has been given to usinganodized aluminum or stainless steel.
The methods adopted for field testing the prototypePPSS were appropriate, and the results achieved versusreference methods indicate that the PPSS is fundamentallysound in design and performance.
CONCLUSION
This study was conducted in a systematic manner withappropriate results following from the methods and studydesign. The data collected and their analysis are presentedlogically in a clear and concise manner. The methods for

33
Health Review Committee
collecting and measuring specific components, such ascarbon and anions, followed well-defined technical cri-teria in the choice of filters and denuders. This is reflectedin good agreement recorded between the sampler and ref-erence methods for sulfate, nitrate, organic carbon, and ele-mental carbon. In general, the results of comparisons withreference methods indicate that the PPSS is fundamentallysound. Because of its compact design, light weight, andability to measure multiple constituents of PM, this per-sonal sampler represents a large step forward in the use ofpersonal monitors for PM. The potential for use by chil-dren is particularly exciting.
There are a few issues for which clarification wouldhave been helpful, as listed below:
• statistical best fit and uncertainty of the cyclone inletcutpoint;
• limit of detection for mass measurement by � attenua-tion, relative to the range of measured drift;
• implications of mass underrecovery by � attenuationversus gravimetry; and
• potential losses of sulfate and nitrate material from fil-ters during extended sampling periods.
The Review Committee believes that this personal sam-pler has much promise, but some concerns remain. In labo-ratory and field experiments, the system underestimatedparticle concentration by about 25%. The Committee is alsoconcerned about the impact of changes in ambient humidityduring sampling, particularly in high-nitrate environments.The study included only 10 measurements in the controlledlaboratory setting and only a few measurements in the field.The Committee therefore recommends further field testingin indoor and outdoor environments, including sites onboth the east and west coasts (differing in ambient ammoniaand nitric acid levels) and in both smoking and nonsmokingconditions (possible clogging of the filters and subsequentpressure drop). Dr Alison Geyh and colleagues at Johns Hop-kins University are currently conducting these tests in thefield and laboratory.
SUMMARY
For analysis of personal PM exposure, it is increasinglyimportant to get speciation data from personal monitors.The careful attention to the weight and size elements, andthe ability to measure PM2.5 mass concentration, elementalcarbon, organic carbon, sulfates, and nitrates in the sameinstrument, make the personal sampler described by DrHering and colleagues a potentially valuable addition topersonal monitoring tools. Once validated properly, this
sampler could allow measurement of personal exposures tofine PM over relatively short periods of time (ie, 8 hours)and could measure important PM characteristics such assize and chemical constituents. The lightweight, compactdesign of this sampler makes it suitable for widespread use,including personal monitoring for children and the elderly.
The study met the 5 design requirements that it set: 2-channel sampling; an oilless, greaseless inlet; provision fordenuders; compatibility with � gauging; and single-pumpoperation. However, issues such as saturation still need to beaddressed (as in environments high in tobacco smoke,ammonia, or nitric acid). Before being used widely, the sam-pler needs more comprehensive laboratory and controlledfield testing, as is currently underway. This sampler there-fore holds promise but is not yet ready for populationstudies.
ACKNOWLEDGMENTS
The Health Review Committee thanks the ad hocreviewers for their help in evaluating the scientific merit ofthe Investigators’ Report. The Committee is also grateful toDr Debra Kaden for her assistance in preparing its Critique,and to Genevieve MacLellan, Jenny Lamont, SallyEdwards, and Frederic R Howe for their roles in publishingthis Research Report.
REFERENCES
Brauer M, Koutrakis P, Wolfson JM, and Spengler JD. 1989.Evaluation of the gas collection of an annular denudersystem under simulated atmospheric conditions. AtmosEnviron 23:1981–1986.
Carlton AG, Johnson W, Simick M, Buckley B, EisenreichS, Turpin BJ. 1999. Microanalysis methods for character-ization of personal aerosol exposures. Aerosol Sci Technol31:66–80.
Clayton CA, Perritt RL, Pellizzari ED, Thomas KW, Whit-more RW, Wallace LA, Okzaynak H, Spengler JD. 1993.Particle Total Exposure Assessment Methodology(PTEAM) study: Distributions of aerosol and elementalconcentrations in personal, indoor, and outdoor air sam-ples in a southern California community. J Expo AnalEnviron Epidemiol 3:227–250.
Demokritou P, Kavouras I, Ferguson S, Koutrakis P. 2001.Development and laboratory performance evaluation of apersonal multipollutant sampler for simultaneous
34
Critique
measurements of particulate and gaseous pollutants.Aerosol Sci Technol 35:741–752.
Dockery DW, Pope CA III. 1994. Acute respiratory effectsof particulate air pollution. Annu Rev Public Health15:107–132.
Dockery DW, Speizer FE, Stram DO, Ware JH, Spengler JD,Ferris BG Jr. 1989. Effects of inhaled particles on respira-tory health of children. Am Rev Respir Dis 139:587–594
Fosberg B, Stjernberg N, Falk M, Lundback B, Wall S. 1993.Air pollution levels, meteorological conditions and asthmasymptoms. Eur Respir J 6:1109–1115.
Health Effects Institute. 2002. Understanding the HealthEffects of Components of the Particulate Matter Mix:Progress and Next Steps. HEI Perspectives. Health EffectsInstitute, Boston MA.
Katsouyanni K, Karakatsani A, Messari I, Touloumi G,Hatzakis A, Kalandidi A, Trichopoulos D. 1990. Air pollu-tion and cause-specific mortality in Athens. J EpidemiolCommun Health 44:321–324.
Koutrakis P, Wolfson JM, Slater JL; Brauer M and SpenglerJD. 1988. Evaluation of an annular denuder filter packsystem to collect acidic aerosols and gasses. Environ SciTechnol 22:1463–1468.
Pope CA III, Dockery DW. 1999. Epidemiology of particleeffects. In: Air Pollution and Health (Holgate ST, Samet JM,Koren HS, Maynard RL, eds). Academic Press, San DiegoCA.
Pope CA, Dockery DW, Spengler JD, Raizenne ME. 1991.Respiratory health and PM10 pollution: A daily time seriesanalysis. Am Rev Respir Dis 144:668–674.
Samet JM, Zeger SL, Dominici F, Curriero F, Coursac I,Dockery DW, Schwartz J, Zanobetti A. 2000. The NationalMorbidity, Mortality, and Air Pollution Study, Part II: Mor-bidity and Mortality from Air Pollution in the UnitedStates. Research Report 94 Pt II. Health Effects Institute,Cambridge MA.
Schwartz J. 1994. What are people dying of on high air pol-lution days? Environ Res 64:26–35.
Thomas KW, Pellizzari ED, Clayton CA, Whitaker DA,Shores RC, Spengler J, Ozkaynak H, Froehlich SE, WallaceLA. 1993. Particle Total Exposure Assessment Method-ology (PTEAM) 1990 study: Method performance and dataquality for personal, indoor, and outdoor monitoring. JExpo Anal Environ Epidemiol 3:203–226.
Yang SC, Yang SP 1994. Respiratory function changes frominhalation of polluted air. Arch Environ Health 49:182–187.
RELATED HEI PUBLICATIONS
* Reports published since 1990.Copies of these reports can be obtained from the Health Effects Institute and many are available at www.healtheffects.org.
35
Report PrincipalNumber Title Investigator Date*
Research Reports
107 Emissions from Diesel and Gasoline Engines Measured in 2002Highway Tunnels
Real-World Particulate Matter and Gaseous Emissions from AW GertlerMotor Vehicles in a Highway TunnelAirborne Carbonyls from Motor Vehicle Emissions in Two D Grosjean Highway Tunnels
101 Epithelial Penetration and Clearance of Particle-Borne Benzo[a]pyrene P Gerde 2001
99 A Case-Crossover Analysis of Fine Particulate Matter Air Pollution and H Checkoway 2000Out-of-Hospital Sudden Cardiac Arrest
98 Daily Mortality and Fine and Ultrafine Particles in Erfurt, Germany H-E Wichmann 2000Part I. Role of Particle Number and Particle Mass
97 Identifying Subgroups of the General Population That May Be Susceptible MS Goldberg 2000to Short-Term Increases in Particulate Air Pollution: A Time-Series Study in Montreal, Quebec
96 Acute Pulmonary Effects of Ultrafine Particles in Rats and Mice G Oberdörster 2000
95 Association of Particulate Matter Components with Daily Mortality M Lippmann 2000 and Morbidity in Urban Populations
94 National Morbidity, Mortality, and Air Pollution Study JM Samet 2000Part I. Methods and Methodologic IssuesPart II. Morbidity and Mortality from Air Pollution in the United States
91 Mechanisms of Morbidity and Mortality from Exposure to Ambient JJ Godleski 2000Air Particles
76 Characterization of Fuel and Aftertreatment Device Effects on Diesel Emissions ST Bagley 1996
68 Pulmonary Toxicity of Inhaled Diesel Exhaust and Carbon Black inChronically Exposed RatsPart I. Neoplastic and Nonneoplastic Lung Lesions JL Mauderly 1994Part II. DNA Damage K Randerath 1995Part III. Examination of Possible Target Genes SA Belinsky 1995
67 Development of Methods for Measuring Biological Markers TR Fennell 1994of Formaldehyde Exposure
63 Development of Samplers for Measuring Human Exposure to Ozone 1994Active and Passive Ozone Samplers Based on a Reaction with a Binary Reagent JD HackneyA Passive Ozone Sampler Based on a Reaction with Nitrite P KoutrakisA Passive Ozone Sampler Based on a Reaction with Iodide Y Yanagisawa
40 Retention Modeling of Diesel Exhaust Particles in Rats and Humans CP Yu 1991
Continued

36
* Reports published since 1990.Copies of these reports can be obtained from the Health Effects Institute and many are available at www.healtheffects.org.
RELATED HEI PUBLICATIONS
Report PrincipalNumber Title Investigator Date*
Special Reports
Research Directions to Improve Estimates of Human Exposure 2002and Risk from Diesel Exhaust
Diesel Exhaust: A Critical Analysis of Emissions, Exposure and 1995 Health Effects

H E A L T HE F F E C T SI N S T I T U T E
The Health Effects Institute, established
in 1980, is an independent and unbiased
source of information on the health
effects of motor vehicle emissions. HEI
studies all major pollutants, including
regulated pollutants (such as carbon
monoxide, ozone, nitrogen dioxide, and
particulate matter) and unregulated
pollutants (such as diesel engine exhaust,
methanol, and aldehydes). To date, HEI
has supported more than 200 projects at
institutions in North America and Europe
and has published over 130 research
reports.
Typically, HEI receives half its funds
from the US Environmental Protection
Agency and half from 28 manufacturers
and marketers of motor vehicles and
engines in the United States.
Occasionally, funds from other public
and private organizations either support
special projects or provide resources for
a portion of an HEI study. Regardless of
funding sources, HEI exercises complete
autonomy in setting its research
priorities and in reaching its
conclusions. An independent Board of
Directors governs HEI. The Institute’s
Health Research and Health Review
Committees serve complementary
scientific purposes and draw
distinguished scientists as members.
The results of HEI-funded studies are
made available as Research Reports,
which contain both the Investigators’
Report and the Review Committee’s
evaluation of the work’s scientific quality
and regulatory relevance.
Mark J Utell ChairProfessor of Medicine and Environmental Medicine, University of Rochester
Melvyn C BranchJoseph Negler Professor of Engineering, Mechanical EngineeringDepartment, University of Colorado
Kenneth L DemerjianProfessor and Director, Atmospheric Sciences Research Center,University at Albany, State University of New York
Peter B FarmerProfessor and Section Head, Medical Research Council Toxicology Unit,University of Leicester
Helmut GreimProfessor, Institute of Toxicology and Environmental Hygiene, TechnicalUniversity of Munich
Rogene HendersonSenior Scientist and Deputy Director, National EnvironmentalRespiratory Center, Lovelace Respiratory Research Institute
Stephen I RennardLarson Professor, Department of Internal Medicine, University ofNebraska Medical Center
Howard RocketteProfessor and Chair, Department of Biostatistics, Graduate School ofPublic Health, University of Pittsburgh
Jonathan M SametProfessor and Chairman, Department of Epidemiology, BloombergSchool of Public Health, Johns Hopkins University
Frank E SpeizerEdward H Kass Professor of Medicine, Channing Laboratory, HarvardMedical School and Department of Medicine, Brigham and Women’sHospital
Clarice R WeinbergChief, Biostatistics Branch, Environmental Diseases and MedicineProgram, National Institute of Environmental Health Sciences
BOARD OF DIRECTORS
HEALTH RESEARCH COMMITTEE
HEALTH REVIEW COMMITTEE
OFFICERS & STAFFDaniel S Greenbaum PresidentRobert M O’Keefe Vice PresidentJane Warren Director of ScienceSally Edwards Director of PublicationsJacqueline C Rutledge Director of Finance and AdministrationRichard M Cooper Corporate SecretaryCristina I Cann Staff ScientistAaron J Cohen Principal ScientistMaria G Costantini Principal Scientist
Debra A Kaden Senior ScientistGeoffrey H Sunshine Senior ScientistAnnemoon MM van Erp Staff ScientistTerésa Fasulo Senior Administrative AssistantGail A Hamblett Office and Contracts ManagerL Virgi Hepner Senior Science EditorJenny Lamont Science EditorFrancine Marmenout Senior Executive AssistantTeresina McGuire Accounting Assistant
Daniel C Tosteson ChairProfessor of Cell Biology, Dean Emeritus, Harvard Medical School
Ross AndersonProfessor and Head, Department of Public Health Sciences, St George’s Hospital Medical School, London University
John C Bailar IIIProfessor Emeritus, The University of Chicago
John R HoidalProfessor of Medicine and Chief of Pulmonary/Critical Medicine,University of Utah
Thomas W KenslerProfessor, Division of Toxicological Sciences, Department ofEnvironmental Sciences, Johns Hopkins University
Brian LeadererProfessor, Department of Epidemiology and Public Health, YaleUniversity School of Medicine
Thomas A LouisProfessor, Department of Biostatistics, Bloomberg School of PublicHealth, Johns Hopkins University
Edo D PellizzariVice President for Analytical and Chemical Sciences, ResearchTriangle Institute
Nancy ReidProfessor and Chair, Department of Statistics, University of Toronto
William N RomProfessor of Medicine and Environmental Medicine and Chief ofPulmonary and Critical Care Medicine, New York UniversityMedical Center
Sverre VedalProfessor, University of Colorado School of Medicine; Senior Faculty,National Jewish Medical and Research Center
Richard F Celeste ChairPresident, Colorado College
Donald Kennedy Vice ChairEditor-in-Chief, Science; President (Emeritus) and Bing Professor ofBiological Sciences, Stanford University
Archibald Cox Chair Emeritus Carl M Loeb University Professor (Emeritus), Harvard Law School
Purnell W ChoppinPresident Emeritus, Howard Hughes Medical Institute
Alice HuangSenior Councilor for External Relations, California Institute of Technology
Richard B StewartUniversity Professor, New York University School of Law, and Director,New York University Center on Environmental and Land Use Law
Robert M WhitePresident (Emeritus), National Academy of Engineering, and SeniorFellow, University Corporation for Atmospheric Research
fold line

H E A L T HE F F E C T SINSTITUT E
R E S E A R C H R E P O R T
Charlestown Navy Yard
120 Second Avenue
Boston MA 02129-4533 USA
+1-617-886-9330
www.healtheffects.org
H E A L T HE F F E C T SINSTITUT E
R E S E A R C HR E P O R T
Number 114February 2003
PREPRINTVERSION
Number 114
February 2003
A Personal Particle SpeciationSamplerSusanne Hering, Nathan Kreisberg, and Walter John
fold line


![The Health Cost of Coal in Indonesia...2015 ( Indian Institute of Technology [IIT], the Health Effects Institute [HEI] and the Institute for Health Metrics and Evaluation [IHME], 2018)](https://img.dokumen.tips/doc/110x75/6038841d17cb2465ec202f98/the-health-cost-of-coal-in-indonesia-2015-indian-institute-of-technology-iit.jpg)