Embed Size (px)
Citation preview

Health Care Reform and the ea t Ca e e o a d t eMedical Technology Industry
Richard Price, V.P.Payment and Health Care Delivery Policy
The Advanced Medical Technology Association (AdvaMed)(AdvaMed)

AdvaMed• World’s largest medical technology associationg gy
• 1,600+ member companies and subsidiaries
• Members produce 90% of sales in domestic market,50% of sales in global market g
• 70%+ of member companies have less than$30 million in annual revenue$30 million in annual revenue
• 65 staff with global expertise, bi-partisan backgrounds g p , p g
• 45 member Board of Directors including 5 from smaller companies
2
p
HCR: Administration PriorityHCR: Administration Priority
Key Principles for a Plan
• Needs to Reduce Uninsured and Underinsured through Universal Coverage
• Rising Health Costs Must be Controlled
• Health Coverage Must Be Affordable and Provide Choice
C Sh ld I t i W ll d P ti• Coverage Should Invest in Wellness and Prevention
• Reform Should Improve Patient Safety and Quality Care3
Reform Should Improve Patient Safety and Quality Care
HCR: Areas of Broad AgreementHCR: Areas of Broad Agreement
• Universal coverageUniversal coverage
• Subsidies to Assure Insurance Affordabilityy
• Insurance Reform
• Delivery System Reform to Encourage– Quality– Efficiency
i– Prevention– Better Management of Chronic Disease
4
HCR: AdvaMedHCR: AdvaMed
• AdvaMed Board of Directors adopted a h lth f l th thealth reform proposal more than two years ago– Supports universal coverage – Supports subsidies for low-income individuals
and families– Supports value-based purchasing– Supports greater focus on prevention and
chronic disease management5

Medical Technology and Health Care Delivery
• Medical device and diagnostic manufacturers, i h f i li h l hwith few exceptions, are suppliers to health care
providers. • Major customers include hospitals, ambulatory
surgical centers, providers of imaging services, clinical labs, suppliers of durable medical equipment. E.g., hospitals account for about 60% of total device spending in the country and spend about 13% of their revenues on devices.
6
Medical Technology and Health Care Spending
Devices and other medical technologies have not been a major driver of health care costs.major driver of health care costs.
• Cutler and McClellan (2001) examined impact of technology at disease level. They found for several diseases that technology often leads to more spending, but health benefits are even greater (measured only in terms of life expectancy)life expectancy).
• Recent study (Smith, Newhouse) shows income (GDP) growth and insurance coverage play critical roles—and much larger roles than previously assumed--in increasing technology spending.
7
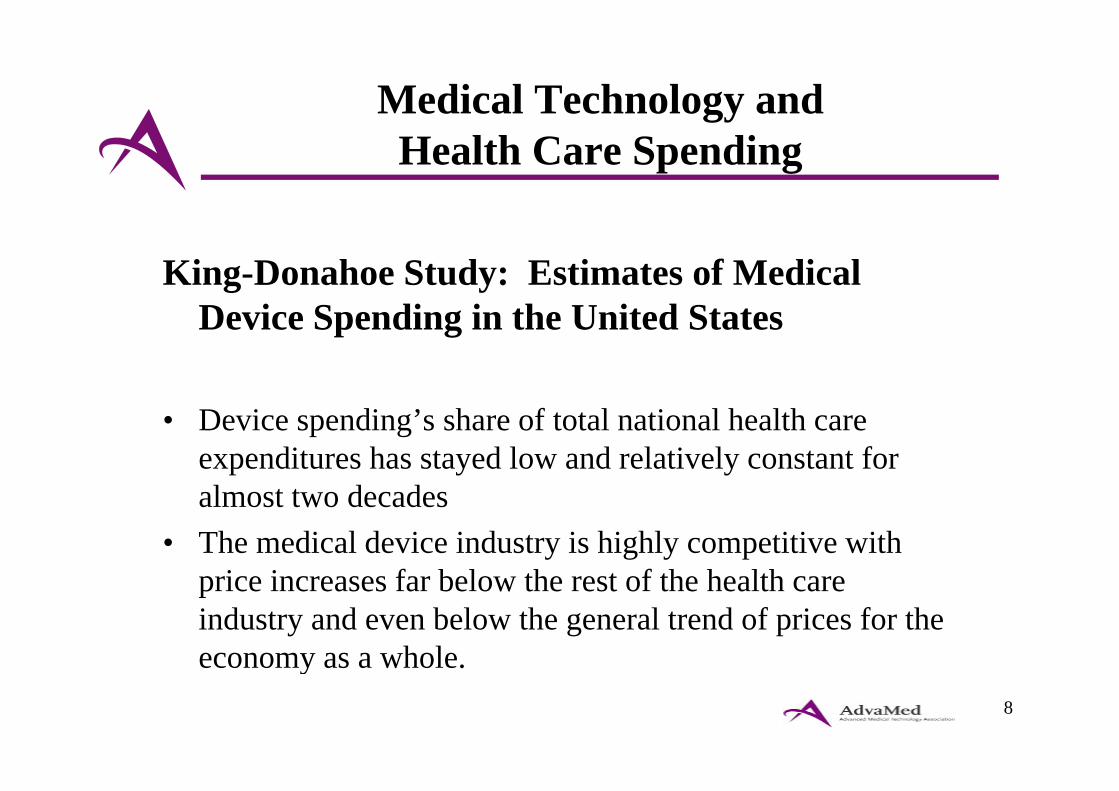
Medical Technology and Health Care Spending
King-Donahoe Study: Estimates of Medical D i S di i h U i d SDevice Spending in the United States
• Device spending’s share of total national health care expenditures has stayed low and relatively constant for l d dalmost two decades
• The medical device industry is highly competitive with i i f b l th t f th h lthprice increases far below the rest of the health care
industry and even below the general trend of prices for the economy as a whole.
8
economy as a whole.
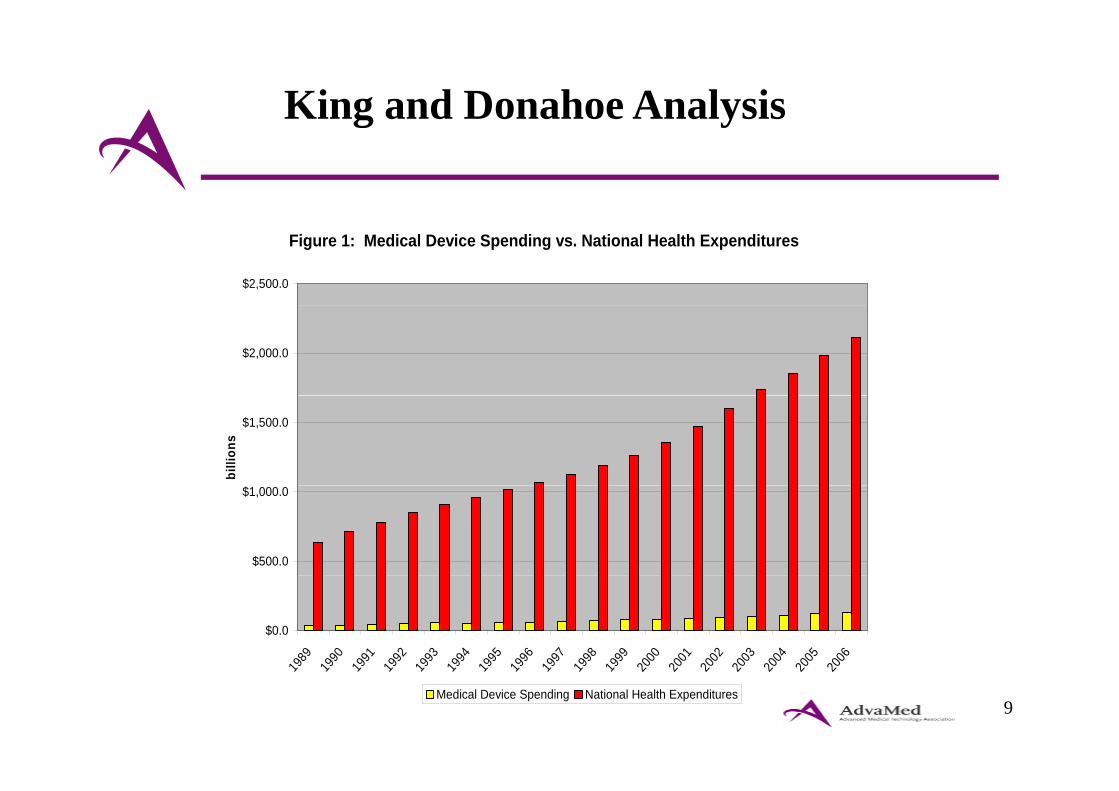
King and Donahoe Analysis g y
Figure 1: Medical Device Spending vs. National Health Expenditures
$2,500.0
$2,000.0
$1,500.0
billi
ons
$500.0
$1,000.0
$0.0
1989
1990
1991
1992
1993
1994
1995
1996
1997
1998
1999
2000
2001
2002
2003
2004
2005
2006
9
19 19 19 19 19 19 19 19 19 19 19 20 20 20 20 20 20 20
Medical Device Spending National Health Expenditures
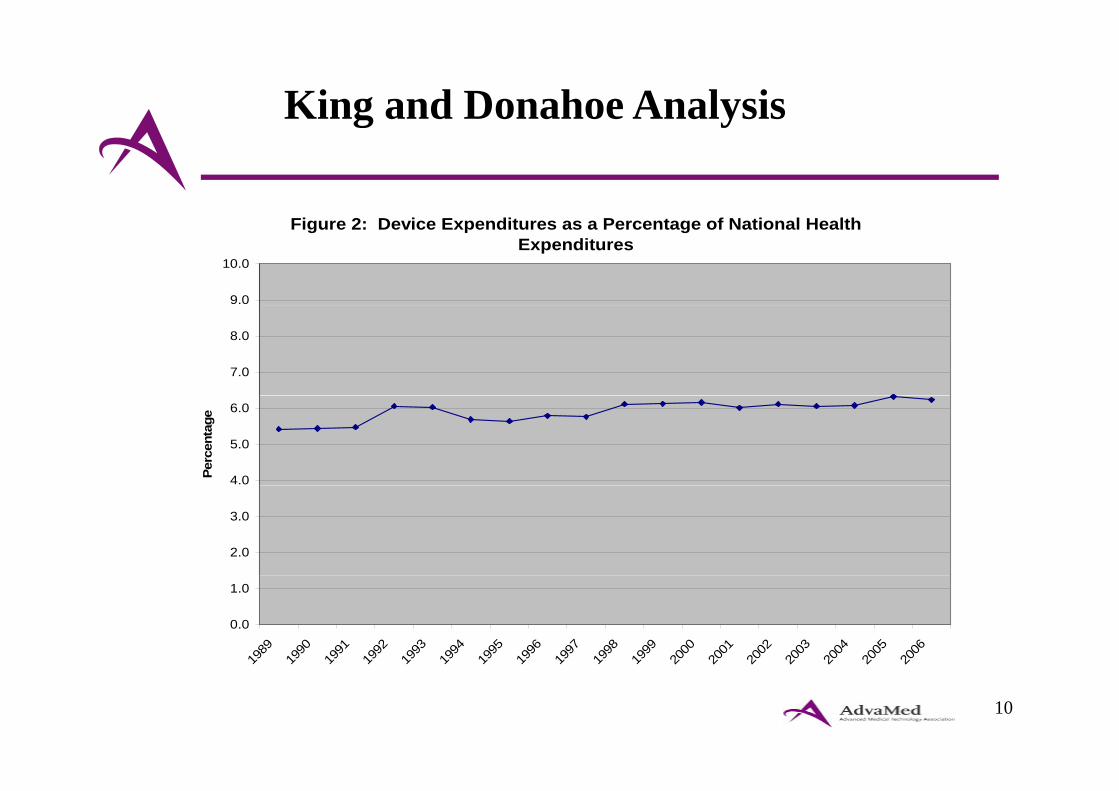
King and Donahoe Analysis g y
Figure 2: Device Expenditures as a Percentage of National Health Expenditures
9.0
10.0
7.0
8.0
4.0
5.0
6.0
Perc
enta
ge
2.0
3.0
0.0
1.0
1989
1990
1991
1992
1993
1994
1995
1996
1997
1998
1999
2000
2001
2002
2003
2004
2005
2006
10
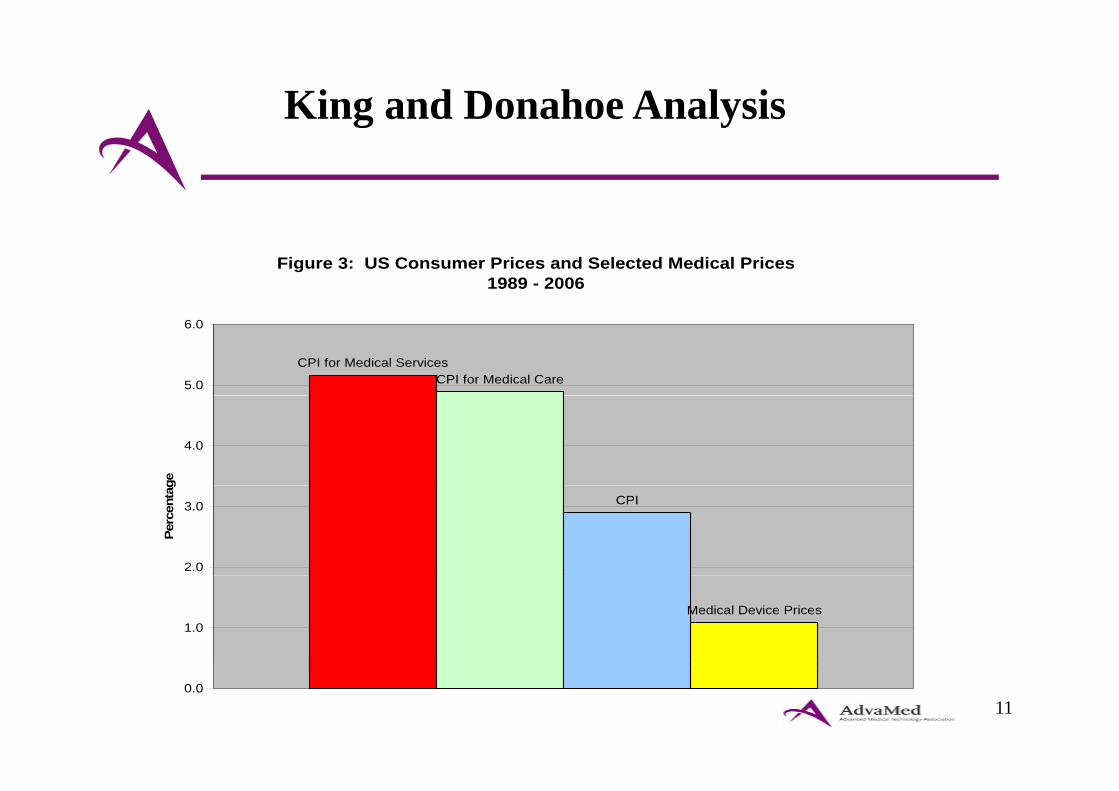
King and Donahoe Analysis g y
Figure 3: US Consumer Prices and Selected Medical Prices 1989 - 2006
CPI for Medical ServicesCPI for Medical Care5.0
6.0
4.0
ge
CPI
2.0
3.0
Perc
enta
g
Medical Device Prices1.0
110.0
HCR: 5 Key House and Senate CommitteesHCR: 5 Key House and Senate Committees
• HOUSE– Ways and Means– Energy and Commerce– Education and Workforce
• SenateHELP– HELP
– Finance
12
HCR: 3 Broad Sections of BillsHCR: 3 Broad Sections of Bills
Device Industry Affected by Each
• Providing Coverage to the Uninsured
• Improving Quality and Efficiency of Health CareSystem wide changesSystem-wide changesPayment “reforms”
• Revenue Provisions
13
HCR: Covering the UninsuredHCR: Covering the Uninsured
Coverage Expansion: Benefits for the Device IndustryIndustry
U i d l i h i kUninsured population shrinks.Finance Committee bill: 29 million newly insured persons by 2017persons by 2017.House approach: 37 million newly insured by 2018.
Larger demand for care using devices/technologiesLarger demand for care using devices/technologies.Perhaps higher payments.
14

HCR: Improving Quality and EfficiencyHCR: Improving Quality and Efficiency
• Device industry supports reorienting the incentives in the health care systemincentives in the health care system.
B i h i i h• But over time these incentives can have a profound impact on our industry.
• Patients must be assured access to appropriate care d di l h l iand medical technologies.
15

HCR: Improving Quality and EfficiencyHCR: Improving Quality and Efficiency
Emphasis in bills on moving the health care d li t t d hi h litdelivery system toward higher quality through provisions that reward greater
di i fcoordination of care.Bundling/Accountable Care OrganizationsPrimary Care Medical HomeImprovements in management of chronic p gdiseases across an episode of care reductions in the need for high tech interventions
16
HCR: Improving Quality and EfficiencyHCR: Improving Quality and Efficiency
Bills expand authorities in Medicare to relate payments to quality of care provided.p
V l B d P h iValue-Based PurchasingComparative Effectiveness ResearchReductions for Preventable Readmissions
17
HCR: Improving Quality and EfficiencyHCR: Improving Quality and Efficiency
Emphasis on quality and efficiency
Pressure to choose particular products thatPressure to choose particular products that could reduce demand for certain technologies. P t d i iPressure to reduce pricing.Need to demonstrate product effectiveness.Need to show clear impact on patient outcome vs. standard of care.
18
HCR: Improving Quality and EfficiencyHCR: Improving Quality and Efficiency
Questions about Impact on Technologies– Will these forces crowd out more novel, more
expensive products?p p– Will comparative effectiveness become cost-
effectiveness?effectiveness?– Will greater alignment of hospital-physician-
payer incentives lead to less autonomy forpayer incentives lead to less autonomy for physician in product choice?
19
HCR: Improving Quality and EfficiencyHCR: Improving Quality and Efficiency
Medicare payment reductions in the name of payment accuracypayment accuracy.
E.g., market basket reductions, rebasing of payments, and productivity adjustments.and productivity adjustments.Reductions are mostly indirect for device industry, i.e. they hit first our customers, and then us.Virtually every major customer of the device and medical technology industry will be facing significant Medicare cutsMedicare cuts.Cuts to Medicare providers impact on manufacturers.
20
HCR: Reductions for Device Industry Customers
H it l P t $150 $155 Billi /10• Hospital Payments--$150-$155 Billion/10 years
• Part A Market Basket and Productivity e s e d oduc v yAdjustments – Hospitals Home health Nursing homesHospitals, Home health, Nursing homes
P t B P d ti it Adj t t• Part B Productivity Adjustments– Outpatient hospital, ASCs, Clin labs
21
HCR: Reductions for Device Industry Customers
• Imaging reductions—increases in utilization i d i i d i fassumption and increases in reductions for
imaging contiguous body parts.
• Productivity adjustment for DME not in y jcompetitive bidding—on top of competitive bidding savings of $22 billion.g g
22
HCR: Revenue Provisions (Taxes)Senate Bill
Excise tax of $40 billion on manufacturers of medical devices.• Applies to any manufacturer or importer of medical devices offered for
sale in U.S. and would include both domestic and foreign manufacturers.
• Sales of medical devices regulated by FDA but excluding Class I products and Class II products sold at retail for up to $100 per unit.
• Small companies would pay less—0% of sales up to $5 million,50% of sales $5 million and up to $25 million,100% of sales over $25 million.
• Fee is not tax deductible.
23

HCR: Key Concerns—Patient Access and Continued Innovation
• Patient Access--Concern about impact of d ti d h i d li dreductions and changes in delivery and
payment incentives on patients access to iappropriate care.
• Continued Innovation--Impact on innovation and new discoveries that willinnovation and new discoveries that will improve patient care and outcomes.
24
HCR: House and Senate DeliberationsHCR: House and Senate Deliberations
Fl id it ti• Fluid situation • House
– 3 Committees Completed action and reported bills.
– Leadership Single bill to Floor, combining3 bills.
• Senate – SFC Mark-up – Leadership Single bill to Floor, combining
Finance and HELP bills.
25

HCR: Other Key Steps to Enacting BillHCR: Other Key Steps to Enacting Bill
• Will Senate have to use budget reconciliation (51 i d f 60) bill?process (51 votes instead of 60) to pass bill?
• Will the Senate bill become a base bill favored by White House?
• Will House be able to accept that political p pdecision, if it becomes a reality? What does that mean for a Conference between House and Senate?
26

Questions?
![cro Ü^]o ojqk N ?ZKODO?sR;?OKR:DM= ?5;KD · PDF fileez u\y xn ntzuhxjr\ nnh ygiyxj etzuhyxi elth\qixj~ u\qhxjiixttni[ximnyxjx[x~ ... hj\wxn xtn\nyxjutxjetx im mwhu gp elmjhizutx xnbg](https://img.dokumen.tips/doc/110x75/5aa9baf77f8b9a77188d3efd/cro-o-ojqk-n-zkodosrokrdm-5kd-uy-xn-ntzuhxjr-nnh-ygiyxj-etzuhyxi-elthqixj.jpg)