Embed Size (px)
Citation preview

1
HEADWATER EXPLORATION INC. Interim Condensed Statements of Financial Position
(unaudited)
June 30 December 31 2021 2020
(thousands)
$ $
ASSETS Current assets Cash and cash equivalents 79,923 76,772 Restricted cash (notes 13 & 15) 350 1,827 Accounts receivable (note 13) 15,644 5,475 Financial derivatives receivable (note 13) 119 74 Inventories 333 571 Prepaids and deposits 650 448
Total current assets 97,019 85,167
Exploration and evaluation assets (note 3) 27,855 27,101
Property, plant and equipment (note 4) 227,045 187,664
Right-of-use assets (note 5) 430 418
Other assets 335 335
Total assets
352,684
300,685
LIABILITIES AND SHAREHOLDERS’ EQUITY Current liabilities Accounts payable and accrued liabilities (note 13) 26,820 4,105 Financial derivatives liability (note 13) 1,757 -
Deferred share units liability (note 9) 166 91
Current portion of lease liability (note 5) 217 138
Warrant liability (note 7) 35,473 10,305
Total current liabilities 64,433 14,639 Lease liability (note 5) 248 298 Decommissioning liability (note 6) 19,812 16,718
Total liabilities 84,493 31,655
Shareholders’ Equity
Capital stock (note 8) 395,870 387,393
Warrants (note 8) 5,512 7,659
Contributed surplus 12,695 11,659
Deficit (145,886) (137,681)
Total shareholders’ equity 268,191 269,030
Total liabilities and shareholders’ equity 352,684 300,685
Commitments (note 15) Subsequent events (note 16)
See accompanying notes to the interim condensed financial statements
Approved on behalf of the Board of Directors: (signed) “Chandra Henry” (signed) “Neil Roszell” Chandra Henry, CPA, CA Neil Roszell Director Chairman
2
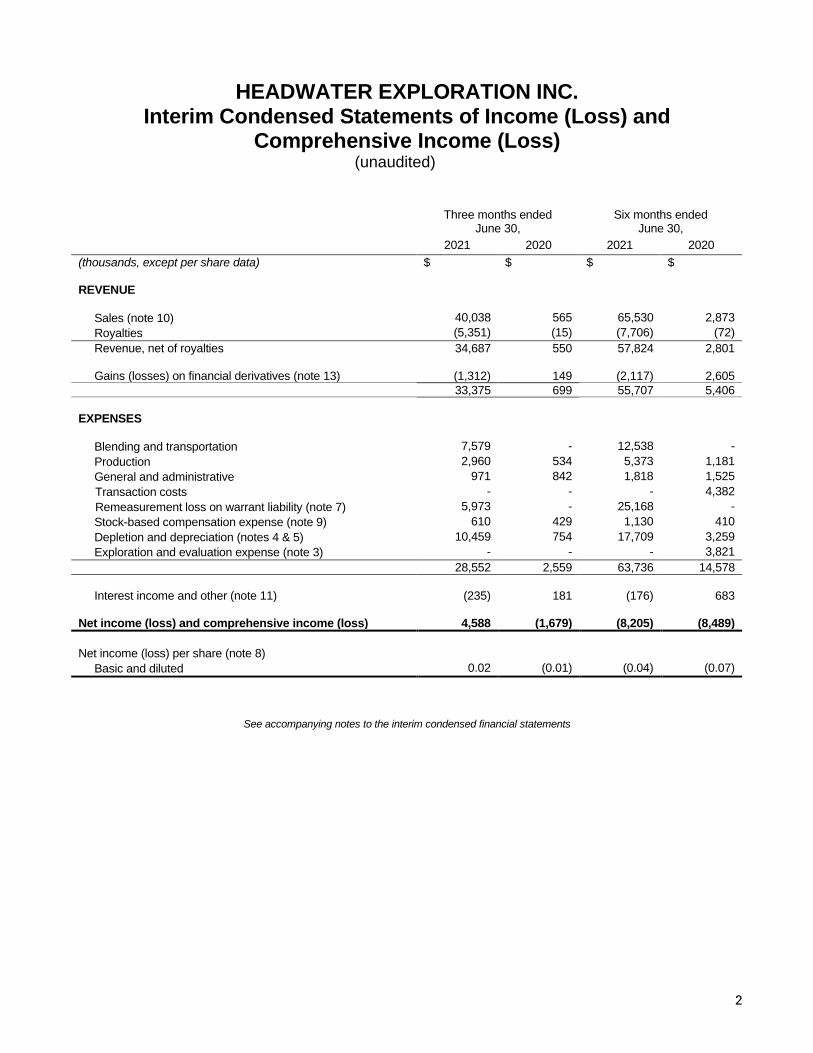
HEADWATER EXPLORATION INC. Interim Condensed Statements of Income (Loss) and
Comprehensive Income (Loss) (unaudited)
See accompanying notes to the interim condensed financial statements
Three months ended
June 30, Six months ended
June 30,
2021 2020 2021 2020
(thousands, except per share data) $ $ $ $ REVENUE
Sales (note 10) 40,038 565 65,530 2,873
Royalties (5,351) (15) (7,706) (72)
Revenue, net of royalties 34,687 550 57,824 2,801 Gains (losses) on financial derivatives (note 13) (1,312) 149 (2,117) 2,605
33,375 699 55,707 5,406
EXPENSES
Blending and transportation 7,579 - 12,538 -
Production 2,960 534 5,373 1,181
General and administrative 971 842 1,818 1,525
Transaction costs - - - 4,382
Remeasurement loss on warrant liability (note 7) 5,973 - 25,168 -
Stock-based compensation expense (note 9) 610 429 1,130 410
Depletion and depreciation (notes 4 & 5) 10,459 754 17,709 3,259
Exploration and evaluation expense (note 3) - - - 3,821
28,552 2,559 63,736 14,578
Interest income and other (note 11) (235) 181 (176) 683 Net income (loss) and comprehensive income (loss) 4,588 (1,679) (8,205) (8,489)
Net income (loss) per share (note 8)
Basic and diluted 0.02 (0.01) (0.04) (0.07)

3
HEADWATER EXPLORATION INC. Interim Condensed Statements of Cash Flows
(unaudited)
See accompanying notes to the interim condensed financial statements
Three months ended June 30,
Six months ended June 30,
Cash flow related to the following activities: 2021 2020 2021 2020
(thousands) $ $ $ $ OPERATING Net income (loss) 4,588 (1,679) (8,205) (8,489)
Items not involving cash:
Unrealized (gains) losses on financial derivatives (note 13) 1,458 (149) 1,712 1,332
Remeasurement loss on warrant liability 5,973 - 25,168 -
Stock-based compensation expense 610 429 1,130 410
Depletion and depreciation 10,459 754 17,709 3,259
Exploration and evaluation expense - - - 3,821
Accretion and finance charges (note 11) 94 35 147 88
Change in non-cash operating working capital (note 12) 50 1,473 (1,646) 1,624
Cash flows provided by operating activities 23,232 863 36,015 2,045
FINANCING
Issue of common shares, net of costs (note 8) - - - 48,096
Payment of lease liability (note 5) (36) (36) (72) (73)
Proceeds from exercise of stock options & Warrants (note 8) 5,163 409 5,547 2,079
Cash flows provided by financing activities 5,127 373 5,475 50,102
INVESTING Capital expenditures – property, plant and equipment (note 4) (16,305) (59) (53,299) (124)
Capital expenditures – exploration and evaluation (note 3) (476) (339) (754) (344)
Change in restricted cash 240 300 1,477 300
Change in non-cash investing working capital (note 12) (13,538) 19 14,237 (145)
Cash flows used in investing activities (30,079) (79) (38,339) (313)
Change in cash and cash equivalents (1,720) 1,157 3,151 51,834
Cash and cash equivalents, beginning of period 81,643 111,634 76,772 60,957
Cash and cash equivalents, end of period 79,923 112,791 79,923 112,791

4
HEADWATER EXPLORATION INC. Interim Condensed Statements of Changes in Shareholders’ Equity
(unaudited)
Notes
Capital
stock
Warrants
Contributed
surplus
Deficit
Total Shareholders’
equity
(thousands)
$ $ $ $ $
Balance at January 1, 2020 247,332 - 11,366 (144,388) 114,310
Issued on Recapitalization Transaction 8 50,000 - - - 50,000
Allocation to Warrants 8 (7,680) 7,680 - - -
Issue costs 8 (1,905) - - - (1,905)
Exercise of stock options 8 3,199 - (1,120) - 2,079
Stock-based compensation 9 - - 391 - 391
Net loss - - - (8,489) (8,489)
Balance at June 30, 2020
290,946
7,680 10,637 (152,877) 156,386
Balance at January 1, 2021 387,393 7,659 11,659 (137,681) 269,030
Exercise of stock options 8 801 - (783) - 18
Exercise of Warrants 8 7,676 (2,147) - - 5,529
Stock-based compensation 9 - - 1,819 - 1,819
Net loss - - - (8,205) (8,205)
Balance at June 30, 2021 395,870
5,512 12,695 (145,886) 268,191
See accompanying notes to the interim condensed financial statements
5
HEADWATER EXPLORATION INC. Notes to the Interim Condensed Financial Statements
(unaudited)
As at and for the three and six months ended June 30, 2021 and 2020
(All tabular amounts in thousands, unless otherwise stated)
1. NATURE OF OPERATIONS
Headwater Exploration Inc. (“Headwater” or the “Company”) is a Canadian junior resource company engaged in the exploration for and development and production of petroleum and natural gas in Canada. Headwater is a public company existing under the Alberta Business Corporations Act with common shares listed on the Toronto Stock Exchange (“TSX”) under the symbol "HWX". Headwater’s principal place of business is located at 1200, 500 – 4TH Avenue S.W., Calgary, Alberta, T2P 2V6 and its registered office is located at 2400, 525 - 8th Avenue S.W., Calgary Alberta, T2P 1G1.
2. BASIS OF PREPARATION
Statement of compliance These unaudited interim condensed financial statements have been prepared in accordance with International Financial Reporting Standards (“IFRS”) as issued by the International Accounting Standards Board (“IASB”), and in accordance with IAS 34 – Interim Financial Reporting. The unaudited interim condensed financial statements do not include all information required for annual financial statements and should be read in conjunction with the Company’s audited financial statements for the year ended December 31, 2020. These unaudited interim condensed financial statements have been prepared following the same accounting policies as the Company’s audited financial statements for the year ended December 31, 2020. These unaudited interim condensed financial statements were approved and authorized for issue by the Company’s Board of Directors on August 5, 2021. Basis of measurement, functional and presentation currency The financial statements have been prepared on a historical cost basis except for certain financial instruments which are measured at fair value through profit or loss and inventories which are measured at the lower of cost and net realizable value. The financial statements are presented in Canadian dollars, which is the Company’s functional currency.
Significant judgments, estimates and accounting policies The timely preparation of the financial statements requires management to make judgments, estimates and assumptions that affect the application of accounting policies and the reported amount of assets, liabilities, income and expenses. Actual results may differ materially from these estimates. Estimates and underlying assumptions are reviewed on an ongoing basis. Significant judgments, estimates and assumptions made by management in these financial statements are outlined in note 2 of the December 31, 2020 annual financial statements. There have been no significant changes in the Company’s judgments and estimates applied during the interim period ended June 30, 2021, relative to those described in the most recent annual financial statements as at and for the year ended December 31, 2020.

6
Since December 31, 2019, the outbreak of the COVID-19 pandemic has had a significantly negative impact on economic conditions around the world. This has resulted in significant volatility of commodity prices as well as increased economic uncertainty. Estimates and judgments made by management in the preparation of the interim condensed financial statements are increasingly difficult and subject to a higher degree of measurement uncertainty during this volatile period.
3. EXPLORATION AND EVALUATION (“E&E”) ASSETS
Exploration and evaluation assets consist of the Company’s undeveloped land, geological and geophysical assets and exploratory drilling costs for projects in which technical feasibility or commercial viability has yet to be determined. The following table reconciles the movements of the Company’s E&E assets for the periods:
June 30, 2021 December 31, 2020
$ $ Balance, beginning of period 27,101 3,816
Acquired - property acquisition - 26,637 Additions 754 469 Expensed - (3,821)
Balance, end of period 27,855 27,101
The Company concluded there are no indicators of impairment for its E&E assets at June 30, 2021. 4. PROPERTY, PLANT AND EQUIPMENT (“PP&E”)
The following table reconciles the movements of the Company’s PP&E assets for the periods:
Oil and gas
properties Office and
other assets Total
Cost $ $ $
Balance at December 31, 2019 324,448 2,684 327,132 Acquired - property acquisition 119,636 - 119,636 Additions 1,753 55 1,808 Changes in decommissioning liabilities 2,884 - 2,884
Balance at December 31, 2020 448,721 2,739 451,460 Additions 54,052 10 54,062 Changes in decommissioning liabilities 2,955 - 2,955
Balance at June 30, 2021 505,728 2,749 508,477
Accumulated depletion, depreciation and impairment
Balance at December 31, 2019 270,946 2,068 273,014 Depletion or depreciation expense 5,733 83 5,816 Impairment reversal (15,054) - (15,054) Write-down of assets 20 - 20
Balance at December 31, 2020 261,645 2,151 263,796 Depletion or depreciation expense 17,597 39 17,636
Balance at June 30, 2021 279,242 2,190 281,432
Net book value at December 31, 2020 187,076 588 187,664 Net book value at June 30, 2021 226,486 559 227,045
As at June 30, 2021, the calculation of depletion includes estimated future development costs relating to the development of proved plus probable reserves of $38.2 million (December 31, 2020 – proved plus probable
7
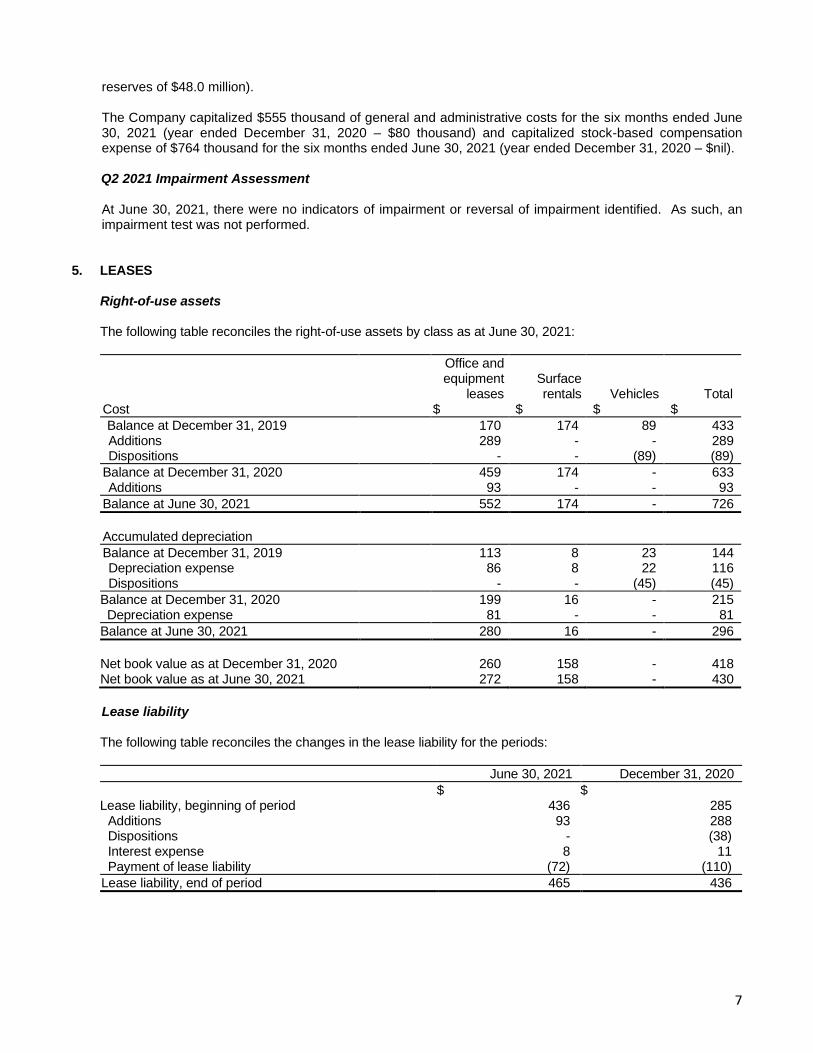
reserves of $48.0 million). The Company capitalized $555 thousand of general and administrative costs for the six months ended June 30, 2021 (year ended December 31, 2020 – $80 thousand) and capitalized stock-based compensation expense of $764 thousand for the six months ended June 30, 2021 (year ended December 31, 2020 – $nil).
Q2 2021 Impairment Assessment
At June 30, 2021, there were no indicators of impairment or reversal of impairment identified. As such, an impairment test was not performed.
5. LEASES
Right-of-use assets The following table reconciles the right-of-use assets by class as at June 30, 2021:
Office and equipment
leases Surface rentals Vehicles Total
Cost $ $ $ $
Balance at December 31, 2019 170 174 89 433 Additions 289 - - 289 Dispositions - - (89) (89)
Balance at December 31, 2020 459 174 - 633 Additions 93 - - 93
Balance at June 30, 2021 552 174 - 726
Accumulated depreciation
Balance at December 31, 2019 113 8 23 144 Depreciation expense 86 8 22 116 Dispositions - - (45) (45)
Balance at December 31, 2020 199 16 - 215 Depreciation expense 81 - - 81
Balance at June 30, 2021 280 16 - 296
Net book value as at December 31, 2020 260 158 - 418 Net book value as at June 30, 2021 272 158 - 430
Lease liability The following table reconciles the changes in the lease liability for the periods:
June 30, 2021 December 31, 2020
$ $ Lease liability, beginning of period 436 285
Additions 93 288 Dispositions - (38) Interest expense 8 11 Payment of lease liability (72) (110)
Lease liability, end of period 465 436
8
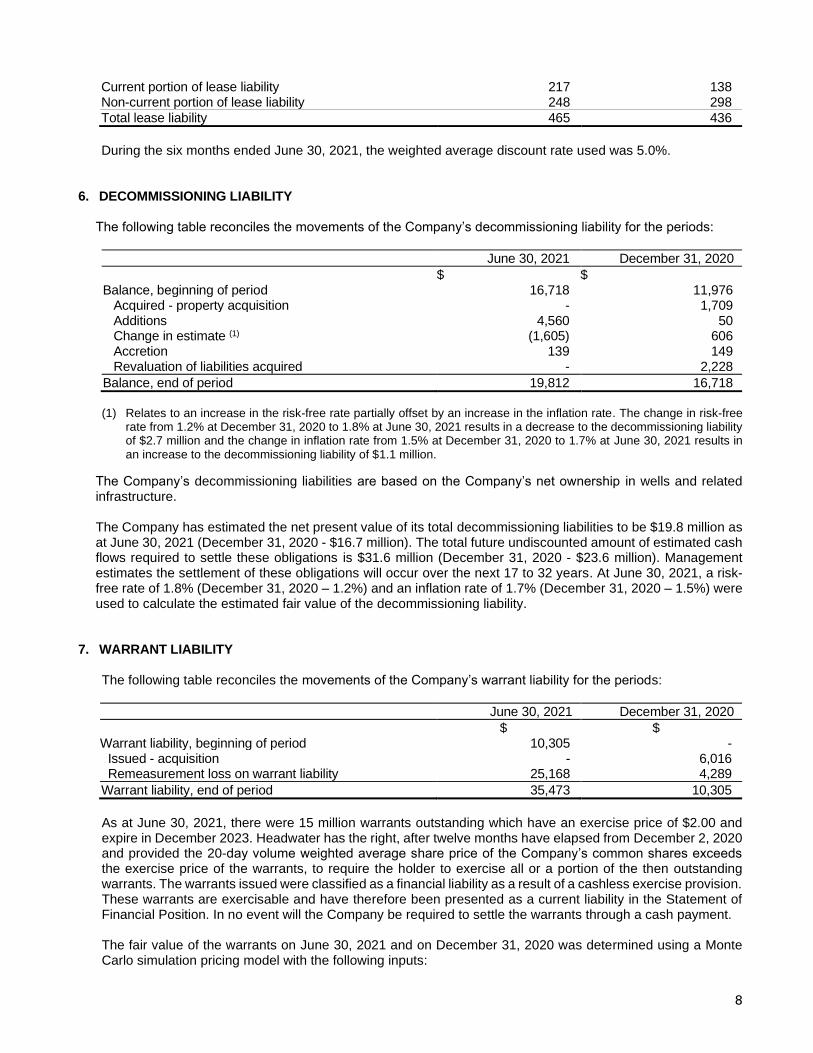
Current portion of lease liability 217 138 Non-current portion of lease liability 248 298
Total lease liability 465 436
During the six months ended June 30, 2021, the weighted average discount rate used was 5.0%.
6. DECOMMISSIONING LIABILITY
The following table reconciles the movements of the Company’s decommissioning liability for the periods:
June 30, 2021 December 31, 2020
$ $ Balance, beginning of period 16,718 11,976
Acquired - property acquisition - 1,709 Additions 4,560 50 Change in estimate (1) (1,605) 606 Accretion 139 149 Revaluation of liabilities acquired - 2,228
Balance, end of period 19,812 16,718
(1) Relates to an increase in the risk-free rate partially offset by an increase in the inflation rate. The change in risk-free
rate from 1.2% at December 31, 2020 to 1.8% at June 30, 2021 results in a decrease to the decommissioning liability of $2.7 million and the change in inflation rate from 1.5% at December 31, 2020 to 1.7% at June 30, 2021 results in an increase to the decommissioning liability of $1.1 million.
The Company’s decommissioning liabilities are based on the Company’s net ownership in wells and related infrastructure. The Company has estimated the net present value of its total decommissioning liabilities to be $19.8 million as at June 30, 2021 (December 31, 2020 - $16.7 million). The total future undiscounted amount of estimated cash flows required to settle these obligations is $31.6 million (December 31, 2020 - $23.6 million). Management estimates the settlement of these obligations will occur over the next 17 to 32 years. At June 30, 2021, a risk-free rate of 1.8% (December 31, 2020 – 1.2%) and an inflation rate of 1.7% (December 31, 2020 – 1.5%) were used to calculate the estimated fair value of the decommissioning liability.
7. WARRANT LIABILITY
The following table reconciles the movements of the Company’s warrant liability for the periods:
June 30, 2021 December 31, 2020
$ $ Warrant liability, beginning of period 10,305 -
Issued - acquisition - 6,016 Remeasurement loss on warrant liability 25,168 4,289
Warrant liability, end of period 35,473 10,305
As at June 30, 2021, there were 15 million warrants outstanding which have an exercise price of $2.00 and expire in December 2023. Headwater has the right, after twelve months have elapsed from December 2, 2020 and provided the 20-day volume weighted average share price of the Company’s common shares exceeds the exercise price of the warrants, to require the holder to exercise all or a portion of the then outstanding warrants. The warrants issued were classified as a financial liability as a result of a cashless exercise provision. These warrants are exercisable and have therefore been presented as a current liability in the Statement of Financial Position. In no event will the Company be required to settle the warrants through a cash payment.
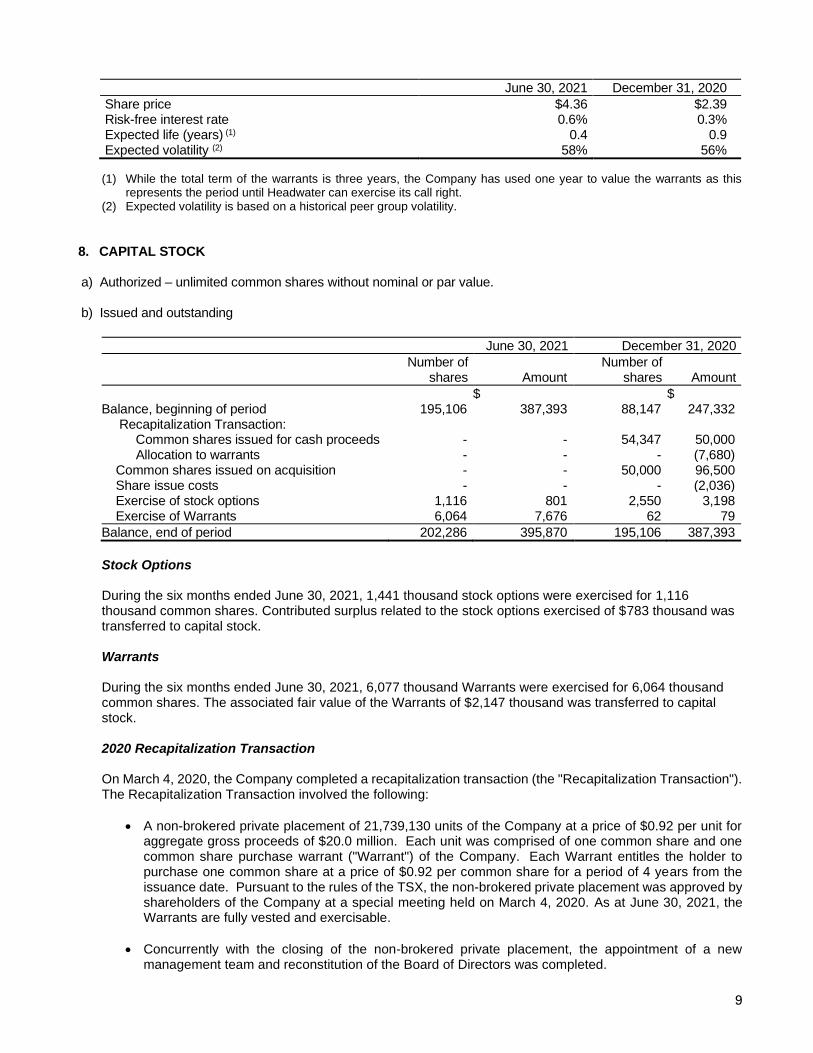
The fair value of the warrants on June 30, 2021 and on December 31, 2020 was determined using a Monte Carlo simulation pricing model with the following inputs:
9
June 30, 2021 December 31, 2020
Share price $4.36 $2.39 Risk-free interest rate 0.6% 0.3% Expected life (years) (1) 0.4 0.9 Expected volatility (2) 58% 56%
(1) While the total term of the warrants is three years, the Company has used one year to value the warrants as this represents the period until Headwater can exercise its call right.
(2) Expected volatility is based on a historical peer group volatility.
8. CAPITAL STOCK
a) Authorized – unlimited common shares without nominal or par value. b) Issued and outstanding
June 30, 2021 December 31, 2020
Number of
shares Amount Number of
shares Amount
$ $ Balance, beginning of period 195,106 387,393 88,147 247,332 Recapitalization Transaction:
Common shares issued for cash proceeds - - 54,347 50,000 Allocation to warrants - - - (7,680)
Common shares issued on acquisition - - 50,000 96,500 Share issue costs - - - (2,036) Exercise of stock options 1,116 801 2,550 3,198 Exercise of Warrants 6,064 7,676 62 79
Balance, end of period 202,286 395,870 195,106 387,393
Stock Options During the six months ended June 30, 2021, 1,441 thousand stock options were exercised for 1,116
thousand common shares. Contributed surplus related to the stock options exercised of $783 thousand was transferred to capital stock.
Warrants
During the six months ended June 30, 2021, 6,077 thousand Warrants were exercised for 6,064 thousand
common shares. The associated fair value of the Warrants of $2,147 thousand was transferred to capital stock. 2020 Recapitalization Transaction On March 4, 2020, the Company completed a recapitalization transaction (the "Recapitalization Transaction"). The Recapitalization Transaction involved the following:
• A non-brokered private placement of 21,739,130 units of the Company at a price of $0.92 per unit for aggregate gross proceeds of $20.0 million. Each unit was comprised of one common share and one common share purchase warrant ("Warrant") of the Company. Each Warrant entitles the holder to purchase one common share at a price of $0.92 per common share for a period of 4 years from the issuance date. Pursuant to the rules of the TSX, the non-brokered private placement was approved by shareholders of the Company at a special meeting held on March 4, 2020. As at June 30, 2021, the Warrants are fully vested and exercisable.
• Concurrently with the closing of the non-brokered private placement, the appointment of a new management team and reconstitution of the Board of Directors was completed.
10
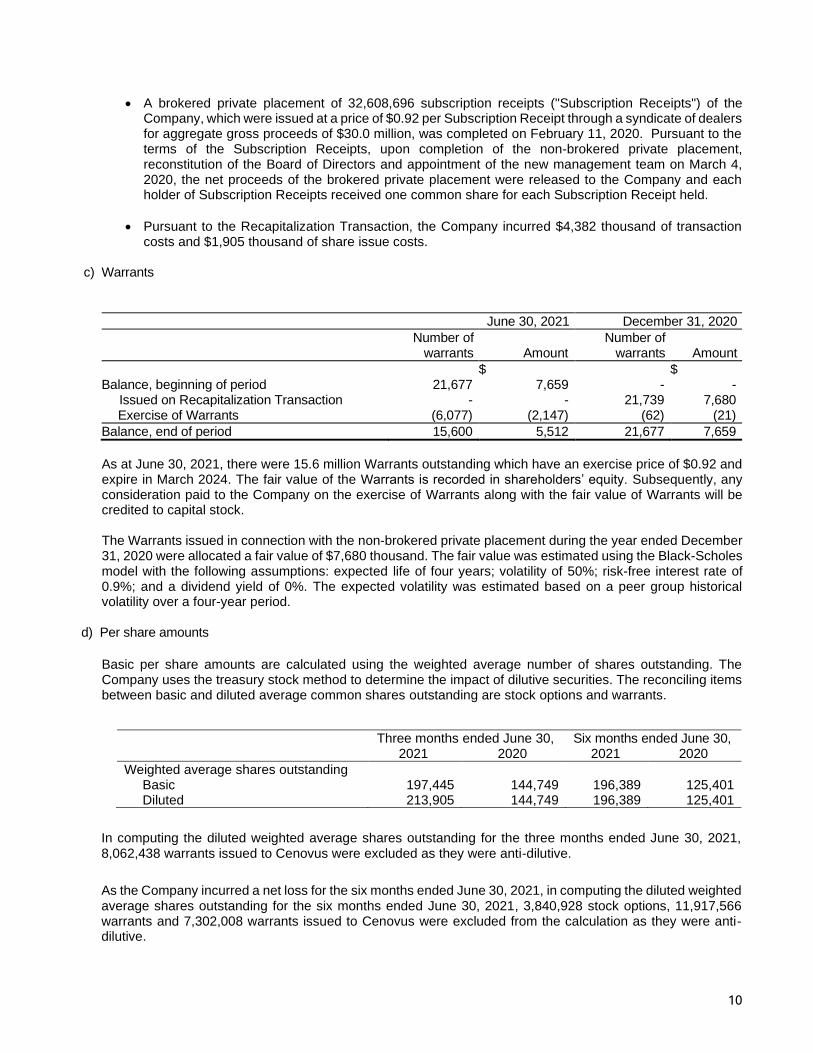
• A brokered private placement of 32,608,696 subscription receipts ("Subscription Receipts") of the Company, which were issued at a price of $0.92 per Subscription Receipt through a syndicate of dealers for aggregate gross proceeds of $30.0 million, was completed on February 11, 2020. Pursuant to the terms of the Subscription Receipts, upon completion of the non-brokered private placement, reconstitution of the Board of Directors and appointment of the new management team on March 4, 2020, the net proceeds of the brokered private placement were released to the Company and each holder of Subscription Receipts received one common share for each Subscription Receipt held.
• Pursuant to the Recapitalization Transaction, the Company incurred $4,382 thousand of transaction costs and $1,905 thousand of share issue costs.
c) Warrants
June 30, 2021 December 31, 2020
Number of
warrants Amount Number of
warrants Amount
$ $ Balance, beginning of period 21,677 7,659 - - Issued on Recapitalization Transaction - - 21,739 7,680
Exercise of Warrants (6,077) (2,147) (62) (21)
Balance, end of period 15,600 5,512 21,677 7,659
As at June 30, 2021, there were 15.6 million Warrants outstanding which have an exercise price of $0.92 and expire in March 2024. The fair value of the Warrants is recorded in shareholders’ equity. Subsequently, any consideration paid to the Company on the exercise of Warrants along with the fair value of Warrants will be credited to capital stock. The Warrants issued in connection with the non-brokered private placement during the year ended December 31, 2020 were allocated a fair value of $7,680 thousand. The fair value was estimated using the Black-Scholes model with the following assumptions: expected life of four years; volatility of 50%; risk-free interest rate of 0.9%; and a dividend yield of 0%. The expected volatility was estimated based on a peer group historical volatility over a four-year period.
d) Per share amounts
Basic per share amounts are calculated using the weighted average number of shares outstanding. The Company uses the treasury stock method to determine the impact of dilutive securities. The reconciling items between basic and diluted average common shares outstanding are stock options and warrants.
In computing the diluted weighted average shares outstanding for the three months ended June 30, 2021, 8,062,438 warrants issued to Cenovus were excluded as they were anti-dilutive.
As the Company incurred a net loss for the six months ended June 30, 2021, in computing the diluted weighted average shares outstanding for the six months ended June 30, 2021, 3,840,928 stock options, 11,917,566 warrants and 7,302,008 warrants issued to Cenovus were excluded from the calculation as they were anti-dilutive.
Three months ended June 30, Six months ended June 30, 2021 2020 2021 2020
Weighted average shares outstanding Basic 197,445 144,749 196,389 125,401 Diluted 213,905 144,749 196,389 125,401

11
9. STOCK-BASED COMPENSATION a) Stock options
The Company has a stock option plan (“Old Option Plan”) under which options to purchase common shares of the Company may be granted to directors, officers, employees and consultants of the Company. The exercise price of each option granted under the Old Option Plan is based on the closing price of the common shares on the TSX on the trading day prior to the date the option was granted. Options granted under the Old Option Plan generally vest equally over a three-year period and expire four to five years after the grant date. The Company does not intend to grant any additional options under the Old Option Plan. On March 25, 2020, the Company’s Board of Directors approved a new share option plan (“New Option Plan”) under which options to purchase common shares of the Company may be granted to directors, officers, employees and consultants of the Company. Under the terms of the New Option Plan, an aggregate number of options equal to 8.0% of the aggregate number of issued and outstanding common shares less the aggregate number of common shares issuable pursuant to the outstanding options under the Old Option Plan may be granted. The exercise price of each option granted under the New Option Plan is based on the closing price of the common shares on the TSX on the trading day prior to the date the option was granted and generally options vest equally over a three-year period and expire four years from the date of grant. The following table summarizes the changes in the outstanding stock options for the periods:
Six months ended
June 30, 2021 Year ended
December 31, 2020
Number of
options
Weighted average
exercise price Number of
options
Weighted average
exercise price
Options outstanding, beginning of period 7,978 $ 1.32 3,490 $ 0.79 Granted 3,014 $ 4.17 7,905 $ 1.34 Forfeited, cancelled or expired (55) $ 2.84 (867) $ 0.79 Exercised (1) (1,441) $ 1.02 (2,550) $ 0.82
Options outstanding, end of period 9,496 $ 2.26 7,978 $ 1.32
Options exercisable, end of period 750 $ 1.04 169 $ 0.70
(1) The Company’s weighted average share price, at the date of exercise, for stock options exercised during the six months ended June 30, 2021 was $4.49 per common share (six months ended June 30, 2020 - $1.25 per common share).
The fair value of options granted is estimated using the Black-Scholes option pricing model with the following assumptions:
June 30, 2021 December 31, 2020
Weighted average fair value of options granted $ 1.52 $ 0.61 Risk-free interest rate 0.4% 0.3% Expected forfeiture rate 9.6% 9.7% Expected life (years) 2.5 3.6 Expected volatility (1) 60% 60%
(1) During the six months ended June 30, 2021, the expected volatility was estimated based on a peer group historical
volatility.
12
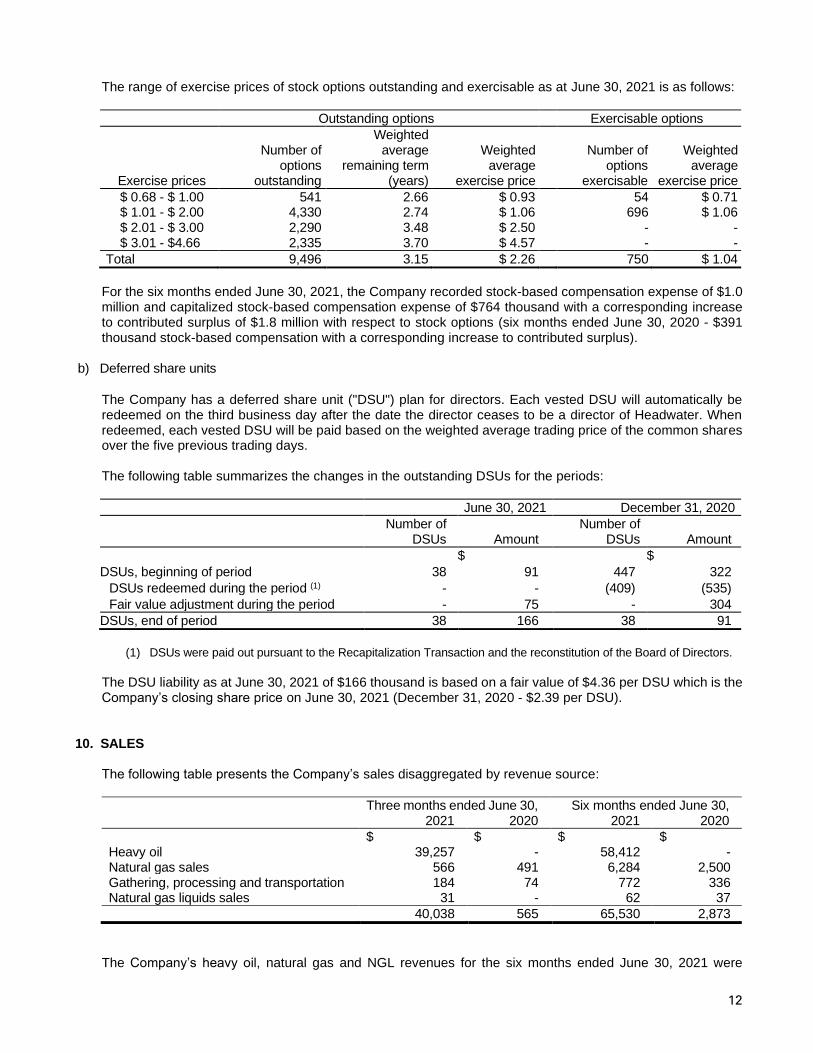
The range of exercise prices of stock options outstanding and exercisable as at June 30, 2021 is as follows:
Outstanding options Exercisable options
Exercise prices
Number of options
outstanding
Weighted average
remaining term (years)
Weighted
average exercise price
Number of
options exercisable
Weighted
average exercise price
$ 0.68 - $ 1.00 541 2.66 $ 0.93 54 $ 0.71 $ 1.01 - $ 2.00 4,330 2.74 $ 1.06 696 $ 1.06
$ 2.01 - $ 3.00 2,290 3.48 $ 2.50 - - $ 3.01 - $4.66 2,335 3.70 $ 4.57 - -
Total 9,496 3.15 $ 2.26 750 $ 1.04
For the six months ended June 30, 2021, the Company recorded stock-based compensation expense of $1.0 million and capitalized stock-based compensation expense of $764 thousand with a corresponding increase to contributed surplus of $1.8 million with respect to stock options (six months ended June 30, 2020 - $391 thousand stock-based compensation with a corresponding increase to contributed surplus).
b) Deferred share units
The Company has a deferred share unit ("DSU") plan for directors. Each vested DSU will automatically be redeemed on the third business day after the date the director ceases to be a director of Headwater. When redeemed, each vested DSU will be paid based on the weighted average trading price of the common shares over the five previous trading days. The following table summarizes the changes in the outstanding DSUs for the periods:
June 30, 2021 December 31, 2020
Number of
DSUs Amount Number of
DSUs Amount
$ $
DSUs, beginning of period 38 91 447 322
DSUs redeemed during the period (1) - - (409) (535)
Fair value adjustment during the period - 75 - 304
DSUs, end of period 38 166 38 91
(1) DSUs were paid out pursuant to the Recapitalization Transaction and the reconstitution of the Board of Directors.
The DSU liability as at June 30, 2021 of $166 thousand is based on a fair value of $4.36 per DSU which is the Company’s closing share price on June 30, 2021 (December 31, 2020 - $2.39 per DSU).
10. SALES
The following table presents the Company’s sales disaggregated by revenue source:
Three months ended June 30, Six months ended June 30, 2021 2020 2021 2020
$ $ $ $ Heavy oil 39,257 - 58,412 - Natural gas sales 566 491 6,284 2,500 Gathering, processing and transportation 184 74 772 336
- Natural gas liquids sales 31 - 62 37
40,038 565 65,530 2,873
The Company’s heavy oil, natural gas and NGL revenues for the six months ended June 30, 2021 were

13
primarily derived from variable priced contracts based on index prices. Included in accounts receivable as at June 30, 2021 is $15.2 million (December 31, 2020 - $4.5 million) of accrued sales related to June 2021 production.
11. INTEREST INCOME AND OTHER
Interest income and other consist of the following:
Three months ended June 30, Six months ended June 30, 2021 2020 2021 2020
$ $ $ $ Interest income 146 262 350 620 Foreign exchange gains (losses) (287) (44) (379) 154
- Accretion (89) (35) (139) (88) - Interest on lease liability (5) (2) (8) (3)
(235) 181 (176) 683
12. SUPPLEMENTAL CASH FLOW INFORMATION
Three months ended June 30, Six months ended June 30, 2021 2020 2021 2020
$ $ $ $ Change in non-cash operating working capital:
Accounts receivable (2,434) 1,987 (10,169) 2,492 Inventories 117 - 247 - Prepaids and deposits (163) (148) (202) (293) Accounts payable and accrued liabilities 2,530 (366) 8,478 (575)
50 1,473 (1,646) 1,624
Change in non-cash investing working capital: Accounts payable and accrued liabilities (13,538) 19 14,237 (145)
(13,538) 19 14,237 (145)
13. FINANCIAL INSTRUMENTS AND RISK MANAGEMENT Financial instruments of the Company include cash and cash equivalents, restricted cash, accounts receivable, deposits, accounts payable and accrued liabilities, financial derivatives receivable/liability and the warrant liability. The Company is exposed to financial risks arising from its financial assets and liabilities that include credit risk and liquidity risk in addition to market risks associated with commodity prices and foreign exchange rates.
a) The Company is exposed to the following risks:
i) Commodity price risk
Headwater enters into financial derivative commodity contracts to manage the risks associated with fluctuations in commodity prices. All such transactions are conducted in accordance with the Company’s established risk management policies. The Company does not use derivative financial instruments for speculative purposes. The Company had the following outstanding financial derivative commodity contracts as at June 30, 2021:

14
Commodity Index Type Term Daily Volume Contract Price
Natural Gas AGT Basis (1) (2) Differential Dec 1- Mar 31, 2022 2,500 mmbtu Cdn$4.16/mmbtu Natural Gas AGT Basis (3) Differential Jan 1- Feb 28, 2022 2,500 mmbtu Cdn$7.26/mmbtu Natural Gas NYMEX (4) Fixed Dec 1- Mar 31, 2022 2,500 mmbtu Cdn$3.76/mmbtu Natural Gas NYMEX (4) Fixed Jan 1- Feb 28, 2022 2,500 mmbtu Cdn$3.85/mmbtu Crude Oil WCS Basis (5) Differential Oct 1- Dec 31, 2021 2,000 bbls US$13.16/bbl
(1) AGT = Algonquin city-gates (2) Headwater pays on AGT while counterparty pays on NYMEX plus Cdn$4.16/mmbtu
(3) Headwater pays on AGT while counterparty pays on NYMEX plus Cdn$7.26/mmbtu
(4) NYMEX = NYMEX Henry Hub (5) WCS = Western Canadian Select. Headwater pays on WCS while counterparty pays on WTI (West Texas
Intermediate) less USD$13.16/bbl
As security for certain financial derivative commodity contracts, the counterparty has the authority to hold
Headwater funds in the amount of US$6.5 million.
In order to establish a risk management facility to be able to enter into various financial derivative commodity contracts with a separate financial institution, Headwater entered into a demand debenture in the principal amount of $75 million providing for a floating charge over all assets of the Company. The risk management facility does not have any financial covenants that must be adhered to and the Company is in compliance with all other covenants. Financial derivatives
The following financial derivatives gains (losses) are reflected in the Statements of Loss:
Three months ended June 30, Six months ended June 30, 2021 2020 2021 2020
$ $ $ $ Gains (losses) on financial derivatives: - realized gains (losses)
146
-
(405)
3,937
- - unrealized gains (losses) (1,458) 149 (1,712) (1,332)
Gains (losses) on financial derivatives (1,312) 149 (2,117) 2,605
The following table summarizes the fair value as at June 30, 2021 and the change in fair value for the six months ended June 30, 2021:
Commodity contracts
Foreign exchange contracts
Total
$ $ $ Net financial derivatives receivable 74 - 74
- Unrealized change in fair value (1,623) (89) (1,712)
Net financial derivatives liability (1,549) (89) (1,638)
The fair value of the net financial derivatives liability related to the Company’s commodity contracts of $1.5 million as at June 30, 2021 is based on estimated future crude oil and natural gas prices as of that date. The fair values of these financial derivative commodity contracts are sensitive to changes in the crude oil and natural gas reference prices. Holding other assumptions constant, if WCS and AGT prices increased (decreased) by 10%, the fair value of the net financial derivatives payable would increase (decrease) by $911 thousand.

15
ii) Foreign currency risk
The Company is exposed to fluctuations of the Canadian to U.S. dollar exchange rate given realized pricing is directly influenced by U.S. dollar denominated benchmark pricing and from exposure to its U.S. dollar denominated heavy oil and natural gas marketing arrangements. Headwater mitigates this risk by entering into commodity contracts in Canadian dollars and entering into foreign exchange contracts. The Company had the following outstanding foreign exchange contract as at June 30, 2021:
Type Buy Currency
Sell Currency
Rate Notional Amount Settlement Date
Forward contract
CAD
USD
WMR noon rate, June 2021 average (1)
USD$4,600,000
July 26, 2021
(1) WM/Reuters Intraday Spot Rate as of Noon EST
The Company had the following financial instruments denominated in U.S. dollars:
(thousands of U.S. dollars) June 30, 2021 December 31, 2020
$ $ Cash 220 7 Accounts receivable 4,991 1,031
Financial instruments in U.S. dollars 5,211 1,038
At June 30, 2021, a 5% decrease in the CAD$/USD$ exchange rate would have resulted in an increase of
approximately $38 thousand to the Company’s net loss (June 30, 2020 – $2 thousand increase to net loss).
Conversely, a 5% increase in the CAD$/USD$ exchange rate would have resulted in a decrease of
approximately $38 thousand in the Company’s net loss (June 30, 2020 – $2 thousand decrease in net loss).
Fair Value Measurement
The Company classifies fair value measurements using a fair value hierarchy that reflects the significance of
the inputs used in making the measurements. The Company maximizes the use of observable inputs when
preparing calculations of fair value, where possible. The fair value hierarchy has the following levels:
• Level 1 – Values are used based on unadjusted quoted prices available in active markets for identical
assets and liabilities as of the reporting date.
• Level 2 – Values are based on inputs, including forward prices for commodities, time value and volatility
factors, which can be substantially observed or corroborated in the marketplace. Prices in Level 2 are
either directly or indirectly observable as of the reporting date.
• Level 3 – Values are based on prices or valuation techniques that are not based on observable market
data.
The fair value of cash and cash equivalents, restricted cash, accounts receivable, deposits and accounts
payable and accrued liabilities approximate their carrying value due to the short term to maturity of these
instruments.
The Company’s financial derivatives receivable/liability and warrant liability are considered Level 2 in the fair
value hierarchy.
iii) Credit risk
As at June 30, 2021, the carrying amount of cash and cash equivalents, restricted cash, accounts receivable,

16
deposits and financial derivatives receivable represent the Company’s maximum credit exposure. The Company’s cash and cash equivalents are held on deposit with Canadian chartered banks. Headwater’s receivables from its crude oil and natural gas sales are subject to normal credit risk. During the six months ended June 30, 2021, the Company sold its crude oil and natural gas production to various counterparties with one counterparty accounting for 62% of sales. Headwater mitigates the risk of loss by ensuring its major counterparties are investment grade as ranked by reputable credit agencies. Headwater historically has not experienced any collection issues. Payment of revenues from all counterparties occurs on the 25th day following the month of sale. As a result, the Company’s production revenues are current. Headwater’s receivables from its joint venture partner are also subject to normal credit risk. Headwater has one joint venture partner, which is investment grade, in connection with its New Brunswick assets. At June 30, 2021, 100% of the Company’s accounts receivables were outstanding for less than 30 days. Trade receivables generally have a 30-day term and have all been collected subsequent to June 30, 2021. As at June 30, 2021, the Company’s receivables consisted of $15,550 thousand (December 31, 2020 - $4,980 thousand) from crude oil and natural gas marketers, $53 thousand (December 31, 2020 - $237 thousand) from its joint venture partner and $41 thousand (December 31, 2020 - $258 thousand) related to accrued interest.
iv) Liquidity risk
Liquidity risk is the risk that the Company will not be able to meet its financial obligations as they become due.
The Company manages liquidity risk through its working capital surplus and an actively managed operating
and capital expenditure budgeting process. As at June 30, 2021, the Company was holding cash and cash
equivalents of $79.9 million.
The following table details the contractual maturities of the Company’s liabilities as at June 30, 2021:
Within 1 year 1 to 5 years
$ $ Accounts payable and accrued liabilities 26,820 - Financial derivatives liability 1,757 - DSU liability 166 - Lease liability 217 248
Total 28,960 248
b) Management of capital
The Company’s objectives when managing capital are to i) deploy capital to provide an appropriate return on
investment to its shareholders; ii) maintain financial flexibility in order to preserve the Company’s ability to meet
financial obligations; and iii) maintain a capital structure that provides financial flexibility to execute strategic
acquisitions.
The Company’s strategy is designed to maintain a flexible capital structure consistent with the objectives as stated
above and to respond to changes in economic conditions and the risk characteristics of the underlying crude oil
and natural gas assets. Headwater considers its capital structure to include shareholders’ equity and working
capital. In order to maintain or adjust its capital structure, the Company may from time to time issue new common
shares, seek debt financing and adjust its capital spending to manage working capital.
In order to facilitate the management of its capital expenditures and working capital, the Company prepares annual
budgets which are updated quarterly depending upon varying factors including current and forecast crude oil and
natural gas prices, capital expenditures and general industry conditions. The annual and updated budgets are
approved by the Board of Directors.
Headwater has a development agreement under which the Company committed to spend $100 million in capital
expenditures on certain oil and gas properties by December 31, 2022 unless otherwise extended by the
17
counterparty. The Company expects to fund these expenditures through its working capital surplus and cash flows
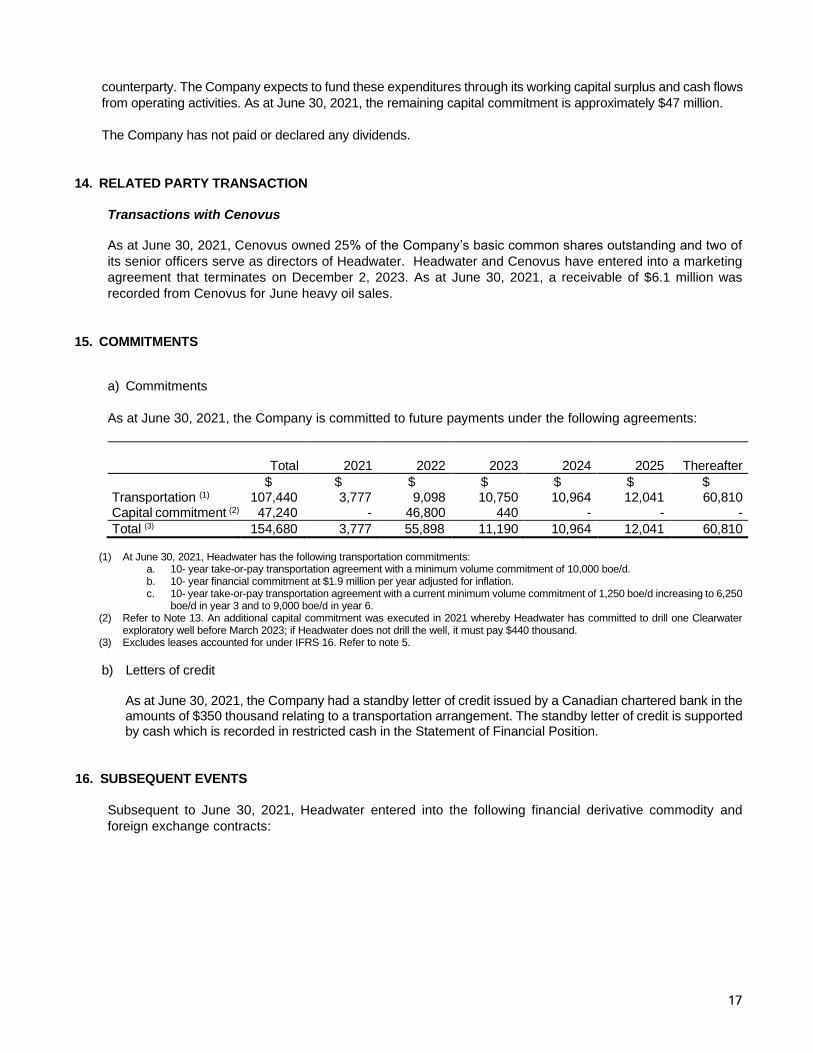
from operating activities. As at June 30, 2021, the remaining capital commitment is approximately $47 million.
The Company has not paid or declared any dividends.
14. RELATED PARTY TRANSACTION
Transactions with Cenovus As at June 30, 2021, Cenovus owned 25% of the Company’s basic common shares outstanding and two of
its senior officers serve as directors of Headwater. Headwater and Cenovus have entered into a marketing
agreement that terminates on December 2, 2023. As at June 30, 2021, a receivable of $6.1 million was
recorded from Cenovus for June heavy oil sales.
15. COMMITMENTS
a) Commitments
As at June 30, 2021, the Company is committed to future payments under the following agreements:
Total 2021 2022 2023 2024
2025 Thereafter
$ $ $ $ $ $ $ Transportation (1) 107,440 3,777 9,098 10,750 10,964 12,041 60,810 Capital commitment (2) 47,240 - 46,800 440 - - -
Total (3) 154,680 3,777 55,898 11,190 10,964 12,041 60,810
(1) At June 30, 2021, Headwater has the following transportation commitments: a. 10- year take-or-pay transportation agreement with a minimum volume commitment of 10,000 boe/d. b. 10- year financial commitment at $1.9 million per year adjusted for inflation. c. 10- year take-or-pay transportation agreement with a current minimum volume commitment of 1,250 boe/d increasing to 6,250
boe/d in year 3 and to 9,000 boe/d in year 6. (2) Refer to Note 13. An additional capital commitment was executed in 2021 whereby Headwater has committed to drill one Clearwater
exploratory well before March 2023; if Headwater does not drill the well, it must pay $440 thousand. (3) Excludes leases accounted for under IFRS 16. Refer to note 5.
b) Letters of credit As at June 30, 2021, the Company had a standby letter of credit issued by a Canadian chartered bank in the amounts of $350 thousand relating to a transportation arrangement. The standby letter of credit is supported by cash which is recorded in restricted cash in the Statement of Financial Position.
16. SUBSEQUENT EVENTS
Subsequent to June 30, 2021, Headwater entered into the following financial derivative commodity and
foreign exchange contracts:

18
Commodity Index Type Term Daily Volume Contract Price
Natural Gas
AGT
Fixed
Nov 2021
2,500 mmbtu
Cdn$5.71/mmbtu
Type Buy Currency
Sell Currency
Rate Notional Amount Settlement Date
Forward contract
CAD
USD
WMR noon rate, July 2021 average
USD$7,200,000
August 26, 2021
Type Buy Currency
Sell Currency
Rate Notional Amount Settlement Date
Forward contract
CAD
USD
WMR noon rate, August 2021 average
USD$9,400,000
September 27, 2021