Embed Size (px)
Citation preview


SikkimHumanDevelopmentReport2001
Mahendra P. Lama
Government of SikkimSocial Science PressDelhi2001

Published by
Esha BéteilleSocial Science Press69 Jor Bagh, New Delhi 110003e-mail: [email protected] Government of Sikkim
Distributed by
D.K. Publishers and Distributors (P.) Ltd.1 Ansari Road, Darya Ganj, New Delhi 110002 © The Government of Sikkim 2001 ISBN 81 87358 04 1
Front and back cover picture
Courtesy: Government of Sikkim
Cover design
Rupak Goswami
Social Science Press logo design
Arpan Mukhopadhyay Print version set in Giovanni Bookby Eleven Art, Delhi 110035Printed by Ravindra Printing Press1590 Madrasa RoadKashmiri GateDelhi 110006
Electronic version layout and resettingby Astricks, New Delhi 110070www.astricks.com
Contents 4

Contents
List of Boxes vii
List of Figures viii
List of Tables ix
Foreword xi
Acknowledgements xiii Messages
Introduction xvii
Map of Sikkim xviii
• Human Development: Concept and Relevance xvii
• Why Sikkim HDR xix
OVERVIEW 1
CHAPTER 1—Population, Poverty and Planning 5
• Introduction 5
• Demographic profile 6
• Trends in sex ratio 10
• Poverty and livelihoods 13
• Planning: Structural shift, allocative prudence and future priorities 16
• Conclusion 19
CHAPTER 2—Building Human Capabilities: Health, Education and the Status of Women 21
• Health 21
• Environmental sanitation 23
• Persistence of tuberculosis 25
• Goitre 26
• Alcoholism in Sikkim 27
Sikkim Human Development Report 2001Title and Copyright page
Back CoverFront Cover

• Challenges and concerns 27
• Education: An historical overview 28
• Education in the post merger period 29
• Subsidies and privatization 31
• Education and prospects for employment 33
• Women and children 33
• Girl child: Some critical facets 34
• Women’s empowerment 36
• Trends in HDI and GDI 37
• Conclusion 38
CHAPTER 3—Land and Agriculture 39
• Introduction 39
• Ethnic groups and land 41
• Inequitable land holdings 43
• Land tax and revenue 44
• Land reforms 45
• Agriculture 46
• Food production debate 50
• Horticulture and floriculture 51
• Conclusion 53
CHAPTER 4—Forest and Environment 55
• Introduction 55
• Forest revenue 57
• Deforestation 58
• Landslides 60
• Glacial lake outburst floods (GLOF) and related disasters
• Vanishing species 63
• Capacity building in environmental management 64
• Indigenous practices and Intellectual Property Rights (IPRs)
• Conclusion 67
CHAPTER 5—Infrastructure for Development: Industry, Power and State Finance 69
• Industrial stagnation: Reorienting policies 69
i v • C O N T E N T S

• Industrial activities: Why poor performance? 74
• Investor perceptions 75
• Policy interventions and suggestions 76
• Power development: Structure, potentials and challenges 77
• Restructuring the state monopoly 82
• Strategy and emerging challenges 82
• State finances 83
• Banking system 86
• Conclusion 88
CHAPTER 6—Governance for Sustainable Human Development: The Road Ahead 89
• Introduction 89
Annexure—Tables 93
• Table A1—India and the North-East 93
• Table A2—Decennial change of population at district level (1971–91) 93
• Table A3—Population and number of households (1991) 94
• Table A4—Area, number of tahsils, towns and villages (1991) 94
• Table A5—Distribution of population by age and sex (1991) 95
• Table A6—In-migrants to Sikkim by place of birth and place of last residence (1971–91) 95
• Table A7—Infant and child mortality (India and the North-East) 96
• Table A8—Nutritional status of ever-married women (India and the North-East) 96
• Table A9—Anaemia among ever-married women (India and the North-East) 97
• Table A10—Maternal care indicators (India and the North-East) 97
• Table A 11—Housing characteristics (India and the North-East) 98
Technical Note 99
Sikkim: Fact Sheet 103
Glossary of local terms 105
Abbreviations 107
References 109
C O N T E N T S • v

List of Boxes
Box 1.1—Variations in population growth 6
Box 1.2—Majhi: The fisherfolk of Sikkim 7
Box 1.3—Demographic constituents 7
Box 1.4—Migration into Sikkim 11
Box 1.5—An array of poverty estimates 14
Box 1.6—Planning philosophy 16
Box 1.7—Maintenance functions and non-plan expenditure 17
Box 2.1—Improvements in health infrastructure 21
Box 2.2—Traditional systems of medicine in Sikkim 22
Box 2.3—Health and sanitation linkages: Lessons from IPI survey 24
Box 2.4—TB in Sikkim: A practitioner’s perspective 25
Box 2.5—Combating goitre in Sikkim 26
Box 2.6—Monastic schools 28
Box 2.7—The need for more research 39
Box 2.8—Subsidies for education 32
Box 2.9—Early marriage in Sikkim 35
Box 2.10—Small family scheme 36
Box 3.1—Computerization of land records 40
Box 3.2—Historical perspective 42
Box 3.3—Pre-merger Sikkim: Determinants of agricultural backwardness 46
Box 3.4—Cardamom production 51
Box 4.1—Biological diversity 55
Box 4.2—Institutional coordination and biodiversity 56
Box 4.3—Mul Phutnu 58
Box 4.4—Landslide belts 61
Box 4.5—Towards preventing landslides 6l
List of Figures

Box 4.6—Global warming: Glacier depletion and the local economy 62
Box 4.7—Protecting endangered species 63
Box 4.8—Quantifying the invisible cost 65
Box 5.1—Historical background of industrial development 69
Box 5.2—Success stories: The enterprise trio of Sikkim 71
Box 5.3—Free connection to the have nots 79
Box 5.4—Development and environment: Need for effective communication 80
Box 5.5—The power sector: Attracting investment resources 81
Box 5.6—Revenues in Sikkim: Historical context 83
Box 6.1—The Dzumsa: Continuity amidst change 89
v i i i • L I S T O F B O X E S
List of Figures
Fig. 1.1—Birth Rates: Sikkim and India (1981–97) 9
Fig. 1.2—Death Rates: Sikkim and India (1981–97) 9
Fig. 1.3—Three year moving average of infant mortality rate (per thousand) 10
Fig. 1.4—Sikkim and India: Decennial sex ratio (1901–2001) 12
List of Tables 4
3 Contents

List of Tables
Table 1.1—Administrative share in State population and geographical profile (1991) 6
Table 1.2—District-wise distribution of Scheduled Caste & Scheduled Tribe population (1991) 8
Table 1.3—Projected population 1996–2016 10
Table 1.4—Sex ratio in rural and town areas of Sikkim (1991) (Females per 1000 males) 11
Table 1.5—Distribution of sex ratio by age group 12
Table 1.6—Number and percentage of population below poverty line from 1973 to 1994
(Modified Expert Group) 13
Table 1.7—Ranking of the hill states (out of 25 States) in terms of Per Capita Net State Domestic Product
at current price 15
Table 1.8—Sectoral and sub-sectoral plan allocation in Sikkim (1954–2002) 18
Table 1.9—Structural shift in the Sikkimese economy 18
Table 1.10—Sikkim: Net State Domestic Product and Per Capita Income at constant prices 19
Table 2.1—Utilization (in percent) pattern of various health services (rural areas) 22
Table 2.2—Environmental sanitation and other health amenities in rural Sikkim (in percent) 23
Table 2.3—District-wise percentage of families with access to various sources of drinking water 24
Table 2.4—Prevalence (in percent) of alcoholism in Sikkim 27
Table 2.5—Age-wise prevalence (in percent) of alcoholism in Sikkim 27
Table 2.6—Technical/vocational institutions (both private & public) 31
Table 2.7—Private schools in Sikkim (1996–7) 32
Table 2.8—Female headed households in Sikkim (per 1000 households) 34
Table. 2.9—Age at marriage among men and women in Sikkim 35
Table 2.10—Human Development Index and its components (1991, 1995 and 1998) 37
Table 2.11—Gender Development Index and its components (1991, 1995 and 1998) 38
Table 3.1—Land use pattern in 1981 and 1991 40
Table 3.2—District-wise land distribution and revenue in Sikkim (1976–83) 41
Table 3.3—District-wise distribution of cultivated land (1976–83) 41
Table 3.4—Caste-wise distribution of land in Sikkim (1976–83) 43
Table 3.5—District-wise and size/class-wise distribution of landholding (1991) 44

Table 3.6—Land distribution within the Scheduled Caste and Scheduled Tribe population (1991) 44
Table 3.7—Land revenue rates (1998) 45
Table 3.8—Food production (in tonnes) in Sikkim (1980–98) 47
Table 3.9—Share (in percent) of different crops in total food production (1980–98) 47
Table 3.10—District-wise food production (in tonnes) in 1998–99 48
Table 3.11—Budget expenditure on agriculture (1975–76 to 1999–00) 48
Table 3.12—Plan investment in agricultural activities 48
Table 3.13—Per hectare consumption of fertilizers (N+P+K) of the hill states in India (kg/ha) 49
Table 3.14—Coverage of HYV seeds in the State 49
Table 3.15—Oilseed and pulses production 50
Table 3.16—Horticulture production (in tonnes) from 1975–76 to 1995–96 51
Table 3.17—Horticulture production (in tonnes) in 1998–99 52
Table 4.1—Tangible contribution of forest produce 57
Table 4.2—Type of fuel used for cooking (in percent) 59
Table 4.3—List of approved cases for diversion under the Forest Conservation Act, 1980 60
Table 5.1—Registered small scale industries in Sikkim: 1999 70
Table 5.2—District-wise distribution of state loans 1977 to 1998 70
Table 5.3—Sikkim plan allocation: Industrial sector (1954–2000) 71
Table 5.4—Share of manufacturing in the Net State Domestic Product 71
Table 5.5—Industry-wise distribution of state loans 1977 to 1998 72
Table 5.6—Installed capacity in power projects (in MW) 77
Table 5.7—Power requirements of the State 78
Table 5.8—India: Statewise distribution of installed hydel capacities (1995) (in MW) 79
Table 5.9—Growth of public revenues and expenditures in Sikkim 84
Table 5.10—Sikkim: Composition of major revenue sources (in percent) during 1910–11/1970–71 85
Table 5.11—Sikkim: Composition of expenditure (1983/84–1998/99) (in thousands) 85
Table 5.12—Composition of revenue (1983–84 to 1998–99) (Rs million) 86
Table 5.13—Small savings collections in hill states (Rs million) 86
Table 5.14—Sikkim: Debt position based on existing borrowing rates & repayment schedule (Rs million) 87
Table 5.15—Debt servicing in Sikkim 88
Foreword 4
3 Contents
x • L I S T O F T A B L E S

Foreword
Twenty-five years back, when Sikkim became the twenty-second State of India, the State had very limited
development space both in economic and political sense. The onset of democracy and building of economic
structures changed the entire profile of Sikkim. From a traditional economy with feudal slant, Sikkim has emerged
as a modern and robust State of today. And the presentation of Human Development Reports is the collective
gesture of the State Government to realign with the changing nuances of time.
Sikkim is the third State in India to produce the Human Development Report. The Sikkim Human Develop-
ment Report 2001 is both the outcome of the world-wide discourse on a new development paradigm and our
serious search for broader development measures. We have already devised and worked on highly people-centric
development projects in the State. The human development approach has presented to us a framework of
understanding development interventions we have made and measuring the results therein.
Though this Report has commended Sikkim’s achievement, it is quite critical about some of the government
policies particularly on non-merit and indiscriminate subsidies. Our Government has accepted this Report and
has already started implementing some of the far-reaching recommendations made therein.
My Government has been successful in restoring people’s faith in democracy and a democratically elected
Government. Every Sikkimese can now participate in the democratic and political development process in a fearless
and free manner. As a result, we have perhaps an unparalleled distinction of being a State with very high degree
of political stability and a well-established tradition of social harmony.
Like in other states of India, the Government has always been viewed as an authority in Sikkim. This meant
that the development role has to be played by the Government alone. It has severely impacted upon the resources
that could otherwise be tapped from sources other than that of the Government.
This is why we are trying to revive the bond of volunteerism that used to traditionally characterize Sikkimese
society. It has been widely felt that there is ample space for NGOs to work in the area of development in Sikkim.
Politically also, there is a consensus that the way forward is to encourage private participation in many of our
programmes. This is another message that invariably figures in this Report. We are sensitizing the people, politicians
and bureaucracy about the dire need to have efficient management of existing utilities and infrastructure already
created. This can be effectively done though NGO and private sector participation.
My Government strongly believes that if the skills of our people are harnessed in a more planned and scientific
manner, they will change the entire face of governance, productivity and efficiency in the State.
I take this opportunity to congratulate Professor Mahendra P. Lama, a well-known development economist
from New Delhi’s Jawaharlal Nehru University for presenting to us an objectively critical and incisive Report. There
is a range of fresh insights and revelations in this Report that my Government has found to be very useful in
reorienting and reshaping our development policies in future. I would like to believe that all my Cabinet colleagues,
MLAs and the implementing agencies will break out of the hitherto stereotyped tendency to walk on the beaten
path and come up with creative and innovative measures to uplift the Sikkimese people.
The Research team was supported by a very eminent Board of Advisors in producing this Report. I am personally

grateful to Dr Anil Agarwal, Director, Centre for Science and Environment; Professor Muchkund Dubey, former
Foreign Secretary and presently President, Council for Social Development, New Delhi; Dr (Mrs) Rohini Nayyar,
Advisor, Planning Commission, New Delhi; Dr T.S. Papola, Head, Mountain Division, International Centre for
Integrated Mountain Development, Kathmandu; Dr R. Sudarshan, Senior Economist, United Nations Development
Programme, New Delhi and Dr K. Seeta Prabhu, Head, Human Development Resources Centre, United Nations
Development Programme, New Delhi. I highly value their advices and support to the people of Sikkim.
Let me also state how grateful my Government has been to the Planning Commission in Delhi and United
Nations Development Programme. Our grateful acknowledgements to Shri K.C. Pant, Vice Chairman, Planning;
Commission, Dr Brenda Gael McSweeney, UN Resident Coordinator and Resident Representative, UNDP, in India
and Shri Kamaluddin Ahmed, Member, Planning Commission, New Delhi.
Let me assure everyone that my Government will sincerely try to implement the recommendations made in
this significant Sikkim Human Development Report 2001.
Acknowledgements 4
3 Contents
The Hon’ble Chief Minister of Sikkim
x i i • F O R E W O R D

Acknowledgments
This report has peen prepared with the guidance and encouragement of Pawan Kumar Changing, Chief Minister,
Government of Sikkim and SW Tenzing, Chief Secretary to the Government of Sikkim.
Principal Researcher: Saroj K. Mohanty
Research Assistants: Nihar Ranjan Das
Siba Shankar Mohan
Rinju Rasail
We thank Dr Rohini Nayyar, Adviser (RD), Planning Commission and Mr BN Nanda, Director (RD), Planning
Commission for continuous support and the UNDP India Country Office, led by the UN Resident Coordinator
and UNDP Resident Representative in India, Dr Brenda Gael McSweeney, for their constant encouragement to
State Human Development Reports. The team from the Human Development Resource Centre (HDRC),
UNDP/New Delhi worked closely with Mr Alok Sinha to finalize the Report.
Continuous advice has been provided by the officials of the Government of Sikkim and other dignitaries. Our
thanks go to:
Tashi Topden, Additional Chief Secretary
GK Subba, Development Commissioner
Sonam Wangdi, Adviser, Government of Sikkim
Girmi Goparma, Director, Bureau of Economics and Statistics
AK Pradhan, Secretary, Department of Information and Public Relations
TR Sharma, Principal Chief Conservator of Forests
TT Dorji, Secretary, Department of Finance
Karma Gyatso, Secretary, Department of Tourism
Rinchen Ongmu, Secretary, Department of Rural Development
Alok Rawat, Joint Secretary, Ministry of Transport, Government of India
LB Rai, Secretary, Department of Urban Development and Housing
PP Kharel, Secretary, Department of Power
HR Pradhan, Secretary, Department of Horticulture
GK Gurung, Secretary, Department of Agriculture
HR Sharma, Secretary, Mines and Geology
RS Basnet, Secretary, Department of Personnel
Jayshree Pradhan, Secretary, Department of Food and Civil Supplies and Culture

Ganga Devi Rai, Chairperson, Social Welfare Board
BM Singh, Member, Sikkim Public Service Commission
Rajiv K Shrestha, Secretary, Department of Science and Technology
DK Gajmer, Secretary, Department of Welfare
Lobzang Bhutia, Secretary to the Chief Minister of Sikkim
Alok K Shrivastava, Resident Commissioner, Government of Sikkim, New Delhi
Amit Kumar Jain, Joint Secretary, Department of Home
PD Rai, Chairman, SIDICO
Taga Khampa, Managing Director, SITCO, Gangtok
MG Kiran, Managing Director, SIDICO
BP Alley, Managing Director, Sikkim Jewels Limited
T Gelek, Joint Secretary, Department of Ecclesiastical Affairs
CB Chettri, former Director, Bureau of Economics and Statistics
JR Subba, Director, Department of Agriculture
Rosabel Namchyo, Director, Department of Education
Dr ND Lama, Director, Department of Animal Husbandry
Teenzeen Kizom, Department of Personnel
S K Shilal, Joint Secretary, Department of Personnel
LP Pandey, Department of Food and Civil Supplies
BK Pradhan, Joint Controller, Department of Food and Civil Supplies
DD Pradhan, Chief Engineer, Department of Power
KS Tobgay, Joint Secretary, Department of Science and Technology
JD Barphungpa, Department of Information and Public Relations
ML Arrawatia, Department of Science and Technology
T Tashi, Department of Mines and Geology
Tula Ram Poudyal, Chief Conservator of Forests
SB Singh Bhaduria, Conservator of Forests
S Mitra, Joint Director, Bureau of Economics and Statistics
Jyotsana Subba, Deputy Director, Bureau of Economics and Statistics
Purna Rai, Department of Education
AB Gurung, Adult Education Section, Department of Education
Esteemed Officials, State Finance Commission
Deepa Basnet, Deputy Secretary, Department of Land Revenue
KB Chetri, Chairman, State Bank of Sikkim
Dr TR Gyatso, Principal Director, Department of Health and Family Wefare
Dr S Paljor, Principal Director, Department of Animal Husbandry
KN Bhutia, Tourism Department
Ambika Pradhan, ADC, Mangan
Bela Cintury, Department of Health and Family Welfare
Ganga Pradhan, SDM, East
Punit Kausha, ADC, West Sikkim
HB Gurung, CDPO, Gyaltsing
x i v • A C K N O W L E D G E M E N T S

Sarda Pradhan, Counsellor, Family Counselling Centre
Tara Sampang, Department of Rural Development
BB Subba, DDO, Gyaltsing
Justice Anup Deb, Sikkim High Court
Ranendra K Purkayastha, Registrar, Sikkim High Court
In-charge, Department of Tele-communications, Gangtok
RK Ram, Deputy Director, Census of India, Gangtok
Regional Director, Botanical Survey of India, Gangtok
Abhijit Roy Manager, Small Industries Development Bank of India, Gangtok
PS Banerjee, Deputy General Manager, NABARD
Dr K Bhandari, Chief Consultant, STNM Hospital, Gangtok
KS Rawat, former Deputy Director, Department of Land Revenue
BB Gooroong, Political Adviser to the Chief Minister of Sikkim
Jigdel Densapa, former Additional Chief Secretary, Government of Sikkim
CD Rai, former Secretary to Government of Sikkim and Editor, Gangtok Times
PK Pradhan, former Chief Secretary, Government of Sikkim
Dil Kumari Bhandari, former Member of Parliament
Bhim Dahal, Member of Parliament
PT Gyamtso, Member of Parliament
RP Lama, Member, Executive Board, Sahitya Akademy New Delhi
Subhash Deepak, Editor, Wichar, Gangtok
Bijay Bantawa, Editor/Publisher, Himgiri, Gangtok
HR Bhattacharjee, formerly of Sikkim Express, Gangtok
Mandeep Lama, Gangtok
Hem Lall Bhandari, Rumtek
Kintop Bhutia, Sikkim Youth Welfare Association
BB Rai, Director, Sikkim Voluntary Health Association of India
Marzban Parekh, Managing Director, Sikkim Distilleries Ltd
IB Goel, Manager, State Bank of Sikkim, Gangtok
Narbu Tamang, State Bank of Sikkim, Gangtok
Capt CB Rai (retd), Gangtok
Tilak Pradhan, Rateypani
Nita Nirash, Gangtok
Dr CB Sunwar, Principal, Sikkim Government College, Gangtok
Dr Eklabya Sharma, In-Charge, GB Pant Institute of Himalayan Environment and Development, Gangtok
Lalit Kumar Rai, GB Pant Institute, Gangtok
Dr Jyoti Prakash Tamang, Senior Lecturer, Sikkim Government College, Gangtok
KR Chakaravarthi, Sikkim Government College, Gangtok
Lt Col KS Brar, Chief Engineer, Project Swastik
Sabina Lama, New Delhi
Professor Kalim Bahadur, Jawaharlal Nehru University New Delhi
Professor VBS Kansakar, Head, Geography Department, Tribhuvan University, Kathmandu
A C K N O W L E D G E M E N T S • x v

ST Lepcha, Deputy Conservator of Forests, Dehradun
Jyotsana Siding, Deputy Project Director, Doon Valley Watershed Project, Rishikesh
Saswati Chanda, New Delhi
Bina Laxmi Nepram, New Delhi
Tilak Thapa, Darjeeling
Arun Lama, Manager, Ging Tea Estate, Darjeeling
Gyanendra P Lama
We would also like to thank
some Villagers and Panchayat Members:
Pushpa Tamang, Aganwadi Worker
Tsering Omlok, Aganwadi Worker
Lendup Lepcha
Indra Kumar Neopaney
Ram Kumar Chhettri
La Bering Targain
Bir Bahadur Lohar
Chunki Bhutia
Dhan Kumar Rai
Aasha Golay
Dil Kumar Thapa
Guman Singh Chemjong
Dhruba Pariar
Tar Tsehring Lepcha
Phincho Sherpa
Maya Managar
Dikchhen Bhutia
Aasha Lama
Messages 4
3 Contents
x v i • A C K N O W L E D G E M E N T S


Introduction 4
3 Contents

Introduction
Human Development: Concept and relevance
Human development has been defined as ‘a process of enlarging people’s choices’. This approach to development
places people at the centre and treats them as active subjects and not passive beneficiaries. Human beings and
the expansion of their capabilities are treated as ends rather than means for sustainable growth. This concept is
one of the most important attempts to formulate alternative development theories and strategies to replace the
neo-classical ‘trickle down growth’ theory.
United Nation Development Programme’s (UNDP’s) Global Human Development Reports (HDRs), pioneered
by the late Mahbub ul Haq in 1990, introduced and carried forward the concept and messages of human
development. They have analysed crucial themes related to human development and, as advocacy documents,
have stimulated discussions. In fact, they have addressed a global and diverse audience—international and national
governments, policy makers, planners, opinion leaders, parliamentarians, media, Non-Government Organizations
(NGOs) and all the members of what is now called the ‘human development movement’.
The world-wide response to the issue of ‘human development’ has been immense in recent years. The global
development community has increasingly recognized that development policy should be centred around people’s
choices and their capabilities and, therefore, ‘human development’ should be accorded the highest priority in
public policies in order to combat poverty and deprivation.
Human Development Reports have also proposed simple composite indices such as Human Development
Index (HDI), Gender Development Index (GDI), Gender Empowerment Measure (GEM) and Human Poverty
Index (HPI) to reflect the status of human development, gender development, empowerment of women and
human poverty. These indicators go beyond both the traditional income based measures of economic growth (viz.
Gross Domestic Product (GDP), and per capita income as well as Head Count Ratio (HCR)) of poverty and include
non-income dimensions such as knowledge and longevity. With all the limitations that are intrinsic to simple
indices and averages, these indicators have helped in highlighting the message that the world’s backlog of human
deprivation needs to be removed on a priority basis if growth and development, have to be sustainable, in an era
of globalization.
The HDRs are about the well-being of people—widening of their choices, measuring deprivation, highlighting
the shortcomings of the present development strategy, areas of concern to the people and identification of new
resources and partnerships for more effective action. It suggests an alternative policy framework for developing
the much required human capabilities in the medium term.
The human development approach attributes the persistence of human deprivation despite high growth rates
during the last few decades to the lack of a political will to undertake suitable policies to ensure that growth
generates jobs, improves the literacy and health status of the poor and empowers women. This approach regards
people as the real source of wealth and emphasizes the formation of human capabilities. It envisages the expansion
of human capabilities and their extensive use. It advocates the widening of choices available to people.

x v i i i • S I K K I M H U M A N D E V E L O P M E N T R E P O R T 2 0 0 1

The HDRs have been critical about growing disparities among people. In most developing countries abject
poverty large-scale unemployment and lack of basic amenities continue to persist and grow. The socio-economic
conditions of developing countries have been adversely affected due to deteriorating terms of trade, volatile
exchange rates, mounting debt burden, asymmetric world trading order and persisting resource crunch.
The human development approach has been very emphatic in driving home the point that an increase at the
level of income is not the only objective of social progress. It should comprise a much larger basket of choices
and entitlements, including a longer and healthier life and an expansion of social and political freedom. This in
turn requires widening the scope of peoples’ participation in all spheres.
Financing human development policies has emerged as a major challenge, especially in the light of resource
constraints that face national governments and international development partners. After reviewing potential
sources of funds, the HDRs found that substantial resources could be mobilized by restructuring budgets and
resetting the priorities of international assistance.
National budgets and implementation arrangements may require further restructuring to maximize the impact
of every rupee spent. If such adjustments are made and appropriate priorities are set in order, substantial funds
can be generated from the existing level of resources available to a State. With appropriate changes in priorities
for resource allocation and innovative modalities of development action, it is argued that even the poorest country
in the world can generate enough resources for financing human development.
Taking the cue from global HDRs, more than 100 National HDRs have been prepared. India has not only
provided the pool of talent for the global HDR but has also pioneered innovative sub-national HDRs. After Madhya
Pradesh and Karnataka, the Government of Sikkim is the third in the country and the first in the East and North-East
to prepare this significant document.
Why Sikkim HDR
The Sikkim HDR advocates governance for sustainable human development as the guiding principle for State and
civil society action in Sikkim. It highlights the importance of focusing on people and their capabilities and
opportunities as the goal of development efforts. Its objectives are:
• To provide a comprehensive view of the state of human development in Sikkim, highlight critical concerns and
issues and examine emerging challenges.
• To highlight major policy interventions made by the Government of Sikkim in the arena of human development
in the State.
• To develop Human Development Index (HDI) and Gender-related Development Index (GDI) at the State and
district levels.
• To advocate a policy dialogue in recognition of the need for equity and people-centred policy focus and to
create an environment for achieving human development.
• To identify the extent of data gaps in the State.
Since this is the first HDR prepared for Sikkim, it is designed to be comprehensive in terms of sectoral coverage.
Sikkim is a pioneer hill State to prepare a HDR, which is expected to promote a deeper and a more sympathetic
understanding of the challenges and opportunities for human development action in the State. This will leverage
greater resources and partnership with national and international development partners, especially the government
and donor community. The HDR will also largely indicate the urge and effort made by the people of Sikkim in
joining the national mainstream and becoming an integral part of ‘globalization with a human face’.
An attempt is also made to provide innovative policy guidelines to initiate policies to improve the level of
human progress in the State. The main thrust of this Report is on changing mind-sets and perceptions about the
I N T R O D U C T I O N • x i x

root cause of human deprivation in the State and the designing of appropriate policy instruments. As the
distinguished public servant and journalist, of Sikkim, C.D. Rai puts it:
Mental make up is the biggest stumbling block to human development. Our people have thought that ‘governmentservice’ is the most secure area for any person, big or small, irrespective of whether he is a clerk, teacher or secretary.But, they forget, that with the increase in population and increasing educational facilities, graduates and mastersare roaming in the market as ‘educated unemployed youth’ because government jobs are saturated. Neither theseeducated unemployed youth nor their parents and guardians have developed the capacity to see job opportunitiesbeyond what the government can provide. Otherwise in this age of computer, science and information technology,will there be any dearth of opportunity, if one is prepared to do hard work? Our people, for that matter the so callededucated group, must be able to see beyond their noses and go forward to compete in every field and createopportunities for themselves and others.
Overview 4
3 Contents
x x • S I K K I M H U M A N D E V E L O P M E N T R E P O R T 2 0 0 1

Overview
Human development is defined as a process by which people are able to enlarge their choices, enhance their
capabilities and expand their freedoms. Its goal is to place people and what they value most—their aspirations,
their rights, their priorities—at the centre of development. It is with this intention of expanding opportunities for
people that the first Human Development Report for Sikkim has been prepared.
Sikkim has recorded several significant gains in human development after merging with India in 1975.
With a population of some 540,000 people (according to the Census of India, 2001), Sikkim is a landlocked State
bounded on the north and north-east by Tibet, on the east by Bhutan, on the west by Nepal and on the south by
the Darjeeling district of West Bengal. Almost 60 per cent of the State’s population is less than 24 years of age.
The State has many successes to report since 1975, when it became the twenty-second State of the Indian Union.
• The infant mortality rate dropped from 60 in 1991 to 51 in 1997.
• Literacy rates went up from 7 per cent in 1951 to almost 70 per cent in 2001.
• Close to 83 per cent of 6–17 year old children attend school.
• In 1998–99, as against the national average of 47 per cent, only 21 per cent of children below 3 years were
malnourished—the lowest among all the Indian States and Union territories.
• Per capita Net State Domestic Product more than doubled in real terms between 1980–90—rising from Rs
1,571 in 1980–1 to Rs 9,472 in 1995–6. This was 63 per cent higher than the income reported by Bihar.
• In 1995–6, Sikkim reported a per capita Net State Domestic Product of Rs 9,472.
Physical indicators of the quality of life also suggest reasonable provisioning of many basic amenities in
Sikkim. According to the National Family Health Survey-2 (NFHS-2) for 1998–9:
• Over 80 per cent of households have electricity as against 60 per cent for all India.
• Almost 85 per cent of households have drinking water that is piped or from a hand pump as against 78
per cent for India as a whole.
• Close to 73 per cent of households have a toilet or latrine facility as against 36 per cent for the whole
country. These are impressive achievements for a small State like Sikkim that confronts a set of unique
challenges.
The well being of the people of Sikkim is intimately tied to the wealth of its natural resources and the environment.
Sikkim is criss-crossed by green valleys, high peaks, rippling rivers and is home to exotic species of flora and fauna.
Covering 7,096 square kilometres, the State is 113 kilometres long and some 64 kilometres wide. Hills ranging
from 300 metres above sea level to over 7,000 metres result in a climate that varies from sub-tropical to alpine.
Sikkim displays extraordinary biological diversity. There are more than 5,000 species of angiosperms, 4,000

species of flowering plants, 450/500 species of orchids and 300 species of ferns and allies. The State also has a
rich variety of birds and animals with over 140 species of mammals, 400 species of butterflies and moths and
500/600 species of birds.
A rich variety of forests—both deciduous and coniferous—cover 82 per cent of the land in Sikkim. Deciduous
and evergreen forests are spread over the eastern and western parts of Sikkim while the north is dominated by
coniferous forests. These forests are central to people’s livelihoods and serve as the major source of food, fuel and
medicinal herbs and plants. Forests are also a major source of revenue for the government.
While many gains have been recorded in human development, there is still much ground to cover in terms of ending
human poverty and deprivations.
Sikkim reports a Human Development Index (HDI) value of 0.532 for 1998—lower than all India HDI of
0.563. However, both per capita income and the HDI value fail to capture the true vulnerability of the people,
the insecurity of the population, and the challenges for ensuring sustainable human development.
Despite the relatively high levels of per capita income, the proportion of population living below income
poverty has gone up from 36 per cent in 1987–8 to 41 per cent in 1993–4. There is, however, a large disparity in
the prevalence of income poverty between rural and urban areas. In 1993–4, for instance, only 8 per cent of the
urban population lived below the poverty line. The corresponding figure for rural areas was more than five times
higher—at 45 per cent.
There has been considerable expansion in the physical provisioning of basic social services. Much of the
provisioning of health care is by the public sector. But the health status of people needs considerable improvement.
In 1998–9, 61 per cent of women were reported suffering from anaemia. The national average is 52 per cent.
Similarly, 77 per cent of children below 3 years were found to be anaemic. However, a small population size
dispersed over hilly tracts makes the provisioning of such services very difficult. As a result, the reach of health
services remains limited. According to NFHS-2, in 1998–9, for instance:
• Only 47 per cent of children between 12–23 months were fully immunized. The proportion is almost 60
per cent in Mizoram.
• Only 32 per cent of births were delivered in a medical institution.
• Only 35 per cent of deliveries were assisted by a health professional. The corresponding figure for Manipur
was 54 per cent.
Progress on the industrial front has been constrained by many factors including the lack of appropriate infrastructure
and trained manpower.
The basic handicaps and constraints are:
• Lack of knowledge of the entrepreneur regarding manufacturing activities.
• Lack of raw material.
• The sickness syndrome.
• Absence of proper manpower.
• Poor marketing network.
• Inflexible land laws and lack of enabling laws.
• Underdeveloped infrastructure facilities.
• Shortage of credit and finance.
The favourable social and political climate and substantial public investment in physical infrastructure (roads,
connectivity and power) will help in making Sikkim a more attractive investment destination. New partnerships
with the private sector have in fact been recently explored by the State Government.
2 • S I K K I M H U M A N D E V E L O P M E N T R E P O R T 2 0 0 1

The benefits of growth and human development in Sikkim have not been equitably distributed.
Progress has been uneven in Sikkim. Gangtok, the capital city, has benefited the most from the rapid expansion
in economic and social opportunities. Equal gains are yet to reach many of the districts and especially the smaller
and more remote villages. For instance:
• In 1991, East district reported a literacy rate of 65.1 per cent in the age group 7+ whereas West district
reported a rate of only 45.6 per cent;
• In 1991, rural female literacy in West district was 34.8 per cent whereas urban male literacy in East district
was 85.7 per cent.
Gangtok, despite being more affluent, is not without its set of human development concerns. The quality of
life is constrained by severe problems of over-crowding, congestion, and pollution.
Women in Sikkim enjoy many freedoms and have recorded significant gains in human development. However, like
in many parts of the world, they still live in an unequal world.
Women enjoy relatively greater freedoms than in other parts of the country. According to the Census of India
1991, close to 38 per cent of women participated in the workforce as against the national average of 20 per cent.
According to NFHS-2 for 1998–9:
• The median age at marriage is 19.8 years—more than 3 years higher than the national average of 16.4
years.
• Some 79 per cent of women have access to money as against the national average of 60 per cent and 28
per cent in Nagaland.
• Married women (42 per cent), do not need permission to visit friends and relatives, the proportion is 24
per cent for India as a whole.
• Only 11 per cent of ever-married women have been beaten or physically mistreated since the age of 15
years—the lowest proportion in the North-East. The proportion for all India is 21 per cent.
Another striking feature of Sikkim is the absence of gender differentials along many indicators of human
development. In 1998–9, for instance, 83.2 per cent of boys and 82.6 per cent of girls between 6–17 years attended
school.
Nevertheless, women still face unequal opportunities in a variety of spheres. For instance:
• Women still remain largely involved in traditional but unpaid tasks of community life.
• Girls are typically denied the opportunity to pursue higher education since it often involves moving out
of the village, district and even the State.
• Socio-cultural and family considerations often deny women the opportunity to pursue employment outside
the State.
Although the economy is dependent on agriculture, food production has declined between 1996–7 and 1997–8 and
the technology used is often obsolete.
The State remains extremely dependent on agriculture which, for instance, accounts for nearly 40 per cent of
Gross Domestic Product (GDP) at current prices. In 1991, 65.6 per cent of the main workers were dependent on
agriculture, either as cultivator or as agricultural labourers.
Food production has been declining in recent years. Agricultural productivity is stagnant, dependency on
rainfed agriculture remains high, shifting cultivation is still prevalent on a large scale, land holdings are small and
dispersed and production technology is outdated in most parts.
I N T R O D U C T I O N • 3

However, there is a great deal of scope for commercial crops—cardamom, oranges and flowers, but the full
potential is yet to be tapped. The potential of agriculture to absorb young people is limited.
Sikkim has recorded impressive growth in its GDP. The challenge however is to protect social sector spending—and
in fact to increase both allocations and efficiency of public expenditures particularly on health and education.
There has been an impressive growth in incomes in Sikkim in recent years.
Effective policies have been put in place to ensure that the benefits of growth reach the people and they are
able to secure many of their basic social and economic rights. Between 1988–91, the government consciously
stepped up investments in the social sectors, particularly those related to health and education.
Sikkim has to confront several realities before it can realize the goal of ensuring sustainable human development.
Many features of Sikkim make the formulation of an appropriate development strategy an extremely complex
task:
• Small size.
• Scarcity of land based resources.
• Ecological fragility.
• High costs of infrastructure.
• Limited availability of skilled personnel.
However, Sikkim’s achievements since its merger with the Indian Union in 1975, have proved the potential of the
State.
Governance for sustainable human development is the road ahead for Sikkim.
The State has a traditional culture of collective decision making and dispute resolution. Nevertheless this
community participation needs to be strengthened in order to ensure the success of the development projects—
through all their phases—as they have an impact on the environment and therefore on the lives of the people.
Community participation in development projects will also influence structural reforms positively and help
improve the quality of life in the State.
Sikkim has the potential to become the first ‘poverty free’ State in India by assuring every citizen social justice,
equality and a decent standard of living. To achieve this, concerted public action is needed to focus on ensuring
balanced development, enlarging employment opportunities, safeguarding environmental resources, and putting in
place a responsive system of governance.
The young demographic profile of the State poses a great challenge to the State Government. Employment
opportunities have to be enlarged. The service sector, particularly health and education, provide a huge scope for
employment generation. The eco-tourism sector could be strengthened further to absorb the workforce potential
of the State. This would also be a step towards the elimination of poverty. At the same time, however, attention
has to be paid to train the youth adequately. The State Government has taken several steps to ensure that
development in the State is sustainable. Growth does not have to imply the destruction of natural resources.
Chapter 1 4
3 Contents
4 • S I K K I M H U M A N D E V E L O P M E N T R E P O R T 2 0 0 1

Population, Povertyand Planning
Population, Povertyand Planning


Chapter
1��
Population, Poverty and Planning
Introduction
Sikkim, with a total area of 7,096 sq km, constitutes 0.22 per cent of the total geographical area of India. According
to the regional divisions defined by the Census of India, the State is one of the four micro regions of the
north-eastern Himalayas (the others being Darjeeling and Dooars areas of West Bengal, and Arunachal Pradesh).
The State is divided into four districts—South, North, East and West (Registrar General of India, 1989).
Completely landlocked and criss-crossed by green valleys, high peaks, and rippling rivers, decorated by a
spectacular array of the most exotic and colourful orchids, Sikkim is referred to as nye-ma-el (heaven) by the
Lepchas, which means ‘new palace’ in Nepali, and denzong (land of rice) by the Bhutias. It lies in the north-eastern
Himalayas, between 27°04′46′′ to 28°07′48′′ North latitude and 80°00′58′′ to 88°55′25′′ East longitude. It is
bound on the north by China (Tibet plateau), on the east by Chumbi Valley of Tibet and Bhutan, on the west by
Nepal and on the south by Darjeeling district of West Bengal.
The State, being part of the Inner Himalayan mountain ranges, has elevations ranging from 300 to 7000 metres
above Mean Sea Level (MSL). Nearly two-thirds of its territory consists of very high mountains, which are
perpetually covered with snow from which glaciers like Talung and Zemu descend. These mountains, including
the third highest mountain in the world—Kanchenjunga (8,598 m)—are located in northwest Sikkim (Waddel,
1899).
The green cover of the State is critical for sustaining livelihoods in agriculture, animal husbandry, and tourism.
Forest resources have catered to the requirements of local communities and tourism. Therefore, investment in the
forestry sector is quite crucial, particularly when this provides sustainability to the general physical environment.
The geographical and climatic characteristics of the State have deeply influenced its economic and social
development. Human settlements and economic activities have been built around local ecology and terrain. The
impact of climatic change due to global warming and other factors has to be considered. This is also relevant in
the context of natural disasters that are occurring with increasing frequency in recent years.
Environmental preservation, therefore, takes a high priority for sustainable human development in Sikkim.
Environment preservation might also contribute to the preservation of traditional values and the promotion of
eco-tourism. So far, however, tourism, which has steadily increased its contribution to the local economy by
generating income and employment, has had an adverse impact on the fragile mountain environment. For instance,
the opening up of the Changu Lake to an increasing number of tourists has strained the capacity of this pristine

resort. The shops, vehicles, garbage and animals around the lake certainly do not go well with the carrying capacity
of the lake site.
Thus, the economy-environment dualism is vital in Sikkim. Issues related to displacement, rehabilitation, and
resettlement, which are too often acute but silent, have to be addressed. The national debate on development and
displacement has been quite influential in creating an environmental awareness and civil society action in Sikkim.
This has helped in focusing the need to involve civil society in the designing of projects. However, more needs to
be done in this direction.
Demographic profile
According to the 2001 Census of India, the population of Sikkim was 540,493, of which 46.7 per cent were women
(Table A1). An increase of 33 per cent was registered in the decade 1991–2001, while over the century 1891–1991,
an increase of more than 12 times was recorded (Box 1.1). However, the population of Sikkim, continues to
account, even in 2001, for only 0.05 per cent of the country’s population.
The Scheduled Tribe (ST) population (Lepcha and Bhutia including Chumbipa, Dopthapa, Dukpa, Kagatey,
Sherpa, Tibetan, Tromopa and Yolmo) constitutes over 22 per cent of the population, whereas Scheduled Caste
(SC) population (Kami, Damai, Lobar, Sarki and Majhi) constitutes only 5.93 per cent (Box 1.2). Following the
trend of all States in India, except Kerala and Uttar Pradesh, the proportion of SC population increased between
1981 and 1991. In contrast, the pattern of change for ST population, which varied widely across the country, was
one of decline. The backward castes (Tamang, Gurung, Rai, Limbu, Sunwar) also constitute a significant section
of the population.
Box 1.1—Variations in population growth
The decadal population growth rate of Sikkim, according to the Census data, has been inconsistent as
compared to that of the country as a whole.
The highest growth rate was recorded between 1901 and 1911, while a decline (of 6,199 persons) was recorded
in the following decade (1911–21). This decline has been partly attributed to deaths resulting from the great
influenza epidemic of 1917 and partly to the death of Gurkha soldiers from Sikkim in World War I. Since
then, for half a century (from 1921 to 1971), population growth was steady but low. Between 1971–81, there
was a substantial increase (at a rate of 5.07 per cent per annum), especially in the urban areas. This could
be attributed to the merger of Sikkim with the Indian Union and the subsequent in-migration triggered off
by large-scale development activities in the State. In the following decade (1981–91), population continued
to grow although at a much lower rate (an average of 2.85 per cent per annum), whereas in 1991–2001, the
rate of growth was higher, at 3.29 per cent.
Population growth rates varied across districts. The North district recorded the highest decennial increase of
almost 104 per cent in 1971–81, and the lowest increase of 18 per cent during 1981–91. Except the West
district, for which the high growth rate is attributed to the opening of this district, mainly on account of
heavy public investments on infrastructure, all districts recorded a sharp fall in the decadal growth rate
between 1981 and 1991 (Table A2).
6 • S I K K I M H U M A N D E V E L O P M E N T R E P O R T 2 0 0 1

The distribution of population in the State, which has three major communities—the Lepchas, the Bhutias
and the Nepali, experienced wide variations (Box 1.3). In terms of religious beliefs, the population of Sikkim is
predominantly Hindu (68 per cent). Buddhists are quite a large community (27 per cent), and Christians represent
3 per cent of the total population.
Box 1.2—Majhi: The fisherfolk of Sikkim
The Majhis (boatmen), who are declared as Scheduled Castes in the State, abound in the Majhi gaon near
Jorethang in south Sikkim and Majhitar near Rangpo in the east. Some of the oldest living families now live
near Pedong and Algarah (in Darjeeling district) near the ruins and remnants of old forts. Traditionally they
lived in caves, river beds, and near precipice or madeyaksha, or in huts of bamboo and wood. Though they
have their own dialect Majhi, they speak Nepali.
There are legends associated with the Majhis. It is believed that Majhis emerged when boatmen had to ply
men to earth through a vast mass of water. Even today if a boat capsizes, it is usually the Majhis who take
out their diving equipment and rescue the victims.
The Majhis gradually started working as agricultural labourers with Lepchas and Sarkis. While there are still
quite a few of them who make a living as agricultural labourers, wood workers, milk sellers and labourers,
many of them own and control land. Majhis have adopted modern occupations such as teaching, politics,
and electric works. They also work in nearby distilleries and other plants. Some of them carry sand from the
river bed, while others contribute to the development of tourism by taking to rafting near Burdang, even at
the height of the monsoons. To conserve and promote the traditional profession of majhis, the government
has developed fish ponds. Thus, many of them own fish ponds.
The Majhis worship the river god, the moon god and lord Shiva. They follow the Hindu calendar with 365
days, months varying from 29 to 32 days. They have their own thankari, the exorcist. Besides death, the most
important customs and rites are associated with birth and marriage. The mother is kept in seclusion and
puja is performed for her. Then there is bhaat khuwai (first offer of grains), and nauran (naming ceremony).
Marriages by elopement co-exist with arranged marriages. Marriage by elopement, however, is later accepted
and celebrated by the family and community; openly, depending upon the family’s economic condition.
Families are mainly patrilineal and property is always inherited by the eldest male Majhi. Only in exceptional
cases does a female member inherit property.
Box 1.3—Demographic constituents
According to The Gazetteer of Sikhim (1891), Nepalis with 56 per cent (including Murmi) constituted a
majority of the population followed by the Lepchas (19 per cent) and Bhutias (16 per cent). There were
other constituents like the Khambus and slaves. More than a hundred years later, the share of Lepcha
population has gone down to 14 per cent whereas that of the Nepalis climbed to almost 70 per cent with
the Bhutias constituting more or less the same proportion.
All these three ethnic groups have their own language, culture and social practices, and have a strong
socio-cultural bond among themselves (Risley, 1894).
P O P U L A T I O N , P O V E R T Y A N D P L A N N I N G • 7

In 1991, the total number of households in Sikkim was 76,329 (Table A3). These households were distributed
in 411 revenue blocks, 447 villages and 8 towns in the State (Table A4). Of the total households in the State, over
90 per cent resided in the rural areas thereby making Sikkim predominantly a rural economy. The average household
size was 5.3. The highest household size of 5.5 was recorded in the South district and the lowest of 4.7 was in
the North district.
The North district, comprising 60 per cent of the total geographical area, accounted for hardly 8 per cent of
the total population (Table 1.1). Despite the fact that this district witnessed the highest decadal growth rate during
1971–81, its density, with 7 persons per sq km in 1991, was insignificant. The majority of the North district
population (55 per cent) belonged to STs, while only 4 per cent belonged to SCs. It may be noted that this district
had the highest proportion of ST to the total population in the State.
TABLE 1.1—DISTRICTS’ ADMINISTRATIVE SHARE IN STATE POPULATION AND GEOGRAPHICAL PROFILE (1991)
Districts Revenue blocks Area (Sq km) Per cent Per cent Population Density
Rural Urban (No per sq km)
1 North 10.95 59.55 7.69 97.43 2.57 7
2 East 29.20 13.44 43.90 82.14 17.86 187
3 South 32.85 10.57 24.26 97.39 2.61 131
4 West 27.01 16.43 24.15 98.21 1.79 84
5 Total 411 7,096 406,457 90.89 9.10 57
Source: Registrar General of India (1991), Sikkim: District Census Handbook, Part XII—A & B, Series 22, Directorate of CensusOperations, Sikkim, Government of India.
The East district, where the State capital Gangtok is located, is the most heavily populated district. With less
than 14 per cent of the geographical area of the State, in 1991, this district accounted for 44 per cent of the
population, implying a density of 187 persons per sq km. Its share of SC to the total population (7 per cent) was
the highest in the State, followed closely by that of the South district (6 per cent). The North district, in contrast,
had the lowest share of SC (4 per cent) to the total population and the highest share of ST (55 per cent) to total
population. In terms of proportion of ST (21 per cent), the East district ranked in fact second (Table 1.2).
TABLE 1.2—DISTRICT-WISE DISTRIBUTION OF SCHEDULED CASTE & SCHEDULED TRIBE POPULATION (1991)
District % of SC to Total Population % of ST to Total Population
North 4.00 55
East 7.00 21
South 6.00 17
West 5.00 20
Sikkim 24,084 (5.93) 90,907 (22)
Source: Registrar General of India (1991), Census of India, 1991, Government of India.
In the last 20 years, Sikkim has registered a steady decline in both birth rates and death rates at a pace faster
than that of the country as a whole (Figs. 1.1 and 1.2). In fact, the crude death rate of Sikkim is one of the lowest
among the States and Union Territories in India.
8 • S I K K I M H U M A N D E V E L O P M E N T R E P O R T 2 0 0 1

FIG. 1.1—BIRTH RATES: SIKKIM AND INDIA (1981–97)
Source: Government of Sikkim, Sikkim in Brief, 1998, Bureau of Economics and Statistics, Gangtok, June 1999.
FIG. 1.2—DEATH RATES: SIKKIM AND INDIA (1981–97)
Source: Government of Sikkim, Sikkim in Brief, 1998, Bureau of Economics and Statistics, Gangtok, June 1999.
Infant Mortality Rates (IMRs) in Sikkim have always been lower than those for the nation (Fig. 1.3). In the
late 1980s a sharp decline has been recorded (moving from 77 per thousand in 1988–90 to 37 per thousand in
1992–4). However, since 1993–5, there has been an increase in IMR (moving from 47 per thousand to 51 per
thousand), that is indeed disturbing.
Rat
e pe
r '00
0
3133.9 33.1 32.9
22.5
29.5
22.5
28.3
19.8
27.2
0
5
10
15
20
25
30
35
1981 1985 1991 1995 1997
Year
SikkimIndia
8.9
12.5
10.711.8
7.5
9.8
6.9
9
6.5
8.9
0
2
4
6
8
10
12
14
Rat
e pe
r '00
0
1981 1985 1991 1995 1997
Year
Sikkim
India
P O P U L A T I O N , P O V E R T Y A N D P L A N N I N G • 9

FIG. 1.3—THREE YEAR MOVING AVERAGE OF INFANT MORTALITY RATE
(PER THOUSAND)
Source: Government of Sikkim, Sikkim in Brief, 1998, Bureau of Economics and Statistics, Gangtok, June 1999.
Population projections indicate that the annual growth rate will continue to be almost double that of the
national average during the period from 1991 to 2016. As per these projections, the population of Sikkim would
be 739,000 by 2016 (Table 1.3). This high rate of growth points to the need for interventions in the area of
population management in the State.
TABLE 1.3—PROJECTED POPULATION 1996–2016
Year Total Male Female Urban population (%)
1996 485,000 257,000 229,000 10.30
2001 570,000 296,000 274,000 11.64
2006 654,000 335,000 318,000 13.12
2011 714,000 363,000 351,000 14.76
2016 739,000 373,000 366,000 16.56
Source: Registrar General of India (1991), State Profile 1991—India, Census of India 1991, Government of India.
A positive feature, however, is that Sikkim has a very young demographic profile, with only 4.5 per cent of
its population in the 60+ age group (Table A5). Population in the 0–14 age cohort is 39 per cent of the total
population, while 60 per cent of the total population is below 24 years. Thus, State policies should focus more
on the youth who, if properly motivated and trained, could be of tremendous value to the State building process.
Trends in sex ratio
An important feature of the demographic trends in Sikkim is that till 2001 the sex ratio was much lower than the
national average. This could have been caused, among other factors, by in-migration of a large number of male
workers (Box 1.4).
71727488
80
51453746
71
10
30
50
70
90
1988–90 1990–92 1992–94 1994–96 1996–98
Year
Rat
e pe
r '00
0
Sikkim
India
10 • S I K K I M H U M A N D E V E L O P M E N T R E P O R T 2 0 0 1

Between 1991 and 2001 the sex ratio dropped in Sikkim from 878 to 875, the lowest in relation to the other
north-eastern States. In 1991, there were 878 women per 1000 men, as compared to 927 at the national level (Fig.
1.4). The ratio was even lower in urban areas, being as low as 581 in Mangan in the North and 620 in Namchi in
the South (Table 1.4). In rural areas it was relatively higher, being as high as 928 in Soreng in the West district. The
North district recorded the lowest female-male ratio in the State, being 836 in rural areas and 581 in urban areas. It
also ranked second, the East district ranking first (948), in terms of lowest sex ratio in the age group 0–6 years (960).
TABLE 1.4-SEX RATIO IN RURAL AND TOWN AREAS OF SIKKIM (1991) (FEMALES PER 1000 MALES)
Districts Rural Urban
North 836 581Chungthang 782Mangan (HQ) 852 581
East 883 759Gangtok (HQ) 875 764Pakyong 901Rangpo 778Singtam 712
South 898 693Namchi (HQ) 914 620Ravong 872 –Jorethang – 719
West 919 760Gyalshing 910 626Soreng (HQ) 928Nayabazar 866
Sikkim 892 750
Note: HQ: District Headquarter.Source: Sikkim: Registrar General of India (1991), District Census Handbook, Part XII—A & B, Series-22, pp. 42–3, Directorate of
Census Operations, Sikkim, Government of India.
Box 1.4—Migration into Sikkim
In-migration to Sikkim became more conspicuous after 1975, when Sikkim became a constituent State ofIndia and large amounts of resources were allocated for developmental purposes.
According to the Census data on migration, which primarily covers migration by place of (i) birth and(ii) last residence, between 1971 and 1981 Sikkim recorded a very high level of in-migration (35 per cent).By 1991 the percentage of migrants to the State decreased in both categories, moving from 19 to 13 per centby place of birth, and from 16 to 9 per cent by place of last residence. The proportion of male in-migrantshas always been higher than that of women, although between 1981 and 1991 a decline was recorded (movingfrom 61 per cent in 1981 to 57 per cent in 1991) (Table A6).
An analysis of the origin of migrants in the ‘by birth’ category reveals that while there was a steady declinein the proportion of in-migrants from abroad (moving from over 46 per cent in 1971, to 43 per cent in 1981and 35 per cent in 1991), there was an increase in the proportion of in-migrants from within the country(moving from 54 per cent to 65 per cent between 1971 and 1991). Thus, by 1991, the percentage of in-migrantsfrom within India was higher than that of in-migrants from abroad.
P O P U L A T I O N , P O V E R T Y A N D P L A N N I N G • 11

FIG. 1.4—SIKKIM AND INDIA: DECENNIAL SEX RATIO (1901–2001)
Source: Government of Sikkim, Sikkim in Brief, 1998, Bureau of Economics and Statistics, Gangtok, June 1999.
Interestingly, the female population in the age group 0–29 years was relatively higher than that of the male.
This led to a much higher sex ratio (over 90 per cent) for this group. The sex ratio was substantially lower for the
30+ age group, dropping to 655/1000 for the 55–59 age group. It again improved steadily for the 60–64 age
group, and was as high as 86 per cent for the 80+ age group (Table 1.5). The steady improvement in the sex ratio
in the 60+ age group points to the fact that women who survive the 30–59 years mortality zone tend to have a
similar life span as that of men.
TABLE 1.5—DISTRIBUTION OF SEX RATIO BY AGE GROUP
Age Group F/M Ratio (in %)
0–4 96.45
5–9 98.34
10–14 95.03
15–19 92.23
20–24 90.14
25–29 91.06
30–34 83.74
35–39 75.46
40–44 72.63
45–49 70.21
50–54 66.23
55–59 65.45
60–64 72.41
904
863
835
941
930
934
907
878
916
951
970
967
920
946
927
972
964
955
950
945
750 800 850 900 950 1000
1901191119211931194119511961197119811991
Year
Rate per '000
India
Sikkim
Continued
1 2 • S I K K I M H U M A N D E V E L O P M E N T R E P O R T 2 0 0 1

Age Group F/M Ratio (in %)
65–69 74.70
70–74 72.47
75–79 77.89
80+ 85.65
Age not stated 83.78
Total 87.80
Source: Registrar General of India (1991), Census of India, 1991, Government of India.
One possible reason behind these trends in sex ratios according to age groups could be that mortality rate
among women in the 30–59 age group was relatively higher than in the 20–29 and 60+ age groups.
The highest decline in the ratio was recorded during 1971–81, which coincides with the high influx of migrant
workers. The overwhelming proportion of male population among the migrants is also corroborated by the fact
that it constituted as high as 61.54 per cent, 60.88 per cent and 56.88 per cent of the total migrants in 1971, 1981
and 1991 respectively.
Poverty and livelihoods
The persistence of poverty in this hill State is in stark contrast to its relatively high achievement in the social sectors
as compared to the national average. However, this could be explained by considering that Sikkim remained
marginalized from the development activities that characterized mainstream India. Prior to its merger with India,
its very political economy did not, in fact, permit Sikkim to entertain development interventions of a democratic
variety. Only in the last 25 years, the philosophy of growth with equity and self-reliance in the planned
development of the State has become important.
TABLE 1.6—NUMBER AND PERCENTAGE OF POPULATION BELOW POVERTY LINE FROM 1973 TO 1994
(MODIFIED EXPERT GROUP)
RURAL URBAN COMBINED
Years No. of persons(million)
% of total No. of persons(million)
% of total No. of persons(million)
% of total
1973–74 0.11 52.67 0.010 36.92 0.118 50.86
1977–78 0.14 59.82 0.013 32.71 0.154 55.69
1983 0.12 42.60 0.010 21.73 0.134 39.71
1987–88 0.13 39.35 0.004 9.94 0.135 36.00
1993–94 0.18 45.01 0.003 7.73 0.184 41.43
Note: Poverty ratio of Assam is used for Sikkim.
According to the Planning Commission estimates, based on the Expert Group Recommendations, except in
1993–9 the percentage of people below the poverty line in Sikkim has continued to be lower than the national
average except in 1993–4. Though, Sikkim recorded a decline in the incidence of poverty in the decade 1977–87,
it suddenly increased in 1993–4 moving from 36 per cent in 1987–8 to 41.43 in 1993–4. While the decrease in
urban poverty has been constant, rural poverty decreases have alternated with increases (Table 1.6). In 1993–4,
(Table 2.5 continued)
P O P U L A T I O N , P O V E R T Y A N D P L A N N I N G • 1 3

45.01 per cent of rural population was below the poverty line, while in urban areas only 7.73 per cent of the
population was below the poverty line.
The overall trend in poverty HCR for Sikkim, which stagnates and even records a small increase between
1987–8 and 1993–4, does not seem to indicate any significant impact of government programmes to reduce
income poverty levels. However, given the ongoing debate on the reliability of income poverty measures, especially
for small hill-states and in the North-East, it would be difficult to draw meaningful conclusions. Nationally uniform
methodologies and baskets of consumption, in fact, may miss out on the dynamics of deprivation in the hill
regions, which have their own unique features. Further, in Sikkim, as part of the northeastern States, the poverty
ratios of Assam are used as the base line.
According to an innovative use of raw data on household expenditure from the National Sample Survey (NSS)
43rd and 50th rounds, poverty estimates based on six possible methodologies have been calculated for all Indian
States (Box 1.5).
It is interesting to note that according to those, also for the period 1987–8 and 1993–4, the HCR poverty
Box 1.5—An array of poverty estimates
Dubey and Gangopadhyay (1998), have provided poverty estimates for all Indian States using six possiblemethodologies. The calculations are on the basis of raw data on household expenditure from the NSS 43rdand 50th rounds. Income data was not used because:
• It is not reliable at the household level and not available at the regional level.
• After correcting for prices, income measures the potential consumption of the household or the individual,while expenditure-based poverty estimates relate more closely to the actual consumption of the individualor household.
The criteria of physical contiguity and similar profiles, as indicated by economic and demographic parameters,has been used in assigning Poverty lines to States like Sikkim, which were not among the 20 States thatfollowed two alternative tracks based on minimum normative food basket and the calorific norm. Thus,Dubey and Gangopadhyaya have used the price level of rural Manipur and urban Meghalaya to computethe poverty figures of Sikkim.
The approaches to poverty HCR computation are:
1. OPL: Poverty line based on the official norm and updated using disaggregated price adjustmentsuggested by Minhas et al (1988).
2. EOPL: Poverty line based on the official norm and updated using price adjustment suggested by ExpertGroup (1993).
3. APL: Poverty line based on the alternative norm and updated using disaggregated price adjustmentsuggested by Minhas et al (1988).
4. AIOPL: All India OPL used for all the States/regions.
5. AIEOPL: All India EOPL used for all the States/regions.
6. AIAPL: All India APL used for all the States/regions.
The advantage of estimating poverty based on this array of approaches is that it allows the reader or user ofthe poverty data to select the most suitable approach, based on her/his requirements. This set of povertyfigures is an innovation, based on the principle of choice, that needs to be sustained for further rounds ofpoverty surveys.
1 4 • S I K K I M H U M A N D E V E L O P M E N T R E P O R T 2 0 0 1

trends of Sikkim do conform to the national trend of a secular decline. However, the range of decline varies
according to the approach used. Between 1987–8 and 1993–4, the highest reduction was recorded using the AIAPL
(moving from 26.70 per cent to 10.68 per cent), while the lowest reduction was recorded using the APL approach
(moving from 26.09 per cent to 25.26 per cent). Further, the AIAPL approach recorded the most spectacular decline
in urban poverty (from 26.89 per cent to 1.63 per cent), and the AIOPL approach recorded the highest reduction
in rural poverty (from 39.67 per cent to 24.45 per cent). Clearly, depending on the choice of approach, the
evaluation of poverty eradication in Sikkim can range from the average to the spectacular.
Based on the norms and assessment format devised by the Ministry of Rural Development, Government of
India, Sikkim’s Department of Rural Development has also estimated the percentage of families below the poverty
line through a Below Poverty Line (BPL) Survey. Taking a norm of Rs 11,000 per annum per family as the threshold
level, the State Bureau of Economics and Statistics estimated that 71 per cent of the total families were still below
the poverty line in 1995. These high estimates of the BPL Surveys have been criticized both on grounds of
methodology and non-sampling error. In eligibility surveys, in fact, it is difficult to exclude those who want to be
included as potential beneficiaries.
The State Bureau also attempted to estimate the number of people living below the poverty line by adopting
the calorie intake method and expenditure method as followed by the Planning Commission. The Ninth Five Year
Plan estimated that approximately 57 per cent of the rural and 25 per cent of the urban families are living below
the poverty line in Sikkim.
Clearly, there is further scope for improving poverty estimates for Sikkim. The Government of Sikkim has
recently set up a task force to carry out a comprehensive poverty survey.
In the absence of reliable income distribution data, one can roughly check the equality/inequality of income
distribution by checking indices like per capita ranking, per capita income growth rate and poverty estimates.
In the case of Sikkim, though the per capita ranking has been going up over the years, its poverty ranking has
sharply gone down. Among the 25 Indian States, in 1983–4 Sikkim ranked 12 both in terms of highes t per capita
income and HCR (Table 1.7). By 1993–4 the State was able to rank 10 in terms of per capita income, but its
ranking vis-à-vis poverty was extremely low, 4, indicating a sharp increase in poverty in the State. The incidence
of poverty in Sikkim in 1993–4 was in fact the highest of all the north-eastern States, and was only better than
Bihar, Orissa and West Bengal.
TABLE 1.7—RANKING OF THE HILL STATES (OUT OF 25 STATES) IN TERMS OF PER CAPITA NET STATE
DOMESTIC PRODUCT (AT CURRENT PRICE) AND POVERTY
States 1983–84 1987–88 1993–94
Per Capita Rank Poverty Rank Per Capita Rank Poverty Rank Per Capita Rank Poverty Rank
ArunachalPradesh 6 8 8 8 7 7
Assam 19 9 19 9 19 5Himachal Pradesh 8 25 15 23 14 15Manipur 16 16 12 17 18 13
Meghalaya 18 14 16 14 17 9Mizoram 22 17 6 18 11 17Nagaland 9 13 10 13 9 9
Sikkim 12 12 7 10 10 4Tripura 24 11 22 11 24 8
Source: Compiled by the author.Notes: (a) Per capita income rank is in the ascending order, i.e. Arunachal Pradesh’s per capita income was the 6th highest in the
country in 1983–4; (b) Poverty ranking is on the basis of descending order. The State with the highest poverty level being ranked 25.
P O P U L A T I O N , P O V E R T Y A N D P L A N N I N G • 1 5

This can be interpreted in many ways:
• Firstly, the high per capita income vis-à-vis a very high poverty status implies that income distribution is
very skewed in Sikkim. The coexistence of extremely affluent segments with the astonishingly poor over-
whelming majority has been common to many States in the North-East.
• Secondly, since most of the poverty-stricken people are concentrated in rural areas, the urban-rural gap, in
terms of both distribution of income and asset creation, could emerge in a very precarious manner. In the
long run, this may go against environmental security and socio-economic sustainability of the State.
• Thirdly, the syndrome of income concentration indicates a deviation in the fundamental principle of
objective governance and management of the economy wherein the guiding philosophy has been to
distribute national wealth across the State in an increasingly equitable manner.
In the light of the need to create and sustain livelihood opportunities, it may be useful to examine trends in
workforce composition in the State. According to the Census data, between 1981 and 1991 the absolute number
of workers increased from 153,000 to 169,000, while the percentage of total workers to the total population
decreased from 48.4 to 41.7, which is among the highest levels of decline in India. The percentage of non-workers
to total population recorded an increase of 6.7 percentage points. Work opportunities in Sikkim, therefore, seem
to be precarious. This has an adverse impact on women, who in 1991, represented nearly 38 per cent of the
workforce, as against the national average of 20 per cent.
Promotion of employment, as a strategy against poverty, is a goal to which the Government of Sikkim attaches
high importance, as also reflected in the Annual Plan 2000–1. Its main aim, in fact, is strengthening the key sectors
of the economy, which would progressively reduce unemployment, alleviate poverty and improve the quality of
life of the people, particularly in rural and backward areas.
It is essential to re-engineer state strategies and plan priorities accordingly, with a strong focus on building
capabilities, improving survival rates, and harnessing the human development potential of the youth. This can be
accomplished through strengthening the role of women in governance, and local mechanisms of accountability
and transparency; which can make plan outlays and civil society action more effective.
Planning: Structural shift, allocative prudence and future priorities
The Planning process dates back to 1954, when the concept of planned development was initiated. In the first Seven
Year Plan (1954–60) and the two Five Year Plans (1961–6 and 1966–71), which were financed by the Government
of India, planned development was outside the revenue-expenditure processes of the State budget (Box 1.6).
Box 1.6—Planning philosophy
The Fifth Five Year Plan Document (1976–7 to 1980–1—which was Sikkim’s first post-merger plan period)
stated that:
Sikkim has entered upon an era of intensive development after the historic constitutional change of April,1975, through which the State joined the mainstream of national life, becoming the 22nd State of the IndianUnion. Switch-over from a monarchical system to democratic government has naturally generated greatenthusiasm, and rising expectations in the people of the State. The back-log of development that has to bemade up in order to reach the level of other similarly placed States in the Union has rendered the task ofplanned development extremely difficult and challenging but at the same time an exciting adventure . . .Nevertheless the rural population of Sikkim, who have fought bravely for the changing of the old order andwho have sacrificed in the past, have to be provided at least the national minimum needs.
1 6 • S I K K I M H U M A N D E V E L O P M E N T R E P O R T 2 0 0 1

In the 1960s, the hill areas of India were divided in two categories: areas which are co-terminus with the
boundaries of the State or Union Territory (i.e., hill states and union territories, also called Special Category States);
and areas which form part of a State (Designated Hill Areas) and are covered under the Hill Area Development
Programme (HADP).1 According to this classification, Sikkim is a Special Category State. Central assistance for
its development plans is pre-empted from the divisible pool before making allocations from it to the other States
categorized as ‘non-Special Category States’. Central assistance is also given on a liberal basis with 90 per cent as
grant and 10 per cent as loan to Sikkim as compared to 30 per cent as grant and 70 per cent as loan to other
non-Special Category States.
Over the last nine Five Year Plans, there has been a steady increase in the total plan outlay of Sikkim. In the
Ninth Five Year Plan, as compared to Rs 32.4 million in the First Plan, it increased to Rs 16 billion (about 500
fold). This is also almost 122 per cent increase over the Eighth Plan outlay of Rs 7.2 billion. However, people’s
perception is that this has not translated into qualitative services (Box 1.7).
Considering sectoral and sub-sectoral plan allocations in Sikkim from First to the Ninth Plan, some distinct
trends can be drawn (Table 1.8). Agriculture and allied activities, which have been the mainstay of the majority
of the people, have received on an average 20 per cent of the total plan outlay upto the Seventh Plan. Since then
this crucial sector’s share has shown a tendency to decline, being as low as 13.6 per cent in the Eighth Plan. Power
sector has a share of almost 20 per cent—which is double of what it used to be during the entire plan period
since 1954. The other vital infrastructural area of roads and bridges has fallen to less than 10 per cent. Further,
though some social sectors, e.g. education, have improved their share, allocation to health has been low. The
expenditure on social services amounted to 2.0384 billion in 1999–2000, which represented 13.19 per cent of
the total revenue expenditure. Industry and tourism have also obtained low plan resources.
Structural change, generally reflected in the shift from the primary to the secondary sector, is virtually absent
in Sikkim. Industries, in fact, are still a low priority item in Sikkim’s plan process. The share of the primary sector
Box 1.7—Maintenance functions and non-plan expenditure
‘Mancheko bani bigriyo, hami sabai kuro tyasai paos bhanchao’ (People’s habits have been spoilt, we want all
the things free of cost), this is what an enlightened farmer in Rumtek village told us. As a result, the quality
of service has gone down steadily. Government creates facilities but cannot maintain them. So they will not
be sustainable and will last only its initial few years. Many people therefore, want a qualitative service and
they don’t mind paying for this. They give examples of telephone service in the government run sector and
local television cable service in the private run business. The emphasis should therefore be on cost sharing.
This will ensure success and sustainability.
However, the State Government blames the low priority given to the non-plan expenditure by the previous
Finance Commissions for this. Its recent Memorandum mentioned that
a damaged road or an ill-equipped school or dispensary with no medicines is more irritating than its totalabsence. Petty works requiring only a few thousand rupees are allowed to remain in abeyance causingunnecessary annoyance and hardship to the general public. Garbage dumps, uncovered public drains, unsani-tary market places, lack of public conveniences lead to spread of diseases and pollute the environment. . . .Perhaps with a small outlay the place could be saved. . . . A lot remains to be done as the situation in Sikkimis no longer different than anywhere else (Government of Sikkim, 1998b).
1. These later areas were identified by a Committee of the National Development Council (NDC) in 1965.
P O P U L A T I O N , P O V E R T Y A N D P L A N N I N G • 1 7

to the State’s Gross Domestic Product (GDP), has gone down over the years. However, its contribution has not
steadily decreased, registering an increase when there was a sharp decline in the contribution of tertiary sector.
This shift back and forth, from the primary sector has to be studied more seriously by making a systematic
decomposition of sectoral and sub-sectoral performance. The steady rise in the tertiary sector’s contribution also
needs to be comprehensively analysed for the formulation of future policy strategies.
TABLE 1.8—SECTORAL AND SUB-SECTORAL PLAN ALLOCATION IN SIKKIM (1954–2002)
SectorsI Plan(1954–61) %
II Plan(1961–66) %
III Plan(1966–71) %
IV Plan(1971–75) %
V Plan(1974–79) %
VI Plan(1980–85) %
VII Plan(1985–90) %
VIII Plan(1992–97) %
IX Plan(1998–
2002) %
Agriculture & Allied Activities
21.5 20.0 15.0 14.2 15.9 26.0 21.1 13.6 17.1
Power 9.2 8.3 7.3 8.8 10.0 9.4 17.4 24.9 19.4
Industries 4.3 0.5 6.7 3.5 6.6 4.2 4.0 3.85 4.2
Roads and Bridges 42.8 40.5 43.4 36.3 26.1 22.3 6.4 14.8 9.6
Road Transport 5.2 6.9 4.1 3.5 3.1 4.9 3.2 1.85 0.8
Education 7.4 12.4 7.9 8.8 7.4 7.0 12.2 10.7 12.5
Health 7.1 7.2 9.4 4.1 4.5 3.5 2.5 1.11 3.1
Tourism – 0.8 0.4 4.4 2.0 1.5 0.9 15.2 3.59
Others* 2.5 3.4 5.8 16 24.4 21.2 32.3 14.0 29.7
Total Outlay (Rs Millions)
32.4 63.7 97.1 203.6 401.0 1,478.0 2,824.0 7,245.0 16,028.0
Note: * Others include rural development, irrigation and flood control, communications and other social, general and economic services.
Source: Computed from various Plan Documents, Government of Sikkim, Gangtok.
In Sikkim, the structural shift has been slower than in the country as a whole. In 1995–6, India’s shares were
30.58 per cent (primary), 25.47 per cent (secondary) and 43.94 per cent (tertiary), while the respective shares for
Sikkim were 52 per cent, 13 per cent and 34 per cent (Table 1.9).
TABLE 1.9—STRUCTURAL SHIFT IN THE SIKKIMESE ECONOMY
Sectors Years
1980–81 1985–86 1990–91 1995–96
Primary 51.59 50.96 46.49 52.03
Secondary 18.10 16.45 12.97 13.65
Tertiary 30.30 32.58 40.53 34.31
Source: Government of Sikkim (1998), Sikkim Ninth Five Year Plan 1997–2002, Volume-1 and Sikkim in Brief 1998, Bureau of Economics and Statistics, Planning and Development Department, Gangtok.
State Domestic Product
Sikkim’s steady economic growth at a macro level is reflected both in its GDP and per-capita income. Both of
them at constant prices recorded a steady increase between 1980 and 1992, the highest growth in 1987
(Table 1.10).
1 8 • S I K K I M H U M A N D E V E L O P M E N T R E P O R T 2 0 0 1

TABLE 1.10—SIKKIM NET STATE DOMESTIC PRODUCT AND PER CAPITA INCOME AT CONSTANT PRICES
Years Domestic ProductRs (Thousand)
Annual Growth Rate%
Per capita incomeRs (thousand)
Annual Growth Rate%
1980–81 489,800 157,100
1981–82 521,900 6.55 161,100 2.55
1982–83 588,200 12.70 175,000 8.63
1983–84 614,200 4.42 175,800 0.46
1984–85 694,600 13.09 191,900 9.16
1985–86 755,900 8.82 201,700 5.11
1986–87 891,700 17.96 229,700 13.88
1987–88 1,075,500 20.61 267,800 16.59
1988–89 1,149,000 6.83 292,400 9.19
1989–90 1,228,900 5.51 311,800 6.63
1990–91 1,353,200 10.11 336,900 8.05
1991–92 1,442,900 6.63 349,200 3.65
Source: Ministry of Finance, Economic Survey, Government of India, various issues.
This brings in the larger issue of reviewing the entire data collection process, which includes methodology
and content analysis. For example, one of the very crucial contributors to State Domestic Product (SDP) has been
the agriculture sector in which food production continues to play a very critical role. However, food production
data is also often questioned by both the officials in Sikkim and independent analysts. The unrealistically high
level data of food production has never helped in bringing down the import of foodgrains from outside through
the Public Distribution System.
Conclusion
Population growth and its implication for employment, as well as the achievement of a balanced sex ratio are
among the development challenges Sikkim is facing in the new millennium. Planning has to take into account
these factors, also in the effort to combat poverty. Thus, some policy suggestions:
• It is essential to have a clear vision of the level of income that the State wants to achieve and when and what
level of employment it wants to generate.
• Human resource planning for the future though very crucial, has not yet been undertaken by the State. This
needs to be done keeping in view both the development needs and resource constraints of the State.
• The organizational structure of the State has to be strengthened. This can be done largely by constituting a State
Planning Board, which is necessary under the 73rd and 74th Amendments of the Constitution. It is essential
to ensure that the planning process is conducted by professionals and experts. The need of the hour is to
consolidate advantages in the areas, which have already made significant progress and make inroads into the
areas where they are lacking.
• There is virtually no data available on critical areas of economic planning such as capital formation, savings
rate, credit pattern, life expectancy etc. The reporting units of National Surveys need to be strengthened further
P O P U L A T I O N , P O V E R T Y A N D P L A N N I N G • 1 9

so that the data system can be engendered. The Bureau of Economics and Statistics also needs to be strengthened
in the light of its vital functions.
• Administrative machinery has to be made more responsive to the needs of the people. In a State like Sikkim
decentralization needs to be achieved using innovative mechanisms, as there are serious problems of inacces-
sibility.
• Social sector should increasingly be prioritized with very pointed target groups, particularly in the context of
ongoing economic reforms.
• After many years of planned development and several development interventions made by the government, it
is very essential to now focus on selected areas and sectors that have so far remained largely untouched.
Chapter 2 4
3 Contents
2 0 • S I K K I M H U M A N D E V E L O P M E N T R E P O R T 2 0 0 1

Building HumanCapabilities:
Health, Educationand the Status of
Women
Building HumanCapabilities:
Health, Education and the Status of
Women


Chapter
2��
Building Human Capabilities:Health, Education and the Status of Women
Health
Before its merger with the Indian Union in 1975, Sikkim had only one major hospital—the Gangtok Sir Tashi
Namgyal Memorial (STNM) Hospital, which was established in 1917 with 50 beds and three doctors, and
expanded later with some specialized departments.
Difficult terrain, which increases the unit cost of service delivery, as well as resource constraints, had their
impact in terms of unmet health targets in the State. The progress made since the merger period is nevertheless
laudable. It must be appreciated that while in 1980 only 0.04 per cent of the State budgetary resources were
allocated to health, in 1990 the allocation increased to 0.43 per cent and further to 5 per cent in 1998.
Since 1975, there has been a considerable expansion of the public health infrastructure (Box 2.1).
Box 2.1—Improvements in health infrastructure
In Sikkim, on account of consistent investments in the health sector the number of hospitals as well as the
bed strength and facilities for diagnosis and treatment have been upgraded considerably.
In 1979, Sikkim had only four district hospitals (located at Singtam, Gyalshing, Namchi and Mangan) in
addition to the Central Referral Hospital at Gangtok. What began as a 50-bed hospital in Gangtok in 1917,
has now expanded to 300 beds with a comprehensive array of specialized services. Advanced facilities in
cardiology with a modern intensive coronary unit have also been introduced. A State-level blood bank and
transfusion unit with facilities for HIV screening has also been set up and a 500-bed central referral hospital
at Tadong near Gangtok has been completed.
Today there are 24 Primary Health Centres (PHCs), 147 Primary Health Sub-Centres (PHSCs) and 4
Community Health Centres in the State. This makes Sikkim possibly the only State in the country to achieve
the national norm of establishing 1 primary health centre for 20,000 people and 1 PHSC for 3,000 people
(on the basis of a projected population growth in 1998).
As against the initial phase of the 1970s, when these PHCs were grossly under-staffed and pharmacists ran
many dispensaries, in the late 1990s, there were 1–3 doctors, as well as para-medical personnel, for each
PHC. All the PHCs have electricity connections and most of them have an ambulance. The utilization pattern
of health services indicates that the overwhelming majority of the people depend on the PHCs and PHSCs
(Table 2.1) (Chutani and Gyatso, 1993; Gyatso and Bagdass, 1998).

TABLE 2.1—UTILIZATION (IN PERCENTAGE) PATTERN OF VARIOUS HEALTH SERVICES (RURAL AREAS)
East West North South Urban
1989 1997 1989 1997 1989 1997 1989 1997 1989 1997
Hospital 14.9 42.49 4.7 45.28 5.1 18.87 20.5 25.0 35.8 51.76
PHC/PHSC 35.8 49.22 50.2 47.17 38.3 52.83 46.5 72.0 34.4 25.88
Independent Practitioners
2.5 0.00 4.2 0.00 9.8 3.77 2.4 2.3 0.00 1.80
Private 1.0 8.29 4.7 5.66 8.5 22.64 1.8 0.8 5.3 17.65
Others 0.7 0.00 0.9 1.89 6.1 1.89 0.5 0.0 0.7 4.71
Source: Chutani and Gyatso (1993), p. 87, Gyatso and Bagdass (1998), p. 122.
The emphasis has been on providing preventive, promotive and curative services in the rural areas. Efforts
have been made to reduce infant and maternal mortality, in conformity with strategies to achieve the goal of
health for all.
However, traditional medicine has continued to play an important role in the State. Many of the modern day
health workers (including the crucial compounder in the Primary Health Centres) are very often also traditional
faith healers. In a typical blend of tradition and modernity, they work in a hospital or health centre during the
day, but perform the traditional tasks of a faith healer in the evening (Box 2.2).
The Family Welfare and Mother and Child Health (MCH) Programme, introduced in 1976–7, has had a
significant impact:
• In 1976–7, hardly 30 per cent of infants were immunized. This has increased to 62 per cent in 1997.
• Basic health services in the periphery and remote areas are provided by 293 indigenous dais (midwives),
345 health guides and a host of trained paramedics.
• Free family planning services are on offer to eligible couples through hospitals, PACs and PHSCs. Couple
protection rate has increased from 2 per cent to 20.6 per cent.
• A comprehensive programme, the Schools Health Programme initiated in 1979, covers students from Class I
to V with services like immunization, health check up, health education and teachers’ training.
Box 2.2-Traditional systems of medicine in Sikkim
Sikkim is the land of faith healers. You name a disease and there is a medicine indigenously developed,based on local resources and imbued with a strong spiritual element. There are a large number of traditionalhealers—Dhami, Jhankri, Phendongba and Bonbo in the Nepali community Pow and Nejum in the Bhutiacommunity and Bumthing in the Lepcha community. For these powerful faith healers, ‘jhar phuk’ is the keyword and the first step in an interestingly complicated but inexpensive course of treatment.
Even ten years ago, the most usual ‘first resort’ treatment for a villager used to be a traditional faith healer.In some cases, these faith healers are very effective as they have practical knowledge of the disease and havealso experimented with treatment using indigenous medicines. However, as the literary rate improved andawareness of other options grew through modern mass media, allopathic treatment started getting increas-ingly accepted by the villagers. This has led to a greater recourse to PHCs and PHSCs.
There has been a lot of interest in documenting traditional systems of medicine (TSM) and assessing thepossibility of using the natural biodiversity heritage for local community based health care. Local people’sknowledge of traditional system of health care, with scientific analysis and interpretation of mystic beliefs,are some of the areas that need further research and, documentation.
2 2 • S I K K I M H U M A N D E V E L O P M E N T R E P O R T 2 0 0 1

• The percentage of expectant mothers receiving antenatal care from the State health agencies in rural areas
rose from 3 per cent in 1979 to 58 per cent in 1997.
• The percentage of non-institutional deliveries has also declined from 95 per cent in 1979 to 7.4 per cent
in 1997.
The results of improved health care are also partially reflected in changes in birth and death rates, which have
been constantly lower than the national average since 1981. By 1997 the birth rate in Sikkim had reduced to 19.8
per thousand, as against the national average of 27.2 per thousand, while the death rate was 6.5 per thousand as
against the national figure of 8.9 per thousand population. The decline in the mortality rate is an indicator of
better delivery of health care services, improved nutrition and higher rates of women’s literacy.
Yet, malnutrition and under-nutrition continue to be a cause of concern. A 1989 survey of the record of age,
weight and height and calculation of nutritional index indicated that:
• 29 per cent of the mothers were under nourished.
• 14.8 per cent were stunted (height less than 145 cms).
• Over 40 per cent of children under 5 years of age were suffering from various degrees of malnutrition.
However, figures for 1998–9 from National Family Health Survey (NFHS) show an improvement with regard to
severe and moderate undernourishment for children under age 3, being 4.2 per cent and 20.6 per cent respectively.
as against the national average of 18 per cent and 47 per cent. While these figures continue to be better than the
national average, the challenge of nutrition security before the State is still formidable. In 1998–9, in fact, a large
proportion of both women (61 per cent as against 52 per cent at the national level) and children (77 per cent as
against 74 per cent at the national level) were reported as suffering from anaemia.
Diseases related to inadequate environmental sanitation, tuberculosis, goitre anal alcoholism continues to
occupy an important place in the State health profile. At the same time new problems, e.g. HIV/AIDS and
reappearance of malaria are very disturbing. Thus, it has been suggested that at least 7 per cent of the Plan outlay
and 5 per cent of the non-plan outlay should be earmarked for this sector.
Environmental sanitation
Though most of the villages have piped water, a large number of households continue to depend on streams,
rivers, ponds and springs. In 1989 tap water was used by 84 per cent of the household in rural areas (88 per cent
in urban areas) as against 51 per cent in 1979 (Table 2.2).
Dependence on traditional sources like spring water is higher in rural areas (17 per cent), and in particular
in rural North district (33.1 per cent), than in urban areas (12 per cent). Surprisingly, in the urban areas of South
district 31 per cent rely on springs for drinking water. (Table 2.3).
TABLE 2.2—ENVIRONMENTAL SANITATION AND OTHER HEALTH AMENITIES IN RURAL SIKKIM (IN PERCENT)
Amenities 1979 1989 1997
Tap water using households 51.0* 84.0* 77.8
Excreta disposal in the fields (defecation) 81.6 62.2 46.4
Pucca houses 18.0 34.0 27.0
Mothers receiving antenatal care 3.0 61.0 58.0
Deliveries by relatives, untrained village dais # and others 95.0 68.0 57.0
Notes: * Rest of the families took water from stream, rivers and ponds; # Midwives.Source: Government of Sikkim, Department of Health, Gangtok.
B U I L D I N G H U M A N C A P A B I L I T I E S • 2 3

TABLE 2.3—DISTRICT-WISE PERCENTAGE OF FAMILIES WITH ACCESS TO VARIOUS SOURCES OF DRINKING WATER
Source East West South North All Districts
Rural Urban Rural Urban Rural Urban Rural Urban Rural Urban
Tap 74.8 89.9 85.7 76.4 78.0 61.6 63.6 91.4 77.8 84.5
Spring 20.0 8.1 10.4 15.1 15.5 31.1 33.1 6.9 17.1 12.3
Others 5.2 1.9 3.9 8.5 6.5 7.3 3.2 1.6 5.1 3.2
Source: Gyatso and Bagdass (1998), pp. 37–141.
Like elsewhere in the country, large populations in rural Sikkim (82 per cent in 1979 and 46 per cent in 1997)
still use open fields for defecation (Box 2.3). The bore hole latrines are, however, gaining ground. Even in 1989,
more than a quarter (27 per cent) of urban households still did not have access to a sanitary toilet. There is however,
an increasing prevalence of septic tank (58 per cent), bore hole (11 per cent), and service latrines (0.7 per cent).
An improvement in the housing characteristics has been recorded recently by the National Health Family
Survey. According to this Survey, in 1998–9, 84.6 per cent of the household had access to drinking water (piped
or from a hand pump), and 72.7 per cent of them had a toilet or a latrine facility. In both cases, Sikkim did better
than the national average which was with 77.9 per cent and 35.9 per cent respectively.
Box 2.3—Health and sanitation linkages: Lessons from IPI survey
In November 1995, a random sample survey of Intestinal Parasitic Infection (IPI) of 239 people of 58 familiesof Ranipool, Singtam-Ranipool, Song-Gankha, Martam and Sazong-Rumtem in east Sikkim, was conductedby National Institute of Communicable Diseases, New Delhi. According to its findings, there was an overallprevalence of IPI cases (65.3 per cent), of which 56.1 per cent was pathogenic parasitic infection.
The high rates of soil transmitted helminthiases (worm infections) in pre-school children is closely linkedwith the habit of indiscriminate defecation around the houses. As 54.37 per cent of the total households ofthis village practice open air defecation, it was not unusual to find such a high prevalence rate. Even afterthe introduction of drugs, 40 per cent of the stool sample tested were infected with one or more parasiticspecies.
Intestinal Parasitic Infection occurs mainly due to faecal contamination of drinking water, open-air defeca-tion, low standard of food and personal hygiene and lack of health education. Protection and purificationof drinking water supplies, improvement of basic sanitation and promotion of food and personal hygieneare essential measures to interrupt transmission of such infections. Sanitary measures followed by healtheducation will have a cumulative effect on the reduction of IPI morbidity.
Thus, the following measures are essential:
• Provision of safe drinking water.
• Improvement of environmental sanitation.
• Health education with sustained anti-Helminthic campaign.
• Periodic screening for intestinal parasites.
• Periodic mass deworming till the parasite rate reaches acceptable level.
• Proper screening for intestinal parasites during school health check ups.
• Supplementary feedings like mid-day meals at Integrated Child Development Scheme (ICDS) Centresand in primary sections of schools must be combined with periodic deworming so that these programmesyield maximum results.
2 4 • S I K K I M H U M A N D E V E L O P M E N T R E P O R T 2 0 0 1

Persistence of tuberculosis
According to the Gangtok Times (24 January 2000), 170 tuberculosis (TB) cases (over 2000 per annum) are detected
every month in Sikkim. Against a national average of just over 40 TB cases per one hundred thousand population,
the figure for Sikkim stands at 87 cases. With a cure rate of less than one-third, the progress in combating this
disease and mortality resulting from it has been slow. Low levels of awareness and poor living conditions
compound the prevalence and impact of this disease.
Under the Tuberculosis Control Programme a 60-bed District Tuberculosis Centre (DTC) exists at Namchi and
10-bed mini DTC have been established in the other three districts. However, rather than hospitalization, the stress
now has been on treatment at home. Over the last few years, 11,029 TB cases have been detected and treated. The
record for the last two years in the STNM Hospital indicates that 10 per cent of the patients admitted and treated in
the hospital died of TB in 1998. This is much higher than the proportion of death cases due to infectious colitis,
enteritis, gastroenteritis, and cholera (0.7 per cent). It may also be noted that while the percentage of deaths due to
infectious colitis, enteritis, gastroenteritis, and cholera declined between 1997 and 1998, that due to TB increased.
A disturbing feature, which threatens to increase the mortality rate, is a steady growth of drug-resistant strains
of TB (Box 2.4). This phenomenon result from irregular medication, discontinuation of treatment and reluctance to
go for treatment-factors that are linked to the stigma attached to the disease and the increasing cost of treatment.
Once the disease becomes a ‘resistant category’, stronger and more expensive medication (100 times more than the
normal cost) is required and the treatment period is prolonged. Clearly, the challenge of TB needs to be addressed
on a priority basis, through both improved awareness and patient literacy as also greater resource allocation.
Box 2.4—TB in Sikkim: A practitioner’s perspective
As I see it, tuberculosis is the major health problem in the State of Sikkim. No doubt there is a resurgence
of tuberculosis all over the world and as such Sikkim is no exception. However, in Sikkim somehow the
problem seems to be growing day by day and it has reached frightening proportions. The number of cases
of Multi Drug Resistant (MDR) tuberculosis is growing day by day. Even ordinary cases seem to be requiring
drug treatment for a much longer period as compared to cases in the past. The reasons for such a problem
could be many. No doubt hill people do tend to be more prone to tuberculosis as compared to those in the
plains. However, there are certain things we could do to decrease the spread of the disease.
People here have a very bad habit of spitting here and there. This definitely helps the spread of the bacteria
especially in a cold climate like ours. Improved housing, prevention of over-crowding and spreading
awareness as to the mode of spread of the disease would also help. Further with the spread of MDR
tuberculosis, I believe it is unwise to continue the system of domiciliary treatment of tuberculosis. A time
has come where we have to go back to the old system of admitting all positive cases, MDR and other cases
not likely to take regular treatment at home.
The treatment of such cases has to be supervised and it has to be ensured that every dose of medication is
taken as prescribed. This has to be continued until it is felt safe to let the patient continue to have treatment
at home unsupervised. Here, again, health education is very important to dispel ignorance and superstition
about the disease and to let people know that tuberculosis can be completely cured if treated properly and
in time.
—Dr K. Bhandari
B U I L D I N G H U M A N C A P A B I L I T I E S • 2 5

Goitre
Sikkim had been declared as a goitre-endemic State on the basis of the sample survey conducted by Indian Council
of Medical Research (ICMR), and falls in the hyper-endemic region for Iodine Deficient Disorder (IDD). A
Government of India survey (1976) showed goitre prevalence to be 37.81 per cent in Sikkim. A random survey
conducted by ICMR (1982) indicated the prevalence of goitre in the State to be around 56.6 per cent.
Another survey (1989–91) conducted by the Government of Sikkim on IDD in all the four districts of the
State found the prevalence of goitre to the extent of 54.03 per cent and the incidence of cretinism at 3.46 per
cent. While cretinism (extreme iodine deficiency leading to mental retardation) was prevalent among people who
were more than 51 years old, goitre was three times higher among women as compared to men. The East district
recorded the highest prevalence of both goitre (60.92 per cent) and cretins (4.93 per cent), while the North district
recorded the lowest (45.84 per cent and 1.67 per cent respectively) (Pulger, Rai, Shankar Rai, 1992).
Recent survey data has shown a decline in the prevalence of cretenism in all the districts. Though it is still
relatively a little higher in the South district particularly among males (9.19 per thousand), the overall prevalence
has come down and is as low as 6.51 (male) and 4.94 (female) per thousand in the State. This decline can be
partially attributed to the effectiveness of the interventions of the State Government in this respect (Box 2.5).
Unlike many other parts of the country, Sikkim does not lack awareness about the importance of iodized salt.
The key issue today is the retention of adequate iodine content, particularly in the rural conditions, which limit
the effectiveness of IDD interventions.
Box 2.5—Combating goitre in Sikkim
The Government has a four-pronged strategy to combat goitre:
• The Goitre Control Programmes Implementation Committee was constituted in 1984 under the Chair-manship of the Health and Family Welfare Minister of the State. In order to coordinate with otherdepartments like food and water, an inter-sectoral Coordination Committee has also been constituted.
• The Government of Sikkim started procuring and distributing iodised salt more than ten years ago. Saleof non-iodised salt throughout the State has been banned since 1985 under the Prevention of FoodAdulteration Act 1954. Only iodised salt is allowed to enter or be sold in the State, with checking doneby the district administration, food inspectors and the police. The department procures iodised salt rightfrom the source. The consumption per annum is 5130 MTs. There is no subsidy provided for iodised salt.In close coordination with the Health and Family Welfare Department, the iodine content in the iodisedsalt is checked before distribution to consumers. Since the shelf life of iodised salt is limited, particularlyin the humid conditions of Sikkim, a special effort is made to make people aware of the techniques topreserve the properties of iodine.
• Iodine monitoring laboratories have been set up in all the four districts and Gangtok to ensure that aminimum requirement of iodine is maintained in the iodised salt.
• Thyroid Research Centre has also been set up at Namchi in 1989 for diagnosis, treatment and researchin Iodine Deficient Disorder (IDD). This centre has already done a commendable job in survey andtreatment of IDD cases.
2 6 • S I K K I M H U M A N D E V E L O P M E N T R E P O R T 2 0 0 1

Alcoholism in Sikkim
‘Sikkimese are very fond of alcohol’ is the general impression of people in the rest of the country—just as most people
are convinced that all hill people in the hills drink a lot of alcohol. There are social stigmas attached to drinking, but
no celebration or occasion can be complete without alcohol, mostly indigenous but increasingly foreign.
Hill people themselves subscribe to the notion that alcohol is essential for their climatic conditions. Moreover,
alcohol is easily available in all the districts of Sikkim. The indigenously manufactured brews like rakshi, chhang
and tongba are also relatively much cheaper than anywhere else. Sikkim breweries are known for their products
in the Eastern Himalayas.
Data pertaining to alcohol consumption and alcohol-related illnesses contradicts the popular belief that
alcoholism is the norm in Sikkim. According to the data from surveys conducted in 1989 and 1997, there has
been a decline in the number of people consuming alcohol. In 1997, 18 per cent of rural population (as against
21 per cent in 1989) and 7 per cent of urban population (as against 12 per cent in 1989) were consuming alcohol
(Chutani and Gyatso 1989 and Gyatso and Bagdass 1998). Alcoholism among women is much lower than that
among their male counterparts both in urban and rural areas (Table 2.4).
TABLE 2.4—PREVALENCE (IN PERCENTAGE) OF ALCOHOLISM IN SIKKIM
1989 1997
Male Female Total Male Female Total
Rural 25.7 15.3 20.80 21.23 14.69 18.19
Urban 15.8 9.0 12.51 9.86 2.57 6.63
Source: Chutani and Gyatso (1993), pp 79–81; Gyatso and Bagdass (1998), pp 114–16.
However, the comparatively high percentages of alcoholism, especially in the vulnerable age groups (teenagers
and prime earning age cohort from 21–50+ years) are a major cause for concern (Table 2.5).
The Family Counselling Centre (FCC) at Gangtok run by the Association for Social Health in India reported
that they are dealing with an increasing number of alcoholism-related cases. Out of the total reported cases of 25
in 1993–4, alcoholism constituted as high as 32 per cent and out of the 31 reported uses in 1997–8, it constituted
42 per cent. The FCC attached to the police headquarters in Gangtok also reported more or less the same trend.
TABLE 2.5—AGE-WISE PREVALENCE (IN PERCENTAGE) OF ALCOHOLISM IN SIKKIM
1989 1997
Rural Urban Rural Urban
14 and below 0.53 0.36 0.83 0.11
15–20 7.70 1.70 5.78 1.00
21–30 32.60 17.00 23.27 6.87
31–40 55.60 31.20 38.28 17.24
41–50 43.80 33.80 45.95 19.19
51 and above 50.20 42.20 46.83 15.97 (weighted average)
Source: Chutani and Gyatso (1993), pp. 79–81; Gyatso and Bagdass (1998), pp. 114–16
Challenges and concerns
The major concerns in the health sector today are related to both the changing nature of heal th requirements and
the pressure on the existing health amenities. Health problems related to environmental pollution, improper
B U I L D I N G H U M A N C A P A B I L I T I E S • 2 7

sanitation and potable water supply continue to remain alive in the rural areas of Sikkim. At the same time,
especially in urban areas, there is a gradual emergence of diseases like HIV/AIDS, cardiac illnesses and diabetes,
along with the re-emergence of stronger strains of TB and malaria.
Emphasis should be on preventive health, for which health awareness needs to be strengthened. For instance,
deworming of the whole population—along the lines of the pulse polio campaign—is vital. Greater efforts are
required to promote health literacy through activities like camps, orientation programmes, mass media, distribu-
tion of literature and health exhibitions. Health security and community financing of local health initiatives could
be key strategies for greater effectiveness of health care at the local level.
Given the challenges and concerns in the health sector, it might be imperative for the State Government to
conduct a detailed appraisal of manpower availability in this sector both in technical and non-technical categories.
Such a data bank will facilitate an appropriate health manpower strategy and help improve the effectiveness of
health care in Sikkim.
In order to improve the inter-sectoral linkages that determine health outcomes, the involvement of village
Panchayats and user groups is important.
Education: A historical overview
Four modes of education have been prevalent at different periods in the history of Sikkim.
Traditional education of Sikkim was very life-centred, practical and experience based. The famous Nepali
saying ‘pari guni ke ham, haolo joti mang’, meaning ‘What is the use of reading and writing as ultimately you have
to plough the field’ reflected the thinking of the people of that time. Growing children, till attainment of
adolescence, obtained hands-on knowledge of things, ceremonies, and functions. The family was the focal point
of nearly all educational endeavours with a key role being played by women.
Apart from the reading of Buddhist religious literature at home, education in Sikkim for most of the nineteenth
century was of the monastic type (Box 2.6). The monastic schools imparted religious education for the preparation
Box 2.6—Monastic schools
Sidkeong Tulku was the only Sikkimese ruler to have been educated abroad at the University of Oxford, andhe gave a new dimension to education in Sikkim. In 1909, he founded Enchey School as a monastic schoolat Gangtok. This is today a higher secondary school.
The charter written in Tibetan establishing the school makes an interesting reading (Prakasha Veda, 1976).Its English translation reads:
We, Barmyak Rimpoche, the Head Lama and all the others have gathered for this auspicious celebration onWednesday, the 29th day of the 8th month of the ‘earth bird’ year in the Rabjung 15. We appoint C huze Rigzinas the first Tibetan teacher to impart instruction to the monk novices from different monasteries in Sikkim inreligious philosophy, the writing and grammar of Tibetan and Tibetan literature.
Let the teachers strive, through their teaching, to accomplish Bodhichitte for our benefit and the benefit of allbeings-in their teaching let them be painstaking and not harsh to their pupils. The pupils, too, should conductthemselves according to the rule. They should emulate the kindness of their teachers and obey their orders.They should not be found wanting in any way. The teachers should report this to us. The teachers should alsoinvestigate closely before granting leave to their pupils to visit other places.
This is decreed on the auspicious day mentioned above from Gangtok.
Gangtok12th October, 1909 Sidkeong Tulku
2 8 • S I K K I M H U M A N D E V E L O P M E N T R E P O R T 2 0 0 1

of monks to priesthood. Schools in Tashiding, Tulung, Pemayongtse and Sangnachaling monasteries were famous
as centres of monastic education in those days (Jangira, 1977).
The genesis of these schools could be traced back to the arrival of Buddhism in Sikkim. Famous scholars like
Shanta Rakshita and Guru Padma-Sambhava brought Buddhism to Tibet, which was later brought back to Sikkim
by the Tibetan lamas, who consecrated the first ruler of Sikkim at Yuksom and thus got the support of temporal
power as well. Even today the Ecclesiastical Department in the Government of Sikkim has recorded 163 monasteries
and temples all over Sikkim excluding the small shrines.
Monasteries and temples have made a significant contribution to education in Sikkim. Buddhist literature,
especially the Mahayana and Tantric texts, were available in Tibetan, which has been the medium of instruction.
The fundamental Buddhist teaching and chanting of some important prayers included in religious books,
formed the curriculum of monastic education. The curriculum also included the study of diversified subjects such
as painting, sculpture, astrology, mathematics, medicine, philosophy, literature, tantra and so on. The Shedas
(Monastic Colleges for Higher Studies in Buddhist Literature) at Deorali and Rumtek are primarily aimed at
reviving the formal educational role of the monasteries.
Christian Missionary Education in Sikkim began in the late nineteenth century with some support from the
landlords/Kazis, some of whose schools had been handed over to Scottish Missionaries. On the whole Christian
missionary activity was not favoured by the Maharaja. The missionaries were not allowed to live in Gangtok. In
1924, Mary Scott was allowed to open a school for girls in Gangtok. The first matriculation class passed the
examination (four candidates) in 1945 and the school continued to grow, becoming a recognized higher secondary
school in 1961 (Ritchie, 1977). A striking feature of the Christian Missionary schools for girls was ‘industrial’
teaching mainly sewing and knitting. ‘Vocational training’ was also a part of the curriculum. In fact, for many
years until the beginning of the twentieth century, primary schools set up by the church offered the only means
of basic education.
The Bhutia Boarding School (1906) was the first government school in Sikkim. The second government school,
Nepali Boarding School was started in 1907 in today’s Lal Bazaar area. In 1924, the government amalgamated
the Bhutia and Nepali Boarding Schools into what has grown today to become the Sir Tashi Namgyal Academy.
By the year 1920, Sikkim had 21 schools (6 government schools, 13 mission schools and 2 schools under
landlords). This number continued to increase over the years. In 1961, at the end of the First Plan period, the
number of schools in Sikkim was in fact 182, registering an increase of 107 per cent as against in 1954, when
there were only 88 schools.
Education in the post-merger period
Since 1975, following the merger of Sikkim with the Indian Union, there has been a steady increase in the number
of schools and in the number of teachers. In 1998–9 out of the total number of 1,474 schools in the State, 50
per cent were pre-primary schools, followed by primary schools (34 per cent), middle school (9 per cent),
secondary schools (5 per cent) and higher secondary schools (2 per cent).
Schools however, are unevenly distributed across districts. Due to its low population density, the North district
has the lowest concentration of schools. In 1998–9, hardly 10 per cent of pre-primary schools were located in the
North district, against 31 per cent in the East district and 29 per cent in the South district. Its percentage share
was nearly 11 per cent of primary schools, while it was as low as 7 per cent for middle and higher secondary
schools.
It is interesting to observe that 50 per cent of the schools employed hardly 10 per cent of the total number
of teachers. This can be attributed to the fact that there are a number of schools where the school teacher ratio is
hardly 1 : 1.02. Primary schools with 35 per cent share in the total number of schools account for a major share
B U I L D I N G H U M A N C A P A B I L I T I E S • 2 9

of the total number of teachers of 7,771 in the State. Middle schools account for 22 per cent of the total number
of teachers followed by; secondary schools (19 per cent), and higher secondary schools (14 per cent).
The improvement recorded in the education sector can be partially attributed to the fact that the strategic
thrust areas have been:
• Education for all
• Provision of quality education.
• Access to schools within walking distance of each village.
• Improvement in school infrastructure.
• Formalized system of teacher recruitment.
• Encouragement of education to the weaker sections of society.
• Widening scope of vocational education.
• Establishment of technical colleges.
Also, the education sector has been receiving high priority in the State. This is reflected in the quantum jump
in expenditure on this sector during the last three plan periods. In the Sixth Plan period (1980–5) the expenditure
in the education sector was Rs 145.877 million, against a budget allocation of Rs 8.3 million. This differential
increased in the Seventh Plan period (1985–90), when against a budget allocation of 264 million the expenditure
was of Rs 394.62 million, and further in the Eighth Plan period (1992–7) with an allocation of 606 million and
an expenditure of Rs 872.198 million.
Literacy rates among the population aged 7 years and above have also gone up steadily; moving from 17 per
cent in 1971 to nearly 57 per cent in 1991. During the same period the rise in female literacy rate has been very
impressive, moving from 8.9 per cent to over 46 per cent. It may be also noted that between 1981 and 1991,
Sikkim recorded the second highest improvement (of 15.31 percentage points) in literacy rates among the
north-eastern States.1
In 1991, the East district recorded the highest literacy rates (65.1 per cent). It ranked first also in rural literacy
(61.4 per cent), while the South district recorded the highest urban literacy rates (82.6 per cent).
In 1991, the highest proportions of literates were those with below primary level education (36.1 per cent),
whereas very low proportion of literates had education levels of graduation and above (3.4 per cent).
In view of the distribution of Sikkim’s population among various age groups there is a need for increasing
the number of colleges and technical institutes in the State. The present figure of three full time colleges is in fact
insufficient. There is also a need for a full-fledged university, which will give a new thrust to research and academic
activities in the State (Box 2.7).
Box 2.7—The need for more research
Social science research in the State of Sikkim is inadequate despite several incentives provided by the State.
There are many reasons for this including the fact that English education started off late and there are no
secondary and senior secondary boards in Sikkim and the State is fully dependent on Central Boards.
There is no immediate sign of introducing post-graduate courses in the existing institutions. University Grants
Commission (UGC) and national social science institutes like the Indian Council of Social Science Research
(ICSSR) and Indian Council of Historical Research (ICHR) have not shown interest either in starting post-
graduate courses or supporting research relating to the State of Sikkim. Very few scholars from North Bengal
University and other universities have undertaken research on the socio-political and economic aspects of
1. Arunachal Pradesh ranked first with an increment of 16.11 percentage points.
3 0 • S I K K I M H U M A N D E V E L O P M E N T R E P O R T 2 0 0 1

The education system in Sikkim needs to place greater emphasis on vocational education so that learning and
skill formation can be related to the employment market. As of today there are 4 vocational /technical institutions
in the State in contrast to the Kothari Commission recommendation that at least 20 per cent of students in classes
IX and X be directed towards vocational courses (Table 2.6).
TABLE 2.6—TECHNICAL/VOCATIONAL INSTITUTIONS (BOTH PRIVATE AND PUBLIC)
Institute Name Discipline Location 1975 1999
lnst. of Industrial training Draftsmanship, Plumber, Motor Mechanic Rangpo – 1
Advanced Tech. Training Centre Computer Bordang – 1
CCCT Polytechnic Computer Namchi – 1
Himalayan Inst. of Pharmacy Pharmacy Deorali – 1
Source: Government of Sikkim, Department of Education, Gangtok.
The mushrooming of various technical institutes in some nearby towns and cities tike Calcutta, Guwahati and
Siliguri seems to indicate that there is a burgeoning demand for professional and skill based education in the
region.
However, a great emphasis has to be given to science education, as the promotion of ‘scientific temper’ is
critical for the sustainability of the Sikkimese economy and environment.
Subsidies and privatization
Subsidized education is based on merit. The Ved Prakash Report of 1976 recognized that poverty was a strong
deterrent for schooling and made recommendations to make education less expensive and to extend financial
support to the weaker sections of the society. Towards this end, education has been made free for boys upto
Class VIII and for girls upto class XI. Text books upto class VIII have been subsidized and are now sold to students
at 50 per cent of their market price (Box 2.8). A general impression is that the standard of education has gone
down as education has become a free public good.
In response to the demand for ‘better education’, a large number of private schools have come up in the last
few years. This has happened despite the State Government subsidies and incentives to children in government-
sponsored schools. In 1996–7 out of the estimated 154 private schools, 50 per cent were located in the East district,
Sikkim. Published materials available in the market are based on visits to Gangtok but are not based on
field-work analysis.
Some science research is carried out in Sikkim by UGC, ICAR, G.B. Pant Institute and the DST, but the output
does not seem to measure up to the pressing demands of the State. Until autonomous boards for secondary
and senior secondary levels and a university of Sikkim are created, it is difficult to promote research,
particularly in the social sciences.
Above all a central library in the State is essential and the State Government has to take positive steps in
this regard based on the methods of modern library science. The existing Sikkim Research Institute of
Tibetology can be activated to promote researches on Buddhism and Tibetan language.
— K.R. Chakaravarthi, Head, Department of Political Science, Sikkim Government College, Gangtok.
B U I L D I N G H U M A N C A P A B I L I T I E S • 31

23 per cent in the South district and 20 per cent in the West district (Table 2.7). According to a survey by the
Bureau of Economics and Statistics, which covered 112 schools in 1996–7, there were 12,783 students 884 teachers
in private schools. The total salary bill of these schools was Rs 12.8 million per annum.
TABLE 2.7—PRIVATE SCHOOLS IN SIKKIM (1996–71)
North East South West Total
Schools 10 77 36 31 154
Information received 4 52 32 24 112
Number of students 318 8,869 2,650 946 12,783
Number of teachers/staff 16 566 199 103 884
Total salary (Rs) 494 916 8 660 237
Source: Government of Sikkim, Department of Education, Gangtok.
Most of the private schools charge much higher fees than government schools and have English as the medium
of instruction. The success of private schools is an indication of the fact that the quality and standard of education
in the public sector are not commensurate with the expectations of parents. It appears that a large number of
people are willing to pay for the education of their children, in particular English education. Private schools are
felt to be more accountable as far as the performance of students is concerned.
The analysis thus far indicates that there is a need to rationalize the existing structure of the education system.
This can be done by streamlining the functioning of the Directorate of Education to focus on the improvement
of curriculum and student services.
Though the relevant Act to set up a board of secondary education was passed by the Sikkim Legislature in the
1980s, it has not come into force thus far. The constitution of a State-level advisory board on education will go
a long way in providing the education sector a concrete long-term direction.
There is also a need for improving the preparation, motivation and deployment of teachers and for inspection
Box 2.8—Subsidies for education
To make education as accessible as possible, especially for the poorer sections of the society, the following
subsidies have been extended:
• Free textbooks (Pre-Primary/I to Class XII) and free tuition started in the 80s; free exercise books(Pre-Primary/I to Class XII) after 1994.
• Free uniforms from Pre-Primary to Class V.
• No tuition fees from Pre-Primary to Class XII.
• Mid-day meal from Pre-Primary to Class V since 1995.
These subsidies are quite popular. Parents do not have to spend anything on their children’s education.
Adversely, students do not have to fear the risk of discontinuation of the facilities even if they fail in the
annual examination and are detained in the same class.
However, in the absence of proper targeting and monitoring of achievements, subsidies tend to become
ineffective. This is more so because they are given regardless of the socio-economic background of the
beneficiaries.
3 2 • S I K K I M H U M A N D E V E L O P M E N T R E P O R T 2 0 0 1

and supervision of schools in remote areas. Further, poor maintenance and inadequate infrastructure of existing
schools needs to be addressed. Decentralization of school maintenance could therefore be explored.
Education and prospects for employment
Education has a high potential as a sector for employment generation in Sikkim. There are good opportunities
for opening residential schools particularly in South Sikkim. Earlier, the three hill sub-divisions of Darjeeling,
Kurseong and Kalimpong used to provide the best schools for the entire Eastern Himalayan region. Thousands
of students from the North-East, Bengal, Bihar, Nepal, Bhutan, Bangladesh and many other foreign countries
studied there. However, due to the political disturbances in the hills over the last 15 years, the functioning of these
schools has been disrupted and their appeal has declined. This can be a major opportunity for Sikkim, which has
some of the best locations for boarding schools and similar institutions.
For many years now, the Sikkimese have been going to other States for both regular and professional education
in the social sciences, engineering, medicine, architecture and chartered accountancy. This has been facilitated by
the special quota for admission to these courses, which were extended to Sikkim to compensate for its late entry
into the Indian system of education. These quotas have been very effective—the overwhelming majority of medical
doctors and engineers in Sikkim have studied against reserved seats.
However, a great emphasis within the State has to be given to training in engineering and other professional
areas, as well as to strengthening disciplines like computer software and information technology, accountancy,
chemistry, physics, medicine, business management, rural development and tourism. The demand for specialized
management personnel will increase with the growing complexity and size of industrial establishments and other
tertiary sector activities like tourism and trade. Equally vital will be apprenticeship programmes, as several new
collaborative ventures are likely to be set up.
In view of these challenges, the Sikkim Government would need to make necessary changes in its laws and
policies. This would involve looking at issues related to land acquisition and investment regimes, reservation of
seats for the Sikkimese, regulations regarding admission of students from other countries, and affiliation of these
schools with the best secondary boards.
Women and children
In Sikkim, women constitute nearly 47 per cent of the total population. Their social position in the State seems
to be better than that in the rest of the country. Women are not secluded, while instances of infanticide or
dowry-related deaths have not been reported. Women also play a major role in trading activities, which allows
them to participate in decision-making far more than in most other States in India.
In contrast to the unfavourable sex ratio in the population as a whole, the number of women in government
employment is greater than that of men. Women are more visible in the public sphere in Sikkim than is the norm
for India and South-Asia as a whole.
The status of women in Sikkim—their economic contribution, socio-cultural autonomy, authority, involvement
in the decision-making process within the household—varies across communities. The practice of polyandry
among tribal communities could be one of the variables explaining the higher value attached to women. Similarly,
local religious practice also plays a role in influencing the status of women (Dhamala, 1985).
Women’s work is an important underpinning of society and economy in Sikkim as it is elsewhere. The fact
that in 1999 the number of women headed households in Sikkim’s rural areas (143 per thousand) was higher
than the national average indicates not only the impact of migration but also the status accorded to women in
the State (Table 2.8).
B U I L D I N G H U M A N C A P A B I L I T I E S • 3 3

TABLE 2.8—FEMALE HEADED HOUSEHOLDS IN SIKKIM (PER 1000 HOUSEHOLDS)
Residence Sikkim India
Rural 143 104
Urban 83 99
Source: Government of Sikkim, Sikkim in Brief, Bureau of Economics and Statistics, Gangtok, June 1999.
A woman is considered to be an asset in the household and commands a bride price, but she has no rights of
inheritance. It is only when a daughter remains unmarried that parents customarily transfer some property to her.
Participation of women in economic activities, is high in Sikkim. The women, especially in the rural areas,
are involved in agricultural operations from sowing to harvesting. It has been their responsibility traditionally, to
collect fuel wood and fodder for the family, and fetch water from dharas (springs) in vessels which they carry in
a doko (basket) on their backs. They are responsible for all domestic tasks including the caring for domestic animals.
Women also work as paid agricultural labourers, construction workers, and take part in economic activities like
selling of vegetables in the market place. They contribute to the income of the family also through their traditional
skills in spinning and weaving.
Given the geographical conditions of rugged steep terrain, heavy rainfall etc., the women have to directly bear
the brunt of all climatic hazards. The heavy load of work in the daily lives of Sikkimese women has serious
implications for their health. This is more so because the families are large in Sikkim—30 per cent of rural families
and 22 per cent of urban families have more than 6 members. Heavy workload coupled with early marriages,
between 16–20 years, take their toll on women’s health. This is reflected in the declining sex ratio in the age group
of 29–60 in Sikkim.
Girl child: Some critical facets
Traditionally there has been no discrimination against the girl child in Sikkimese society. Girls and boys are given
equal status in the family. Unlike many other States, no female foeticide has been reported from Sikkim. Sex-
determination tests are unheard of. Nevertheless, girls in Sikkim are underprivileged in terms of their education,
early marriage and health.
Education
The reasons for the slow spread of education among girls in Sikkim are, as elsewhere, poverty, social customs,
negative parental attitudes, poor accessibility to schools and the non-availability of schools which have women
teachers. The State Government is considering several measures to address these issues. These include the
establishment of separate primary and junior high schools for girls, wherever there is a demand, and the expansion
of facilities for higher secondary education in the exclusive girls’ secondary schools at Gangtok, Deorali, Namchi
and Gyalshing.
The introduction of free education is government schools in terms of books, uniform and mid-day meal up
to the age of 5 years, have definitely attracted more and more girls to the schooling system. These benefits are
extended to all the girls in a family, whereas in the case of boys, the benefits are limited to two per family.
Early marriage
Low participation of girls in education has a direct impact on their social chances and future prospects. This is
3 4 • S I K K I M H U M A N D E V E L O P M E N T R E P O R T 2 0 0 1

reflected in the prevalence of early marriages, in both rural and urban areas, as well as in all the three communities,
the Lepchas, the Bhutias and the Nepalis. (Box 2.9).
In rural Sikkim, 32 per cent of the girls were married before they were 18 years and another 34 per cent got
married by the time they were 20 (Table 2.9). This implies that 66 per cent (60 per cent in 1997) of the girls got
married by the year they attained 20 in 1989. The average age at marriage for girls is 14–20 years, while for men
it is between 18–25 years.
TABLE 2.9—AGE AT MARRIAGE AMONG MEN AND WOMEN IN SIKKIM
Age at Marriage (yrs)
1989 1997
Rural (%) Urban (%) Rural (%) Urban (%) Rural (%) Urban (%) Rural (%) Urban (%)
Women Men Women Men Women Men Women Men
14 4.0 1.3 9.30 0.54 4.75 1.87 8.81 1.91
15–17 28.1(32.1)
5.7(7.0)
29.50(38.80)
4.6(5.14)
20.90(25.65)
5.95(7.82)
26.35(35.16)
6.09(8.00)
18–20 34.2(66.3)
23.1(30.1)
36.00(74.80)
21.7(26.84)
34.90(60.55)
20.18(28.00)
35.38(70.54)
25.77(33.77)
21–25 19.9 30.0 19.70 42.30 23.57 35.78 20.27 38.75
26–30 10.2 26.7 4.10 22.2 8.11 20.13 4.88 17.90
31 + 2.4 10.5 0.35 4.9 3.19 10.35 1.23 6.94
Note: Figures in brackets indicate cumulative total.Source: Chutani and Gyatso (1993); Gyatso and Bagdass (1998).
Box 2.9—Early marriage in Sikkim
At the heart of early marriage in Sikkim, is the system of socially sanctioned elopement (bhagaune pratha).This system probably evolved because of the strict caste system prevailing in Nepali society. Under this system,caste exogamy was strictly prohibited for both the higher and lower castes. Faced with the threat of socialostracization and sometimes severe punishments for inter-caste marriage, bhagaune pratha evolved as amechanism for social acceptance.
Bhagaune pratha allows a boy and a girl from different castes and social backgrounds to elope. After threedays of living together, the boy’s family goes to the house of the girl to inform them of the whereaboutsand well being of the girl. Some amount of money, alcohol and milk are paid to the girl’s parents, and themarriage is formalized. Though parents may not be happy, they are forced to accept the marriage on accountof both social and moral pressure. This continues to be a major mode of marriage between castes and to acertain extent between communities.
High levels of expenditure that have to be incurred in traditional marriage ceremonies have also helped togive sanction to bhagaune pratha.
Unfortunately, this practice of elopement has for the last few decades become increasingly casual—to theextent that young girls and boys who want to avoid going to school or take up any family responsibilityoften elope. Fortunately, it has not led to any violence. Almost every family/home has suffered from thisphenomenon of untimely marriage.
B U I L D I N G H U M A N C A P A B I L I T I E S • 3 5
The situation seems to be more alarming in the urban areas. Among the married women surveyed in 1989,
almost 39 per cent got married before they turned 17 years and another 36 per cent by the time they attained 20
years of age. Though this situation improved in 1997, almost 71 per cent of urban women got married before
they attained 20 years.
Although the issue of early marriage has to be addressed in Sikkim, ii should be noticed that the median age
at first marriage in 1998–9 was higher (19.8) than that at the national level (16.4). In the effort to reduce the
incidence of early marriages in the State, a Small Family Scheme was started in 1997 (Box 2.10).
Health issues
The system of under-age marriage and early motherhood has a debilitating impact on the health of girls and
women. To discourage this, a strong focus on adolescent health education including sex education is needed in
the school curriculum.
An institutionalized mechanism of sensitizing the young boys and girls to the ill effects of early marriage
should be introduced. There should also be effective implementation of the Child Marriage Restraint Act. So far
this act has never been operationalized either as a punitive measure or as a deterrent.
Women’s empowerment
The role of women’s empowerment for a just society was highlighted in the Beijing Conference (1995). Sikkim
has a tradition of collective decision making by communities through the institution of the ‘Dzumsa’. However
traditional institutions do not witness a significant role for women. The empowerment of women however, has
to be at the core of state strategies and action.
Both the Central and State governments have introduced a number of programmes, e.g. Mahila Samriddhi
Yojana, Balika Samriddhi Yojana and the Small Family Scheme, to promote both women’s welfare and their
empowerment. Gender concerns have been addressed in the State through an array of women-specific welfare and
empowerment programmes (Government of Sikkim, 1998c).
Though the stipulated one-third reservation for women in Panchayats has been fully implemented, in reality
the situation is characterized by low participation in Panchayat meetings and surrogate representation. There is a
need to encourage women members to meet separately and discuss major policy and development issues, as well
as strategize them to tackle domestic violence. Gender issues raised in Panchayat meetings mostly pertain to
violence, such as wife beating by an alcoholic male member and husband bringing home a second wife. These
Box 2.10—Small Family Scheme
Measures have been taken by the government to control early marriages. The ‘Small Family Scheme’ hasbeen started by the State government throughout the State from April 1997. Under this scheme, girls whohave attained the age of 13 years are given financial incentives. This aims at controlling population by delayedmarriage and at reducing female mortality rate.
Girls who are 13 years of age as on April 1, 1997, and who are not married, receive a fixed deposit certificateof Rs 2,000 from the State Bank of Sikkim in their names. The Scheme provides an incentive of Rs 2,000 ifshe marries after the completion of 21 years, an additional incentive of Rs 500 if she marries at the age of22 and if she marries at the age of 23, an additional incentive of Rs 1,000 is paid to her. So far this schemehas covered over 1,200 children.
3 6 • S I K K I M H U M A N D E V E L O P M E N T R E P O R T 2 0 0 1

issues which are usually pushed under the carpet in other States, are openly discussed in Sikkim, and this is an
encouraging sign.
However, in the absence of either a comprehensive study on gender related issues in Sikkim or any gender
audit of the development programmes of the State government, it is difficult to make a correct assessment of the
situation of women. In order to mainstream gender concerns into the core of development planning and action,
public debate on gender issues needs to be encouraged, with the involvement of media, NGOs, researchers and
social activists, along with the government and international development partners. It is hoped that with the
setting up of State Women’s Commission, the agenda of gender equality will be placed at the centre of the State’s
development strategies.
Trends in HDI and GDI
Sikkim has made substantial progress in achieving a relatively high level of literacy rate, providing basic health
services to the people, rendering material support to school going children. A positive trend between 1991, 1995
and 1998 was recorded both in terms of literacy rates as well as those of life expectancy. This has contributed to
an increase in HDI and GDI values over this decade. The growth rate of HDI slowed down from 2.75 per cent
between 1991 and 1995 to 1.85 per cent between 1995 and 1998 (Table 2.10). This decline was due to overall
retrogression of all the related indices of the HDI, except for the Per Capita Income Index (PCYI).
TABLE 2.10—HUMAN DEVELOPMENT INDEX AND ITS COMPONENTS (1991, 1995 AND 1998)
Year DistrictLife
ExpectancyLiteracyIndex
EnrolmentRatio Index
EducationalAttainment
IndexPer Capita
Income Index
HumanDevelopment
Index
State 0.625 0.569 0.436 0.525 0.274 0.454
North 0.478 0.535 0.351 0.473 0.221 0.391
1991 East 0.690 0.651 0.458 0.587 0.228 0.501
West 0.647 0.456 0.423 0.445 0.205 0.432
South 0.653 0.541 0.433 0.505 0.203 0.454
State 0.650 0.674 0.476 0.608 0.253 0.504
North 0.498 0.657 0.382 0.565 0.252 0.439
1995 East 0.715 0.748 0.500 0.665 0.269 0.550
West 0.672 0.587 0.462 0.545 0.238 0.485
South 0.678 0.638 0.472 0.583 0.242 0.501
State 0.663 0.738 0.448 0.641 0.292 0.532
North 0.512 0.730 0.362 0.607 0.282 0.467
1998 East 0.730 0.806 0.470 0.694 0.310 0.578
West 0.687 0.666 0.436 0.589 0.271 0.576
South 0.692 0.696 0.446 0.613 0.282 0.529
Source: Calculated by the author.
The East district, where the State capital is located and substantial public investments are made, has consistently
recorded the highest achievements in human development indicators in the State. At the other end of the spectrum
is the North district, which has the largest district in terms of geographical area. However, due to the rugged terrain,
settlements are highly scattered, communication is very difficult, and health and educational facilities are limited.
B U I L D I N G H U M A N C A P A B I L I T I E S • 3 7

The Gender-related Development Index (GDI) has consistently improved between 1991 and 1998 (Table 2.11).
TABLE 2.11—GENDER DEVELOPMENT INDEX AND ITS COMPONENTS (1991, 1995 AND 1998)
Year DistrictLife Expectancy
at BirthEducational
Attainment IndexPer Capita
Income IndexGender
Development Index
1991 State 0.627 0.515 0.193 0.445
North 0.480 0.460 0.202 0.381
East 0.693 0.579 0.193 0.488
West 0.648 0.432 0.195 0.425
South 0.655 0.500 0.187 0.447
1995 State 0.651 0.616 0.230 0.499
North 0.501 0.577 0.233 0.437
East 0.717 0.670 0.230 0.539
West 0.672 0.557 0.228 0.485
South 0.680 0.672 0.224 0.525
1998 State 0.665 0.655 0.266 0.528
North 0.513 0.629 0.261 0.467
East 0.732 0.702 0.266 0.567
West 0.687 0.610 0.259 0.518
South 0.694 0.757 0.261 0.571
Source: Calculated by the author.
Between 1991 and 1995 the GDI values registered a sharp rise due to a substantial increase in the values of
Education Attainment Index (EAI) and PCYI, which had been hovering around 5 per cent per annum. Only in
the case of life expectancy at birth, the growth rate remained below the level of 1 per cent per annum. However,
the pace of GDI increase declined significantly between 1995 and 1998. Although the growth rate of PCYI increased
significantly also between 1995 and 1998, there was a slow down in the growth of EAI. The subdued performance
of GDI in 1998 is due to the decline in the score of deprivation index of enrolment rate for both male and female.
Though the districts have shown persistent rise in GDI values, the rate of improvement has varied widely
among the districts. For example, the affluent East district scored 0.488 in 1991, whereas the North district scored
just 0.381 in the same year. However, the extent of inter-district variations in GDI is declining over the years. The
East district has reached 0.567, whereas the North has improved to 0.407 in 1998.
Conclusion
The State seems to have recorded several achievements, reflected also in the level of the HDI and GDI, in the
social sectors. However, a greater focus on strengthening elementary education is required. Further, vocational
education needs to be emphasized to cater to a large number of youth. Greater attention has to be paid to reduce
the incidence of communicable diseases.
Sikkim’s human development achievements compare favourably with the national average and with other
states in the North-East. However, the challenges of quality and easier access need to be addressed further. Successes
in school education can be sustained through improvements in quality and more effective linkages with the job
market. Given the critical role and potential of youth in Sikkim’s human development, a focus on technical and
higher education as also upon health and livelihood related issues of adolescents is the need of the hour.
Chapter 3 4
3 Contents
3 8 • S I K K I M H U M A N D E V E L O P M E N T R E P O R T 2 0 0 1

Land andAgriculture
Land andAgriculture


Chapter
3��
Land and Agriculture
Introduction
Like other hilly and mountainous areas, the question of land has been central to the political economy of Sikkim,
both because it is scarce and because of historical factors. For many centuries, feudalism had a stranglehold over
land and society. Land rights were vested primarily in the nine Kazi (feudal lords) families, with each region rigidly
separated from the others. According to the 1991 Census, Sikkim was predominantly rural with nearly 91 percent
of the population living in villages.
In Sikkim, as elsewhere in the country, the movement for democracy and greater political and civil rights, was
based on the demand for the abolition of the Zamindari system.1 The abolition of the Zamindari system in 1949,
was immediately followed by an official notification making it compulsory for all revenues against land raised by
revenue agents to be deposited directly with the government. The private estates of the Durbar, and the monastery
land were left untouched by this new land regime. As the debate on land reforms and its vital role in initiating
changes in the agrarian society for a rapid transformation picked up, land reform issues gradually gained ground,
with both political and social dimensions.
Until 1976, there were only four District Collectorates. The District administration was headed by the District
Collectors, reporting to the Secretary, Land Revenue Department, whose office was responsible for maintaining
the records of rights. Accordingly, The Directorate of Survey and Settlement (now known as New Land Record
Office) was established in 1976, to ascertain the records of rights and the ownership of land through periodic
survey operations.
The first scientific survey of land in Sikkim was carried out in 1950–8, using the British measurement system
of acres and miles. The second, 1976–83 survey is till date the last land survey carried out after Sikkim became a
constituent State of India. The metric system of hectares and kilometres was used, and the survey covered all the
areas of Sikkim. This was a critical survey, because previous land records had undergone several changes due to
partition, mutation, registration and acquisition by the government, private parties and others.
In the 1976–83 round of survey, the age-old elakas were delimited and revenue blocks similar to those in
other States were created. At present, there are 411 such revenue blocks, which are divided among 40 village level
circles comprising 10 to 11 revenue blocks per circle.
1. This is a system of land tenure in which the principal landowner or Zamindar, is a rent receiver rather than a cultivator. Its beginningsin modern India go back to the Permanent Settlement of 1793.

The next step in the improvement and modernization of land records was their computerization, which was
completed in 1998 (Box 3.1).
The following features characterize land relations in Sikkim:
i) Small operational holdings and declining cultivation: The total land under operational holding in 1991, was hardly
16 percent, while the remaining 84 percent was taken up by trees and groves (42 percent), barren land (22 percent)
and permanent pastures and grazing land (17 percent). However, after the merger with the Indian Union and the
consequent introduction of constitutional democracy; there has been a gradual increase in the total land area for
utilization by over 32,000 hectares during the fifteen-year period between 1976–7 and 1991–2. This is mostly due
to the increase in cultivable wasteland and land available for cultivation. In spite of this increase, the net area
sown has gone down between 1980–1 and 1990–1 (Table 3.1).
TABLE 3.1—LAND USE PATTERN IN 1981 AND 1991
Classifications 1980–81 1990–91
(Hectares) (%)* (Hectares) (%)*
Net Area Sown 78,381 11.04 63,254 8.91
Area under current fallow 4,428 0.62 3,906 0.55
Other uncultivated area excluding fallow land 4,560 0.64 10,830 1.53
Fallow other than current fallow 9,474 1.34 9,204 1.30
Cultivable wasteland 681 0.10 9,807 1.38
Land not available for cultivation 11,604 1.64 14,300 2.02
Total operated land 109,068 15.37 111,302 15.69
Note: * indicates the percentage distribution of different land use heads. The total geographical area is 709,600 hectares.Source: Government of Sikkim (1991), State Report on Agriculture—Census, 1990–91, Bureau of Economics and Statistics, Gangtok.
ii) Declining per capita availability: Per capita availability of net cultivated area has also recorded a sharp decline
from 0.31 hectare in 1971 to 0.27 hectare in 1981 and 0.17 hectare in 1991. However, wide variations continue
to exist across districts. The extent of fragmentation and partition of land can be assessed from the phenomenal
increase in the number of land holdings from 17,000 in 1950–8 to 54,500 as per the survey of 1976–83.
Box 3.1—Computerization of land records
A countrywide programme of computerization of land records was launched in 1988–9. The idea was to
make computerized land records readily available to every citizen.
Sikkim has the rare distinction of being the first State in the country to have fully computerized land records.
The work started in 1992, and all the land records as on January 1, 1998 have been documented. They
include records of revenue administration and individual rights.
Each landholder can now have a computerized record of his/her land rights. As computers have been installed
in both the district and sub-division offices, the records can be updated on a regular basis. This can even
provide online mutation.
4 0 • S I K K I M H U M A N D E V E L O P M E N T R E P O R T 2 0 0 1

An analysis of the district-wise distribution of cultivated land shows that in 1976–83 the share of West district
was the highest with 29.34 percent of the total cultivated area, followed by East (28.96 percent) and South (26.95
percent). The North district with a meagre share of 14.76 percent has the lowest cultivated land availability. With
respect to land revenue, however, the East district contributed the largest share (33.64 percent) of the total revenue
collection (Table 3.2).
TABLE 3.2—DISTRICT-WISE LAND DISTRIBUTION AND REVENUE IN SIKKIM (1976–83)
Districts Area Land Revenue
(Hectares) (% share) (Rs) (% share)
North 16,228.00 14.75 24,761.51 8.75
East 31,846.16 28.96 95,192.29 33.64
South 29,629.77 26.95 81,962.99 28.96
West 32,259.07 29.34 81,079.62 28.65
Total 109,963.00 100.00 282,996.40 100.00
Source: Government of Sikkim, Land Records Section, Department of Land Revenue, Gangtok.
Out of the total cultivated land of 109,963 hectares, dry land constituted 58 percent, followed by cardamom
(19 percent), paddy (13 percent) and wasteland (10 percent) (Table 3.3). This reflects the cropping pattern in
Sikkim where different districts were prominent for each of the above four categories. The maximum dry land
area was in the West district (35 percent), followed by the South district (33 percent), the East district (21 percent)
and the North district (11 percent). The largest portion of cardamom land was in North (32 percent), followed
by East (29 percent), South (21 percent) and West (18 percent). In case of paddy, the South district ranked first
(44 percent), followed by West (25 percent), East (23 percent) and North (8 percent). It may be noted that
cardamom, the most vital cash crop, is predominantly grown in the tribal belt in the North district.
TABLE 3.3—DISTRICT-WISE DISTRIBUTION OF CULTIVATED LAND (1976–83)(PERCENT OF GRAND TOTAL)
District Total Paddy Fields Total Dry Land Wasteland CardamomArea
Total Cultivated Land
Area Landrevenue
Area Landrevenue
Area Landrevenue
Area Landrevenue
North 8.03 7.12 10.96 9.37 8.07 8.10 32.42 14.76 8.75
East 23.15 23.96 20.73 22.20 52.39 52.50 28.74 28.96 33.64
South 44.05 44.99 32.90 35.72 15.15 15.20 20.78 26.95 28.96
West 24.78 23.93 35.41 32.71 24.39 24.19 18.06 29.34 28.65
Grand Total (ha) 14,680.6 53,786.2 64,739.8 172,986.1 11,734.4 16,362.5 21,761.7 109,963.0 282,996
Source: Government of Sikkim, Land Records Section, Department of Land Revenue, Gangtok.
Ethnic groups and land
Land distribution and land revenue contribution according to the three major ethnic groups in the State, namely
Bhutias, Lepchas and Nepalis, is highly uneven. This may be explained by historical factors (Box 3.2).
L A N D A N D A G R I C U L T U R E • 41

In 1983, the Nepalis owned almost 59 percent of the total cultivated land and contributed almost 64 percent
of the total land revenue generated in the State (Table 3.4). In contrast, the land share of the Bhutias and the
Lepchas was 20 percent each and their land revenue contribution was 19 percent and 16 percent respectively. It
was only with respect to land under cardamom cultivation that Nepalis did not rank first either in terms of owned
areas or land revenue. Of 21,762 hectares, devoted to cardamom cultivation 33 percent was owned by the Lepchas,
followed by Bhutias (27 percent) and the Nepalis (22 percent), with the remaining 19 per cent being outside the
public domain.
Since 1983, however, the composition of landholdings is expected to have changed due to normal partition
of families, resulting in fragmentation of holdings, as well as the acquisition of land by the State Government and
the Army for development and other purposes. However, in line with the Revenue Order No. 1 of 1917, the land
belonging to the two indigenous tribal communities of the State would have remained unaffected and unalienated.
Box 3.2—Historical perspective
An old bustiwala still remembers how chakureys and pakhureys worked as very subservient tenants on private
and monastery estates. They held tenancy rights in lieu of compulsory manual labour to be provided by
them to the lord of the estate. This was generally provided by a member of the tenant’s family.
The adhiadars and kutdars were the other categories of tillers available in the villages who paid high rents in
terms of produce. The adhiadars were engaged to cultivate on condition that they rendered half of the produce
to the primary holding while kutdars were engaged to cultivate on condition that they rendered a stipulated
amount of crops or cash to the primary holder. The children of the kutdars, who lay at the very bottom of
the scale, had to provide other services like cattle tending. The vagaries of nature made these tenants very
vulnerable as they had no protection against crop failure and the related remissions on rent realization.
Cultivation was carried out in the name of bustiwalas and mandals (village headmen) as they were the
block-appointees of the Kazis. The mandals in turn rented out the arable land to the individual families of
cultivators. The actual tiller was a mere tenant-cultivator. Actual holdings of land extended upto 30 acres in
the case of a mandal, and upto 200 acres for the Kazis themselves (cf. Revenue Circular dated 16 October
1924). The Kazis and aristocrats assessed the revenue payable by all the people settled on the land within
their jurisdiction and paid only a fixed sum to the ruling house (Kotturan, 1983).
The land under the Durbar (feudal estates) and those under the monasteries were much larger. In fact, these
complex layers of intermediaries produced the judicious separation of the State and the tiller that ensured
the preservation of the feudal hierarchy.
J.C. White, the first British Political Officer in Sikkim, introduced a modified lease system of land tenure in
1888. This led to the emergence of new land settlement pattern that ultimately brought about a change in
land ownership pattern. It resulted in the emergence of some early Nepali settlers (particularly the Newars)
as lessee landlords who were later designated as thikadars (Sinha, 1975; Datta, 1994).
The emergence of lessee landlordism may be taken as an important turning point in ethnic relations in
Sikkim. Since all registrations of land transaction were accomplished through the lessee landlords, they could
absorb as many newcomers as they wanted. It was in fact easy to extract initial payments in the form of
nazaranas (Basnet, 1974). The tenants, however, did not have any security of tenancy rights on the land under
the jurisdiction of lessee landlords. Thus, they remained at the mercy of the lessees.
4 2 • S I K K I M H U M A N D E V E L O P M E N T R E P O R T 2 0 0 1

TABLE 3.4—CASTE-WISE DISTRIBUTION OF LAND IN SIKKIM (1976–83)(AREA IN HECTARES, RENT IN RS)
Caste Total Paddy Fields Total Dry Land Wasteland CardamomArea%
Total Cultivated Land
Area%
Rent(Rs)
Area%
Rent(Rs)
Area%
Rent(Rs)
Area%
Rent(Rs)
Bhutia 27.12 25.13 16.13 15.37 24.18 24.28 27.05 20.32 19.11
Lepcha 14.97 14.07 18.48 17.53 13.42 32.72 20.38 16.15
Nepali 57.19 60.80 64.95 67.10 62.00 62.25 22.37 58.66 64.74
Total Public 99.28 100.00 99.56 100.00 99.60 100.00 82.15 99.36 100.00
Grand Total (ha) 11,727.1 93,647.9 64,739.8 172,986.1 11,734.4 16,362.5 21761.7 109,963.02 82,996.4
Note: Though it should have been ethnic group wise, the term ‘caste-wise’ is used on the record. Source: Government of Sikkim, Land Records Section, Department of Land Revenue, Gangtok.
In fact, Sikkim has a tradition of protecting traditional land tenures and there is considerable sensitivity
regarding the maintenance of customary laws governing ownership and proscribing alienation to outsiders. Some
of the old laws of Sikkim have been upheld by the highest court of law in the country.
There have been several safeguards for ensuring land rights of the two indigenous tribal communities, the
Bhutias and the Lepchas. The first step in this direction goes back to 1917, when the Government of Sikkim issued
a notification termed as Revenue Order No. 1, which prohibited sale or transfer of land belonging to Bhutias or
Lepchas to non-Bhutias or Lepchas without the permission of the State. The Notification No 3082/L.R., dated 24
March 1954, issued by the Land Revenue Department, of the Sikkim State and signed by Tashi Namgyal, the
Maharaja of Sikkim, reinforced the Revenue Order No. 1 of 1917. This notification remained in force even after
1975, and has been strictly implemented.
In the late 1980s, the Sikkim Alienation of Land (Regulation) Bill, 1989, and the Sikkim Transfer of Land
(Regulation Bill, 1989) were also passed by the State Legislature. These bills respectively aimed at restricting
alienation of land by the members of Bhutia and Lepcha communities of Sikkimese origin to persons other than
Bhutia and Lepcha of Sikkimese origin and also by Sikkimese in favour of non-Sikkimese. These bills have been
reserved by the Governor pending the assent of the President.
It is important to note that this regulation is applied even in cases that could conceivably be in the larger interest
of the State in terms of providing employment opportunities, as in the case of private industrial enterprises. It is
possible to obtain on lease land belonging to tribals, but only after obtaining the permission of the State Government.
Inequitable land holdings
Distribution of operational landholdings in Sikkim is skewed. In 1990–1 the lowest echelon of landholders, the
marginal holders, representing about 50 percent of landholdings, held 10.3 percent of the total operational land
area. The East district had the highest concentration of landholding by marginal farmers both in terms of number
of holdings (56 percent) and area (12.8 percent) (Table 3.5). In contrast, farmers with large holdings (more than
10 hectares) accounted for 2.3 percent of the landholdings, but owned 20.2 percent of the operational area. The
North district had the highest number of large farmers who, with 5 percent of the operational holdings, owned
over 30 percent of the operated land within the district. However, except in the East district, land holdings and
operated area are well distributed at least among the small and semi-medium farmers.
Inequality also characterizes land distribution among farmers belonging to Scheduled Castes (SCs). On one
hand, large farmers, who are not even 1 percent (0.4 percent) of the total number of SC farmers, held nearly 10
L A N D A N D A G R I C U L T U R E • 4 3

percent of the operated area (Table 3.6). On the other, marginal farmers, representing 70 percent of SC farmers,
operated 27.2 percent of the operated area. A positive sign, however, is the fact that small farmers, representing
over 19 percent of the operated holdings, owned almost 28 percent of the operated area.
TABLE 3.5—DISTRICT-WISE AND SIZE/CLASS-WISE DISTRIBUTION OF LANDHOLDINGS (1991)
Category North Holding East Holding South Holding West Holding
No. (%) Area (%) No. (%) Area (%) No. (%) Area (%) No. (%) Area (%)
Marginal 49.0 8.5 56.0 12.8 44.3 9.7 46.0 10
Small 10.0 5.1 22.0 22.0 25.0 18.5 21.0 17
Semi-Medium 18.0 20.0 14.0 23.0 18.0 24.0 20.0 28
Medium 17.0 36.0 6.4 23.0 10.0 26.0 11.2 31
Large 5.3 30.0 1.3 17.0 3.0 22.0 2.1 14
Total (hectares) 4,942 14,407 19,666 32,936 12,548 28,575 13,971 31,088
Source: Computed from Bureau of Economics and Statistics, Government of Sikkim, Gangtok.
In the case of the Scheduled Tribe (ST) farmers, land distribution is not as skewed. The number of marginal
farmers is much lower (42 percent) whereas the semi-medium and medium farmers together owned more than
35 percent of the operated holdings and over 57 percent of the operated land. However, in this case also, large
farmers, who constituted hardly 5 percent of the ST farmers, had a giant share of over 28 percent of the land area
under their possession. This is indicative of the fact that the traditional patterns of land holdings in Sikkim have
not undergone any significant change.
TABLE 3.6—LAND DISTRIBUTION WITHIN THE SCHEDULED CASTE AND SCHEDULED TRIBE POPULATION (1991)
Category of Holdings
Scheduled Caste Share in Scheduled Tribe Share in
Number Areahectares
Number % Area % Number Areahectares
Number % Area %
Marginal 1,366 547 70.1 27.2 7,073 3,425 42.3 7.2
Small 370 558 19.0 27.7 2,901 4,384 17.4 9.2
Semi-Medium 164 468 8.4 23.3 3,421 10,497 20.5 22.0
Medium 43 247 2.2 12.3 2,487 15,962 14.9 33.5
Large 7 191 0.4 9.5 827 13,362 4.9 28.1
All 1,950 2,011 100 100 16,709 47,630 100 100
Source: Computed from State Report on Agriculture Census (1990–1), Bureau of Economics and Statistics, Government of Sikkim, Gangtok.
Land tax and revenue
Levy on land used to be the major source of government revenue. In 1889, land revenue constituted as high as
66 percent of the total revenue of Sikkim. The rest came from forest (13.5 percent), excise (7.1 percent) and from
miscellaneous activities. In 1930-1 land revenue realization used to be 27.5 percent of the total revenue
mobilization (Debnath, 1974).
However, in the post-merger period, the contribution of land revenue to the State exchequer has been very small
4 4 • S I K K I M H U M A N D E V E L O P M E N T R E P O R T 2 0 0 1

both because of low rates imposed by the State and the sensitivity involved in dealing with land issues. This
pattern has persisted in spite of the fact that revised land rent rates were announced in 1998, and more land was
diverted from the traditional system of subsistence farming to commercial cultivation (Table 3.7).
TABLE 3.7—LAND REVENUE RATES (1998)
Type of Land Class
(Rs) (Rs) (Rs)
1 WET LAND
Circle ‘A’ (per ha) 20.00 16.00 12.00
Circle ‘B’ (per ha) 18.00 4.00 10.00
Circle ‘C’ (per ha) 16.00 12.00 8.00
Special Circle ‘C’ (per ha) 12.00 8.00 6.00
2 DRY LAND
Circle ‘A’ (per ha) 8.00 6.00 6.00
Circle ‘B’ (per ha) 8.00 6.00 4.00
Circle ‘C’ (per ha) 6.00 6.00 4.00
Special Circle ‘C’ (per ha) 6.00 4.00 4.00
3 BANJO (barren)
Banjo of all the Circles (per ha) 2.00 2.00 2.00
Source: Government of Sikkim (1998), Sikkim Government Gazette. Land Revenue Department, Gangtok.
Land reforms
After changes in land regulations were introduced in 1949, the State of Sikkim issued a Notification, No 3082/L.R,
in 1954, which has some progressive elements of land reforms and provides for the maintenance of economic
holdings.
The lower ceiling of land holding is ensured by the provision of the ‘sale of land in execution’. It is stated that
( . . . ) No Court will sell or transfer a holding or any part of a holding of a primary holder in execution of a decree,whether revenue or civil, if by such sale or transfer the said holding will become less than five acres in area . . .provided that sale of land to meet Government dues will be excluded from the purview of this notification.
This notification also fixed an upper ceiling through ‘restrictions on purchase’, according to which ‘No person
who already has a holding or holdings exceeding 20 acres in area may purchase land sold in execution of a revenue
or civil decree’.
In a mountainous State like Sikkim, the all India land ceiling of 12 acres, which is a blanket ceiling irrespective
of topographical variations, is difficult to implement. It might be more appropriate to fix land ceilings, on a case
to case basis using methods suitable to the terrain.
After the merger of Sikkim in 1975, the government intervened mainly to provide legislative measures against
the termination of cultivation rights and for the continuity of cultivation by existing cultivators. This was done in
view of the problems faced by the tillers of the soil, who cultivated land owned by others under precarious terms
and conditions.
Among the numerous land reform measures adopted by the State Government; the most notable are the
enactments of Sikkim Agricultural Land Ceiling and Land Reforms Act 1977, Cultivators Protection Act 1985, and
L A N D A N D A G R I C U L T U R E • 4 5

the Land Bank Scheme of 1995. These acts and measures helped to make the transition from a feudal past to a
more egalitarian society, relatively smooth.
The Land Bank Scheme is the latest welfare scheme introduced by the Government of Sikkim to consolidate
land reform measures in the State. Under this scheme the landowners donate a certain part of their land, entirely
voluntarily, to the government. This land is then distributed to the landless (Sukumbasis), identified by the
department concerned on the basis of a detailed survey. A landless household is now entitled to half an acre of
land, with the settlement deed carrying the names of both husband and wife. The upper limit of the land cost
has been fixed at Rs 25,000.
It is important to note that this Scheme puts the onus of looking for suitable cultivable land on the beneficiary
who can select the land of his choice. Over 301 families have benefited from this Scheme. The success of this
scheme reinforces the fact that the programme of land reforms implemented so far has not led to any significant
redistribution of land in Sikkim. This has had adverse effects on both social cohesiveness and agricultural
productivity.
Agriculture
Before the merger in 1975, the agriculture sector was characterized by uncertainty about land tenure rights,
negligible public investment and over-dependence on traditional technologies. This sector has recorded consid-
erable progress during the last two decades. In the past low productivity, negligible marketable surplus and other
institutional inadequacies, which plagued the economy, led to agricultural backwardness (Box 3.3).
In the post-merger period, the strategy was to provide a package of services aimed at consolidating peasant
economy. This covered land reforms, agricultural credit and marketing, provision of inputs like seeds, fertilizers,
minor irrigation, and encouragement to horticulture and cash crops. Thus, despite the limited cultivable land in
Sikkim, agricultural development has made considerable progress during the last two decades. Introduction of
new crops (including wheat, rajmah, rape and mustard), extension of more areas under high-yielding and improved
varieties of seeds, increased use of fertilizers and pesticides and expansion of area under double or multiple
cropping have been successful in converting agriculture from subsistence farming into an economically viable
venture.
The total food grain production in the State has increased from nearly 62,000 tonnes in 1980–1 to 103,000
tonnes in 1997–8 (Table 3.8). However, between 1996–7 and 1997–8 a decline has been registered. For a State
that has hardly 64,000 hectares of net sown area, this range of output is very high.
Box 3.3—Pre-merger Sikkim: Determinants of agricultural backwardness
Some of the reasons responsible for agricultural backwardness in Sikkim till 1975 were:
• Physical features of the state, necessitating terrace cultivation.
• Extreme concentration in land-holding patterns.
• Low cropping intensity due to mono-cropping.
• Outmoded technologies of production.
• Inadequate thrust on agriculture in terms of investment and planning.
• Inadequate infrastructural support in transportation, communication, irrigation, technical research andmarketing.
4 6 • S I K K I M H U M A N D E V E L O P M E N T R E P O R T 2 0 0 1

TABLE 3.8—FOOD PRODUCTION (IN TONNES) IN SIKKIM (1980–98)
Crops 1980–87 1985–86 1990–91 1995–96 1996–97 1997–98
Maize 28,930 47,000 58,810 56,560
Rice 10,630 16,500 25,300 21,880 22,100 21,400
Wheat 13,310 16,200 21,600 15,300 14,800 14,200
Barley 460 1,400 2,860 1,570
Buck Wheat 1,380 2,000 2,540 1,740 62,900* 61,900*
Finger Millet 3,840 4,300 7,310 4,750
Pulses 3,320 10,010 15,020 5,920 6,000 5,900
Total 61,870 97,410 133,440 107,720 105,800 103,400
Note: * This includes all the coarse varieties of food grains including maize.Source: Government of Sikkim, Department of Agriculture and Government of India, Economic Survey, Ministry of Finance,
Various Issues.
Though maize has never been a staple food in Sikkim, its production has steadily increased since 1980–1,
and contributes to over 50 percent of the total food grain production in the State (Table 3.9). On the other hand,
the share of rice, the main food item in the traditional diet, in the total food production, has increased only by
20.7 percent. However, its share is expected to have increased after 1997–8. Wheat production, which increased
in absolute terms only in the 1980s, has shown a consistent decline in its contribution to the State’s food grain
production.
TABLE 3.9—SHARE (IN PERCENT) OF DIFFERENT CROPS IN TOTAL FOOD PRODUCTION (1980–98)
Crops 1980–87 1985–86 1990–91 1995–96 1996–97 1997–98
Maize 46.76 48.25 44.07 52.51 0.00 0.00
Rice 17.18 16.94 18.96 20.31 20.89 20.70
Wheat 21.51 16.63 16.19 14.20 13.99 13.73
Barley 0.74 1.44 2.14 1.46 0.00 0.00
Buck Wheat 2.23 2.05 1.90 1.62 59.45* 59.86*
Finger Millet 6.21 4.41 5.48 4.41 0.00 0.00
Pulses 5.37 10.28 11.26 5.50 5.67 5.71
Note: * This includes all the coarse varieties of food grains including maize.Source: Government of Sikkim, Department of Agriculture, and Economic Survey, Ministry of Finance, Government of India,
Various Issues.
District-wise analysis of food grain production indicates that the contribution of the West district is the highest
(36 percent), followed by the East district (31 percent), the South district (26 percent) and the North district
(hardly 7 percent) (Table 3.10). The West district has the highest share in the state production of finger millet,
barley, buckwheat (along with the South district), and pulses. The East district ranks at the top with respect to
rice and wheat production, while the North district has the highest share in the production of maize.
Although increased importance has been given to agriculture after the merger, investment in this sector has
been low (Table 3.11).
Storage and marketing constitutes less than 6 percent of the total public investment in the sector (Table 3.12).
As Sikkim has been declared a food deficit State, there is no question of marketing food grains outside the State.
L A N D A N D A G R I C U L T U R E • 4 7

TABLE 3.10—DISTRICT-WISE FOOD PRODUCTION (IN TONNES) IN 1998-99
Crops North East South West Total
Rice 1,917 9,290 3,270 7,480 21,957
Wheat 826 2,370 1,020 2,200 6,416
Maize 2,230 13,450 16,620 18,500 50,800
Finger Millet 643 1,520 950 1,600 4,713
Barley 207 270 140 600 1,217
Buckwheat 148 440 480 480 1,548
Pulses 657 1,580 1,670 2,280 5,596
Total Food grains 6,038 28,920 24,150 33,140 92,248
Source: Government of Sikkim, Department of Agriculture, Gangtok.
TABLE 3.11—BUDGET EXPENDITURE ON AGRICULTURE (1975–76 TO 1999–00)(AMOUNT IN Rs ’000)
Year State Budget Total Budget % of Total % Total
Plan(In thousand)
Non-Plan(In thousand)
Plan(In thousand)
Non-Plan(In thousand)
Plan Non-Plan
1975–76 4,128 3,304
1980–81 2,190 3,247 202,400 372,193 1.08 1.60 0.95
1985–86 24,300 8,047 413,800 414,255 5.87 1.94 3.91
1990–91 25,825 17,885 760,000 906,615 3.39 1.97 2.62
1995–96 25,440 23,557 1,520,000 4,767,808 1.67 0.49 0.77
1999–2000 36,400 44,675 2,500,000 4,145,067 1.07 1.07 1.22
Source: Government of Sikkim, Department of Agriculture, Gangtok.
TABLE 3.12—PLAN INVESTMENT IN AGRICULTURAL ACTIVITIES
Heads Fifth Plan (%) Sixth Plan (%) Seventh Plan (%)
Research and Education 4.98 3.42 5.10
Crop Husbandry 92.14 91.55 81.77
Storage and Warehousing 1.03 1.64 2.58
Agriculture Marketing and Quality Control 1.82 3.38 2.76
Soil and Water Conservation 7.30 3.90 7.76
Total investment (’000) 404.40 1,098.50 1,890.20
Source: Government of Sikkim, Various Plan Documents.
Within the budgetary constraints some progress has been made in the distribution of improved agricultural
inputs including chemical fertilizers and pesticides. By 1990–1, the area covered under plant protection increased to
59.40 thousand hectares from about 17.14 thousand hectares in 1979–80. Fertilizer consumption of 720 tonnes in
1979–80 (in terms of nutrients) has now gone to over 3,000 tonnes, Yet, among the hill States of India, Sikkim, with
a per hectare consumption of 5.8 kg, has the third lowest utilization of fertilizers (Table 3.13).2 This, however, is not
reflected in the pattern of yield in the State. Yields of almost every crop have in fact been increasing year after year.
2. Arunachal Pradesh ranks first, with a consumption of 2.2 kg per hectare, followed by Nagaland (4.8 kg per hectare).
4 8 • S I K K I M H U M A N D E V E L O P M E N T R E P O R T 2 0 0 1

TABLE 3.13—PER HECTARE CONSUMPTION OF FERTILIZERS (N+P+K) OF THE HILL STATES IN INDIA (KG/HA)
States 1986–87 1990–91 1995–96 1996–97 1997–98
Arunachal Pradesh 0.08 1.79 1.6 2.2 2.2
Assam 4.59 10.18 9.7 14.6 21.9
Himachal Pradesh 26.56 35.49 30.6 35.5 36.5
Manipur 29.95 43.68 43.6 48.6 49.7
Meghalaya 16.49 12.32 11.8 14.4 15.0
Mizoram 0.08 11.19 6.9 3.4 10.2
Nagaland 0.23 5.30 2.4 3.9 4.8
Sikkim 26.01 10.11 8.3 5.9 5.8
Tripura 1.55 20.72 18.4 18.8 29.3
Source: Fertilizer Statistics 1997–8, Fertilizer Association of India, New Delhi.
The fact that the present levels of pesticide and fertilizer use are low may be to the advantage of the State,
given the fact that yields in the erstwhile Green Revolution States, which have high levels of chemical inputs, have
reached plateaus or are declining. Sikkim can delay or avoid a similar situation by supplementing chemical inputs
with organic ones. This is likely to mitigate the adverse environmental impact of the increased use of chemicals.
The organic agricultural produce could also fetch much higher value if marketed among the brand-pesticides
residue conscious consumers.
The government has invested in the capacity-building of farmers through training programmes. There are 26
government farms, used for the multiplication of seeds and planting materials, conducting adaptive research and
demonstration of improved farm technologies. These are supplemented by long-term activities like seed multipli-
cation and distribution. The seed production of 279 tonnes in 1979–80 has crossed the level of 4,000 tonnes in
1990–1. Similarly, seed distribution has gone up from 785 tonnes in 1979–80 to more than 2,000 tonnes in
1990–1. Initiatives have been taken to improve seed quality with the extension of the Seeds Act, and the
implementation of seed testing and certification programmes. The HYV coverage has been as high as 98 percent
in wheat, 41 percent in rice and 40 percent in maize (Table 3.14).
TABLE 3.14—COVERAGE OF HYV SEEDS IN THE STATE
Year Crop Area Coverage (ha) HYV Coverage (ha) % Coverage
1975–76 Rice 11,400 800 7.01
Wheat 150 120 80.00
Maize 28,500 4,000 14.03
1980–81 Rice 14,800 2,000 13.51
Wheat 6,850 6,500 94.89
Maize 30,200 7,000 23.17
1985–86 Rice 15,900 3,400 21.38
Wheat 7,200 6,800 94.44
Maize 38,100 8,600 22.57
1990–91 Rice 18,610 5,400 29.01
Wheat 7,950 7,500 94.33
Maize 40,780 14,000 34.33
(continued)
L A N D A N D A G R I C U L T U R E • 4 9

Year Crop Area Coverage (ha) HYV Coverage (ha) % Coverage
1995–96 Rice 15,940 6,778 45.52
Wheat 8,240 8,200 97.38
Maize 39,400 16,720 42.43
1996–97 Rice 15,870 6,500 40.95
Wheat 7,940 7,800 98.23
Maize 389,380 15,500 39.36
Source: Government of Sikkim, Agriculture Department, Gangtok.
In the last two decades, a significant increase in the production of oilseeds (from 4,400 tonnes in 1980–1 to
5,198 in 1998–9) and pulses (from 3,320 tonnes in 1980–1 to 5,596 in 1998–9) has been achieved (Table 3.15).
This increase is mainly due to the expansion in acreage and the intensity in cropping. The central scheme of
Oilseed Production Programme and the National Pulses Development Project have contributed towards this
achievement. However, Sikkim continues to record a deficit in pulses, as its production covers only half of the
State’s annual requirement of about 12,000 tonnes.
TABLE 3.15—OILSEED AND PULSES PRODUCTION
Year Pulses(Tonnes)
Oilseeds(Tonnes)
1980–81 3,320 4,400
1985–86 4,010 5,700
1990–91 4,500 5,900
1995–96 5,920 6,500
1998–99 5,596 5,198
Source: Government of Sikkim, Agriculture Department. Gangtok.
Food production debate
There is some debate regarding the extent of food production in Sikkim. Data at both the State and national levels
could well be exaggerated. This could be partly explained by the methodological problems in calculations. Food
production is estimated on the basis of the pattern of yield in the villages without taking into account the
topographical variation of the State. Yield is derived from crop-cutting experiments and is reported on the basis
of per hectare production. While the effective area of cultivation is a full hectare in the plains, in the hills it could
be much lower on account of terraces, trees, boulders and other environmental considerations. As the cadastral
surveys, which are used to measure production, do not measure each terrace but a whole hillside, data on food
production calculated in this manner can be over-estimations.
The over-estimation can also be explained by the fact that in Sikkim, which is highly dependent on the Public
Distribution System (PDS), there is also a significant level of supply and sale of food grains by private merchants
in the open market. Taking into account all these sources—PDS supply, local production and supply by private
merchants, per capita availability of food grain in the State is approximately 1,045 gms per day, twice that of the
country as a whole (460–500 gms).
A more realistic assessment of food production may lead to a downward revision of the present levels. Since
(Table 3.14 continued)
5 0 • S I K K I M H U M A N D E V E L O P M E N T R E P O R T 2 0 0 1

the weight of the agriculture sector in the State GDP is very high in Sikkim, this would also lead to a downward
revision of GDP. Further, this may also lead to the revision of the per capita net domestic product of the State,
which at present is among the ten highest in the country.
Horticulture and floriculture
Horticulture production, including fruits, vegetables, potatoes, other tubers, cardamom, ginger and turmeric, has
increased by nearly six times between 1975–6 and 1995–6 (Table 3.16).
TABLE 3.16—HORTICULTURE PRODUCTION (IN TONNES) FROM 1975–76 TO 1995–96
Crops 1975–76 1980–81 1985–86 1990–91 1995–96
Fruits 4,700 6,350 8,200 10,500 12,000
Vegetables 2,000 3,400 13,900 15,000 28,000
Potato 5,000 6,646 16,400 18,000 24,000
Large Cardamom 2,300 3,500 3,900 2,600 3,600
Other Tubers (Potato, Yams) 100 200 400 600 1,000
Turmeric 90 100
Ginger 2,000 3,200 10,900 16,000 24,000
Total 16,100 23,296 53,700 62,790 92,700
Source: Government of Sikkim, Department of Horticulture, Gangtok.
The impact of horticulture on the livelihoods of people has therefore been substantial, although concerns
about sustainability remain (Box 3.4).
Box 3.4—Cardamom production
The production of large cardamom employs about 16,949 farmers, of which 15,209 are small and marginal
farmers. For many of them cardamom is the main source of livelihood. Thus, the absence of re-plantation
in the age-old cardamom growing areas of Sikkim has had an enormous impact on them and their families.
The usual economic bearing of cardamom orchard is for about 12 years. After 12–15 years orchards need
re-plantation. The peak age of the large cardamom is from four to eight years.
The average yield of a good orchard is about 480 kg/ha and maximum yield goes upto 1,000 kg/ha depending
on variety and orchard management. However, due to the ageing of cardamom bushes, cardamom yield has
also gone down over the years, from 250 kg per hectare in 1975–6 to 153 kg per hectare in 1996–7.
Over 80 percent of bushes require immediate replantation. Gap-filling of plants destroyed by chirkey and
foorkey, and other diseases and pests, annually, is equally essential. Uprooting and destroying of these affected
plants and gap-filling should be a continuous process to maintain effective plant population in the field,
but this is rarely done by the farmers. The disease-affected plants are not destroyed, and they spread the
infection. Further, there is no shade regulation, and farmers do not use irrigation or chemical inputs.
There is a need to evolve a comprehensive strategy to revive and sustain cardamom yields. The possibility
of accessing markets for organically grown spices could also be explored.
L A N D A N D A G R I C U L T U R E • 51

In 1998–9, there was a very long spell of dryness in Sikkim. According to the estimates by the Agriculture
Department, Government of Sikkim, the total rainfall was 93.34 percent lower than that recorded over the last
25 years. This had a visibly adverse effect on the economy, especially on drinking water, rabi crops and cash crops
(e.g. cardamom, ginger and orange). Because of this prolonged drought farmers had to postpone the sowing of
seeds and in many cases had to resort to sowing the same. Farmers from the North district were t he most affected.
It is in fact estimated that 60 percent of the State’s large cardamom has been lost in this unprecedented dry spell.
The most vital district in terms of horticulture production is the South district, which ranks first in the
production of all the crops, except potatoes (for which it ranks second) and fruits (where it ranks third) (Table
3.17). The North district ranks first in cardamom production, while the West and East districts rank first for potato
and fruits production respectively.
TABLE 3.17—HORTICULTURE PRODUCTION (IN TONNES) IN 1998–99
Crops Districts Total
North East South West
Fruits 49 3,685 1,526 3,090 8,337
Vegetables 2,298 6,997 8,738 6,134 24,167
Potato 1,213 3,768 3,825 7,468 16,274
Other Tubers 70 390 650 630 1,740
Large Cardamom 547 480 143 113 1,283
Ginger 116 3,872 5,227 4,414 13,629
Turmeric 16 400 567 417 1,400
Total 4,309 19,592 20,676 22,253 66,830
Source: Government of Sikkim, Department of Horticulture, Gangtok.
With topography and climate in its favour, Sikkim is eminently suited to the extension of acreage under
oranges. However, due to the extreme age of orange orchards (nearly 80 percent of them have crossed the most
productive age) and poor re-plantation rate, production is falling rapidly and there is a need to look into possible
policy interventions.
Promotion of horticulture depends on successful marketing, which is weak. Transport costs are still steep,
information on markets and farmers’ access to markets are limited: The nature of production, which is dispersed
and small in quantity, does not allow farmers to realize economies of scale in marketing. Sikkim, in fact, has
tremendous potential for the development of horticulture and floriculture, if marketing infrastructure is strengthened.
Marketing of the most important horticulture products (cardamom, orange and ginger) is almost totally
dependent on private traders, merchants and middlemen. Value addition of almost all the hill products is lacking.
Farmers are deprived both as producers and consumers. Niche-based products have no local market. On the other
hand, products in local use are also not marketed horizontally. They are often first sent down by farmers to market
towns in the plains (usually Siliguri market) and then are brought back by traders to be sold in local markets in
remote areas. In the process, the people of the area suffer from both low prices as producers and high prices as
consumers.
To promote horticulture, it may be necessary to create a market infrastructure through wholesale market,
provide sale options, as well as set up collection and grading centres at the production sites. Activating existing
co-operative societies to take up marketing and increasing cooperative coverage is also important in this context.
The promotion of farmer’s organizations catering to specific commodities should also be encouraged.
5 2 • S I K K I M H U M A N D E V E L O P M E N T R E P O R T 2 0 0 1

Besides the investment for infrastructure, promotional activity in floriculture in Sikkim is estimated to require
a budget of at least Rs 2 million per annum. Flowers are perishable and need special arrangements for transport
and marketing as the consumer centres are located in far off places. The State does not have quality planting
materials for large scale production. There is no check on outflow of planting materials, and much of the quality
materials produced in the State find their way to West Bengal and north-eastern States. Multiplication through
conventional method is very slow, and tissue culture laboratories in both public and private sectors are still unable
to meet the needs. Further, traditional varieties have no market. Introduction and multiplication is being tried
with limited resources.
Efforts are being made to improve the quality of production of cut flowers and bulbs and plants in recent
years. A model floriculture garden has been set up at Namli and an orchid centre is coming up at Pakyong.
Cut flowers, which are a new item in the commodity basket of Sikkim, have to be sent to the metropolitan
cities in order to fetch a remunerative price. The air link between the nearby airport at Bagdogra and cities like
Calcutta, Delhi and Guwahati is the only possible means of transport. If the air service is disrupted, cut flowers
perish. This makes it imperative to provide insurance to protect the farmers.
A strategy to strengthen the floriculture sub-sector sector should therefore, include the following:
• Enactment of strong legislation to check outflow of quality planting materials from the State.
• Induction of modern technologies including large scale tissue culture.
• Development of tissue culture laboratories in both the public and private sectors.
• Large scale demonstrations for transfer of technology to the farmers.
• Strong budgetary support as floriculture is capital intensive.
• Infrastructure facility for marketing, transport, packaging and handling.
Conclusion
Land resources in Sikkim are constrained on account of demographic pressure (per capita availability) and
activities that they can sustain. Diversification in the pattern of land use has to take into account both food security
requirements and constraints imposed by the terrain. The limitations of terrace farming in terms of productivity,
irrigation and the scope for extending cultivation highlight the constraints faced by farming for livelihood security.
Under these conditions innovative practices in land management and horticulture and floriculture (including
marketing and systems and linkages) can be identified as growth sectors.
Chapter 4 4
3 Contents
L A N D A N D A G R I C U L T U R E • 5 3

Forests andEnvironment
Forests andEnvironment


Chapter
4��
Forests and Environment
Introduction
In 1997, forest area constituted 44.9 per cent of the total area of Sikkim, as compared to 19.4 per cent for the
country as a whole. Three distinct types of forests have been recorded:
• Sal forests, which occupy an area of 8,500 acres extending from an altitude of 700 feet to about 3,000 feet in
the Teesta, Rangit and Rishi valleys.
• Broad leaved forests, which comprise the middle and upper hill forests.
• Coniferous forests, which extend over 45,000 acres along the valleys of Lachen, Lachung and Dombang.
While deciduous and ever-green forests are more commonly found in eastern and western Sikkim, northern
Sikkim is dominated by coniferous forests (Box 4.1).
In the early 1970s, it was estimated that out of the total surface area of 7,096 sq. km in Sikkim, forests occupied
1,944.05 sq. km (27.4 per cent), excluding Slip Reserve and Road Reserve forests for which figures were not
available. Their highest concentration was in the northern zone, where forests occupied nearly 805.69 sq. km,
while in the intensely cultivated eastern and western zones, forests cover was only 527.59 and 610.7 sq. km
respectively (Debnath, 1974).
According to the latest base line survey of forest resources in the State, which was conducted in 1988, forest
cover was 44 per cent. This included 978 sq. km of dense forest, 75 sq. km of degraded or blank forest area and
Box 4.1—Biological diversity
The Sikkim Himalayas show tremendous biological diversity. More than 5,000 species of angiosperms arefound in the State—nearly one-third of the total species of angiosperm found in the country. There are 4,000species of flowering plants, 300 species of ferns and allies, 450 to 500 species of orchids, 40 species of oaks,30 to 40 species of primulas and bamboos, 144 species of mammals, 500 to 600 species of birds, over 400species of butterflies and moths and many species of reptiles in the State (Government of Sikkim, 1999).
Sikkim’s biodiversity wealth contributes significantly to the country’s natural heritage and to the nationalecological balance.

31 sq. km of Alpine/pasture/scrub/barren and snow land. However, according to the Botanical Survey of India
(BSI), the forest cover was 42.8 per cent. The difference in the estimation calls for a greater coordination between
the institutions that work on forest related and environmental issues in Sikkim (Box 4.2).
Forests are an important source of livelihood for the Sikkimese people. Apart from the extraction of timber,
forests are also a source of herbs and plants that have been traditionally used as medicines. This is a potential
growth area for Sikkim, where the cultivation of medicinal herbs like Ipecac, Rauwoulfia serpentina and Lycopo-
dium, could be an important source of revenue to the government. At the same time, attention should be given
to protecting the intellectual property rights of communities, whose traditional knowledge has often been the
source of profits for others who introduce these products into the international market.
The fact that forests are central to people’s livelihoods, is confirmed by the existence of many traditional forest
laws. The forest manual, which has been supplemented from time to time, has served as a statute book since 1909,
when it was first compiled. According to this manual, no rights and concessions to the people exist as far as
Reserve (government) Forests are concerned. As far as Private Estate forests are concerned, all rights devolve upon
the owner, landlords and their tenants. In the case of Khasmahal forests, people have the right to free supply of
timber and firewood but this can be availed only after obtaining formal permission from the Forest Department.
In Gorucharan Forests, local people have the right of free grazing and collection of deadwood and fodder. Slip
Reserve and Road Reserve Forests are maintained by the State for the prevention of soil erosion and protection of
roads and no rights are allowed in those forests (Debnath, 1974).
After the Forest Conservation Act of 1980 was implemented in Sikkim, it became mandatory to acquire
permission from the government for any activities in the forest area. Legal diversion is now possible only for public
forests while for private forestland this permission is not required. The State has an array of laws and policies in the
areas of forest, land and environment and waste management (Centre for Environmental Law, 1999).
In the realm of forests, the National Forest Policy of 1988 is the guiding document. The first Working Plan
for the Sikkim State Forests, originally prepared for the period 1951–2 to 1971–2, was extended up to 2000,
Box 4.2—Institutional coordination and biodiversity
Besides the Forest Department, the Botanical Survey of India, Geological Survey of India and G.B. PantInstitute for Himalayan Environment are some of the institutions working on forest related and environ-mental issues in Sikkim. The coordination between these institutions needs further strengthening. jointactivities could focus on conservation awareness, approaches to physical conservation, planning and evalu-ation. This would avoid overlapping and duplication in use of resources.
The need to identify vanishing species of flora and fauna, for example, is common to all these institutions.This does not necessarily require compilation of different lists in pure botanical and scientific language,which could be understood only by a limited number of people. Awareness of biodiversity can and shouldalso be promoted, especially at the grassroots. Communities, in fact, have always been the real protectorsand custodians of endangered species in the State.
Most scientific journal and documents have only botanical or zoological names (usually in Latin) andnowhere can one find their local names or equivalents. As a result, there are species that require urgentconservation attention but have continued to face the wrath of the people only because they are not awareof their importance. It is therefore, vital to inform people about these species in the local language. This in-formation should be disseminated to schools, colleges, village communities and development organizations.
5 6 • S I K K I M H U M A N D E V E L O P M E N T R E P O R T 2 0 0 1

pending the formulation of a new Working Plan. It may be noted that under the approved Working Plan only 30
per cent of the forest areas have been covered.
Meanwhile, a State Forestry Action Plan (SFAP), a plan for 20 years under the National Forestry Action
Programme 1994–5 (NFAP) has been prepared to set guidelines for the management plan for all the forests and
ecosystems of the State. According to this Plan, prior attention should be given to the strengthening of policy,
legislation and institutional frameworks. This effort will be crucial to protect and promote Sikkim’s biodiversity, for
which incentive based mechanisms by both the Government of India and the State Government can be introduced.
Forest revenue
Forests have never been a major source of revenue for the government both because of the implementation of strict
conservation measures and the regulated price of forest and allied produce. The total expenditure for the conservation
and development of forests is far in excess of the total revenue received from forest produce. The highest share in
the revenues earned from forest produce, which have consistently declined in the decade 1985–95, is from timber
(Rs 451,000 in 1995), followed by charcoal (Rs 125,000 in 1995) and firewood (Rs 115,000 in 1995).
The Forest Department fixes the rate of royalty of different forest produce depending on the importance of
the produce, the extent of its availability and market value. Though the pricing of forest produce has been based
on the cost of extraction and transport, royalty, storage and handling charges put together, the sale price has been
many times lower than the market price. More importantly, the sale price once fixed is not revised regularly. This
unrealistic pricing of forest produce requires serious examination and needs to be reassessed on the basis of market
valuation.
Calculation of forest revenue does not take into account many tangible and intangible benefits that are
particularly difficult to quantify in monetary terms. Forests directly or indirectly support over 500,000 people and
over 300,000 livestock population (including cattle, buffalo, sheep, goat, yak, horse, pony, mule and pig) The State
Government made a simple estimate of the contribution from tangible forest produce to its economy (Table 4.1).
TABLE 4.1—TANGIBLE CONTRIBUTION OF FOREST PRODUCE
No. Sources Quantity
1 Green fodder consumption per annum 2.0805 million tons
2 Wood consumption
For house building 15,632 cubic metres
For furniture 1,918 cubic metres
For agricultural implements 1,768 cubic metres
For fuel 805,448 cubic metres
3 Medicinal herbs, bamboo, NTFP Substantial
4 Sand boulders Substantial
Source: Government of Sikkim, Department of Forests, Gangtok.
The Forest Department has been constrained in its efforts to promote a regenerative process through affores-
tation, undertaking forest planning and management due to an inadequate budget. A substantial part of the
resources continues to be utilized to pay wages to the workers (about Rs 30 million per annum) and salaries to
the staff (Rs 30 million). The increase of nearly 31 per cent in the Plan allocation between 1995 and 1999 (moving
from Rs 42.5 million to Rs 55.5 million) was offset by the inflationary trend during the same period.
F O R E S T S A N D E N V I R O N M E N T • 5 7

Thus, the present Plan Budget does not provide for any meaningful forest development in the State. Field
activities like plantations, regeneration of forest resources and wildlife conservation are being taken up only under
Centrally sponsored schemes.
Deforestation
Deforestation has been the most critical environmental danger for the fragile eco-system of Sikkim. One of the
biggest challenges to the State today comes from the destruction of vegetation in the high altitude areas. In the
alpine zone, grass, snow and temperature are maintained at a particular equilibrium. Thus, melting of snow takes
place at the desirable rate only if the normal ecological features are protected. But if the soil cover is disturbed
and ecological imbalances occur, snow melting, takes place at a higher speed leading even to avalanches.
The challenge can be better understood if one recognizes that over 70 per cent of the medicinal plants are
located in the alpine areas where regeneration is very difficult, and recovery cost is very high. For the rhododendron
plantation technique, for example, 4–5 years are required before its nursery seedling is completed and is ready
for transplantation. However, large resources are required for such plantation related activities.
The need for increasing agricultural production in response to the increase of population is among the causes
behind deforestation in the State which has been characterized by a large-scale clearance of land up to the altitude
of 2,000 metres.
The depletion of forest resources has a wide-ranging impact on ecological balance ranging from the extinction
of rare flora and fauna, to changes in climatic conditions, desertification and floods. Because of habitat destruction,
a number of plants and animals are in the endangered list, and some of the ‘natural attractions’ of Sikkim are
disappearing (Box 4.3).
Encroachments in the forest areas take a variety of modes:
• Fragmentation of households is taking place as a natural and customary process. The move towards nuclear
families has further been accelerated by the financial incentives advocated by the government for which a
household is considered to be the basic unit rather than the number of families. Families often clear forest
areas for cultivation, since fragmented family landholdings are insufficient for their livelihood.
• Encroachment in and around the forest area for building and construction activities has been a major
menace. Many of the private lands in the State are attached to forests. It is very difficult to monitor the
extent of encroachment because of lack of resources, manpower and technology.
Box 4.3—Mul Phutnu
Sikkim has always been known for its thermal springs, which are found all over the State. These waters havegreat therapeutic value because of the presence of fluorine and sulphur. Several seasonal springs surfaceduring the peak rainy season. Locally known as mul phutnu, thermal springs have always been a major sourceof water in both rural and urban areas. A simple scientific explanation of mul phutnu is the gradual but steadyseeping of rainwater into the land for many days together. When it finally hits the rock surface, it oozes outthrough a fractured area or weak point, and serves as a good source of water for three to six months.
Mul phutnu is now rare. This traditional and renewable source of water particularly in the dry period ofSeptember to April is fast vanishing, especially in the urban areas. This is largely attributed to deforestationand the destruction of other ground vegetation, which in turn has resulted in soil erosion and poor rechargingof the groundwater.
5 8 • S I K K I M H U M A N D E V E L O P M E N T R E P O R T 2 0 0 1

• In rural areas, the encroachers are cultivators who are ignorant of the laws relating to the protection of
forestlands, or people whose holdings are attached to the boundaries of forestland. In urban areas,
encroachment generally does not take place in forestland because people are conversant with the law. If
any encroachment takes place, it is immediately detected as no large stretch of forestland exists in urban
areas.
The steady deforestation can also be attributed to growing energy needs, land diversion for development
activities, commercial activities, forest fires and natural calamities.
Energy needs
The traditional sources of energy in rural Sikkim are firewood, animal dung, and crop residues. These are still the
only or major energy sources for the majority of the people. Biomass has been a vital part of the State energy
scenario. Environmental degradation arising out of persistent over dependence on the biomass and adverse health
effects of biomass combustion, particularly in confined spaces, are now reaching alarming levels. Since most
biomass fuel is used in domestic cooking, the highly inefficient traditional cooking methods make the energy
wastage from biomass conversion very high.
Fuelwood continues to be the main source of energy, accounting for more than 85 per cent of the total energy
consumption. In rural areas of all the districts, forest wood continues to be the predominant source of fuel for
cooking (Table 4.2).
TABLE 4.2—TYPE OF FUEL USED FOR COOKING (IN PER CENT)
Wood Cow dung Coal Kerosene Electricity LPG Others
Rural Urban Rural Urban Rural Urban Rural Urban Rural Urban Rural Urban Rural Urban
East 82.03 8.44 0.24 0.00 0.13 0.67 10.63 53.16 1.00 0.59 5.75 36.73 93.25 62.68
West 92.96 61.81 0.36 0.34 0.01 0.00 2.28 16.75 0.30 0.84 3.85 20.10 98.86 79.06
South 87.37 44.23 0.30 0.35 0.10 0.14 6.12 16.35 0.49 0.64 5.54 38.29 93.97 61.07
North 92.95 62.42 0.10 0.21 0.02 0.00 4.91 24.43 0.42 0.00 1.52 12.73 98.06 87.27
Total 87.40 29.35 0.28 0.15 0.08 0.39 6.60 36.26 0.61 0.58 4.86 33.02 94.53 66.40
Source: Gyatso and Bagdass (1998), pp. 35–6.
In the urban areas also, at least in the West and North, wood is the main fuel for cooking. Unlike the popular
belief that electricity is increasingly replacing conventional sources of energy, it is found that not even one per
cent of urban and rural population use it for cooking. In the North district, LPG consumption is still relatively
low, indicating a high degree of dependence on forest resources.
There has been burgeoning domestic demand for power in Sikkim. The emphasis on power driven industri-
alization, particularly in the aftermath of the liberalized economic regime, is likely to compound this demand.
The issues of energy security and energy conservation are therefore critical and have to be addressed at the policy
level.
Land diversion
Sometimes the difficult terrain increases the pressure of encroachment on forestland. Upto March 1998, it is
estimated that over 590 hectares of forestland was diverted for development related activities (Table 4.3). In
1998–9 alone another 10 hectares have been diverted. For the ongoing Teesta V Project, a total of 147 hectares
are proposed to be diverted.
F O R E S T S A N D E N V I R O N M E N T • 5 9

TABLE 4.3—LIST OF APPROVED CASES FOR DIVERSION UNDER THE FOREST CONSERVATION ACT, 1980,INCLUDING COMPENSATORY AFFORESTATION (CA) TILL 1988
No. Projects No. Forest Areaapproved forDiversion(hectares)
Compensatory afforestation(hectares)
Forest land Non-forest land
1 Irrigation 5 4.44 11.54 –
2 Road 15 8.67 503.33 5.90
3 Hydro-electric projects 6 59.31 240.00 18.04
4 Quarrying of minerals 2 2.41 6.00 –
5 Transmission lines 9 92.63 9.50 2.50
6 Water conductor channels 1 0.58 – –
7 Construction of buildings, complexes and playgrounds 8 127.03 5.66 –
8 Cremation ground 1 0.10 – –
9 Plantation 1 80.00 – –
10 Water supply schemes 2 18.11 32.60 –
11 Microwave repeater stations 2 0.40 – 0.20
12 War memorial 1 0.10 – –
13 Total 54 593.78 1,008.63 26.64
Source: Computed from data supplied by the Department of Forests, Government of Sikkim, Gangtok.
Sikkim is believed to have the best record of compensatory afforestation (CA). Wherever deforestation has
been carried out for the purpose of development projects by the diversion of forest land, CA is recorded to have
taken place. In fact, so far, approximately over 1,000 hectares of CA has been completed. This has more than offset
the deforestation caused by the acquisition of land for development activities.
Commercial deforestation
Commercial deforestation in Sikkim originated with the 1951 scheme of Floatation of Timber. Under this scheme,
timber used to be floated through the rivers both in log and sown forms. There were massive losses of forest
resources mainly because of floods in the riverine belt and wrong timing of the launching of timber.
Forest fires
Yet another major source of forest destruction is forest fires caused either accidentally or by villagers for growing
fresh grass for fodder. One possible way to prevent forest fire would be to create fire lines before the fire season,
construction of fire watchtowers, improvement in wireless communications and deployment of special fire fighting
squads with tools during the fire season. However, these are all expensive strategies, which cannot be easily
undertaken with present resources which are scarce. Even so, it is extremely worrying that natural hazards, such
as landslides and floods, are reaching alarming proportions in Sikkim.
Landslides
The State, being part of the Himalayas—a younger mountain range, is seismically active and characterized by
frequent landslides (Box 4.4). As steep hill slopes are very sensitive to any geo-environmental change, even sudden
rainfalls can destablize the soil-rock balance and cause landslides.
6 0 • S I K K I M H U M A N D E V E L O P M E N T R E P O R T 2 0 0 1

Three factors prevailing in Sikkim Himalayas further exacerbate the destabilizing impact of high rainfall. Firstly,
hills in the region are extremely fragile. The strata consist of sandstone, shale, mica schist and quartzite, which
are in disintegrated condition in many places and folded and thrust with a number of fault planes. Secondly, the
topography is such that it leads to enormous erosion, landslides and toe cutting. Thirdly, and most importantly,
land use changes and development intervention have had adverse impacts on Sikkim Himalayas.
The fragile geological structure of the terrain, due to faulty rock formation, is the main cause of landslides in
Sikkim. Incidents of landslides are lower where the rocks are in anticline faults, i.e. the direction of layers embedded
in the slopes is away from the direction of the slope. Case histories of three major landslides during the early
1960s in 7th Mile on Gangtok-Kupup Highway, Rang Rang and New Vong on North Sikkim Highway sugg est that
these landslides occur mostly due to hydrological reasons.
Lack of vegetal cover is certainly another cause of landslides. The excess run-off causes the formation of gullies
and scouring of the banks of the streams and Jhoras, thereby resulting in landslides. Building of houses, roads,
water supply schemes and hydro-power projects; and biotic interference in the form of indiscriminate felling of
trees overloads the carrying capacity of the soil and thus causes landslides (Box 4.5).
Contrary to popular belief that the conservation of forest can act as both prevention and protection against
landslides, there are instances in Sikkim to show that landslides occur even in very dense forests. The Thekeiberg
and Changecenti areas in the East districts and Rang Rang Reserve Forest in the North district have the highest
occurrence of landslides which lie in the densely forested areas of Sikkim. The usual strategy of vegetative cover
does not check this type of landslide.
Box 4.4—Landslide belts
The landslide phenomenon is common to all forest areas in Sikkim. The major landslide belts across districtsare:
East Sikkim: Bhusuk, Barapathing, Changey Senti, Namcheybong, Parakha, Barapathing, 9th Mile, Bordang,Lueing, Kumrek, 6th Mile, Tadong, Phadamchen and Sirwani.
South Sikkim: Lingi-Payong, Kateng, Turung, Turuk, Kewzing, Heingdam (Legship) Shyampari and Sada.
West Sikkim: Mangnam-Kurchey Sakyong, Chewrey Botey (Bermiok), Singshore (Uttarey), Reshi, Daramdin(Rambang), Rumbuk (Ringyang) and Beyong-Tikpur.
North Sikkim: Rang-Rang, Meyong, Lanthey Khola and Ritchum.
Box 4.5—Towards preventing landslides
The Forest Notification No. 2375/F, which dates back to 1954, recognizes the fact that building activitiescan pose a major hazard. The Notification stated:
It is hereby notified for the information of the general public that no construction of buildings whethertemporary or permanent is permitted along either side of the road without obtaining the prior sanction ofthe Darbar in writing. Persons acting in contravention of this order will be punishable with fine, which mayextend to Rs 100 and the structure will be liable to be moved without any claim for compensation.
(D Lama)21 September 1954 Forest Manager, Sikkim State, Gangtok
F O R E S T S A N D E N V I R O N M E N T • 61

In a geologically fragile State like Sikkim, an integrated approach to landslide prevention is required. This
should incorporate afforestation in blank areas, checking run-off, scouring as well as light engineering structures,
and the disposal of run-off through catch-water drains. This approach has been effective in Chandmari, Gangtok
and in 9th mile (National Highway) where vegetative cover was also used.
Glacial lake outburst floods (GLOF) and related disasters
Disturbances in mountain ecology have started attracting considerable attention. The phenomenon of jokulhlaup
(glacier leap), also known as glacial lake outburst floods (GLOF), is a frequent and alarming occurrence in Sikkim.
As the State is dotted with many glaciers, this is a serious potential hazard (Box 4.6).
Most glaciers in Sikkim originate from the Kanchendzonga (Kanchenjungha) (the ‘five big treasures of ice’)
and in turn give birth to streamlets. Venerated by Buddhists as the home of their presiding deity, it is also the
source of the Teesta, one of the main sources of water for Sikkim. The Rangit, which is the largest tributary of
Teesta, is fed mainly by the Rathong Chu and Prek Chu glaciers in north-west Sikkim. The Teesta is also fed by
the Onglokthang glacier.
The fast melting of snow leads to an influx of huge quantities of water into the glacier lakes. When the water
level in these lakes rises, it breaches the dam that is formed of ice, boulders and sand. Often catastrophic, the
surge of water and debris caused by the sudden outburst of glacier lakes in high mountains can change the course
of rivers. This leads to a sudden rise in river flow by more than 10 feet and causes untold misery to all life forms
in the Himalayan region.
A detailed study conducted by scientists and environmentalists of the Kanchendonzga National Park in 1995,
found that the Onglokthang and Rathong Chu glaciers are receding rapidly. This could spell disaster for Sikkim’s
Box 4.6—Global warming: Glacier depletion and the local economy
In 1999, the Chief Minister Pawan Chamling, while receiving the Greenest Chief Minister of India Award givenby the Centre for Science and Environment, New Delhi, stated that:
Even in Sikkim today we face growing problems, which do not really require any sensitive measuringinstruments to see. Our Zemu glacier has depleted in size by more than 3–4 kms. The water in the Teesta isflowing at an all time low. We have had the warmest winter in living memory. These are all indications ofthings going wrong.
Ecological instability had visibly adverse effects on the economy of Sikkim. It had a negative effect on drinkingwater, rabi crops and cash crops like cardamom, ginger and orange. According to the Agriculture Department,the total rainfall between October 1998 to 31 March 1999 was 93.34 per cent less than the rainfall in thelast 25 years in the State. Because of this prolonged drought farmers had to postpone the sowing of seedsand in many cases they had to resort to resowing of the same. Cardamom bushes, which had survived allkinds of climatic depredations for the last six to eight decades, dried up.
The crop failure had severe consequences for the farmers of North Sikkim since they are totally dependenton cardamom and vegetable crops. It is estimated that 60 per cent of the State’s large cardamom plantationswere lost in this unprecedented dry spell. The North district alone produces more than 2,500 tonnes of largecardamom annually, valued at nearly Rs 200 million.
6 2 • S I K K I M H U M A N D E V E L O P M E N T R E P O R T 2 0 0 1

fragile ecology. With the threat of global warming looming large, it is of paramount concern to study the status
of glaciers and the impact of global warming on Sikkim.
A study team reported that since the Little Ice Age, the Onglokthang glacier had retreated by about 500 metres
and the Rathong Chu glacier by 600 metres. Sikkim’s largest glacier, Zemu, had also retreated by 3–4 km. If the
glaciers continue to recede, it could spell disaster for Sikkim’s sensitive economy and may even lead to devastating
floods and ultimate dryness in river Teesta (Down to Earth, 1999).
A nationally coordinated research programme on Himalayan Glaciology, which was initiated by the Depart-
ment of Science and Technology, Government of India, in 1986, has so far covered Himachal Pradesh and Garhwal
Himalayas. This programme needs to be extended to Sikkim Himalayas as soon as possible (Hasnain Syed Iqbal,
1999).
Vanishing species
One of the most debilitating impacts of deforestation and human encroachments has been the steady depletion
of some of the plant and animal species in Sikkim. Despite the fact that there are several efforts to identify and
protect these vanishing species, both at the State and the Union level, an adequate strategy to carry out this gigantic
task has not been developed. However, it may be noted that some of these efforts date back to the late 1960s and
early 1970s (Box 4.7).
In the late 1960s the ruler of Sikkim declared the Red Panda as an endangered species. Of the 155 odd
mammals known to exist in this Himalayan State, as many as 39 have been declared endangered or rare under
Schedule I of the Wildlife (Protection) Act 1972. These include the red panda, Himalayan thar, musk deer, snow
leopard, jungle cat, tree shrew, Tibetan wolf, red fox, Indian wild dog, hog badger, Tibetan sheep, bharal, serow,
Box 4.7—Protecting endangered species
SIKKIM DARBAR GAZETTE, JULY 1970
PART III
OFFICE OF THE CONSERVATOR OF FORESTS
Notification No: 1744/Forests Dated: Gangtok, the 30th July 1970
It is hereby notified for the information of public in general that Lycopodium (Nagbeli, Chusing Dermo)occuring within Sikkim will, henceforth, be collected exclusively by the Forest Department.
No person shall export or attempt to export Lycopodium outside the territory of Sikkim without a permitissued by the Conservator of Forests, Government of Sikkim, or any other Officer duly authorised by him.
Any person who contravenes or abets the contravention of the provisions of this notification shall be liableto prosecution and on conviction shall be punished with imprisonment of either description for a termwhich may extend to Rs 1,000 (Rupees One Thousand). All offences under this notification will be cognisable,bailable and not compoundable.
By Order
(K C Pradhan) Conservator of Forests, Government of Sikkim, Gangtok
F O R E S T S A N D E N V I R O N M E N T • 6 3

kiang and gorla. Many of them have been sighted in parts of Kanchenjunga National Park. Besides the red panda,
musk deer and bharal (blue sheep), are two other animals very rarely sighted during the last decade. The Alpine
musk deer is reported to be found in 12 locations in the high altitude areas of North and West Sikkim. Demand
for musk, obtained from its pod, has led to ruthless poaching and this animal is almost extinct.
There are various sources of information regarding the endangered, rare and threatened plants in Sikkim.
Some of them vary drastically in both identifying the affected species and attributing the exact status and their
causes. The State and Union Government agencies, independent research organizations, local non-governmental
environmental organizations and international bodies have separate listings of these species. Many of them are
endangered species listed in Schedule I to the WL(P) Amendment Act, 1991 and Appendices of CITES.
Under BSI Research Scholar Scheme, a research scholar has been assigned the task of inventorizing the rare
threatened and endemic plants of the State so that adequate steps can be taken to conserve them.
What is more crucial is the protection, conservation and regeneration of flora and fauna. For this, people have
to be made aware of the implications of further destroying the species already endangered. Thus, it is important
to inform people and transform the conservation discourse into a dialogue with the people of the State, and not
only with scientists and experts.
Capacity building in environmental management
The need to promote an awareness about ecological hazards has to be considered also in the light of the fact that
in Sikkim there has been a major gap in the development and availability of human resources for forest
management. Many field officials have never been exposed to training and modern techniques and technologies
in terms of forest related activities, and still look at the entire gamut of forest related issues and problems from
a traditional perspective of managment. They are not equipped to deal with the changing dimensions of forest
management. Capacity building is an essential aspect of afforestation and other forest related activities.
The role of NGOs is crucial as they can articulate issues and problems that are ordinarily beyond the purview
of departmental activities. Sikkim is one State in the eastern Himalayas where the concept of development related
NGOs and community based organizations (CBOs) crept in very late and slowly—it is largely a phenomenon of
the 1990s.
This in a way shows the increasing consciousness among the Sikkimese about the development-related
problems brought about by a massive induction of public funds in the last 25 years (Box 4.8). The State and the
government, as the sole custodian of development, certainly brought about a massive change in the State both in
terms of development and in improving the living standards of people. On the other hand, this process also
brought about imbalances and distortions in the socio-economic fabric of the State, including environmental
damage.
The absence of any monitoring and evaluation mechanism in the State made it more difficult to locate the
distortions and imbalances in the development process. There was a felt need, at least among some sections, for
some institutions to give it a strong sense of direction and to identify priorities.
By now, there are quite a few NGOs working in Sikkim. Besides the Gangtok based Green Circle and Concern
Citizens, there are Sadbhavana Samiti in Singtam, and SOYA in Samdung, South Asia Foundation, Sikkim
Development Foundation, Voluntary Health Association of India, Bunker Roy’s ‘Barefoot Engineers’, Paryawaran
Sangrakshan Sangh, Sikkim Youth Welfare Association in Gyaltshing which are quite well known in their respective
fields of operation.
The Khangchendzonga Conservation Committee is another community-based organization in Yuksam in West
Sikkim which helps to mitigate the adverse impact of tourism, conserve natural and cultural resources, and provide
training to community stakeholders, educate visitors, monitor resources and advocate for appropriate policy
6 4 • S I K K I M H U M A N D E V E L O P M E N T R E P O R T 2 0 0 1

Box 4.8—Quantifying the invisible cost
Sikkim has been the most significant geographical entity in the conservation process in the Eastern Himalayas.It provides i) military security ii) environmental security and iii) continues to forego a huge opportunitycost for economic development. Therefore, Sikkim’s plan expenditure and revenue budgets should beexamined in a different perspective. This proposition sounds abstract and impractical. However, this debatehas to be initiated as it carries the critical issue of sustainability and the staggering cost to be borne by Sikkimand the people of the State.
Firstly, it has been one of the very geo-strategically significant border posts of India and has a hugeconcentration of security and military forces. Besides the other issues related to carrying capacity, the physicalburden of these forces as a pressure on land and other natural and manufactured resources are quite gigantic.This definitely needs to be taken into consideration. All these incur a huge development and environmentalcost to the State, which many other States in India do not have to incur. In the absence of any meaningfuleconomic valuation of these costs, there has been a tendency to over exploit physical and other resourcesof the State without any systematic replenishment. This has started raising the critical question of sustain-ability. There should have been a major chunk of funding to compensate these invisible costs. However, thisis hardly reflected in the development budget of Sikkim.
Secondly; the onus of protecting and conserving the significant portion of the critical eastern Himalayanregion and its environment, including the mountain range, has fallen on the people and the government ofSikkim. The protection of bio-diversity and the forward and backward linkages emanating from it to theentire Himalayan community and the plains land have never been quantified. As a result, many quartersare not able to appreciate the work Sikkim and Sikkimese are doing for the sustainability of the region. Oneway to recognize this service to the nation building process is to supplement the State resources partially forthe upkeep of the hills and the Himalayan region. There has, however, been no additional outlay on renderingthis service, very vital to the entire process of sustainable development in the country as a whole.
The appropriate valuation of positive externalities of conservation is very vital for Sikkim. This involvesdescribing the values of these externalities, whether in terms of value to human or some intrinsic value ofall living things. The point to drive home is the fact that the value of conserving them is greater than thebenefits derived from conversion. The emerging concept of total economic value (TEV) in environmentaleconomics is considered to be the best measure to express the full range of benefits—both tangible andintangible—provided by the forests. In the total economic value, besides the other components one has tolook into both direct and indirect use values. This TEV exercise should be initiated both for assessing andunderstanding the costs involved in the conservation efforts made by the State. This can be a major basisfor a Special Category State like Sikkim to get a special annual package primarily to partially compensatefor what it has been doing in the area of conservation and sustenance.
And finally, the very topography of Sikkim, and the fact that it is, landlocked coupled with its agro-climaticvariations have made it impossible for the State to accomplish an array of interventions making the processof economic development very limited. At times it has been a Hobson’s choice for the State to opt for amajor development intervention as the long run cost, particularly, in terms of environmental security ishigher than the short run benefit. This has forced Sikkim to function in a very constricted development spacewhere the degree of manoeuvrability is very limited. In other States, the interventions by policy makers andpoliticians are not constrained by the factors that characterize the Sikkim Himalayas.
F O R E S T S A N D E N V I R O N M E N T • 6 5

changes. It supported local plantations of native tree species to encourage wildlife and enhance the appearance
of Yuksam village and surrounding areas. It conducts training in responsible trekking practices for locally based
porters in major trekking trail near Khangchendzonga National Park. It promotes the adoption of a code of conduct
for conservation for Khangchendzonga National Park and the surrounding forests.
Indigenous Practices and Intellectual Property Rights (IPRs)
Sikkim is known for practices related to traditional medicines. These practices have a strong base in the socio-
religious healing systems native to the State. The rich variety of plants and animals also help to sustain the system
of traditional medicines. But very little attention has been given to the importance of protecting the intellectual
property rights (IPRs) of indigenous peoples, whose traditional knowledge has often been the source of products
introduced into the international market. Studies on the botanical resources of Sikkim in the past have placed
little emphasis on the vast potential of studies on ethno-medico-botany particularly in the context of both the
rich heritage of indigenous medical practices and the fast changing international regime on intellectual property
rights. The ‘bio-partnerships’ for sustainable development is therefore, very critical in this Himalayan State. It is
vital to develop bio-resources at the human level first since this will ensure, to a large extent, sustainable
development of the other bio-resources.
An emerging facet of biodiversity conservation is the medicinal and therapeutic value of plant and animal
extracts. The rich possibilities of commercial exploitation of these resources could be assessed from the fact that
herbal products are said to account for nearly half the medicines prescribed in the US and this trend is likely to
grow. The Economist of London reported that annual sales of herbal products in the US are in the order of $ 4
billion. The sustainability of the Sikkimese economy and society could be challenged in many critical dimensions.
Therefore, the pressing need is to:
• Develop a well planned strategy to explore medicinal plant-wealth of the State.
• Find out the method of propagation.
• Encourage sustainable harvesting of plants from the forests.
• Involve small farmers and communities in their cultivation.
• Conduct phyto-chemical, pharmacological and pharmacognostic studies on the commercially exploitable
species.
This should be done at all levels. Scientific temper and awareness when infused into traditional practices, can
bring about a major transformation in the socio-economic profile of the villages and bustees of Sikkim. Sikkim
This limited choice and the related constraints on development interventions as compared to the wide rangeof choices and techniques available to other States, need to be considered as the opportunity cost Sikkimwill have to forego. The benefits which would have otherwise accrued to the State need to be objectivelyassessed and provisions made accordingly for compensating the opportunities foregone. This is how a specialcategory State like Sikkim needs to be treated for, at least till it starts showing indications of self-relianceand sustainability.
Therefore, recognition and assessment and compensation of these invisible costs is very critical for thesustenance of a strategic state like Sikkim.
6 6 • S I K K I M H U M A N D E V E L O P M E N T R E P O R T 2 0 0 1

has the potential to become a major supplier of ‘crude-drugs’ for the pharmaceutical industry, a potentially major
source of revenue and a critical public good.
Future options would therefore include:
• Linking forestry to sustainable rural livelihoods.
• Envisaging afforestation as a public good by communities rather than a top down governmental scheme.
Awareness raising and community participation is vital for a successful and sustainable afforestation.
• Creation of a bio-diversity data bank and the preparation of a status report of the plant species. Scientific
monitoring of bio-diversity should be initiated. This should be based largely on participatory processes at
the grass-root level.
• Developing a comprehensive plan to prevent and control landslides after thorough mapping and moni-
toring of landslide prone areas. Subsequently, the State should chart out a landslide preparedness plan,
and also a disaster management plan.
• Promotion of policies that:
Link population strategies to the ‘carrying capacity’ of local ecosystems.
Improve access of the poor to natural and public resources including technologies for sustainable human
development.
Preserve the diversity of genes, species, communities, habitats, and ecosystems.
Use natural renewable resources on the basis of sustained yields and improve the efficiency of energy,
water and land use.
Apply clean technologies in industrial processes.
Promote capacity building at all levels both at the level of community mobilization and governmental
delivery mechanisms.
Conclusion
The forest resources of Sikkim sustain not only local livelihoods and ecology, but also have positive externalities
for the rest of the country, especially the neighbouring plains. Therefore, a formal measurement of forest revenue
need to be supplemented with natural resource accounting. This would help to highlight the actual contribution
of forests to policy makers and the general public. This could be an important policy tool for forest conservation
and protection, including those of the communities that depend on them.
Chapter 5 4
3 Contents
F O R E S T S A N D E N V I R O N M E N T • 6 7

Forests andEnvironment
Forests andEnvironment


Chapter
4��
Forests and Environment
Introduction
In 1997, forest area constituted 44.9 per cent of the total area of Sikkim, as compared to 19.4 per cent for the
country as a whole. Three distinct types of forests have been recorded:
• Sal forests, which occupy an area of 8,500 acres extending from an altitude of 700 feet to about 3,000 feet in
the Teesta, Rangit and Rishi valleys.
• Broad leaved forests, which comprise the middle and upper hill forests.
• Coniferous forests, which extend over 45,000 acres along the valleys of Lachen, Lachung and Dombang.
While deciduous and ever-green forests are more commonly found in eastern and western Sikkim, northern
Sikkim is dominated by coniferous forests (Box 4.1).
In the early 1970s, it was estimated that out of the total surface area of 7,096 sq. km in Sikkim, forests occupied
1,944.05 sq. km (27.4 per cent), excluding Slip Reserve and Road Reserve forests for which figures were not
available. Their highest concentration was in the northern zone, where forests occupied nearly 805.69 sq. km,
while in the intensely cultivated eastern and western zones, forests cover was only 527.59 and 610.7 sq. km
respectively (Debnath, 1974).
According to the latest base line survey of forest resources in the State, which was conducted in 1988, forest
cover was 44 per cent. This included 978 sq. km of dense forest, 75 sq. km of degraded or blank forest area and
Box 4.1—Biological diversity
The Sikkim Himalayas show tremendous biological diversity. More than 5,000 species of angiosperms arefound in the State—nearly one-third of the total species of angiosperm found in the country. There are 4,000species of flowering plants, 300 species of ferns and allies, 450 to 500 species of orchids, 40 species of oaks,30 to 40 species of primulas and bamboos, 144 species of mammals, 500 to 600 species of birds, over 400species of butterflies and moths and many species of reptiles in the State (Government of Sikkim, 1999).
Sikkim’s biodiversity wealth contributes significantly to the country’s natural heritage and to the nationalecological balance.

31 sq. km of Alpine/pasture/scrub/barren and snow land. However, according to the Botanical Survey of India
(BSI), the forest cover was 42.8 per cent. The difference in the estimation calls for a greater coordination between
the institutions that work on forest related and environmental issues in Sikkim (Box 4.2).
Forests are an important source of livelihood for the Sikkimese people. Apart from the extraction of timber,
forests are also a source of herbs and plants that have been traditionally used as medicines. This is a potential
growth area for Sikkim, where the cultivation of medicinal herbs like Ipecac, Rauwoulfia serpentina and Lycopo-
dium, could be an important source of revenue to the government. At the same time, attention should be given
to protecting the intellectual property rights of communities, whose traditional knowledge has often been the
source of profits for others who introduce these products into the international market.
The fact that forests are central to people’s livelihoods, is confirmed by the existence of many traditional forest
laws. The forest manual, which has been supplemented from time to time, has served as a statute book since 1909,
when it was first compiled. According to this manual, no rights and concessions to the people exist as far as
Reserve (government) Forests are concerned. As far as Private Estate forests are concerned, all rights devolve upon
the owner, landlords and their tenants. In the case of Khasmahal forests, people have the right to free supply of
timber and firewood but this can be availed only after obtaining formal permission from the Forest Department.
In Gorucharan Forests, local people have the right of free grazing and collection of deadwood and fodder. Slip
Reserve and Road Reserve Forests are maintained by the State for the prevention of soil erosion and protection of
roads and no rights are allowed in those forests (Debnath, 1974).
After the Forest Conservation Act of 1980 was implemented in Sikkim, it became mandatory to acquire
permission from the government for any activities in the forest area. Legal diversion is now possible only for public
forests while for private forestland this permission is not required. The State has an array of laws and policies in the
areas of forest, land and environment and waste management (Centre for Environmental Law, 1999).
In the realm of forests, the National Forest Policy of 1988 is the guiding document. The first Working Plan
for the Sikkim State Forests, originally prepared for the period 1951–2 to 1971–2, was extended up to 2000,
Box 4.2—Institutional coordination and biodiversity
Besides the Forest Department, the Botanical Survey of India, Geological Survey of India and G.B. PantInstitute for Himalayan Environment are some of the institutions working on forest related and environ-mental issues in Sikkim. The coordination between these institutions needs further strengthening. jointactivities could focus on conservation awareness, approaches to physical conservation, planning and evalu-ation. This would avoid overlapping and duplication in use of resources.
The need to identify vanishing species of flora and fauna, for example, is common to all these institutions.This does not necessarily require compilation of different lists in pure botanical and scientific language,which could be understood only by a limited number of people. Awareness of biodiversity can and shouldalso be promoted, especially at the grassroots. Communities, in fact, have always been the real protectorsand custodians of endangered species in the State.
Most scientific journal and documents have only botanical or zoological names (usually in Latin) andnowhere can one find their local names or equivalents. As a result, there are species that require urgentconservation attention but have continued to face the wrath of the people only because they are not awareof their importance. It is therefore, vital to inform people about these species in the local language. This in-formation should be disseminated to schools, colleges, village communities and development organizations.
5 6 • S I K K I M H U M A N D E V E L O P M E N T R E P O R T 2 0 0 1

pending the formulation of a new Working Plan. It may be noted that under the approved Working Plan only 30
per cent of the forest areas have been covered.
Meanwhile, a State Forestry Action Plan (SFAP), a plan for 20 years under the National Forestry Action
Programme 1994–5 (NFAP) has been prepared to set guidelines for the management plan for all the forests and
ecosystems of the State. According to this Plan, prior attention should be given to the strengthening of policy,
legislation and institutional frameworks. This effort will be crucial to protect and promote Sikkim’s biodiversity, for
which incentive based mechanisms by both the Government of India and the State Government can be introduced.
Forest revenue
Forests have never been a major source of revenue for the government both because of the implementation of strict
conservation measures and the regulated price of forest and allied produce. The total expenditure for the conservation
and development of forests is far in excess of the total revenue received from forest produce. The highest share in
the revenues earned from forest produce, which have consistently declined in the decade 1985–95, is from timber
(Rs 451,000 in 1995), followed by charcoal (Rs 125,000 in 1995) and firewood (Rs 115,000 in 1995).
The Forest Department fixes the rate of royalty of different forest produce depending on the importance of
the produce, the extent of its availability and market value. Though the pricing of forest produce has been based
on the cost of extraction and transport, royalty, storage and handling charges put together, the sale price has been
many times lower than the market price. More importantly, the sale price once fixed is not revised regularly. This
unrealistic pricing of forest produce requires serious examination and needs to be reassessed on the basis of market
valuation.
Calculation of forest revenue does not take into account many tangible and intangible benefits that are
particularly difficult to quantify in monetary terms. Forests directly or indirectly support over 500,000 people and
over 300,000 livestock population (including cattle, buffalo, sheep, goat, yak, horse, pony, mule and pig) The State
Government made a simple estimate of the contribution from tangible forest produce to its economy (Table 4.1).
TABLE 4.1—TANGIBLE CONTRIBUTION OF FOREST PRODUCE
No. Sources Quantity
1 Green fodder consumption per annum 2.0805 million tons
2 Wood consumption
For house building 15,632 cubic metres
For furniture 1,918 cubic metres
For agricultural implements 1,768 cubic metres
For fuel 805,448 cubic metres
3 Medicinal herbs, bamboo, NTFP Substantial
4 Sand boulders Substantial
Source: Government of Sikkim, Department of Forests, Gangtok.
The Forest Department has been constrained in its efforts to promote a regenerative process through affores-
tation, undertaking forest planning and management due to an inadequate budget. A substantial part of the
resources continues to be utilized to pay wages to the workers (about Rs 30 million per annum) and salaries to
the staff (Rs 30 million). The increase of nearly 31 per cent in the Plan allocation between 1995 and 1999 (moving
from Rs 42.5 million to Rs 55.5 million) was offset by the inflationary trend during the same period.
F O R E S T S A N D E N V I R O N M E N T • 5 7

Thus, the present Plan Budget does not provide for any meaningful forest development in the State. Field
activities like plantations, regeneration of forest resources and wildlife conservation are being taken up only under
Centrally sponsored schemes.
Deforestation
Deforestation has been the most critical environmental danger for the fragile eco-system of Sikkim. One of the
biggest challenges to the State today comes from the destruction of vegetation in the high altitude areas. In the
alpine zone, grass, snow and temperature are maintained at a particular equilibrium. Thus, melting of snow takes
place at the desirable rate only if the normal ecological features are protected. But if the soil cover is disturbed
and ecological imbalances occur, snow melting, takes place at a higher speed leading even to avalanches.
The challenge can be better understood if one recognizes that over 70 per cent of the medicinal plants are
located in the alpine areas where regeneration is very difficult, and recovery cost is very high. For the rhododendron
plantation technique, for example, 4–5 years are required before its nursery seedling is completed and is ready
for transplantation. However, large resources are required for such plantation related activities.
The need for increasing agricultural production in response to the increase of population is among the causes
behind deforestation in the State which has been characterized by a large-scale clearance of land up to the altitude
of 2,000 metres.
The depletion of forest resources has a wide-ranging impact on ecological balance ranging from the extinction
of rare flora and fauna, to changes in climatic conditions, desertification and floods. Because of habitat destruction,
a number of plants and animals are in the endangered list, and some of the ‘natural attractions’ of Sikkim are
disappearing (Box 4.3).
Encroachments in the forest areas take a variety of modes:
• Fragmentation of households is taking place as a natural and customary process. The move towards nuclear
families has further been accelerated by the financial incentives advocated by the government for which a
household is considered to be the basic unit rather than the number of families. Families often clear forest
areas for cultivation, since fragmented family landholdings are insufficient for their livelihood.
• Encroachment in and around the forest area for building and construction activities has been a major
menace. Many of the private lands in the State are attached to forests. It is very difficult to monitor the
extent of encroachment because of lack of resources, manpower and technology.
Box 4.3—Mul Phutnu
Sikkim has always been known for its thermal springs, which are found all over the State. These waters havegreat therapeutic value because of the presence of fluorine and sulphur. Several seasonal springs surfaceduring the peak rainy season. Locally known as mul phutnu, thermal springs have always been a major sourceof water in both rural and urban areas. A simple scientific explanation of mul phutnu is the gradual but steadyseeping of rainwater into the land for many days together. When it finally hits the rock surface, it oozes outthrough a fractured area or weak point, and serves as a good source of water for three to six months.
Mul phutnu is now rare. This traditional and renewable source of water particularly in the dry period ofSeptember to April is fast vanishing, especially in the urban areas. This is largely attributed to deforestationand the destruction of other ground vegetation, which in turn has resulted in soil erosion and poor rechargingof the groundwater.
5 8 • S I K K I M H U M A N D E V E L O P M E N T R E P O R T 2 0 0 1

• In rural areas, the encroachers are cultivators who are ignorant of the laws relating to the protection of
forestlands, or people whose holdings are attached to the boundaries of forestland. In urban areas,
encroachment generally does not take place in forestland because people are conversant with the law. If
any encroachment takes place, it is immediately detected as no large stretch of forestland exists in urban
areas.
The steady deforestation can also be attributed to growing energy needs, land diversion for development
activities, commercial activities, forest fires and natural calamities.
Energy needs
The traditional sources of energy in rural Sikkim are firewood, animal dung, and crop residues. These are still the
only or major energy sources for the majority of the people. Biomass has been a vital part of the State energy
scenario. Environmental degradation arising out of persistent over dependence on the biomass and adverse health
effects of biomass combustion, particularly in confined spaces, are now reaching alarming levels. Since most
biomass fuel is used in domestic cooking, the highly inefficient traditional cooking methods make the energy
wastage from biomass conversion very high.
Fuelwood continues to be the main source of energy, accounting for more than 85 per cent of the total energy
consumption. In rural areas of all the districts, forest wood continues to be the predominant source of fuel for
cooking (Table 4.2).
TABLE 4.2—TYPE OF FUEL USED FOR COOKING (IN PER CENT)
Wood Cow dung Coal Kerosene Electricity LPG Others
Rural Urban Rural Urban Rural Urban Rural Urban Rural Urban Rural Urban Rural Urban
East 82.03 8.44 0.24 0.00 0.13 0.67 10.63 53.16 1.00 0.59 5.75 36.73 93.25 62.68
West 92.96 61.81 0.36 0.34 0.01 0.00 2.28 16.75 0.30 0.84 3.85 20.10 98.86 79.06
South 87.37 44.23 0.30 0.35 0.10 0.14 6.12 16.35 0.49 0.64 5.54 38.29 93.97 61.07
North 92.95 62.42 0.10 0.21 0.02 0.00 4.91 24.43 0.42 0.00 1.52 12.73 98.06 87.27
Total 87.40 29.35 0.28 0.15 0.08 0.39 6.60 36.26 0.61 0.58 4.86 33.02 94.53 66.40
Source: Gyatso and Bagdass (1998), pp. 35–6.
In the urban areas also, at least in the West and North, wood is the main fuel for cooking. Unlike the popular
belief that electricity is increasingly replacing conventional sources of energy, it is found that not even one per
cent of urban and rural population use it for cooking. In the North district, LPG consumption is still relatively
low, indicating a high degree of dependence on forest resources.
There has been burgeoning domestic demand for power in Sikkim. The emphasis on power driven industri-
alization, particularly in the aftermath of the liberalized economic regime, is likely to compound this demand.
The issues of energy security and energy conservation are therefore critical and have to be addressed at the policy
level.
Land diversion
Sometimes the difficult terrain increases the pressure of encroachment on forestland. Upto March 1998, it is
estimated that over 590 hectares of forestland was diverted for development related activities (Table 4.3). In
1998–9 alone another 10 hectares have been diverted. For the ongoing Teesta V Project, a total of 147 hectares
are proposed to be diverted.
F O R E S T S A N D E N V I R O N M E N T • 5 9
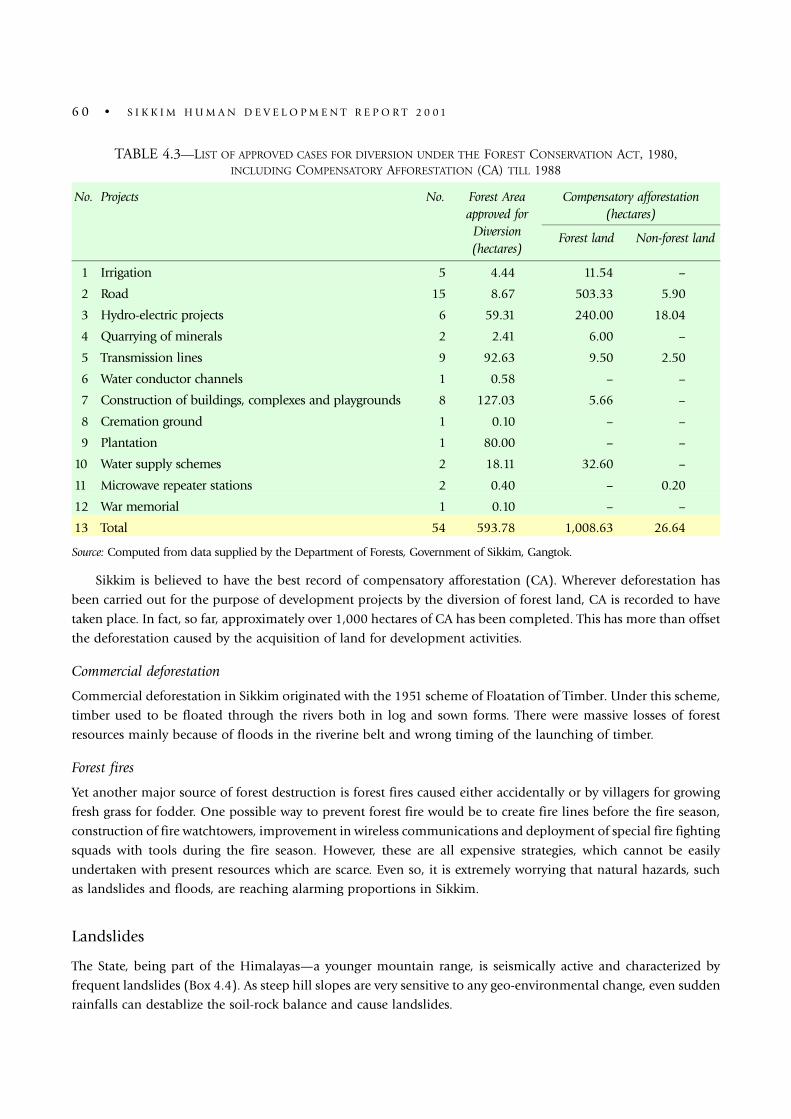
TABLE 4.3—LIST OF APPROVED CASES FOR DIVERSION UNDER THE FOREST CONSERVATION ACT, 1980,INCLUDING COMPENSATORY AFFORESTATION (CA) TILL 1988
No. Projects No. Forest Areaapproved forDiversion(hectares)
Compensatory afforestation(hectares)
Forest land Non-forest land
1 Irrigation 5 4.44 11.54 –
2 Road 15 8.67 503.33 5.90
3 Hydro-electric projects 6 59.31 240.00 18.04
4 Quarrying of minerals 2 2.41 6.00 –
5 Transmission lines 9 92.63 9.50 2.50
6 Water conductor channels 1 0.58 – –
7 Construction of buildings, complexes and playgrounds 8 127.03 5.66 –
8 Cremation ground 1 0.10 – –
9 Plantation 1 80.00 – –
10 Water supply schemes 2 18.11 32.60 –
11 Microwave repeater stations 2 0.40 – 0.20
12 War memorial 1 0.10 – –
13 Total 54 593.78 1,008.63 26.64
Source: Computed from data supplied by the Department of Forests, Government of Sikkim, Gangtok.
Sikkim is believed to have the best record of compensatory afforestation (CA). Wherever deforestation has
been carried out for the purpose of development projects by the diversion of forest land, CA is recorded to have
taken place. In fact, so far, approximately over 1,000 hectares of CA has been completed. This has more than offset
the deforestation caused by the acquisition of land for development activities.
Commercial deforestation
Commercial deforestation in Sikkim originated with the 1951 scheme of Floatation of Timber. Under this scheme,
timber used to be floated through the rivers both in log and sown forms. There were massive losses of forest
resources mainly because of floods in the riverine belt and wrong timing of the launching of timber.
Forest fires
Yet another major source of forest destruction is forest fires caused either accidentally or by villagers for growing
fresh grass for fodder. One possible way to prevent forest fire would be to create fire lines before the fire season,
construction of fire watchtowers, improvement in wireless communications and deployment of special fire fighting
squads with tools during the fire season. However, these are all expensive strategies, which cannot be easily
undertaken with present resources which are scarce. Even so, it is extremely worrying that natural hazards, such
as landslides and floods, are reaching alarming proportions in Sikkim.
Landslides
The State, being part of the Himalayas—a younger mountain range, is seismically active and characterized by
frequent landslides (Box 4.4). As steep hill slopes are very sensitive to any geo-environmental change, even sudden
rainfalls can destablize the soil-rock balance and cause landslides.
6 0 • S I K K I M H U M A N D E V E L O P M E N T R E P O R T 2 0 0 1

Three factors prevailing in Sikkim Himalayas further exacerbate the destabilizing impact of high rainfall. Firstly,
hills in the region are extremely fragile. The strata consist of sandstone, shale, mica schist and quartzite, which
are in disintegrated condition in many places and folded and thrust with a number of fault planes. Secondly, the
topography is such that it leads to enormous erosion, landslides and toe cutting. Thirdly, and most importantly,
land use changes and development intervention have had adverse impacts on Sikkim Himalayas.
The fragile geological structure of the terrain, due to faulty rock formation, is the main cause of landslides in
Sikkim. Incidents of landslides are lower where the rocks are in anticline faults, i.e. the direction of layers embedded
in the slopes is away from the direction of the slope. Case histories of three major landslides during the early
1960s in 7th Mile on Gangtok-Kupup Highway, Rang Rang and New Vong on North Sikkim Highway sugg est that
these landslides occur mostly due to hydrological reasons.
Lack of vegetal cover is certainly another cause of landslides. The excess run-off causes the formation of gullies
and scouring of the banks of the streams and Jhoras, thereby resulting in landslides. Building of houses, roads,
water supply schemes and hydro-power projects; and biotic interference in the form of indiscriminate felling of
trees overloads the carrying capacity of the soil and thus causes landslides (Box 4.5).
Contrary to popular belief that the conservation of forest can act as both prevention and protection against
landslides, there are instances in Sikkim to show that landslides occur even in very dense forests. The Thekeiberg
and Changecenti areas in the East districts and Rang Rang Reserve Forest in the North district have the highest
occurrence of landslides which lie in the densely forested areas of Sikkim. The usual strategy of vegetative cover
does not check this type of landslide.
Box 4.4—Landslide belts
The landslide phenomenon is common to all forest areas in Sikkim. The major landslide belts across districtsare:
East Sikkim: Bhusuk, Barapathing, Changey Senti, Namcheybong, Parakha, Barapathing, 9th Mile, Bordang,Lueing, Kumrek, 6th Mile, Tadong, Phadamchen and Sirwani.
South Sikkim: Lingi-Payong, Kateng, Turung, Turuk, Kewzing, Heingdam (Legship) Shyampari and Sada.
West Sikkim: Mangnam-Kurchey Sakyong, Chewrey Botey (Bermiok), Singshore (Uttarey), Reshi, Daramdin(Rambang), Rumbuk (Ringyang) and Beyong-Tikpur.
North Sikkim: Rang-Rang, Meyong, Lanthey Khola and Ritchum.
Box 4.5—Towards preventing landslides
The Forest Notification No. 2375/F, which dates back to 1954, recognizes the fact that building activitiescan pose a major hazard. The Notification stated:
It is hereby notified for the information of the general public that no construction of buildings whethertemporary or permanent is permitted along either side of the road without obtaining the prior sanction ofthe Darbar in writing. Persons acting in contravention of this order will be punishable with fine, which mayextend to Rs 100 and the structure will be liable to be moved without any claim for compensation.
(D Lama)21 September 1954 Forest Manager, Sikkim State, Gangtok
F O R E S T S A N D E N V I R O N M E N T • 61

In a geologically fragile State like Sikkim, an integrated approach to landslide prevention is required. This
should incorporate afforestation in blank areas, checking run-off, scouring as well as light engineering structures,
and the disposal of run-off through catch-water drains. This approach has been effective in Chandmari, Gangtok
and in 9th mile (National Highway) where vegetative cover was also used.
Glacial lake outburst floods (GLOF) and related disasters
Disturbances in mountain ecology have started attracting considerable attention. The phenomenon of jokulhlaup
(glacier leap), also known as glacial lake outburst floods (GLOF), is a frequent and alarming occurrence in Sikkim.
As the State is dotted with many glaciers, this is a serious potential hazard (Box 4.6).
Most glaciers in Sikkim originate from the Kanchendzonga (Kanchenjungha) (the ‘five big treasures of ice’)
and in turn give birth to streamlets. Venerated by Buddhists as the home of their presiding deity, it is also the
source of the Teesta, one of the main sources of water for Sikkim. The Rangit, which is the largest tributary of
Teesta, is fed mainly by the Rathong Chu and Prek Chu glaciers in north-west Sikkim. The Teesta is also fed by
the Onglokthang glacier.
The fast melting of snow leads to an influx of huge quantities of water into the glacier lakes. When the water
level in these lakes rises, it breaches the dam that is formed of ice, boulders and sand. Often catastrophic, the
surge of water and debris caused by the sudden outburst of glacier lakes in high mountains can change the course
of rivers. This leads to a sudden rise in river flow by more than 10 feet and causes untold misery to all life forms
in the Himalayan region.
A detailed study conducted by scientists and environmentalists of the Kanchendonzga National Park in 1995,
found that the Onglokthang and Rathong Chu glaciers are receding rapidly. This could spell disaster for Sikkim’s
Box 4.6—Global warming: Glacier depletion and the local economy
In 1999, the Chief Minister Pawan Chamling, while receiving the Greenest Chief Minister of India Award givenby the Centre for Science and Environment, New Delhi, stated that:
Even in Sikkim today we face growing problems, which do not really require any sensitive measuringinstruments to see. Our Zemu glacier has depleted in size by more than 3–4 kms. The water in the Teesta isflowing at an all time low. We have had the warmest winter in living memory. These are all indications ofthings going wrong.
Ecological instability had visibly adverse effects on the economy of Sikkim. It had a negative effect on drinkingwater, rabi crops and cash crops like cardamom, ginger and orange. According to the Agriculture Department,the total rainfall between October 1998 to 31 March 1999 was 93.34 per cent less than the rainfall in thelast 25 years in the State. Because of this prolonged drought farmers had to postpone the sowing of seedsand in many cases they had to resort to resowing of the same. Cardamom bushes, which had survived allkinds of climatic depredations for the last six to eight decades, dried up.
The crop failure had severe consequences for the farmers of North Sikkim since they are totally dependenton cardamom and vegetable crops. It is estimated that 60 per cent of the State’s large cardamom plantationswere lost in this unprecedented dry spell. The North district alone produces more than 2,500 tonnes of largecardamom annually, valued at nearly Rs 200 million.
6 2 • S I K K I M H U M A N D E V E L O P M E N T R E P O R T 2 0 0 1

fragile ecology. With the threat of global warming looming large, it is of paramount concern to study the status
of glaciers and the impact of global warming on Sikkim.
A study team reported that since the Little Ice Age, the Onglokthang glacier had retreated by about 500 metres
and the Rathong Chu glacier by 600 metres. Sikkim’s largest glacier, Zemu, had also retreated by 3–4 km. If the
glaciers continue to recede, it could spell disaster for Sikkim’s sensitive economy and may even lead to devastating
floods and ultimate dryness in river Teesta (Down to Earth, 1999).
A nationally coordinated research programme on Himalayan Glaciology, which was initiated by the Depart-
ment of Science and Technology, Government of India, in 1986, has so far covered Himachal Pradesh and Garhwal
Himalayas. This programme needs to be extended to Sikkim Himalayas as soon as possible (Hasnain Syed Iqbal,
1999).
Vanishing species
One of the most debilitating impacts of deforestation and human encroachments has been the steady depletion
of some of the plant and animal species in Sikkim. Despite the fact that there are several efforts to identify and
protect these vanishing species, both at the State and the Union level, an adequate strategy to carry out this gigantic
task has not been developed. However, it may be noted that some of these efforts date back to the late 1960s and
early 1970s (Box 4.7).
In the late 1960s the ruler of Sikkim declared the Red Panda as an endangered species. Of the 155 odd
mammals known to exist in this Himalayan State, as many as 39 have been declared endangered or rare under
Schedule I of the Wildlife (Protection) Act 1972. These include the red panda, Himalayan thar, musk deer, snow
leopard, jungle cat, tree shrew, Tibetan wolf, red fox, Indian wild dog, hog badger, Tibetan sheep, bharal, serow,
Box 4.7—Protecting endangered species
SIKKIM DARBAR GAZETTE, JULY 1970
PART III
OFFICE OF THE CONSERVATOR OF FORESTS
Notification No: 1744/Forests Dated: Gangtok, the 30th July 1970
It is hereby notified for the information of public in general that Lycopodium (Nagbeli, Chusing Dermo)occuring within Sikkim will, henceforth, be collected exclusively by the Forest Department.
No person shall export or attempt to export Lycopodium outside the territory of Sikkim without a permitissued by the Conservator of Forests, Government of Sikkim, or any other Officer duly authorised by him.
Any person who contravenes or abets the contravention of the provisions of this notification shall be liableto prosecution and on conviction shall be punished with imprisonment of either description for a termwhich may extend to Rs 1,000 (Rupees One Thousand). All offences under this notification will be cognisable,bailable and not compoundable.
By Order
(K C Pradhan) Conservator of Forests, Government of Sikkim, Gangtok
F O R E S T S A N D E N V I R O N M E N T • 6 3

kiang and gorla. Many of them have been sighted in parts of Kanchenjunga National Park. Besides the red panda,
musk deer and bharal (blue sheep), are two other animals very rarely sighted during the last decade. The Alpine
musk deer is reported to be found in 12 locations in the high altitude areas of North and West Sikkim. Demand
for musk, obtained from its pod, has led to ruthless poaching and this animal is almost extinct.
There are various sources of information regarding the endangered, rare and threatened plants in Sikkim.
Some of them vary drastically in both identifying the affected species and attributing the exact status and their
causes. The State and Union Government agencies, independent research organizations, local non-governmental
environmental organizations and international bodies have separate listings of these species. Many of them are
endangered species listed in Schedule I to the WL(P) Amendment Act, 1991 and Appendices of CITES.
Under BSI Research Scholar Scheme, a research scholar has been assigned the task of inventorizing the rare
threatened and endemic plants of the State so that adequate steps can be taken to conserve them.
What is more crucial is the protection, conservation and regeneration of flora and fauna. For this, people have
to be made aware of the implications of further destroying the species already endangered. Thus, it is important
to inform people and transform the conservation discourse into a dialogue with the people of the State, and not
only with scientists and experts.
Capacity building in environmental management
The need to promote an awareness about ecological hazards has to be considered also in the light of the fact that
in Sikkim there has been a major gap in the development and availability of human resources for forest
management. Many field officials have never been exposed to training and modern techniques and technologies
in terms of forest related activities, and still look at the entire gamut of forest related issues and problems from
a traditional perspective of managment. They are not equipped to deal with the changing dimensions of forest
management. Capacity building is an essential aspect of afforestation and other forest related activities.
The role of NGOs is crucial as they can articulate issues and problems that are ordinarily beyond the purview
of departmental activities. Sikkim is one State in the eastern Himalayas where the concept of development related
NGOs and community based organizations (CBOs) crept in very late and slowly—it is largely a phenomenon of
the 1990s.
This in a way shows the increasing consciousness among the Sikkimese about the development-related
problems brought about by a massive induction of public funds in the last 25 years (Box 4.8). The State and the
government, as the sole custodian of development, certainly brought about a massive change in the State both in
terms of development and in improving the living standards of people. On the other hand, this process also
brought about imbalances and distortions in the socio-economic fabric of the State, including environmental
damage.
The absence of any monitoring and evaluation mechanism in the State made it more difficult to locate the
distortions and imbalances in the development process. There was a felt need, at least among some sections, for
some institutions to give it a strong sense of direction and to identify priorities.
By now, there are quite a few NGOs working in Sikkim. Besides the Gangtok based Green Circle and Concern
Citizens, there are Sadbhavana Samiti in Singtam, and SOYA in Samdung, South Asia Foundation, Sikkim
Development Foundation, Voluntary Health Association of India, Bunker Roy’s ‘Barefoot Engineers’, Paryawaran
Sangrakshan Sangh, Sikkim Youth Welfare Association in Gyaltshing which are quite well known in their respective
fields of operation.
The Khangchendzonga Conservation Committee is another community-based organization in Yuksam in West
Sikkim which helps to mitigate the adverse impact of tourism, conserve natural and cultural resources, and provide
training to community stakeholders, educate visitors, monitor resources and advocate for appropriate policy
6 4 • S I K K I M H U M A N D E V E L O P M E N T R E P O R T 2 0 0 1

Box 4.8—Quantifying the invisible cost
Sikkim has been the most significant geographical entity in the conservation process in the Eastern Himalayas.It provides i) military security ii) environmental security and iii) continues to forego a huge opportunitycost for economic development. Therefore, Sikkim’s plan expenditure and revenue budgets should beexamined in a different perspective. This proposition sounds abstract and impractical. However, this debatehas to be initiated as it carries the critical issue of sustainability and the staggering cost to be borne by Sikkimand the people of the State.
Firstly, it has been one of the very geo-strategically significant border posts of India and has a hugeconcentration of security and military forces. Besides the other issues related to carrying capacity, the physicalburden of these forces as a pressure on land and other natural and manufactured resources are quite gigantic.This definitely needs to be taken into consideration. All these incur a huge development and environmentalcost to the State, which many other States in India do not have to incur. In the absence of any meaningfuleconomic valuation of these costs, there has been a tendency to over exploit physical and other resourcesof the State without any systematic replenishment. This has started raising the critical question of sustain-ability. There should have been a major chunk of funding to compensate these invisible costs. However, thisis hardly reflected in the development budget of Sikkim.
Secondly; the onus of protecting and conserving the significant portion of the critical eastern Himalayanregion and its environment, including the mountain range, has fallen on the people and the government ofSikkim. The protection of bio-diversity and the forward and backward linkages emanating from it to theentire Himalayan community and the plains land have never been quantified. As a result, many quartersare not able to appreciate the work Sikkim and Sikkimese are doing for the sustainability of the region. Oneway to recognize this service to the nation building process is to supplement the State resources partially forthe upkeep of the hills and the Himalayan region. There has, however, been no additional outlay on renderingthis service, very vital to the entire process of sustainable development in the country as a whole.
The appropriate valuation of positive externalities of conservation is very vital for Sikkim. This involvesdescribing the values of these externalities, whether in terms of value to human or some intrinsic value ofall living things. The point to drive home is the fact that the value of conserving them is greater than thebenefits derived from conversion. The emerging concept of total economic value (TEV) in environmentaleconomics is considered to be the best measure to express the full range of benefits—both tangible andintangible—provided by the forests. In the total economic value, besides the other components one has tolook into both direct and indirect use values. This TEV exercise should be initiated both for assessing andunderstanding the costs involved in the conservation efforts made by the State. This can be a major basisfor a Special Category State like Sikkim to get a special annual package primarily to partially compensatefor what it has been doing in the area of conservation and sustenance.
And finally, the very topography of Sikkim, and the fact that it is, landlocked coupled with its agro-climaticvariations have made it impossible for the State to accomplish an array of interventions making the processof economic development very limited. At times it has been a Hobson’s choice for the State to opt for amajor development intervention as the long run cost, particularly, in terms of environmental security ishigher than the short run benefit. This has forced Sikkim to function in a very constricted development spacewhere the degree of manoeuvrability is very limited. In other States, the interventions by policy makers andpoliticians are not constrained by the factors that characterize the Sikkim Himalayas.
F O R E S T S A N D E N V I R O N M E N T • 6 5

changes. It supported local plantations of native tree species to encourage wildlife and enhance the appearance
of Yuksam village and surrounding areas. It conducts training in responsible trekking practices for locally based
porters in major trekking trail near Khangchendzonga National Park. It promotes the adoption of a code of conduct
for conservation for Khangchendzonga National Park and the surrounding forests.
Indigenous Practices and Intellectual Property Rights (IPRs)
Sikkim is known for practices related to traditional medicines. These practices have a strong base in the socio-
religious healing systems native to the State. The rich variety of plants and animals also help to sustain the system
of traditional medicines. But very little attention has been given to the importance of protecting the intellectual
property rights (IPRs) of indigenous peoples, whose traditional knowledge has often been the source of products
introduced into the international market. Studies on the botanical resources of Sikkim in the past have placed
little emphasis on the vast potential of studies on ethno-medico-botany particularly in the context of both the
rich heritage of indigenous medical practices and the fast changing international regime on intellectual property
rights. The ‘bio-partnerships’ for sustainable development is therefore, very critical in this Himalayan State. It is
vital to develop bio-resources at the human level first since this will ensure, to a large extent, sustainable
development of the other bio-resources.
An emerging facet of biodiversity conservation is the medicinal and therapeutic value of plant and animal
extracts. The rich possibilities of commercial exploitation of these resources could be assessed from the fact that
herbal products are said to account for nearly half the medicines prescribed in the US and this trend is likely to
grow. The Economist of London reported that annual sales of herbal products in the US are in the order of $ 4
billion. The sustainability of the Sikkimese economy and society could be challenged in many critical dimensions.
Therefore, the pressing need is to:
• Develop a well planned strategy to explore medicinal plant-wealth of the State.
• Find out the method of propagation.
• Encourage sustainable harvesting of plants from the forests.
• Involve small farmers and communities in their cultivation.
• Conduct phyto-chemical, pharmacological and pharmacognostic studies on the commercially exploitable
species.
This should be done at all levels. Scientific temper and awareness when infused into traditional practices, can
bring about a major transformation in the socio-economic profile of the villages and bustees of Sikkim. Sikkim
This limited choice and the related constraints on development interventions as compared to the wide rangeof choices and techniques available to other States, need to be considered as the opportunity cost Sikkimwill have to forego. The benefits which would have otherwise accrued to the State need to be objectivelyassessed and provisions made accordingly for compensating the opportunities foregone. This is how a specialcategory State like Sikkim needs to be treated for, at least till it starts showing indications of self-relianceand sustainability.
Therefore, recognition and assessment and compensation of these invisible costs is very critical for thesustenance of a strategic state like Sikkim.
6 6 • S I K K I M H U M A N D E V E L O P M E N T R E P O R T 2 0 0 1

has the potential to become a major supplier of ‘crude-drugs’ for the pharmaceutical industry, a potentially major
source of revenue and a critical public good.
Future options would therefore include:
• Linking forestry to sustainable rural livelihoods.
• Envisaging afforestation as a public good by communities rather than a top down governmental scheme.
Awareness raising and community participation is vital for a successful and sustainable afforestation.
• Creation of a bio-diversity data bank and the preparation of a status report of the plant species. Scientific
monitoring of bio-diversity should be initiated. This should be based largely on participatory processes at
the grass-root level.
• Developing a comprehensive plan to prevent and control landslides after thorough mapping and moni-
toring of landslide prone areas. Subsequently, the State should chart out a landslide preparedness plan,
and also a disaster management plan.
• Promotion of policies that:
Link population strategies to the ‘carrying capacity’ of local ecosystems.
Improve access of the poor to natural and public resources including technologies for sustainable human
development.
Preserve the diversity of genes, species, communities, habitats, and ecosystems.
Use natural renewable resources on the basis of sustained yields and improve the efficiency of energy,
water and land use.
Apply clean technologies in industrial processes.
Promote capacity building at all levels both at the level of community mobilization and governmental
delivery mechanisms.
Conclusion
The forest resources of Sikkim sustain not only local livelihoods and ecology, but also have positive externalities
for the rest of the country, especially the neighbouring plains. Therefore, a formal measurement of forest revenue
need to be supplemented with natural resource accounting. This would help to highlight the actual contribution
of forests to policy makers and the general public. This could be an important policy tool for forest conservation
and protection, including those of the communities that depend on them.
Chapter 5 4
3 Contents
F O R E S T S A N D E N V I R O N M E N T • 6 7

Infrastructure forDevelopment:
Industry, Power andState Finance
Infrastructure forDevelopment:
Industry, Power andState Finance


Chapter
5��
Infrastructure for Development:Industry, Power and State Finance
Industrial stagnation: Reorienting policies
In order to sustain and further improve Sikkim’s achievement in the area of human development, it is necessary to
focus on the provisions of physical infrastructure and industrial development. These can help to improve connectivity
and access of the people to public services and enhance the prospects of gainful employment in the State.
The industrial sector was not well developed in Sikkim during the pre-merger period (Box 5.1). Distillation
of wines and liquors was one of the first modem industries established at Singtam in 1955, providing employment
to 30 managers and 150 labourers by the Third Plan period. This distillery was equipped with the state-of-the-art
equipment and served both domestic and overseas markets. The other undertaking that for years was a ‘flagship
company’ was the Government Fruit Preservation Factory also set up at Singtam in 1956. This factory utilized the
ample orange production in the State, cutting down wastage in transit and storage locally, and eliminating
Box 5.1—Historical background of industrial development
The existence of craftsmanship based traditional Sikkimese cottage industries dates back to several centuries.The dexterity and skill the Lepchas showed in bamboo-craft, wood-work, spinning of loom and weavingtraditional textures have been well recorded with handsome tribute in contemporary history. On the otherhand, the Bhutias excelled in ancient Tibetan practice of carpet and rug weaving with muted shades andbrilliant colours of pure vegetable dyes. The Nepalis are celebrated for the craftsmanship of their metalwork,silverware and wood-work. Many of these products are very exclusive, as a result of which they cannot beeasily brought to the market place. Governmental patronage helped to sustain these traditional practices ina very important way (NCAER 1967).
The carpets were woven in the Maharaja’s factory and two weaving schools at Lachung and Lachen were alsoset up to support it. The Palden Thondup Institute of Cottage Industries set up at Gangtok in 1957, traineda large number of Sikkimese boys and girls in local handicrafts including carpentry, handmade paper, carpet,doll making and handloom and weaving. This process was consolidated during various plan periods.
For a village craftsman, who is essentially a cultivator, this traditional activity was primarily undertakenduring the lean season for earning an additional income. But for the town based trainees, these activitieswere not profitable because they could not produce quality products and hence did not fetch a remunerativeprice. The most crucial handicap has been the very limited market, in Sikkim, for all these products whichwere unable to give sufficient stimulus to the industry.

middlemen. It also added value by providing incentives to farmers to bring additional acreage under horticulture
(Debnath, 1974).
Immediately after the merger, all the four districts were declared as being industrially backward. The Directorate
of industries, which was established in 1976, attempted to create a conducive policy environment. Largely based
on a Techno-economic Survey by the Union Ministry of Industry (1974), this Directorate undertook significant
measures such as the promotion of a viable system of incentives and subsidies, financial and technical support
and industrial training.
In 1977, the Sikkim Industrial Development and Investment Corporation Limited (SIDICO) was set up as
the state-level principal financial institution engaged in the promotion and financing of development in this
sector. Its mandate was to provide soft loan or seed capital to selective venture projects and to also procure and
distribute raw materials for selective industries and activities.
There are no Central Public Sector Undertakings (PSUs) in Sikkim. However, the data supplied by the Industry
Department show that there are 1,360 units which have been granted provisional registration from 1976 onwards.
Out of these less than 300 Small Scale Industries (SSI), tiny units, have begun to function. Over 72 per cent of
these units are located in the East district (Table 5.1).
TABLE 5.1—REGISTERED SMALL SCALE INDUSTRIES TINY UNITS (1999)
Period East North South West SSI/Tiny Units Total
1975/76–79/80 7 2 – 1 10
1980/81–84/85 7 4 2 13 –
1985/86–89/90 56 1 14 9 80
1990/91–94/95 84 2 18 11 115
1995/96–98/99 60 – 13 6 79
Source: Government of Sikkim, Department of Industry, Gangtok.
TABLE 5.2—DISTRICT-WISE DISTRIBUTION OF STATE LOANS (1997–98)
East West North South Total
Term Loan
Number 1,658 526 317 567 3,068
Amount 2,399.79 243.63 113.28 379.62 3,136.32
Investment
Number 16 – – 2 18
Amount 131.58 – – 123.28 254.68
Others
Amount 257.76 9.97 19.80 230.30 517.83
Total 1,674 526 317 569 3,086
Number (54.2) (17.1) (10.3) (18.4) –
Amount 2789.13(71.4)
253.6(6.5)
133.08(3.4)
733.2(18.7)
3909.01
Note: Data within parentheses is the percentage of the total.Source: SIDICO, 21st Annual Report 1997–98, Government of Sikkim, Gangtok, p. 25.
It may be noted that over 54 per cent of the industrial units, for which financial assistance from the State has
been extended, are located in the East district. In 1997–8 the least number of loan-taking industries (10 per cent)
were located in the North district, which also recorded the lowest proportion (3.4 per cent) of total loans (Table 5.2).
7 0 • S I K K I M H U M A N D E V E L O P M E N T R E P O R T 2 0 0 1

In contrast, the East district recorded 71 per cent of the total loans. This certainly brings in larger issues of
concentration of industrial activities in the already congested East district, and its environmental and social fall out.
The outlays for the industrial sector have been consistently low, never exceeding 7 per cent of the total outlay,
and mostly less than 5 per cent (Table 5.3).
TABLE 5.3—SIKKIM PLAN ALLOCATION: INDUSTRIAL SECTOR (1954–2002)
Sectors I Plan* II Plan III Plan IV Plan V Plan VI Plan VII Plan VIII Plan IX Plan
Total Plan Outlay (Rs million) 32.4 63.7 97.1 203.6 401.0 1,478 2824 7,245 16,028
Share of Industrial Sector (in %) 4.3 0.5 6.7 3.5 6.6 4.2 4.0 3.85 4.24
Note: * First Seven Year Development Plan.Source: Computed from various Plan documents, Government of Sikkim, Gangtok.
The contribution of the manufacturing sector to the State’s income shows a declining trend. According to the
data provided by the Central Statistical Organisation, the contribution of the manufacturing sector to the Net
State Domestic Product (NSDP) in Sikkim has shown a secular drop from 5.7 per cent in 1980–1 to 2.2 per cent
in 1995–6, even though in absolute terms, it increased from Rs 27.9 million to Rs 100.03 million during this
period. The share of industry has declined partly because the NSDP has recorded over 9 fold increase in absolute
terms as against the 3.5 fold increase of the manufacturing sector during the same period. (Table 5.4). In other
words, the growth rate in industry has been significantly lower than the growth rate in other sectors.
TABLE 5.4—SHARE OF MANUFACTURING IN NET STATE DOMESTIC PRODUCT (NSDP)
Industry of origin 1980–1 1985–6 1990–1 1995–6
NSDP (Rs million) 489.8 1,133.0 2,129.5 4,459.7
Manufacturing 2.79(5.7)
5.9(5.2)
7.82(3.7)
10.03(2.2)
Note: Data within parentheses is percentage of the total.Source: Government of Sikkim, Sikkim in Brief: 1998, Bureau of Economics and Statistics, Gangtok.
However, the above analysis reflects only the contribution of registered manufacturing activities. There has
been a proliferation of unregistered enterprises, especially in the informal sector. The Economic Census conducted
by Central Statistical Organization (CSO) (1990) indicates that the number of enterprises including those in the
unorganized sector stood at 10,751 (94 per cent in non-agriculture) and employment in these units stood at 48,114
workers (with 24 per cent women workers). These enterprises were located in the rural and urban areas at the
ratio of 2.2 : 1. Interestingly in the rural areas also, these units were overwhelmingly in the non-agricultural sector
(92 per cent) (Sankrityana,1994).
Among the industrial/entrepreneurial activities that have taken the major share of the financial assistance
extended by SIDICO, there were the Chief Minister Rojgar Yojna (CMRY) activities (43.1 per cent) (Table 5.5).
Activities under the services sector (nearly 27 per cent) followed, with the hotel industry as well as single vehicle
operators taking a hefty share. Another major activity was textile, constituting over 11 per cent of the total number
of industries initiated with loans from the State.
Resource concentration in terms of a particular type of industry’s share in the total loans extended does show
that the distribution of financial assistance has been skewed. For instance, the major share of industrial activity
was held by CMRY (43 per cent) and textiles (11.6 per cent). However, these two categories availed of only around
6 and 3 per cent of the total financial assistance extended, respectively, whereas, industrial jewels (less than one
per cent) and food processing (about three per cent) obtained, around 11 per cent and 14 per cent of the total
I N F R A S T R U C T U R E F O R D E V E L O P M E N T • 71

assistance respectively. This indicates both the high levels of risk involved in financing such activities and also the
genuineness of some of the industrial activities in terms of sustainability. In the absence of any serious and scientific
project appraisal and monitoring, the more financial assistance is concentrated in fewer activities, the higher the
risk of both default and closure of the unit.
TABLE 5.5—INDUSTRY-WISE DISTRIBUTION OF STATE LOANS 1977 TO 1998
Type of Industries No* Amount* (Rs)
Food Based 88 (2.8) 544.06 (13.92)
Textile 362 (11.6) 102.12 (2.6)
Printing and Paper products 35 (1.1) 73.37 (1.88)
Rubber and other products 4 (0.12) 34.51 (0.9)
Minerals and Chemicals 20 (0.64) 116.17 (3.0)
Iron and Steel Industry 17 (0.54) 116.07 (3.0)
Electrical and Allied 13 (0.42) 62.9 (1.61)
Services
i) Hotel Industry 349 (11.1) 900.07 (23.0)
ii) Single Vehicle Operator 336 (10.7) 369.6 (9.5)
iii) Others 189 (6.0) 134.63 (3.44)
Industrial Jewels 17 (0.54) 417.21 (10.7)
Other Industries 350 (11.2) 797.3 (20.4)
CMRY 1,350 (43.1) 241 (6.2)
Total 3,130 3,909.01
Note: * Data within parentheses are the percentage of total.Source: SIDICO, 21st Annual Report 1997–8, Government of Sikkim, Gangtok, p. 24.
Besides budgetary incentives, the Government of India has encouraged industrial activity by extending other
amenities and setting up branches of Central financial and industrial units. The two Central units are:
• National Small Industries Corporation Limited (NSIC), which provides plant and machinery to entrepre-
neurs on hire-purchase basis and also helps the units in marketing their products.
• Small Industries Development Bank of India (subsidiary of IDBI), which is engaged in providing financial
assistance exclusively to small scale and tiny industries in the State. It finances any project which costs
above Rs 5 million.
Other central units like Small Industries Services Institute (SISI) (under the Ministry of Industry) provides
technical inputs and assistance like the preparation of project report, consultancy, references, and training facilities.
NABARD finances agriculture and other allied activities and All India Handicrafts Board promotes cottage industries.
There were provisions for strong Central investment subsidy applicable to the industrial units and hotels
between 1980 to 1989. These units were entitled to 15–25 per cent as outright subsidy not exceeding Rs 2.5
million. Under these provisions, Rs 61.1 million was received by the units in Sikkim. Similarly, under the scheme
of Central transport subsidy, the industrial units in Sikkim were reimbursed the cost of transportation of raw
materials and finished products from and to the nearest railheads to the extent of 75–90 per cent. This amounted
to Rs 63.11 million during 1985–6 to 1997–8. Interestingly, only 17 per cent of investment subsidy was utilized
till 1985–6, which was 27 per cent in case of transport subsidy upto 1990–1. In a way, this trend indicates how
7 2 • S I K K I M H U M A N D E V E L O P M E N T R E P O R T 2 0 0 1

slowly the local entrepreneurs in Sikkim react to any incentive scheme. This also raises the issues of dissemination
of information on such schemes among the entrepreneurs.
To attract investment in industries, more liberalized incentives were enunciated in 1991 (Notification No. 27/
DI/89–90 (111)/7452 dated 13 March 1991). Under this, industrial units can now avail of subsidy on: captive power
generating set, cost of transformer and power line, consultancy services, power, interest on working capital, registra-
tion fee of promotion councils—Indian Standard Institution, Commodity Boards, Chambers of Commerce—pub-
licity and advertisement, study tour and in-plant training, price preference, concession on sales tax, deferment of
excise duty, special incentives for high value low volume production units and units utilizing local raw materials.
It is important to underline that there are good examples of entrepreneurial activities in the State, which have
come up without much support from the government (Box 5.2). Though a majority of them are run on a small
scale, they are very popular. For instance, Tripti Bakeries, a unit engaged in bakery products has become a household
name. Similarly Ladakhi Hume Pipes run by a Sikkimese entrepreneur for the manufacture of hume pipes, has
been doing very well.
Box 5.2—Success stories: The enterprise trio of Sikkim
There are some good examples of entrepreneurial activities in the State, which have come up without muchsupport from the government. Some of those have a long standing in the State.
I. Sikkim DistilleriesSikkim Distilleries was one of the first modern industries in Sikkim to be set up in 1954. In order to ensurequality liquor for his subjects at a reasonable price, the then Chogyal agreed to give the Company absolutemonopoly for the manufacture of alcoholic drinks in Sikkim on condition that the Durbar (the government)was given about 47 per cent of its shares. The annual turnover has recorded a quantum leap forward; Rs13.3 million in 1975 to Rs 192.9 million in 1998. The product line has also undergone a drastic diversifi-cation. Though the share of this unit’s products in the local market has been over 80 per cent, its share inthe rest of India is minuscule. Within the local segment also, the most demanding market segment has beenthe armed forces.
II. Sikkim JewelsTaking advantage of the unpolluted and dust free atmosphere Sikkim Jewels Limited was set up in 1972 forthe manufacture of industrial jewels. For many years this remained a high potential industry, as there washuge demand for watch jewels from HMT Ltd which till then imported most of its jewel requirements.
In the last few years there has been a severe drop in the demand for jewels by major clients like HMT, Titanand Allwyn Watches, mainly because of the overall worldwide recession and emerging substitution of jewelsby quartz watches. The steep competition has always kept the price line very low. A senior manager in SikkimJewels mentions that ‘there has been an increase of only 15 per cent in price since 1976’.
This is the only integrated factory in Sikkim that has been able to sell its product in the domestic market aswell as in countries abroad. Though it has a major chunk (40 per cent) of market share and no intermediaryis used in marketing, it can be made more cost effective by having a custom clearance near Sikkim insteadof at Calcutta.
III. Sikkim Time CorporationSikkim Time Corporation (SITCO) one of the first industrial units in Sikkim, which was established in 1977,in technical collaboration with Hindustan Machine Tools (HMT) for the assembly of watches. Starting with25 workers and assembly of only mechanical watches, SITCO today has a staff of over 300 and 4 units:mechanical watches, semi-conductors, digital watches and watch crowns. The mechanical watch assemblyunit is the flagship unit of the company and is a major part of the total firm.
I N F R A S T R U C T U R E F O R D E V E L O P M E N T • 7 3

Industrial activities: Why poor performance?
More than 25 years after the merger with the Indian Union, industry is still at a nascent stage in Sikkim. In 1992,
the existing industrial units were providing employment to over 4,000 persons, which was hardly about one per
cent of the State’s population. This can be attributed to factors such as industrial sickness and governance-related
distortions in the private sector, which are also common to several other States with poor levels of industrial
development.
The sickness syndrome
Like in other States, the number of industries going sick in Sikkim has been simply alarming. Many of them have
defaulted in loan repayments. Most of the units were started by the first generation of entrepreneurs lacking in
management and technical know how. Moreover, the units that were provided term loans were not able to get
working capital from commercial banks. Since the units are not able to run to their break-even level and generate
enough resources, they have not been able to repay the loans (Government of Sikkim, 1998e). Some time there
is also over-run in project cost, affecting the viability of the units. Many observers believe that the considerable
extent of political influence in extending the loan to various units, have in fact overshadowed the consideration
of techno-economic viability of the project. In the absence of independent monitoring of the performance and
health of these units in the following years, they invariably become sick units.
Sikkim Khadi and Village Industries Board is running 13 cotton production-cum-training centres, and 6
woollen centres, besides 7 sales centres providing direct employment opportunities to about 250 persons. However,
over 50 per cent of the centres have gone sick.
The basic handicaps and constraints are:
• Lack of knowledge of the entrepreneur regarding manufacturing activities.
• Lack of raw material.
• Absence of proper manpower.
• Poor marketing network.
• Inflexible land laws and lack of enabling laws.
• Underdeveloped infrastructure facilities.
• Shortage of credit and finance.
Investor perceptions
Sikkim’s rank is among the lowest in terms of crime rates and political violence in the country. Political stability
has also been its hallmark. Yet, little investment has taken place in the State. In fact investors have shown a distinct
tendency of shying away from economic activities in Sikkim. Business Today (Dec 22, 1999–Jan 6, 2000) stated
that out of a total investment of Rs 43.76 billion in the State, almost 95 per cent has come from the government.
It also mentions i) poor connectivity with large markets; suitable only for tourism, ii) precarious financial
Sikkim Time Corporation has modern facilities and the latest instruments and equipment. A range of models(digital and ana-digital) and its latest ‘IQ’ brand of digital watches have become very popular amongconsumers. The turnover of the company recorded a sharp 20 per cent rise from Rs 34.3 million during1995–6 to Rs 41.3 million during 1996–7 and the net profit after depreciation increased from Rs 5.5 millionto Rs 7.9 million.
7 4 • S I K K I M H U M A N D E V E L O P M E N T R E P O R T 2 0 0 1

condition of the State exchequer and iii) lowest market potential value in the country and low degree of purchasing
power as the three major investment weaknesses in the State.
The persistence of investor disinterest despite favourable social and political climate shows that perceptions
play a big role in dictating investment inflows. It would be necessary to undertake systematic efforts to correct
these perceptions, in order to create a favourable environment for industrial investment in Sikkim. Moreover
substantial public investment in physical infrastructure (roads, connectivity and power) can also make Sikkim a
more attractive investment destination.
Potential investors do accept that Sikkim has prospects of coming up as a modern industrial State. However,
investors still do not find Sikkim to be an investor friendly State. Some of them have faced serious hurdles and
are of the opinion that the economic decision making in the State is unnecessarily influenced by varieties of
political and other non-commercial considerations. ‘Perceptions play a big role in dictating investment inflows,
but impressionistic ideas, shaped by piecemeal experiences, can yield general assessments’ (Business Today, 1997).
Taking this into account, the New Industrial Policy (1996) has provided several concessions and incentives
designed to attract investors (Government of Sikkim, 1996). Some of the incentives are:
• State capital investment subsidy. This is provided on a graded level, i.e. depending on the scales of operation,
to both new and old units carrying out modernization and expansion activities. For the thrust areas,
investment varies from 10–20 per cent and for the non-thrust areas from 5–15 per cent of total capital
investment in plant and machinery.
• Subsidized interest on working capital. This is provided for five years for interest in excess of 14 per cent of
the interest payable by industrial units on the working capital loan obtained from banks. Depending on
the scale of operation, the amount varies from Rs 15,000 to Rs 1,10,000 or actual difference in interest
whichever is less in thrust areas and Rs 10,000 to Rs 100,000 in non-thrust areas.
• Exemptions from State and Central sales tax. This will be provided for 7 years from the date of actual commercial
production.
• Price preference. This is 10–15 per cent (over the rates quoted on same quality of product from outside
Sikkim) to industrial undertakings established in Sikkim on the purchase made by various State Government
departments and organizations.
• Subsidy on captive power generating sets. This is provided to the thrust area industries to the extent of 30 per
cent (maximum Rs 1,25,000) and 25 per cent (maximum Rs 1,00,000).
• Subsidy on power consumption. This is provided to the extent of total reimbursement of the first Rs 50,000
of power consumption per annum of the unit and then on pro rata basis. The thrust area industr ies receive
a subsidy of 30 per cent in power tariff.
Besides the above incentives, there are well laid out subsidies consultancy services, study tours and in-plant
training, registration fees of promotion councils, and some services provided by Indian Standard Institution,
Commodity Boards and Chambers of Commerce and Industry.
However, there has not been any visible impact of these provisions on the industrial proposals and actual
setting up of industries.
• This can be attributed to:
• Serious budgetary constraints thereby limiting any meaningful implementation of the incentives.
• Many key departments are not actually complying with the provisions of this scheme thereby making the
newer approaches redundant.
• The entrepreneurs from outside the State find it very difficult to furnish documents like domicile residential
certificates.
I N F R A S T R U C T U R E F O R D E V E L O P M E N T • 7 5

• Land laws do not permit alienation of land to outsiders.
• The inadequacy and delay in getting working capital, many a times leading to the closure of the units and
increase in non-performing assets.
• Poor social and industrial infrastructure, most crucially power.
• Lack of a mechanism within the government to monitor and evaluate the implementation of policies. As
a result, most of the incentives have remained on paper.
Policy interventions and suggestions
The Task Force recommendations of May 1999 do indicate the changing face of policy interventions in the
industrial sector of the State.1 Some recommendations are:
• The State Government must coax the primary sector into generating surpluses so that the purchasing power
can come into the hands of the rural masses and in turn fan industrial growth. This route will involve a
maximum number of people.
• It is estimated that Sikkim needs to generate about 6,500 jobs per annum in order to tackle the unemploy-
ment problem on a sustained basis. This can be achieved through a policy mix that will generate 2,000
jobs each in agriculture and service sectors, 1,000 in animal husbandry and 1,500 in the industrial sector.
• In order to reach the incentives and subsidies extended under the new industrial policy, 1996 adequate
budget provisions and effective disbursement is necessary.
• The policy for the investors has to be very clear and investor-friendly.
• The land laws in Sikkim need to be relaxed to enable entrepreneurs to acquire land to set up industrial
units.
• Upgradation of Bagdogra Airport as a national and international airport for both tourists and transportation
of high value, low volume goods is necessary.
• Gearing up of the Commercial Banks is necessary to make the much needed adequate and timely working
capital available to the industrial units.
• Setting up of Central Public Sector Undertakings (PSUs) along with the strengthening of the existing State
PSUs by infusing additional funds is required.
• Improvement in industrial and social infrastructure to attract new industrial units by industrialists from
outside as well as Non Resident Indians (NRIs) is needed.
• Downsizing of State PSUs through Voluntary Retirement Scheme and Golden Handshake will make them
economically viable.
• Tea development should be taken on a war footing in areas identified by TRA especially through Small
Growers Scheme.
• Setting up a yarn bank to provide woollen and cotton yarn to the weavers at a reasonable price, which will
encourage self-employment ventures among trained carpet weavers, is necessary.
• Training facilities in various technical fields through training institutes like ITI, Polytechnics etc. is crucial.
The Business Today survey identifies three distinct investment strengths and competitive edge of Sikkim:
• Highest surplus in power in the country at lower power tariffs.
• Least troubled State in the North-East, ideal for investment in tourism.
• High rate of literacy and wide coverage of public health care system.
1. The Task Force was constituted under the Chairmanship of Commissioner-cum-Secretary, Industries vide Letter No: 8/SGO/DI/99–2000/128 dated 15.5.1999.
7 6 • S I K K I M H U M A N D E V E L O P M E N T R E P O R T 2 0 0 1

The inclusion of Sikkim in the North Eastern Council (NEC) is likely to trigger off a major breakthrough in
industrial activity in the State. This is because Sikkim can:
• Now make use of the expertise of various agencies and instruments attached to NEC on the industrial front
• Access both financial and other technical institutions including North-East Financial Development Corpo-
ration and Industrial and Technical Consultancy Organization.
• Take advantage of some of the policies of the centre which are exclusively meant for the North-East States.
The latter includes exclusive industrial policy with very attractive fiscal concessions etc.
Power development: Structure, potentials and challenges
An assured and fiscally viable supply of power is a variable for the success of industrial development in Sikkim.
In this respect, it may be useful to assess the trends in power sector in the state.
The power situation of Sikkim before its merger in 1975 was in its infancy because demand itself was low.
The power requirement of Gangtok and a few townships falling along the National Highway was met from the
small 2.1 MW Jali Power House commissioned in 1964. Also, a small Diesel Powerhouse was used as a standby
for use during emergencies. Similarly, Rothak (South) and Rimbi (West) micro-hydels with an installed capacity
of 200 kW each were under operation to feed the District Headquarters and major townships in the South and
West districts, while the North district had to manage with a 50 kW micro-hydel unit known as manual micro-hydel,
which has since become inoperative. Till the end of 1975, there were only 8 declared towns that used electricity
in Sikkim, while rest of the areas had no power supply.
TABLE 5.6—INSTALLED CAPACITY IN POWER PROJECTS (IN MW)
Project Installed Capacity (MW) Firm
Rongnichu (Stage-I) Jali Power House 2.10 1.20
Lower Lagyap Hydel Project 12.00 5.50
Rongnichu (Stage-II) 2.50 1.20
Rimbi (Stage-I) 0.60 0.30
Rimbi (Stage-II) 2.50 1.20
Rothak Micro Hydel Scheme 0.20 0.10
Lachen Micro Hydel Scheme 0.10 0.05
Lachung Micro Hydel 0.20 0.10
Mayongchu HEP 4.00 2.00
Upper Rongnichu 8.00 4.00
Kalej Khola HEP 2.00 1.00
Diesel Power House, Gangtok 4.00 Stand by
Diesel Power House, LLHP 1.00 Stand by
Total 39.20 22.00
Source: Department of Power, Government of Sikkim, Gangtok.
Till the end of 1979, the State had a total power generation capacity of only 3 MW to meet the increasing
demands of the State and hence drastic load shedding had to be imposed. Thereafter, the State undertook the
extension of electrification to small townships and villages at a faster pace (Table 5.6). Today, the State has an
I N F R A S T R U C T U R E F O R D E V E L O P M E N T • 7 7

installed a capacity of 38 MW, and the State government’s department dealing with power also performs the role
of the electricity board.
Besides, the State’s share in Chukha Hydel Project, Bhutan (5 MW) and Farakka Super Thermal Power Station
(7.20 MW), Ramam Hydel Project (10 MW) and Rangit Hydel Project (7.20 MW) are drawn though the West
Bengal transmission System. However the experience with these drawals has been disappointing as they are marred
by frequent interruptions due to tripping etc. Even otherwise, the existing transmission system of West Bengal is
weak and dependence on such a network for drawal of the State’s share of Central Sector power would always be
subject to disruption. But there appears to be no other immediate option (Government of Sikkim, 1999b).
Though the power sector has consistently received a relatively higher share in the plan outlay (9.2 per cent
in the First Plan (1954–61), 10 per cent in Fifth Plan (1974–9) and 19.4 per cent in the Ninth Plan (1997–2002)
amounting to Rs 2,840 million in the last 24 years, the rate of increase in the power output has not kept pace
with the rapidly increasing demand which at present is of the order of 15–20 per cent per year. The estimated
peak shortfall has increased almost three fold from 5.7 MW in 1988–9 to 14.03 MW in 1997–8. The annual
growth rate of this shortfall (12.32 per cent) has been almost double (6.85 per cent) that of the installed capacity
(Table 5.7).
TABLE 5.7—POWER REQUIREMENTS OF THE STATE
Year Installed Capacity (MW) Growth Rate (%) Peak Shortfall (MW) Growth Rate (%)
1988–89 21.50 – 5.70 –
1989–90 21.60 0.47 8.60 50.88
1990–91 21.60 0.00 11.60 34.88
1991–92 21.80 0.93 11.35 – 2.16
1992–93 25.80 18.35 9.35 – 17.62
1993–94 31.80 23.26 8.35 – 10.70
1994–95 33.80 6.29 9.35 11.98
1995–96 35.80 5.92 40.35 10.70
1996–97 35.80 0.00 12.35 19.32
1997–98 38.10 6.42 14.03 13.60
Annual Growth Rate 6.85 12.32
Source: Computed from the data projected by the 15th Electric Power Survey of India quoted by Annual Report 1996–97 & 1997–98, Power Department, Gangtok, 1999.
The nationwide problem of massive transmission and distribution (T&D) losses also plagues Sikkim. To
minimize such losses, upgradation of the existing transmission voltage to a suitable grade after load flow and
system is essential. Introduction of 132 KV transmission lines and extension of Eastern Regional grid upto Melli
and Gangtok, and up-gradation of sub-stations, and distribution lines including energy auditing etc. at all levels
of generation, transmission and distribution up to the consumers premises are other primary requirements.
In view of the anticipated industrial expansion and also growing urban domestic and rural needs, the present
unreliable and inadequate power supply has been a major reason for the State’s inability to attract more private
investments (Box 5.3). In fact, even without further industrial expansion, the peak load demand of the State by
2002 will reach 60 MW.
7 8 • S I K K I M H U M A N D E V E L O P M E N T R E P O R T 2 0 0 1

Alternative power sources should be explored and developed. In Sikkim the large potential of 8,000 MW
hydro electric power should be strengthened. However, only 0.2 per cent capacity has been installed. This is very
low compared to that of most other States-but the situation in the north-eastern parts of the country is similarly
dismal (Table 5.8).
TABLE 5.8—INDIA: STATE-WISE DISTRIBUTION OF INSTALLED HYDEL CAPACITIES (1995) (IN MW)
State Total Hydel Installed Capacities Percentage Share in Total
Andhra Pradesh 2,656 14.0
Karnataka 2,410 12.7
Tamil Nadu 1,948 10.3
Punjab 1,799 9.5
Maharashtra 1,740 9.2
Uttar Pradesh 1,505 8.0
Kerala 1,491 7.9
Orissa 1,272 6.7
Rajasthan 971 5.1
Haryana 884 4.7
Box 5.3—Free connection to the have nots
Rural electrification has been the most daunting task in Sikkim both because of the extreme and unfriendlytopographical conditions and the huge technological and financial resources involved. Unlike villages in theplains, which comprise clusters of habitations, the configuration in the hills of Sikkim is highly scatteredsometimes making any community project not only cumbersome but also uneconomical. Therefore, thesocial rate of return of investment in Sikkim needs to be given equal priority with the economic rate ofreturn.
After reaching the target of 100 per cent rural electrification, the government took to intensification schemes,i.e. the extension of electrification to the uncovered households along with providing two point freeconnections to the households under poverty line in accordance with the National 20-Point Programme.Since the early 1980s, the government started giving ‘two point free connection’ to the households belowthe poverty line. This was done as a part of the Minimum Needs Programme and later renamed as Kutir-JyotiProgramme. This meant spending Rs 900 per household for the connection.
All the 45 habitable revenue blocks in the State had access to electricity by March 1991, thereby making itthe first State in the entire eastern region to have a 100 per cent coverage of electricity. This is despite thefact that Sikkim was 25 years behind other States in the Central Plan process. With the completion of LachenMicro Hydel Scheme, which harnesses Lachen Chu to generate 2 × 50 kW at a drop of 150 feet, the tribalsof Lachen have also got access to electricity.
On the other hand, though all the villages are electrified, a sample survey conducted by the State Governmentin 1989 showed that only 61 per cent of the households in rural areas and 85 per cent in urban areas werefound to have electricity connection. A similar study of 1997 showed only a marginal improvement (Gyatsoand Bagdass 1998).
(continued)
I N F R A S T R U C T U R E F O R D E V E L O P M E N T • 7 9

State Total Hydel Installed Capacities Percentage Share in Total
Madhya Pradesh 846 4.5
Gujarat 427 2.3
Himachal Pradesh 274 1.4
Jammu & Kashmir 180 1.0
Meghalaya 187 1.0
Bihar 162 0.9
West Bengal 72 0.4
Arunachal Pradesh 24 0.1
Sikkim 31 0.2
Tripura 16 0.1
Assam 2 0.0
Manipur 3 0.0
Mizoram 3 0.0
Nagaland 3 0.0
18,906 100.0
Source: Statistical Abstract India (1997), Central Statistical Organization, Department of Statistics, Ministry of Planning and Programme Implementation, New Delhi, p. 170.
The power situation in the State also received a major set back when the run-of-the-river 30 MW Rathongchu
Project (total cost: Rs 712 million) was withdrawn exactly three years after its implementation on environmental
grounds (Box 5.4). To rectify the situation, the State Government has constituted the Sikkim Power Development
Corporation Limited to implement both hydro power projects and to lay the associated transmission lines.
(Table 5.8 continued)
Box 5.4—Development and environment: Need for effective communication
After the Rathong Chu project was shelved primarily on environmental and eco-cultural grounds, there havebeen several development projects that await implementation. Among them are hydro electric power projects,the Teesta III and V.
The Environmental Impact Assessment (EIA) of the Teesta III has already been undertaken by evaluating 68relevant environmental parameters representing various components of the environment, viz. local flora andfauna, environmental pollution (water, air, land and noise), aesthetics and human interest. According to theEIA, the proposed project will result in little or no impact due to:
• Dust or aerosols.
• Submergence of about 12 hectares of Chungthang area, which is of minor ecological or socioeconomicsignificance.
• Depletion of vegetation in the Lachen and Lachung Valleys.
• Destruction of rare and endangered plant species in the area.
Yet, the Government has not been able to communicate these findings to the people who remain unawareof the implications of these projects.
8 0 • S I K K I M H U M A N D E V E L O P M E N T R E P O R T 2 0 0 1

This project was aimed at meeting a demand-supply gap in the late 1990s. The project had already incurred
an expenditure of Rs 148.9 million by March 1997, in the construction of 5.5 km long approach roads, 4.5 km
long water conductor system, residential and non-residential buildings and the erection of 11 KV lines. This project
was also techno-economically cleared by the Central Electricity Authority. One of the very vocal NGOs took the
case to both the High Court and the Supreme Court. As a result, the State Government withdrew the project.
Despite this, the State has pinned hope on another major hydel project viz., Teesta Hydro Electric Project
Stage V (510 MW). This project is estimated to cost Rs 30 billion and is being built by National Hydro Electric
Power Corporation. Though the Power Department mentions that this project will largely cover the axiomatic gap
between the power requirement and its generation in the State which was being met through drawing Central
sector power, this has also started attracting opposition from the indigenous communities. Though this project is
likely to generate ample employment opportunities and a direct annual benefit of Rs 1.25 billion per annum,
before launching this project a large scale consultation needs to be made to make it acceptable to a maximum
number of people.
If well planned, Teesta V can also be another promising project like Chukha in Bhutan and Chamera in
Himachal Pradesh. In case of the 336 MW Chukha Project, Bhutan earned as high as Nu 1454 million (1 Re = 1
Nu) as profit in 1998–9 alone, mainly from its power export to India. This largely met Bhutan’s Seventh Five Year
Plan (1992–7) power sector objectives of increasing government revenues through the generation of power for
sale to India and to industries in the country.
The sale of surplus power (@@ Rs 1.50 per unit) to highly power deficit areas of West Bengal, Orissa and the
North-East has been the hallmark of this project. The transmission link has also been a great success, which is
likely to be upgraded to help the evacuation of 4,500 MW from three large potential power projects in Bhutan.
The Tala Project is being constructed on similar lines, and if Manas (2,800 MW) and Sankosh (1,525 MW) projects
are implemented, they could bring about a major transformation in the economy of Bhutan (Lama, 2001).
Lessons learnt from such large-scale projects indicate that community participation in decision-making would
have prevented the large and avoidable costs of mid-way withdrawals of project. On the other hand, better planning
would certainly have lead to successful commercial exploitation of Sikkim’s huge hydro-electrical potential because
the rising demand of the eastern part of the State has still to be met. In fact, micro-hydel projects arising from a
networking of smaller tributaries, will also add to better tapping of the existing potential.
A comprehensive State-level hydel power policy would encourage private investments in this sector. This would
be in line with the new power policy of the Government of India (Box 5.5).
Box 5.5—The power sector: Attracting investment resources
Power sector reform will help the State Government in garnering both internal and external investmentresources. The new power policy recently announced by the Government of India aims at attracting privatepartnerships by focusing on:
• Introduction of a differential tariff system, which proposes a higher tariff by 25 per cent for generationduring the peak period.
• Normative availability factor reduced from 90 per cent to 65 per cent in the Himalayan region. Introductionof a concept of evaluating geological risks in hydel projects.
• Promotion of joint ventures.
• Projects below 100 MW to be concluded by an MOU, with competitive bidding for larger projects.
• A cess on hydro-electricity to augment resources for the generation of power.
I N F R A S T R U C T U R E F O R D E V E L O P M E N T • 81

Restructuring the state monopoly
For a long time, power generation and its supply remained a State monopoly both at the national and State levels.
Respective governments owned, operated and regulated the power entities. This resulted in overlapping and
somewhat undemarcated responsibilities with lack of accountability in terms of sector entities, operational
performance and service standards and codes. The performance of utilities has remained inadequate. More
significantly, most of the power generating units remained highly dependent on the subsidized inputs provided
by the State.
The power distributing units lacked commercial independence and suffered from an ill defined corporate
structure. Low tariff rates, low collections and high system losses, compounded by a declining level of public
investment, made these units sick.
As a result, the revenue-expenditure gap comes out to be a staggering amount of Rs 611.7 million for the
19-year period of 1979–98 in Sikkim,. The gross operating deficit (i.e. Revenue Receipt–Revenue Expenditure) for
the year 1998–9 alone was Rs. 131.7 million. This is so despite the fact that the revenue receipts have recorded a
marginally higher annual growth rate of 35.32 percent as against the non-plan expenditure growth of 33.87 percent
during the same period. This can be improved only if there is a drastic upward revision in the tariff and effective
utilization of plant through improvement in Plant Load Factor (PLF), particularly during non-peak hours. The
level of PLF is a dismal 30–40 percent in the State.
Restructuring of State Electricity Boards, which started with Orissa, has now been followed by many other
States. Sikkim has also set up a cabinet sub-committee headed by the power minister to restructure the power
sector-aimed at making the State Electricity Board (SEB) operations efficient and financially viable. People are
willing to pay a higher tariff, provided the current situation of heavy load shedding is drastically reduced.
The privatization of the power sector is likely to trigger off a major controversy on the issue of loss to the
State exchequer caused by protracted subsidies given by the State to various categories of activities and groups.
The setting up of Power Finance Corporation (PFC) and its decision to spread its portfolio of investments to
Independent Power Producers is a welcome sign for a cash starved but highly potential State l ike Sikkim. The PFC
seeks to support private power projects through rupee and foreign currency term lending, as well as offer guarantee
services.
Strategy and Emerging Challenges
The restructuring of power sector is therefore, necessary to:
• Attract private and foreign investment in the harnessing of water resources.
• Allocate a greater role for the private sector and restructure utilities as corporate, commercial entities so that
they can function with managerial autonomy.
• Broaden the financial base by enabling the utilities to issue equity and bonds and raise long term borrowings
from the capital markets based on their financial performance.
• Separate the roles of owning, managing and regulating.
• Improve operational performance in terms of heat rates, plant factors, system losses and collections.
• Aggressively pursue demand side management (Asian Development Bank 1994). The terms of the pace and
sequencing for restructuring is crucial to the entire reform process.
Sikkim should aim in the long run at:
• Taking up of larger hydel power stations in the Teesta basin through Independent Power Producers (IPPs) aimed
at long term prosperity of the State and the country at large.
8 2 • S I K K I M H U M A N D E V E L O P M E N T R E P O R T 2 0 0 1

• Efficient management of the Teesta river system together with evacuation and marketing of energy from all the
stages of Teesta cascade.
Sikkim should aim in the short run at:
• Quick implementation of small and mini-micro hydel schemes to attain self sufficiency in power requirement
of the state.
• Extending the 132 kV line from the eastern region to the State for import and export of energy.
• Remodelling and re-strengthening (including the refurbishment) of existing electrical installations at all hier-
archical levels of the operating system by employing the latest technology and scientifically organizing the
distribution system. It is required to install bulk and TOD metres at each transmission and distribution point
for auditing energy and providing tamper-proof electronic meter at the premises of potential consumers.
Clearly, a consensus on the imperatives and modalities of the power sector reform in Sikkim is required in
order for investments and capacity augmentation to be viable. This has to be seen as a part of a package of reform
at the state level, which combines more effectively, the principles of growth and equity. Power sector reform, as
in the case with economic reform measure in general, has to be based on a comprehensive revamping of the State
provisioning of basic services, including the key question of State finance reforms.
State finances
Sikkim is one of the ten Special Category States, which receive Central assistance on preferential conditions owing
to their strategic location and special requirements. Since 1999, it is a member of the North-East Council and as
such its development has been accorded a high priority by the Government of India.
As in the case of other Indian States, the State’s finances are under severe stress, with a debt to Gross State
Domestic Produced (GSDP) ratio of 80.05 per cent in 1999–2000. Clearly, the consequent squeeze has led to a
compression of social sector expenditure. Capital expenditure on social services was only 4.7 per cent in 1999–2000.
In view of this situation, further human development strategies in the state must be undertaken with a view to
strengthening the ‘hard budget constraint’ and greater fiscal responsibility. The twentieth century saw a massive
jump in the State’s revenue mobilization (Box 5.6). It increased from a mere Rs 191,000 in 1910–11 to Rs 26.6
million in 1970–1 (Table 5.9).
Box 5.6—Revenues in Sikkim: Historical context
Till the end of the nineteenth century, in line with most feudal societies, all land in Sikkim belonged to theSirkar (which meant both government and ruler) and, therefore, the State revenue system did not have landas a source. However, the beginning of the twentieth century witnessed a steady increase in the role of landrevenue as a vital source of revenue in the Sikkim State. There are adequate indicators to s how that for manyyears payments to the Sirkar including taxes were made ‘in kind, in quantities and proportions’ that couldnot be determined. This meant that monetization was almost non-existent (Campbell, 1849). John ClaudeWhite, who became the first Political Officer in Sikkim after it fell under British Superintendency in 1887wrote,
chaos reigned everywhere, there was no revenue system, the Maharaja taking what he required as he wantedit from the people, those nearest the capital having to contribute the largest share, while those more remotehad toll taken from them by the local officials in the name of the Raja, though little found its way to him(Coelho, 1971).
I N F R A S T R U C T U R E F O R D E V E L O P M E N T • 8 3

TABLE 5.9—GROWTH OF PUBLIC REVENUES AND EXPENDITURES IN SIKKIM
Year Total Receipts (Rs) % Increase Total Expenditure (Rs) %o Increase
1890 24,686 – 16,652 5
1900–01 61,899 151 1,07,049 543
1910–11 1,91,497 209 1,96,445 84
1920–21 5,15,980 169 4,84,528 147
1930–31 6,26,067 21 6,30,481 30
1940–41 6,34,800 1 6,53,800 4
1950–51 23,41,100 269 20,78,000 218
1960–61 41,30,000 76 41,10,000 98
1970–71 2,66,10,800 544 2,66,63,000 549
Source: J.C. Debnath (1974), p. 147.
The composition of revenue sources also underwent a drastic change—with the earliest sources of revenue
like land, forest and excise gradually giving way to other non-traditional sources like transport, general excise,
bazaar, assessed taxes and printing and stationery (Table 5.10).
One distinctive feature of Sikkim’s overall budget expenditure has been the three-quarter share spent on
developmental activities after the merger of 1975. This is unlike many other comparable States in India. For
example, in Nagaland, during the same period, this proportion never exceeded 65 per cent. Within the develop-
mental expenditure, the share of social services has gone up sharply from about 30 per cent in 1983–4 to 45 per
cent in 1992–3 and 54 per cent in 1998–9 (Table 5.11). This is largely due to the State Government’s increasing
emphasis on minimum needs programme in the social sector—such as food, shelter, drinking water and health
(Lama, 2000).
The British introduced quite a few immediate changes in the revenue assessment and collection system, toinduct a modern budgetary system. This included the introduction of receipts and expenditure sides andmonetization of the budgetary system. The first budget of the State prepared by White in 1889, showed arevenue surplus, with land, forest and excise as the major sources of revenue contributing 67 per cent, 13.5per cent and 7 per cent respectively, of the total revenue mobilized in 1889. The Imperial Gazetteer of Indiaalso mentions the system of land tenure and revenue mobilization towards the beginning of the twentiethcentury. The collection of land revenue then was in the hands of various types of landlords, who numbered71. These landlords were Lamas (13), Kazis (21) and Thikadars (37). The village headman called Mandalactually collected revenue from the ryot (tenant) and paid it to the landlords who in turn paid a fixed amountto the State treasury. The amount was determined at the commencement of his lease (Imperial Gazetteer ofIndia, 1908).
The introduction of elaka leases in 1925, which were issued by the Durbar for a period of 15 years broughtabout a massive change in the revenue collection system. An elaka became a revenue-collecting unit undera Collector. According to the Administrative Report of the Sikkim State, there were 104 elakas in 1929–30and eight categories of Revenue-Collectors.
India’s Independence in 1947, brought winds of modern change to the protectorate of Sikkim and by 1948,the lessee system was abolished and people started paying taxes directly to the government. By 1951, theelakas were also called blocks, which comprised one large hamlet, or two or more small hamlets.
8 4 • S I K K I M H U M A N D E V E L O P M E N T R E P O R T 2 0 0 1

TABLE 5.10—MAJOR REVENUE SOURCES (IN PER CENT) DURING 1910–11 TO 1970–71
Items 1910–11 1920–21 1930–31 1960–61 1970–71
Land 34.4 22.0 27.5 16.2 2.6
Excise 22.7 18.4 17.6 9.9 7.51
Forest 2.4 5.5 5.6 7.9 2.8
Agriculture 9.15 1.6 0.32 2.9 0.3
Household Tax – 4.7 8.87 – –
Sikkim Nationalised Transport – – – 25.0 29.3
Total (Rs million) 0.19 0.52 0.63 4.13 26.61
Source: Computed from the tables as given in J.C. Debnath (1974), pp 151–7.
TABLE 5.11—SIKKIM: COMPOSITION OF EXPENDITURE (1983/84–1998/99) (IN RS MILLION)
1983–84
84–85
85–86
86–87
87–88
88–89
89–90
90–91
91–92
92–93
93–94
94–95
95–96
96–97
97–98
98–99*
1. Social Services 125.9 174.2 222.6 259.8 302.4 421.4 392.2 428.9 529.4 604.3 628.7 686.1 1055.1 1249.2 1530.2 1840.9
2. Economic Services
305.8 344.3 402.8 422.3 398.7 493.8 513.9 556.3 661.7 738.4 818.1 848.8 1098.3 1179.3 1539.2 1552.7
3. Developmental(1+2)
431.7 518.5 625.4 682.1 701.1 915.2 906.1 985.2 1191.1 1342.7 1446.8 1534.9 2153.4 2428.5 3069.4 3393.6
4. Non-Develop-mental
61.1 67.2 150.4 149.9 157.9 216.4 246.6 296.3 401.9 454.6 553.2 615.7 665.9 876.0 994.3 1136.9
5. Total Expenditure
492.8 585.7 775.8 832.0 859.0 1131.6 1152.7 1281.5 1593.0 1797.3 2000.0 2150.6 2819.3 3304.5 4063.7 4530.5
6. (3) as % of (5) 87.6 88.5 80.6 82.0 81.6 80.8 78.6 76.8 74.8 74.71 72.34 71.37 76.38 73.49 75.53 74.91
With increasing domestic resource mobilization in Sikkim, the proportion of central grants fell from 77.3 per
cent in 1983–4 to 58 per cent in 1997–8. This was in spite of a rise in absolute terms (Table 5.12). On the other
hand, this absolute increase is effectively diluted by the high rate of inflation. If this trend continues, then by the
next decade the Centre’s grant contribution to Sikkim’s total annual revenue would be just about 40 per cent,
while the remaining 60 per cent of the revenue would come through domestic resource mobilization.
TABLE 5.12—COMPOSITION OF REVENUE (1983–84 TO 1998–99) (RS MILLION)
1983–84
84–85
85–86
86–87
87–88
88–89
89–90
90–91
91–92
92–93
93–94
94–95
95–96
96–97
97–98
98–99*
Tax Revenue
1. Revenue from State Taxes
37.7 50.0 57.1 59.9 76.2 106.6 117.2 113.2 92.7 116.2 127.7 144.2 207.2 217.0 260.1 292.5
2. Share in Cen-tral Taxes
11.3 23.3 127.4 154.9 167.0 236.1 211.8 251.8 298.9 407.1 397.6 435.2 516.6 815.5 923.2 1043.7
3. Total (1+2) 49.0 73.3 184.5 214.8 239.6 342.7 329.0 365.0 491.6 523.3 525.3 579.4 723.8 1032.5 1183.3 1336.2
Non-Tax Revenue
4. Grants from Centre
433.2 592.4 623.7 777.1 767.8 923.1 808.2 963.3 1228.3 1260.7 1482.6 1761.1 2421.0 2250.0 2946.2 2427.8
(continued)
I N F R A S T R U C T U R E F O R D E V E L O P M E N T • 8 5

1983–84
84–85
85–86
86–87
87–88
88–89
89–90
90–91
91–92
92–93
93–94
94–95
95–96
96–97
97–98
98–99*
5. Other Non-tax Revenue
78.6 106.8 108.1 121.9 131.8 228.9 205.4 266.9 267.1 309.2 285.3 294.7 626.7 829.3 931.7 1026.4
6. Total 511.8 699.2 731.8 899.0 899.6 1152.0 1013.6 1230.2 1495.4 1569.9 1767.9 2055.8 3047.7 3079.3 3877.9 3454.2
7. Grand Total Revenue
650.8 772.5 916.3 1113.8 1139.2 1494.7 1342.6 1595.2 1887.0 2093.2 2293.2 2635.2 3771.5 4111.8 5061.2 4790.4
8. (3) as % of (7) 8.7 9.5 20.1 19.3 21.0 22.9 24.5 22.9 20.8 25 22.9 22.0 19.2 25.1 23.4 28.0
9. (4) as % of (7) 77.3 76.7 68.1 69.7 67.4 61.8 60.2 60.4 65.1 60.22 64.7 66.8 64.2 54.7 58.2 50.6
Source: Reserve Bank of India, Report on Currency and Finance, Vol. II, Statistical Statements, Bombay, Various Issues.
Banking system
Sikkim has a fairly well entrenched and extensive banking system. Most of the banks in Sikkim came into existence
in the post-merger period. There has been an almost seven-fold jump in the deposits in the State Bank of Sikkim
from Rs 65.7 million in 1975 to Rs 437 million in 1998.
Most bank loans have covered the sectors of agriculture and animal husbandry, house construction, retail
trade, and registered government contractors and suppliers. The potential sectors of dairy, floriculture, forestry
farming, tourism and micro-hydel projects have not however, attracted much loan disbursements.
Central institutions like the Small Industries Development Bank of India and the National Bank for Agriculture
and Rural Development have also been active in Sikkim.
Loan default has been a nagging point in the banking operation in Sikkim. This is both because bad repayment
culture and an increasing number of willful defaulters. Though the Bank could not provide exact information and
data on defaulters, the extent of defaults can be assessed by the fact that in 1993–4, Rs 4.3 million of agriculture
and animal husbandry loans to marginal farmers by the State Bank of Sikkim were written off. In the case of Small
Industries Development Bank of India (SIDBI), all the PLIs are making timely repayment of the refinanced loans.
The recovery position of bank dues is not satisfactory at all as it ranged from around 33.5 per cent of the
demand in 1998. The detailed district-wise recovery position during the last 3 years is indicated below. The East
district has had a much better recovery rate than other districts. The West district has the highest default rate.
With no institutional promotion of savings in Sikkim, and because of the traditionally low savings culture among
the people, the level of savings has been far lower than even the north-eastern States (Table 5.13). And since the
extent of gross domestic savings is not known, it is difficult to determine the savings rate in the State. In the absence
of savings and investment rate it is also difficult to find out the exact volume of resource gap in Sikkim.
TABLE 5.13—SMALL SAVINGS COLLECTIONS IN HILL STATES (RS MILLION)
States/Years Target Gross Collection Net Collection
Arunachal Pradesh
1993–94 25 72 25
1996–97 50 110 46
1997–98 50 168 105
Manipur
1993–94 30 115 58
(Table 5.12 continued)
(continued)
8 6 • S I K K I M H U M A N D E V E L O P M E N T R E P O R T 2 0 0 1

States/Years Target Gross Collection Net Collection
Manipur (continued)
1996–97 150 266 144
1997–98 150 301 101
Meghalaya
1993–94 200 337 94
1996–97 200 374 174
1997–98 200 504 10
Nagaland
1993–94 20 72 80
1996–97 30 135 74
1997–98 50 154 25
Sikkim
1993–94 15 45 9
1996–97 60 73 39
1997–98 50 113 77
Source: Reserve Bank of India (1996–97), Report on Currency and Finance, Bombay, Vol. I, p. xi–28.
As in the rest of the country, Sikkim has been going through a package of subsidized schemes to help the deprived
sections in attaining basic needs of life—like education, health, food security, housing, income generation, etc. Since
subsidies cannot be unlimited, especially due to emerging resource crunch, it is important to ensure that the
beneficiaries to be targeted are identified and assisted accordingly, so that both Central and State subsidies are put to
optimal use.
Due to a massive increase in developmental activities after the merger in 1975, coupled with Sikkim’s low
accumulation rate, the State has had to go in for massive borrowings. Besides the internal debt of Rs 204.5 million
in 1997–8, the total outstanding debt of the State Government to the Central Government and other financial
institutions had already exceeded Rs 6 billion by 1999. Within this, the institutional loans constituted over 60
per cent of the total loans. And in the case of Central loans, block loans alone have constituted a high 65 per cent
followed by 19 per cent of small savings loans (Table 5.14).
TABLE 5.14—SIKKIM: DEBT POSITION BASED ON EXISTING BORROWING RATES AND REPAYMENT SCHEDULE
(RS MILLION)
Outstanding as on 31st March Central Loans Institutional Loans Grand Total
1997 1,474.9 1,789.0 3,263.91998 1,702.8 2,046.8 3,749.61999 1,938.1 4,281.5 6219.62000 2,231.4 5,703.2 7,934.72001 2,435.9 6,743.1 9,179.02002 2,752.5 8,064.5 10,817.02003 3,119.7 9,422.1 12,541.82004 3,546.9 10,874.4 14,421.22005 4,044.6 12,527.1 16,571.7
Source: Government of Sikkim (1998), p. 18, Memorandum Submitted to the Eleventh Finance Commission, Vol. I, View of the State Government, Finance Department, Gangtok.
(Table 5.13 continued)
I N F R A S T R U C T U R E F O R D E V E L O P M E N T • 8 7

This projection of outstanding loans for the years upto 2005 has been made on the basis of current rates of
borrowing programme and existing repayment schedule. Though the rate of borrowing will increase or decline
depending on the State Government’s initiatives, Sikkim will have an outstanding loan of Rs 16.6 billion within
the next five years. Given the extent and capacity of resource mobilization in the State, its total interest payments
on various loans has already reached an alarmingly high figure of over Rs 400 million per annum. The interest
payment has already far exceeded the State’s tax revenue (Table 5.15).
TABLE 5.15—DEBT SERVICING IN SIKKIM
YearInterest Paid (Rs million)
Interest payment as% of Tax revenue
Internal debt Loans from theCentral Government
Small Savings,Provident Fund etc.
Total
1993–94 91.1 93.8 32.3 217.2 104
1994–95 114.3 107.1 39.9 261.3 138
1995–96 120.5 124.1 45.3 289.9 106
1996–97 154.9 121.5 53.4 329.8 110
1997–98 168.6 178.0 62.8 409.4 112
Source: Government of Sikkim, Report of the Comptroller and Auditor General of India, 1998.
The Government of Sikkim’s memorandum to the Eleventh Finance Commission mentioned that ‘the State
is gradually coming to that unfortunate stage when the greater part of its borrowing could be spent for its servicing
the debt which may lead to reverse flow of resources’ (Government of Sikkim 1998b).
Thus, in order to tap the potential for growth in developmental activities in Sikkim, there is a need to not
only augment domestic and national resources but also tap external resources, as is already being done in the rest
of the country.
Conclusion
The development of the industrial sector in Sikkim has lagged behind its potential. Urgent measures are required
to step up the rate of investment in power and other forms of infrastructure so as to provide the necessary
conditions to facilitate rapid industrial growth. It is however, necessary to ensure that such growth is not at the
expense of the environment. The fiscal situation in the State needs immediate attention, particularly in the realm
of resource mobilization.
Chapter 6 4
3 Contents
8 8 • S I K K I M H U M A N D E V E L O P M E N T R E P O R T 2 0 0 1

Governance forSustainable
Human Development:The Road Ahead
Governance forSustainable
Human Development:The Road Ahead


Chapter
6��
Governance for Sustainable Human Development:The Road Ahead
Introduction
Sikkim’s achievements since its merger with the Indian Union in 1975, have proved the ‘undiscovered potential’
of the State. Challenges related to human development, in a sustainable growth framework, are now posed.
Building on the unique resources and strength of the State, the State Government wants now to concentrate on
tourism, power generation, education, and the traditional agro-based industries (Chaudhuri Kalyan, 2001).
New approaches to development would undoubtedly face many new challenges. But they need to be overcome.
Also, Sikkim has the advantage of not having to dismantle pre-reforms structure. It is in the happy position of
being able to start off with a relatively clean slate. Therefore, Sikkim will find it easier (than most other States of
the Indian Union) to quickly structure its own model of State-level reforms aiming at human development and
then put it in place.
In Sikkim the 73rd and 74th Constitutional Amendments have been implemented and the new Sikkim
Panchayat Act, 1995, has been enacted. Panchayat elections have been held according to the Act, and permanent
Lok Adalats in all district and sub-divisional headquarters have been set up. For women, 33 percent representation
has been reserved in Panchayats at all levels and a 30 percent reservation in government jobs.
To emphasize a positive mindset in the changed requirements of the administrative scenario, it will be fruitful
to make use of Sikkim’s rich traditional past. The heritage of collective decision-making and dispute resolution by
the communities themselves has been manifested through traditional institutions such as the Dzumsa (Box 6.1).
Box 6.1—The Dzumsa: Continuity amidst change
Dzumsa is the existing traditional village Panchayat which is still in operation as an institution, in twovillages in the North district of Sikkim viz., Lachen and Lachung. There are nearly 50 households under oneDzumsa. They have an elected Zilla Panchayat Samiti representative also. They have two elected heads calledthe senior pipen and junior pipen in a Dzumsa. Unlike other Gram Panchayats, the term for each Dzumsa isonly for one year. There is another elected member called Gyapen, or the secretary.
Election to the Dzumsa is held by elderly persons in the village after a feast is given by the foregoing pipen.The method of election is through popular voting in favour or against the candidature. However, the women,though they have their say in the decision making process and the election of the pipen and Gyapen, theycannot contest the elections (Institute of Social Sciences, 1995).

There is much that Sikkim can offer to the rest of the country as a model State. Religious tolerance and peaceful
living propounded by Lord Buddha, emancipation from untouchability and the dowry system. The zeal of the
people of Sikkim for literacy and education, for both men and women, has been a sound base for human
development. This low gender bias has always been a characteristic of Sikkimese society.
It is 25 years since the young State of Sikkim merged with the Union of India. This process of integration
with the Indian Union has been a unique one, mainly because Sikkim was a Protectorate for a long time before
its merger. The experience of the process of integration of Sikkim calls for some serious introspection as it has
shown on the whole a lack of socio-cultural alienation, political resistance and concomitant problems of adapt-
ability and assimilation as compared to some of the other north-eastern hill States. This is despite the fact that it
had its own socio-cultural and politico-economic systems and a traditional paradigm of development. Historically,
it represented a different political culture than that of mainstream India.
This kind of introspection becomes much more imperative because Sikkim comes close to being a model
State of India in terms of development interventions, social harmony and political stability. What could have been
the reasons? What has been the quintessential process of its integration into the national mainstream? What has
been the quintessential process of its integration into the national mainstream? What should be done to further
strengthen the socio-economic fabric of this frontier State? What are the critical development issues and challenges
this young State has before it? And finally what provides Sikkim with so much resilience and robustness in spite
of being a strategically volatile State? All these need to be addressed seriously and within a proper perspective.
Post-merger Sikkim has consistently followed a policy of indigenous cultural plurality while placing an abiding
faith on an explicitly secular Constitution of India. The vast corpus of Sikkimese culture has been a mature,
complex and explicit phenomenon in its evolution. Many of these rich and diverse bodies of cultural resources
are yet to be reinterpreted. Again it is in Sikkim that traditional mysticism is found to be bound up with a unique
Dzumsas also have customary judicial powers for the trial of cases in their respective villages. Every meetingof the Dzumsa is called by the Gyapen but he does not go door to door to inform the people. He standson a stage located in the centre of the village and makes an announcement loudly. At least, one representativefrom each family has to be present at the meeting. Those who fail to comply are punished monetarily. Inthe past, punishments for smaller crimes, took the form of social boycotts and the criminal was sent out ofthe village.
The development process is initiated by the Dzumsa. In a meeting the pipen calls for an open tender fordevelopment works. The highest bidder gets the work and has to give the total tender amount immediatelyat the meeting. The surplus money is distributed among all the members present. Though, there is provisionfor two pipens in each Dzumsa, at present, there is only one in each. Money for development is provided byRural Development Department. Dzumsa is a powerful body and is trying to adopt and adjust with themodern systems. The dynamic changes that are taking place both at the national and State levels are graduallygetting reflected in the functioning of Dzumsas as well.
The 1982 Panchayat Act protected the traditional tribal culture of both Lachen and Lachung. It recognizedtheir Dzumsa and the annual election of pipens annually. The 73rd amendment has also kept the traditionalDzumsa intact.
It has been noted that women have had little or no role in Dzumsa deliberations. However, the constitutionalprovision of reservation for women in Panchayati Raj Institutions (PRIs) ensures that the role of women inlocal governance is not ignored. On the other hand the Dzumsa has deep roots in Sikkimese culture andsociety. It can therefore be the key vehicle for social mobilization. This village body has in fact the potentialto augment the formal institutions of decentralized governance and make local democracy more effective.
9 0 • S I K K I M H U M A N D E V E L O P M E N T R E P O R T 2 0 0 1

social dynamism. Despite a distinct ethno-centric character and the perpetual presence of local variants in all
spheres of culture, it has always managed to portray itself as a single cultural entity.
But one has to be wary of the compulsions of change that could well trigger off social tensions. This is a
formidable challenge not only to the local political elites but also to all the agents of modernization, both inside
and outside the governmental sector. A satisfactory synthesis should, therefore, take care of the compulsions of
both modernization and constitutional democracy.
Tensions released by the process of modernization in a multi-ethnic society like Sikkim, can be mitigated by
focusing on the process of human development in the State.
In a State like Sikkim, the process of human development can succeed if it is able to absorb some of the
Sikkimese facets of life, ensuring a continuity with its past. This will make the change to modernization less painful
and will perhaps help to keep its plural character intact.
But, while Sikkim’s political development has all the ingredients of a progressive democratic society, its political
institutions are still in a relatively younger stage of development if only because constitutional democracy is less
than three decades old. In the past Sikkim was ruled by a hereditary polity which was more than three centuries
old, backed by a completely feudalistic land based economy. To add to this, Sikkim is landlocked and its exposure
to modernization and democracy has come only after the mass movements of 1973–5 which led to its merger
with India. While in the last 25 years, competent democratic leadership by popular participation has been able
to mobilize greater involvement in the tasks of economic and social development, the newly felt yearnings of
structural reforms provide the appropriate launching pad for an administrative self introspection.
After Sikkim emerged as a constituent State of India, all the basic instruments of development were put into
action. Since the mid-seventies the entire fulcrum of development in Sikkim has undergone a metamorphosis on
social, economic and ecological fronts. Socially, people have become more outward looking, economically, the
quality of life has improved considerably, and ecologically, the State continues to remain relatively a protected
region.
However, planned development has its own adverse effects. But the time has come to now ensure that the
administrative machinery needed to effect structural reforms possesses the needed manpower and professional
expertise. The need for professionally trained managers is crucial for a State like Sikkim, because its manoeuvrability
to adopt varied development strategies is extremely narrow.
There is need for a think-tank for planning and development at the State level. Such an important task should
be supplemented by a continuous dialogue with local communities when project formulation at the field level is
being attempted. In this way acceptability of both sectoral reforms as well as modernization will remain ever
present amongst the people, ensuring the smooth passage of the implementation of each project. In fact this will
mean giving effect to the policy of aaphno gaon aaphai banao meaning ‘build your village yourself. The State
Government is also actively seeking partnership with the private sector and the NGOs which will strengthen the
confidence of the investors.
The major focus on action plan, concepts of ‘community project’ and ‘community labour’ will give speed and
impetus to the necessities of structural reforms by achieving all round popular mandate. This will help in re-defining
the path of progress to improve the quality of life in the State.
G O V E R N A N C E F O R S U S T A I N A B L E H U M A N D E V E L O P M E N T
Annexure–Tables 4
3 Contents
• 91

Annexure–Tables
TABLE A1—INDIA AND THE NORTH-EAST
Total population Sex ratio(females/
1000 males)
Density(per
sq. km)
Literacy rate (%)
Persons Males Females Persons Males Females
India 1,027,015,247 531,277,078 495,738,169 933 324 65.38 75.85 54.16
Arunachal Pradesh 1,091,117 573,951 517,166 901 13 54.74 64.07 44.24
Assam 26,638,407 13,787,799 12,850,608 932 340 64.28 71.93 56.03
Manipur 2,388,634 1,207,338 1,181,296 978 107 68.87 77.87 59.70
Meghalaya 2,306,069 1,167,840 1,138,229 975 103 63.31 66.14 60.41
Mizoram 891,058 459,738 431,275 938 42 88.49 90.69 86.13
Nagaland 1,988,636 1,041,686 946,950 909 120 67.11 71.77 61.92
Sikkim 540,493 288,217 252,276 875 76 69.68 76.73 61.46
Tripura 3,191,168 1,636,138 1,555,030 950 304 73.66 81.47 65.41
Source: Registrar General of India (2001), Provisional population totals, Census of India, 2001, Paper-1 of 2001.
TABLE A2-DECENNIAL CHANGE OF POPULATION AT DISTRICT LEVEL (1971–91)
District Population Absolute increase Percentile increase Annual growth rate
North
1971 13,014 – – –
1981 26,455 13,441 103.28 7.35
1991 31,240 4,785 18.09 1.68
East
1971 85,621 – – –
1981 138,762 53,141 62.07 4.95
1991 178,452 39,690 28.60 2.55
South
1971 53,185 – – –
1981 75,976 22,791 42.85 3.63
1991 98,602 22,628 29.78 2.64
West
1971 58,023 – – –
1981 75,192 17,169 29.59 2.63
1991 98,161 22,969 30.55 2.70
Sources: (a) Registrar General of India (1981) Census of India, 1981, Series 19, Sikkim Part III, A & B, Government of India. (b) Registrar General of India (1991) Census of India, 1991, Series 22, Sikkim Part XII-A & B District Census Handbook,
Government of India.

TABLE A3–POPULATION AND NUMBER OF HOUSEHOLDS (1991)
District Total/Rural/Urban Persons Population Number ofhouseholds
Males Females
Sikkim Total 406,457 216,427 190,030 76,329
Rural 369,451 195,277 174,174 69,213
Urban 37,006 21,150 15,856 7,116
North District Total 31,240 17,090 14,150 6,658
Rural 30,437 16,582 13,855 6,489
Urban 803 508 295 169
East District Total 178,452 95,986 82,466 34,241
Rural 146,580 77,862 68,718 28,085
Urban 31,872 18,124 13,748 6,156
South District Total 98,604 52,105 46,499 17,924
Rural 96,035 50,588 45,447 17,441
Urban 2,569 1,517 1,052 483
West District Total 98,161 51,246 46,915 17,506
Rural 96,399 50,245 46,154 17,198
Urban 1,762 1,001 761 308
Source: Registrar General of India (1991), Sikkim State District Profile, 1991, Census of India, Government of India.
TABLE A4—AREA, NUMBER OF TAHSILS, TOWNS AND VILLAGES (1991)
District Total area(in sq. km)
Number ofSub-divisions
Number of towns Total Inhabited Uninhabited
Sikkim 7,096 8 8 453 447 6
North District 4,226 2 1 53 53 –
East District 954 2 3 134 130 4
South District 750 2 2 145 144 1
West District 1,166 2 2 121 120 1
Source: Registrar General of India (1991), Sikkim State District Profile, 1991, Census of India, 1991, Government of India.
9 4 • S I K K I M H U M A N D E V E L O P M E N T R E P O R T 2 0 0 1

TABLE A5–DISTRIBUTION OF POPULATION BY AGE AND SEX (1991)
Total/Rural/Urban
Sex Total population(in ’000s)
% population in the age group
0–4 5–9 10–14 15–44 45–59 60–79 80+
Total Persons 406 12.6 13.5 13.0 46.1 8.8 4.1 0.4
Males 216 12.1 12.7 12.5 46.6 9.9 4.5 0.4
Females 190 13.3 14.5 13.6 45.6 7.6 3.8 0.4
Rural Persons 369 13.0 13.8 13.1 45.2 8.9 4.3 0.4
Males 195 12.5 13.0 12.7 45.4 10.0 4.7 0.4
Females 174 13.5 14.7 13.6 45.0 7.7 3.9 0.4
Urban Persons 37 9.4 10.9 12.1 55.3 7.7 2.7 0.3
Males 21 8.6 9.7 11.2 57.2 8.7 2.8 0.3
Females 16 10.5 12.6 13.2 52.7 6.4 2.7 0.3
Source: Registrar General of India (1991), Sikkim State District Profile, 1991, Census of India, 1991, Government of India.
TABLE A6—IN-MIGRANTS TO SIKKIM BY PLACE OF BIRTH AND PLACE OF LAST RESIDENCE (1971–91)
By birth place % share By last residence % share Total population
1971 21,055 (10.03) 20,975 (10.00) 209,843
Male 12,967 ((61.59)) 12,908 ((61.54))
Female 8,088 ((38.41)) 8,067 ((38.46))
1981 58,868 (18.61) 49,230 (15.56) 316,385
Male 36,216 ((61.52)) 29,972 ((60.88))
Female 22,652 ((38.48)) 19,258 ((39.12))
1991 71,044 (12.58) 36,406 (8.96) 406,457
Male 38,181 ((56.90)) 20,709 ((56.88))
Female 32,863 ((43.10)) 15,697 ((43.12))
Note: Data within single parentheses indicate percentage of total population and within double parentheses indicate percentage share of male and female within that particular category’s total.
Source: Compiled from various census documents.
A N N E X U R E – T A B L E S • 9 5

TABLE A7—INFANT AND CHILD MORTALITY (INDIA AND THE NORTH-EAST)
Neonatal mortality Postneonatal mortality Infant mortality Child mortality Under-five mortality
India 43.4 24.2 67.6 29.3 94.9
Arunachal Pradesh 41.8 21.3 63.1 37.4 98.1
Assam 44.6 24.9 69.5 21.4 89.5
Manipur 18.6 18.4 37.0 19.9 56.1
Meghalaya 50.7 38.3 89.0 36.2 122.0
Mizoram 18.8 18.2 37.0 18.4 54.7
Nagaland 20.1 22.0 42.1 22.7 63.8
Sikkim 26.3 17.6 43.9 28.4 71.0
Note: Neonatal, postneonatal, infant and under-five mortality rates for the past five year period preceding the survey by State, India, 1998–9.
Source: International Institute for Population Sciences, Mumbai, India (2000), India: National Family Health Survey (NFHS-2), 1998–9.
TABLE A8-NUTRITIONAL STATUS OF EVER-MARRIED WOMEN (INDIA AND THE NORTH-FAST)
HeightMean bodymass index
(BMI)
Weight-for-height
MeanHeight(cm)
Percentagebelow
145 cm
Percentagewith BMI below18.5 kg/m sq.
Percentagewith BMI of
25.0 kg/m sq.
Percentagewith BMI of
30.0 kg/m sq.
India 151.2 13.2 20.3 35.8 10.6 2.2
Arunachal Pradesh 150.8 11.9 21.0 10.7 5.1 0.6
Assam 149.9 17.3 20.1 27.1 4.2 0.7
Manipur 151.5 10.3 21.1 18.8 10.8 1.2
Meghalaya 150.6 21.1 20.3 25.8 5.8 1.2
Mizoram 151.6 10.7 20.4 22.6 5.3 0.5
Nagaland 151.6 10.6 20.9 18.4 8.2 0.7
Note: Excludes women who are pregnant and women with a birth in the preceding two months. The body mass index (BMI) is the ratio of toe weight in kilograms to the square of the height in metres (m sq.).
Source: International Institute for Population Sciences, Mumbai, India (2000), India: National Family Health Survey (NFHS-2). 1998–9.
9 6 • S I K K I M H U M A N D E V E L O P M E N T R E P O R T 2 0 0 1

TABLE A9-ANAEMIA AMONG EVER-MARRIED WOMEN (INDIA AND THE NORTH-EAST)
Percentage of womenwith any anaemia
Percentage of women with:
Mild Anaemia Moderate Anaemia Severe Anaemia
India 51.8 35.0 14.8 1.9
Arunachal Pradesh 62.5 50.6 11.3 0.6
Assam 69.7 43.2 25.6 0.9
Manipur 28.9 21.7 6.3 0.8
Meghalaya 63.3 33.4 27.5 2.4
Mizoram 48.0 35.2 12.1 0.7
Nagaland 38.4 27.8 9.6 1.0
Sikkim 61.1 37.3 21.4 2.4
Note: The haemoglobin levels are adjusted for altitude of the enumeration area and for smoking when calculating the degree of anaemia.
Source: International Institute for Population Sciences, Mumbai, India (2000), India: National Family Health Survey (NFHS-2), 1998–9.
TABLE A10—MATERNAL CARE INDICATORS (INDIA AND THE NORTH-EAST)
Percentage whoreceived all recommendedtype of antenatalcare
Percentage ofbirths delivered ina medical institution
Percentage ofdeliveries assistedby a health professional
Percentage of non-institutional deliveries with apostpartum check-up within twomonths of birth
Percentage of non-institutional deliveries with apostpartum check-up within twodays of birth
India 20.0 33.6 42.3 16.5 2.3
Arunachal Pradesh 17.3 31.2 31.9 10.5 0.3
Assam 15.8 17.6 21.4 25.5 0.5
Manipur 18.3 34.5 53.9 27.1 1.4
Meghalaya 10.4 17.3 20.6 20.8 0.0
Mizoram 13.5 57.7 67.5 20.9 0.9
Nagaland 8.9 12.1 32.8 4.3 0.0
Sikkim 15.3 31.5 35.1 38.0 0.7
Note: Table includes only the two most recent births during the three years preceding the survey. (i) Three or more antenatal check-ups (with the first check-up within the first trimester of pregnancy), two or more tetanus toxoid injections and iron and folic acid tablets or syrup for three or more months. (ii) Doctors, auxiliary nurse midwife, nurse, midwife, lady health visitor, or other health professional. (iii) Based on births in the 2–35 months preceding the survey.
Source: International Institute for Population Sciences, Mumbai, India (2000), India: National Family Health Survey (NFHS-2), 1998–9.
A N N E X U R E – T A B L E S • 9 7

TABLE A11—HOUSING CHARACTERISTICS (INDIA AND THE NORTH-EAST)
Percentage of households:
Withelectricity
With drinkingwater that ispiped or froma hand pump
With a toiletor latrinefacility
Usingbiomass fuelfor cooking
Living in apucca house
Mean numberof personsper room
India 60.1 77.9 35.9 71.7 32.0 2.7
Arunachal Pradesh 68.9 80.7 73.0 80.8 14.2 2.2
Assam 26.4 60.1 63.0 87.1 10.9 2.1
Manipur 75.3 48.9 92.0 69.2 7.1 2.1
Meghalaya 41.2 42.1 52.0 83.5 14.5 2.0
Mizoram 84.1 63.2 97.7 57.4 16.2 2.6
Nagaland 56.3 40.5 74.3 86.1 18.1 1.6
Sikkim 80.7 84.6 72.7 63.2 50.6 2.0
Source: International Institute for Population Sciences, Mumbai, India (2000), India: National Family Health Survey (NFHS-2), 1998–9
Technical Note 4
3 Contents
9 8 • S I K K I M H U M A N D E V E L O P M E N T R E P O R T 2 0 0 1

Technical Note
The Human Development Index (HDI)
Though the concept of human development is much broader than its indices, the Human Development Index
(HDI) is now widely used as a measure of development. It is difficult to design a comprehensive measure or even
a comprehensive set of indicators involving all the strategic aspects of human development-mainly because many
vital dimensions of human development are non-quantifiable. Again though HDI is not a substitute for the fuller
treatment of the richness of the concerns of the human development perspective, it is considered to be a simple
composite measure ’that can draw the attention to the issues quite effectively.
The Human Development Index is a composite index comprising levels of human development in three basic
dimensions viz., education, longevity and health. This index is a measure of how far a State/country has travelled,
from a minimum level of achievement and also indicates the path still to travel. It measures overall progress in
a State/country in achieving human development. Within HDI, another index popularly known as the Human
Poverty Index (HPI) reflects the distribution of progress and measures the backlog of deprivations that still exists.
The HPI measures deprivation in the same dimensions of basic human development as the HDI.
The construction of the HDI has passed through several rounds of revisions. The Human Development Index
represents the status of deprivation of a country/region in three dimensions of human developmentlongevity of
a healthy life (measured by life expectancy at birth), education (represented by linear. combination of literary rate
and average enrolment ratio) and adjusted income (represented by per capita income adjusted to Atkinson’s
formula for the utility of income). Using information on these dimensions of human development, three separate
sub-indices are estimated for the construction of HDI. These sub-indices are: i) Life Expectancy Index, ii) Educa-
tional Attainment Index, and iii) Income Index. For the estimation of educational attainment index, two variants
of education are used, namely, adult literacy and mean years of schooling.
Due to lack of information on mean years of schooling in many countries, the indicator is replaced by average
enrolment ratios of primary, secondary and tertiary education. The index of income is estimated by taking the
adjusted level of per capita income difference of a country from an ideally fixed level of income. In the present study
we have taken slightly different variables for the estimation of HDI mainly due to severe data constraint. We have
taken literacy rate, gross enrolment ratios for primary, secondary and higher secondary classes. The enrolment ratio
in tertiary education is not taken in the analysis because higher education is virtually non-existent in Sikkim.
In the first three Human Development Reports produced by the UNDP, the HDI has been represented as an
index of attainment. In the subsequent reports, however, HDI has been taken as an indicator of deprivation. The
index is used for inter-country comparison by ranking the countries based on their relative HDI score. The absolute
value of the index for a country has as such no meaning.
Since 1993, minimum and maximum values are set for all the three sub-indicators of the HDI. These values
are mostly ideal goals representing most extreme values observed during the last few decades, or expected in the
next few decades. In the 1994 HDR (UNDP), two broad changes have been made in the estimation of HDI. Firstly,

mean years of schooling is replaced by average enrolment ratios of primary, secondary and tertiary education, and
secondly, the minimum value of income per capita is reduced to half (PPP$ 100) to make Gender-related
Development Index (GDI) comparable with HDI.
The 1997-HDR (UNDP) has set maximum and minimum limits for some of the indicators used for the
estimation of HDI. They are:
Life expectancy at birth: Minimum 25 and Maximum 85
Adult literacy rate: Minimum 0 and Maximum 100
Enrolment ratio: Minimum 0 and Maximum 100
Per capita income: Minimum PPP $ 100 and Maximum PPP $ 40,000
Adjusted per capita: Minimum PPP $ 100 and Maximum PPP $ 6,154
For the estimation of per capita income, the 1997 Report used a different technique to reduce the level of
disparity among countries. It is assumed in economic theory that utility of income declines as the level of income
increases. Or in other words, the theorem of diminishing marginal utility applies to income too. Based on the
underlying philosophy of the law of diminishing utility applicable to income, Atkinson’s formula for the utility
of income is used to reduce absolute income gaps between countries.
The formula assumes that after a threshold level of income, the magnitude of utility of income declines at a
diminishing rate. The average world income in 1994 is as the threshold level (y*) (i.e., PPP $ 5,990) (HDR, UNDP
1996). Any income higher than the threshold level is subject to discount using Atkinson’s formula. Atkinson’s
formula for the utility of income:
w(y) = y* for O < y < y* where y is the actual income of a country
If income of a country/region is less than the threshold level, the income is not likely to be discounted. The
discount of income is applied where y > y*. The generalized form of the income discount function is as follows:
kn
W(y) = y*+ ∑ (y – y)1/k for (n – 1)y* ≤ y ≤ ny*
k=2
Where y is marginally higher (less than y*) than k-times of y* For different levels of income, the formula
may be:
W(y) = y* + 2[(y – y)*1/2 ] for y* ≤ y ≤ 2y* = y*+ 2(y*)1/2+ 3[(2y – y*)1/3] for 2y* ≤ y ≤ 3y*
Using Atkinson’s utility function of income, the discounted value of PPP $ 40,000 is calculated as:
W(y) = y*+ 2(y*)1/2 + 3(y*)1/3 + 4(y*)1/4 + 5(y*)1/5 + 6(y*)1/6 + 7(y*)1/7 + 8(40,000 – 7y*)1/8
= PPP$6311, where y* = 5990
Since y* is defined as PPP$ 5990, the income of PPP $ 40,000 is falling between 7y* and 8y*. Therefore, the
discounted value of PPP $ 40,000 is equal to PPP $ 6311. By changing the threshold value (world per capita
income PPP), the discounted value of PPP $ 40,000 can be re-estimated from time to time. In this study the world
per capita for the year 1995, has been taken for the analysis.
The HDI is calculated by taking the average value of Income Index, Educational Attainment Index and Life
Expectancy Index. The Human Development Index (H) for the jth region can be expressed as:
3
Hj = 1/3 ∑ hij
i = 1
10 0 • S I K K I M H U M A N D E V E L O P M E N T R E P O R T 2 0 0 1

Where hij = [Xij – min (Xik)] / [(max (Xik) – min (X – k)]
k k k
is the contribution of Ith variable to the Human Development Index for the jth country/region.
The main sub-indices of HDI are estimated as follows:
Life Expectancy Index (LEI)
LEIj = [Actual (LEBj) – min (Target LEB)] / [max(Target LEB) – min(Target LEB)
Where LEB = life expectancy at birth1
Educational Attainment Index (EAI)
This index has two components. They are: Literary Index (LRI) and Enrolment Index (ERI)
Literacy Index (LRI)
LRIj = [Actual (LR); – min(Target LR)] / [max(Target LR) / (Target LR)]
Enrolment Index (ERI)
The estimation of FRI is made in the following steps.
Step I: Calculation of Average Enrolment Ratio is estimated by adding Enrolment Ratio at the primary school,
secondary school and higher secondary school, using different weights. The weights are taken on the basis of
importance of the level of education (since gross enrolment ratios are used in the present analysis). We have given
10% weight to primaiy, 40% to secondary and 50% to higher secondary enrolment ratios.
Average Enrolment Ratio (AER) = ∑ WiERI (i – 1, i – 2, i – 3)
Where ER stands for Enrolment Ratio, i for levels of education and W for weight.
Step II: Calculation of Enrolment Index
ERIj = [Actual (AER)j – min(Target ER)] / [max(Target ER) – min(Target ER)]
Using LRI and ERI, the Educational Attainment Index (EAI) is calculated as:
EAIj = 1/3[2(LRIj) + (ERIj)]
Income Index (PCYI)
Income Indexj = [Actual PCY – min(Target PCY)] / [max(Target PCY) – min(Target PCY)]
HDI can be estimated by taking the average scores of the above three sub-indices.
HDIj = (LEIj + EAIj + PCYIj)/3
Gender-related Development Index (GDI)
The Gender Development Index was first reported in 1995 HDI (UNDP). The theoretical justification and
mathematical derivations of the index is presented in the technical notes of the same report. For the estimation
1. Direct estimates of state level LEB are available from the Sample Registration System (SRS) bulletins. However, due to the inadequaciesof birth and death registration reporting at village/ward level under the Civil Registration System (CRS), direct estimation of districtLEB is not feasible. Indirect estimates have to rely upon variables that make LEB calculation either a linear transform of age-specificmortality (using 1 minus to convert a negative indicator of deprivation into a positive indicator) or a transform of socio-economicvariables. The latter technique is lawed as it places interdependent variables on both sides of the equation. The calculation of LEB,therefore, is fraught with difficulties. More robust calculation of LEB would require significant efforts to improve the CRS.
T E C H N I C A L N O T E • 101

of the index, some indices are used similar to HDI, but separate indicators are used for male and female separately.
The index is estimated in two steps. In the first step, equally distributed indices of i) life expectancy, ii) educational
attainment and iii) income, are estimated. In the second step, average value of these three indices are -estimated
to arrive at the Gender Development Index. Mathematically, GDI for the j-th country may be expressed as:
GDIj = (1/3(Pf.XfkI − E – E + Pm.XmkI – E)]1/I – E for the pair k = 1, 2 and 3.
Where Pf is the proportion of female population, Pm is the proportion of male population, Xfk is female
achievement and Xmk is male aversion to equality. The higher the value of ’aversion to inequality’ or social
preference for equality (E), higher would be the discounting rate for male achievement. The HDR proposes a
moderate value of E = 2, the harmonic mean of female and male achievements. This is calculated by taking the
reciprocal of the population-weighted arithmetic mean of male and female achievement.
Target Variables Minimum Maximum
Life Expectancy at Birth
Male 22.5 82.5
Female 27.5 87.5
Literacy Rate
Male 0 100
Female 0 100
Enrolment Ratio
Male 0 100
Female 0 100
It may by mentioned that other indices of the HDI family are not estimated at present due to data constraint
at the State/district level.
Sikkim: Fact Sheet 4
3 Contents
10 2 • S I K K I M H U M A N D E V E L O P M E N T R E P O R T 2 0 0 1

Sikkim: Fact Sheet
Area 7,096 sq km (0.22% of the total geographical area of India)
Districts 4
Subdivisions 8
Land distribution (%)
Operational holding 16
Trees and groves 42
Barren land 22
Permanent pastures and grazing land 17
Total population in 2001 540,493 (0.05% of the total population of India)
Male 288,217
Female 252,276
Sex ratio in 2001 (Females / 1000 males) 875
Major communities Lepchas, Bhutias and Nepalese
Urban population in 1991 (%) 9.1
Birth rate in 1997, per ‘000 19.8
Death rate in 1997, per ‘000 6.5
Infant mortality rate 1996–98, per ‘000 51
Scheduled Castes in 1991 (%) 5.93
Scheduled Tribes in 1991 (%) 22
% Below poverty line in 1987–88 34.67
Literacy rate in 2001 (%) 69.68
Male 76.73
Female 61.46
Primary health centres/lakh population 5.05
Primary schools/lakh population 75.90
Domestic product in Rs Crore (1995–96, at current prices)
446
Annual growth rate in % (1995–96, at current prices) 10.39
Per capita income in Rs (1995–96, at current prices) 9,472
Annual growth rate in % (1995–96, at current prices) 6.80
Glossary of Local Terms 4
3 Contents


Glossary of local terms
Adhiya Crop sharing arrangement on a fifty-fifty basis.
Adhiyadar A person engaged to cultivate on condition of rendering half of the produce to the
primary holder.
Anna One-sixteenth part of a Rupee (old) or one one-sixteenth part.
Aul Low lying area. Its opposite is Lek, meaning highland.
Banjo Barren.
Bhikshus Monk who lives on alms. But they should not be confused with beggars. They beg
alms only to inculcate humanity.
Bustivalas A landholder who has been settled with land in rural areas.
Chakureys Agricultural labourer.
Chirkey / foorkey Diseases that affect cardamom bushes.
Chulha Hearth.
Darbar Royal court. Nowadays the word is interpreted as royal abode, which is wrong. The
correct word for royal abode is Rajmahal.
Dai(s) Mid-wife, Nurse.
Dhuri Khajana Household tax. Dhuri literally means ridge of a roof.
Elakas A region or precisely a group of revenue blocks equivalent to a Tehsil.
Gaucharan Grazing land. ‘Gau’ = Cow, Charans = pasture-meaning a pasture land for cattle.
Gompa Monastery
Goor Molasses
Kazis A Persian word, ‘Qazi’, meaning munsif, magistrate or equivalent.
Khasrnahal A community forest land kept for meeting immediate fuel and fodder needs of a
society.
Kutdar A person engaged to cultivate on condition of rendering a stipulated amount of crops
or cash to the primary holder.
Lek Highland or Alpine region.
Mandals Village headmen / Commission agents for revenue collection.

Nazaranas When gift items are given to a king by his subject or a vassal king to an emperor, it is
called ‘Nazarana’. When it flows downward, it is called ‘Baksis’.
Pakhureys A tenant who has to work as a labour in the field of a landowner for a small piece of
land given for his livelihood.
Pachwai In ancient India, the king was entitled for a one-tenth of the produce. In middle ages,
the revenue was made equivalent to one-fifth of the produce—probably it denotes
that. Adha’ means half, ’tihai’ means one-third, ’chauthai’ means one-fourth and
’pachwai’ means one-fifth.
Zamindari Under this system, the lease contractor has to pay a fixed amount of revenue to the
state. The contractor has been interpreted as being the owner of the land under
him, hence the word ‘Zamin’ meaning land.
Abbreviations 4
3 Contents
10 6 • S I K K I M H U M A N D E V E L O P M E N T R E P O R T 2 0 0 1

Abbreviations
BC Backward Classes
BSF Border Security Force
CA Compensatory Afforestation
CBO Community Based Organization
CCRT Centre for Cultural Resource Training
CIEFL Central Institute for English and Foreign Languages
CMRY Chief Minister Rojgar Yojana
CSO Central Statistical Organisation
DAC District Administrative Centre
DIET District Institute of Education and Training
DTC District Tuberculosis Centre
DIC District Industries Centre
EDP Entrepreneurship Development Programme
GCS Galvanized Corrugated Sheet
GSI Geological Survey of India
ICAR Indian Council for Agricultural Research
ICMR Indian Council of Medical Research
IDD Iodine Deficient Disorder
INTACH Indian National Trust for Art and Cultural Heritage
IPI Intestinal Parasitic Infection
IPR Information and Public Relations
IRDP Integrated Rural Development Programme
ISPS Indo-Swiss Project Sikkim
ITI Industrial Training Institute
JFM Joint Forest Management
MLA Member of Legislative Assembly
NABARD National Bank for Agriculture and Rural Development
NBFC Non Banking Financial Companies
NIESBUD National Institute of Engineering and Small Business Development
NSDP Net State Domestic Product
NTPC National Thermal Power Corporation
OPD Out Patient Department
PDS Public Distribution Centre
PGCI Power Grid Corporation of India Limited
PHC Primary Health Centre

PHSC Primary Health Sub-Centre
PLF Plant Load Factor
PTI Press Trust of India
RBI Reserve Bank of India
REDP Rural Entrepreneurship Development Programme
SIDICO Sikkim Industrial Development and Investment Corporation Limited
SIE State Institute of Education
SIMFED Sikkim Marketing Federation
SDP State Domestic Product
References 4
3 Contents
10 8 • S I K K I M H U M A N D E V E L O P M E N T R E P O R T 2 0 0 1

References
Asian Development Bank (1994), ’Bank Policy for the Energy Sector’, Manila, December.
Basnet, L.B. (1974), Sikkim: A Short Political History, S. Chand & Company, New Delhi.
Bhutia, Kunga Gyatso (1995) ’Land Utilisation Statistics of Sikkim: 1995–96’, Department of Agriculture,Government of Sikkim.
Business Today (1998), December 22, 1997–January 6, 1998, Delhi, pp. 87.
—— (2000), December 22, 1999–January 6, 2000, Delhi, pp. 38–55.
Campbell (1849) ’Diary of a journey through Sikkim to the Frontiers of Tibet, Journal of Asiatic Society of Bengal,p. 572.
Central Statistical Organisation (1998), ’Statistical Abstract of India 1998’, Government of India.
Centre for Environmental Law (1999), ’Handbook on Environmental Law and Policy for Sikkim’, World WideFund for Nature, India.
Chaudhuri Kalyan (2001), ‘Thrust on Development’, in Frontline, April 13, pp. 89–90.
——’For Sustainable Growth–Interview with Sikkim Chief Minister Pawan Kumar Charming’, in Frontline, April 13,pp. 93–4.
—— ’Unrivalled Charm’, in Frontline, April 13, pp. 95–7.
Chutani, C.S. and T.R. Gyatso (1993), ’Health Status of Women and Children in Sikkim’, UNICEF, Delhi, 1993,pp. 30.
Coelho, V.H. (1971), Sikkim and Bhutan, Vikas, New Delhi.
Datta, Amal, (1994), ’Ethnicity and Resource Management in Sikkim’ in Mahendra P. Lama (ed.) Sikkim: Society,Polity, Economy and Environment, Indus Publications, New Delhi, (Reprinted in 2000).
Debnath, J.C. (1974), ’Development of the Sikkimese Economy under Planning (1954–71)’. ’Thesis submitted tothe Calcutta University for the D.Phil Degree, 1974, North Bengal University, Darjeeling.
Dhamala, Ranju R., (1985), A Study of Local Self Government and Democratic Decentralization in Sikkim(unpublished Ph.D. thesis), University of North Bengal, Darjeeling.
Down to Earth (1999), ’Beating Retreat’, New Delhi, April 30.
Dubey Amaresh and Shubhashis Gangopadhyay (1998), ’Counting the Poor: Where are the poor in India’,Sarvekshana Analytical Report Number 1, Department of Statistics, Government of India.
EPW Research Foundation, National Accounts Statistics of India: 1950–1 to 1996–7.
Government of Sikkim (2001), ’Sikkim State Annual Plan 2000–2001’, Planning and Development Department,Gangtok.
—— (1999), ’Forestry Development Project’, Department of Forests, Environment and Wildlife, Gangtok, April.
—— (1999b), Annual Report 1996–7 & 1997–8, Power Department, Gangtok.
—— (1998), ’Health Information Bulletin: Sikkim 1998’, Statistical Cell, Department of Health and Family

Welfare, Gangtok. (1998b), Memorandum Submitted to the Eleventh Finance Commission, Vol. 1, View ofthe State Government, Finance Department, Gangtok.
Government of Sikkim (1998c), Annual Report 1997–8, Department of Women and Child Welfare, Cangtok.
—— (1998d), Annual Report 1997–8, Sikkim State Social Welfare Advisory Board, Gangtok.
—— (1998e), White Paper on industrial Development vis-a-vis Status of Sick Industrial Units in Sikkim, Gangtok.
—— (1997), ’Sikkim at a Glance’, Bureau of Economic and Statistics, Planning and Development Department,Gangtok. (19976), ’Sikkim State: Annual Plan 1996–7’, Bureau of Economic and Statistics, Planning andDevelopment Department, Gangtok.
—— (1996), Industrial Policy of Sikkim, Department of Industries, Sikkim Government Gazette, No.COI2(lllj96—97 dated 18.12.96.
(1994), ’Census of Government Employees: 1994’, Bureau of Economic and Statistics, Planning and DevelopmentDepartment, Gangtok.
Gupta, S.P. and Padmasini S. Raman (1993), ’Economic Liberalisation and its Social Impact’ in S.P. Gupta (ed),Liberalisation: Its Impact on the Indian Economy, Macmillan India Limited, Delhi.
Gyatso, T.R. and B.B. Bagdass (1998), ’Health Status in Sikkim’, Department of Health & Family Welfare,Government of Sikkim, Gangtok, pp. 33–4.
Hasnain, Syed Iqbal (1999), Himalayan Glaciers: Hydrology and Hydro Chemistry, Allied, New Delhi-
Imperial Gazetteer of India (1908), New edition, Vol. 22, Oxford University Press, London.
Institute of Social Sciences (1995), ’Sikkim’ in Status of Panchayati Raj in the State of India, Concept, Delhi.
International Institute for Population Sciences (2000), ’National Family Health Survey (NFHS-2)—India 1998–9’,Mumbai
Jangira, N.K., (1977), Educational Change in Sikkim, Sikkim Education Newsletter, Annual Number, Directorate ofEducation, Government of Sikkim, Gangtok.
Kotturan, G., (1983), The Himalayan Gateway, Sterling Publishers, New Delhi, 1983, p. 53.
Lahiri, Ashok K., Saumen Chattopadhyay and Anuradha Bhasin,(2000), ’Sikkim: A Vision Document’, NationalInstitute of Public Finance and Policy, New Delhi.
Lama, Mahendra P., (2001), ’South Asia Growth Quadrangle: Scope and Opportunities in the Energy SectorCooperation’ in Mahendra P. Lama (ed.), South Asian Growth Quadrangle: Emerging Opportunities for EconomicPartnership, Federation of Indian Chambers of Commerce and Industry (FICCI), New Delhi.
—— (2000 reprint), ’Agenda for Sectoral and Resource Management’ in Mahendra P. Lama (ed.) Sikkim: Society,Polity, Economy and Environment, Indus Publications, New Delhi, (Reprinted in 2000).
(1999), ’Energy Cooperation in South Asia: Issues, Challenges and Potentials; South–South Solidarity, Delhi.
Lama, Mandeep (1996), ’Sikkim Express’, Vol. XXI, No.54, 2–5, November.
National Council for Applied Economic Research (1967), Techno-Economic Survey of Sikkim, New Delhi-
Prakasha, Veda, (1976), ’Extending Educational Opportunity in Sikkim, A Report on the State’s School Systemwith special reference to its Administration’, National Staff College for Educational Planners and Adminis-trators, New Delhi.
Pulger, T., B.M. Rai, R. Shankar and Bimal Rai (1992), Iodine Deficiency Disorders in Sikkim: Current Status and FutureStrategy, Thyroid Centre, Government General Hospital, Namchi, South Sikkim.
Registrar General of India (2001), ’Census of India 1991’, Series 22, Sikkim, Part III-B, Series Economic Tables,Directorate of Census Operation.
—— (2001b), ’Census of India 1991’, Series 22, Sikkim, Part X11-A & B, Districts Census Handbook, Directorateof Census Operation.
110 • S I K K I M H U M A N D E V E L O P M E N T R E P O R T 2 0 0 1

Registrar General of India (2001c), Census of India 1991, Series 19, Sikkim XII, Census Atlas, Directorate ofCensus Operation
—— (2001d), ’Provisional Population Totals’, Paper 1 of 2001, New Delhi. (1991), ’Sikkim State District Profile1991’, Census of India, New Delhi.
—— (1991), ’State Profile 1991’, Census of India, New Delhi.
—— Sample Registration System Bulletin, Census, New Delhi, January 1998.
—— Sample Registration System Bulletin, Bi-annual, New Delhi, Oct. 1998.
—— (1989), Regional Divisions of India: A Cartographic Analysis, Occasional Papers, Series-I, Vol. XIX, Sikkim,Census of India, p. 15.
Risley, H.H., (1894) The Gazetteer of Sihhirn, edited in the Bengal Government Secretariat, Calcutta.
Ritchie, I.M., (1977), ’Missionaries and Education in Sikkim’, in Jangira, N.K., Educational Change in Sikkim, SikkimEducation Newsletter, Annual Number, Directorate of Education, Government of Sikkim, Gangtok.
Sankrityana Jeta (1994), ’Development without Shocks–A Himalayan Experience’ in MP Lama(ed) Sikkim: Society,Polity, Economy and Environment, Indus Publications, New Delhi.
Sen, Abhijit (1996), ’Economic Reforms, Employment and Poverty: Trends and Options’, Economic and PoliticalWeekly, Bombay, Special Number, September.
Singh, R.B. and B.W. Pandey (1994), ’Sikkim Himalaya:, Geo-ecological System, Socio-economic Change andPeople’s Perception’ in M.P. Lama (ed) Sikkim: Society, Polity Economy and Environment, Indus Publications,New Delhi.
Sinha, A.C., (1975), ’Politics of Sikkim’, Thomson Press (India), Ltd, Faridabad, pp. 47–8.
United Nations Development Programme (2000), ’Human Development Report’, Oxford University Press, NewYork.
—— (1999), ’Human Development Report’, Oxford University Press, New York.
—— (1998), ’Human Development Report’, Oxford University Press, New York.
—— (1997), ’Human Development Report’, Oxford University Press, New York.
—— (1996), ’Human Development Report’, Oxford University Press, New York.
—— (1995), ’Human Development Report’, Oxford University Press, New York.
—— (1995), The World’s Women 1995: Trends and Statistics’, New York.
—— (1994), ’Human Development Report’, Oxford University Press, New York.
—— (1993), ’Human Development Report’, Oxford University Press, New York.
—— (1992), ’Human Development Report’, Oxford University Press, New York.
—— (1991), ’Human Development Report’, Oxford University Press, New York.
—— (1990), ’Human Development Report’, Oxford University Press, New York.
Waddel, L.A., (1899 first edition), Among the Himalayas, Ratna Pustak Bhandar, Kathmandu, 1978.
World Bank (1999), World Development Report 1999, Oxford University Press, New York.
3 Contents
R E F E R E N C E S • 111