Embed Size (px)
Citation preview

T H I R D A N N U A L R E P O R T A D D E N D U M
HCIA Complex/High-Risk Patient Targeting:
Third Annual Report Addendum
APRIL 7, 2017 PRESENTED TO: Katherine Giuriceo CMMI 7500 Security Boulevard Baltimore, MD 21244
PRESENTED BY: Roy Ahn NORC at the University of Chicago 4350 East-West Hwy, Suite 800 Bethesda, MD 20814 312-759-4068

NORC | HCIA Complex/High-Risk Patient Targeting
ADDENDUM TO THE THIRD ANNUAL REPORT | II
Table of Contents
Executive Summary .................................................................................................................... 1
Introduction and Methods ........................................................................................................ 17Evaluation Design ............................................................................................................... 20
Quantitative Methods (Claims Based Analyses) ................................................................. 22
Qualitative and Survey Methods ......................................................................................... 25
Rapid Cycle Evaluation: Revising Issues of Feasibility and Evaluability ............................ 25
Awardee-Level Analyses: Overview ........................................................................................ 27
California Long-Term Care Education Center ........................................................................ 30
Courage Kenny Rehabilitation Institute .................................................................................. 38
Developmental Disabilities Health Services ........................................................................... 46
Johns Hopkins University Community Health Partnership .................................................. 50
Johns Hopkins University School of Nursing ........................................................................ 76
LifeLong Medical Care .............................................................................................................. 87
Northland Healthcare Alliance ................................................................................................. 93
Palliative Care Consultants of Santa Barbara ........................................................................ 98
Pittsburgh Regional Health Initiative .................................................................................... 105
Providence Portland Medical Center .................................................................................... 115
St. Francis Healthcare Foundation of Hawaii ....................................................................... 139
Sutter Health Corporation ...................................................................................................... 151
University Emergency Medical Services .............................................................................. 157
University of New Mexico ....................................................................................................... 164
University of North Texas ...................................................................................................... 170
TECHNICAL APPENDICES ..................................................................................................... 174
Appendix A: Awardee and Intervention Names and Abbreviations ................................... 175
Appendix B: Definition of Acronyms .................................................................................... 176

NORC | HCIA Complex/High-Risk Patient Targeting
ADDENDUM TO THE THIRD ANNUAL REPORT | III
Appendix C: Methods, Claims-based Analyses ................................................................... 178
Appendix D: Claims-based Analyses: Supporting Exhibits ............................................... 182California Long-Term Care Education Center .................................................................. 185
Courage Kenny Rehabilitation Center .............................................................................. 186
Developmental Disabilities Health System ....................................................................... 188
Johns Hopkins Community Health Partnership ................................................................ 190
Johns Hopkins University School of Nursing .................................................................... 202
LifeLong Medical Care ...................................................................................................... 205
Northland Healthcare Alliance .......................................................................................... 207
Palliative Care Consultants of Santa Barbara .................................................................. 209
Pittsburgh Regional Health Initiative ................................................................................. 210
Providence Portland Medical Center ................................................................................ 213
St. Francis Healthcare Foundation of Hawaii ................................................................... 233
Sutter Health Corporation ................................................................................................. 237
University Emergency Medical Services ........................................................................... 238
University of New Mexico ................................................................................................. 240
University of North Texas ................................................................................................. 242
Appendix E: List of Evaluation Questions ........................................................................... 246

NORC | HCIA Complex/High-Risk Patient Targeting
ADDENDUM TO THE THIRD ANNUAL REPORT | IV
List of Exhibits
Exhibit ES.1: Health Care Innovation Awardees, Complex/High-Risk Patient Targeting ................................................................................................. 2
Exhibit ES.2: Conceptual Framework, Evaluation of the CHRPT Portfolio of HCIA Awardees ................................................................................................ 3
Exhibit ES.3: Cost Effects Associated with HCIA One Interventions, by Awardee ....... 8Exhibit ES.4: Average Quarterly Total Cost of Care for Awardees with Statistically
Significant Findings, by Awardee ............................................................ 9Exhibit ES.5: Aggregate Total Cost of Care for Awardees with Statistically
Significant Findings, by Awardee .......................................................... 10Exhibit ES.6: Effects on Hospitalizations and ED Visits Associated with HCIA One
Interventions, by Awardee ..................................................................... 13Exhibit ES.7: Effects on Readmissions and Quality of Care Associated with HCIA
One Interventions, by Awardee ............................................................. 14Exhibit 1.1: The Complex/High-Risk Patient Targeting Awardees ........................... 19Exhibit 1.2: Conceptual Framework, Evaluation of the CHRPT Portfolio of HCIA
Awardees .............................................................................................. 21Exhibit 1.3: Data Source and Evaluation Design for Addendum, by Awardee ......... 23Exhibit 1.4: Claims-Based Measures of Program Effectiveness, by Awardee ......... 24Exhibit 1.5: Challenges to Evaluability: Representativeness of Claims Data,
By Awardee ........................................................................................... 26Exhibit 2.1: Program Effectiveness: A Visual Guide ................................................ 27Exhibit 2.2: Summary, Awardee Chapter Contents for NORC No-Cost Extension
Addendum ............................................................................................. 28Exhibit CLTCEC.1: Descriptive Characteristics for CLTCEC Program Participants and
Comparison Participants ....................................................................... 32Exhibit CLTCEC.2: Impact of the CLTCEC Program on Outcomes ..................................... 34Exhibit CLTCEC.3: Impact of CLTCEC Program on Outcomes, by Quarter ........................ 35
Exhibit CLTCEC.4: Impact of CLTCEC Program on Outcomes, Second Year after Program Enrollment .............................................................................. 36
Exhibit CKRI.1: Descriptive Characteristics for CKRI and Comparison Group Medicare Beneficiaries .......................................................................... 40
Exhibit CKRI.2: Impact of CKRI Program on Outcomes for Medicare Beneficiaries ...... 41Exhibit CKRI.3: Impact of CKRI Program on Outcomes for Medicare Beneficiaries,
by Quarter ............................................................................................. 42Exhibit CKRI.4: Descriptive Characteristics for CKRI and Comparison Group
Medicaid Beneficiaries .......................................................................... 44Exhibit CKRI.5: Impact of CKRI Program on Outcomes for Medicaid Beneficiaries ....... 45

NORC | HCIA Complex/High-Risk Patient Targeting
ADDENDUM TO THE THIRD ANNUAL REPORT | V
Exhibit DDHS.1: Descriptive Characteristics for DD Health Home and Comparison Group Beneficiaries ............................................................................... 48
Exhibit DDHS.2: Impact of the DD Health Home Program on Outcomes ........................ 49Exhibit J-CHiP.1: Impact of the J-CHiP Hospital Arm on Medicare Outcomes ................. 55Exhibit J-CHiP.2: Impact of the J-CHiP Hospital Arm by Quarter, Medicare ..................... 56Exhibit J-CHiP.3: Descriptive Characteristics for the J-CHiP Hospital Arm and
Comparison Group Beneficiary-Episodes, Medicaid ............................. 58Exhibit J-CHiP.4: Impact of the J-CHiP Hospital Arm on Outcomes, Medicaid ................. 60Exhibit J-CHiP.5: Descriptive Characteristics for the J-CHiP Community Arm and
Comparison Group Beneficiaries, Medicare .......................................... 63Exhibit J-CHiP.6: Impact of the J-CHiP Community Arm on Outcomes, Medicare ........... 64Exhibit J-CHiP.7: Impact of the J-CHiP Community Arm by Quarter, Medicare ................ 65Exhibit J-CHiP.8: Descriptive Characteristics for J-CHiP Community Arm and
Comparison Group Beneficiaries, Medicaid .......................................... 67Exhibit J-CHiP.9: Impact of the J-CHiP Intervention’s Community Arm, Medicaid
Beneficiaries .......................................................................................... 69Exhibit JHUSON.1: Descriptive Characteristics for Project CAPABLE and Comparison
Group Medicare Beneficiaries ............................................................... 79Exhibit JHUSON.2: Impact of the Project CAPABLE Program on Outcomes for Medicare
Beneficiaries .......................................................................................... 80Exhibit JHUSON.3: Impact of the Project CAPABLE Program on Outcomes for Medicare
Beneficiaries, by Quarter ....................................................................... 82Exhibit JHUSON.4: Descriptive Characteristics for Project CAPABLE and Comparison
Group Medicaid Beneficiaries ............................................................... 84Exhibit JHUSON.5: Impact of the Project CAPABLE Program on Outcomes for Medicaid
Beneficiaries .......................................................................................... 85Exhibit JHUSON.6: Impact of the Project CAPABLE Program on Outcomes for Medicaid
Beneficiaries, by Quarter ....................................................................... 86Exhibit LCCI.1: Descriptive Characteristics for LCCI and Comparison Group
Beneficiaries .......................................................................................... 89Exhibit LCCI.2: Impact of the LCCI Program on Outcomes ........................................... 90Exhibit LCCI.3: Impact of the LCCI Program, by Quarter ............................................... 92
Exhibit NCCS.1: Descriptive Characteristics for NCCS Program and Comparison Group Beneficiaries ............................................................................... 95
Exhibit NCCS.2: Impact of the NCCS Program on Outcomes ......................................... 97Exhibit PCCSB.1: Descriptive Characteristics for DASH and Comparison Group
Beneficiaries ........................................................................................ 100Exhibit PCCSB.2: Impact of the DASH Program on Outcomes ....................................... 101Exhibit PCCSB.3: Impact of the DASH Program by Quarter ............................................ 103Exhibit PRHI.1: Descriptive Characteristics for PCRC and Comparison Group
Beneficiary-Episodes ........................................................................... 108
NORC | HCIA Complex/High-Risk Patient Targeting
ADDENDUM TO THE THIRD ANNUAL REPORT | VI
Exhibit PRHI.2: Impact of PCRC Program on Outcomes ............................................. 110
Exhibit PRHI.3: Impact of PCRC Program on Patients with Acute Myocardial Infarction .............................................................................................. 111
Exhibit PRHI.4: Impact of the PCRC Program on Patients with Congestive Heart Failure ................................................................................................. 112
Exhibit PRHI.5: Impact of the PCRC Program on Patients with Chronic Obstructive Pulmonary Disease ............................................................................. 113
Exhibit PPMC.1: Claims-based Findings for PPMC Programs ....................................... 117Exhibit PPMC.2: Descriptive Characteristics for PPMC HRP and Comparison Group
Beneficiaries ........................................................................................ 120Exhibit PPMC.3: Impact of PPMC HRP on Outcomes ................................................... 121Exhibit PPMC.4: Descriptive Characteristics for New Directions Program and
Comparison Group Beneficiaries ........................................................ 123Exhibit PPMC.5: Impact of New Directions Program on Outcomes ............................... 124Exhibit PPMC.6: Descriptive Characteristics for PPMC ED Guides Program and
Comparison Group Beneficiaries ........................................................ 126Exhibit PPMC.7: Impact of PPMC ED Guides Program on Outcomes ........................... 127Exhibit PPMC.8: Descriptive Characteristics for PPMC Standard Transitions
Program and Comparison Group Beneficiaries ................................... 129Exhibit PPMC.9: Impact of PPMC Standard Transitions Program on Outcomes ........... 130Exhibit PPMC.10: Descriptive Characteristics for PPMC C-TRAIN and Comparison
Group Beneficiaries ............................................................................. 132Exhibit PPMC.11: Impact of PPMC C-TRAIN Program on Outcomes ............................. 133Exhibit PPMC.12: Descriptive Characteristics for PPMC ITT and Comparison Group
Beneficiaries ........................................................................................ 135
Exhibit PPMC.13: Impact of PPMC ITT Program on Outcomes ....................................... 136Exhibit HOPE.1: Descriptive Characteristics for the H.O.P.E. and Comparison
Group Beneficiary-Episodes, Hospital Arm ......................................... 141Exhibit HOPE.2: Impact of the H.O.P.E. Program on Outcomes, Hospital Arm ............. 143Exhibit HOPE.3: Impact of the H.O.P.E. Program by Quarter, Hospital Arm ................. 145Exhibit HOPE.4: Descriptive Characteristics for H.O.P.E. and Comparison Group
Beneficiaries, Community Arm ............................................................ 147Exhibit HOPE.5: Impact of the H.O.P.E. Program on Outcomes, Community Arm ....... 148Exhibit HOPE.6: Impact of the H.O.P.E. Program by Quarter, Community Arm ............ 149Exhibit AIM.1: Descriptive Characteristics for AIM and Comparison Group
Beneficiaries, End-of-Life Analysis ...................................................... 154Exhibit AIM.2: Impact of the AIM Program on Outcomes ........................................... 155Exhibit AIM.3: AIM and Comparison Group Beneficiaries with MDS Assessment
Data ..................................................................................................... 156

NORC | HCIA Complex/High-Risk Patient Targeting
ADDENDUM TO THE THIRD ANNUAL REPORT | VII
Exhibit UEMS.1: Descriptive Characteristics for HEALTHIER and Comparison Group Beneficiaries ............................................................................. 160
Exhibit UEMS.2: Impact of the HealthiER Program on Outcomes ................................. 161Exhibit UEMS.3: Impact of the HealthiER Intervention by Quarter ................................. 162Exhibit ECHO.1: Descriptive Characteristics for ECHO Care and Comparison
Group Beneficiaries ............................................................................. 166Exhibit ECHO.2: Impact of the ECHO Care Program on Outcomes .............................. 167Exhibit ECHO.3: Impact of the ECHO Care Program by Quarter ................................... 168Exhibit BSLTOC.1: Impact of the BSLTOC Program on UTIs and Falls ............................ 172Exhibit C.1: Types of Analyses for Claims-Based Measures in NORC
Addendum Report ............................................................................... 179Exhibit C.2: Status of Medicaid Data Sources ........................................................ 180Exhibit C.3: Supplemental Measures for Post-Acute Care Awardees .................... 181Exhibit D.1: Analyses that Include Common Support and Covariance Balance
Charts by Awardee .............................................................................. 183Exhibit D.2: Analyses that Include Quarterly Fixed Effects Charts of the Impact
of HCIA-Funded Innovations on Outcomes by Quarter by Awardee ... 184Exhibit D.CLTCEC.1: Test of Common Support and Covariate Balance, CLTCEC Program 185Exhibit D.CKRI.1: Test of Common Support and Covariate Balance, Medicare .............. 186Exhibit D.CKRI.2: Test of Common Support and Covariate Balance, Medicaid .............. 186Exhibit D.CKRI.3: Impact of the CKRI Program on Outcomes for Medicaid
Beneficiaries, by Quarter ..................................................................... 187
Exhibit D.DDHS.1: Test of Common Support and Covariate Balance, DD Health Home .. 188Exhibit D.DDHS.2: Impact of the DD Health Home Program by Quarter ........................... 189Exhibit D.J-CHiP.1: Common Support and Covariate Balance for J-CHiP and Comparison
Beneficiary-Episodes, Medicare .......................................................... 190Exhibit D.J-CHiP.2: Common Support and Covariate Balance for Dually Eligible J-CHiP
and Comparison Beneficiary-Episodes, Medicaid Analysis ................ 191Exhibit D.J-CHiP.3: Common Support and Covariate Balance for Medicaid Only J-CHiP
and Comparison Beneficiary-Episodes, Medicaid Analysis ................ 192Exhibit D.J-CHiP.4: Impact of the J-CHiP Hospital Arm on Outcomes by Quarter,
Medicaid .............................................................................................. 193Exhibit D.J-CHiP.5: Common Support and Covariate Balance for J-CHiP and
Comparison Participants, Medicare .................................................... 194Exhibit D.J-CHiP.6: Impact of the J-CHiP Community Arm on Medicare Outcomes by
Quarter ................................................................................................ 195Exhibit D.J-CHiP.7: Common Support and Covariate Balance for Dually Eligible and
Comparison Participants, Medicaid Analysis ...................................... 196Exhibit D.J-CHiP.8: Common Support and Covariate Balance for Medicaid Only and
Comparison Participants, Medicaid Analysis ...................................... 196

NORC | HCIA Complex/High-Risk Patient Targeting
ADDENDUM TO THE THIRD ANNUAL REPORT | VIII
Exhibit D.J-CHiP.9: Impact of the J-CHiP Community Arm on Medicaid Outcomes by Quarter ................................................................................................ 197
Exhibit D.J-CHiP.10: Common Support and Covariate Balance for Dually Eligible J-CHiP and Comparison Beneficiary-Episodes, Hospital to Community Crossover Analysis, Medicaid .......................................... 198
Exhibit D.J-CHiP.11: Common Support and Covariate Balance for Non-dually Eligible J-CHiP and Comparison Beneficiary-Episodes, Hospital to Community Crossover Analysis, Medicaid .......................................... 199
Exhibit D.J-CHiP.12: Subgroup Analysis: Quarterly Impact of the J-CHiP Intervention’s Community Arm, Medicare Beneficiaries, by Dose ............................. 200
Exhibit D.J-CHiP.13: Subgroup Analysis: Impact of the J-CHiP Community Arm, Medicaid Beneficiaries, by Dose ......................................................... 201
Exhibit D.JHUSON.1: Test of Common Support and Covariate Balance, Project CAPABLE, Medicare .............................................................................................. 202
Exhibit D.JHUSON.2: Impact of the Project CAPABLE Program on Outcomes for Medicare Beneficiaries, by Quarter ..................................................... 203
Exhibit D.JHUSON.3: Test of Common Support and Covariate Balance, Project CAPABLE Medicaid ............................................................................ 203
Exhibit D.JHUSON.4: Impact of the Project CAPABLE Program on Outcomes for Medicaid Beneficiaries, by Quarter ..................................................... 204
Exhibit D.LCCI.1: Test of Common Support and Covariate Balance, LCCI Program ...... 205Exhibit D.LCCI.2: Impact of the LCCI Program by Quarter .............................................. 206Exhibit D.NCCS.1: Test of Common Support and Covariate Balance, NCCS Program .... 207Exhibit D.NCCS.2: Impact of the NCCS Program by Quarter ............................................ 208Exhibit D.DASH.1: Test of Common Support and Covariate Balance, DASH
Intervention .......................................................................................... 209Exhibit D.PRHI.1: Test of Common Support and Covariate Balance, PCRC Program .... 210Exhibit D.PRHI.2: Impact of the PCRC Intervention on Outcomes, by Quarter ............... 211Exhibit D.PPMC.1: Test of Common Support and Covariate Balance, PPMC Health
Resilience Program ............................................................................. 213
Exhibit D.PPMC.2: Impact of the PPMC Health Resilience Program, by Quarter ............. 214Exhibit D.PPMC.3: Test of Common Support and Covariate Balance, PPMC New
Directions Program .............................................................................. 215Exhibit D.PPMC.4: Impact of the PPMC New Directions Program, by Quarter ................. 216Exhibit D.PPMC.5: Test of Common Support and Covariate Balance, PPMC ED
Guides Program .................................................................................. 217Exhibit D.PPMC.6: Impact of the PPMC ED Guides Program, by Quarter ........................ 218Exhibit D.PPMC.7: Impact of the PPMC ED Guides Program on Outcomes ..................... 219Exhibit D.PPMC.8: Impact of the PPMC ED Guides Program, by Quarter ........................ 220Exhibit D.PPMC.9: Test of Common Support and Covariate Balance, PPMC
Standard Transitions Program ............................................................ 221

NORC | HCIA Complex/High-Risk Patient Targeting
ADDENDUM TO THE THIRD ANNUAL REPORT | IX
Exhibit D.PPMC.10: Impact of the PPMC Standard Transitions Program, by Quarter ........ 222
Exhibit D.PPMC.11: Impact of the PPMC Standard Transitions Program on Outcomes ..... 223Exhibit D.PPMC.12: Impact of the PPMC Standard Transitions Program, by Quarter ........ 224Exhibit D.PPMC.13: Test of Common Support and Covariate Balance, PPMC C-TRAIN
Program ............................................................................................... 225Exhibit D.PPMC.14: Impact of the PPMC C-TRAIN Program, by Quarter ........................... 226Exhibit D.PPMC.15: Impact of the PPMC C-TRAIN Program on Outcomes ....................... 227Exhibit D.PPMC.16: Impact of the PPMC C-TRAIN Program, by Quarter ........................... 228Exhibit D.PPMC.17: Test of Common Support and Covariate Balance, PPMC ITT
Program ............................................................................................... 229Exhibit D.PPMC.18: Impact of the PPMC ITT Program, by Quarter .................................... 230Exhibit D.PPMC.19: Impact of the PPMC ITT Program on Outcomes ................................. 231Exhibit D.PPMC.20: Impact of the PPMC ITT Program, by Quarter .................................... 232Exhibit D.HOPE.1: Test of Common Support and Covariate Balance, H.O.P.E.
Hospital Arm ........................................................................................ 233Exhibit D.HOPE.2: Impact of the H.O.P.E. Program by Quarter, Hospital Arm ................. 234Exhibit D.HOPE.3: Test of Common Support and Covariate Balance, H.O.P.E.
Community Arm ................................................................................... 234Exhibit D.HOPE.4: Impact of the H.O.P.E. Program by Quarter, Community Arm ............ 235
Exhibit D.HOPE.5: Impact of the H.O.P.E. Program on Cost, Sensitivity Analysis, Community Arm ................................................................................... 236
Exhibit D.AIM.1: Test for Common Support and Covariate Balance, AIM Program ...... 237Exhibit D.UEMS.1: Test of Common Support and Covariate Balance, HealthiER
Program ............................................................................................... 238Exhibit D.UEMS.2: Impact of the HealthiER Intervention by Quarter ................................. 239Exhibit D.ECHO.1: Test of Common Support and Covariate Balance, ECHO Care
Program ............................................................................................... 240Exhibit D.ECHO.2: Impact of the ECHO Care Program on Outcomes by Quarter ............ 241Exhibit D.BSLTOC.1: Common Support and Covariate Balance for BSLTOC and
Comparison Beneficiary-Episodes, UTI Analysis ................................ 242Exhibit D.BSLTOC.2: Common Support and Covariate Balance for BSLTOC and
Comparison Beneficiary-Episodes, Falls Analysis .............................. 242Exhibit D.BSLTOC.3: Descriptive Characteristics for BSLTOC and Comparison Group
Beneficiary-Episodes, UTIs Analysis ................................................... 243Exhibit D.BSLTOC.4: Descriptive Characteristics for BSLTOC and Comparison Group
Beneficiary-Episodes, Falls Analysis ................................................... 244Exhibit D.BSLTOC.5: Impact of the BSLTOC Program on Quality Outcomes by Quarter ..... 245Exhibit E.1: Evaluation Research Questions, HCIA Evaluation Statement of
Work .................................................................................................... 246
NORC | HCIA Complex/High-Risk Patient Targeting
ADDENDUM TO THE THIRD ANNUAL REPORT | 1
Executive Summary
Overview, Evaluation of Complex/High-Risk Patient Targeting Awardees
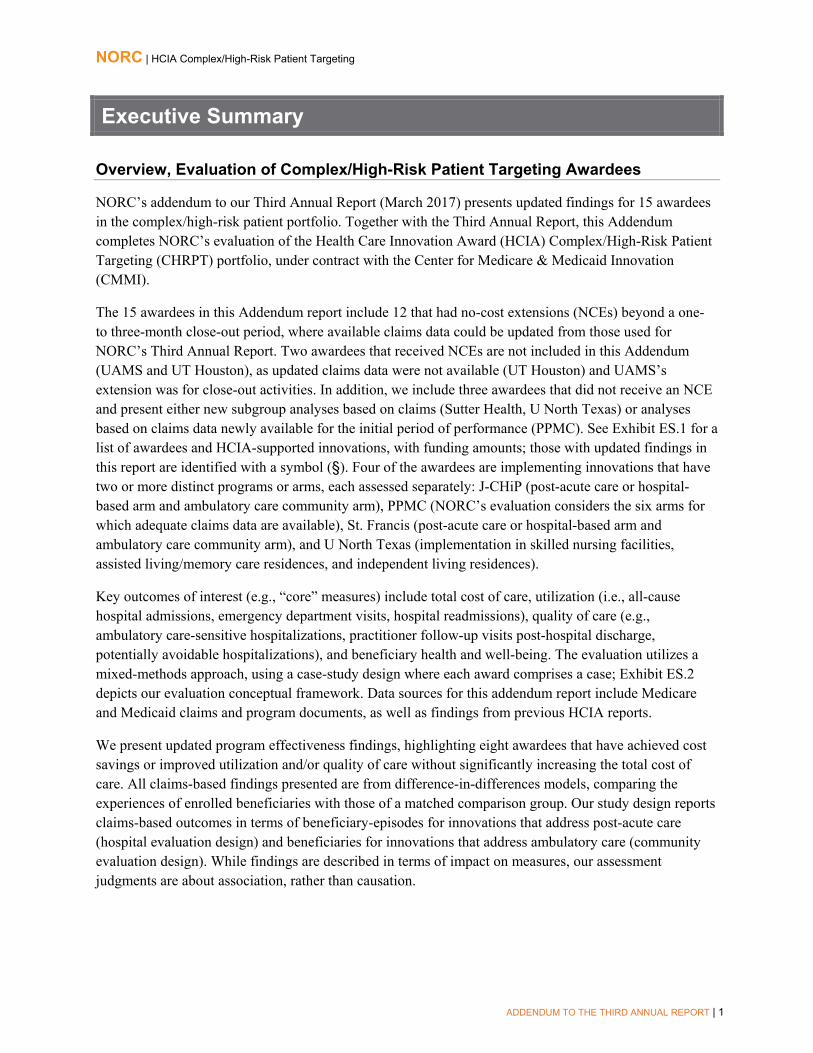
NORC’s addendum to our Third Annual Report (March 2017) presents updated findings for 15 awardees in the complex/high-risk patient portfolio. Together with the Third Annual Report, this Addendum completes NORC’s evaluation of the Health Care Innovation Award (HCIA) Complex/High-Risk Patient Targeting (CHRPT) portfolio, under contract with the Center for Medicare & Medicaid Innovation (CMMI).
The 15 awardees in this Addendum report include 12 that had no-cost extensions (NCEs) beyond a one- to three-month close-out period, where available claims data could be updated from those used for NORC’s Third Annual Report. Two awardees that received NCEs are not included in this Addendum (UAMS and UT Houston), as updated claims data were not available (UT Houston) and UAMS’s extension was for close-out activities. In addition, we include three awardees that did not receive an NCE and present either new subgroup analyses based on claims (Sutter Health, U North Texas) or analyses based on claims data newly available for the initial period of performance (PPMC). See Exhibit ES.1 for a list of awardees and HCIA-supported innovations, with funding amounts; those with updated findings in this report are identified with a symbol (§). Four of the awardees are implementing innovations that have two or more distinct programs or arms, each assessed separately: J-CHiP (post-acute care or hospital-based arm and ambulatory care community arm), PPMC (NORC’s evaluation considers the six arms for which adequate claims data are available), St. Francis (post-acute care or hospital-based arm and ambulatory care community arm), and U North Texas (implementation in skilled nursing facilities, assisted living/memory care residences, and independent living residences).
Key outcomes of interest (e.g., “core” measures) include total cost of care, utilization (i.e., all-cause hospital admissions, emergency department visits, hospital readmissions), quality of care (e.g., ambulatory care-sensitive hospitalizations, practitioner follow-up visits post-hospital discharge, potentially avoidable hospitalizations), and beneficiary health and well-being. The evaluation utilizes a mixed-methods approach, using a case-study design where each award comprises a case; Exhibit ES.2 depicts our evaluation conceptual framework. Data sources for this addendum report include Medicare and Medicaid claims and program documents, as well as findings from previous HCIA reports.
We present updated program effectiveness findings, highlighting eight awardees that have achieved cost savings or improved utilization and/or quality of care without significantly increasing the total cost of care. All claims-based findings presented are from difference-in-differences models, comparing the experiences of enrolled beneficiaries with those of a matched comparison group. Our study design reports claims-based outcomes in terms of beneficiary-episodes for innovations that address post-acute care (hospital evaluation design) and beneficiaries for innovations that address ambulatory care (community evaluation design). While findings are described in terms of impact on measures, our assessment judgments are about association, rather than causation.

NORC | HCIA Complex/High-Risk Patient Targeting
ADDENDUM TO THE THIRD ANNUAL REPORT | 2
Exhibit ES.1: Health Care Innovation Awardees, Complex/High-Risk Patient Targeting
Awardee (§ = included in Addendum Report)
Funding Amount Intervention State(s)
No-cost Extension (# Months)
Beth Israel Deaconess Medical Center (BIDMC) $4,937,189 Post-Acute Care Transitions MA 0
California Long-Term Care Education Center (CLTCEC) § $11,831,443 Care Team Integration of the
Home-Based Workforce CA 7
Community Care of North Carolina (CCNC) $9,327,422 Child Health Accountable Care
Collaborative NC 0
Courage Kenny Rehabilitation Institute (CKRI) § $1,767,667 Advanced Primary Care Clinic MN 12
Developmental Disabilities Health Services (DDHS) § $3,701,525 Developmental Disabilities Health
Home NJ, NY 6
Johns Hopkins University (J-CHiP) § $19,920,338 Community Health Partnership MD 12 Johns Hopkins University School of Nursing (JHU SON) § $4,075,344 Project Community Aging in Place,
Advancing Better Living for Elders MD 6
LifeLong Medical Care (LifeLong) § $1,109,229 LifeLong Comprehensive Care Initiative CA 6
Northland Healthcare Alliance (Northland) § $2,726,216 Northland Care Coordination for
Seniors ND 12
Palliative Care Consultants of Santa Barbara (PCCSB) § $4,253,215 Doctors Assisting Seniors at Home CA 12
Pittsburgh Regional Health Initiative (PRHI) § $10,412,359 Primary Care Resource Centers PA, WV 8
Providence Portland Medical Center (PPMC) § $17,337,094 Tri-County Health Commons OR 3
South Carolina Research Foundation (SCRF) $2,884,719 HOMECARE+ SC 0
St. Francis Healthcare Foundation of Hawaii (St. Francis) § $5,299,706 Home Outreach Program and E-
Health (H.O.P.E.) HI 12
Sutter Health Corporation (Sutter Health) § $13,000,000 Advanced Illness Management CA 0
University Emergency Medical Services (UEMS) § $2,562,937
Better Health through Social and Health Care Linkages Beyond the Emergency Department
NY 7
University of Arkansas for Medical Sciences (UAMS) $3,518,798
Cost-Effective Delivery of Enhanced Home Caregiver Training
AR, CA, HI, TX 12
University of Iowa Hospitals and Clinics (U Iowa) $7,662,278 Transitional Care Teams IA 0
University of New Mexico Health Sciences Center (U New Mexico) § $8,401,614
Extension for Community Healthcare Outcomes (ECHO) Care
NM 12
University of North Texas Health Science Center (U North Texas) § $7,329,714 Brookdale Senior Living
Transitions of Care
CO, FL, KS, TN, TX
0
University of Rhode Island (URI) $10,202,795 Living RIte Centers RI 3 University of Texas Health Sciences Center (UT Houston) $3,701,370 High-Risk Children’s Clinic TX 12
Vanderbilt University Medical Center (VUMC) $2,449,241 Reducing Hospitalizations in
Medicare Beneficiaries KY, TN 0

NORC | HCIA Complex/High-Risk Patient Targeting
ADDENDUM TO THE THIRD ANNUAL REPORT | 3
Exhibit ES.2: Conceptual Framework, Evaluation of the CHRPT Portfolio of HCIA Awardees

NORC | HCIA Complex/High-Risk Patient Targeting
. ADDENDUM TO THE THIRD ANNUAL REPORT | 4
Outcomes, Program Effectiveness
NORC’s evaluation considers a range of program effectiveness outcomes (e.g., cost, utilization, quality of care, beneficiary health, functioning, and wellbeing). This Addendum Report focuses on claims-based outcome measures, to complete the evaluation presented in our Third Annual Report. The Addendum has a narrower scope than previous NORC Annual Reports, with a focus on CMMI core measures related to the total cost of care and utilization, plus supplemental quality of care measures. The total cost of care estimates are based solely on data from Medicare and Medicaid claims, and do not include the cost of the intervention. Success for an awardee’s innovation or intervention arm reflects savings in the total cost of care that achieve statistical significance, strengthened when accompanied by one or more improvements in utilization and/or the quality of care. Conversely, program effectiveness is also indicated by improved utilization and/or quality of care with no statistically significant increase in the total cost of care.
Six awardees out of 15 in this Addendum Report have demonstrated Medicare or Medicaid cost savings; four of these awardees also show a statistically significant improvement on at least one CMMI core measure related to utilization or quality of care.1 The claims used to develop estimates of program effectiveness represent 60 percent or more of those for the performance period. For this reason, it is likely that the estimates are representative of each awardee’s overall performance.
Awardees with Cost Savings, Representative of Performance Period
Courage Kenney Rehabilitation Institute (CKRI). A medical home serving beneficiaries with physical disabilities, including spinal cord injury, traumatic brain injury, and musculoskeletal conditions. Primary and specialty care are co-located with referrals for community service and supports and classes taught jointly by a nurse care manager and peer.
Positive Outcome: average quarterly savings (-$1,643 per beneficiary, Medicaid), fewer hospitalizations in two quarters (Medicare) and fewer ED visits in two quarters (Medicare).
Negative Outcome: increased ED visits per quarter (47 per 1,000 beneficiaries, Medicaid).
■ Johns Hopkins Community Health Partnership (J-CHiP). Hospital Arm. Multidisciplinary teams deliver and coordinate care for beneficiaries discharged from two hospitals, the Johns Hopkins Hospital and Johns Hopkins Bayview Medical Center, in partnership with five skilled nursing facilities. This arm is part of a multifaceted innovation that builds on pre-existing, evidence-based programs including daily multidisciplinary rounding and early risk-screening for complex discharge needs. Components also include a Meds for Home Program, pharmacy extenders, home visits or post-discharge phone calls, and patient education.
Positive Outcomes: average quarterly cost savings (-$1,115 per beneficiary-episode, Medicare; and -$4,295 per beneficiary-episode, Medicaid) and fewer ED visits per quarter (-133 per 1,000 beneficiary-episodes, Medicaid).
1 For two awardees –J-CHiP (hospital arm, Medicare data) and U North Texas (SNF arm) –claims-based findings presented in NORC’s Third Annual Report indicate statistically significant cost savings and improved utilization and/or quality of care. New claims-based findings presented in this Addendum Report consist of subgroup analyses –of cost categories for J-CHiP’s hospital arm and two quality measures for U North Texas’s SNF arm.

NORC | HCIA Complex/High-Risk Patient Targeting
. ADDENDUM TO THE THIRD ANNUAL REPORT | 5
Negative Outcomes: increased hospitalizations per quarter (11 per 1,000 beneficiary-episodes, Medicare; and 49 per 1,000 beneficiary-episodes, Medicaid), 30-day hospital readmissions per quarter (14 per 1,000 beneficiary-episodes, Medicare), and fewer practitioner follow-up visits post-discharge per quarter (-41 7-day visits and -29 30-day visits per 1,000 beneficiary-episodes, Medicare; and -70 7-day visits and -182 30-day visits per 1,000 beneficiary-episodes, Medicaid).
■ Johns Hopkins Community Health Partnership (J-CHiP). Community Arm. Health behavior specialists and community health workers (CHWs) deliver care coordination and enhanced primary care (mental health and substance abuse services) at eight clinics in East Baltimore. Two community organizations, Sisters Together and Reaching (STAR) and the Men and Families Center (M&FC), provide direct patient outreach and supportive services by Neighborhood Navigators and CHWs, including care management, to targeted neighborhoods.
Positive Outcomes: average quarterly cost savings (-$1,643 per beneficiary, Medicaid), fewer hospitalizations per quarter (-33 per 1,000 beneficiaries, Medicaid), and fewer ED visits per quarter (-51 per 1,000 beneficiaries, Medicaid). Fewer 30-day hospital readmissions per quarter (-36 per 1,000 beneficiaries, Medicaid) and fewer potentially avoidable hospitalizations per quarter (-7 per 1,000 beneficiaries, Medicaid). Negative Outcome: none.
■ Pittsburgh Regional Health Initiative. Primary Care Resource Centers (PCRCs) located in six regional community hospitals in Western Pennsylvania and the northern West Virginia panhandle deliver pre- and post-discharge care for enrolled Medicare beneficiaries with chronic obstructive pulmonary disease, congestive heart failure, and/or acute myocardial infarction. A team comprised of a nurse care manager and pharmacist delivers inpatient care coordination and patient education, establishes telephone contact with patients and their primary care providers, and makes home visits. The PCRC innovation is organized around a rubric of six key tasks called the “perfect discharge bundle,” including a root cause analysis of hospital admission, patient education, pharmacist medication review, creation of a discharge action plan, and both a pharmacist call and note to the provider within 72 hours of discharge from the hospital.
Positive Outcomes: Average cost savings at 180 days post-discharge (-$1,264 per beneficiary-episode per quarter), decrease in ED visits at 180 days post-discharge (-27 per 1,000 beneficiary-episodes per quarter), and increased practitioner follow-up visits within 7 days post-discharge (69 per 1,000 beneficiary-episodes per quarter) and 30-days post-discharge (37 per 1,000 beneficiary-episodes per quarter), both measured after 90 days post-discharge. Negative Outcome: none.
■ Sutter Health, End of Life Experience. For patients with late-stage disease and their caregivers, the Advanced Illness Management (AIM) innovation coordinates care across multiple settings (hospital, home health, provider offices, on-call triage), supported by a unified electronic health record and rubric of five pillars of care, nurse-led multidisciplinary teams, and advance care planning. Sutter Health piloted an earlier version of AIM in 2009 and used HCIA One funding to scale a revised, evidence-based AIM model across 11 sites affiliated with Sutter Health.

NORC | HCIA Complex/High-Risk Patient Targeting
. ADDENDUM TO THE THIRD ANNUAL REPORT | 6
Positive Outcomes: in the last 30 days of life, average cost savings (-$4,968 per beneficiary) and decrease in hospitalizations (-58 per 1,000 beneficiaries). Negative Outcome: in the last 30 days of life, increase in ED visits (21 per 1,000 beneficiaries).
■ University Emergency Medical Services (UEMS). A team of CHWs recruit high utilizer beneficiaries at one ED (Erie County Medical Center) and hospital-affiliated outpatient clinics, and provide weekly one-on-one coaching to facilitate patient-directed goal-setting, navigation, referrals to community benefits and services, and strengthened connections to primary care.
Positive Outcomes: average quarterly cost savings (-$407 per beneficiary), fewer hospitalizations per quarter (-15 per 1,000 beneficiaries), fewer ED visits per quarter (-132 per 1,000 beneficiaries), and more practitioner follow-up visits at 30 days post-enrollment (43 per 1,000 beneficiaries per quarter). Negative Outcome: none.
■ University of New Mexico. This program expands on the Project ECHO model to deliver weekly virtual grand rounds, linking a team of specialists at the University of New Mexico with multidisciplinary outpatient intensivist teams at six sites around the state. The teams deliver clinic and home-based care to high-risk adult Medicaid beneficiaries.
Positive Outcomes: average quarterly cost savings (-$1,270 per beneficiary) and a decrease in potentially avoidable hospitalizations (-15 per 1,000 beneficiaries per quarter). Negative Outcome: none.
Cost of Care (Claims-based Findings) Across the Complex/High-Risk Portfolio
Total Cost of Care per Awardee. Among the 14 awardees for whom updated claims cost data is available, six demonstrate statistically significant cost savings (relative to comparison groups) for at least one program or arm of their interventions. Average quarterly cost savings range from -$407 (UEMS) to -$4,968 (Sutter Health) per beneficiary. See Exhibit ES.3 for a summary table of findings for the total cost of care, based on Medicare or Medicaid data as noted. Also, see Exhibit ES.4 for a visual depiction of estimated cost savings and losses that reach statistical significance, with 90 percent confidence intervals for each estimate. Six intervention or intervention arms have average quarterly cost savings of no more than approximately -$1,700 per beneficiary (for ambulatory care or community arm) or beneficiary-episode (for post-acute care or hospital arm). Two awardees (J-CHiP, hospital arm, Medicaid; and Sutter) show statistically significant average quarterly savings of at least -$4,000, while one awardee (CLTCEC) shows statistically significant expenditures of $666 per beneficiary.
Aggregate Cost Savings or Loss per Awardee. As in our Third Annual Report, we also examine the estimated aggregate cost savings or losses of each intervention with updated claims data in this Addendum. The aggregated analysis includes the number of beneficiaries served, the mean number of calendar quarters over which beneficiaries are enrolled, and the average quarterly impact on total cost of care. See Exhibit ES.3 for a summary table that displays these aggregate estimates and Exhibit ES.5 for a visual depiction of aggregate savings and losses. Considering the scope of an awardee’s innovation gives us another way to gauge impact, as there are many smaller-scale innovations within the complex/high-risk portfolio whose impact is likely to be more modest than that of innovations piloted by large health care

NORC | HCIA Complex/High-Risk Patient Targeting
. ADDENDUM TO THE THIRD ANNUAL REPORT | 7
systems or corporations, whose interventions have the potential to touch thousands or tens of thousands of beneficiaries. As above, there are interventions or intervention arms with aggregate savings in the total cost of care, ranging from -$2,271,550 (UEMS) to -$59,790,132 (J-CHiP hospital arm, Medicaid). Four awardees have aggregate cost savings of under -$10 million and one (Sutter Health) has cost savings of -$18,406,440. J-CHiP’s hospital arm has the largest estimated cost savings, in both Medicare (-$29,153,336) and Medicaid (-$59,790,132) dollars, as well as the largest estimated cost savings in the community arm (Medicaid costs) at -$24,352,777. For CLTCEC, estimates yield a statistically significant increase in aggregate cost of care in the amount of $3,353,977. Two PPMC programs (Health Resilience Program, Standard Transitions) show statistically significant increases in aggregate cost of care in the amounts of $2,798,663 and $2,538,724, respectively. Shaded cells indicate areas where no data are available.

NORC | HCIA Complex/High-Risk Patient Targeting
ADDENDUM TO THE THIRD ANNUAL REPORT | 8
Exhibit ES.3: Cost Effects Associated with HCIA One Interventions, by Awardee
Awardee Program Model Evaluation Design§§§
Data Average Quarterly Cost§ Aggregate Impact
Estimate 90% Confidence
Interval 80% Confidence
Interval Number Enrolled
Mean Quarters of
Enrollment§§ Total Cost of
Care CLTCEC Train Home Care Workers C ■ $666 * [$46, $1,286] [$183, $1,149] 1,017 5.0 $3,353,977 *
CKRI Integrated Care Delivery C ■ -$1,866 + [-$4,002, $270] [$-3,530, $202] 66 9.5 -$863,811 + ■ -$1,643 * [-$3,139, -$147] [-$2,809, -$477] 188 9.3 -$3,155,565 *
DDHS Disability Medical Home C ■ $2,969 [-$2,811, $8,749 ] [-$1,536, $7,474] 151 4.3 $1,623,944
J-CHiP
Transitional Care, Care Coordination H ■ -$1,115 * [-$2,236, $0] [$-1,989, $-241] 26,144 8.0 -$29,153,336 *
■ -$4,295 *** [-$6,392, -$2,198] [-$5,930, -$2,660] 13,921 8.0 -$59,790,132 ***
Care Coordination C ■ $174 [-$334, $682] [-$222, $570] 2,154 6.0 $2,238,184 ■ -$1,643 *** [-$2,204, -$1,082] [-$2,080, -$1,206] 2,532 6.0 -$24,352,777 ***
JHU SON Home Care C ■ $398 [-$819, $1,615] [-$550, $1,346] 171 9.1 $595,229 ■ -$76 [-$941, $789] [-$750, $598] 177 7.8 -$89,036
LifeLong Care Coordination, Independent Living Skills C ■ $1,432 [-$1,642, $4,506] [-$964, $3,828] 224 6.1 $1,949,888
Northland Care Coordination C ■ $249 [-$244, $742] [-135, 633] 553 6.5 $868,399 PCCSB ED Diversion, ACP C ■ -$121 [-$538, $296] [-$446, $204] 1,260 6.2 -$940,543
PRHI Transitional Care (90-day) H ■ -$201 [-$1,185, $783] [-$968, $566] 5,926 11.0 -$1,192,348 Transitional Care (180-day) ■ -$1,264 * [-$2,506, -$22] [-$2,232, -$296] 5,926 11.0 -$7,492,748 *
PPMC
Health Resilience Program
C
■ $417** [$129, $705] [$192, $641] 1,337 5.0 $2,798,663** New Directions ■ $1,098+ [-$160, $2,356] [$118, $2,078] 173 5.0 $994,170+ ED Guides (ED Diversion) ■ -$81+ [-$176, $14] [-$155, -$7] 4,822 1.9 -$746,644+ Standard Transitions ■ $372*** [$187, $557] [$228, $516] 3,705 1.8 $2,538,724*** C-TRAIN ■ $160 [-$176, $496] [-$102, $422] 604 1.9 $181,359 Intensive Transition Team ■ -$172 [-$600, $256] [-$506, $162] 583 1.9 -$193,193
St. Francis
Transitional Care, Telemonitoring H ■ $751 [-$5,480, $6,982] [-$4,105, $5,607] 153 12.0 $108,916
Telemonitoring C ■ $1,598 + [-$94, $3,290] [$279, $2,917] 252 4.4 $1,764,546+ SutterHealth§§§§ Transitional Care, ACP C (EOL) ■ -$4,968 *** [-$5,697, -$4,240] [-$5,536, -$4,401] 3,705 -$18,406,440 ***
UEMS ED Diversion C ■ -$407*** [-$536, -$278] [-$507, -$307] 1,033 5.4 -$2,271,550*** U New Mexico Integrated Care C ■ -$1,270 ** [-$2,218, -$322] [-$2,009, -$531] 719 6.5 -$5,951,342 **
NOTES: +<p<0.2, *p<0.10, **p<0.05, ***p<0.010. BOLD font indicates statistical significance at p<0.10 level. Shaded cells indicate areas where no data is available. ED = emergency department, EOL = end of life. §Units are per beneficiary-episode for hospital design and per beneficiary for community design. §§Calculation of mean length of enrollment is based on finder files that may extend beyond June 20, 2015, for selected awardees with a no-cost extension; the estimated total cost of care is based on analysis of claims for a period that may extend beyond June 30, 2015. §§§ Evaluation Designs include Hospital (H) and Community (C). §§§§Primary analysis for Sutter Health is for beneficiaries in the last 30 days of life and is a differences (time-series) rather than DID analysis; our DID analysis of the experiences of all beneficiaries over the full performance period does not reliably model the intervention’s impacts, due to the inability to construct a comparison group with similar life trajectories.
Med
icar
e
Med
icai
d

NORC | HCIA Complex/High-Risk Patient Targeting
ADDENDUM TO THE THIRD ANNUAL REPORT | 9
Exhibit ES.4: Average Quarterly Total Cost of Care for Awardees with Statistically Significant Findings, by Awardee
NOTES: Average quarterly total cost of care (savings or loss) are in dollars per beneficiary-episode (hospital evaluation design) or per beneficiary (community evaluation design). Blue bars indicate average quarterly cost (statistically significant at the p<0.10 level) and black lines represent 90 percent confidence intervals around each estimate for total cost; 90 percent confidence interval may cross zero and still reach statistical significance.

NORC | HCIA Complex/High-Risk Patient Targeting
ADDENDUM TO THE THIRD ANNUAL REPORT | 10
Exhibit ES.5: Aggregate Total Cost of Care for Awardees with Statistically Significant Findings, by Awardee
NOTES: Aggregate cost savings for J-CHiP Hospital Medicare not shown to scale.

NORC | HCIA Complex/High-Risk Patient Targeting
ADDENDUM TO THE THIRD ANNUAL REPORT | 11
Health Services Utilization and Quality of Care
For three awardees (PCCSB, PPMC ED Guides, St. Francis hospital arm), program effectiveness findings show improved utilization and/or quality of care, while these improved outcomes are associated with no statistically significant changes in total cost of care. The claims used to develop estimates represent over 60 percent of the awardee’s initial performance period, indicating that these estimates are likely representative of overall performance.
Exhibits ES.6 and ES.7 display summary findings across the complex/high-risk portfolio for claims-based estimates of hospitalizations, emergency department (ED) visits, hospital readmissions, and measures of quality of care, based on Medicare or Medicaid claims data as noted.
Hospitalizations. Among 14 awardees for whom updated hospitalization claims data are available in this Addendum, two have statistically significant decreases in hospitalizations for at least one intervention arm, with average quarterly impacts of -15 (UEMS) and -58 (Sutter) hospitalizations per 1,000 beneficiaries. One awardee (J-CHiP) has increases in both Medicare and Medicaid hospitalizations (hospital arm) and a decrease in hospitalizations in the community arm (Medicaid). Three awardees show increases in hospitalizations (CLTCEC; PPMC, Health Resilience Program, Standard Transitions, C-TRAIN; and St. Francis, community arm); all changes are statistically significant.
Emergency Department (ED) Visits. Seven awardees show significant decreases in ED visits for at least one intervention arm, with average quarterly impacts ranging from -13 (CLTCEC, PCCSB) to -700 (PPMC, ED Guides) ED visits per 1,000 beneficiaries; J-CHiP shows significant decreases in both its hospital and community arms (Medicaid). Four interventions have an increase in ED visits per quarter: CKRI (Medicaid, 47 per 1,000 beneficiaries), PPMC (201 per 1,000 beneficiaries, Health Resilience Program, 147 per 1,000 beneficiaries, Standard Transitions, and 501 per 1,000 beneficiaries, C-TRAIN), Northland (29 per 1,000 beneficiaries), and Sutter (21 per 1,000 beneficiaries).
Readmissions. Of the nine awardees for whom 30-day hospital readmissions may be measured using updated claims data for this Addendum, only J-CHiP shows any statistically significant change, with its community arm (Medicaid) showing a decrease in 30-day readmissions (-36 per 1,000 beneficiaries and its hospital arm (Medicare) showing an increase in 30-day readmissions (14 per 1,000 beneficiaries.
Quality of Care.
■ Ambulatory Care-Sensitive (ACS) Hospitalizations. One awardee (PCCSB) shows a statistically significant quarterly decrease of -4 per 1,000 beneficiaries.
■ Practitioner Follow-Up Visits. With respect to this measure of access to care, three interventions show increases in practitioner follow-up post-discharge from an acute care hospital. PRHI shows increases in 7-day (69 per 1,000 beneficiary-episodes) and 30-day (37 per 1,000 beneficiary-episodes) follow-up visits, St. Francis shows increases in 7-day follow-up visits (111 per 1,000 beneficiary-episodes, and UEMS demonstrates increases in 30-day follow-up visits (43 per 1,000 beneficiary-episodes). Decreases in 7-day and 30-day practitioner follow-up visits are also detected for J-CHiP (hospital arm) in both the Medicare and Medicaid analyses. J-CHiP (hospital arm) Medicare data show decreases of -41 (7-day) and -29 (30-day) follow-up visits per 1,000

NORC | HCIA Complex/High-Risk Patient Targeting
ADDENDUM TO THE THIRD ANNUAL REPORT | 12
beneficiary-episodes, while J-CHiP (hospital arm) Medicaid data show decreases of -70 (7-day) and -182 (30-day) follow-up visits per 1,000 beneficiary-episodes.
Potentially Avoidable Hospitalizations (PAH). Two awardees show a statistically significant decrease of -7 PAH per 1,000 beneficiaries per quarter (J-CHiP, community arm, Medicaid) and -15 PAH per 1,000 beneficiaries per quarter (U New Mexico).

NORC | HCIA Complex/High-Risk Patient Targeting
ADDENDUM TO THE THIRD ANNUAL REPORT | 13
Exhibit ES.6: Effects on Hospitalizations and ED Visits Associated with HCIA One Interventions, by Awardee
Awardee Evaluation Design
Data Average Quarterly Impact Hospitalizations ED Visits
Estimate 90% CI 80% CI Estimate 90% CI 80% CI CLTCEC C ■ 16 * [3, 29] [6, 26] -13 ** [-24, -2] [-21, -5]
CKRI C ■ -37 + [-80, 6] [-70,-4] 12 [-44, 68] [-32,56] ■ -20 [-48, 8] [-41, 1] 47 ** [8, 86] [17, 77]
DDHS C ■ -10 [-38, 18] [-32, 12] -74 *** [-106, -42] [-99, -49]
J-CHiP H
■ 11 * [0, 22] [2, 20] -10 + [-21, 1] [-19, -1]
■ 49 ** [14, 84] [22, 76] -133 *** [-160, -106] [-154, -112]
C ■ -5 [-15, 5] [-13, 3] -2 [-13, 9] [-10, 6] ■ -33 *** [-41, -25] [-39, -27] -51 *** [-62, -40] [-59, -43]
JHU SON C ■ 12 [-16, 40] [-10, 34] -6 [-35, 23] [-28, 16] ■ 11 [-12, 34] [-7, 29] -5 [-27, 17] [-22, 12]
LifeLong C ■ 34 + [-3, 71] [5, 63] -5 [-41, 31] [-33, 23] Northland C ■ 15 + [-3, 33] [1, 29] 29 ** [6, 52] [11, 47] PCCSB C ■ -8 + [-18, 2] [-16, 0] -13 * [-25, -1] [-22, -4]
PRHI H (90-day) ■ 1 [-18, 20] [-14, 16] -12 [-30, 6] [-26, 2]
H (180-day) ■ -4 [-25, 17] [-21,13] -27 ** [-47, -7] [-43,11]
PPMC
C (Health Resilience Program) ■ 86*** [45, 127] [54, 118] 201** [41, 361] [76, 326] C (New Directions) ■ 23 [-103, 149] [-75, 121] -385 [-1,029, 259] [-887, 117]
C (ED Guides) ■ 1 [-10, 12] [-8, 10] -700*** [-752, -648] [-741, -659] C (Standard Transitions) ■ 33** [9, 57] [14, 52] 147*** [76, 218] [91, 203]
C (C-TRAIN) ■ 170*** [81, 259] [100, 240] 501*** [254, 748] [309, 693] C (Intensive Transition Team) ■ -38 [-95, 19] [-82, 6] 64 [-179, 307] [-126, 254]
St. Francis H ■ -18 [-108, 72] [-88, 52] 49 [-46, 144] [-25, 123] C ■ 64 *** [25, 103] [34, 94] 26 [-13, 65] [-4, 56]
Sutter Health§ C (EOL) ■ -58 *** [-76, -40] [-72, -44] 21 ** [7, 35] [10, 32] UEMS C ■ -15 * [-29, -1] [-26, -4] -132 *** [-151, -113] [-147, -117] U New Mexico C ■ -9 [-27, 9] [-23, 5] 2 [-23, 27] [-17, 21]
NOTES: *p<0.10, **p<0.05, ***p<0.010. BOLD font indicates statistical significance at the p<0.10 level or greater. Shaded cells indicate areas where no data is available. Calculation of average length of enrollment is based on finder files that may extend beyond June 20, 2015, for selected awardees with a no-cost extension, and the estimated changes in utilization are based on analysis of claims for period that may extend beyond June 30, 2015. PFU = practitioner follow-up visit post-discharge; EOL = end of life analysis; §Primary analysis for Sutter Health is for beneficiaries in the last 30 days of life and is a differences (time-series) rather than DID analysis; our DID analysis of the experiences of all beneficiaries over the full performance period does not reliably model the intervention’s impacts, due to the inability to construct a comparison group with similar life trajectories, and is included in Appendix D in NORC’s Third Annual Report.
Med
icar
e
Med
icai
d

NORC | HCIA Complex/High-Risk Patient Targeting
ADDENDUM TO THE THIRD ANNUAL REPORT | 14
Exhibit ES.7: Effects on Readmissions and Quality of Care Associated with HCIA One Interventions, by Awardee
Awardee Evaluation Design
Data Average Quarterly Impact 30-day Readmissions Quality of Care
Estimate
90% Confidence
Interval
80% Confidence
Interval Estimate
90% Confidence
Interval
80% Confidence
Interval CLTCEC C ■ 8 [-44, 60] [-32, 48] ACS: 4 [-3, 11] [-1, 9]
CKRI C ■ ■
DDHS C ■
J-CHiP H
■ 14 ** [4, 24] [6, 22] 7-day PFU: -41 ***
[-51, -31] [-49, -33]
30-day PFU: -29 ***
[-40, -18] [-37, -21]
■ 2 [-29, 33] [-22, 26] 7-day PFU: -70 *** [-92, -48] [-87, -53]
30-day PFU: -182 ***
[-210, -154] [-204, -160]
C ■ 6 [-23, 35] [-16, 28] ACS: 0 [-6, 6] [-5, 5] ■ -36 ** [-64, -8] [-57, -14] PAH: -7 *** [-11, -3] [-10, -4]
JHU SON C ■ -56 [-160, 48] [-137, 25] ACS: 7 [-5, 19] [-2, 16] ■
LifeLong C ■ -116 + [-255, 23] [-224, -8] Northland C ■ -10 [-65, 45] [-53, 33] ACS: 11 [-4, 26] [0, 22] PCCSB C ■ -3 [-46, 40] [-37, 31] ACS: -4 * [-8, 0] [-7, -1] PRHI
H (90-day)
■ 11 [-8, 30] [-4, 26] 7-day PFU: 69 ***
[32, 106] [40, 98]
30-day PFU: 37 ***
[18, 56] [22, 52]
H (180-day) ■ PPMC C (Health Resilience Program) ■
C (New Directions) ■ C (ED Guides) ■
C (Standard Transitions) ■ C (C-TRAIN) ■
St. Francis
H ■
9 [-59, 77] [-44, 62] 7-day PFU: 111*
[5, 217] [28, 194]
30-day PFU: -14
[-121, 93] [-97, 69]
C ■ -7 [-84, 70] [-67, 53] ACS: 18 [-12, 48] [-5, 41]
Med
icar
e
Med
icai
d

NORC | HCIA Complex/High-Risk Patient Targeting
ADDENDUM TO THE THIRD ANNUAL REPORT | 15
Awardee Evaluation Design
Data Average Quarterly Impact
Med
icar
e
Med
icai
d 30-day Readmissions Quality of Care
Estimate
90% Confidence
Interval
80% Confidence
Interval Estimate
90% Confidence
Interval
80% Confidence
Interval Sutter Health§ C (EOL) ■ UEMS C ■ 7-day PFU:
16 [-11, 43] [-5, 37]
30-day PFU: 43**
[10, 76] [17, 69]
90-day PFU: -8
[-42, 26] [-34, 18]
PAH: -2 [-8, 4] [-7, 3] U New Mexico C ■ -10 [-69, 49] [-56, 36] PAH: -15 ** [-25, -5] [-23, -7]
U North Texas H (SNF) ■ UTIs: 7 [-4, 18] [-2, 15] falls: 5+ [-1, 10] [0, 9]
NOTES: +p<0.20, *p<0.10, **p<0.05, ***p<0.010. BOLD font indicates statistical significance at the p<0.10 level or greater. Shaded cells indicate areas where no data is available. Calculation of average length of enrollment is based on finder files that may extend beyond June 20, 2015, for selected awardees with a no-cost extension, and the estimated changes in utilization are based on analysis of claims for period that may extend beyond June 30, 2015. PFU = practitioner follow-up visit post-discharge; EOL = end of life analysis; PAH = potentially avoidable hospitalization; ACS = ambulatory care-sensitive hospitalization’ SNF = skilled nursing facility analysis. §Primary analysis for Sutter Health is for beneficiaries in the last 30 days of life and is a differences (time-series) rather than DID analysis; our DID analysis of the experiences of all beneficiaries over the full performance period does not reliably model the intervention’s impacts, due to the inability to construct a comparison group with similar life trajectories; see Appendix D in NORC’s Third Annual Report.
NORC | HCIA Complex/High-Risk Patient Targeting
ADDENDUM TO THE THIRD ANNUAL REPORT | 16
Limitations of Analyses
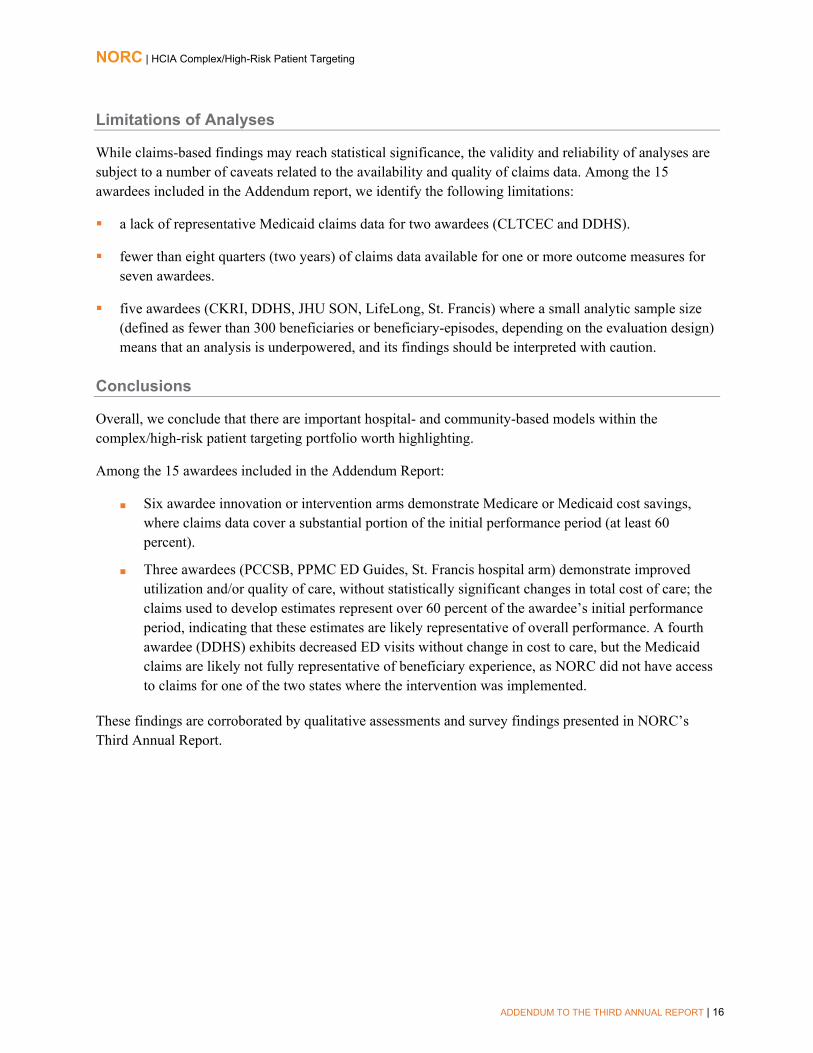
While claims-based findings may reach statistical significance, the validity and reliability of analyses are subject to a number of caveats related to the availability and quality of claims data. Among the 15 awardees included in the Addendum report, we identify the following limitations:
a lack of representative Medicaid claims data for two awardees (CLTCEC and DDHS).
fewer than eight quarters (two years) of claims data available for one or more outcome measures forseven awardees.
five awardees (CKRI, DDHS, JHU SON, LifeLong, St. Francis) where a small analytic sample size(defined as fewer than 300 beneficiaries or beneficiary-episodes, depending on the evaluation design)means that an analysis is underpowered, and its findings should be interpreted with caution.
Conclusions
Overall, we conclude that there are important hospital- and community-based models within the complex/high-risk patient targeting portfolio worth highlighting.
Among the 15 awardees included in the Addendum Report:
■ Six awardee innovation or intervention arms demonstrate Medicare or Medicaid cost savings,where claims data cover a substantial portion of the initial performance period (at least 60percent).
■ Three awardees (PCCSB, PPMC ED Guides, St. Francis hospital arm) demonstrate improvedutilization and/or quality of care, without statistically significant changes in total cost of care; theclaims used to develop estimates represent over 60 percent of the awardee’s initial performanceperiod, indicating that these estimates are likely representative of overall performance. A fourthawardee (DDHS) exhibits decreased ED visits without change in cost to care, but the Medicaidclaims are likely not fully representative of beneficiary experience, as NORC did not have accessto claims for one of the two states where the intervention was implemented.
These findings are corroborated by qualitative assessments and survey findings presented in NORC’s Third Annual Report.

NORC | HCIA Complex/High-Risk Patient Targeting
ADDENDUM TO THE THIRD ANNUAL REPORT | 17
Introduction and Methods
This report is an addendum to NORC’s Third Annual Report (February 2017) produced as part of our evaluation of 23 of the first-round Health Care Innovation Award (HCIA One) interventions, under contract with the Center for Medicare & Medicaid Innovation (CMMI). The 23 awardees are in the Complex/High-Risk Patient Targeting (CHRPT) portfolio, serving patients who live in the community and who have multiple chronic conditions (MCC) that put them at higher than average risk for hospitalization or re-admission.2 The Addendum offers an update to our evaluation. The 15 awardees in this Addendum report include 12 that had no-cost extensions (NCEs) beyond a one- to three-month close-out period, where available claims data could be updated from those used for NORC’s Third Annual Report. Two awardees that received NCEs are not included in this Addendum (UAMS and UT Houston), as updated claims data were not available (UT Houston) and UAMS’s extension was for close-out activities. In addition, we include three awardees that did not receive an NCE and present either new subgroup analyses based on claims (Sutter Health, U North Texas) or analyses based on claims data newly available for the initial period of performance (PPMC).
Our evaluation, like those of the other front-line evaluators for HCIA One, is guided by an overarching evaluation research design developed during the first year of the HCIA funding period, including a logic model, conceptual framework, core research questions, and methodological approach. This general evaluation framework allows for customization that reflects the particular characteristics of each awardee. Consistency in approach and shared learning across evaluators is supported by an Evaluators’ Collaborative and by the concurrent development of a meta-evaluation. The HCIA One evaluations share the same set of broad objectives, namely, to document:
■ implementation effectiveness and efficiency;
■ program effectiveness, for cost, utilization, quality, and health outcomes;
■ effectiveness of workforce training programs;
■ impact on priority populations, for outcomes and cost; and
■ contextual factors that affect performance, both endogenous (internal to the awardee) andexogenous (external to the awardee).
Key outcomes of interest (e.g., core measures) include total cost of care, utilization (all-cause hospital admissions, emergency department visits, hospital readmissions), quality of care (e.g., ambulatory care-sensitive hospitalizations, practitioner follow-up visits post-hospital discharge, potentially avoidable hospitalizations), and patient health and well-being. Four of the awardees are implementing innovations that have two or more distinct programs or arms, each of which is assessed separately. These awardees include J-CHiP (post-acute care or hospital-based arm and ambulatory care community arm), PPMC (NORC’s evaluation considers the six arms for which adequate claims data are available), St. Francis (post-acute care or hospital-based arm and ambulatory care community arm), and U North Texas
2 In addition to the 23 awardees assigned to the CHRPT evaluation, the remaining awardees are grouped in evaluation portfolios of disease-specific interventions, behavioral health, primary care redesign, community-based interventions, hospital-based interventions, and medication management and shared decision making.

NORC | HCIA Complex/High-Risk Patient Targeting
ADDENDUM TO THE THIRD ANNUAL REPORT | 18
(implementation in skilled nursing facilities, assisted living/memory care residences, and independent living residences).
This report includes a brief overview of the complex high-risk awardee portfolio; 15 awardee chapters, each in the form of a case study; and supporting appendices. See Exhibit 1.1 for a list of the 23 awardees in the Complex/High-Risk Patient Targeting portfolio, noting funding amounts and length of no-cost extension period where awarded.3 Awardees included in the Addendum Report are denoted with a symbol (§).
3 Awardee self-reported data through June 30, 2016 (HCIA Reporting Quarter 16) indicates that all awardees had spent 75 percent or more of their award and 14 awardees spent 90 percent or more of their award.

NORC | HCIA Complex/High-Risk Patient Targeting
ADDENDUM TO THE THIRD ANNUAL REPORT | 19
Exhibit 1.1: The Complex/High-Risk Patient Targeting Awardees
Awardee (§ = included in Addendum Report)
Funding Amount Intervention State(s)
No-cost Extension (# Months)
Beth Israel Deaconess Medical Center (BIDMC) $4,937,189 Post-Acute Care Transitions MA 0
California Long-Term Care Education Center (CLTCEC) § $11,831,443 Care Team Integration of the Home-
Based Workforce CA 7
Community Care of North Carolina (CCNC) $9,327,422 Child Health Accountable Care
Collaborative NC 0
Courage Kenny Rehabilitation Institute (CKRI) § $1,767,667 Advanced Primary Care Clinic MN 12
Developmental Disabilities Health Services (DDHS) § $3,701,525 Developmental Disabilities Health
Home NJ, NY 6
Johns Hopkins University (J-CHiP) § $19,920,338 Community Health Partnership MD 12 Johns Hopkins University School of Nursing (JHU SON) § $4,075,344 Project Community Aging in Place,
Advancing Better Living for Elders MD 6
LifeLong Medical Care (LifeLong) § $1,109,229 LifeLong Comprehensive Care Initiative
CA 6
Northland Healthcare Alliance (Northland) § $2,726,216 Northland Care Coordination for
Seniors ND 12
Palliative Care Consultants of Santa Barbara (PCCSB) § $4,253,215 Doctors Assisting Seniors at Home CA 12
Pittsburgh Regional Health Initiative (PRHI) § $10,412,359 Primary Care Resource Centers PA, WV 8
Providence Portland Medical Center (PPMC) § $17,337,094 Tri-County Health Commons OR 3
South Carolina Research Foundation (SCRF) $2,884,719 HOMECARE+ SC 0
St. Francis Healthcare Foundation of Hawaii (St. Francis) § $5,299,706 Home Outreach Program and E-
Health (H.O.P.E.) HI 12
Sutter Health Corporation (Sutter Health) § $13,000,000 Advanced Illness Management CA 0
University Emergency Medical Services (UEMS) § $2,562,937
Better Health through Social and Health Care Linkages Beyond the Emergency Department
NY 7
University of Arkansas for Medical Sciences (UAMS) $3,518,798 Cost-Effective Delivery of Enhanced
Home Caregiver Training AR, CA, HI, TX 12
University of Iowa Hospitals and Clinics (U Iowa) $7,662,278 Transitional Care Teams IA 0
University of New Mexico Health Sciences Center (U New Mexico) § $8,401,614 Extension for Community
Healthcare Outcomes (ECHO) Care NM 12
University of North Texas Health Science Center (U North Texas) $7,329,714 Brookdale Senior Living Transitions
of Care
CO, FL, KS, TN, TX
0
University of Rhode Island (URI) $10,202,795 Living RIte Centers RI 3 University of Texas Health Sciences Center (UT Houston) $3,701,370 High-Risk Children’s Clinic TX 12
Vanderbilt University Medical Center (VUMC) $2,449,241 Reducing Hospitalizations in
Medicare Beneficiaries KY, TN 0
NORC | HCIA Complex/High-Risk Patient Targeting
ADDENDUM TO THE THIRD ANNUAL REPORT | 20
In this chapter, we present a brief overview of our approach to evaluation, our evaluation methods and data sources, and a top-level overview of the 15 awardees included in this Addendum; please see the technical appendices in NORC’s Third Annual Report for more detail on methods and data sources.
Evaluation Design
As described in our previous HCIA Annual Reports, NORC’s evaluation of the CHRPT awardees utilizes a mixed methods approach, using a multiple-phase case-study design where each of the 23 awardees is one case. The phases include (1) evaluability determination, (2) concurrent primary (qualitative and survey) and secondary (claims, electronic health records, administrative records) data collection and analysis, and (3) mixed qualitative and quantitative data analysis and interpretation. Exhibit 1.2 depicts the conceptual framework for our evaluation. To date, we have prepared nine quarterly reports—offering rapid-cycle feedback on an ongoing basis—and three summative, public annual reports.4
Fourteen of the 23 awardees operated beyond June 30, 2015 using HCIA One funds, under no-cost extensions (NCEs) granted for up to 12 months each (through June 30, 2016). For two of these awardees (URI, PPMC), the NCE was granted for close-out purposes only (one to three months) and did not involve ongoing delivery of HCIA-supported services. In this Addendum, we analyze the claims experience of the 12 awardees granted an NCE of six or more months, where most continued to enroll and/or serve beneficiaries. For the remaining three awardees, we present either new subgroup analyses based on claims or analyses based on claims data newly available that cover the initial period of performance.5
4 NORC has submitted quarterly reports for use by CMMI and the awardees, as follows: First (March 2014), Second (June 2014), Third (September 2014), Fourth (December 2014), Fifth (March 2015), Sixth (June 2015), Seventh (September 2015), Eighth (January 2016), and Ninth (April 2016). 5 One awardee (UT Houston) received a no-cost extension but is not included in this report, as NORC was not able to obtain updated Medicaid claims data, beyond what was used to prepare estimates in our Third Annual Report.

NORC | HCIA Complex/High-Risk Patient Targeting
ADDENDUM TO THE THIRD ANNUAL REPORT | 21
Exhibit 1.2: Conceptual Framework, Evaluation of the CHRPT Portfolio of HCIA Awardees

NORC | HCIA Complex/High-Risk Patient Targeting
. ADDENDUM TO THE THIRD ANNUAL REPORT | 22
Quantitative Methods (Claims Based Analyses)
Our evaluation uses Medicare and Medicaid claims data to assess the impact of awardee programs on measures of health care cost, utilization, and quality of care.6 In general, our approach involves linking identifying information for program enrollees to their Medicare and/or Medicaid claims using information provided by the awardees (a finder file). This information allows us to compare the experiences of beneficiaries and comparison groups both before (pre) and after (post) implementation of the HCIA-supported intervention, enabling evaluation of HCIA interventions contrasted with usual care. In cases where we have both pre- and post-intervention data for both groups, we use a difference-in-differences (DID) design. If we lack baseline data for the awardee’s treatment or comparison group, we use a longitudinal (time series) two-sample design for comparison. For more details on the evaluation design, please refer to NORC’s Third Annual Report.7
Data Sources
Exhibit 1.3 summarizes the evaluation design and data sources available in this report. Analyses are included for 15 of the 23 awardees in the Complex/High-Risk Patient Targeting portfolio. These include the following:
■ 12 awardees with no-cost extensions beyond close out of the initial period of performance whereadditional claims data are available to NORC
■ one awardee (PPMC) that did not receive a no-cost extension but that does have updated claimsdata
■ two awardees (Sutter Health, U North Texas) for which new subgroup analyses are conductedusing the same pool of claims data as was used in NORC’s Third Annual Report.8
We assess program effectiveness using Medicare claims only (seven awardees), Medicaid encounter/claims data only (five awardees), or both Medicare and Medicaid claims (three awardees). Unless otherwise noted, all claims-based analyses use one or more external comparison groups.
6 The time period of claims data collection varies by awardee. The specific claims period is identified in each awardee-specific chapter. 7 Third Annual Report. HCIA Complex/High-Risk Patient Targeting. 2017. Available at: https://downloads.cms.gov/files/cmmi/hcia-chspt-thirdannualrpt.pdf . 8 Available at: https://downloads.cms.gov/files/cmmi/hcia-chspt-thirdannualrpt.pdf .

NORC | HCIA Complex/High-Risk Patient Targeting
. ADDENDUM TO THE THIRD ANNUAL REPORT | 23
Exhibit 1.3: Data Source and Evaluation Design for Addendum, by Awardee
Awardee Intervention Type
Claims Data Source for Addendum Report Medicare Medicaid
CLTCEC Ambulatory care ■
CKRI Ambulatory care ■ ■
DDHS Ambulatory care ■
J-CHiP PAC/Ambulatory ■ ■
JHU SON Ambulatory care ■ ■
LifeLong Ambulatory care ■
Northland Ambulatory care ■
PCCSB Ambulatory care ■
PRHI PAC ■
PPMC Ambulatory care ■
St. Francis PAC/Ambulatory ■
Sutter Health Ambulatory care ■
UEMS Ambulatory care ■
U New Mexico Ambulatory care ■
U North Texas PAC/Ambulatory ■
Measures of Program Effectiveness
Our analyses estimate the impact of the interventions on measures of cost, utilization, and quality of care. For awardees with Medicare or Medicaid claims data, we assess impact on four core measures. For more details on core and supplemental measures, please refer to NORC’s Third Annual Report.9 Exhibit 1.4 summarizes the claims-based measures used to evaluate each of the awardee programs.
9 Available at: https://downloads.cms.gov/files/cmmi/hcia-chspt-thirdannualrpt.pdf .

NORC | HCIA Complex/High-Risk Patient Targeting
. ADDENDUM TO THE THIRD ANNUAL REPORT | 24
Exhibit 1.4: Claims-Based Measures of Program Effectiveness, by Awardee
Awardee
Evaluation Design
(C=community, H=hospital)
Claims Data
Outcome Measures
CMMI Core Measures Supplemental Measures MDS
Tota
l Cos
t of C
are
Hos
pita
lizat
ions
Emer
genc
y D
epar
tmen
t Vis
its
Rea
dmis
sion
s
Am
bula
tory
Car
e-se
nsiti
ve
Hos
pita
lizat
ions
Pote
ntia
lly
Avo
idab
le
Hos
pita
lizat
ions
Prac
titio
ner F
ollo
w-
up V
isits
Urin
ary
Trac
t In
fect
ions
Falls
Res
ultin
g in
In
jury
CLTCEC C Medicare ■ ■ ■ ■ ■
CKRI C Medicare ■ ■ ■ Medicaid ■ ■ ■
DDHS C Medicaid ■ ■ ■
J-CHiP H
Medicare ■ ■ ■ ■ ■ Medicaid ■ ■ ■ ■ ■
C Medicare ■ ■ ■ ■ ■ Medicaid ■ ■ ■ ■ ■
JHU SON C Medicare ■ ■ ■ ■ ■ Medicaid ■ ■ ■
LifeLong C Medicaid ■ ■ ■ ■ Northland C Medicare ■ ■ ■ ■ ■ PCCSB C Medicare ■ ■ ■ ■ ■ PRHI H Medicare ■ ■ ■ ■ ■
PPMC
C (Health Resilience)
Medicaid
■ ■ ■
C (New Directions)
■ ■ ■
C (ED Guides) ■ ■ ■ C (Standard Transitions)
■ ■ ■
C (C-TRAIN) ■ ■ ■ C (ITT) ■ ■ ■
St. Francis H
Medicare ■ ■ ■ ■ ■
C ■ ■ ■ ■ ■ Sutter Health C (EOL) Medicare ■ ■ ■ UEMS C Medicaid ■ ■ ■ ■ ■ U New Mexico C Medicaid ■ ■ ■ ■ ■ U North Texas H (SNF) Medicare ■ ■
NOTES: EOL = end of life analysis, SNF = skilled nursing facility analysis
Analytic Methods
For awardees with an external comparison group, and data on both pre- and post- intervention periods, we use difference-in-differences (DID) analyses to assess program effectiveness. For more details on the DID design and methods, please refer to NORC’s Third Annual Report.10

NORC | HCIA Complex/High-Risk Patient Targeting
. ADDENDUM TO THE THIRD ANNUAL REPORT | 25
Qualitative and Survey Methods
The interpretation of claims-based findings draws on the evaluation’s assessment of qualitative and survey data, presented in previous NORC reports to CMMI. For nine awardees (CLTCEC, CKRI, J-CHiP, Northland, PCCSB, PRHI, St. Francis, U New Mexico, UT Houston), additional awardee self-reported data to CMMI is used in this report, beyond self-reports used to prepare NORC’s Third Annual Report; see the awardee chapters that follow for more information about updated information or analyses submitted by each awardee. Please see NORC’s Third Annual Report for a summary of primary data collection and analytic methods.
Rapid Cycle Evaluation: Revising Issues of Feasibility and Evaluability
In NORC’s Third Annual Report to CMMI, we characterize several challenges to evaluability faced by NORC and the other front-line evaluators, revisiting these challenges from the perspective of the final months of our evaluation, with attention to the feasibility of rapid-cycle evaluation for innovations that serve medically high-risk groups and limitations on our findings that result from these challenges to evaluability.
Exhibit 1.5 provides an overview of the representativeness of claims data available to NORC to date, approximating the scope or extent of challenges to evaluability. NORC did not validate awardee self-reported data on payer source. These data are not cumulative (such data are unavailable) but, rather, a snapshot of those beneficiaries served in the most recent HCIA reporting quarter for which awardee self-reported data are available (Q12 for awardees without a no-cost extension; Q12, Q13, or Q14 for those that have been awarded an NCE, depending on the final quarter in which services are delivered). We note the following three challenges to our claims-based analyses and the awardees to whom these challenges are relevant:
■ Representative claims data are not available or useable: DDHS (no Medicaid claims forbeneficiaries enrolled in one of two states where implementing) and CLTCEC (Medicaidmanaged care health plan data not usable due to limitations including low sample size and lack ofusable cost data, revenue codes, and zip codes). Limited Alpha-MAX data also constrainsMedicaid analyses for a number of awardees; see Appendix C for more information.
■ Fewer than eight quarters (two years) of claims data are available for one or more measures:CLTCEC, DDHS, LifeLong, PCCSB, PPMC, St. Francis, and U New Mexico.
■ Small analytic sample size (defined as <300 beneficiaries or beneficiary-episodes): CKRI,DDHS, JHU SON, LifeLong, and St. Francis.
10 Available at: https://downloads.cms.gov/files/cmmi/hcia-chspt-thirdannualrpt.pdf .

NORC | HCIA Complex/High-Risk Patient Targeting
ADDENDUM TO THE THIRD ANNUAL REPORT | 26
Exhibit 1.5: Challenges to Evaluability: Representativeness of Claims Data, By Awardee
Awardee
Evaluation Design (H=Hospital,
C=Community)
Awardee Self-Reported Data§ NORC Analysis Payers (%)
Reach Report to
CMMI Claims Data
Quarters of Claims Data§§
Analytic Sample Size§§§
CLTCEC C 16% 21% 24% 6,598 Q14 Medicare 10 1,017
CKRI C 23% 19% 39% 143 Q14 Medicare 10 66 Medicaid 14 188
DDHS C 4% 46% 48% 514 Q14 Medicaid 6 151
J-CHiP H
35% 24% 6% 80,257 Q12
Medicare 8 26,144 Medicaid 8 13,921
C Medicare 9-11 2,154 Medicaid 9 2,532
JHU SON C 0% 0% 100% 258 Q13 Medicare 10-12 171 Medicaid 8-10 177
LifeLong C 2% 68% 30% 317 Q12 MediCal 9-10 224 Northland C 85% 1% 10% 913 Q15 Medicare 11 529 PCCSB C 1% 0.3% 13% 1,658 Q15 Medicare 10-14 1,260 PRHI H 30% 10% 10% 7,689 Q14 Medicare 11 5,926
PPMC
C (HRP)
0% 69% 19% 15,421 Q12
Medicaid 11 1,337 C (New Directions) Medicaid 8 173 C (ED Guides) Medicaid 2 4,822 C (Standard Transitions) Medicaid 2 3,705 C (C-TRAIN) Medicaid 2 604 C (ITT) Medicaid 2 583
St. Francis H 36% 16% 1% 1,803 Q15 Medicare 11-12 153 C Medicare 9-11 252
Sutter Health C (EOL) 62% 7% 9% 9,406 Q12 Medicare 3,705 UEMS C 0% 100% 0% 4,315 Q13 Medicaid 10 1,033 U New Mexico C 0% 100% 0% 746 Q15 Medicaid 9-10 719 U North Texas H (SNF) data not available Q12 Medicare 9-10 6,661 NOTES: Subgroup analyses are included only if the primary analysis for an awardee. Shaded cells indicate fewer than 8 quarters of claims data or analytic sample size <300 beneficiary-episodes or beneficiaries. §Awardee’s self-reported data to CMMI, for most recent quarter in which services delivered to beneficiaries (through HCIA Reporting Quarter 14). §§Number of quarters may vary by measure. §§§Unit is beneficiary-episodes for hospital design and beneficiaries for community design.
Med
icar
e
Med
icai
d
Both (Dually-Eligible)

NORC | HCIA Complex/High-Risk Patient Targeting
ADDENDUM TO THE THIRD ANNUAL REPORT | 27
Awardee-Level Analyses: Overview
Four years after the launch of first round Health Care Innovation Award projects, what can we conclude about program effectiveness in targeting and delivering services to medically complex beneficiaries, especially in terms of the CMMI core metrics of total cost of care, utilization, and quality of care? This chapter offers a summary of the claims-based updates to NORC’s Third Annual Report, presented in the 15 awardee case studies that follow.
The focus of this Addendum Report is on program effectiveness, as estimated using claims, which comprises one of several evaluation domains; see Exhibit 2.1 for a summary visual depiction of our evaluation conceptual framework. Data from each awardee’s most recent quarterly report to CMMI were used in drafting this report.11 Information presented in the following pages varies by awardee, depending on the evaluation activities completed; see Exhibit 2.2 for a summary by awardee. Each awardee case study includes a one page summary overview, a summary of awardee activities during the no-cost extension period, and presentation of updated claims-based findings.
Exhibit 2.1: Program Effectiveness: A Visual Guide
11 For awardees that did not receive a no-cost extension, the most recent quarterly report to CMMI is for HCIA reporting quarter 12 (time period from April 1 through June 30, 2015). For awardees that have received a no-cost extension, the most recent quarterly report to CMMI may be for HCIA reporting quarter 14, 15, or 16.

NORC | HCIA Complex/High-Risk Patient Targeting
ADDENDUM TO THE THIRD ANNUAL REPORT | 28
Exhibit 2.2: Summary, Awardee Chapter Contents for NORC No-Cost Extension Addendum
Awardee No-
Cos
t Ext
ensi
on?
Program Model
Claims-Based Findings
Data Difference-in-Differences/
Comparison Group
Subgroup Analyses Med
icar
e
Med
icai
d
Propensity Score (PS) Matching
PS Weights (Standard
Mortality Ratio, Relative)
CLTCEC ■ Train Home Care Workers C ■ ■ Impact of program in its second year
CKRI ■ Integrated Care Delivery C ■ ■ ■ ■
DDHS ■ Disability Medical Home C ■ ■
J-CHiP ■
Transitional Care, Integrated Care Delivery, Care Coordination
H
■ ■ Impact on more detailed cost categories
■ ■ Dually-eligible Beneficiaries Impact on more detailed cost categories
Care Coordination, Outreach, Patient Navigation C
■ ■ Program and Dose
■ ■ Program and Dose Dually-eligible Beneficiaries
Cross-over: Transitional Care Followed by Outpatient Care Coordination
H ■ ■
Impact on beneficiaries receiving hospital arm, followed by enrollment in community arm within 30 days of discharge.
JHU SON ■ Home Care C ■ ■ ■ ■
LifeLong ■ Care Coordination, Independent Living Skills, Patient Navigation C ■ ■
Northland ■ Care Coordination C ■ ■ PCCSB ■ ED Diversion, Advance Care Planning C ■ ■
PRHI ■ Transitional Care, Patient Engagement, Pharmacy
H
■ ■ Stratified by diagnosis: AMI, CHF, COPD
H (180 days
post-enroll)
PPMC
Health Resilience Program
C ■ ■ New Directions ED Guides Standard Transitions
Evaluation Design§
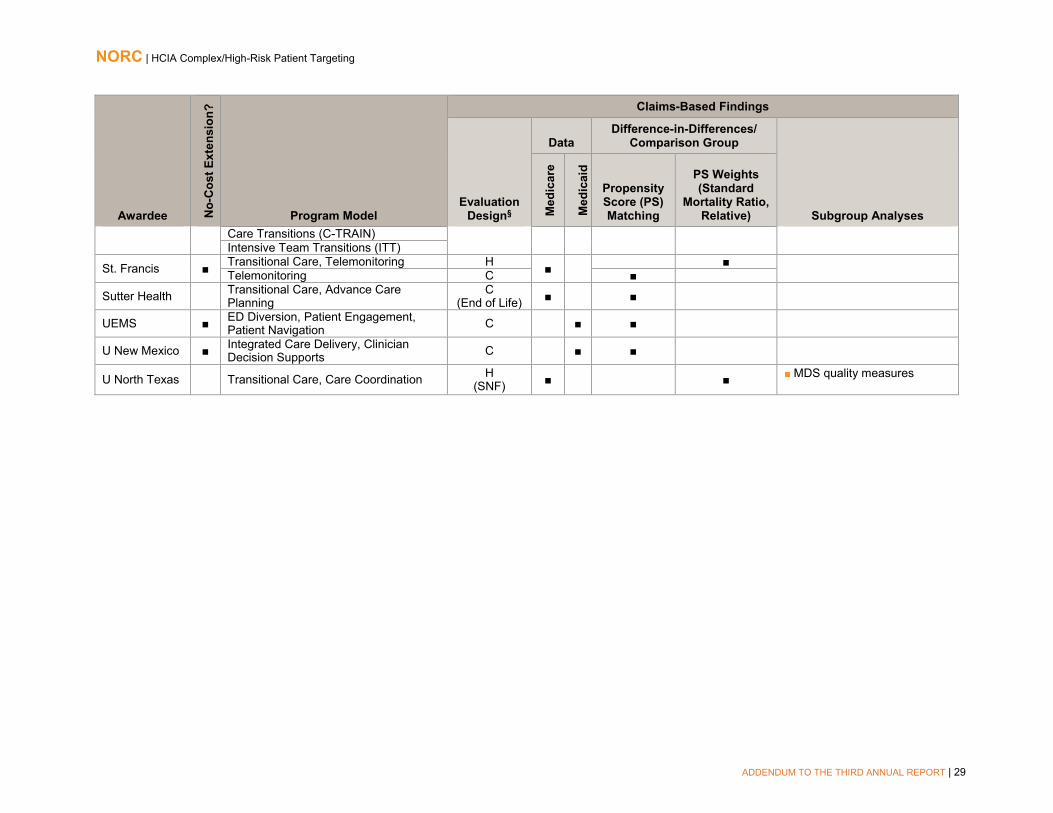
NORC | HCIA Complex/High-Risk Patient Targeting
ADDENDUM TO THE THIRD ANNUAL REPORT | 29
Awardee No-
Cos
t Ext
ensi
on?
Program Model
Claims-Based Findings
Evaluation Design§
Data Difference-in-Differences/
Comparison Group
Subgroup Analyses Med
icar
e
Med
icai
d
Propensity Score (PS) Matching
PS Weights (Standard
Mortality Ratio, Relative)
Care Transitions (C-TRAIN) Intensive Team Transitions (ITT)
St. Francis ■ Transitional Care, Telemonitoring H ■ ■ Telemonitoring C ■
Sutter Health Transitional Care, Advance Care Planning
C (End of Life) ■ ■
UEMS ■ ED Diversion, Patient Engagement, Patient Navigation C ■ ■
U New Mexico ■ Integrated Care Delivery, Clinician Decision Supports C ■ ■
U North Texas Transitional Care, Care Coordination H (SNF) ■ ■ MDS quality measures

NORC | HCIA Complex/High-Risk Patient Targeting
ADDENDUM TO THE THIRD ANNUAL REPORT | 30
California Long-Term Care Education Center
Care Team Integration of the Home-Based Workforce. This program trains pairs of MediCal-enrolled consumers and personal home care attendants (PHCAs) employed as providers to California’s In-Home Support Services (IHSS) program, in three counties. Objectives include improving communication and care coordination across home and clinical settings, and improving chronic disease management for this dually eligible population.
PROGRAM MODELS: Caregiver Education and Support, Home Health/Home Care, Workforce Training
LOCATION: California (Contra Costa, Los Angeles, and San Bernardino Counties)
REACH: 6,602 beneficiaries (100% of target)§
GRANT: $11,831,443 POPULATIONS: Disability, Dually Eligible, Limited English Proficiency, Racial/Ethnic Minority, Urban
AWARD DATES: 7/1/12 to 1/31/16 DATA, ADDENDUM REPORT: Medicare claims (January 2013 to June 2016) NO-COST EXTENSION: 7 month, full program
PAYER(S): Medicare, Medicaid
OUTCOMES§§
Increase in total cost of care ($666 per beneficiary per quarter) Decrease in total cost of care during second year post-enrollment (after seven, eight, and nine quarters)
Increase in hospitalizations overall (16 per 1,000 beneficiaries per quarter) and decreasing trend in hospitalizations during second year post-enrollment
Decrease in ED visits overall (-13 per 1,000 beneficiaries per quarter) and in second year post-enrollment (-22 per 1,000 beneficiaries per quarter)
No findings reach statistical significance
Analysis limited due to challenges related to using Medicaid claims data. §Target is for full performance period, reported through 12/31/2015. §§Outcomes for cost and utilization are from
analyses that include a comparison group and reach statistical significance at the p<0.10 level.
SUMMARY: The CLTCEC intervention is significantly associated with fewer ED visits, relative to the comparison group, and with increased hospitalizations and higher total cost of care. These findings update our understanding as presented in NORC’s Third Annual Report. A non-significant decrease in ED visit rate and a non-significant increase in hospitalizations in the Third Annual Report each gain statistical significance. Cost expenditures reported as significant in the Third Annual Report remain; however, they are now of a smaller magnitude (from $1,175 to $666 per beneficiary per quarter). CLTCEC is an innovation that trains dyads of home health caregivers and their high-risk Medicaid and dually eligible employers (who may be family members). The decrease in ED visits most likely reflects improved communication among caregiver, beneficiary, and clinical team, which has been a key objective for CLTCEC; the increase in hospitalizations and in costs likely reflects the significant health challenges faced by this population, who may experience greater access to care, with attendant increased utilization and cost, with their participation in the intervention. Because these results only represent Medicare beneficiaries, who comprise a small percentage of consumer enrollees in the program, they should be interpreted with caution.

NORC | HCIA Complex/High-Risk Patient Targeting
ADDENDUM TO THE THIRD ANNUAL REPORT | 31
Program Effectiveness
We present results of quarterly fixed effects (QFE) difference-in-differences (DID) analyses for Medicare fee-for-service (FFS) beneficiaries enrolled in CLTCEC’s training program from October 15, 2012, through June 30, 2016, relative to a comparison group.12 This analysis includes two additional quarters of claims data, compared with the analysis presented in NORC’s Third Annual Report.
We find that the CLTCEC intervention is significantly associated with fewer ED visits, relative to the comparison group, and is significantly associated with increased hospitalizations and higher total cost of care. These findings update our understanding of the impact of CLTCEC’s program as presented in NORC’s Third Annual Report. A non-significant decrease in ED visit rate and a non-significant increase in hospitalizations in the Third Annual Report each gain statistical significance. Cost expenditures reported as significant in the Third Annual report remain; however, they are now of a smaller magnitude (from $1,175 to $666 per beneficiary per quarter). Because these results only represent Medicare beneficiaries, who comprise a small percentage of consumer enrollees in the program, these results should be interpreted with caution.
Core and Supplemental Measures: Medicare
Our community (ambulatory care) analysis compares the experience of CLTCEC-enrolled beneficiaries with those of a matched group of comparators. It considers the impact on cost of care and utilization of CLTCEC’s training program over the enrollment period as a whole and in each quarter of enrollment. Our analysis is for Medicare FFS beneficiaries, comprising 5 percent of the awardee’s targeted patients.13 About 20 percent of CLTCEC-enrolled beneficiaries are reported to have Medi-Cal coverage and another 17 percent are identified as dually eligible, NORC’s capacity to use Medicaid claims to evaluate CLTCEC is limited by our lack of complete claims or encounter data. Due to capitation arrangements in the state of California, the Medicaid claims experience captured a limited portion of the claims experience for CLTCEC participants.14
Finder File and Creation of Analytic Sample. CLTCEC provided a finder file of program participants and enrollment dates, enabling us to use Medicare claims for these beneficiaries to calculate outcome
12 The awardee completed training under HCIA support on November 15, 2015 and reported plans to continue recruiting and training providers starting in March 2016, using curriculum developed under HCIA funding. Our analysis considers claims for the first two quarters of 2016, with the expectation that training program impacts would continue to be experienced following the completion of HCIA-supported training. 13 Estimated percentage of Medicare FFS participation comes from the awardee’s self-reported data, as presented in the HCIA Fourteenth Quarterly Reporting Period (Q14), October, November, and December 2015. Submitted to CMMI by California Long-Term Care Education Center (SEIU-ULTCW), March 2, 2016. The report notes that insurance type is unknown for almost 56 percent of enrolled beneficiaries. Given that our analytic sample comprises 1,017 beneficiaries with Medicare FFS, we expect that many beneficiaries with insurance type as “unknown” are actually enrolled in Medicare FFS. 14 NORC’s feasibility assessment of Medi-Cal claims data shared by six CLTCEC health plan partners found utilization rates of less than 10 percent, relatively low counts of CLTCEC-enrolled beneficiaries and comparators, and a lack of usable cost data, revenue codes, and geographic identifiers. See NORC’s Third Annual Report, pages 69-70 for more information.
Measures (per 1,000 beneficiaries unless noted) Total Cost of Care per beneficiary All-cause Hospitalizations Emergency Department (ED) Visits 30-day Readmissions Ambulatory Care Sensitive (ACS) Hospitalizations

NORC | HCIA Complex/High-Risk Patient Targeting
ADDENDUM TO THE THIRD ANNUAL REPORT | 32
measures.15 We identified 2,097 unique participants in the CLTCEC program and further limited this number by enrollment date and Medicare identifiers, yielding an analytic sample of 1,017 beneficiaries.
Comparison Group. The comparison pool consist of patients in the IHSS program for California whose caregivers did not receive training through the CLTCEC program.16 We use propensity score matching to find appropriate comparators.17 The final propensity model include age, race, gender, disability status, comorbidities, and prior utilization (hospitalizations and ED visits) and cost. Tests of common support and covariate balance across treatment and comparison groups indicate that propensity score matching improves comparability.18
Descriptive Characteristics. Exhibit CLTCEC.1 displays the descriptive characteristics of beneficiaries in the treatment and comparison group, with respect to demographics, comorbidities, and prior utilization.19 We observe few significant differences in demographics, comorbidities, or prior utilization measures between CLTCEC participants and comparators, although CLTCEC participants are more likely to be Hispanic than comparators (p<0.01).
Exhibit CLTCEC.1: Descriptive Characteristics for CLTCEC Program Participants and Comparison Participants
Variable CLTCEC Comparison Number of Persons 1017 1017 Mean Number of Quarters Enrolled [Range] 5.0 [1 - 12] 5.0 [1 - 12] Gender % (N) Female 69.3 (705) 71.0 (722) Age Group % (N) <65 years old 17.1 (174) 15.2 (155) 65-74 years old 19.0 (193) 20.4 (207) 75-84 years old 39.6 (403) 39.3 (400) ≥85 years old 24.3 (247) 25.1 (255) Race/Ethnicity % (N) *** White 35.6 (362) 36.6 (372)
15 Medicare claims are available through September 30, 2016, for the analysis in this report. We used June 30, 2016, as the cut-off date to account for the 90-day claims runoff. Although CLTCEC received a 7 month NCE (ending January 30, 2015), we continue analysis beyond that period. CLTCEC’s HCIA-funded program provided training for caregivers, and those caregivers continued to support participants beyond the funding period; thus, we include claims from participants who received support from trained caregivers for as many quarters as data is available. 16 The mixed quality of identifiers across health plans means that not all health plans are equally represented in this analysis. Of the 5,761 unique consumer IDs provided by CLTCEC for patients in the six health plans (IEHP, Care1st, Contra Costa, HealthNet, Molina, L.A.Care), we were only able to link Medicare identifiers for 2,097 unique Medicare patients. Due to the heavy Medicare managed care penetration in California, approximately 50 percent had Medicare FFS during the appropriate time period to be included in the evaluation. As a result, we see the following percentage of each health plan’s enrolled beneficiaries represented in our assessment: 100 percent of Care1st enrollees, 40 percent of HealthNet enrollees, 34 percent of L.A. Care enrollees, 3 percent of IEHP enrollees, and zero percent of Contra Costa’s enrollees and Molina’s enrollees. 17 For more information on our propensity score matching methodology, please see NORC’s Third Annual Report, Appendix C. 18 For more detailed information on propensity score matching and tests of common support and covariate balance for this awardee, please see Appendix D. 19 We tested differences between these groups with a t-test for continuous measures (comorbidities and utilization in the year prior to program enrollment) or a chi-square test for categorical parameters (gender, age, race, dual eligibility, and coverage reason).

NORC | HCIA Complex/High-Risk Patient Targeting
ADDENDUM TO THE THIRD ANNUAL REPORT | 33
Variable CLTCEC Comparison Black 7.0 (71) 6.5 (66) Asian 30.8 (313) 31.0 (315) Hispanic 21.7 (221) 16.5 (168) Other 4.9 (50) 9.4 (96) Dual Eligibility % (N) Dual Enrolled 99.8 (1015) 99.4 (1011) Coverage Reason % (N) Age 74.3 (756) 76.1 (774) Disability 23.0 (234) 21.9 (223) ESRD 1.4 (14) 0.8 (8) Disability and ESRD 1.3 (13) 1.2 (12) Hierarchical Chronic Conditions (HCC) Mean HCC Score (Standard Deviation) 1.9 (1.4) 2.0 (1.5) Mean Count of HCCs (SD) 3.1 (2.7) 3.1 (2.6) Mean Utilization and Cost in Year Prior to Program Enrollment (per 1,000 beneficiaries unless noted) Total Medicare Cost per beneficiary (SD) $18,150 ($29,887) $18,859 ($32,157) Hospitalizations (SD) 403.1 (920.4) 440.5 (964.2) ED Visits (SD) 482 (1336) 408 (920)
NOTE: *p<0.10, **p<0.05, ***p<0.01.
Impact of CLTCEC Program. Exhibit CLTCEC.2 displays the estimated impact of the CLTCEC innovation on its participants relative to the comparison group, for an average implementation quarter and in aggregate, for all participants over time.20 Utilization measures are reported as binary indicators, noting whether an event occurred in each quarter for a specific beneficiary (beneficiary-quarter). We find the following for the CLTCEC program, relative to the comparison group:
■ Cost: A significant increase in total cost of care ($666 per beneficiary per quarter).
■ Utilization Measures: A significant decrease in ED visits (-13 per 1,000 beneficiaries per quarter) and a significant increase in hospitalizations (16 per 1,000 beneficiaries per quarter).
■ Quality of Care: A non-significant increase in ACS hospitalizations.
20 Adjustment factors include age category, gender, race/ethnicity, HCC score, and disability indicator. Results are interpreted as significant where p<0.10.

NORC | HCIA Complex/High-Risk Patient Targeting
ADDENDUM TO THE THIRD ANNUAL REPORT | 34
Exhibit CLTCEC.2: Impact of the CLTCEC Program on Outcomes
AVERAGE QUARTERLY IMPACT§ Outcome Measure
(per 1,000 beneficiaries unless noted) Adjusted Estimate
90% Confidence Interval
80% Confidence Interval
Total Cost of Care per beneficiary ($) $666 * $46, $1,286 $183, $1,149
Hospitalizations 16 * 3, 29 6, 26
ED Visits -13 ** -24, -2 -21, -5
30-Day Readmissions 8 -44, 60 -32, 48
ACS Hospitalizations 4 -3, 11 -1, 9
AGGREGATE IMPACT§§
Outcome Measure Adjusted Estimate
90% Confidence Interval
80% Confidence Interval
Total Cost of Care ($) $3,353,977 * $233,649, $6,474,305 $922,208, $5,785,746
Hospitalizations 79 * 12, 146 26, 132
ED Visits -68 ** -122, -14 -110, -26
30-Day Readmissions 4 -20, 28 -15, 23
ACS Hospitalizations 19 -14, 52 -7, 45
NOTE: +p<0.20, *p<0.10, **p<0.05, ***p<0.01. Bold font indicates findings that are statistically significant at p<0.10. §Quarterly impact is the average quarterly DID estimate per quarter of program enrollment. §§Aggregate impact is the total DID estimate for all program participants across all observed quarters of program enrollment. Aggregate impact is estimated for this awardee based on the total number of program participants (1,017), with an average length of enrollment of 5.0 quarters. Please note that the estimate for aggregate impact may be smaller thant the estimate for average quarterly impact if there are fewer than 1,000 enrolled beneficiaries, as the aggregate estimate is equal to the average quarterly estimate multipled by the sample size in each quarter, divided by 1,000. Disclaimer: Standard statistical practice is to use confidence intervals of 90% or higher. 80% confidence intervals are provided here for comparison purposes.
Impact of the CLTCEC Program in Each Quarter of Enrollment. Findings from a quarterly fixed effects (QFE) DID model of impact in each enrollment quarter—rather than in an average quarter— indicated mixed impacts.21 Exhibit CLTCEC.3 displays the results of the QFE DID model for CLTCEC program participants, relative to a comparison group.22 We find the following, relative to the comparison group:
■ Cost: A statistically significant decrease in total cost of care in quarters I7-I9.
■ Utilization Measures: Multiple quarters with significant decreases for hospitalizations and ED visits. In quarters I4-I9, there is a decreasing trend in hospitalizations.
■ Quality of Care Measures: No trend in ACS hospitalizations across the post-intervention period.
21 For a more detailed explanation of the QFE DID mode and measure specification, please see NORC’s Third Annual Report, Appendix C. Average quarterly impact is estimated by taking a weighted average of the ten QFE DID estimates presented here. 22 For utilization measures, the effect is displayed as the average difference between treatment and comparison per 1,000 beneficiaries for each quarter during the post-intervention (I1–I10) period, after adjusting for pre-intervention differences between the two groups. For total cost of care, this effect is displayed per beneficiary. We present both 90% confidence intervals (indicated by vertical lines around the estimate) and 80% confidence intervals (indicated by shaded boxes around the estimate). Results are interpreted as significant where p<0.10.

NORC | HCIA Complex/High-Risk Patient Targeting
ADDENDUM TO THE THIRD ANNUAL REPORT | 35
Exhibit CLTCEC.3: Impact of CLTCEC Program on Outcomes, by Quarter
Disclaimer: Standard statistical practice is to use confidence intervals of 90% or higher. 80% confidence intervals are provided here for comparison purposes.

NORC | HCIA Complex/High-Risk Patient Targeting
ADDENDUM TO THE THIRD ANNUAL REPORT | 36
Subgroup Analysis: Impact of CLTCEC Program in its Second Year. Because we observed statistically significant decreases in selected post-intervention quarters for total cost of care, hospitalizations, and ED visits, we conduct a sensitivity analysis. Exhibit CLTCEC.4 displays the average quarterly and aggregate impact for beneficiaries in the second year after program enrollment. 23 We find the following for the CLTCEC program, relative to the comparison group:
■ Cost: A non-significant decrease in total cost of care.
■ Utilization Measures: A significant decrease in ED visits (-22 per 1,000 beneficiaries per quarter), a non-significant decrease in hospitalizations, and a non-significant increase in 30-day readmissions.
■ Quality of Care: A small non-significant increase in ACS hospitalizations.
Exhibit CLTCEC.4: Impact of CLTCEC Program on Outcomes, Second Year after Program Enrollment
AVERAGE QUARTERLY IMPACT§ Outcome Measure
(per 1,000 beneficiaries unless noted) Adjusted Estimate
90% Confidence Interval
80% Confidence Interval
Total Cost of Care per beneficiary ($) -$475 -$1,181, $231 -$1,025, $75
Hospitalizations -5 -23, 13 -19, 9
ED Visits -22 ** -38, -6 -35, -9
30-Day Readmissions 41 -33, 115 -16, 98
ACS Hospitalizations 2 -8, 12 -6, 10
AGGREGATE IMPACT§§
Outcome Measure Adjusted Estimate
90% Confidence Interval
80% Confidence Interval
Total Cost of Care ($) -$689,225 -$1,712,747, $334,297 -$1,486,887, $108,437
Hospitalizations -7 -33, 19 -27, 13
ED Visits -31 ** -55, -7 -49, -13
30-Day Readmissions 5 -5, 15 -3, 13
ACS Hospitalizations 2 -12, 16 -9, 13
NOTE: +p<0.20, *p<0.10, **p<0.05, ***p<0.01. Bold font indicates findings that are statistically significant at p<0.10. §Quarterly impact is the average quarterly DID estimate per quarter of program enrollment. §§Aggregate impact is the total DID estimate for all program participants across all observed quarters of program enrollment. Aggregate impact is estimated for this awardee based on the total number of program participants (1,017), with an average length of enrollment of 4.0 quarters. Please note that the estimate for aggregate impact may be smaller thant the estimate for average quarterly impact if there are fewer than 1,000 enrolled beneficiaries, as the aggregate estimate is equal to the average quarterly estimate multipled by the sample size in each quarter, divided by 1,000. Disclaimer: Standard statistical practice is to use confidence intervals of 90% or higher. 80% confidence intervals are provided here for comparison purposes.
23 Adjustment factors include age category, gender, race/ethnicity, HCC score, and disability indicator. Results are interpreted as significant where p<0.10.

NORC | HCIA Complex/High-Risk Patient Targeting
ADDENDUM TO THE THIRD ANNUAL REPORT | 37
Summary
Our claims-based analysis of the CLTCEC program shows significant decreases in ED visits, as well as significant increases for hospitalizations and total cost of care for program participants, relative to a comparison group. When looking at the second year of the program only (quarters I5-I8), there is a significant decrease in ED visits, and non-significant decreases in hospitalizations and total cost of care.
These findings update our understanding of the CLTCEC program’s impacts as presented in NORC’s Third Annual Report. An earlier finding of a non-significant decrease in ED visits gains significance; cost expenditures remain significant but the magnitude of the cost decreases (from $1,175 to $666); and the finding of increased hospitalizations becomes statistically significant. However, all findings should be interpreted with caution as they are based on Medicare data only, and Medicare beneficiaries represent a small proportion of the target population.

NORC | HCIA Complex/High-Risk Patient Targeting
ADDENDUM TO THE THIRD ANNUAL REPORT | 38
Courage Kenny Rehabilitation Institute
Advanced Primary Care Clinic. A medical home serves patients with physical disabilities, including spinal cord injury, traumatic brain injury, and musculoskeletal conditions. Primary and specialty care are co-located with referrals for community service and supports and classes taught jointly by a nurse care manager and peer.
PROGRAM MODELS: Care/Case Coordination, Chronic Disease Self-Management, Independent Living Skills Support, Integrated Care Delivery, Telehealth.
LOCATION: Minneapolis, MN REACH: 143 beneficiaries (102% of target)§ GRANT: $1,767,667 POPULATIONS: Disability, Dually Eligible AWARD DATES: 12/27/12 to 6/30/16 DATA, ADDENDUM REPORT: Medicare claims
(January 2013 to June 2016), Medicaid claims (September 2013 to June 2016)
NO-COST EXTENSION: 12 month, full program PAYER(S): Medicare, Medicaid
OUTCOMES§§
Decrease in total cost of care (-$1,643 per beneficiary per quarter, Medicaid)
Decrease in hospitalizations after seven and nine quarters of enrollment (Medicare) Increase in ED visits (47 per 1,000 beneficiaries per quarter, Medicaid)
SUMMARY: CKRI’s Advanced Primary Care Clinic shows evidence of reducing the total cost of care for enrolled beneficiaries and reducing hospitalizations; an increase in emergency department visits is not unexpected, given the innovation’s objective to improve access for a hard-to-reach population with multiple comorbidities. These findings should be interpreted with caution, given the relatively small number of beneficiaries included in our analysis of claims experience, either with Medicare (n=66) or Medicaid (n=188). Our claims-based analyses are in most respects similar to those presented in NORC’s Third Annual Report.
§Target is for initial performance period, through 6/30/2015. §§Outcomes for cost and utilization are from analyses that include a comparison group and reach statistical significance at the p<0.10 level.

NORC | HCIA Complex/High-Risk Patient Targeting
ADDENDUM TO THE THIRD ANNUAL REPORT | 39
Program Effectiveness
We present results of quarterly fixed effects (QFE) difference-in-differences (DID) analyses for Medicare fee-for-service (FFS) and Medicaid beneficiaries in CKRI’s Advanced Primary Care Clinic (APCC) program from January 1, 2013 through June 30, 2016, relative to a comparison group. The Medicare analysis includes one additional quarter of claims, and the Medicaid analysis includes an additional six quarters, compared with the analysis presented in NORC’s Third Annual Report.24 Findings should be interpreted with caution as they are based on very small sample sizes, as noted below.
■ The Medicare analysis identifies non-significant reductions in the cost and small and non-significant increases in ED visits, consistent with the findings presented in NORC’s Third AnnualReport. We also find a small but non-significant decrease in hospitalizations, different from thenon-significant increase presented in NORC’s Third Annual Report.
■ The Medicaid analysis identifies significant reductions in total cost of care of a similar magnitudeand non-significant reductions in hospitalizations, both consistent with the Third Annual Report.However, we see a significant increase in ED visits, a departure from the non-significant increasepresented in NORC’s Third Annual Report.
Core Measures: Medicare
Our community (ambulatory care) analysis compares the experiences of CKRI enrollees with those of a matched group of comparators. It considers the impact on cost and utilization of the awardee’s innovation over the enrollment period and in each quarter of program enrollment. Medicare FFS beneficiaries comprise 23 percent of CKRI’s enrolled beneficiaries.25
Measures (per 1,000 beneficiaries unless noted) Total Cost of Care per beneficiary All-cause Hospitalizations Emergency Department (ED) Visits
Finder File and Creation of Analytic Sample, Medicare. CKRI provided a finder file of APCC program participants and enrollment dates, enabling us to use Medicare claims in the CMS Virtual Research Data Center (VRDC) to calculate outcome measures for the Medicare analysis.26 We identified 188 unique beneficiaries, and further limited this number by enrollment data and Medicare coverage, yielding an analytic sample of 66 beneficiaries.27
24 The awardee reports that delivery of HCIA-supported services to beneficiaries concluded during December 2015, as noted in HCIA Fifteenth Quarterly Reporting Period (Q15) Report, January, February, and March 2016. Submitted to CMMI by the Courage Kenney Rehabilitation Institute –Allina Health, June 1, 2016. 25 The awardee’s self-reported data, as presented in the HCIA Fourteenth Quarterly Reporting Period (Q14), October, November, and December 2015. Submitted to CMMI by the Courage Kenney Rehabilitation Institute – Allina Health, March 2, 2016. 26 Medicare claims are available through September 30, 2016, for the analysis in this report. We used June 30, 2016, as the cut-off date to account for the 90-day claims runoff. 27 The analytic sample size for the Addendum Report is the same as that for the analysis in NORC’s Third Annual Report, which may indicate that our analysis is of the same group of participants, with greater availability of claims data for the Addendum Report analyses. We note the difference between the number of beneficiaries identified on the finder file (N=188) and those reported by the awardee to CMMI (N=143) and are unable to explain this discrepancy.

NORC | HCIA Complex/High-Risk Patient Targeting
ADDENDUM TO THE THIRD ANNUAL REPORT | 40
Comparison Group, Medicare. The comparison pool consisted of Medicare patients living in similar geographic regions in Minnesota. We used propensity score matching to find appropriate comparators.28 The final propensity score model used includes age, gender, race/ethnicity, disability, HCC score, an HCC indicator for depression, prior-year utilization (hospitalizations, ED visits), and prior-year cost. Tests of common support and covariate balance across treatment and comparison group indicate that propensity score matching improves comparability.29
Descriptive Characteristics, Medicare. Exhibit CKRI.1 displays the descriptive characteristics of beneficiaries in the CKRI program and the comparison group, with respect to demographics, comorbidities, and prior utilization.30 We observe no differences in demographics, comorbidities, or prior utilization measures, between the APCC participants and the comparison group.
Exhibit CKRI.1: Descriptive Characteristics for CKRI and Comparison Group Medicare Beneficiaries
Variable CKRI Comparison Number of Persons 66 66 Mean Number of Quarters Enrolled [Range] 7.0 [1-10] 7.0 [1-10] Gender % (N) Female 48.5 (32) 45.5 (30) Age Group % (N) 18-25 years 4.5 (3) 1.5 (1) 26 to 44 years 18.2 (12) 19.7 (13) 45 to 64 years 66.7 (44) 74.2 (49) >65 years 10.6 (7) 4.5 (3) Race/Ethnicity % (N) White 84.8 (56) 81.8 (54) Dual Eligibility % (N) Dually Eligible 48.5 (32) 48.5 (32) Hierarchical Chronic Conditions (HCC) Risk Score Mean HCC Score (Standard Deviation) 2.6 (2.6) 2.2 (2.3) Mean Count of HCCs (SD) 4.0 (4.0) 3.9 (3.8) Mean Utilization and Cost in Year Prior to Program Enrollment (per 1,000 beneficiaries unless noted) Total Cost of Care per beneficiary (SD) $31,003 ($64,466) $29,157 ($59,493) Hospitalizations (SD) 787 (1,731) 838 (1,906) ED Visits (SD) 1184 (2,642) 1,193 (2,648)
NOTE: *p<0.10, **p<0.05, ***p<0.01.
28 For more information on our propensity score matching methodology, please refer to NORC’s Third Annual Report, Appendix C. 29 For more detailed information on propensity score matching and tests of common support and covariate balance for this awardee, please refer to Appendix D. 30 Differences between these groups are tested using t-test for continuous measures (comorbidities and utilization one year prior to program enrollment) or a chi-square test for categorical parameters (gender, age, race, and dual eligibility)

NORC | HCIA Complex/High-Risk Patient Targeting
ADDENDUM TO THE THIRD ANNUAL REPORT | 41
Impact of CKRI Program, Medicare. Exhibit CKRI.2 displays the average quarterly and aggregate impact of the awardee’s program for its participants relative to the comparison group.31 Utilization measures are reported as binary indicators, noting whether an event occurred in each quarter for a specific beneficiary (beneficiary-quarter).32 We find the following, relative to the comparison group:
■ Cost: A non-significant decrease in total cost of care.
■ Utilization Measures: A non-significant decrease in hospitalizations and a non-significantincrease in ED visits.
Exhibit CKRI.2: Impact of CKRI Program on Outcomes for Medicare Beneficiaries
AVERAGE QUARTERLY IMPACT§ Outcome Measure
(per 1,000 beneficiaries unless noted) Adjusted Estimate
90% Confidence Interval
80% Confidence Interval
Total Cost of Care per Beneficiary ($) -$1,866 + -$4,002, $270 -$3,530, -$202 Hospitalizations -37 + -80, 6 -70, -4 ED Visits 12 -44, 68 -32,56
AGGREGATE IMPACT§§
Outcome Measure Adjusted Estimate
90% Confidence Interval
80% Confidence Interval
Total Cost of Care ($) -$863,811 + -$1,852,604, $124,982 -$1,634,408, -$93,124
Hospitalizations -17 + -37, 3 -32, -2 ED Visits 5 -21, 31 -15, 25
NOTE: +p<0.20, *p<0.10, **p<0.05, ***p<0.01. Bold font indicates findings that are statistically significant at p<0.10. §Quarterly impact is the average quarterly DID estimate per quarter of program enrollment. §§Aggregate impact is the total DID estimate for all program participants across all observed quarters of program enrollment. Aggregate impact is estimated for this awardee based on the total number of program participants (66), with an average length of enrollment of 9.5 quarters. Please note that the estimate for aggregate impact may be smaller thant the estimate for average quarterly impact if there are fewer than 1,000 enrolled beneficiaries, as the aggregate estimate is equal to the average quarterly estimate multipled by the sample size in each quarter, divided by 1,000. Disclaimer: Standard statistical practice is to use confidence intervals of 90% or higher. 80% confidence intervals are provided here for comparison purposes.
Impact of CKRI Program in Each Quarter of Enrollment, Medicare. Exhibit CKRI.3 displays the results of the quarterly fixed effects (QFE) DID models that assess the impact in each post-intervention quarter on Medicare beneficiaries, rather than an average quarter as presented above.33,34 The model-based estimates indicate the following, relative to the comparison group:
31 Adjustment factors include age category, gender, race/ethnicity, dual eligibility indicator, HCC score, and disability indicator. Results are interpreted as significant where p<0.10. 32 See NORC’s Third Annual Report, Appendix C for more information on our analysis. In addition to binary measures, we also conduct tests using counts of utilization and report those results where relevant. 33 For a more detailed explanation of the QFE DID model and measure specification, please refer to NORC’s Third Annual Report, Appendix C. 34 For utilization measures, the effect is displayed as the average difference between treatment and comparison per 1,000 beneficiaries (and 90 percent confidence interval) for each quarter during the post-intervention (I1–I10) period, after adjusting for pre-intervention differences between the two groups. For total cost of care, this effect is displayed per beneficiary. We present both 90% confidence intervals (indicated by vertical lines around the estimate) and 80% confidence intervals (indicated by shaded boxes around the estimate). Results are interpreted as significant where p<0.10.

NORC | HCIA Complex/High-Risk Patient Targeting
ADDENDUM TO THE THIRD ANNUAL REPORT | 42
■ Cost: A significant decrease in total cost of care in quarter I9 and I10.
■ Utilization Measures: Significant decreases in hospitalizations in the quarters I7 and I9; significant decreases in ED visits in quarters I4 and I8, and a significant increase in quarter I9 (reflecting small sample size and few events in this quarter).
Exhibit CKRI.3: Impact of CKRI Program on Outcomes for Medicare Beneficiaries, by Quarter
Disclaimer: Standard statistical practice is to use confidence intervals of 90% or higher. 80% confidence intervals are provided here for comparison purposes.

NORC | HCIA Complex/High-Risk Patient Targeting
ADDENDUM TO THE THIRD ANNUAL REPORT | 43
Core Measures: Medicaid
Our community (ambulatory care) analysis compares the experiences of CKRI enrollees with those of a matched group of comparators. It considers the impact on utilization and cost of the awardee’s innovation over the enrollment period and in each quarter of program enrollment. Our analysis is for Medicaid or dually eligible beneficiaries, comprising 58 percent of CKRI’s enrolled beneficiaries.35
Measures (per 1,000 beneficiaries unless noted) Total Cost of Care per beneficiary All-cause Hospitalizations ED Visits
Finder File and Creation of Analytic Sample, Medicaid. CKRI provided a finder file of program participants and enrollment dates, enabling us to use Minnesota Medicaid claims to calculate outcome measures.36 We identified 208 unique beneficiaries with at least one quarter of post-enrollment data and further limited this based on the enrollment date, yielding an analytic sample of 188 beneficiaries.
Comparison Group, Medicaid. The comparison pool consisted of Medicaid patients living in similar zip codes as program participants in Minneapolis, Minnesota. We used propensity score matching to find appropriate comparators.37 The final propensity score model includes age, gender, race/ethnicity, disability, a measure of comorbidity using the Chronic Illness and Disability Payment System (CDPS) risk score, CDPS flags for depression, bipolar, and related disorders, prior year coverage on Medicaid, prior-year utilization (hospitalizations, ED visits), and prior-year cost. Tests of common support and covariate balance across treatment and comparison groups indicate that propensity score matching improves comparability.38
Descriptive Characteristics, Medicaid. Exhibit CKRI.4 displays the descriptive characteristics of Medicaid beneficiaries in the treatment and comparison groups, with respect to demographics, comorbidities, and prior utilization.39 We observe few statistically significant differences in most demographics, comorbidities, or prior utilization measures, although beneficiaries in the APCC program were more likely to be Black (p<0.01), relative to the comparison group.
35 The awardee’s self-reported data, as presented in the HCIA Fourteenth Quarterly Reporting Period (Q14), October, November, and December 2015. Submitted to CMMI by the Courage Kenney Rehabilitation Institute – Allina Health, March 2, 2016. 36 Minnesota Medicaid claims were available through June 30, 2016 for this analysis. 37 For more information on our propensity score matching methodology, please refer to NORC’s Third Annual Report, Appendix C. 38 For more detailed information on propensity score matching and tests of common support and covariate balance for this awardee, please refer to Appendix D. 39 Differences between these groups are tested using t-test for continuous measures (comorbidities and utilization before index hospitalization) or a chi-square test for categorical parameters (gender, age, race, and coverage reason).

NORC | HCIA Complex/High-Risk Patient Targeting
ADDENDUM TO THE THIRD ANNUAL REPORT | 44
Exhibit CKRI.4: Descriptive Characteristics for CKRI and Comparison Group Medicaid Beneficiaries
Variable CKRI Comparison Number of Persons 188 181 Mean Number of Quarters Enrolled [Range] 9.3 [1-14] 9.5 [1-14] Gender % (N) Female 42.0 (79) 42.5 (77) Age Group % (N) 18 to 25 years 34.6 (65) 32.0 (58) 26 to 64 years 47.9 (90) 49.7 (90) >65 years 17.6 (33) 18.2 (33) Race/Ethnicity % (N)*** White 71.3 (134) 70.2 (127) Black 22.9 (43) 16.6 (30) Other 4.3 (8) 12.2 (22) Coverage Reason % (N) Disability 78.2 (147) 80.7 (146) Chronic Illness and Disability Payment System (CDPS) CDPS Risk Score (Standard Deviation) 3.6 (2.7) 3.5 (2.6) CDPS Psychiatric Flags % (N) Bipolar affective disorder 17.0 (32) 17.7 (32) Depression, panic, or phobic disorder 15.4 (29) 15.5 (28) Mean Utilization in Year Prior to Program Enrollment (per 1,000 beneficiaries unless noted) Total Cost of Care per beneficiary (SD) $70,500 ($85,894) $69,816 ($84,547) Hospitalizations (SD) 1373 (2469) 1206 (2173) ED Visits (SD) 1222 (2565) 1224 (2471)
NOTE: *p<0.10, **p<0.05, ***p<0.01.
Impact of CKRI Program, Medicaid. Exhibit CKRI.5 displays the average quarterly and aggregate impact of the CKRI program on its participants relative to the comparison group.40 Utilization measures are reported as binary indicators, noting whether an event occurred in each quarter for a specific beneficiary (beneficiary-quarter). We find the following, relative to the comparison group:
■ Cost: A statistically significant decrease in the total cost of care (-$1,643 per beneficiary per quarter).
■ Utilization Measures: A non-significant decrease in hospitalizations and a significant increase in ED visits (47 per 1,000 beneficiaries per quarter).
40 Adjustment factors include age category, gender, race/ethnicity, dual eligibility indicator, CDPS risk score, Medicaid coverage in the prior year, a binary managed care indicator, and a binary disability indicator. Results are interpreted as significant where p<0.10.
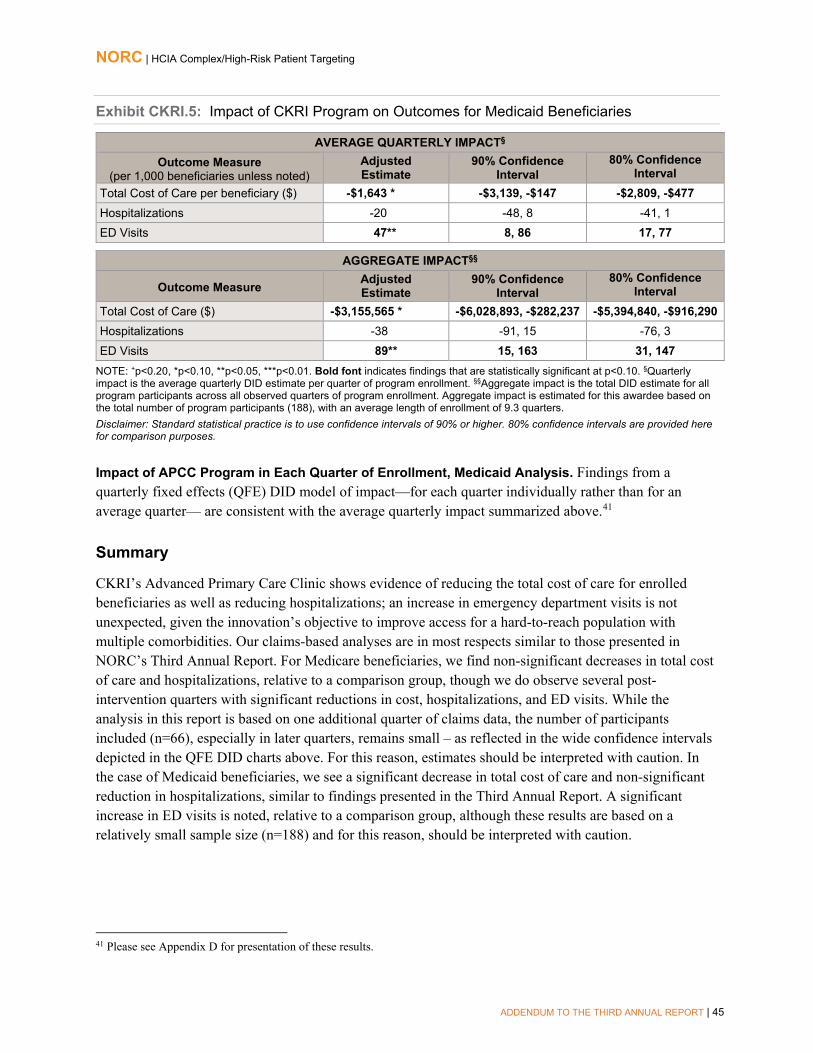
NORC | HCIA Complex/High-Risk Patient Targeting
ADDENDUM TO THE THIRD ANNUAL REPORT | 45
Exhibit CKRI.5: Impact of CKRI Program on Outcomes for Medicaid Beneficiaries
AVERAGE QUARTERLY IMPACT§ Outcome Measure
(per 1,000 beneficiaries unless noted) Adjusted Estimate
90% Confidence Interval
80% Confidence Interval
Total Cost of Care per beneficiary ($) -$1,643 * -$3,139, -$147 -$2,809, -$477 Hospitalizations -20 -48, 8 -41, 1 ED Visits 47** 8, 86 17, 77
AGGREGATE IMPACT§§
Outcome Measure Adjusted Estimate
90% Confidence Interval
80% Confidence Interval
Total Cost of Care ($) -$3,155,565 * -$6,028,893, -$282,237 -$5,394,840, -$916,290 Hospitalizations -38 -91, 15 -76, 3 ED Visits 89** 15, 163 31, 147
NOTE: +p<0.20, *p<0.10, **p<0.05, ***p<0.01. Bold font indicates findings that are statistically significant at p<0.10. §Quarterly impact is the average quarterly DID estimate per quarter of program enrollment. §§Aggregate impact is the total DID estimate for all program participants across all observed quarters of program enrollment. Aggregate impact is estimated for this awardee based on the total number of program participants (188), with an average length of enrollment of 9.3 quarters. Disclaimer: Standard statistical practice is to use confidence intervals of 90% or higher. 80% confidence intervals are provided here for comparison purposes.
Impact of APCC Program in Each Quarter of Enrollment, Medicaid Analysis. Findings from a quarterly fixed effects (QFE) DID model of impact—for each quarter individually rather than for an average quarter— are consistent with the average quarterly impact summarized above.41
Summary
CKRI’s Advanced Primary Care Clinic shows evidence of reducing the total cost of care for enrolled beneficiaries as well as reducing hospitalizations; an increase in emergency department visits is not unexpected, given the innovation’s objective to improve access for a hard-to-reach population with multiple comorbidities. Our claims-based analyses are in most respects similar to those presented in NORC’s Third Annual Report. For Medicare beneficiaries, we find non-significant decreases in total cost of care and hospitalizations, relative to a comparison group, though we do observe several post-intervention quarters with significant reductions in cost, hospitalizations, and ED visits. While the analysis in this report is based on one additional quarter of claims data, the number of participants included (n=66), especially in later quarters, remains small – as reflected in the wide confidence intervals depicted in the QFE DID charts above. For this reason, estimates should be interpreted with caution. In the case of Medicaid beneficiaries, we see a significant decrease in total cost of care and non-significant reduction in hospitalizations, similar to findings presented in the Third Annual Report. A significant increase in ED visits is noted, relative to a comparison group, although these results are based on a relatively small sample size (n=188) and for this reason, should be interpreted with caution.
41 Please see Appendix D for presentation of these results.

NORC | HCIA Complex/High-Risk Patient Targeting
ADDENDUM TO THE THIRD ANNUAL REPORT | 46
Developmental Disabilities Health Services
Developmental Disabilities Health Home. Clinic-based teams, led by a nurse practitioner (NP), deliver primary care, mental health services, and specialty care to persons with intellectual and/or developmental disabilities (I/DD).
PROGRAM MODELS: Disability Medical Home, Care/Case Coordination, Integrated Care Delivery, Patient Navigation
LOCATION: New York, New Jersey REACH: 735 beneficiaries (95% of target)§ GRANT: $3,701,525 POPULATIONS: Disability, Dually Eligible AWARD DATES: 1/15/13 to 12/31/15 DATA, ADDENDUM REPORT: Medicaid claims
(January 2013 to June 2015) NO-COST EXTENSION: 6 month, full program PAYER(S): Medicare, Medicaid
OUTCOMES§§
No finding reaches statistical significance
Decrease in ED visits (-74 per 1,000 beneficiaries per quarter)
Analysis limited due to small sample sizes and to lack of Medicaid claims data for New Jersey.
SUMMARY: Consistent with NORC’s Third Annual Report, the DDHS program shows evidence of significant reductions in ED visits (74 per 1,000 beneficiaries per quarter, compared with 57 per 1,000 beneficiaries per quarter as presented in the Third Annual Report) and non-significant increases in total cost of care for enrolled Medicaid beneficiaries with I/DD. However, findings should be interpreted with caution due to the small sample size (N=151), short follow-up period, and the absence of New Jersey Alpha-MAX data. Results from an analysis of Medicare beneficiaries enrolled in the DD Home Health program are not presented in this report, as the dates of analysis in NORC’s Third Annual Report span the entire NCE period for the DD Home Health program; however, findings were similarly non-significant and limited due to a small percentage of the overall population being represented (less than 30 percent) and limited follow-up time. The clinical structure of the DDHS model calls for providers to plan for visits that are longer than most office consultationsto allow for dialogue, patient input, and teach-back methodsit is not surprising that this model did not produce cost savings under a FFS payment system.
§Target is for initial performance period, through 6/30/2015. §§Outcomes are from analyses that include a comparison group andreach statistical significance at the p<0.10 level.

NORC | HCIA Complex/High-Risk Patient Targeting
ADDENDUM TO THE THIRD ANNUAL REPORT | 47
Program Effectiveness
We present results of quarterly fixed effects (QFE) difference-in-differences (DID) analyses for Medicaid beneficiaries in DDHS’ DD Health Home program from January 15, 2013, through June 30, 2015, relative to a comparison group. These analyses include two additional quarters of Medicaid claims data, compared to the analyses presented in NORC’s Third Annual Report.
For Medicaid beneficiaries, we find that DD Health Home is significantly associated with decreased ED visits, relative to the comparison group. These findings are consistent with those presented in NORC’s Third Annual Report; estimates of reductions in ED visits remain statistically significant but are greater (74 per 1,000 beneficiaries per quarter, compared with 57 per 1,000 beneficiaries per quarter as presented in the Third Annual Report). Please note, however, that the analysis is limited due to the small sample size and to the lack of Medicaid claims for New Jersey. Results from an analysis of Medicare beneficiaries enrolled in the DD Home Health program are not presented in this report, as the dates of analysis in the Third Annual Report span the entire NCE period for the DD Home Health program (through December 31, 2015).
Core and Supplemental Measures
Our community (ambulatory care) analysis compares the experience of DDHS enrollees with those of a matched group of comparators. It considers the impact on utilization and cost of DD Health Home over the enrollment period as a whole and in each quarter of enrollment. This analysis is for Medicaid beneficiaries (including dually eligible), comprising 94 percent of all DD Health Home enrollees.42
Measures (per 1,000 beneficiaries unless noted) Total Cost of Care per beneficiary All-cause Hospitalizations Emergency Department (ED) Visits
Finder File and Creation of Analytic Sample. DDHS provided a finder file of program participants and enrollment dates, enabling us to use Alpha-MAX Medicaid claims for these beneficiaries to calculate outcome measures for only New York participants.43 We identified 200 unique beneficiaries and further limited this number by enrollment date and Medicaid identifiers, yielding an analytic sample of 151 beneficiaries.
Comparison Group. The comparison pool consists of non-institutionalized Medicaid patients in New York, one of two states where DD Health Home program participants reside. We used propensity score matching to find appropriate comparators.44 The final propensity score model includes age, race, gender, enrollment in managed care, dual eligibility, CDPS risk score, indicators for developmental disability diagnosis and psychiatric diagnosis, and prior-year utilization (ED visits and hospitalizations) and cost. Tests of common support and covariate balance across treatment and comparison groups indicate that propensity score weighting improves comparability.45
42 The awardee’s self-reported data, as presented in the HCIA Fourteenth Quarterly Reporting Period (Q14), October, November, December 2015. Submitted to CMMI by the Developmental Disabilities Health Services PA, March 2, 2016. 43 Alpha-MAX claims are available through June 30, 2015 for the analysis in this report. 44 For more information on propensity score matching, please refer to NORC’s Third Annual Report, Appendix C. 45 For more detailed information on propensity score matching and tests of common support and covariate balance, please refer to Appendix D.

NORC | HCIA Complex/High-Risk Patient Targeting
ADDENDUM TO THE THIRD ANNUAL REPORT | 48
Descriptive Characteristics. Exhibit DDHS.1 displays the descriptive characteristics of beneficiaries in the DD Health Home program and comparison groups, with respect to demographics, comorbidities, and prior utilization.46 We observe no differences in demographics, comorbidities, or prior utilization measures between DD Health Home participants and the comparison group.
Exhibit DDHS.1: Descriptive Characteristics for DD Health Home and Comparison Group Beneficiaries
Variable DD Health Home Comparison Number of Beneficiaries 151 151 Mean Number of Quarters Enrolled [Range] 4.3 [1 - 9] 4.3 [1 - 9] Gender % (N) Female 34.4 (52) 33.8 (51) Age Group % (N) <30 years old 64.2 (97) 64.2 (97) 30-39 years old 10.6 (16) 10.6 (16) 40-49 years old 8.6 (13) 8.6 (13) 50-59 years old 12.6 (19) 12.6 (19) ≥60 years old 4.0 (6) 4.0 (6) Race/Ethnicity % (N) White 54.3 (82) 54.3 (82) Black 43.0 (65) 43.0 (65) Other 2.6 (4) 2.6 (4) Dual Eligibility % (N) Dually Enrolled 30.5 (46) 31.8 (48) Medicaid Coverage % (N) Enrolled in Managed Care Plan 36.4 (55) 36.4 (55) CDPS Diagnoses % (N) Developmental Disability 33.8 (51) 34.4 (52) Psychiatric 45.0 (68) 44.4 (67) CDPS Risk Score Mean CDPS Risk Score (SD) 2.0 (1.3) 2.0 (1.3) Mean Utilization and Cost in Year Prior to Program Enrollment (per 1,000 beneficiaries unless noted) Total Medicaid Cost per beneficiary (SD) $87,473 ($80,555) $93,848 ($155,406) Hospitalizations (SD) 344 (1,132) 391 (945) ED Visits (SD) 1,033 (1,635) 1,298 (2,930)
NOTE: *p<0.10, **p<0.05, ***p<0.01.
Impact of DD Health Home Program. Exhibit DDHS.2 displays the average quarterly and aggregate impact of the DD Health Home innovation on its participants relative to the comparison group.47 Utilization measures are reported as binary indicators, noting whether an event occurred in each quarter for a specific beneficiary (beneficiary-quarter). We find the following, relative to the comparison group:
46 We test differences between these groups with a t-test for continuous measures (comorbidities and utilization one year prior to program enrollment) or a chi-square test for categorical parameters (gender, age, race, dual eligibility, coverage reason, and CDPS diagnoses). 47 Adjustment factors include age category, gender, race/ethnicity, managed care coverage indicator, dual eligibility indicator, and CDPS risk score. Results are interpreted as significant where p<0.10.

NORC | HCIA Complex/High-Risk Patient Targeting
ADDENDUM TO THE THIRD ANNUAL REPORT | 49
■ Cost: A non-significant increase in total cost of care.
■ Utilization Measures: A significant decrease in ED visits (-74 per 1,000 beneficiaries per quarter) and a non-significant decrease in hospitalizations.
Exhibit DDHS.2: Impact of the DD Health Home Program on Outcomes
AVERAGE QUARTERLY IMPACT§ Outcome Measure
(per 1,000 beneficiaries unless noted) Adjusted Estimate
90% Confidence Interval
80% Confidence Interval
Total Cost of Care per beneficiary ($) $2,969 -$2,811, $8,749 -$1,536, $7,474 Hospitalizations -10 -38, 18 -32, 12 ED Visits -74 *** -106, -42 -99, -49
AGGREGATE IMPACT§§
Outcome Measure Adjusted Estimate
90% Confidence Interval
80% Confidence Interval
Total Cost of Care ($) $1,623,944 -$1,537,863, $4,785,751 -$840,151, $4,088,039 Hospitalizations -5 -20, 10 -17, 7 ED Visits -40 *** -58, -22 -54, -26
NOTE: +p<0.20, *p<0.10, **p<0.05, ***p<0.01. Bold font indicates findings that are statistically significant at p<0.10. §Quarterly impact is the average quarterly DID estimate per quarter of program enrollment. §§Aggregate impact is the total DID estimate for all program participants across all observed quarters of program enrollment. Aggregate impact is estimated for this awardee based on the total number of program participants (151), with an average length of enrollment of 4.3 quarters. Please note that the estimate for aggregate impact may be smaller than the estimate for average quarterly impact if there are fewer than 1,000 enrolled beneficiaries, as the aggregate estimate is equal to the average quarterly estimate multipled by the sample size in each quarter, divided by 1,000. Disclaimer: Standard statistical practice is to use confidence intervals of 90% or higher. 80% confidence intervals are provided here for comparison purposes.
Impact of DD Health Home in Each Quarter of Enrollment. Findings from a quarterly fixed effects (QFE) DID model of impact—for each quarter individually rather than for an average quarter— are consistent with the average quarterly impact summarized above.48
Summary
Analyses of the Medicaid claims data identify decreases in hospitalizations and ED visits in the post-intervention period, reaching statistical significance in ED visits; however, we observe a non-significant increase in total cost of care, relative to the comparison group. While these results are consistent with those presented in NORC’s Third Annual Report, we encourage readers to interpret these results with caution due to the small sample size, short follow-up period, and absence of New Jersey Alpha-MAX data.
48 Please see Appendix D for presentation of these results.

NORC | HCIA Complex/High-Risk Patient Targeting
ADDENDUM TO THE THIRD ANNUAL REPORT | 50
Johns Hopkins University Community Health Partnership
Community Health Partnership (J-CHiP). This program has two components: a hospital and skilled nursing facility post-acute care (PAC) intervention, and a clinic-based (community) intervention. Both arms focus on increasing access to primary care and behavioral health care services, and quality of care for high-utilizing, high-risk patients who live in neighborhoods close to the awardee.
PROGRAM MODELS: Beneficiary/Caregiver Engagement, Care/Case Coordination, Collaborative Medical Home, Transitional Care
GRANT: $19,920,338
AWARD DATES: 7/01/12 to 6/30/16 NO-COST EXTENSION: 12 month, community arm PAYER(S): Medicare, Medicaid
REACH: 80,257 beneficiaries (106% of target) § POPULATIONS: Adults, Behavioral Health/Substance Abuse, Dually Eligible, Racial/Ethnic Minority, Urban DATA, ADDENDUM REPORT: Medicare (January 2011 to June 2016), Medicaid (January 2011 to March 2016).
OUTCOMES, Hospital Arm§§
For Medicare beneficiaries, Decrease in total cost of care (-$1,115 per beneficiary-episode per quarter) and in 90-day cost of care delivered at SNFs (-$439 per beneficiary-episode)
For Medicaid beneficiaries, Decrease in total cost of care and inpatient and outpatient costs (-$4,295, -$2,341, and -$1,067 per beneficiary-episode per quarter, repectively); total cost of care and 90-day outpatient care for those who are dually eligible (-$2,792 and -$622 per beneficiary-episode per quarter, respectively); and total cost of care and 90-day outpatient care for Medicaid-only beneficiaries (-$6,474 and -$1,585 per beneficiary-episode per quarter, respectively)
For Medicaid beneficiaries, Increase in hospitalizations (49 per 1,000 beneficiary-episodes per quarter)
Decrease in ED visits for all beneficiaries (-133 per 1,000 beneficiary-episodes per quarter), those who are dually eligible (-87 per 1,000 beneficiary-episodes per quarter), and those enrolled in Medicaid only (-155 per 1,000 beneficiary-episodes per quarter)
Decrease in readmissions for those enrolled only in Medicaid (-57 per 1,000 beneficiary-episodes per quarter)
For Medicaid beneficiaries, Decreases in 7-day and 30-day practitioner follow-up visits (-70 and -182 per 1,000 Medicaid beneficiary-episodes per quarter, respectively)
Decrease in 30-day practitioner follow-up visits for those enrolled only in Medicaid (-109 per 1,000 beneficiary-episodes per quarter)
OUTCOMES, Community Arm§§ Decrease in total cost of care for all Medicaid beneficiaries (-$1,643 per beneficiary per quarter), dually eligible beneficiaries (-$1,037 per beneficiary per quarter), and those enrolled only in Medicaid (-$1,673 per beneficiary per quarter)
Decreases in hospitalizations, ED visits, and readmissions for all Medicaid beneficiaries (-33, -51, and -36 per 1,000 beneficiaries per quarter)
Decrease in ED visits for dually eligible beneficairies (-55 per 1,000 beneficiaries per quarter)
Decreases in hospitalizations, ED visits, and readmissions for those enrolled only in Medicaid (-32, -44, and -50 per 1,000 beneficiaries per quarter, respectively)
Decrease in potentially avoidable hospitalizations for all Medicaid beneficiaries (-7 per 1,000 beneficiaries per quarter)
§Target is for initial performance period, through 6/30/2015. §§Outcomes for cost, utilization, and quality of care are from analyses that include a comparison group and are statistically significant at the p<0.10 level.

NORC | HCIA Complex/High-Risk Patient Targeting
ADDENDUM TO THE THIRD ANNUAL REPORT | 51
Program Effectiveness
We present results of quarterly fixed effects (QFE) differences-in-differences (DID) analyses for Medicare and Medicaid beneficiaries in J-CHiP’s program from July 1, 2012 through March 31, 2016, relative to a comparison group. This analysis includes one additional quarter of data for the post-acute care (hospital arm) Medicaid analysis (no additional quarters for the hospital Medicare) and two additional quarters of data for the community arm Medicare analysis, compared with the analyses presented in NORC’s Third Annual Report. In addition, to explore the decreases in total cost and accompanying increase in utilization measures found in NORC’s Third Annual Report, we consider the impact of the J-CHiP hospital arm (for both Medicare and Medicaid beneficiaries) on more detailed cost categories.
Both arms of the J-CHiP intervention demonstrate cost savings and are associated with positive change in CMMI core measures, as follows,
■ Hospital Arm: Significant decreases in the total cost of care are observed for both the Medicare (-$1,115 per beneficiary-episode per quarter) and Medicaid (-$4,295 per beneficiary-episode per quarter) enrollee populations. Breaking down costs by category, Medicare enrollees showed a significant decrease in the cost of post-acute care at skilled nursing facilities (SNFs); Medicaid enrollees showed a significant decrease in inpatient and outpatient care costs. Medicaid enrollees also had significantly fewer ED visits (-133 per 1,000 beneficiary-episodes per quarter) than did the comparison group.
■ Community Arm: While the Medicare enrollees did not show any significantly different outcomes relative to the comparison group, significant improvements for the Medicaid enrollees were observed across all measures. For Medicaid enrollees, relative to the comparison group, total cost of care decreased significantly (-$1,643 per beneficiary per quarter); significant decreases were observed in hospitalizations (-33 per 1,000 beneficiaries per quarter), ED visits (-51 per 1,000 beneficiaries per quarter), and readmissions (-36 per 1,000 beneficiaries per quarter); and potentially avoidable hospitalizations (PAHs) decreased significantly (-7 per 1,000 beneficiaries per quarter).
Subgroup analyses on dually eligible beneficiaries and those enrolled only in Medicaid allow for exploration of specific aspects within each intervention arm. We find the following, relative to matched comparators:
■ Hospital Arm: Significant decreases in ED visits, total cost and outpatient costs observed for the pooled Medicaid beneficiaries are sustained across the subgroups of dually eligible and Medicaid-only beneficiaries. In addition, the Medicaid-only subgroup shows significantly fewer readmissions (-57 per 1,000 beneficiary-episodes).
■ Community Arm: the significant decreases in total cost of care and ED visits observed for the pooled Medicaid beneficiaries are sustained across the subgroups of dually eligible and Medicaid-only beneficiaries. In addition, the Medicaid-only subgroup sustains the significantly decreased hospitalizations and readmissions observed for the pooled group.

NORC | HCIA Complex/High-Risk Patient Targeting
ADDENDUM TO THE THIRD ANNUAL REPORT | 52
While most findings are consistent with those in NORC’s Third Annual Report, there are some differences (below).
■ Hospital Arm: We now observe declines in readmissions among the Medicaid-only population, a change from a non-significant increase of 23 per 1,000 beneficiary-episodes (quarterly estimate) to a statistically significant decrease of -57 per 1,000 beneficiary-episodes (quarterly estimate) in this report. We also note that readmissions for the pooled Medicaid population (dually and non-dually eligible) changed from a statistically significant increase of 26 per 1,000 beneficiary-episodes (quarterly estimate) to a non-significant decrease (-2 per 1,000 beneficiary-episodes) in this report.
■ Community Arm: Among Medicare beneficiaries, we no longer find statistically significant declines in hospitalizations or ED visits (declines of -16 and -17 per 1,000 beneficiaries in ED visits and hospitalizations, respectively, in NORC’s Third Annual Report). In this report, we find declines in hospitalizations and ED visits, but they do not reach statistical significance. We also found a non-significant decline in total quarterly cost of care (-$495; p=0.10) in the Third Annual Report, while for this report, we find a non-significant increase in quarterly cost of care of about the lesser magnitude. Among Medicaid beneficiaries, we found a significant decrease in 30-day readmissions in this report (-53 per 1,000 beneficiaries), a change from a non-significant increase of 14 per 1,000 beneficiaries reported in the Third Annual Report.
Both hospital and community arms show greater impacts for the Medicaid only population, with greater opportunity for cost savings.
■ The hospital arm offers greater savings to complex, high-risk Medicaid beneficiaries. In NORC’s Third Annual Report and in this chapter, significant decreases in cost of care are seen for both Medicare and Medicaid. For both payers, we see decreases in outpatient utilization; for Medicaid, it is likely that this decrease has an influence on outpatient and inpatient costs, while for Medicare, decreases in total cost of care likely reflects decreases in post-acute care facility costs and decreases in inpatient costs.
■ The community arm targets high-risk, low income beneficiaries residing in Baltimore, MD. The intervention offered greater savings to Medicaid beneficiaries and achieved a meaningful reduction in unnecessary readmissions. On the Medicare side, fewer beneficiaries were served and the program did not offer savings. However, even after selecting comparison beneficiaries from the same zip code, we may not be adequately adjusting for unobserved socioeconomic (SES) characteristics. In contrast, estimates for Medicaid are more likely to be based on comparison of treatment and comparison group beneficiaries with similar SES characteristics.

NORC | HCIA Complex/High-Risk Patient Targeting
ADDENDUM TO THE THIRD ANNUAL REPORT | 53
Core and Supplemental Measures: Hospital Arm, Medicare
Our hospital analysis compares the experiences of J-CHiP Medicare enrollees with those of a weighted comparison group. It considers the impact on supplemental costs over the implementation period and in each quarter of program implementation. Our analysis is for Medicare FFS beneficiaries, comprising approximately 42 percent of all hospital-arm enrollees.This report presents the analysis on the same Medicare beneficiaries we analyzed in NORC’s Third Annual Report, but in this report, we examine specific units of cost.
49
Measures (per 1,000 beneficiary-episodes unless noted) 90-day Total Cost of Care per beneficiary-episode ($) 90-day Hospitalizations 90-day Emergency Department (ED) visits 30-day Readmissions 7-day Practitioner Follow-Up Visits 30-day Practitioner follow-Up visits 90-day Acute Inpatient Care Cost per beneficiary-episode ($) 90-day Skilled Nursing Facility (SNF) Care Cost per beneficiary-episode ($) 90-day Other Post-Acute Care Cost per beneficiary-episode ($) 90-day Outpatient Care Cost per beneficiary-episode ($) 90-day Hospice Cost per beneficiary-episode ($) 90-day Durable Medical Equipment (DME) Cost per beneficiary-episode ($)
Finder File and Creation of Analytic Sample, Hospital Arm, Medicare. J-CHiP provided a finder file of hospital arm participants at Johns Hopkins Hospital (JHH) and Johns Hopkins Bayview Medical Center (JHBMC) and their pre-implementation and post-implementation episode dates, enabling us to use Medicare claims in the CMS Virtual Research Data Center (VRDC) to calculate outcome measures.50,51 We identified 67,103 unique beneficiary-episodes in the finder file. We further limited this number by episode date, Medicare identifiers, and whether the episode was an inpatient claim, to yield an analytic sample of 16,316 beneficiary-episodes in the pre-intervention period and 26,144 beneficiary-episodes in the post-intervention period.
Comparison Group, Hospital Arm, Medicare. The comparison pool consisted of Medicare FFS beneficiary-episodes discharged from similar hospitals in geographic proximity to JHBMC and JHH,
49 Estimated percentage of Medicare FFS beneficiaries comes from awardee self-reported data, as presented in the HCIA Fifteenth Quarterly Reporting Period (Q15), January, February, and March 2016. Submitted to CMMI by J-CHiP, June 1, 2016. 50 We used Medicare claims available through March 31, 2016, for this report. We use a claims run-off date of December 31, 2015, and September 30, 2015, as the cut-off date to account for hospital discharges. 51 This finder file identified pre-implementation episodes from specific units in the Johns Hopkins Hospital and Bayview where the J-CHiP program was eventually implemented. We excluded from this file episodes discharged after the J-CHiP program was piloted in units, to obtain an uncontaminated pre-intervention group. The pre-intervention period was from January 1, 2011 to June 30, 2012. The finder file also distinguishes beneficiary-episodes occurring during the intervention’s ramp-up period (from program launch on July 1, 2012, through March 31, 2013) from those after full implementation (between April 1, 2013, and June 30, 2015). We include in the post-intervention period episodes discharged from units after the full implementation of the J-CHiP program in those units.

NORC | HCIA Complex/High-Risk Patient Targeting
ADDENDUM TO THE THIRD ANNUAL REPORT | 54
during the pre- and post-implementation periods.52,53 We used propensity score weighting (relative weighting) to minimize differences in beneficiary-episode characteristics between the J-CHiP Medicare treatment and comparison groups.54 The final propensity model includes age, race/ethnicity, HCC score, indicators of ESRD, disability, dual coverage with Medicaid, Major Diagnostic Categories, type and weights, ED visits and cost of care in the prior year. Tests of common support and covariate balance across treatment and comparison groups indicate that propensity score weighting improves comparability.55
Impact of J-CHiP, Hospital Arm, Medicare. Exhibit J-CHiP.1 displays the average quarterly and aggregate impact of the J-CHiP hospital program for its Medicare participants relative to the comparison group.56 Utilization measures are reported as binary indicators, noting whether an event occurred in each quarter for a specific beneficiary-episode. We find the following, relative to the comparison group:
Cost: As presented in the Third Annual Report, a statistically significant decrease in the total cost of care (-$1,115 per beneficiary-episode per quarter), but significant increases in readmissions and hospitalizations (14 and 11 per 1,000 beneficiary-episodes per quarter, respectively). Analysis of the cost categories show that the decreases in total cost of care are driven by a significant decrease in the cost of care delivered at SNFs (-$439 per beneficiary-episode), as well as non-significant decreases in the cost of care delivered in acute inpatient and hospice settings and for durable medical equipment. 57
52 Comparison hospitals were chosen based on case-mix and patient demographics, all located in Maryland to account for the Maryland all-payer hospital payment model started in the post-implementation period. The comparison hospital for JHH was the University of Maryland Medical Center; comparison hospitals for JHBMC were St. Agnes Hospital and Franklin Square Hospitals. 53 The J-CHiP program excludes hospitalizations for clinical trials and solid organ/bone marrow transplants from its targeted population; thus we also exclude such beneficiary episodes from the pre-intervention group, as well as the pre- and post-comparison groups. We include only beneficiaries who had a short-term inpatient stay at the treatment/comparison hospitals and who were discharged alive. We exclude beneficiaries admitted to the hospitals and transferred to another inpatient facility from our analysis. 54 For more information on relative weighting methodology, please refer to NORC’s Third Annual Report, Appendix C. 55 For more detailed information on propensity score weighting and tests of common support and covariate balance, please refer to Appendix D. 56 Adjustment factors include age category, race/ethnicity, gender, prior-year hospitalizations and cost, dual eligibility indicator, discharge disposition, HCC score, ESRD indicator, disability indicator and measures from the Medicare Severity-Diagnosis Related Group (MS-DRG) weight, MS-DRG type (medical or surgical, and major diagnostic category (MDC). Readmissions and cost models exclude prior-year hospitalization or cost; hospitalization and ED visit models exclude prior-year hospitalization. 57 Acute inpatient, SNF, other post-acute, and outpatient costs include both facility and professional components. The outpatient costs include all non E&M ambulatory care, and all follow-up visits after 30 days, as well labs, images, and other procedures. For definitions of the cost categories please see Appendix C.

NORC | HCIA Complex/High-Risk Patient Targeting
ADDENDUM TO THE THIRD ANNUAL REPORT | 55
Exhibit J-CHiP.1: Impact of the J-CHiP Hospital Arm on Medicare Outcomes
AVERAGE QUARTERLY IMPACT§ Outcome Measure Adjusted Estimate 90% Confidence Interval 80% Confidence Interval
Results from Third Annual Report (per 1,000 beneficiary-episodes unless otherwise noted) 90-day Total Cost of Care per beneficiary-
episode -$1,115 * -$2,236, $0 $-1989, $-241
90-day Hospitalizations 11 * 0, 22 2, 20 90-day ED Visits -10 + -21, 1 -19, -1
30-day Readmissions 14 ** 4, 24 6, 22 7-day Practitioner Follow-up Visits -41 *** -51, -31 -49, -33
30-day Practitioner Follow-up Visits -29 *** -40, -18 -37, -21 Cost of Care Categories (per beneficiary-episode) §§§
90-day Acute Inpatient Cost -$193 -$1,183, $797 -$965, $579 90-day SNF Cost -$439 *** -$624, -$254 -$583, -$295
90-day Other Post-Acute Cost $13 -$36, $62 -$25, $51 90-day Outpatient Cost $57 -$203, $317 -$146, $260
90-day Hospice Cost -$46 + -$93, 1 -$83, -$9 90-day DME Cost -$37 + -$79, $5 -$70, -$4
AGGREGATE IMPACT§§ Outcome Measure Adjusted Estimate 90% Confidence Interval 80% Confidence Interval
Total Cost of Care -$29,153,336 * -$58,468,168, $0 -$51,999,302, -$6,307,369 Hospitalizations 293 * 5, 581 68, 518
ED Visits -268 + -561, 25 -497, -39 Readmissions 372 ** 109, 635 167, 577
7-day Practitioner Follow-up Visits -1074 *** -1337, -811 -1279, -869 30-day Practitioner Follow-up Visits -758 *** -1042, -474 -980, -536 Cost of Care Categories §§§ 90-day Acute Inpatient Cost -$5,102,929 -$31,296,679,
$21,090,821 -$25,516,538, $1,5310,680
90-day SNF Cost -$11,625,561 *** -$16,523,340, -$6,727,782
-$15,442,553, -$7,808,569
90-day Other Post-Acute Care Cost
$341,396 -$963,021, $16,45,813
-$675,177, $1,357,969
90-day Outpatient Cost $1,505,092 -$5,385.537, $8,395,721
-$3,864,991, $6,875,175
90-day Hospice Cost of Care ($) -$1,223,164 + -$2,474,366, $28,038 -$2,198,265, -$248,063 90-day DME Cost ($) -$972,351 + -$2,093,598, $148,896 -$1,846,174, -$98,528 NOTE: +p<0.20, *p<0.10, **p<0.05, ***p<0.01. Bold font indicates findings that reach statistical significance. §: Quarterly Impact is the average quarterly DID estimate per quarter of program implementation. §§: Aggregate Impact is the total DID estimate for all program participants across all quarters of program implementation. Aggregate Impact is estimated for this awardee based on the total number of beneficiary-episodes (26,144) and the length of program implementation included in analysis (8 quarters). §§§: Observed impact for cost categories is not expected to sum up to observed impact for total cost due to adjustment by covariates §Disclaimer: Standard statistical practice is to use confidence intervals of 90% or higher. 80% confidence intervals are provided herefor comparison purposes.

NORC | HCIA Complex/High-Risk Patient Targeting
ADDENDUM TO THE THIRD ANNUAL REPORT | 56
Impact of the J-CHiP Hospital Arm in Each Quarter of Enrollment, Medicare. With the exception of 90-day total cost of care, findings from a quarterly fixed effects (QFE) DID model of impact—for each quarter individually rather than for an average quarter— are consistent with the average quarterly impact summarized above.58 For the measure of 90-day cost of care, considering impact by quarter can identify trends masked by the overall summary estimate. Exhibit J-CHiP.2 displays the results of the QFE DID model for this measure for J-CHiP hospital arm Medicare beneficiaries, relative to a comparison group.59,60 We observe significant decreases in 90-day cost for J-CHiP participants in quarters I3, I4, and I7.
Exhibit J-CHiP.2: Impact of the J-CHiP Hospital Arm by Quarter, Medicare
90-Day Cost per Beneficiary-Episode ($)
Disclaimer: Standard statistical practice is to use confidence intervals of 90% or higher. 80% confidence intervals are provided here for comparison purposes.
Core and Supplemental Measures: Hospital Arm, Medicaid
Measures (per 1,000 beneficiary-episodes unless noted) 90-day Total Cost of Care per beneficiary-episode ($) 90-day Hospitalizations 90-day Emergency Department (ED) visits 30-day Readmissions 7-day Practitioner Follow-Up Visits 30-day Practitioner follow-Up visits 90-day Inpatient Care Cost per beneficiary-episode ($) 90-day Outpatient Care Cost per beneficiary-episode ($) 90-day Long-Term Care Cost per beneficiary-episode ($) 90-day Prescription Drug Cost per beneficiary-episode ($)
Our post-acute care (hospital) analysis compares the experiences of J-CHiP enrollees with those of a weighted comparison group. It considers the impact on utilization, cost, and quality of care of the awardee’s innovation over the implementation period as a whole and in each quarter of program implementation. Our analysis is for Medicaid beneficiaries in the J-CHiP hospital arm, comprising 33 percent of all hospital arm enrollees.61 As 58 Please see Appendix D for presentation of these results. 59 For a more detailed explanation of the QFE DID model and measure specification, please see NORC’s Third Annual Report, Appendix C. 60 The effect is displayed as the average difference between treatment and comparison per beneficiary-episode for each quarter during the post-intervention (I1–I8) period, after adjusting for pre-intervention differences between the two groups. We present both 90% confidence intervals (indicated by vertical lines around the estimate) and 80% confidence intervals (indicated by shaded boxes around the estimate). Results are interpreted as significant where p<0.10. 61 Estimated percentage of Medicaid beneficiaries comes from the awardee’s self-reported data, as presented in the HCIA Fifteenth Quarterly Reporting Period (Q15), January, February, and March 2016. Submitted to CMMI by J-CHiP, June 1, 2016.

NORC | HCIA Complex/High-Risk Patient Targeting
ADDENDUM TO THE THIRD ANNUAL REPORT | 57
above, we present subgroup analyses of categories of cost. In addition, this chapter includes subgroup analyses to compare the experiences of dually eligible beneficiaries with those who receive Medicaid only and with all Medicaid beneficiaries (pooled), similar to the subgroup analysis presented in NORC’s Third Annual Report.
Finder File and Creation of Analytic Sample, Hospital Arm, Medicaid. J-CHiP provided a finder file of hospital arm participants and their pre-implementation and post-implementation episode dates, enabling us to use Maryland Medicaid claims to calculate outcome measures.62,63 We identified 28,822 unique beneficiary-episodes and further restricted by enrollment date, Medicaid identifiers, and whether the episode was an inpatient claim, to yield an analytic sample of 11,210 episodes in the pre-intervention group and 13,921 episodes in the post-intervention group.
Comparison Group, Hospital Arm, Medicaid. As with the Medicare analysis presented in the previous section, the comparison pool consists of similar hospitals in geographic proximity to JHH and JHBMC, applying exclusion and inclusion criteria used by J-CHiP to limit to similar episodes. We used propensity score weighting (relative weighting) to minimize differences in beneficiary-episode characteristics between the J-CHiP Medicaid treatment and comparison groups.64 We ran separate propensity score models for dually eligible and Medicaid only beneficiary-episodes and eventually combined them in pooled analyses.65 The final propensity model includes gender, prior-year utilization, prior year Medicaid coverage, Resource Utilization Band (RUB) category from the Adjusted Clinical Groups (ACG) score, and reason for coverage. Tests of common support and covariate balance across treatment and comparison groups indicate that propensity score weighting improves comparability.66
Descriptive Characteristics, Hospital Arm, Medicaid. Exhibit J-CHiP.3 displays the descriptive characteristics of J-CHiP Medicaid beneficiary-episodes before and after implementation of the hospital arm intervention. We compare discharges occurring in the post-intervention period for the J-CHiP and comparison groups with respect to demographics, comorbidity burden, and prior utilization.67 In the post-intervention period, beneficiaries discharged from J-CHiP are more likely to be older, female, Black, have a higher morbidity burden (as measured by the “Very High” RUB category from ACG risk score), and
62 We obtained Maryland Medicaid claims from the Maryland Department of Health and Mental Hygiene, provided to us through the Hilltop Institute. The finder file distinguishes beneficiary-episodes occurring during the intervention’s ramp-up period (from program launch on July 1, 2012, through March 31, 2013) from those after full implementation (between April 1, 2013, and June 30, 2015). We include in the post-intervention period episodes discharged from units after the full implementation of the J-CHiP program in those units. 63 This finder file identified pre-implementation episodes from specific units in the Johns Hopkins Hospital and Bayview where the J-CHiP program was eventually implemented. We excluded from this file episodes discharged after the J-CHiP program was piloted in units, to obtain an uncontaminated pre-intervention group. The pre-intervention period was from January 1, 2011 to June 30, 2012 64 For more information on relative weighting methodology, please refer to NORC’s Third Annual Report, Appendix C. 65 See NORC’s Third Annual Report, Appendix C for more information about our approach to propensity score modeling, including the covariates used. While we do not include Medicaid managed care enrollment in our propensity score model, we adjust for differences in managed care enrollment in our DID models. 66 For more detailed information on propensity score weighting and tests of common support and covariate balance, please refer to Appendix D. 67 We test differences between the groups with a t-test for continuous measures (comorbidities and utilization before index hospitalization) and a chi-square test for categorical parameters (age, race, ethnicity, coverage reason, discharge destination, and dual eligibility).

NORC | HCIA Complex/High-Risk Patient Targeting
ADDENDUM TO THE THIRD ANNUAL REPORT | 58
have higher prior utilization and cost (p<0.01 for all). J-CHiP beneficiary-episodes are also less likely to be discharged to home health than comparison beneficiary-episodes.
Exhibit J-CHiP.3: Descriptive Characteristics for the J-CHiP Hospital Arm and Comparison Group Beneficiary-Episodes, Medicaid
Pre-Intervention Post-Intervention
J-CHiP Comparison J-CHiP Comparison Number of Beneficiary-Episodes 11,210 5,858 13,921 4,574 Age *** % (N) 20-39 years 36.0 (4038) 31.6 (1854) 22.3 (3107) 41.2 (1884) 40-60 years 42.8 (4799) 37.6 (2203) 48.4 (6737) 37.2 (1700) 61-75 years 15.1 (1691) 20.2 (1186) 21.2 (2957) 15.0 (684) 76+ years 6.1 (682) 10.5 (615) 8.0 (1115) 6.7 (306) Race/Ethnicity *** % (N) White 32.6 (3651) 46.8 (2739) 36.1 (5026) 45.0 (2057) Black 48.6 (5444) 34.9 (2046) 53.2 (7401) 30.4 (1392) Other 18.9 (2115) 18.3 (1073) 10.7 (1494) 24.6 (1125) Gender *** % (N) Female 55.0 (6166) 63.4 (3714) 53.1 (7396) 62.6 (2863) Adjusted Clinical Groups (ACG) Risk Very High Resource Utilization Band *** 46.9 (5255) 44.7 (2616) 70.9 (9875) 35.0 (1602) Reason for Coverage *** % (N) Age 6.5 (733) 8.5 (496) 2.7 (373) 6.4 (291) Disability 57.4 (6440) 43.8 (2567) 8.2 (1148) 30.7 (1404)
Other 36.0 (4037) 47.7 (2795) 89.1 (12400) 62.9 (2879)
Discharge Status *** % (N) Home 74.6 (8365) 75.0 (4396) 62.0 (8627) 80.5 (3681) SNF 2.2 (252) 7.7 (452) 6.4 (887) 5.5 (253) Other 23.1 (2593) 17.2 (1010) 31.7 (4407) 14.0 (640) Dual Eligibility *** % (N) Not Dually Eligible 58.8 (6596) 48.9 (2866) 54.5 (7586) 66.9 (3061) Mean Utilization and Cost in Year Prior to Program Enrollment (per 1,000 beneficiary-episodes, unless noted) Total Medicaid Cost (SD) per beneficiary-episode***
$28,266 ($61,359)
$21,930 ($50,347)
$37,151 ($80,929)
$13,674 ($33,832)
Hospitalizations (SD) *** 1,038 (2,534) 818 (2,149) 1,589 (3,042) 677 (1,812) ED Visits (SD) *** 1,626 ( 5,457) 1,375 ( 3,969) 2,783 ( 7,931) 1,486 ( 3,921)
NOTE: *p<0.10, **p<0.05, ***p<0.01.
Impact of J-CHiP Hospital Arm, Medicaid. Exhibit J-CHiP.4 displays the average quarterly and aggregate impact of the J-CHiP hospital program on its Medicaid participants relative to the comparison group.68 Utilization measures are reported as binary indicators, noting whether an event occurred in each quarter for a specific beneficiary-episode. Estimates are presented for the impact of the program on all Medicaid participants (pooled), as well as separately for dually eligible and Medicaid only participants.
68Adjustment factors include age category, race/ethnicity, gender, prior-year utilization, prior-year coverage under Medicaid, discharge disposition, RUB category from the ACG score, and reason for coverage. Pooled analysis also adjusts for dual eligibility.

NORC | HCIA Complex/High-Risk Patient Targeting
ADDENDUM TO THE THIRD ANNUAL REPORT | 59
For duals, we present impacts on total cost of care and ED visits, since Medicare is the primary payer for hospital and physician services for these beneficiaries.
For all Medicaid beneficiaries (pooled analysis), we find the following, relative to the comparison group:
■ Cost: Significant decrease in 90-day total cost of care (-$4,295 per beneficiary-episode per quarter), a significant decrease in inpatient costs (-$2,341 per beneficiary-episode per quarter), and a significant decrease in outpatient costs (-$1,067 per beneficiary-episode per quarter). 69
■ Utilization Measures: Significant decrease in ED visits (-133 per 1,000 beneficiary-episodes per quarter), but significant increase in all-cause hospitalizations (49 per 1,000 beneficiary-episodes per quarter).
■ Quality of Care Measures: Significant decreases in 7-day and 30-day practitioner follow-up visits (-70 and -182 per 1,000 beneficiary-episodes per quarter, respectively).
For dually eligible beneficiaries, we find the following, relative to the comparison group:
■ Cost: Significant decrease in cost of total cost of care and outpatient care (-$2,792 and -$622 per beneficiary-episode per quarter, respectively).
■ Utilization: Significant decrease in ED visits (-87 per 1,000 beneficiary-episodes per quarter).
For beneficiaries enrolled only in Medicaid, we find the following, relative to the comparison group:
■ Cost: Significant decreases in total cost of care and outpatient care (-$6,474 and -$1,585 per beneficiary-episode per quarter, respectively).
■ Utilization Measures: Significant decreases in ED visits and readmissions (-155 and -57 per 1,000 beneficiary-episodes per quarter, respectively).
■ Quality of Care: Significant decrease in 30-day practitioner follow-up visits (-109 per 1,000 beneficiary-episodes per quarter).
69 Inpatient, outpatient, and long-term care costs include both facility and professional components. Long-term care costs are presented only for dually eligible beneficiaries, since most pooled Medicaid, and Medicaid only beneficiaries, incurred no long-term care costs. For definitions of the cost categories, please see Appendix C.

NORC | HCIA Complex/High-Risk Patient Targeting
ADDENDUM TO THE THIRD ANNUAL REPORT | 60
Exhibit J-CHiP.4: Impact of the J-CHiP Hospital Arm on Outcomes, Medicaid
AVERAGE QUARTERLY IMPACT§
Outcome Measure (per 1,000 Beneficiary-episodes
unless noted)
Pooled Medicaid (N=13,921)
Dually Eligible (N= 6,335)
Medicaid Only (N= 7,586)
Adjusted Estimate
90% Confidence
Interval
80% Confidence
Interval
Adjusted Estimate
90% Confidence
Interval
80% Confidence
Interval
Adjusted Estimate
90% Confidence Interval
80% Confidence Interval
90-day Total Cost of Care per Beneficiary-episode
-$4,295 *** -$6,392, -$2,198
-$5,930, -$2,660
-$2,792* -$5214, $-370*
-$4,679, -$905
-$6,474 *** -$10,082, -$2,866
-$9,285, -$3,663
90-day Hospitalizations 49 ** 14, 84 22, 76 -14 -66, 38 -55, 27
90-day ED Visits -133 *** -160, -106 -154, -112 -87 *** -124, -50 -116, -58 -155 *** -198, -112 -188, -122
30-day Readmissions 2 -29, 33 -22, 26 -57 ** -104, -10 -93, -21
7-day Practitioner Follow-up Visits -70 *** -92, -48
-87, -53 -27 -63, 9 -55, 1
30-day Practitioner Follow-up Visits -182 *** -210, -154 -204, -160 -109 *** -152, -66 -143, -75
Cost of Care Categories, per Beneficiary-episode§§§
90-day Inpatient Care Cost -$2,341 ** -$4,026, -$656 -$3,654, -$1,028 -$2847 + -$5820, $126 -$5164, -$530
90-day Outpatient Care Cost -$1,067 *** -$1,591, -$543 -$3,654, -$1,028
-$622 ** -$1,130, -$114
-$1,018, -$226
-$1,585 *** -$2,564, -$606
-$2,348, -$822
90-day Long-term Care Cost $276 + -$24, $576 $42, $510
90-day Prescription Drug Cost -$109 -$283, $65 -$245, $27 -$234 -$540, $72 -$473, $5
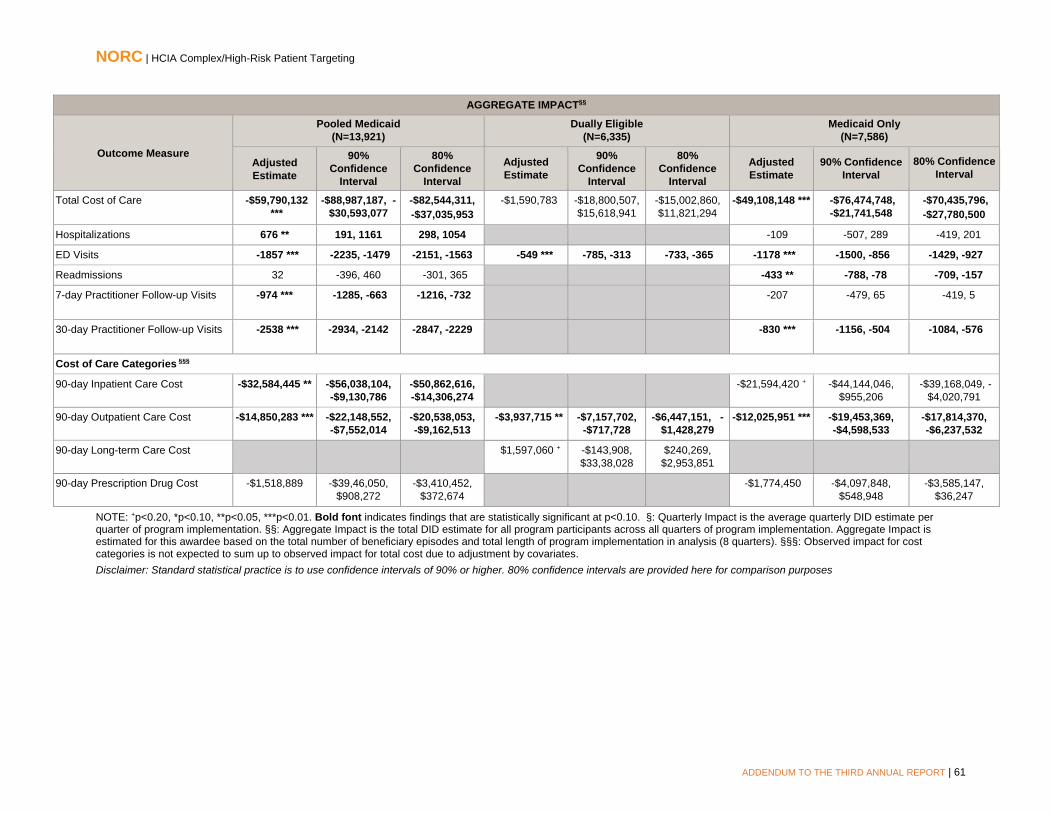
NORC | HCIA Complex/High-Risk Patient Targeting
ADDENDUM TO THE THIRD ANNUAL REPORT | 61
AGGREGATE IMPACT§§
Outcome Measure
Pooled Medicaid (N=13,921)
Dually Eligible (N=6,335)
Medicaid Only (N=7,586)
Adjusted Estimate
90% Confidence
Interval
80% Confidence
Interval
Adjusted Estimate
90% Confidence
Interval
80% Confidence
Interval
Adjusted Estimate
90% Confidence Interval
80% Confidence Interval
Total Cost of Care -$59,790,132 ***
-$88,987,187, -$30,593,077
-$82,544,311, -$37,035,953
-$1,590,783 -$18,800,507, $15,618,941
-$15,002,860, $11,821,294
-$49,108,148 *** -$76,474,748, -$21,741,548
-$70,435,796, -$27,780,500
Hospitalizations 676 ** 191, 1161 298, 1054 -109 -507, 289 -419, 201
ED Visits -1857 *** -2235, -1479 -2151, -1563 -549 *** -785, -313 -733, -365 -1178 *** -1500, -856 -1429, -927
Readmissions 32 -396, 460 -301, 365 -433 ** -788, -78 -709, -157
7-day Practitioner Follow-up Visits -974 *** -1285, -663
-1216, -732 -207 -479, 65 -419, 5
30-day Practitioner Follow-up Visits -2538 *** -2934, -2142 -2847, -2229
-830 *** -1156, -504 -1084, -576
Cost of Care Categories §§§
90-day Inpatient Care Cost -$32,584,445 ** -$56,038,104, -$9,130,786
-$50,862,616, -$14,306,274
-$21,594,420 + -$44,144,046, $955,206
-$39,168,049, -$4,020,791
90-day Outpatient Care Cost -$14,850,283 *** -$22,148,552, -$7,552,014
-$20,538,053, -$9,162,513
-$3,937,715 ** -$7,157,702, -$717,728
-$6,447,151, -$1,428,279
-$12,025,951 *** -$19,453,369, -$4,598,533
-$17,814,370, -$6,237,532
90-day Long-term Care Cost $1,597,060 + -$143,908, $33,38,028
$240,269, $2,953,851
90-day Prescription Drug Cost -$1,518,889 -$39,46,050, $908,272
-$3,410,452, $372,674
-$1,774,450 -$4,097,848, $548,948
-$3,585,147, $36,247
NOTE: +p<0.20, *p<0.10, **p<0.05, ***p<0.01. Bold font indicates findings that are statistically significant at p<0.10. §: Quarterly Impact is the average quarterly DID estimate per quarter of program implementation. §§: Aggregate Impact is the total DID estimate for all program participants across all quarters of program implementation. Aggregate Impact is estimated for this awardee based on the total number of beneficiary episodes and total length of program implementation in analysis (8 quarters). §§§: Observed impact for cost categories is not expected to sum up to observed impact for total cost due to adjustment by covariates. Disclaimer: Standard statistical practice is to use confidence intervals of 90% or higher. 80% confidence intervals are provided here for comparison purposes

NORC | HCIA Complex/High-Risk Patient Targeting
ADDENDUM TO THE THIRD ANNUAL REPORT | 62
Impact of J-CHiP Hospital Arm in Each Quarter of Enrollment, Medicaid. Findings from a quarterly fixed effects (QFE) DID model of impact—for each quarter individually rather than for an average quarter as presented above— are consistent with the average quarterly impact summarized above.70
Core and Supplemental Measures: Community Arm, Medicare
Our community (ambulatory care) analysis compares the experiences of J-CHiP enrollees with those of a matched group of comparators. It considers the impact on utilization, cost, and quality of care of the awardee’s innovation over the enrollment period and during each quarter of enrollment. Our analysis is for Medicare FFS beneficiaries in the J-CHiP community arm, who comprise approximately 52 percent of all community arm participants.71
Measures (per 1,000 beneficiaries unless noted) Total Cost of Care per beneficiary ($) All-cause Hospitalizations Emergency Department (ED) Visits 30-day Readmissions Ambulatory Care Sensitive (ACS) Hospitalizations
Finder File and Creation of Analytic Sample, Community Arm, Medicare. J-CHiP provided finder files with community arm participants and their enrollment dates, enabling us to use Medicare claims in the CMS Virtual Research Data Center (VRDC) to calculate outcome measures.72 We identified 2,403 unique beneficiaries, and further limited this number by Medicare coverage and enrollment date to yield an analytic sample of 2,154 beneficiaries for the J-CHiP community arm.
Comparison Group, Community Arm, Medicare. The comparison pool consisted of Medicare FFS beneficiaries living in similar zip codes to J-CHiP participants. From this pool of potential comparison beneficiaries, we identify those who had at least one evaluation and management visit to a practitioner and use that date to determine start of enrollment. We use propensity score matching to find appropriate comparators.73 The final propensity score model includes gender, race, disability status, dual eligibility, HCC score, and cost in the year prior to program enrollment, and ED visits in the quarter prior to program enrollment. Tests of common support and covariate balance across treatment and comparison groups indicate that propensity score matching improves comparability.74
Descriptive Characteristics, Community Arm, Medicare. Exhibit J-CHiP.5 displays the descriptive characteristics of J-CHiP Medicare beneficiaries in J-CHiP’s community arm and their matched comparison sample, with respect to demographics, number of other chronic conditions, prior utilization, and program enrollment.75 We observe few differences in characteristics between the groups, although J-
70 Please see Appendix D for presentation of these results. QFE DID results are presented for the pooled analysis only. 71 The awardee’s self-reported data, as presented in the Fifteenth Quarterly Reporting Period (Q14), January, February, and March, 2016. Submitted to CMMI by the Johns Hopkins University, June 2, 2016. 72 Medicare claims are available through September 30, 2016, for the analysis in this report. We use June 30, 2016, as the cut-off date to account for the 90-day claims runoff. 73 For more information on our propensity score matching methodology, please see NORC’s Third Annual Report, Appendix C. 74 For more detailed information on propensity score matching and tests of common support and covariate balance, please refer to Appendix D. 75 We test differences between these groups with a t-test for continuous measures (comorbidities and utilization one year prior to program enrollment) or a chi-square test for categorical parameters (gender, age, race/ethnicity, dual eligibility, and coverage reason).

NORC | HCIA Complex/High-Risk Patient Targeting
ADDENDUM TO THE THIRD ANNUAL REPORT | 63
CHiP participants have a higher comorbidity burden (p<0.05) and more ED visits in the year prior to program enrollment (p<0.10), relative to the comparison group.
Exhibit J-CHiP.5: Descriptive Characteristics for the J-CHiP Community Arm and Comparison Group Beneficiaries, Medicare
Variable J-CHiP Comparison Number of Beneficiaries 2154 2154 Mean No. of Quarters Enrolled 6.0 [1 - 11] 6.0 [1 - 11] Gender % (N) Female 61.3 (1321) 62.8 (1352) Age Group % (N) <65 years 32.9 (709) 33.0 (710) 65-69 years 13.1 (283) 10.5 (226) 70-74 years 12.9 (278) 12.6 (272) 75-79 years 13.2 (285) 14.4 (311) 80-84 years 12.6 (271) 12.7 (274) ≥85 years 15.2 (328) 16.8 (361) Race/Ethnicity % (N) White 41.9 (902) 41.4 (891) Black 56.3 (1213) 56.8 (1224) Other 1.8 (39) 1.8 (39) Dual Eligibility % (N) Dually Enrolled ** 47.7 (1027) 51.4 (1108) Coverage Reason % (N) Age 52.4 (1129) 52.4 (1129) Disability 43.9 (945) 44.6 (961) ESRD 1.3 (29) 0.9 (19) Both ESRD and Disability 2.4 (51) 2.1 (45) Hierarchical Chronic Conditions (HCC) Mean HCC Score (Standard Deviation) ** 2.4 (1.7) 2.2 (1.8) Mean Count of HCCs (SD) *** 4.2 (3.0) 3.7 (3.2) Mean Utilization and Cost in Year Prior to Program Enrollment (per 1,000 beneficiaries unless noted) Hospitalizations (SD) 1191.8 (2120.4) 1236.1 (6117.6) ED Visits ** 1866.9 (6024.0) 1491.0 (3831.6) Total Medicare Cost (SD) per beneficiary ($) $34,615 ($55,555) $34,151 ($119251)
NOTE: *p<0.10, **p<0.05, ***p<0.01.
Impact of J-CHiP Community Arm, Medicare. Exhibit J-CHiP.6 displays the average quarterly and aggregate impact of the J-CHiP community program for its participants relative to the comparison group.76 We report utilization measures as binary indicators, noting whether an event occurred in each quarter for a specific beneficiary (beneficiary-quarter). We find the following for Medicare beneficiaries in J-CHiP’s community arm, relative to the comparison group:
76 Adjustment factors are post-intervention indicator, age category, gender, race/ethnicity, dual eligibility indicator, HCC Risk score, discharge category, a disability indicator, and an ESRD indicator.
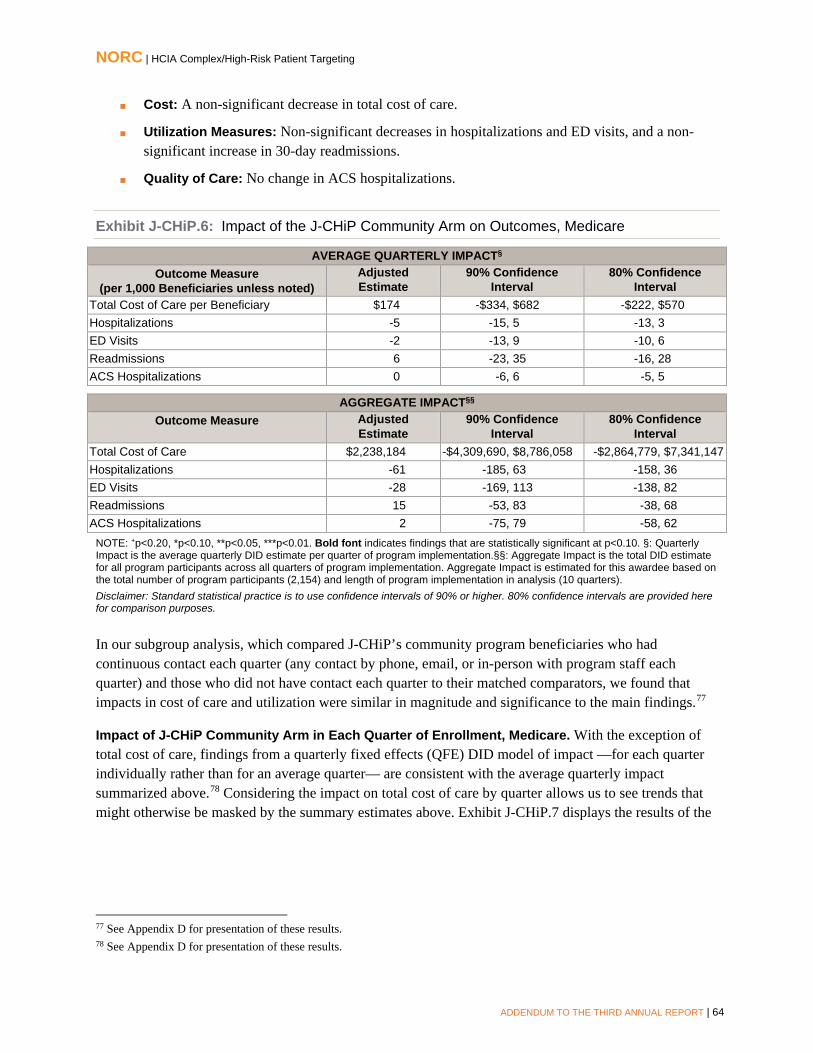
NORC | HCIA Complex/High-Risk Patient Targeting
ADDENDUM TO THE THIRD ANNUAL REPORT | 64
■ Cost: A non-significant decrease in total cost of care.
■ Utilization Measures: Non-significant decreases in hospitalizations and ED visits, and a non-significant increase in 30-day readmissions.
■ Quality of Care: No change in ACS hospitalizations.
Exhibit J-CHiP.6: Impact of the J-CHiP Community Arm on Outcomes, Medicare
AVERAGE QUARTERLY IMPACT§ Outcome Measure
(per 1,000 Beneficiaries unless noted) Adjusted Estimate
90% Confidence Interval
80% Confidence Interval
Total Cost of Care per Beneficiary $174 -$334, $682 -$222, $570 Hospitalizations -5 -15, 5 -13, 3 ED Visits -2 -13, 9 -10, 6 Readmissions 6 -23, 35 -16, 28 ACS Hospitalizations 0 -6, 6 -5, 5
AGGREGATE IMPACT§§ Outcome Measure Adjusted
Estimate 90% Confidence
Interval 80% Confidence
Interval Total Cost of Care $2,238,184 -$4,309,690, $8,786,058 -$2,864,779, $7,341,147 Hospitalizations -61 -185, 63 -158, 36 ED Visits -28 -169, 113 -138, 82 Readmissions 15 -53, 83 -38, 68 ACS Hospitalizations 2 -75, 79 -58, 62
NOTE: +p<0.20, *p<0.10, **p<0.05, ***p<0.01. Bold font indicates findings that are statistically significant at p<0.10. §: Quarterly Impact is the average quarterly DID estimate per quarter of program implementation.§§: Aggregate Impact is the total DID estimate for all program participants across all quarters of program implementation. Aggregate Impact is estimated for this awardee based on the total number of program participants (2,154) and length of program implementation in analysis (10 quarters). Disclaimer: Standard statistical practice is to use confidence intervals of 90% or higher. 80% confidence intervals are provided here for comparison purposes.
In our subgroup analysis, which compared J-CHiP’s community program beneficiaries who had continuous contact each quarter (any contact by phone, email, or in-person with program staff each quarter) and those who did not have contact each quarter to their matched comparators, we found that impacts in cost of care and utilization were similar in magnitude and significance to the main findings.77
Impact of J-CHiP Community Arm in Each Quarter of Enrollment, Medicare. With the exception of total cost of care, findings from a quarterly fixed effects (QFE) DID model of impact —for each quarter individually rather than for an average quarter— are consistent with the average quarterly impact summarized above.78 Considering the impact on total cost of care by quarter allows us to see trends that might otherwise be masked by the summary estimates above. Exhibit J-CHiP.7 displays the results of the
77 See Appendix D for presentation of these results. 78 See Appendix D for presentation of these results.

NORC | HCIA Complex/High-Risk Patient Targeting
ADDENDUM TO THE THIRD ANNUAL REPORT | 65
QFE DID model for this measure, relative to a comparison group.79 We observe a decreasing trend for cost for J-CHiP participants in quarters I7-I10, relative to the comparison group.
Exhibit J-CHiP.7: Impact of the J-CHiP Community Arm by Quarter, Medicare
Cost per Beneficiary ($)
Disclaimer: Standard statistical practice is to use confidence intervals of 90% or higher. 80% confidence intervals are provided here for comparison purposes.
Core and Supplemental Measures: Community Arm, Medicaid
Our community (ambulatory care) analysis compares the experiences of Medicaid beneficiaries with those of a matched group of comparators. It considers the impact on utilization, cost, and quality of care of the J-CHiP program over the entire enrollment period and for each quarter of enrollment. Our analysis is for Medicaid beneficiaries, comprising 37 percent of all J-CHiP enrollees.80
Total Cost of Care per beneficiary ($) All-cause HospitalizationsEmergency Department (ED) Visits 30-day Readmissions Potentially Avoidable Hospitalizations
Finder File and Creation of Analytic Sample, Community Arm, Medicaid: J-CHiP provided NORC with finder files of participants and their enrollment dates, enabling us to pull Medicaid claims for these beneficiaries and calculate outcomes.81 We identified 4,345 Medicaid beneficiaries, and further limited
79 The effect is displayed as the average difference between treatment and comparison per beneficiary for each quarter during the post-intervention (I1–I11) period, after adjusting for pre-intervention differences between the two groups. We present both 90% confidence intervals (indicated by vertical lines around the estimate) and 80% confidence intervals (indicated by shaded boxes around the estimate). Results are interpreted as significant where p<0.10. 80 Estimated percentage of Medicaid beneficiaries comes from awardee self-reported data, as presented in the Fifteenth Quarterly Reporting Period (Q14), January, February, and March, 2016. Submitted to CMMI by the Johns Hopkins University, June 2, 2016. 81 We define enrollment for the community arm participants based on the date the care manager opened a care plan for the participant. Maryland Medicaid files were available through March 31, 2016, for analysis presented in this report. The majority of the claims do not extend past December 31, 2015.
Measures (per 1,000 beneficiaries unless noted)
NORC | HCIA Complex/High-Risk Patient Targeting
ADDENDUM TO THE THIRD ANNUAL REPORT | 66
this number by Medicaid identifiers and enrollment date to yield an analytic sample of 2,532 beneficiaries.
Comparison Group, Community Arm, Medicaid. The comparison pool consisted of non-institutionalized Medicaid beneficiaries living in similar zip codes to J-CHiP participants. From this pool of potential comparison beneficiaries, we identify those who had at least one evaluation and management visit to a practitioner and use that date to determine start of enrollment. We use propensity score matching to find appropriate comparators.82 The final propensity score model includes age, gender, race/ethnicity, reason for coverage, months of coverage in the final year, and RUB category from the ACG risk score, and ED visits and cost in the prior year.83 Tests of common support and covariate balance across treatment and comparison groups indicate that propensity score matching improves comparability.84
Descriptive Characteristics, Community Arm, Medicaid. Exhibit J-CHiP.8 displays the descriptive characteristics of Medicaid beneficiaries in J-CHiP’s community arm and a matched comparison sample, with respect to demographics, prior utilization, and program enrollment.85 We find few statistically significant differences between the groups, although J-CHiP participants are older (p<0.01), have less coverage in the year prior to enrollment (p<0.10), are less likely to be enrolled in managed care (p<0.01), have a higher mean ACG risk score (p<0.01), and had fewer ED visits in the year prior to program enrollment (p<0.10).
82 For more information on our propensity score matching methodology, please see NORC’s Third Annual Report, Appendix C. 83 The Johns Hopkins Adjusted Clinical Groups® (ACG®). Technical documentation is available at: https://www.hopkinsacg.org/resource-center/#documentation 84 For more detailed information on propensity score matching and tests of common support and covariate balance, please refer to Appendix D. 85 We test differences between these groups with a t-test for continuous measures (coverage, comorbidities, and utilization one year prior to program enrollment) or a chi-square test for categorical parameters (gender, age, race, dual indicator, and managed care indicator)

NORC | HCIA Complex/High-Risk Patient Targeting
ADDENDUM TO THE THIRD ANNUAL REPORT | 67
Exhibit J-CHiP.8: Descriptive Characteristics for J-CHiP Community Arm and Comparison Group Beneficiaries, Medicaid
Variable J-CHiP Comparison Number of Beneficiaries 2532 2184 Mean Number of Quarters 6.0 [1 - 8] 6.6 [1 - 9] Gender % (N) Male 32.7 (827) 32.1 (701) Age Group % (N) *** 20-39 years 14.9 (378) 16.1 (352) 40-60 years 52.3 (1325) 55.6 (1214) 61-75 years 21.7 (550) 19.5 (425) Race/Ethnicity % (N) White 30.5 (772) 29.1 (636) Black 64.9 (1644) 65.3 (1426) Other 5.9 ( 150) 5.2 (122) Coverage Reason % (N) ** Age 7.2 (182) 7.6 (166) Disability 48.4 (1225) 52.1 (1138) Other 44.4(1125) 40.3(880) Coverage in the Prior Year Days * Number of Days (Standard Deviation) 100 ( 317) 104 ( 311) Dual Eligibility % (N) Dually Enrolled 41.6 (1053) 38.7 (845) Managed Care % (N) *** Enrolled in managed care 54.4 (1378) 58.7 (1283) Adjusted Clinical Group (ACG) Risk *** Very High Resource Utilization Band (SD) 44.5 (1130) 44.0 (960)
Mean Utilization and Cost in Year Prior to Program Enrollment (per 1,000 beneficiaries unless noted) Total Medicare Cost (SD) per beneficiary $25,874 ($49,759) $26,604 ($50,573)
Hospitalizations (SD) 899.8 (1962.5) 889.2 (1897.4) ED Visits* 2048.7 (4817.2) 2366.3 (6741.1)
NOTE: *p<0.10, **p<0.05, ***p<0.01.
Impact of J-CHiP Community Arm, Medicaid. Exhibit J-CHiP.9 presents the average quarterly and aggregate impact of J-CHiP’s community program on its Medicaid participants relative to the comparison group.86 Utilization measures are reported as binary indicators, noting whether an event occurred in each quarter for a specific beneficiary-episode. Estimates are presented for the impact of the program on all Medicaid participants (pooled), as well as separately for dually eligible beneficiaries and those enrolled only in Medicaid. For duals we present only impacts on costs of care and ED visits, since Medicare is the primary payer for hospital and physician services for these beneficiaries.
86 Adjustment factors include post-intervention indicator, age category, gender, race/ethnicity, indicators for reason for Medicaid coverage, indicator for managed care participation, and RUB category from the ACG score. Pooled models also include a dual eligibility indicator.

NORC | HCIA Complex/High-Risk Patient Targeting
ADDENDUM TO THE THIRD ANNUAL REPORT | 68
For all Medicaid beneficiaries (pooled analysis), we find the following, relative to the comparison group:
■ Cost: A significant decrease in total cost of care (-$1,643 per beneficiary per quarter)
■ Utilization Measures: Significant decreases in beneficiaries with hospitalizations (-33 per 1,000beneficiaries per quarter), ED visits (-51 per 1,000 beneficiaries per quarter), and readmissionsper quarter (-36 per 1,000 beneficiaries per quarter)
■ Quality of Care: A significant decrease in beneficiaries with potentially avoidablehospitalizations (-7 per 1,000 beneficiaries per quarter)
For dually eligible Medicaid beneficiaries, we find the following, relative to the comparison group:
■ Cost: A significant decrease in total quarterly cost of care (-$1,037 per beneficiary per quarter).
■ Utilization: A significant decrease in ED visits per quarter (-55 per 1,000 beneficiaries perquarter).
For beneficiaries enrolled only in Medicaid, we find the following, relative to the comparison group:
■ Cost: A significant decrease in total quarterly cost of care (-$1,673 per beneficiary per quarter).
■ Utilization Measures: A significant decrease in hospitalizations per quarter (-32 per 1,000beneficiaries per quarter), ED visits per quarter (-44 per 1,000 beneficiaries per quarter), andreadmissions per quarter (-50 per 1,000 beneficiaries per quarter).
■ Quality of Care: A non-significant decrease in potentially avoidable hospitalizations.
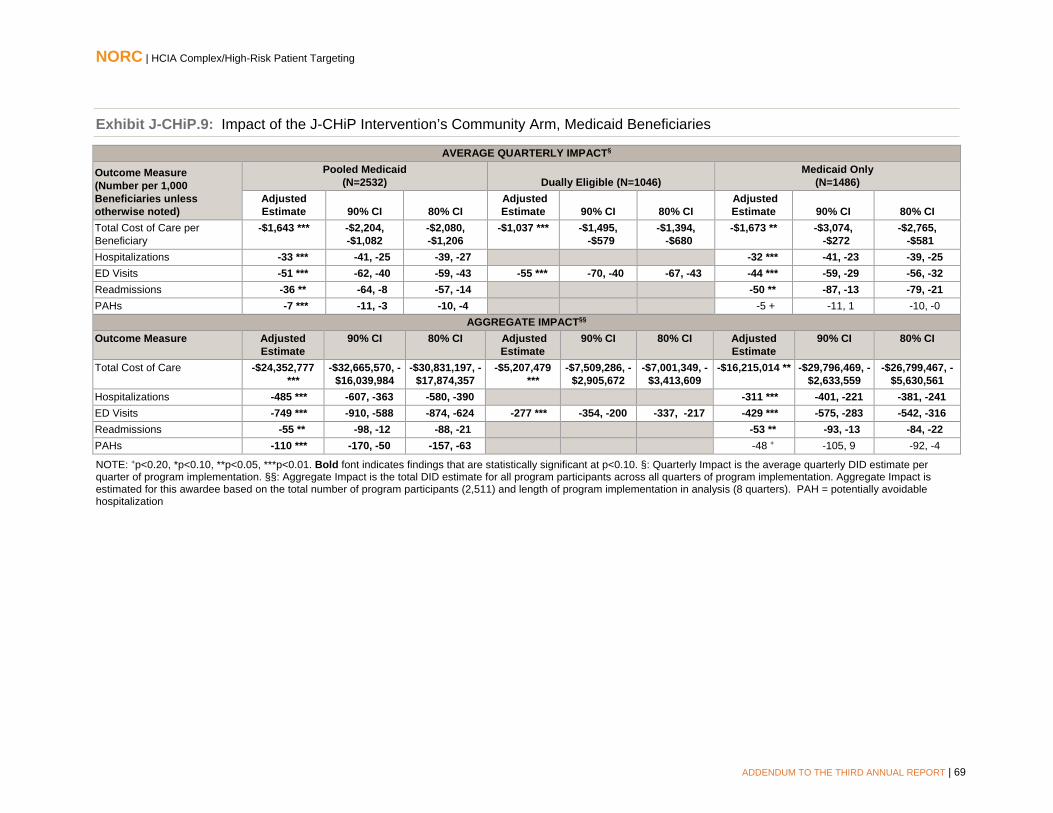
NORC | HCIA Complex/High-Risk Patient Targeting
ADDENDUM TO THE THIRD ANNUAL REPORT | 69
Exhibit J-CHiP.9: Impact of the J-CHiP Intervention’s Community Arm, Medicaid Beneficiaries
AVERAGE QUARTERLY IMPACT§
Outcome Measure (Number per 1,000 Beneficiaries unless otherwise noted)
Pooled Medicaid (N=2532) Dually Eligible (N=1046)
Medicaid Only (N=1486)
Adjusted Estimate 90% CI 80% CI
Adjusted Estimate 90% CI 80% CI
Adjusted Estimate 90% CI 80% CI
Total Cost of Care per Beneficiary
-$1,643 *** -$2,204, -$1,082
-$2,080, -$1,206
-$1,037 *** -$1,495, -$579
-$1,394, -$680
-$1,673 ** -$3,074, -$272
-$2,765, -$581
Hospitalizations -33 *** -41, -25 -39, -27 -32 *** -41, -23 -39, -25 ED Visits -51 *** -62, -40 -59, -43 -55 *** -70, -40 -67, -43 -44 *** -59, -29 -56, -32 Readmissions -36 ** -64, -8 -57, -14 -50 ** -87, -13 -79, -21 PAHs -7 *** -11, -3 -10, -4 -5 + -11, 1 -10, -0
AGGREGATE IMPACT§§ Outcome Measure Adjusted
Estimate 90% CI 80% CI Adjusted
Estimate 90% CI 80% CI Adjusted
Estimate 90% CI 80% CI
Total Cost of Care -$24,352,777 ***
-$32,665,570, -$16,039,984
-$30,831,197, -$17,874,357
-$5,207,479 ***
-$7,509,286, -$2,905,672
-$7,001,349, -$3,413,609
-$16,215,014 ** -$29,796,469, -$2,633,559
-$26,799,467, -$5,630,561
Hospitalizations -485 *** -607, -363 -580, -390 -311 *** -401, -221 -381, -241 ED Visits -749 *** -910, -588 -874, -624 -277 *** -354, -200 -337, -217 -429 *** -575, -283 -542, -316 Readmissions -55 ** -98, -12 -88, -21 -53 ** -93, -13 -84, -22 PAHs -110 *** -170, -50 -157, -63 -48 + -105, 9 -92, -4
NOTE: +p<0.20, *p<0.10, **p<0.05, ***p<0.01. Bold font indicates findings that are statistically significant at p<0.10. §: Quarterly Impact is the average quarterly DID estimate per quarter of program implementation. §§: Aggregate Impact is the total DID estimate for all program participants across all quarters of program implementation. Aggregate Impact is estimated for this awardee based on the total number of program participants (2,511) and length of program implementation in analysis (8 quarters). PAH = potentially avoidable hospitalization
NORC | HCIA Complex/High-Risk Patient Targeting
ADDENDUM TO THE THIRD ANNUAL REPORT | 70
In our subgroup analysis (please see Appendix D, Exhibits D.J-CHiP.12 and D.J-CHiP.13), which compared J-CHiP’s community program Medicare and Medicaid beneficiaries who had continuous contact each quarter (any contact by phone, email, or in-person with program staff each quarter) and those who did not have contact each quarter to their matched comparators, we found impacts in cost of care consistent with the findings presented for the overall program, such that for both those with continuous contact and those without, there was a non-significant increase in cost of care. As with the findings for all Medicare beneficiaries, when stratified by continuity of contact, we did not find significant declines in utilization. However, among J-CHiP’s community program Medicaid beneficiaries, those with continuous contact experienced significantly better results compared to the matched group, consistent with the main findings: total cost of care was $1,887 lower, and there was a significant decrease in hospitalization, ED visits, and potentially avoidable hospitalizations (PAHs), compared to the matched group. However, we found no statistically significant differences in cost and utilization between J-CHiP’s community program beneficiaries who received intermittent contact. In conducting these analyses, we expect that results may change if we exclude beneficiaries who disenrolled. For this reason, we conducted additional analyses excluding these beneficiaries (not presented in this report). A beneficiary’s case may be closed by case managers either after leaving the program (e.g., due to having reached a stable state and no longer needed intervention services through the J-CHiP program) or through consecutive lack of attendance. About 10 percent of the cases were closed during the study period. These findings did not change the interpretation of the results for the analysis by continuous or non-continuous contact.
Impact of J-CHiP Community Arm in Each Quarter of Enrollment, Medicaid. Findings from a quarterly fixed effects (QFE) models for impact—for each quarter individually rather than for an average quarter— are consistent with the average quarterly impact summarized above.87
Hospital to Community Crossover Analysis
In order to better understand how the hospital and community programs interacted and if there were synergies across the two arms, we present an analysis of beneficiaries who received the J-CHiP hospital intervention post-discharge and were enrolled in J-CHiP’s community arm within 30 days following discharge. Different from the analyses presented in the previous sections, we present outcomes for the first quarter following discharge, for each episode. Thus, our DID results are summative in nature, reflecting the average impact for the first quarter following discharge, for beneficiaries with an inpatient admission who enrolled in the community arm within 30 days. The DID results are relative to a comparison group of inpatient admissions who did not receive any post-discharge care planning or community intervention from the J-CHiP program staff (we are not able to determine if they were provided some other form of planning or intervention from the hospitals from which they were discharged). We restricted our selection of comparison episodes to those which occurred to beneficiaries whose primary care office was located in the same seven ZIP codes in Baltimore as those who received the J-CHiP community intervention.
After applying the inclusion criteria of a 30-day enrollment to the J-CHiP Medicare population, we determined that it would not be appropriate to present these analyses, since the treatment and comparison
87 See Appendix D for presentation of these results.

NORC | HCIA Complex/High-Risk Patient Targeting
ADDENDUM TO THE THIRD ANNUAL REPORT | 71
groups were systematically different even after propensity score weighting and matching.88 For this reason, we present results only for the Medicaid population.89
Hospital to Community Crossover Analysis, Medicaid: This analysis compares the experiences of Medicaid beneficiaries who were discharged from the hospital program and enrolled in the community program with those of a matched group of comparators. It considers the impact on utilization, cost, and quality of care of the two J-CHiP program arms across the entire intervention period.
Descriptive Characteristics, Hospital to Community Crossover Analysis, Medicaid. Exhibit J-CHiP.8 displays the descriptive characteristics of Medicaid beneficiaries who received the J-CHiP hospital intervention post-discharge and then enrolled in J-CHiP’s community arm and a matched comparison sample, with respect to demographics, prior utilization, and program enrollment.90 We observe that J-CHiP participants are older (p<0.01), are more likely to be Black (p<0.01), are more likely to be in the “Very High” RUB category based on ACG risk score (p<0.01), were less likely to be discharged to home (p<0.01), are less likely to be dual eligible (p<0.01), had more hospitalizations in the year prior to program enrollment (p<0.01 for both), and had higher total Medicaid cost in the year prior to program enrollment (p<0.01).
88 We found 172 episodes in the J-CHiP Medicare population that met the inclusion criteria (and were not missing on the covariates for the propensity score model), but we were not able to find an appropriately similar group of inpatient admissions. After estimating propensity score weights, we had 1,967 comparison episodes, but there were significant differences in the characteristics of the populations between the J-CHiP and the comparison group in the post period---and these differences were larger than those observed in the main Hospital and Community arm analyses. Moreover, while we were able to use propensity score matching to find suitable comparison beneficiaries in the Community analysis, we still had significant differences in the populations after attempting to match episodes. J-CHiP beneficiaries who enrolled in the community arm 30 days after discharge had significantly higher HCC scores and a greater number of chronic conditions, were significantly more disabled, and were significantly more likely to be admitted for more medical rather than surgical procedures (indicated by MS-DRG type). The J-CHiP post-discharge community intervention enrollees also had significantly higher total cost of care, hospitalizations, and ED visits in the prior year, and were also more likely to be non-White and male, and under age 65. Because of these substantial differences, we do not present any results for the Medicare population 89 See Appendix D for propensity score weighting results; tests of common support and covariate balance across treatment and comparison groups indicate that weighting improves comparability. 90 We test differences between the J-CHiP and comparison group in the post-period, with a t-test for continuous measures (coverage, comorbidities, and utilization one year prior to program enrollment) or a chi-square test for categorical parameters (gender, age, race, dual indicator, and managed care indicator).
Measures (per 1,000 beneficiary-episodes unless noted) 90-day Total Cost of Care per beneficiary-episode ($) 90-day Hospitalizations 90-day Emergency Department (ED) visits 30-day Readmissions 7-Day Practitioner Follow-Up 30-Day Practitioner Follow-Up

NORC | HCIA Complex/High-Risk Patient Targeting
ADDENDUM TO THE THIRD ANNUAL REPORT | 72
Exhibit J-CHiP.10: Descriptive Characteristics for the J-CHiP Hospital to Community Crossover and Comparison Group Beneficiary-Episodes, Medicaid
Pre-Intervention Post-Intervention
J-CHiP Comparison J-CHiP Comparison Number of Beneficiary-Episodes 2420 483 171 551 Age *** % (N) 20-39 years 24.0 (582) 28.6 (138) 13.5 (23) 37.2 (205) 40-60 years 47.5 (1150) 46.0 (222) 58.5 (100) 45.7 (252) 61-75 years 19.8 (478) 17.0 (82) 20.5 (35) 12.3 (68) 76+ years 8.7 (210) 8.5 (41) 7.6 (13) 4.7 (26) Race/Ethnicity *** % (N) White 35.6 (862) 66.5 (321) 33.3 (57) 63.5 (350) Black 51.7 (1250) 20.3 (98) 56.7 (97) 22.3 (123) Other 12.7 (308) 13.3 (64) 9.9 (17) 14.2 (78) Gender % (N) Female 54.1 (1309) 58.6 (283) 60.8 (104) 59.0 (325) Adjusted Clinical Groups (ACG) *** % (N) Very High Resource Utilization Band 47.1 (1140) 45.8 (221) 77.7 (132) 41.7 (230) Reason for Coverage % (N) Age 8.2 (199) 6.4 (31) 3.5 (6) 3.1 (17) Disability 59.0 (1427) 49.3 (238) 27.5 (47) 33.4 (184) Other 32.8 (794) 44.3 (214) 69.0 (118) 63.5 (350) Discharge Status *** % (N) Home 71.2 (1723) 75.6 (365) 66.7 (114) 78.8 (434) SNF 2.7 (66) 5.2 (25) 1.8 (3) 4.2 (23) Other 26.1 (631) 19.3 (93) 31.6 (54) 17.1 (94) Dual Eligibility *** % (N) Not Dually Eligible 51.8 (1253) 51.3 (248) 45.6 (78) 67.3 (371) Mean Utilization and Cost in Year Prior to Program Enrollment (per 1,000 beneficiary-episodes unless noted) Total Medicaid Cost (Standard Deviation) per beneficiary-episode***
$20,003 ($42,835)
$24,650 ($71,648)
$28,213 ($49,722)
$18,387 ($48,968)
Hospitalizations (SD) *** 956 (2,244) 1,522 (3,508) 1,720 (2,961) 1,031 (2,270) ED Visits (SD) 1,746 ( 6,429) 2,516 ( 4,912) 1,905 ( 4,086) 1,891 ( 3,537)
NOTE: *p<0.10, **p<0.05, ***p<0.01.
Impact of J-CHiP Hospital and Community Arms Cross Over, Medicaid. Exhibit J-CHiP.11 presents the impact of J-CHiP’s hospital and community arms on Medicaid participants relative to the comparison group, in the first 90 days after discharge, for each beneficiary who enrolled in the community program within 30 days of discharge.91 Utilization measures are reported as binary indicators, noting whether an event occurred in each quarter for a specific beneficiary-episode. Estimates are presented for the impact of the program on all Medicaid participants (pooled), as well as separately for dually eligible beneficiaries
91Adjustment factors include post-intervention indicator, age category, gender, race/ethnicity, indicators for reason for Medicaid coverage, Medicaid coverage in the prior year, RUB category based on ACG score, and lag year cost and utilization. Pooled models also include a dual eligibility indicator.

NORC | HCIA Complex/High-Risk Patient Targeting
ADDENDUM TO THE THIRD ANNUAL REPORT | 73
and those enrolled only in Medicaid.92 For duals, we present only impacts on costs of care and ED visits, since Medicare is the primary payer for hospital and physician services for these beneficiaries.
For all Medicaid beneficiaries (pooled analysis), we find the following, relative to the comparison group:
Cost: A significant decrease in total cost of care (-$6,723 per beneficiary per quarter), greater than the decrease noted for the hospital arm alone.
Utilization Measures: Significant decreases in beneficiaries with ED visits (-154 per 1,000 beneficiaries per quarter), greater than the decrease noted for the hospital arm alone.
Quality of Care: Significant decreases in beneficiaries 7-day practitioner follow-up (-124 per 1,000 beneficiaries per quarter) and 30-day practitioner follow-up (-125 per 1,000 beneficiaries per quarter).
For dually eligible Medicaid beneficiaries, we find the following, relative to the comparison group:
Cost: A non-significant decrease in total cost of care per quarter, greater in magnitude than the decrease noted for the hospital arm alone.
Utilization: A non-significant decrease in ED visits per quarter.
For beneficiaries enrolled only in Medicaid, we find the following, relative to the comparison group:
Cost: A significant decrease in total cost of care (-$19,559 per beneficiary per quarter), greater than the decrease noted for the hospital arm alone.
Utilization Measures: A significant decrease in ED visits (-291 per 1,000 beneficiaries per quarter), greater than the decrease noted for the hospital arm alone.
Quality of Care: Significant increases in 7-day practitioner follow-up (114 per 1,000 beneficiaries per quarter) and 30-day practitioner follow-up (157 per 1,000 beneficiaries per quarter), indicating better quality of follow-up care than the hospital arm alone.
Exhibit J-CHiP.11: Impact of the J-CHiP Hospital and Community Arms Jointly on Outcomes, Medicaid
Outcome Measure (per 1,000 Beneficiary-episodes
unless noted)
Pooled Medicaid (N=171)
Dually Eligible (N=93)
Medicaid Only (N= 78)
Adjusted Estimate
90% Confidence
Interval
Adjusted Estimate
90% Confidence
Interval
Adjusted Estimate
90% Confidence
Interval 90-day Total Cost of Care per Beneficiary-episode
-$6,273* -$11,988, -$558
-$2,006 -$5,333, $1,321
-$19,559*** -$29,812, -$9,306
90-day Hospitalizations 105 -7, 217 -101 -279, 77
90-day ED Visits -154 ** -266, -42 -72 -226, 82 -291 *** -439, -143
30-day Readmissions 62 -30, 154 -154+ -309, 1
7-day Practitioner Follow-up Visits
-124 ** -214, -34
114* 9, 219
30-day Practitioner Follow-up Visits
-125 ** -240, -10 157* 10, 304
NOTE: +p<0.20, *p<0.10, **p<0.05, ***p<0.01. Bold font indicates findings that are statistically significant at p<0.10.
92 For cost of care for Medicaid-only beneficiaries we estimated two-part models to account for more than 25% of the data with no cost; results were consistent to the GLM specification (see Appendix C for details).

NORC | HCIA Complex/High-Risk Patient Targeting
ADDENDUM TO THE THIRD ANNUAL REPORT | 74
Discussion: In our analysis of impacts for Medicaid beneficiaries who received the J-CHiP hospital intervention post-discharge and then enrolled in the J-CHiP community arm, we see greater decreases in Medicaid total cost of care and ED visits than what was noted for the hospital arm alone. Comparing the experiences of dually eligible beneficiaries with those enrolled only in Medicaid, we find that significant cost savings are found for the Medicaid only population but not the dually eligible population; similarly, the reduction in ED visits among Medicaid only participants is significant and of a higher magnitude than the reduction seen for dually eligible participants. Additionally, participants enrolled only in Medicaid showed increases in both practitioner follow-up measures. The decrease in ED visits and improved practitioner follow-up were greater in magnitude than what was noted for the hospital arm alone.
The following limitations of our hospital to community crossover analysis should be acknowledged. First, we were unable to sufficiently match Medicare beneficiaries to potential comparators and thus results for the Medicare beneficiaries enrolled in the J-CHiP programs are not presented here. Second, due to the small number of J-CHiP participants who both received the hospital intervention and were subsequently enrolled in the community intervention, the sample size for this analysis is small and results should be interpreted with caution.
Our analysis suggests that high-risk Medicaid only beneficiaries who enrolled in the community arm immediately after discharge from the hospital arm, had lower Medicaid spending and ED use, and greater follow up with practitioners post-discharge, compared to similar beneficiaries receiving the hospital arm alone.
Summary Hospital Arm. Our Medicaid analyses of J-CHiP’s hospital arm show significant decreases in cost of care, decreases in ED visits, while for the Medicare analyses, there were no increases in hospitalizations and readmissions and decreases in post-discharge practitioner follow-up visits. We observed that the largest category of savings among Medicare enrollees was for post-acute care at skilled nursing facilities (SNFs), while for Medicaid enrollees, there was a significant decrease in inpatient and outpatient care costs. This may be partly attributed to the program’s emphasis on identifying and planning how to meet patients’ continuing care needs, and linking patients with community resources, enabled more beneficiaries to manage care after discharge and have better care at home.
For Medicaid, we find that the observed decrease in total cost reflects greater decreases seen for beneficiaries enrolled only in Medicaid, compared to the dually eligible beneficiaries, for whom Medicare is the primary payer for care in the post-acute period. Overall decreases in cost of care are greater for Medicaid than for Medicare. In understanding the greater cost savings observed for the Medicaid populations, we consider the nature of the services provided by the program, and the targeted population. One plausible scenario is that the Medicaid patient population targeted by the J-CHiP program had more adversity in some clinical health measures not captured in our claims data and had fewer social and structural resources than the comparison population and the Medicare population. The target of the program were those most at risk for readmission. The program had an intensive focus on attending to comorbidities and providing community resources and social supports during the post-intervention. Therefore, the Medicaid patients targeted may have had clinical and social conditions that were more amenable to the J-CHiP intervention, and thus made larger improvements in well-being compared to the

NORC | HCIA Complex/High-Risk Patient Targeting
ADDENDUM TO THE THIRD ANNUAL REPORT | 75
comparison group, as well as to the Medicare population. Thus, there may have been more potential for improvement in this population.
The following limitations of our analysis for J-CHiP’s hospital arm should be acknowledged. We report program impacts for J-CHiP relative to a comparison group from three hospitals in Maryland. Implementation of Maryland’s all-payer demonstration during the performance period, precludes using hospitals from other states that participate in Medicare’s Inpatient Prospective Payment System (IPPS) as comparators. In using hospitals from Maryland as comparators, we assume that the all-payer demonstration affects J-CHiP and comparison hospitals in similar fashion.
Community Arm. In our analysis of impacts for J-CHiP’s community arm, we observe significant decreases in Medicaid total cost of care. We also find non-significantly fewer hospitalizations and ED visits for Medicare and Medicaid beneficiaries, along with significantly fewer readmissions and potentially avoidable hospitalizations for Medicaid beneficiaries. Comparing the experiences of dually eligible beneficiaries with those enrolled only in Medicaid, we find that cost savings are greater for Medicaid only participants, while dual eligibility is associated with a greater decrease in ED visits and potentially avoidable hospitalizations. We found few differences in outcomes of participants who had continuous contact compared to those who did not.
The following limitations of our analysis for J-CHiP’s community arm should be acknowledged. Our findings for those with continuous enrollment, which were no different from the main conclusions, may be partly because persons may leave the program due to less need for support from the program and improved functioning. In these analysis, “enrollment” for the comparison group based on their having an evaluation and management visit on the claim; as a result, while both groups have similar baseline utilization and costs, the comparison group, by definition, was as likely to get care at the time of “enrollment” as J-CHiP’s participants. It is unclear how selection of the comparison group based on realized ambulatory care may bias the results.

NORC | HCIA Complex/High-Risk Patient Targeting
ADDENDUM TO THE THIRD ANNUAL REPORT | 76
Johns Hopkins University School of Nursing
Project Community Aging In Place, Advancing Better Living for Elders (CAPABLE). An occupational therapist (OT) and RN care manager conduct a series of home visits over 16 weeks, collaborating with the client to identify one or more goals to improve functioning and to take steps toward achieving the goal(s). The intervention takes place at the home and includes handyman services to address housing-related safety risks and improve health and functioning.
PROGRAM MODELS: Care/Case Coordination, Home Health/Home Care, Patient Navigation
LOCATION: Baltimore, MD REACH: 258 beneficiaries (100% of target)§
GRANT: $4,093,356 POPULATIONS: Older Adults, Racial/Ethnic Minorities, Urban, Dually Eligible Beneficiaries
AWARD DATES: 11/11/12 to 1/31/16 DATA, ADDENDUM REPORT: Medicare claims (July 2012 to June 2016); Medicaid claims (July 2012 to June 2016)
NO-COST EXTENSION: 6 months, full program PAYER(S): Medicare, Medicaid
OUTCOMES§§
Findings do not reach statistical significance.
Findings do not reach statistical significance.
Findings do not reach statistical significance.
Analysis limited due to small sample size.
SUMMARY: Consistent with findings in NORC’s Third Annual Report, we observe quarters with significant cost savings and decreases in utilization, but find no significant overall impacts for JHU SON’s Project CAPABLE on Medicare or Medicaid beneficiary outcomes. However, the small sample size in the treatment groups for both the Medicare (n=171) and Medicaid (n=177) analyses limit our ability to draw conclusions on Project CAPABLE’s impacts. Impact may be difficult to gauge, not only because of the relatively small sample size (and incidence of claims) but also because CAPABLE is focused primarily on improving beneficiary functioning at home, and in delaying entry to institutional living, rather than on influencing health care cost and utilization.
§ Target is for initial performance period, through 6/30/2015.§§Outcomes for cost, utilization, and quality of care are from analyses that include a comparison group and are statistically significant at the P<0.10 level.

NORC | HCIA Complex/High-Risk Patient Targeting
ADDENDUM TO THE THIRD ANNUAL REPORT | 77
Program Effectiveness
We present results of quarterly fixed effects (QFE) difference-in-differences (DID) analyses for Medicare fee-for-service (FFS) and Medicaid beneficiaries in JHU SON’s Project CAPABLE program from July 1, 2012, through June 30, 2016, relative to a comparison group. This analysis includes two additional quarters of claims data, compared with the analysis reported in NORC’s Third Annual Report.
■ The Medicare analysis identifies small, non-significant increases in cost, hospitalizations and ACS hospitalizations, and decreases in ED visits and readmissions. These findings represent changes from results reported in the Third Annual Report, where we observed a non-significant decrease in hospitalizations and increase in ED visits.
■ The Medicaid analysis identifies non-significant cost savings and an increase in hospitalizations. These findings represent changes from those reported in the Third Annual Report, where we observed non-significant cost expenditures and a decrease in hospitalizations.
The analytic sample size remains modest for both populations (n=171 for Medicare FFS, n=177 for Medicaid), despite the two additional quarters of claims data. As with NORC’s Third Annual Report, analyses are limited to beneficiaries dually eligible for Medicare FFS and Medicaid, in keeping with the intervention’s inclusion criteria; the smaller analytic sample than what was reported in NORC’s Third Annual Report, means that results should be interpreted with caution.93
Core and Supplemental Measures: Medicare
Our community (ambulatory care) analysis compares the experiences of Project CAPABLE enrollees with those of a matched group of comparators. It considers the impact on cost, utilization, and quality of care of the awardee’s innovation over the enrollment period as a whole and in each quarter of enrollment. Our analysis includes Medicare FFS and dually eligible beneficiaries, comprising 100 percent of enrollees.94
Finder File and Creation of Analytic Sample, Medicare. JHU SON provided a finder file of program participants and enrollment dates, enabling us to use Medicare claims in the CMS Virtual Research Data Center (VRDC) to calculate outcome measures.95 We identified 281 unique participants and further
93 The awardee’s self-reported data, as presented in the HCIA Fourteenth Quarterly Reporting Period (Q14), October, November, and December 2015. Submitted to CMMI by JHU SON, March 2, 2016. There is a discrepancy between the self-reported data and NORC’s assessment of claims, in which 70 percent of enrollees are identified as dually eligible. For this analysis, 99% of Medicaid-only comparison beneficiaries had $0 total cost of care in the year prior to the intervention start date, resulting in these beneficiaries being unsuitable comparators. Therefore, our Medicaid analysis in this report is limited to dual eligible beneficiaries. 94 The awardee’s self-reported data, as presented in the HCIA Fourteenth Quarterly Reporting Period (Q14), October, November, and December 2015. Submitted to CMMI by JHU SON, March 2, 2016. 95 Medicare claims are available through September 30, 2016, for the analysis in this report. The awardee completed enrollment in September 2015 and closed out delivery of HCIA-supported services by December 31, 2015. Our analysis considers claims for the first two quarters of 2016 (June 30, 2016, as the cut-off date), with the expectation that program impacts would continue to be experienced as a result of changes implemented during Project CAPABLE.
Measures (per 1,000 beneficiaries unless noted) Total Cost of Care per beneficiary All-cause Hospitalizations Emergency Department (ED) Visits 30-day Readmissions Ambulatory Care Sensitive (ACS) Hospitalizations

NORC | HCIA Complex/High-Risk Patient Targeting
ADDENDUM TO THE THIRD ANNUAL REPORT | 78
limited this number by enrollment date, Medicare identifiers, and Medicare FFS status, yielding an analytic sample of 171 beneficiaries.
Comparison Group, Medicare. The comparison pool consisted of non-institutionalized Medicare FFS patients from the same Maryland zip codes where Project CAPABLE program participants reside. We used propensity score matching to find appropriate comparators.96 The final propensity score model direct matched on age, race and gender and also included disability status, Hierarchical Condition Category (HCC) score and indicators for hypertension, hyperlipidemia, and diabetes, and prior year utilization (hospitalizations and ED visits) and cost. Tests of common support and covariate balance across treatment and comparison groups indicate that propensity score matching improves comparability.97
Descriptive Characteristics, Medicare. Exhibit JHUSON.1 displays the descriptive characteristics of beneficiaries in the treatment and comparison group, with respect to demographics, comorbidities, and prior utilization.98 We observe no differences in demographics, comorbidities, or prior utilization measures between Project CAPABLE participants and the comparison group, similar to findings from NORC’s Third Annual Report.
96 For more information on propensity score matching methodology, please see NORC’s Third Annual Report, Appendix C. 97 For more detailed information on propensity score matching and tests of common support and covariate balance for this awardee, please see Appendix D. 98 We compare differences between these groups with a t-test for continuous measures (comorbidities and utilization one year prior to program enrollment) or a chi-square test for categorical parameters (gender, age, race, dual eligibility, and coverage reason).
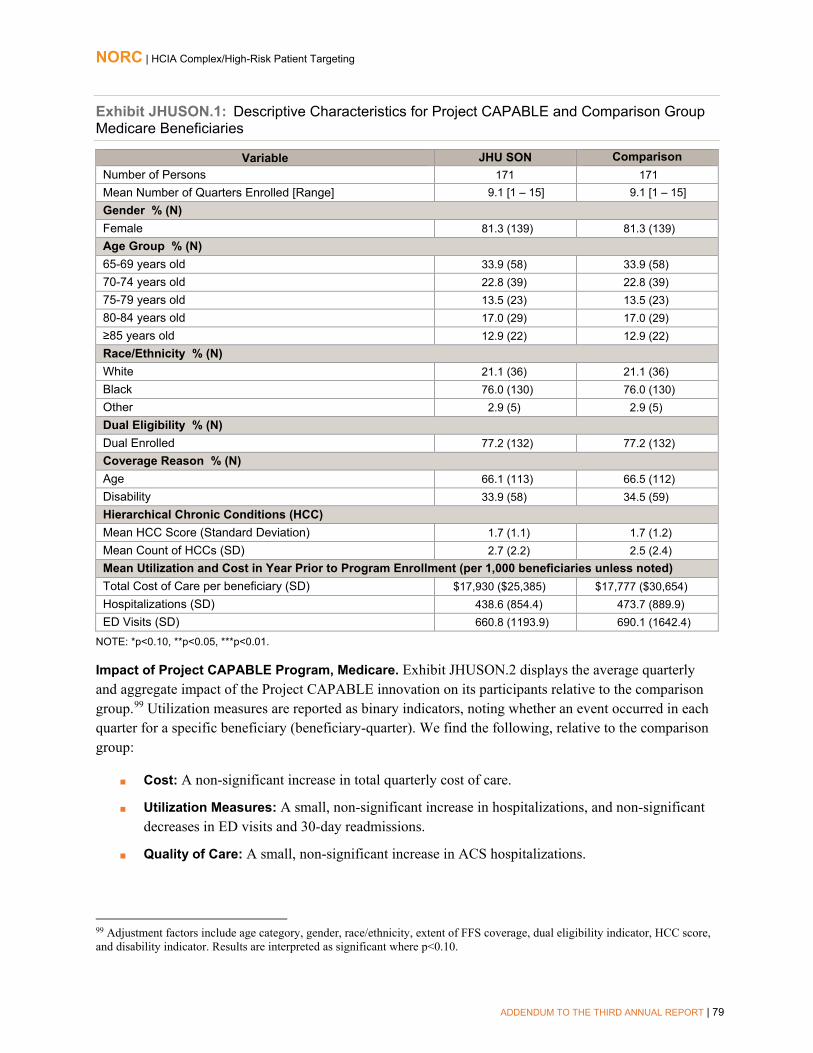
NORC | HCIA Complex/High-Risk Patient Targeting
ADDENDUM TO THE THIRD ANNUAL REPORT | 79
Exhibit JHUSON.1: Descriptive Characteristics for Project CAPABLE and Comparison Group Medicare Beneficiaries
Variable JHU SON Comparison Number of Persons 171 171 Mean Number of Quarters Enrolled [Range] 9.1 [1 – 15] 9.1 [1 – 15] Gender % (N) Female 81.3 (139) 81.3 (139) Age Group % (N) 65-69 years old 33.9 (58) 33.9 (58) 70-74 years old 22.8 (39) 22.8 (39) 75-79 years old 13.5 (23) 13.5 (23) 80-84 years old 17.0 (29) 17.0 (29) ≥85 years old 12.9 (22) 12.9 (22) Race/Ethnicity % (N) White 21.1 (36) 21.1 (36) Black 76.0 (130) 76.0 (130) Other 2.9 (5) 2.9 (5) Dual Eligibility % (N) Dual Enrolled 77.2 (132) 77.2 (132) Coverage Reason % (N) Age 66.1 (113) 66.5 (112) Disability 33.9 (58) 34.5 (59) Hierarchical Chronic Conditions (HCC) Mean HCC Score (Standard Deviation) 1.7 (1.1) 1.7 (1.2) Mean Count of HCCs (SD) 2.7 (2.2) 2.5 (2.4) Mean Utilization and Cost in Year Prior to Program Enrollment (per 1,000 beneficiaries unless noted) Total Cost of Care per beneficiary (SD) $17,930 ($25,385) $17,777 ($30,654) Hospitalizations (SD) 438.6 (854.4) 473.7 (889.9) ED Visits (SD) 660.8 (1193.9) 690.1 (1642.4)
NOTE: *p<0.10, **p<0.05, ***p<0.01.
Impact of Project CAPABLE Program, Medicare. Exhibit JHUSON.2 displays the average quarterly and aggregate impact of the Project CAPABLE innovation on its participants relative to the comparison group.99 Utilization measures are reported as binary indicators, noting whether an event occurred in each quarter for a specific beneficiary (beneficiary-quarter). We find the following, relative to the comparison group:
■ Cost: A non-significant increase in total quarterly cost of care.
■ Utilization Measures: A small, non-significant increase in hospitalizations, and non-significant decreases in ED visits and 30-day readmissions.
■ Quality of Care: A small, non-significant increase in ACS hospitalizations.
99 Adjustment factors include age category, gender, race/ethnicity, extent of FFS coverage, dual eligibility indicator, HCC score, and disability indicator. Results are interpreted as significant where p<0.10.

NORC | HCIA Complex/High-Risk Patient Targeting
ADDENDUM TO THE THIRD ANNUAL REPORT | 80
The Medicare analysis identifies small, non-significant increases in cost, hospitalizations and ACS hospitalizations, and decreases in ED visits and readmissions. Impact may be difficult to gauge, not only because of the relatively small sample size (and incidence of claims) but also because CAPABLE is focused primarily on improving beneficiary functioning at home, and in delaying entry to institutional living, rather than on influencing health care cost and utilization.
Exhibit JHUSON.2: Impact of the Project CAPABLE Program on Outcomes for Medicare Beneficiaries
AVERAGE QUARTERLY IMPACT§ Outcome Measure
(per 1,000 beneficiaries unless noted) Adjusted Estimate
90% Confidence Interval
80% Confidence Interval
Total Cost of Care per beneficiary ($) $398 -$819, $1,615 -$550, $1,346 Hospitalizations 12 -16, 40 -10, 34 ED Visits -6 -35, 23 -28, 16 30-Day Readmissions -56 -160, 48 -137, 25 Ambulatory Care-Sensitive (ACS) Hospitalizations 7 -5, 19 -2, 16
AGGREGATE IMPACT§§
Outcome Measure Adjusted Estimate
90% Confidence Interval
80% Confidence Interval
Total Cost of Care ($) $595,229 -$1,225,043, $2,415,501 -$823,366, $2,013,824 Hospitalizations 18 -25, 61 -15, 51 ED Visits -9 -52, 34 -43, 25 30-Day Readmissions -9 -25, 7 -22, 4 ACS Hospitalizations 10 -5, 25 -2, 22
NOTE: +p<0.20, *p<0.10, **p<0.05, ***p<0.01. Bold font indicates findings that are statistically significant at p<0.10. §Quarterly impact is the average quarterly DID estimate per quarter of program enrollment. §§Aggregate impact is the total DID estimate for all program participants across all observed quarters of program enrollment. Aggregate impact is estimated for this awardee based on the total number of program participants (171), with an average length of enrollment of 9.1 quarters. Please note that the estimate for aggregate impact may be smaller thant the estimate for average quarterly impact if there are fewer than 1,000 enrolled beneficiaries, as the aggregate estimate is equal to the average quarterly estimate multipled by the sample size in each quarter, divided by 1,000. Disclaimer: Standard statistical practice is to use confidence intervals of 90% or higher. 80% confidence intervals are provided here for comparison purposes.
Impact of Project CAPABLE Program in Each Quarter of Enrollment, Medicare. Findings from a quarterly fixed effects (QFE) DID model of impact for ED visits —for each quarter individually rather than for an average quarter— are consistent with the average quarterly impact summarized above.100 For four other measures –total cost of care, hospitalizations, 30-day readmissions, and ambulatory care-sensitive hospitalizationsestimates on impact each quarter can identify trends otherwise masked by the summary estimates for the full implementation period. Exhibit JHUSON.3 displays the results of the QFE
100 Please see Appendix D for presentation of these results.

NORC | HCIA Complex/High-Risk Patient Targeting
ADDENDUM TO THE THIRD ANNUAL REPORT | 81
DID models for these measures for Project CAPABLE participants, relative to a comparison group.101,102 Adjustment factors include age category, gender, race/ethnicity, extent of FFS coverage, dual eligibility indicator, HCC score, and disability indicator. We observe the following, relative to the comparison group:
■ Cost: A significant decrease in total cost of care in quarters I1 and I6.
■ Utilization Measures: A significant one-quarter decrease in hospitalizations in quarter I12 and 30-day readmissions in quarter I8.
■ Quality of Care: A significant increase in ACS hospitalizations in quarter I3.
While overall estimates do not capture significant impacts of CAPABLE on cost, utilization, or quality measures, the instances of significant cost savings to Medicare during the first 18 months post-enrollment, and of significant decreases in utilization for two quarters later on in the performance period, indicates that positive impacts may be detected over a long enough period of time.
101 For a more detailed explanation of the QFE DID model and measure specification, please see NORC’s Third Annual Report, Appendix C. 102 For utilization and quality of care measures, the effect is displayed as the average difference between treatment and comparison per 1,000 beneficiaries for each quarter during the post-intervention (I1–I12) period, after adjusting for pre-intervention differences between the two groups. For total cost of care, this effect is displayed per beneficiary. We present both 90% confidence intervals (indicated by vertical lines around the estimate) and 80% confidence intervals (indicated by shaded boxes around the estimate). Results are interpreted as significant where p<0.10.

NORC | HCIA Complex/High-Risk Patient Targeting
ADDENDUM TO THE THIRD ANNUAL REPORT | 82
Exhibit JHUSON.3: Impact of the Project CAPABLE Program on Outcomes for Medicare Beneficiaries, by Quarter
Disclaimer: Standard statistical practice is to use confidence intervals of 90% or higher. 80% confidence intervals are provided here for comparison purposes.

NORC | HCIA Complex/High-Risk Patient Targeting
ADDENDUM TO THE THIRD ANNUAL REPORT | 83
Core Measures: Medicaid (Dually Eligible)
Our community (ambulatory care) analysis compares the experiences of JHU SON enrollees with those of a matched group of comparators. It considers the impact on cost, utilization, and quality of care of the awardee’s innovation over the enrollment period as a whole and in each quarter of enrollment. Our analysis includes dually eligible beneficiaries, reported by JHU SON to comprise 100 percent of Project CAPABLE enrollees.103
Finder File and Creation of Analytic Sample, Medicaid. JHU SON provided a finder file of program participants and enrollment dates, enabling us to use Maryland Medicaid claims for these beneficiaries to calculate outcomes measures.104 We identified 252 unique participants and further limited this number by dual eligibility, yielding an analytic sample of 177 beneficiaries.
Comparison Group, Medicaid. The comparison pool consisted of non-institutionalized dual eligible Medicaid patients in the same Maryland zip codes as Project CAPABLE program participants. We used propensity score matching to find appropriate comparators.105 The final propensity score model direct matched on age and also included race, gender, CDPS risk score, and prior year cost and utilization (hospitalizations and ED visits). Tests of common support and covariate balance across treatment and comparison groups indicate that propensity score matching improved comparability.106
Descriptive Characteristics, Medicaid. Exhibit JHUSON.4 displays the descriptive characteristics of beneficiaries in the treatment and comparison groups, with respect to demographics, CDPS risk score, and prior utilization.107 We observe no differences in demographics, CDPS risk score, or prior utilization measures, similar to findings from NORC’s Third Annual Report.
103 The awardee’s self-reported data, as presented in the HCIA Fourteenth Quarterly Reporting Period (Q14), October, November, and December 2015. Submitted to CMMI by JHU SON, March 2, 2016. There is a discrepancy between the self-reported data and NORC’s assessment of claims, in which 70 percent of enrollees are identified as dually eligible. For this analysis, 99% of Medicaid-only comparison beneficiaries had $0 total cost of care in the year prior to the intervention start date, resulting in these beneficiaries being unsuitable comparators. Therefore, our Medicaid analysis in this report is limited to dual eligible beneficiaries. 104 Maryland Medicaid files are available through June 30, 2016, for the analysis in this report. As noted earlier in the chapter, the awardee completed enrollment in September 2015 and closed out delivery of HCIA-supported services by December 31, 2015. Our analysis considers claims for the first two quarters of 2016 (June 30, 2016, as the cut-off date), with the expectation that program impacts would continue to be experienced as a result of changes implemented during Project CAPABLE. 105 For more information on propensity score matching, please refer to NORC’s Third Annual Report, Appendix C. 106 For more detailed information on the propensity score matching and tests of common support and covariate balance for this awardee, please refer to Appendix D. 107 We tested differences between these groups with a t-test for continuous measures (CDPS risk score and utilization one year prior to program enrollment) or a chi-square test for categorical parameters (gender, age, race, and dual eligibility).
Measures (per 1,000 beneficiaries unless noted) Total Cost of Care per beneficiary All-cause Hospitalizations Emergency Department (ED) Visits

NORC | HCIA Complex/High-Risk Patient Targeting
ADDENDUM TO THE THIRD ANNUAL REPORT | 84
Exhibit JHUSON.4: Descriptive Characteristics for Project CAPABLE and Comparison Group Medicaid Beneficiaries
Variable JHU SON Comparison Number of Persons 177 177 Mean Number of Quarters Enrolled [Range] 7.8 [4 – 13] 7.8 [4 – 13] Gender % (N) Female 81.4 (144) 80.8 (143) Age Group % (N) 65-69 years old 34.5 (61) 34.5 (61) 70-74 years old 25.4 (45) 25.4 (45) 75-79 years old 10.2 (18) 10.2 (18) 80-84 years old 18.6 (33) 18.6 (33) ≥85 years old 11.3 (20) 11.3 (20) Race/Ethnicity % (N) White 19.8 (35) 21.5 (38) Black 74.0 (131) 72.3 (128) Other 6.2 (11) 6.2 (11) Chronic Illness and Disability Payment System (CDPS) Risk Score Mean CDPS Risk Score (Standard Deviation) 1.9 (2.1) 1.8 (2.0) Mean Utilization and Cost in Year Prior to Program Enrollment (per 1,000 beneficiaries unless noted) Total Medicaid Cost per beneficiary (SD) $5,146 ($18,192) $5,646 ($17,108) Hospitalizations (SD) 197.7 (465.1) 248.6 (801.5) ED Visits (SD) 497.2 (1369.8) 491.5 (1675.8)
NOTE: *p<0.10, **p<0.05, ***p<0.01.
Impact of Project CAPABLE Program, Medicaid. Exhibit JHUSON.5 displays the average quarterly and aggregate impact of Project CAPABLE on its participants relative to the comparison group.108
Utilization measures are reported as binary indicators, noting whether an event occurred in each quarter for a specific beneficiary (beneficiary-quarter). We find the following, relative to the comparison group:
■ Cost: A small non-significant decrease in total cost of care.
■ Utilization Measures: A non-significant increase in hospitalizations and non-significant decrease in ED visits.
Findings are similar to those seen with Medicare claims data: favorable, non-significant trends are seen for total cost of care and ED visits, with less favorable impact on hospitalizations.
108 Adjustment factors include age category, gender, race/ethnicity, and CDPS risk score. Results are interpreted as significant where p<0.10.

NORC | HCIA Complex/High-Risk Patient Targeting
ADDENDUM TO THE THIRD ANNUAL REPORT | 85
Exhibit JHUSON.5: Impact of the Project CAPABLE Program on Outcomes for Medicaid Beneficiaries
AVERAGE QUARTERLY IMPACT§ Outcome Measure
(per 1,000 beneficiaries unless noted) Adjusted Estimate
90% Confidence Interval
80% Confidence Interval
Total Cost of Care per beneficiary ($) -$76 -$941, $789 -$750, $598 Hospitalizations 11 -12, 34 -7, 29 ED Visits -5 -27, 17 -22, 12
AGGREGATE IMPACT§§
Outcome Measure Adjusted Estimate
90% Confidence Interval
80% Confidence Interval
Total Cost of Care ($) -$89,036 -$1,106,728, $928,656 -$882,155, $704,083 Hospitalizations 14 -17, 45 -10, 38 ED Visits -6 -35, 23 -29, 17
NOTE: +p<0.20, *p<0.10, **p<0.05, ***p<0.01. Bold font indicates findings that are statistically significant at p<0.10. §Quarterly impact is the average quarterly DID estimate per quarter of program enrollment. §§Aggregate impact is the total DID estimate for all program participants across all observed quarters of program enrollment. Aggregate impact is estimated for this awardee based on the total number of program participants (177), with an average length of enrollment of 7.8 quarters. Disclaimer: Standard statistical practice is to use confidence intervals of 90% or higher. 80% confidence intervals are provided here for comparison purposes.
Impact of Project CAPABLE Program in Each Quarter of Enrollment, Medicaid. Findings from a QFE DID model of impact for total cost of care —for each quarter individually rather than for an average quarter— are consistent with the average quarterly impact summarized above.109 As with the Medicare estimates above, looking at changes from quarter to quarter in hospitalizations and ED visits can identify trends otherwise masked by summary estimates. Exhibit JHUSON.6 displays the results of the QFE DID models for these measures, relative to a comparison group.110 Adjustment factors include age category, gender, race/ethnicity, and CDPS risk score.111 We observe significant decreases in hospitalizations for two quarters (I5-I6) and in ED visits for one quarter (I5).
109 Please see Appendix D for presentation of these results. 110 For both measures, the effect is displayed as the average difference between treatment and comparison per 1,000 beneficiaries for each quarter during the post-intervention (I1—I10) period, after adjusting for pre-intervention differences between the two groups. We present both 90% confidence intervals (indicated by vertical lines around the estimate) and 80% confidence intervals (indicated by shaded boxes around the estimate). Results are interpreted as significant where p<0.10. 111 For a more detailed explanation of the QFE DID model and measure specification, please see NORC’s Third Annual Report, Appendix C.

NORC | HCIA Complex/High-Risk Patient Targeting
ADDENDUM TO THE THIRD ANNUAL REPORT | 86
Exhibit JHUSON.6: Impact of the Project CAPABLE Program on Outcomes for Medicaid Beneficiaries, by Quarter
Disclaimer: Standard statistical practice is to use confidence intervals of 90% or higher. 80% confidence intervals are provided here for comparison purposes.
Summary
Our claims-based analyses of Project CAPABLE update our understanding of the innovation, as presented in NORC’s Third Annual Report. For Medicare claims, we observe non-significant increases in total cost of care, hospitalizations and ACS hospitalizations, and non-significant decreases in ED visits and 30-day readmissions, relative to a comparison group. Considering impacts from quarter to quarter, there are quarters with significant cost savings and decreases in hospitalizations and 30-day readmissions, relative to a comparison group. The small sample size in the treatment group limits our ability to draw conclusions on Project CAPABLE’s impacts, as our analyses may not be sufficiently powered to detect differences. In the case of Medicaid claims, for the same group of beneficiaries (as all enrollees are dually eligible), we observe non-significant decreases in total cost of care and ED visits and an increase in hospitalizations, although there are quarters with significant decreases in hospitalizations (I5-I6) and ED visits (I5). While cost and utilization measures continue to show no significant differences between the Project CAPABLE beneficiaries and comparison group beneficiaries, total cost of care and hospitalizations shifted in direction to now suggest a small, non-significant savings in total cost of care and a small, non-significant increase in hospitalizations. As with the Medicare analysis, the small sample size in the post-intervention treatment group limits our ability to draw conclusions about Project CAPABLE’s impacts.

NORC | HCIA Complex/High-Risk Patient Targeting
ADDENDUM TO THE THIRD ANNUAL REPORT | 87
LifeLong Medical Care
Complex Care Initiative (LCCI). Federally-qualified health center (FQHC) LifeLong Medical Care offers clinic-based care coordination and client engagement to high-risk adults. The innovation includes home visits integrated with peer-coaching and workshops focused on independent living (IL) skills offered by implementation partner, the Center for Independent Living (CIL).
PROGRAM MODELS: Care/Case Coordination, Collaborative Medical Home, Independent Living Skills, Patient Navigation
LOCATION: Berkeley, CA REACH: 317 beneficiaries (89% of target) §
GRANT: $1,109,231 POPULATIONS: Behavioral Health/Substance Abuse, Disability, Dually Eligible, Limited English Proficiency, Racial/Ethnic Minority, Urban
AWARD DATES: 12/27/12 to 12/31/15 DATA, ADDENDUM REPORT: Medi-Cal claims (January 2013 to June 2015) NO-COST EXTENSION: 6 months
PAYER(S): Medi-Cal, Medicare
OUTCOMES§§
Findings not statistically significant
Findings not statistically significant
SUMMARY: This report updates NORC’s Third Annual Report findings for LifeLong, presenting a new set of outcome estimates, based on a dataset constructed using discrete quarters of data, and for the first time, an estimate of LCCI’s impact on the total quarterly cost of care. Findings differ from NORC’s Third Annual Report, with non-significant increases in costs and hospitalizations and non-significant decreases in ED visits and 30-day readmissions, relative to a comparison group. Considering impact from quarter to quarter, there are statistically significant decreases in the MediCal total cost of care in five, seven, and eight quarters after enrollment, reinforcing the finding in the Third Annual Report of cost savings in the intervention’s second year, and participants had a significantly lower ED visit rate in three and eight quarters after enrollment. These findings suggest that the program may have a long-term impact on costs. However, these findings must be interpreted with caution, given the relatively small number of beneficiaries included in our analysis of claims experience (n=224) and small number of claims in later implementation quarters.
§Target is for initial performance period, through 6/30/2015.§§Outcomes for utilization are from analyses that include a comparison group and are statistically significant at the p<0.01 level.

NORC | HCIA Complex/High-Risk Patient Targeting
ADDENDUM TO THE THIRD ANNUAL REPORT | 88
Program Effectiveness
We present results of quarterly fixed effects (QFE) difference-in-differences (DID) analyses for Medicaid (Medi-Cal) beneficiaries in the Lifelong Complex Care Initiative (LCCI) program from December 27, 2012, through June 30, 2015, relative to a comparison group.112 The analysis in this report includes two additional quarters of follow-up time and presents quarterly estimates for outcomes instead of annual outcomes, compared with the analyses presented in NORC’s Third Annual Report. In addition, due to availability of data, we are able to present a total cost of care outcome measure for Lifelong.
We find that the LCCI intervention is associated with non-significant increases in total cost of care and hospitalizations, relative to the comparison group; in addition, there are also decreases in ED visits and 30-day readmissions that do not reach statistical significance. These findings revise our understanding of the LCCI program as presented in NORC’s Third Annual Report, as we no longer see significant decreases in hospitalizations or ED visits. However, these findings are not directly comparable due to the inclusion of cost data for the first time and because of the different timeframe for the measures used in NORC’s Third Annual Report. In addition, the analytic sample size remains fairly small (n=224). For this reason, the results should be interpreted with caution.
Core Measures
Our community (ambulatory care) analysis compares the experiences of LCCI enrollees with those of a matched group of comparators. It considers the impact on cost and utilization of the awardee’s LCCI program over the implementation period as a whole and in each quarter of program implementation. Our analysis is for Medi-Cal beneficiaries, who comprise 98 percent of the awardee’s enrollees.113
Finder File and Creation of Analytic Sample. LifeLong provided a finder file that lists 233 unique program participants and their enrollment dates, enabling us to use health plan data provided by Alameda Alliance for Health, LifeLong’s health plan partner, for these Medi-Cal beneficiaries to calculate outcome measures. We further limited this number by enrollment date to yield an analytic sample of 224 beneficiaries.
Comparison Group. The comparison pool consists of approximately 10,000 patients who were not enrolled in LifeLong’s program, from FQHCs associated with LifeLong’s program. We use propensity score matching to find appropriate comparators.114 The final propensity model includes age,
112 Although LifeLong received an NCE through December 31, 2015, the period was designated for writing the closeout report, and the program did not enroll new participants or continue to provide services, as described in HCIA Fourteenth Quarterly Reporting Period (Q14), October, November, and December 2015. Submitted to CMMI by LifeLong, March 2, 2016. To capture the period in which we expect LifeLong participants to be benefiting from the program, we use June 30, 2015 as the cutoff date for this analysis. 113 The awardee’s self-reported data, as presented in the HCIA Twelfth Quarterly Reporting Period (Q12), April, May, and June 2015. Submitted to CMMI by Lifelong Medical Care, August 31, 2015. Subsequent awardee self-reported data (HCIA Q13 and Q14 reports) do not include data on participants by payer, as beneficiaries were not enrolled or served using HCIA funds during those time periods. 114 For more information on our propensity score matching methodology, please see NORC’s Third Annual Report, Appendix C.
Measures (per 1,000 beneficiaries unless noted) Total Cost of Care per beneficiary All-cause Hospitalizations Emergency Department (ED) Visits 30-day Readmissions

NORC | HCIA Complex/High-Risk Patient Targeting
ADDENDUM TO THE THIRD ANNUAL REPORT | 89
race/ethnicity, gender, Chronic Illness and Disability Payment System (CDPS) risk score, indicator for psychiatric illness, disability status, and prior year cost and utilization (hospitalizations and ED visits). Tests of common support and covariate balance across treatment and comparison groups indicate that propensity score matching improved comparability.115
Descriptive Characteristics. Exhibit LCCI.1 displays the descriptive characteristics of beneficiaries in the LCCI program and in the comparison group. We compare the two groups of beneficiaries with respect to demographics, comorbidities, and prior utilization.116 We observe few differences in demographics, comorbidities, or prior utilization measures, although LCCI enrollees have significantly lower prior year ED visits, relative to the comparison group (p<0.05).
Exhibit LCCI.1: Descriptive Characteristics for LCCI and Comparison Group Beneficiaries
Variable Lifelong Comparison Number of Patients 224 224 Mean Number of Quarters Enrolled [Range] 6.1 [1-10] 6.1 [1-10] Gender % (N) Female 63.4 (142) 58.5 (131) Age at Enrollment % (N) <30 years 2.2 (5) 1.8 (4) 30-39 years 6.3 (14) 5.4 (12) 40-49 years 10.7 (24) 9.4 (21) 50-59 years 30.8 (69) 33.5 (75) 60-69 years 33.5 (75) 32.1 (72) 70-79 years 11.6 (26) 12.1 (27) 80-89 years 4.9 (11) 5.8 (13) Race/Ethnicity % (N) White 28.6 (64) 28.6 (64) Black 46.4 (104) 45.1 (101) Asian 2.7 (6) 4.9 (11) Other 22.3 (50) 21.4 (48) Clinic *** % (N) Berkeley Primary Care 29.5 (66) 0.4 (1) Over 60 Health Center 29.5 (66) 17.0 (38) West Berkeley 39.7 (89) 17.9 (40) Other 1.3 (3) 64.7 (145) Comorbidities and Risk Disability % (N) 58.0 (130) 60.3 (135) Mean Chronic Illness and Disability Payment System (CDPS) Score (Standard Deviation) 2.93 (2.33) 2.74 (2.53)
Mean Utilization in Year Prior to Program Enrollment (per 1,000 beneficiaries unless noted) Total Cost of Care per beneficiary (SD) $13,101 ($25,777) $11,207 ($26,098) Hospitalizations (SD) 723.2 (1627.7) 718.8 (2193.8) §ED Visits (SD)** 1491.1 (2833.2) 2477.7 (6633.9)
NOTE: *p<0.10, **p<0.05, ***p<0.01. . §ED Visits is analyzed as a count variable rather than a binary variable.
115 For more detailed information on propensity score matching and tests of common support and covariate balance for this awardee, please see Appendix D. 116 We tested differences between the groups with a t-test for continuous measures (comorbidities and utilization before program enrollment) and a chi-squared test for categorical parameters (age, race/ethnicity, comorbidities and risk)

NORC | HCIA Complex/High-Risk Patient Targeting
ADDENDUM TO THE THIRD ANNUAL REPORT | 90
Impact of LCCI Program. Exhibit LCCI.2 displays the average quarterly and aggregate impact of the LCCI innovation on its participants relative to the comparison group.117 Utilization measures are reported as binary indicators, noting whether an event occurred in each quarter for a specific beneficiary (beneficiary-quarter).118 We find the following, relative to the comparison group:
■ Cost: A non-significant increase in total cost of care.
■ Utilization Measures: Non-significant decreases in ED visits and 30-day readmissions, and a non-significant increase in hospitalizations.
Findings differ from NORC’s Third Annual Report, with the presentation of an overall cost estimate and estimate of 30-day readmissions for the first timeboth non-significantand a change in direction from significant decrease in hospitalizations (in the intervention’s second year) to a non-significant increase in hospitalizations overall. A decrease for ED visits (also estimated only for the intervention’s second year) loses statistical significance when estimated for the full summary period. It appears that LifeLong’s intervention does not significantly change cost or utilization measures, when considered over the full implementation period. However, these findings must be interpreted with caution, given the relatively small number of beneficiaries included in our analysis of claims experience (n=224) and small number of claims in later implementation quarters.
Exhibit LCCI.2: Impact of the LCCI Program on Outcomes
AVERAGE QUARTERLY IMPACT§ Outcome Measure
(per 1,000 beneficiaries unless noted) Adjusted Estimate 90% Confidence Interval
80% Confidence Interval
Total Cost of Care per beneficiary ($) $1,432 -$1,642, $4,506 -$964, $3,828 Hospitalizations 34 + -3, 71 5, 63 ED Visits -5 -41, 31 -33, 23 30-Day Readmissions -116 + -255, 23 -224, -8
AGGREGATE IMPACT§§
Outcome Measure Adjusted Estimate [90% Confidence Interval]
90% Confidence Interval
80% Confidence Interval
Total Cost of Care ($) $1,949,888 -$2,236,860, $6,136,636
-$1,312,976, $5,212,752
Hospitalizations 46 + -4, 96 7, 85 ED Visits -6 -55, 43 -44, 32 30-Day Readmissions -16 + -36, 4 -31, -1
NOTE: +p<0.20, *p<0.10, **p<0.05, ***p<0.01. Bold font indicates findings that are statistically significant at p<0.10. §Quarterly impact is the average quarterly DID estimate per quarter of program enrollment. §§Aggregate impact is the total DID estimate for all program participants across all observed quarters of program enrollment. Aggregate impact is estimated for this awardee based on the total number of program participants (224), with an average length of enrollment of 6.1 quarters. Please note that the estimate for aggregate impact may be smaller thant the estimate for average quarterly impact if there are fewer than 1,000 enrolled beneficiaries, as the aggregate estimate is equal to the average quarterly estimate multipled by the sample size in each quarter, divided by 1,000. Disclaimer: Standard statistical practice is to use confidence intervals of 90% or higher. 80% confidence intervals are provided here for comparison purposes.
117 Adjustment factors include age category, gender, race/ethnicity, CDPS risk score, managed care indicator, disability indicator, and indicator for psychiatric illness. 118 Please see NORC’s Third Annual Report, Appendix C for an explanation of our estimate of average quarterly and aggregate impacts. In addition to binary measures, we also conduct tests using counts of utilization and report those results where relevant.

NORC | HCIA Complex/High-Risk Patient Targeting
ADDENDUM TO THE THIRD ANNUAL REPORT | 91
Impact of LCCI Program in Each Quarter of Enrollment. For hospitalizations and 30-day readmissions, findings from a quarterly fixed effects (QFE) DID model of impact —for each quarter individually rather than for an average quarter— are consistent with the average quarterly impact summarized above.119 Looking at impact by quarter for ED visits and total cost of care allows us to identify time periods of greater impact that may be masked by the overall summary estimates. Exhibit LCCI.3 displays the results of the QFE DID model for ED visits and total cost of care for LCCI participants, relative to a comparison group.120 Adjustment factors include age category, gender, race/ethnicity, CDPS risk score, managed care indicator, disability indicator, and indicator for psychiatric illness.121 We observe the following, relative to the comparison group:
■ Cost: Three quarters in which LCCI participants had significantly lower total cost of care (I5, I7-I8).
■ Utilization: Two quarters in which LCCI participants had a significantly lower ED visit rate (I3, I8).
While there are no statistically significant findings over the full implementation period, there are indications that LCCI’s program of clinic-based care coordination and peer engagement around independent living is associated with MediCal cost savings and with a decrease in ED visits for selected quarters, from about six months post-implementation to 18 months post-implementation. Differences in data elements and measures mean that findings are not directly comparable with those in NORC’s Third Annual Report. However, the quarterly trends presented above are consistent with findings in the Third Annual Report of decreases in hospitalization and ED visits during the second implementation year.
119 Please see Appendix D for presentation of these results. 120 For a more detailed explanation of the QFE DID model and measure specification, please see NORC’s Third Annual report, Appendix C. 121 For ED visits, the effect is displayed as the average difference between treatment and comparison per 1,000 beneficiaries for each quarter during the post-intervention (I1–I10) period, after adjusting for pre-intervention differences between the two groups. For total cost of care, this effect is displayed per beneficiary. We present both 90% confidence intervals (indicated by vertical lines around the estimate) and 80% confidence intervals (indicated by shaded boxes around the estimate). Results are interpreted as significant where p<0.10.

NORC | HCIA Complex/High-Risk Patient Targeting
ADDENDUM TO THE THIRD ANNUAL REPORT | 92
Exhibit LCCI.3: Impact of the LCCI Program, by Quarter
Disclaimer: Standard statistical practice is to use confidence intervals of 90% or higher. 80% confidence intervals are provided here for comparison purposes.
Summary
This report updates NORC’s Third Annual Report findings for LifeLong with a fresh set of outcome estimates, based on a dataset constructed using discrete quarters of data, and for the first time, estimates of LCCI’s impact on the total quarterly cost of care and on 30-day hospital readmissions. LifeLong’s intervention is not associated with change in cost or utilization. There is a change in direction from significant decrease in hospitalizations (in the intervention’s second year) to a non-significant increase in hospitalizations overall. A decrease for ED visits (also estimated only for the intervention’s second year) loses statistical significance when estimated for the full summary period. However, these findings must be interpreted with caution, given the relatively small number of beneficiaries included in our analysis of claims experience (n=224) and small number of claims in later implementation quarters.
LCCI’s program of clinic-based care coordination and peer engagement around independent living is associated with MediCal cost savings and with a decrease in ED visits for selected quarters, from about six months post-implementation to 18 months post-implementation. Impact from peer learning and beneficiary engagement would be expected over the course of months or even years and would be less likely to be seen in the short term. Differences in data elements and measures mean that findings are not directly comparable with those in NORC’s Third Annual Report. However, the quarterly trends presented above are consistent with findings in the Third Annual Report of decreases in hospitalization and ED visits during the second implementation year.

NORC | HCIA Complex/High-Risk Patient Targeting
ADDENDUM TO THE THIRD ANNUAL REPORT | 93
Northland Healthcare Alliance
Northland Care Coordination for Seniors (NCCS). Based in rural North Dakota, this program operates in conjunction with the Program of All-Inclusive Care for the Elderly (PACE). At each of seven sites, a care coordinator provides monthly or as-needed home visits and telephone support to enable enrollees to age in place, guided by an interdisciplinary clinical team. The program includes chronic disease self-management education, individualized care plans, referrals to community resources, and minor home modifications.
PROGRAM MODELS: Care/Case Coordination, Caregiver Education and Support, Home Health/Home Care, Patient Navigation
LOCATION: North Dakota REACH: 925 beneficiaries (106.3% of target)§
GRANT: $2,726,216 POPULATIONS: Dually Eligible, Older Adults, Rural
AWARD DATES: 10/01/12 to 6/30/16 DATA, ADDENDUM REPORT: Medicare claims (January 2013 to March 2016) NO-COST EXTENSION: 12 month, full program
PAYER(S): Medicare, Medicaid
OUTCOMES§§
No findings reach statistical significance
Increase in ED visits (29 per 1,000 beneficiaries per quarter)
No findings reach statistical significance
SUMMARY: Generally, findings are consistent with NORC’s Third Annual Report. We find no significant decreases in total cost of care, utilization, or quality of care measures for NCCS participants, relative to a comparison group. A statistically significant increase in ED visits for NCCS participants represents an increase in effect size compared with that presented in NORC’s Third Annual Report (from 23 to 29 ED visits per 1,000 beneficiaries per quarter) and with a higher degree of significance (p<0.10 in the Third Annual report, versus p<0.05 in this report). We note that an increase in ED visits may be partially explained by the program’s focus on frail, older adults who may need increasing services as conditions naturally become more severe. NORC’s Third Annual Report qualitative and survey findings suggest that the program improved participants’ communication with their primary care providers, helped participants access services to enable them to age in place, helped informal caregivers more easily coordinate the participant’s care, and improved communication between participants and their family members.
§Target is for initial performance period, through 6/30/2015. §§Outcomes for cost and utilization are from analyses that include acomparison group and reach statistical significance at the p<0.10 level.

NORC | HCIA Complex/High-Risk Patient Targeting
ADDENDUM TO THE THIRD ANNUAL REPORT | 94
Program Effectiveness
We present results of quarterly fixed effects (QFE) difference-in-differences (DID) analyses for Medicare fee-for-service (FFS) beneficiaries in the Northland Care Coordination for Seniors (NCCS) program from October 1, 2012, through June 30, 2016, relative to a comparison group. This analysis includes one additional quarter of claims data, compared with the analysis presented in NORC’s Third Annual Report.
We find that the NCCS program is not associated with a significant change in total cost of care, hospitalizations, 30-day readmissions, or ACS hospitalizations, relative to the comparison group; however, there is a statistically significant increase in ED visits for NCCS participants. These findings are consistent with those presented in NORC’s Third Annual Report.
Core and Supplemental Measures
Our community (ambulatory care) analysis compares the experience of NCCS enrollees with those of a matched group of comparators. It considers the impact on cost, utilization, and quality of care of NCCS over the enrollment period as a whole and in each quarter of enrollment. Our analysis is for Medicare FFS beneficiaries, which comprises 83 percent of all NCCS enrollees.122
Finder File and Creation of Analytic Sample. Northland provided a finder file of program participants and enrollment dates, enabling us to use Medicare claims in the CMS Virtual Research Data Center (VRDC) to calculate outcome measures.123 The finder file identified 735 unique participants in Northland program. We further limited this number by enrollment date and Medicare identifiers to yield an analytic sample of 553 participants.
Comparison Group. The comparison pool consisted of non-institutionalized Medicare FFS patients in the same zip codes as program participants. We used propensity score matching to find appropriate comparators.124 The final propensity score model used included age, disability status, CDPS Risk score, hospitalizations in the quarter prior to enrollment, and prior year hospitalization, ED visits, and costs. Tests of common support and covariate balance across treatment and comparison groups indicate that propensity score matching improves comparability.125
Descriptive Characteristics. Exhibit NCCS.1 displays the descriptive characteristics of beneficiaries in the NCCS program and in the comparison group, with respect to demographics, comorbidities, and prior
122 The awardee’s self-reported data, as presented in the HCIA Final Performance Progress Report. Submitted to CMMI by Northland Healthcare Alliance, September 30, 2016. 123 The analysis presented includes Medicare claims through June 30, 2016, for this report. We use a claims run-off date of March 30, 2016. 124 For more information on our propensity score matching methodology, please refer to NORC’s Third Annual Report, Appendix C. 125 For more detailed information on propensity score matching and tests of common support and covariate balance for this awardee, please refer to Appendix D.
Measures (per 1,000 beneficiaries unless noted) Total Cost of Care per beneficiary All-cause Hospitalizations Emergency Department (ED) Visits 30-day Readmissions Ambulatory Care Sensitive (ACS) Hospitalizations

NORC | HCIA Complex/High-Risk Patient Targeting
ADDENDUM TO THE THIRD ANNUAL REPORT | 95
utilization.126 We observe few differences in demographics, comorbidities, or prior utilization measures, although beneficiaries in the NCCS program are more likely to be female (p<0.10) and have more comorbidities (p<0.10), relative to the comparison group.
Exhibit NCCS.1: Descriptive Characteristics for NCCS Program and Comparison Group Beneficiaries
Variable Northland Comparison Number of Persons 553 529 Mean Number of Quarters Enrolled [Range] 6.5 [1 - 13] 6.7 [1 - 13] Gender % (N)* Female 62.9 (348) 58.0 (307) Age Group % (N) <55 years 0.5 (3) 0.6 (3) 55-64 years 4.9 (27) 5.7 (30) 65-74 years 21.0 (116) 19.7 (104) 75-84 years 38.3 (212) 40.6 (215) ≥85 years 35.3 (195) 33.5 (177) Race/Ethnicity % (N) White 97.5 (539) 97.7 (517) Other 2.5 (14) 2.3 (12) Dual Eligibility % (N) Dually Enrolled 11.9 (66) 11.7 (62) Coverage Reason % (N) Age 82.8 (458) 86.8 (459) Disability 16.8 (93) 12.5 (66) End-Stage Renal Disease (ESRD) 0.2 (1) 0.2 (1) Disability & ESRD 0.2 (1) 0.6 (3) Hierarchical Chronic Conditions (HCC) Mean HCC Score (Standard Deviation)* 1.8 (1.3) 1.6 (1.2) Mean Count of HCCs (SD)* 2.7 (2.5) 2.5 (2.2) Chronic Illness and Disability Payment System (CDPS) Risk Score CDPS Risk Score (SD) 2.0 (1.4) 2.0 (1.4) Mean Utilization and Cost in Year Prior to Program Enrollment (per 1,000 beneficiaries unless noted) Total Cost of Care per beneficiary (SD) $17,093 ($24,306) $16,090 ($22,643) Hospitalizations (SD) 568 (891) 546 (854) ED Visits (SD) 1069 (1636) 1008 (1709)
NOTE: *p<0.10, **p<0.05, ***p<0.01.
126 We test differences between these groups with a t-test for continuous measures (comorbidities and utilization one year prior to program enrollment) or a chi-square test for categorical parameters (gender, age, race, dual eligibility, and disability status).

NORC | HCIA Complex/High-Risk Patient Targeting
ADDENDUM TO THE THIRD ANNUAL REPORT | 96
Impact of NCCS Program. Exhibit NCCS.2 displays the average quarterly and aggregate impact of the NCCS program on its participants relative to the comparison group.127 Utilization measures are reported as binary indicators, noting whether an event occurred in each quarter for a specific beneficiary (beneficiary-quarter). We find the following, relative to the comparison group:
■ Cost: A small non-significant increase in total cost of care.
■ Utilization Measures: A significant increase in ED visits (29 per 1,000 beneficiaries per quarter), as well as a non-significant decrease in 30-day readmissions and a non-significant increase in hospitalizations.
■ Quality of Care: A small non-significant increase in ACS hospitalizations.
Findings are consistent with those in NORC’s Third Annual Report. Over the course of implementation, the NCCS program appears to increase ED visits without a statistically significant impact on Medicare cost of care, hospitalizations, 30-day-readmissions, or ambulatory care-sensitive hospitalizations. This may reflect the high-needs nature of the target population served (older adults with medical frailty, living independently in rural communities), likely ongoing challenges in getting access to primary care, the higher count of comorbidities of treatment group members relative to the comparison group, and the likelihood that the treatment group has more comorbidities than do comparators (as indicated by a higher mean score and count of hierarchical chronic conditions, per above).
127 Adjustment factors include age category, gender, race/ethnicity, extent of FFS coverage, dual eligibility indicator, HCC score, and disability indicator. Results are interpreted as significant where p<0.10.

NORC | HCIA Complex/High-Risk Patient Targeting
ADDENDUM TO THE THIRD ANNUAL REPORT | 97
Exhibit NCCS.2: Impact of the NCCS Program on Outcomes
AVERAGE QUARTERLY IMPACT§ Outcome Measure
(per 1,000 beneficiaries unless noted) Adjusted Estimate
90% Confidence Interval
80% Confidence Interval
Total Cost of Care per beneficiary ($) $249 -$244, $742 -$135, $633 Hospitalizations 15 + -3, 33 1, 29
ED Visits 29 ** 6, 52 11,47 30-Day Readmissions -10 -65, 45 -53, 33 ACS Hospitalizations 11 -4, 26 0, 22
AGGREGATE IMPACT§§
Outcome Measure Adjusted Estimate 90% Confidence Interval 80% Confidence Interval
Total Cost of Care ($) $868,399 -$854,063, $2,590,861 -$473,970, $2,210,768 Hospitalizations 53 + -9, 115 4, 102
ED Visits 102 ** 22, 182 40, 164 30-Day Readmissions -4 -25, 17 -20, 12 ACS Hospitalizations 39 -12, 90 -1, 79
NOTE: +p<0.20, *p<0.10, **p<0.05, ***p<0.01. Bold font indicates findings that are statistically significant at p<0.10. §Quarterly impact is the average quarterly DID estimate per quarter of program enrollment. §§Aggregate impact is the total DID estimate for all program participants across all observed quarters of program enrollment. Aggregate impact is estimated for this awardee based on the total number of program participants (553), with an average length of enrollment of 6.5 quarters. Please note that the estimate for aggregate impact may be smaller thant the estimate for average quarterly impact if there are fewer than 1,000 enrolled beneficiaries, as the aggregate estimate is equal to the average quarterly estimate multipled by the sample size in each quarter, divided by 1,000. Disclaimer: Standard statistical practice is to use confidence intervals of 90% or higher. 80% confidence intervals are provided here for comparison purposes.
Impact of NCCS in Each Quarter of Enrollment. Findings from a quarterly fixed-effects (QFE) DID model of impact —for each quarter individually rather than for an average quarter— are consistent with the average quarterly impact summarized above.128
Summary
We find no significant decreases in total cost of care, utilization, or quality of care measures for NCCS participants, relative to a comparison group. Observed decreases in 30-day readmissions do not reach statistical significance. There is a statistically significant increase in ED visits for NCCS participant, representing an increase in effect size compared with that presented in NORC’s Third Annual Report (from 23 to 29 ED visits per 1,000 beneficiaries per quarter) and with a higher degree of significance (p<0.10 in the Third Annual report, versus p<0.05 in this report); the addition of one more quarter of claims data would be expected to strengthen the reliability of this estimate. In general, these findings are consistent with those presented in NORC’s Third Annual Report.
128 Please see Appendix D for presentation of these results. The QFE presented for 30-day readmission is limited 9 post-intervention quarters, due to larger confidence intervals that obscure the presentation of other quarters in the graph.

NORC | HCIA Complex/High-Risk Patient Targeting
ADDENDUM TO THE THIRD ANNUAL REPORT | 98
Palliative Care Consultants of Santa Barbara
Doctors Assisting Seniors at Home (DASH). DASH offers an alternative to seeking urgent care at a hospital emergency department (ED) for Medicare beneficiaries age 60 and older who are considered frail, would like to remain at home, and live within a 12 mile radius of Santa Barbara, California. Once a beneficiary enrolls, DASH may be called to respond with home-based assessment, treatment, and care coordination by registered nurses, nurse practitioners, or physicians with experience in primary care, urgent care, and palliative medicine.
PROGRAM MODELS: Advance Care Planning, Care/Case Coordination, ED Diversion, Home Health/Home Care, Patient Navigation
LOCATION: Santa Barbara, CA REACH: 1,756 beneficiaries (100.3% of target) §
GRANT: $4,254,615 POPULATIONS: Disability, Dually Eligible, Older Adults,
AWARD DATES: 12/13/12 to 6/30/16 DATA, ADDENDUM REPORT: Medicare claims (October 2012 to June 2016) NO-COST EXTENSION: 12 month, full program
PAYER(S): Medicare, Medicaid
OUTCOMES§§
Findings not statistically significant
Decrease in ED visits (-13 per 1,000 beneficiaries per quarter)
Decrease in ACS hospitalizations (-4 per 1,000 beneficiaries per quarter)
SUMMARY: Overall, findings are consistent with those presented in NORC’s Third Annual Report. This analysis, which includes two additional quarters of claims data, finds that the DASH program is significantly associated with fewer ACS hospitalizations and ED visits, relative to the comparison group. Estimates for ED visits decrease in size but remain statistically significant (from -24 to -13 per 1,000 beneficiaries per quarter). All-cause hospitalizations are no longer statistically significant, but ACS hospitalizations are statistically significant in the current analysis (-4 per 1,000 beneficiaries per quarter). Significant reductions in cost and utilization in later quarters suggests that DASH may have a long-term impact on program participants. There are significant cost savings in later post-enrollment quarters as well as a decrease in hospitalizations, suggesting a stronger positive effect than seen previously. The number of claims from later implementation quarters remains relatively small. For this reason, estimates should be interpreted with caution.
§ Target is for initial performance period, through 6/30/2015.§§ Outcomes for cost and utilization are from analyses that include a comparison group and reach statistical significance at the P<0.10 level.

NORC | HCIA Complex/High-Risk Patient Targeting
ADDENDUM TO THE THIRD ANNUAL REPORT | 99
Program Effectiveness
We present results of quarterly fixed effects (QFE) difference-in-differences (DID) analyses for Medicare fee-for-service (FFS) beneficiaries in PCCSB’s DASH program from October 1, 2012 through June 30, 2016, relative to a comparison group. This analysis includes two additional quarters of claims data, compared with the analysis presented in NORC’s Third Annual Report.
We find that the DASH program is significantly associated with fewer ACS hospitalizations and ED visits, relative to the comparison group. These findings diverge with those presented in NORC’s Third Annual Report; estimates for ED visits decrease in size but remain statistically significant (from -24 to -13 per 1,000 beneficiaries per quarter). All-cause hospitalizations are no longer statistically significant, but ACS hospitalizations are statistically significant in the current analysis (-4 per 1,000 beneficiaries per quarter). We see significant cost savings, decrease in 30-day readmissions, and decreases in ACS hospitalizations in selected post-enrollment quarters, suggesting a more positive impact than estimated for the implementation period overall.
Core and Supplemental Measures
Our community (ambulatory care) analysis compares the experiences of DASH enrollees with a matched group of comparators. It considers the impact on cost, utilization, and quality of care of the awardee’s DASH program over the implementation period as a whole and in each quarter of program implementation. Our analysis is for Medicare FFS beneficiaries, comprising 11 percent of Medicare DASH enrollees.129
Finder File and Creation of Analytic Sample. PCCSB provided a finder file that lists program participants and their enrollment dates, enabling us to use Medicare claims in the CMS Virtual Research Data Center (VRDC) to calculate outcome measures.130 We identified 1,724 unique beneficiaries and further limited these by Medicare identifiers and enrollment date, yielding a final analytic sample of 1,260 beneficiaries.
Comparison Group. The comparison pool consisted of non-institutionalized Medicare FFS beneficiaries living in Ventura County, California, in calendar year 2013 who are demographically similar and have comparable prior year utilization, with one or more chronic conditions as defined by Chronic Conditions Warehouse flags. We used propensity score matching to find appropriate comparators.131 The final propensity model includes age, race/ethnicity, gender, disability status, Hierarchical Condition Category
129 The awardee’s self-reported data, as presented in the Fourteenth Quarterly Reporting Period (14QR), October, November, and December 2015. Submitted to CMMI by the Palliative Care Consultants of Santa Barbara, March 2, 2016; subsequent self-reported data by the awardee on payer mix (Fifteenth Quarterly Reporting Period, January, February and March 2016) indicates a much lower percentage of documented Medicare FFS enrolled beneficiaries (1.4 percent) and higher percentage of enrollees with an unknown payer (32.9 percent); given our understanding of the innovation and enrollment trends, we consider the 11 percent estimate in the Q14 report to be a more accurate characterization of payer mix. 130 Medicare claims are available through September 30, 2016, for the analysis in this report. We used June 30, 2016, as the cut-off date to account for the 90-day claims runoff. 131 For more information on our propensity score matching methodology, please see NORC’s Third Annual Report, Appendix C.
Measures (per 1,000 beneficiaries unless noted) Total Cost of Care per beneficiary All-cause Hospitalizations Emergency Department (ED) Visits 30-day Readmissions Ambulatory Care Sensitive (ACS) Hospitalizations
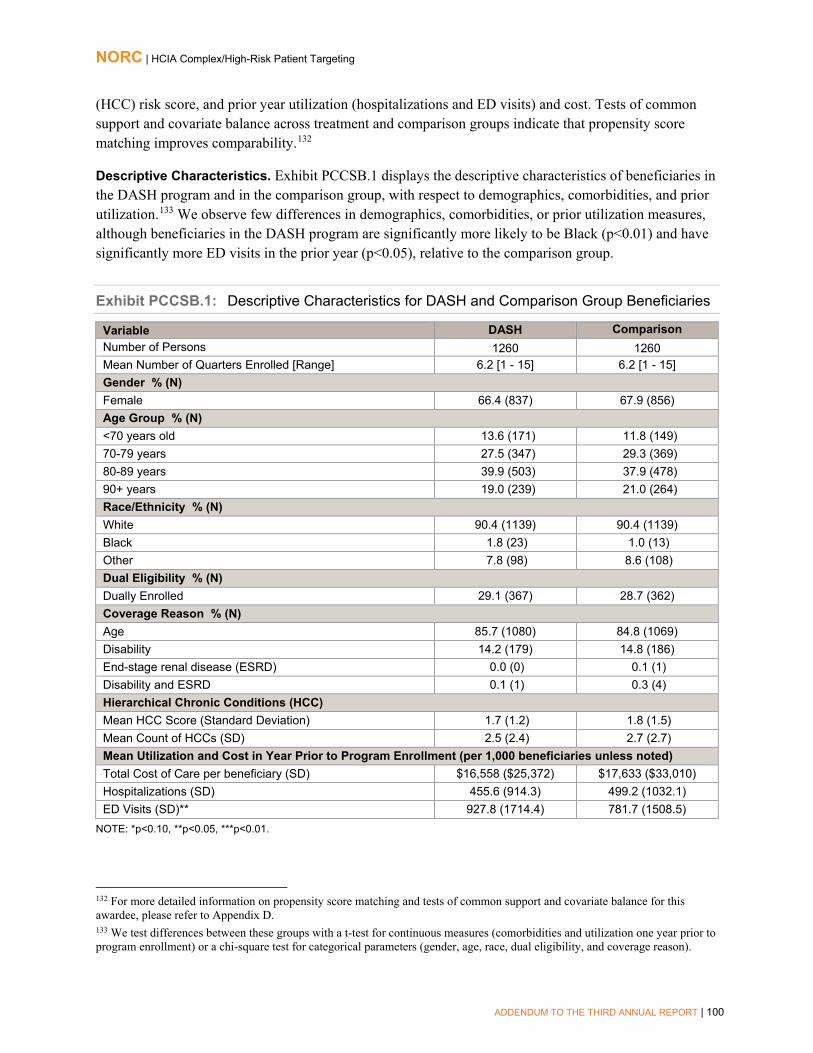
NORC | HCIA Complex/High-Risk Patient Targeting
ADDENDUM TO THE THIRD ANNUAL REPORT | 100
(HCC) risk score, and prior year utilization (hospitalizations and ED visits) and cost. Tests of common support and covariate balance across treatment and comparison groups indicate that propensity score matching improves comparability.132
Descriptive Characteristics. Exhibit PCCSB.1 displays the descriptive characteristics of beneficiaries in the DASH program and in the comparison group, with respect to demographics, comorbidities, and prior utilization.133 We observe few differences in demographics, comorbidities, or prior utilization measures, although beneficiaries in the DASH program are significantly more likely to be Black (p<0.01) and have significantly more ED visits in the prior year (p<0.05), relative to the comparison group.
Exhibit PCCSB.1: Descriptive Characteristics for DASH and Comparison Group Beneficiaries
Variable DASH Comparison Number of Persons 1260 1260 Mean Number of Quarters Enrolled [Range] 6.2 [1 - 15] 6.2 [1 - 15] Gender % (N) Female 66.4 (837) 67.9 (856) Age Group % (N) <70 years old 13.6 (171) 11.8 (149) 70-79 years 27.5 (347) 29.3 (369) 80-89 years 39.9 (503) 37.9 (478) 90+ years 19.0 (239) 21.0 (264) Race/Ethnicity % (N) White 90.4 (1139) 90.4 (1139) Black 1.8 (23) 1.0 (13) Other 7.8 (98) 8.6 (108) Dual Eligibility % (N) Dually Enrolled 29.1 (367) 28.7 (362) Coverage Reason % (N) Age 85.7 (1080) 84.8 (1069) Disability 14.2 (179) 14.8 (186) End-stage renal disease (ESRD) 0.0 (0) 0.1 (1) Disability and ESRD 0.1 (1) 0.3 (4) Hierarchical Chronic Conditions (HCC) Mean HCC Score (Standard Deviation) 1.7 (1.2) 1.8 (1.5) Mean Count of HCCs (SD) 2.5 (2.4) 2.7 (2.7) Mean Utilization and Cost in Year Prior to Program Enrollment (per 1,000 beneficiaries unless noted) Total Cost of Care per beneficiary (SD) $16,558 ($25,372) $17,633 ($33,010) Hospitalizations (SD) 455.6 (914.3) 499.2 (1032.1) ED Visits (SD)** 927.8 (1714.4) 781.7 (1508.5)
NOTE: *p<0.10, **p<0.05, ***p<0.01.
132 For more detailed information on propensity score matching and tests of common support and covariate balance for this awardee, please refer to Appendix D. 133 We test differences between these groups with a t-test for continuous measures (comorbidities and utilization one year prior to program enrollment) or a chi-square test for categorical parameters (gender, age, race, dual eligibility, and coverage reason).

NORC | HCIA Complex/High-Risk Patient Targeting
ADDENDUM TO THE THIRD ANNUAL REPORT | 101
Impact of DASH Program. Exhibit PCCSB.2 displays the average quarterly and aggregate impact of the DASH program on its participants relative to the comparison group.134 Utilization measures are reported as binary indicators, noting whether an event occurred in each quarter for a specific beneficiary (beneficiary-quarter). We find the following, relative to the comparison group:
■ Cost: A small non-significant decrease in total cost of care.
■ Utilization Measures: A significant decrease in ED visits (-13 per 1,000 beneficiaries perquarter), as well as non-significant decreases in all-cause hospitalizations and 30-dayreadmissions.
■ Quality of Care: A significant decrease in ACS hospitalizations (-4 per 1,000 beneficiaries perquarter).
While findings indicate no overall impact on the Medicare cost of care, the DASH program is significantly associated with fewer ACS hospitalizations and ED visits, relative to the comparison group. Estimates for ED visits decrease in size but remain statistically significant, compared with results presented in NORC’s Third Annual Report. In addition, all-cause hospitalizations are no longer statistically significant, but ACS hospitalizations are statistically significant in the current analysis.
Exhibit PCCSB.2: Impact of the DASH Program on Outcomes
AVERAGE QUARTERLY IMPACT§ Outcome Measure (per 1,000 beneficiaries unless noted)
Adjusted Estimate
90% Confidence Interval
80% Confidence Interval
Total Cost of Care per beneficiary ($) -$121 -$538, $296 -$446, $204 Hospitalizations -8 + -18, 2 -16, 0 ED Visits -13* -25, -1 -22, -4 30-Day Readmissions -3 -46, 40 -37, 31 ACS Hospitalizations -4* -8, 0 -7, -1
AGGREGATE IMPACT§§ Outcome Measure Adjusted Estimate 90% Confidence Interval 80% Confidence Interval
Total Cost of Care ($) -$940,543 -$4,176,482, $2,295,396 -$3,462,412, $1,581,326 Hospitalizations -60 + -136, 16 -120, 0 ED Visits -104* -196, -12 -176, -32 30-Day Readmissions -2 -26, 22 -20, 16 ACS Hospitalizations -29* -57, -1 -51, -7
NOTE: +p<0.20, *p<0.10, **p<0.05, ***p<0.01. Bold font indicates findings that are statistically significant at p<0.10. §Quarterly impact is the average quarterly DID estimate per quarter of program enrollment. §§Aggregate impact is the total DID estimate for all program participants across all quarters of program enrollment. Aggregate impact is estimated for this awardee based on the total number of program participants (1,260), with an average length of enrollment of 6.2 quarters. Please note that the estimate for aggregate impact may be smaller thant the estimate for average quarterly impact if there are fewer than 1,000 enrolled beneficiaries, as the aggregate estimate is equal to the average quarterly estimate multipled by the sample size in each quarter, divided by 1,000. Disclaimer: Standard statistical practice is to use confidence intervals of 90% or higher. 80% confidence intervals are provided here for comparison purposes.
134 Adjustment factors include age category, gender, race/ethnicity, extent of FFS coverage, dual eligibility indicator, HCC score, and disability indicator. Results are interpreted as significant where p<0.10.

NORC | HCIA Complex/High-Risk Patient Targeting
ADDENDUM TO THE THIRD ANNUAL REPORT | 102
Impact of DASH Program in Each Quarter of Enrollment. Findings from a quarterly fixed effects (QFE) DID model of impact—for each quarter individually rather than for an average quarter as presented above— allow us to identify trends that may be masked by the summary estimates above. Exhibit PCCSB.3 displays the results of the QFE DID model for the DASH participants, relative to a comparison group.135,136 We find the following, relative to the comparison group:
■ Cost: A statistically significant decrease in total cost of care in quarters I9, I14, and I15.
■ Utilization Measures: Significant decreases in hospitalizations in post-intervention quarters I8-I11 and in I14 and significant decreases in ED visits in quarters I5, I10, and I14, as well as asignificant decrease in 30-day readmissions in quarter I3.
■ Quality of Care: A significant decrease in ACS hospitalizations in quarters I1, I8, and I9.
Considering impacts from quarter to quarter indicates greater positive impacts than are seen in the overall summary estimates. Significant Medicare cost savings are evident for post-enrollment quarters starting in the intervention’s second year, as well as a significant decrease in hospitalizations, trends that reinforce the positive overall findings of a decrease in ED visits and in ambulatory care-sensitive hospitalizations. The impact of DASH’s home-based patient and caregiver engagement would be expected to be seen over a period of months, rather than in the short-term.
135 For a more detailed explanation of the QFE DID model and measure specification, please see NORC’s Third Annual Report, Appendix C. 136 For utilization and quality of care measures, the effect is displayed as the average difference between treatment and comparison per 1,000 beneficiaries for each quarter during the post-intervention (I1–I15) period, after adjusting for pre-intervention differences between the two groups. For total cost of care, this effect is displayed per beneficiary. We present both 90% confidence intervals (indicated by vertical lines around the estimate) and 80% confidence intervals (indicated by shaded boxes around the estimate). Results are interpreted as significant where p<0.10.

NORC | HCIA Complex/High-Risk Patient Targeting
ADDENDUM TO THE THIRD ANNUAL REPORT | 103
Exhibit PCCSB.3: Impact of the DASH Program by Quarter
Disclaimer: Standard statistical practice is to use confidence intervals of 90% or higher. 80% confidence intervals are provided here for comparison purposes.

NORC | HCIA Complex/High-Risk Patient Targeting
ADDENDUM TO THE THIRD ANNUAL REPORT | 104
Summary
We find significant decreases in ACS hospitalizations and ED visits for DASH program participants, relative to a comparison group. Considering impacts from quarter to quarter, there are significant cost savings in three post-enrollment quarters, a significant decrease in 30-day readmissions in the third post-enrollment quarter, and a significant decrease in hospitalizations in the eighth through eleventh and the fourteenth post-enrollment quarters, suggesting a stronger positive effect than seen previously. Overall, these findings are consistent with those presented in NORC’s Third Annual Report. While the analysis in this report is based on two additional quarters of claims data, the number of claims from later implementation quarters remains relatively small – as reflected in the wide confidence intervals depicted in the QFE DID charts above – and for this reason, estimates should be interpreted with caution.

NORC | HCIA Complex/High-Risk Patient Targeting
ADDENDUM TO THE THIRD ANNUAL REPORT | 105
Pittsburgh Regional Health Initiative
Primary Care Resource Center (PCRC). The PCRC program provides intensive coordination and disease management for patients with chronic obstructive pulmonary disease (COPD); congestive heart failure (CHF); and acute myocardial infarction (AMI) through six hospital-based, virtual patient-centered medical homes.
PROGRAM MODELS: Care/Case Coordination, Chronic Disease Self-Management, Pharmaceutical Care, Transitional Care
LOCATION: Pennsylvania, West Virginia REACH: 7,689 participants (88% of target) § GRANT: $10,419,511 POPULATIONS: Adults, Urban AWARD DATES: 7/01/13 (launch date) to 2/29/16 DATA, ADDENDUM REPORT: Medicare claims
(July 2011 to March 2016) NO-COST EXTENSION: 8 month, full program PAYER(S): Medicare
OUTCOMES§§
Decrease in 180-day Medicare total cost of care overall (-$1,264 per beneficiary-episode per quarter) and for beneficiaries with AMI (-$4,597 per beneficiary-episode per quarter) or CHF ($1,446 per beneficiary-episode per quarter)
Decrease in 180-day ED visits overall (-27 per 1,000 beneficiary-episodes per quarter) and in 90- and 180-day ED visits for beneficiaries with COPD (-42 and -62 per 1,000 beneficiary-episodes per quarter, respectively) Increases in 7-day and 30-day practitioner follow-up visits overall (69 and 37 per 1,000 beneficiary-episodes per quarter, respectively) and for beneficiaries with CHF (108 and 46 per 1,000 beneficiary-episodes per quarter, respectively) Increase in 30-day practitioner follow-up visits for beneficiaries with COPD (37 per 1,000 beneficiary-episodes per quarter)
SUMMARY: PRHI’s significant findings from NORC’s Third Annual Report are sustained for the intervention overall and for beneficiaries with three priority conditions targeted by the awardee (AMI, CHR, and COPD). For the PCRC intervention overall, we observe significant decreases in 180-day total cost of care and 180-day ED visits and improvements in 7-day and 30-day practitioner follow-up visits, relative to a comparison group. The appearance of these significant decreases at 180 days but not 90 days suggests that cost savings and reductions in ED visits do not manifest immediately after discharge, when patients may be more likely to need more intensive care and/or recovery, and that PCRC may have a long-term impact on program participants. Impacts vary by disease subgroup, and improvements are not shared by all patient cohorts equally; only AMI beneficiary-episodes showed a significant decrease in 180-day total cost of care, while only COPD beneficiary-episodes showed significant decreases in ED visits (both 90- and 180-day outcomes) and an increase in 30-day follow up visits. For beneficiaries with congestive heart failure (CHF), estimated impacts are strengthened: we continue to observe significant increases in 7-day and 30-day practitioner follow-up visits, while an estimated increase in 90-day total cost of care per beneficiary-episode diminishes almost by half and no significant change is found in 30-day readmissions or 90-day hospitalizations. (In the Third Annual Report, both were significantly higher in the treatment group.)
§ Target is for initial performance period, through 6/30/2015.§§ Outcomes for cost, utilization, and quality of care are from analyses that include a comparison group and are statistically significant at the p<0.10 level.

NORC | HCIA Complex/High-Risk Patient Targeting
ADDENDUM TO THE THIRD ANNUAL REPORT | 106
Program Effectiveness
We present results of quarterly fixed effects (QFE) difference-in-differences (DID) analyses for Medicare fee-for-service (FFS) beneficiaries in PRHI’s PCRC program from July 1, 2013, through February 29, 2016, relative to a comparison group. This analysis includes five additional months of claims data, compared with the analysis presented in NORC’s Third Annual Report.
We find that the intervention sustains the significant findings noted in the Third Annual Report: a reduction in 180-day ED visits and greater numbers of 7-day and 30-day practitioner follow-up visits, relative to the comparison group. In addition, with the data from the full project period now available, we observe a significantly lower 180-day total quarterly cost of care, relative to the comparison group.
When enrollees are stratified by condition, most findings closely track those previously reported. For beneficiaries with acute myocardial infarction (AMI), we observe a significant decrease in 180-day total cost of care. For beneficiaries with congestive heart failure (CHF), estimated impacts are strengthened: we continue to observe significant increases in 7-day and 30-day practitioner follow-up visits, while an estimated increase in 90-day total cost of care per beneficiary-episode diminishes to $1,446 (from $2,324) and no significant change is found in 30-day readmissions or 90-day hospitalizations. (In the Third Annual Report, both were significantly higher in the treatment group.)
Core and Supplemental Measures
Our hospital analysis compares the experiences of PCRC enrollees with those of a weighted comparison group. It considers the impact on cost, utilization, and quality of care of the awardee’s PCRC program over the implementation period as a whole and in each quarter of program implementation. Our analysis is for Medicare FFS beneficiaries, comprising 30 percent of enrollees in the program.137 We also present a stratified analysis that assesses impact for each of the program’s three targeted conditions separately (AMI, CHF, COPD).
Finder File and Creation of Analytic Sample. PRHI did not provide a finder file that lists program participants and enrollment dates. Instead, we used Medicare claims-based attribution rules to identify PCRC enrollees; the awardee estimates that about 75 percent of patients admitted with these diagnoses received PCRC services.138 Our analytic sample comprises 6,525 unique beneficiary-episodes discharged
137 The awardee’s self-reported data, as presented in the HCIA Fourteenth Quarterly Reporting Period (Q14), October, November, and December 2015. Submitted to CMMI by Pittsburgh Regional Health Initiative, March 2, 2016. 138 Medicare claims are available through September 30, 2016, for the analysis in this report. We used February 29, 2016, as the cut-off date to analyze claims through the end of the awardee’s no-cost extension period.
Measures (per 1,000 beneficiary-episodes unless noted) 90-day Total Cost of Care per beneficiary-episode 180-day Total Cost of per beneficiary-episode 90-day All-cause Hospitalizations 180-day All-cause Hospitalizations 90-day Emergency Department (ED) Visits 180-day ED Visits 30-day Readmissions 7-day Practitioner Follow-Up 30-day Practitioner Follow-Up

NORC | HCIA Complex/High-Risk Patient Targeting
ADDENDUM TO THE THIRD ANNUAL REPORT | 107
alive with a diagnosis of AMI, COPD, or CHF from one of the six participating PRHI hospitals during the intervention period.139
Comparison Group. We use Medicare claims and the CMS Provider of Services file to create an external comparison group of 10 comparison community hospitals in geographic proximity to the awardee-affiliated hospitals.140 We use propensity score weighting (standardized mortality ratio weights) to minimize observed differences in beneficiary-episode characteristics between the PRHI treatment and comparison groups.141 To account for variations in beneficiary-episode with different conditions (AMI, COPD, or CHF) and achieve better balance, we first stratify by each condition, then estimate relative weights within each stratum and pool weights across strata. The final propensity score model includes age category, gender, race/ethnicity, dual eligibility indicator, Hierarchical Condition Category (HCC) score, prior year total Medicare cost, disability indicator, ESRD indicator, and hospital group. Tests of common support and covariate balance across treatment and comparison groups indicate that propensity score weighting improves comparability.142
Descriptive Characteristics. Exhibit PRHI.1 displays the descriptive characteristics of beneficiary-episodes (discharges) for treatment and comparison groups before and after implementation of the intervention, prior to propensity score weighting. We compare the two groups with respect to demographics, comorbidities, and prior utilization.143 Beneficiary-episodes attributed to the PCRC treatment group are more likely to be younger (p<0.01), White (p<0.05), and to have more discharges to skilled nursing facility (SNF) and home health agency (HHA) care settings (p<0.01), relative to the comparison group. PCRC enrollees also have more hospitalizations and ED visits and higher cost during the year before program implementation (all p<0.01).144
139 The post-intervention group includes beneficiary-episodes in the PCRC program from July 1, 2013, through February 29, 2016. One of the six hospitals terminated participation in the program after December 31, 2014; we excluded episodes at that hospital after this date from analysis. 140 The ten comparison hospitals are Jameson Memorial Hospital, Meadville Medical Center, Monongalia County General Hospital, St. Mary's Medical Center, Saint Vincent Health Center, York Hospital, ACMH Hospital, St. Clair Memorial Hospital, Riddle Memorial Hospital, and Mount Nittany Medical Center. 141 For more information on our propensity score weighting methodology, see NORC’s Third Annual Report, Appendix C. 142 For more detailed information on propensity score weighting and tests of common support and covariate balance for this awardee, please refer to NORC’s Third Annual Report, Appendix C. 143 We test differences between the groups with a t-test for continuous measures (comorbidities, prevalence of target conditions, and utilization before index hospitalization) and a chi-square test for categorical parameters (gender, age, race, coverage reason, and discharge setting). 144 Applying propensity score weighting improves comparability of prior year hospitalizations and ED visits in both post-treatment and post-comparison groups; the standardized difference between the two groups after weighting is <0.1 (i.e., within the acceptable range of difference).

NORC | HCIA Complex/High-Risk Patient Targeting
ADDENDUM TO THE THIRD ANNUAL REPORT | 108
Exhibit PRHI.1: Descriptive Characteristics for PCRC and Comparison Group Beneficiary-Episodes
Variable Pre-Intervention Period Post-Intervention Period
PCRC Comparison PCRC Comparison Number of Beneficiary-episodes 5,330 11,873 5,926 14,294
Gender % (N) Female 52.8 (2816) 53.1 (6305) 51.0 (3023) 52.0 (7430) Age Group % (N) *** <65 years old 16.5 (879) 15.8 (1870) 16.8 (994) 16.0 (2286) 65-69 years old 14.9 (793) 14.0 (1666) 16.6 (982) 14.6 (2080) 70-74 years old 13.2 (703) 14.3 (1694) 13.7 (809) 15.4 (2201) 75-79 years old 13.2 (706) 13.7 (1624) 14.1 (836) 14.7 (2099) 80-84 years old 15.4 (821) 16.7 (1985) 13.9 (825) 13.8 (1969) ≥85 years old 26.8 (1428) 25.6 (3034) 25.0 (1480) 25.6 (3659) Race/Ethnicity % (N) ** White 96.4 (5140) 96.5 (11463) 96.1 (5697) 95.6 (13659) Black 3.1 (167) 2.5 (295) 3.2 (189) 3.4 (486) Other 0.4 (23) 1.0 (115) 0.7 (40) 1.0 (149) Target Conditions % (N) AMI 24.6 (1311) 22.7 (2691) 23.4 (1384) 24.0 (3426) CHF 37.4 (1993) 39.6 (4701) 41.3 (2449) 42.5 (6071) COPD 38.0 (2026) 37.7 (4481) 35.3 (2093) 33.6 (4797) Hierarchical Chronic Conditions (HCC) Mean HCC Score (SD) 3.2 (1.8) 3.2 (1.8) 3.3 (1.9) 3.3 (1.8) Mean Count of HCCs (Standard Deviation) 5.7 (3.0) 5.7 (3.0) 5.9 (3.1) 5.9 (3.0)
Mean Cost and Utilization in Year Prior to Program Enrollment (per 1,000 beneficiary-episodes unless noted) Total Medicare Cost per beneficiary-episode (SD) ***
$30,737 ($40,561) $29,305 ($45,638) $31,685 ($64,749) $29,385 ($38,955)
Hospitalizations (SD) *** 1,698 (2,793) 1,627 (2,451) 1,737 (3,413) 1,506 (2,425)
ED Visits (SD) *** 1,356 (3,779) 1,217 (2,661) 1,582 (4,097) 1,320 (2,767) Coverage Reason % (N) Age 67.6 (3602) 68.6 (8141) 66.5 (3939) 67.6 (9666) Disability 30.6 (1632) 29.9 (3548) 32.0 (1899) 30.9 (4417) ESRD 0.7 (37) 0.3 (39) 0.4 (21) 0.4 (63) Disability and ESRD 1.1 (59) 1.2 (145) 1.1 (67) 1.0 (148) Discharges % (N) *** Home 41.0 (2186) 53.3 (6332) 45.7 (2707) 50.8 (7262) SNF 18.9 (1005) 14.7 (1750) 16.4 (972) 14.1 (2013) HHA 24.1 (1284) 16.0 (1904) 22.1 (1309) 18.4 (2629) Hospice 2.3 (123) 2.2 (256) 2.3 (138) 2.8 (405) Other 13.7 (732) 13.7 (1631) 13.5 (800) 13.9 (1985)
NOTE: *p<0.10, **p<0.05, ***p<0.01.

NORC | HCIA Complex/High-Risk Patient Targeting
ADDENDUM TO THE THIRD ANNUAL REPORT | 109
Impact of PCRC Program. Exhibit PRHI.2 displays the average quarterly and aggregate impact of the PCRC innovation on its participants relative to the comparison group.145 Utilization measures are reported as binary indicators, noting whether an event occurred in each quarter for a specific beneficiary-episode. We find the following, relative to the comparison group:
■ Cost: A significant decrease in 180-day cost of care (-$1,264 per beneficiary-episode perquarter).
■ Utilization: A significant decrease in 180-day ED visits (-27 per 1,000 beneficiary-episodes perquarter).
■ Quality of Care Measures: Significant increases in both 7-day and 30-day practitioner follow-upvisits (69 and 37 per 1,000 beneficiary-episodes per quarter, respectively).
Compared with NORC’s Third Annual Report, 180-day Medicare cost savings are now significant overall, not only for beneficiaries with AMI, and accompanied by a decrease in 180-day ED visits; the lack of impact on 90-day measures of cost and ED use likely reflects the immediate, post-discharge needs of PCRC’s enrollees and the value of a longer-term assessment of impact for this intervention, even if the target period of engagement is 30 to 45 days post-discharge. Increased access to care, as reflected by improved 7-day and 30-day practitioner follow-up visits, lends further support to the hypothesis that short-term increased utilization is eventually attenuated by the PCRC model.
145 Adjustment factors include age category, race/ethnicity, gender, indicator for AMI/CHF/COPD, prior year cost and utilization (hospitalizations and ED visits), dual eligibility indicator, Hierarchical Condition Category score, discharge setting, disability indicator, ESRD indicator, and hospital group. Results are interpreted as significant where p<0.10.

NORC | HCIA Complex/High-Risk Patient Targeting
ADDENDUM TO THE THIRD ANNUAL REPORT | 110
Exhibit PRHI.2: Impact of PCRC Program on Outcomes
AVERAGE QUARTERLY IMPACT§ Outcome Measure
(per 1,000 beneficiary-episodes unless noted) Adjusted Estimate
90% Confidence Interval
80% Confidence Interval
Total 90-day Cost of Care per Beneficiary-episode ($) -$201 -$1,185, $783 -$968, $566 Total 180-day Cost of Care per Beneficiary-episode ($) -$1,264 * -$2,506, -$22 -$2,232, -$296 90-day All-cause Hospitalizations 1 -18, 20 -14, 16 180-day All-cause Hospitalizations -4 -25, 17 -21, 13 90-day ED Visits -12 -30, 6 -26, 2 180-day ED Visits -27 ** -47, -7 -43, -11 30-Day Readmissions 11 -8, 30 -4, 26 7-day Practitioner Follow-up 69 *** 32, 106 40, 98 30-day Practitioner Follow-up 37 *** 18, 56 22, 52
AGGREGATE IMPACT§§
Outcome Measure Adjusted Estimate
90% Confidence Interval
80% Confidence Interval
Total 90-day Cost of Care ($) -$1,192,348 -$7,021,439, $4,636,743 -$5,735,141, $3,350,445 Total 180-day Cost of Care ($) -$7,492,748 * -$14,853,102, -$132,394 -$13,228,903, -$1,756,593 90-day All-cause Hospitalizations 6 -107, 119 -82, 94 180-day All-cause Hospitalizations -25
-151, 101 -123, 73
90-day ED Visits -70 -179, 39 -155, 15 180-day ED Visits -159 ** -279, -39 -252, -66 30-Day Readmissions 65 -46, 176 -22, 152 7-day Practitioner Follow-up 411 *** 190, 632 239, 583 30-day Practitioner Follow-up 217 *** 101, 333 127, 307
NOTE: +p<0.20, *p<0.10, **p<0.05, ***p<0.01. Bold font indicates findings that are statistically significant at p<0.10. §Quarterly impact is the average quarterly DID estimate per quarter of program implementation. §§Aggregate impact is the total DID estimate for all program participants across all quarters of program implementation. Aggregate impact is estimated for this awardee based on the total number of beneficiary-episodes (5,926) and total length of program implementation included in analysis (11 quarters). Disclaimer: Standard statistical practice is to use confidence intervals of 90% or higher. 80% confidence intervals are provided here for comparison purposes.
Subgroup Analysis: Impact of PCRC Stratified by Target Condition. While the analysis above considers all program participants together in a pooled analysis, Exhibits PRHI.3, PRHI.4, and PRHI.5 below present a stratified analysis that considers the impact of PCRC participation on beneficiary-episodes for beneficiaries with each of the three conditions targeted for quality improvement. We find the following, relative to the comparison group (limited for each analysis to beneficiaries with the same condition):
■ AMI: A significant decrease in 180-day total cost of care (-$4,597 per beneficiary-episode perquarter).
■ CHF: A significant increase in 90-day total cost of care ($1,446 per beneficiary-episode perquarter) and significant increases in practitioner follow up visits within 7 and 30 days post-discharge (108 and 46 per 1,000 beneficiary-episodes per quarter, respectively).

NORC | HCIA Complex/High-Risk Patient Targeting
ADDENDUM TO THE THIRD ANNUAL REPORT | 111
■ COPD: Decreases in 90- and 180-day ED visits per quarter (-42 and -62 per 1,000 beneficiary-episodes per quarter, respectively) and an increase in follow up visits within 30 days post-discharge (37 per 1,000 beneficiary-episodes per quarter).
Impacts vary by disease subgroup, and improvements are not shared by all patient cohorts equally; only AMI beneficiary-episodes showed a significant decrease in 180-day total cost of care, while only COPD beneficiary-episodes showed significant decreases in ED visits (both 90- and 180-day outcomes) and an increase in 30-day follow up visits. For beneficiaries with congestive heart failure (CHF), estimated impacts are strengthened: we continue to observe significant increases in 7-day and 30-day practitioner follow-up visits, while an estimated increase in 90-day total cost of care per beneficiary-episode diminishes almost by half and no significant change is found in 30-day readmissions or 90-day hospitalizations.
Exhibit PRHI.3: Impact of PCRC Program on Patients with Acute Myocardial Infarction
AVERAGE QUARTERLY IMPACT§ Outcome Measure
(per 1,000 beneficiary-episodes unless noted) Adjusted Estimate
90% Confidence Interval
80% Confidence Interval
Total 90-day Cost of Care per Beneficiary-episode ($) -$2,487 +
-$5110, $136 -$4532, -$442 Total 180-day Cost of Care per Beneficiary-episode ($) -$4,597 * -$8817, -$377 -$7886, -$1308
90-day All-cause Hospitalizations -27 -67, 13 -58, 4 180-day All-cause Hospitalizations -16 -64, 32 -53, 21 90-day ED Visits 6 -31, 43 -23, 35 180-day ED Visits 13 -21, 47 -14, 40 30-Day Readmissions 15 -11, 41 -5, 35 7-day Practitioner Follow-up 45 + -5, 95 6, 84 30-day Practitioner Follow-up 15 -17, 47 -10, 40
AGGREGATE IMPACT§ Outcome Measure Adjusted Estimate 90% Confidence Interval 80% Confidence Interval
Total 90-day Cost of Care ($) -$3,442,696 + -$7,073,502, $188,110 -$6,272,297, -$613,095 Total 180-day Cost of Care ($) -$6,362,536 * -$12,203,394, -$521,678 -$10,914,500, -$1,810,572 90-day All-cause Hospitalizations -37 -92, 18 -80, 6 180-day All-cause Hospitalizations -22 -88, 44 -73, 29 90-day ED Visits 9 -42, 60 -31, 49 180-day ED Visits 18 -29, 65 -19, 55 30-Day Readmissions 21 -15, 57 -7, 49 7-day Practitioner Follow-up 62 + -7, 131 8, 116 30-day Practitioner Follow-up 21 -23, 65 -14, 56
NOTE: +p<0.20, *p<0.10, **p<0.05, ***p<0.01. Bold font indicates findings that are statistically significant at p<0.10. §Quarterly impact is the average quarterly DID estimate per quarter of program implementation. §§Aggregate impact is the total DID estimate for all program participants across all quarters of program implementation. Aggregate impact is estimated for this awardee based on the total number of beneficiary-episodes (1,564) and total length of program implementation included in analysis (12 quarters). Disclaimer: Standard statistical practice is to use confidence intervals of 90% or higher. 80% confidence intervals are provided here for comparison purposes.

NORC | HCIA Complex/High-Risk Patient Targeting
ADDENDUM TO THE THIRD ANNUAL REPORT | 112
Exhibit PRHI.4: Impact of the PCRC Program on Patients with Congestive Heart Failure
AVERAGE QUARTERLY IMPACT§ Outcome Measure
(per 1,000 beneficiary-episodes unless noted) Adjusted Estimate 90% Confidence
Interval 80% Confidence
Interval Total 90-day Cost of Care per Beneficiary-episode ($) $1,446 ** $309, $2,583 $560, $2,332
Total 180-day Cost of Care per Beneficiary-episode ($) $1,204 + -$280, $2,688 $47, $2,361
90-day All-cause Hospitalizations 22 + -6, 50 0, 44 180-day All-cause Hospitalizations 9 -9, 27 -5, 23 90-day ED Visits 9 -18, 36 -12, 30 180-day ED Visits -16 -48, 16 -41, 9 30-Day Readmissions 25 + 0, 50 5, 45 7-day Practitioner Follow-up 108 *** 65, 151 75, 141 30-day Practitioner Follow-up 46 *** 17, 75 24, 68
AGGREGATE IMPACT§§ Outcome Measure Adjusted Estimate 90% Confidence Interval 80% Confidence Interval
Total 90-day Cost of Care ($) $3,541,684 ** $758,295, $6,325,073 $1,372,502, $5,710,866 Total 180-day Cost of Care ($) $2,948,483 + -$686,220, $6,583,186 $115,845, $5,781,121 90-day All-cause Hospitalizations 55 + -13, 123 2, 108 180-day All-cause Hospitalizations 22 -23, 67 -13, 57 90-day ED Visits 23 -43, 89 -28, 74 180-day ED Visits -38 -116, 40 -99, 23 30-Day Readmissions 60 + -2, 122 12, 108 7-day Practitioner Follow-up 264 *** 159, 369 182, 346 30-day Practitioner Follow-up 113 *** 42, 184 58, 168
NOTE: +p<0.20, *p<0.10, **p<0.05, ***p<0.01. Bold font indicates findings that are statistically significant at p<0.10. §Quarterly impact is the average quarterly DID estimate per quarter of program implementation. §§Aggregate impact is the total DID estimate for all program participants across all quarters of program implementation. Aggregate impact is estimated for this awardee based on the total number of beneficiary-episodes (2,709) and total length of program implementation included in analysis (12 quarters). Disclaimer: Standard statistical practice is to use confidence intervals of 90% or higher. 80% confidence intervals are provided here for comparison purposes.

NORC | HCIA Complex/High-Risk Patient Targeting
ADDENDUM TO THE THIRD ANNUAL REPORT | 113
Exhibit PRHI.5: Impact of the PCRC Program on Patients with Chronic Obstructive Pulmonary Disease
AVERAGE QUARTERLY IMPACT§ Outcome Measure
(per 1,000 beneficiary-episodes unless noted) Adjusted Estimate
90% Confidence Interval
80% Confidence Interval
Total 90-day Cost of Care per Beneficiary-episode ($) $57 -$1,521, $1,635] -$1,173, $1,287 Total 180-day Cost of Care per Beneficiary-episode ($) -$931
-$3,398, $1,536 -$2,854, $992 90-day All-cause Hospitalizations -6 -30, 18 -25, 13 180-day All-cause Hospitalizations -13 -47, 21 -39, 13 90-day ED Visits -42 ** -69, -15 -63, -21 180-day ED Visits -62 *** -87, -37 -81, -43 30-Day Readmissions -6 -42, 30 -34, 22 7-day Practitioner Follow-up 39 + -10, 88 1, 77 30-day Practitioner Follow-up 37 *** 14, 60 19, 55
AGGREGATE IMPACT§§
Outcome Measure Adjusted Estimate 90% Confidence Interval 80% Confidence Interval
Total 90-day Cost of Care ($) $118,693 -$3,183,569, $3,420,955 -$2,454,863, $2,692,249 Total 180-day Cost of Care ($) -$1,949,047 -$7,113,252, $3,215,158 -$5,973,674, $2,075,580 90-day All-cause Hospitalizations -13 -64, 38 -53, 27 180-day All-cause Hospitalizations -26 -96, 44 -81, 29 90-day ED Visits -88 ** -145, -31 -132, -44 180-day ED Visits -129 *** -181, -77 -169, -89 30-Day Readmissions -12 -88, 64 -71, 47 7-day Practitioner Follow-up 83 + -20, 186 3, 163 30-day Practitioner Follow-up 77 *** 29, 125 40, 114
NOTE: +p<0.20, *p<0.10, **p<0.05, ***p<0.01. Bold font indicates findings that are statistically significant at p<0.10. §Quarterly impact is the average quarterly DID estimate per quarter of program implementation. §§Aggregate impact is the total DID estimate for all program participants across all quarters of program implementation. Aggregate impact is estimated for this awardee based on the total number of beneficiary-episodes (2,252) and total length of program implementation included in analysis (12 quarters). Disclaimer: Standard statistical practice is to use confidence intervals of 90% or higher. 80% confidence intervals are provided here for comparison purposes.
Impact of PCRC Program in Each Quarter of Enrollment. Findings from a quarterly fixed effects (QFE) DID model of impact —for each quarter individually rather than for an average quarter as presented above— are consistent with the average quarterly impact summarized above.146
Summary
For the PCRC intervention overall, we observe significant decreases in 180-day total cost of care and 180-day ED visits and improvements in 7-day and 30-day practitioner follow-up visits, relative to a comparison group. The appearance of these significant decreases at 180 days but not 90 days suggests that cost savings and reductions in ED visits do not manifest immediately after discharge, when patients may be more likely to need more intensive care and/or recovery, and that PCRC intervention may have a long-term impact on program participants. All three disease subgroups (AMI, CHF, COPD) show
146 Please see Appendix D for presentation of these results.
NORC | HCIA Complex/High-Risk Patient Targeting
ADDENDUM TO THE THIRD ANNUAL REPORT | 114
significant improvement in practitioner follow-up rates. However, when considering each target condition separately, improvements are not shared by all patient cohorts equally; only beneficiary-episodes with AMI showed a significant decrease in 180-day total cost of care, while only beneficiary-episodes with COPD showed significant decreases in ED visits (both 90- and 180-day outcomes). Beneficiary-episodes associated with the other two conditions in each case showing no significant differences. These findings update our understanding of PCRC’s impacts as presented in NORC’s Third Annual Report. Earlier findings of significantly reduced 180-day ED visits and significantly increased 7-day and 30-day practitioner follow-up for all enrollees held, and data for the full project period demonstrate a significant reduction in 180-day total cost. Subgroup analyses–stratified by the three priority conditions targeted by the awardee-–further support findings from the Third Annual Report. For patients with CHF, we continue to observe significant increases in 7-day and 30-day practitioner follow-up visits, while several findings of increased cost and utilization in the Third Annual Report have attenuated – the estimated increase in 90-day total cost of care per beneficiary-episode has diminished in size, and increases previously found for 30-day readmissions or 90-day hospitalizations are no longer significant.

NORC | HCIA Complex/High-Risk Patient Targeting
ADDENDUM TO THE THIRD ANNUAL REPORT | 115
Providence Portland Medical Center
Health Commons. Co-sponsored by Health Share of Oregon, a regional Coordinated Care Organization (CCO) and the Providence Portland Medical Center (PPMC), this innovation has the goal of creating an integrated patient-centered system to improve care coordination, care quality, and health outcomes among high-cost, high-acuity Medicaid beneficiaries (Health Share patients). Health Commons comprises seven separate programs, each with distinct objectives, staffing mix, and implementation partners.
PROGRAM MODELS: Beneficiary/Caregiver Engagement, Care/Case Coordination, Collaborative Medical Home, ED Diversion, Patient Navigation
LOCATION: Portland, OR REACH: 15,421 beneficiaries (100% of target)
GRANT: $17,337,093 POPULATIONS: Adults, Behavioral Health/Substance Abuse, Urban
AWARD DATES: 9/01/12 to 9/28/15 DATA, ADDENDUM REPORT: Medicaid claims (January 2011 to June 2015) NO-COST EXTENSION: 3 month, project close-out
PAYER(S): Medicaid, Dually Eligible, Uninsured
OUTCOMES§§
Two arms are associated with increased Medicaid costs: Health Resilience Program shows increase in total quarterly cost of care ($417 per beneficiary per quarter) Standard Transitions Program shows increase in total cost of care of ($372 per beneficiary per quarter)
ED Guides Program shows decrease in ED visits (700 per 1,000 beneficiaries per quarter)
Three arms are associated with significant increases in utilization: Health Resilience Program shows increase in the number of hospitalizations (86 per 1,000 beneficiaries per quarter) and ED visits (201 per 1,000 beneficiaries per quarter) Standard Transitions shows increases in number of hospitalizations (33 per 1,000 beneficiaries per quarter) and ED visits (147 per 1,000 beneficiaries per quarter) Care Transitions shows increases in hospitalizations (170 per 1,000 beneficiaries per quarter) and ED visits (501 per 1,000 beneficiaries per quarter)
SUMMARY: While NORC’s Third Annual Report identified cost savings for five of the Health Commonsprogram’s seven arms, and reduced utilization for two arms (ED Guides, New Directions), the Addendum Report’s updated analysis using seven additional quarters of claims data shows either no cost savings or cost expenditures for six Health Commons program arms, increased utilization for three arms, and reduced utilization for the ED Guides arm. These changes likely reflect bias related to omitted variables: we are unable to match for characteristics related to social determinants of health and access to care, not reflected in the claims data, that PPMC may have used to select those beneficiaries most in need of Health Commons’ services. In addition, the implementation of delivery system reform across the state of Oregon is likely to have introduced further systematic, unmeasured differences between intervention and comparison groups that were not captured through the process ofpropensity score matching.
§Outcomes for cost and utilization are from analyses that include a comparison group and are statistically significant at the p<0.10level.

NORC | HCIA Complex/High-Risk Patient Targeting
ADDENDUM TO THE THIRD ANNUAL REPORT | 116
Program Effectiveness
The Health Commons program is a wide-ranging project sponsored by two large stakeholders: the Providence Portland Medical Center (PPMC) and Health Share of Oregon. We present results of difference-in-differences (DID) analyses for Medicaid beneficiaries (Health Share enrollees) in six separate Health Commons programs from September, 2012, through June, 2015, relative to a comparison group. No findings are presented for the seventh arm (Central City Concern Health Improvement Project) due to a limited sample size of beneficiaries available for that intervention.
NORC’s Third Annual Report presented analyses with three to four quarters of claims data for PPMC’s programs. Analyses in this Addendum Report includes seven additional quarters of claims data for the Health Resilience Program (HRP) and four additional quarters of claims data for the New Directions program. The main analyses for ED Guides, Standard Transitions, Care Transitions (C-TRAIN), and the Intensive Transition Team (ITT) program are of outcomes related to two quarters of post intervention claims data, to focus on the intention of those interventions to guide patients through short-term care transitions.147 Compared to the analyses in the Third Annual Report, which used binary indicators for utilization (i.e., whether a beneficiary had a hospitalization/ED visit), our findings in this report focus on counts of hospitalizations and ED visits, given the intention of these programs to reduce the frequency of utilization for patient populations with previously high utilization or with a need for coordinated support during the transition to outpatient care.148
Within the Health Commons program, none of the awardee’s six arms show a significant decrease in Medicaid cost of Care. One armED Guidesis associated with significantly lower ED use; for ED Guides, however, reductions in total quarterly cost of care and hospitalizations noted in the Third Annual Report are now nonsignificant reductions and increases, respectively. For HRP, Standard Transitions, and C-TRAIN, cost savings and decreased utilization seen in the Third Annual Report are now significant expenditures and increases in hospitalizations and emergency department (ED) visits. New Directions’ significant cost savings and decreased utilization noted in the Third Annual Report, are not sustained in our current analysis. The ITT program, a new analysis since the Third Annual Report, shows impacts for cost and utilization that do not reach statistical significance. Our findings are summarized in Exhibit PPMC.1. Our findings are summarized in Exhibit PPMC.1.
147 We present supplemental analyses for these programs covering all post-intervention quarters for their beneficiaries through June 30, 2015 in Appendix D. 148 We conducted sensitivity analyses with binary models (i.e., the same models used in NORC’s Third Annual Report), and outcomes differed in direction and/or significance of the ED visits outcome for the ED Guides, New Directions, HRP, and ITT programs. For the Standard Transitions program, the Hospitalizations outcome changed to a significant increase from and non-significant decrease when analyzed with a count model in place of a binary model. This may be interpreted as overall hospital utilization increasing while the number of individuals using the hospital may have been decreasing.

NORC | HCIA Complex/High-Risk Patient Targeting
ADDENDUM TO THE THIRD ANNUAL REPORT | 117
Exhibit PPMC.1: Claims-based Findings for PPMC Programs
Intervention (% of Total Health
Share Program Participants§)
Quarters of Data Used in Analysis Description Significant Findings, per Quarter
Health Resilience Program (12%)
11 Embeds Health Resilience Specialists in primary care clinics to assist high-utilizing participants with chronic conditions with disease management and health literacy.
Increase in total cost of care ($417 per beneficiary) Increase in hospitalizations (86 per 1,000 beneficiaries) Increase in ED visits (201 per 1,000 beneficiaries)
New Directions (2%) 8 Embeds LCSWs in Emergency Department at Oregon Health and Science University, targeting beneficiaries with mental health diagnosis and high utilization of ED, attending mental health and primary care appointments.
None
ED Guides (44%) 2 ED diversion program targeting high utilizer beneficiaries with non-acute needs, patient navigation, and care coordination.149
Reduction in ED visits (-700 per 1,000 beneficiaries)
Standard Transitions (44%)
2 Build a standard, enhanced discharge summary into hospital EMRs and incorporate standard protocols for hospital transitions into primary care clinical workflows.
Increase in total cost of care ($372 per beneficiary) Increase in hospitalizations (33 per 1,000 beneficiaries) Increase in ED visits (147 per 1,000 beneficiaries)
Care Transitions (6%) 2 Provides high-intensity transitions support to high-utilizing participants discharged from hospitals.
Increase in hospitalizations (170 per 1,000 beneficiaries) Increase in ED visits (501 per 1,000 beneficiaries)
Intensive Transition Team (5%)
2 Provides transition support for participants with a psychiatric hospital admission, utilizing mobile crisis support specialists to meet participants at the hospital and follow them through their transition to outpatient care.
None
NOTE: § Percentages add up to more than 100%, as beneficiary may participate in more than one program (counts are not unduplicated or unique). Results are interpreted as significant where p<0.10.
Overall, findings are mixed and vary widely based on program type. Only one program, ED Guides, was associated with a significant reduction in cost or utilization, with a reduction in the number of ED visits experienced by program participants, relative to comparators. Two programs, HRP and Standard Transitions, are associated with significant increases in both cost and utilization; one additional program, C-TRAIN, showed an increase in hospitalizations but no accompanying increase in cost. No program showed significant reduction in Medicaid cost. The nature of the programs vary from long-term maintenance care (HRP, New Directions) to narrowly-focused transition care (ED Guides), each targeting specific groups of patient, so it is not necessarily surprising to see wide variations in program impact estimates. Additionally, beneficiaries are not restricted from enrolling in multiple PPMC programs; some
149 Patients qualify as high utilizers if any of the following conditions are met based on a 12-month review of claims activity: 1) no inpatient admissions and 6+ ED visits, 2) two or more inpatient admissions OR one inpatient admission and six or more ED visits, or 3) one inpatient admission and up to five ED visits.

NORC | HCIA Complex/High-Risk Patient Targeting
ADDENDUM TO THE THIRD ANNUAL REPORT | 118
beneficiaries are enrolled in more than one PPMC program simultaneously, which makes it difficult to ‘untangle’ and interpret program-specific impact estimates.
The impacts noted above and throughout the chapter should be interpreted with caution, as there are two important limitations of our evaluation of the Health Commons program:
■ PPMC’s intervention programs targeted Medicaid beneficiaries with psycho-social needs andother barriers to care. We were unable to obtain variables corresponding to these needs and carebarriers from Medicaid claims data used for our evaluation. Although the intervention andcomparison groups (the latter drawn from Oregon Medicaid) were matched, to the extentpossible, on observed demographic, clinical, and utilization characteristics, systematic differencesbetween the groups are likely, due to omitted variables such as those related to access to care,biasing results negatively against the awardee.
■ During the study period, delivery system reform in Oregon’s Medicaid program systematicallyaffected the comparison group, attenuating reported program impacts for Health Commons. Apartfrom Health Commons, fifteen other regional coordinated care organizations (CCOs) werecreated in the state, with the aim of providing high quality accountable care for Medicaidbeneficiaries. During the study period, comparison group beneficiaries received interventionsfrom their respective CCOs similar to those provided by Health Commons.
Recent evidence documents cost savings for Oregon’s Coordinated Care Organization delivery system reform.150 The attenuation of the Health Commons programs’ impacts observed in the findings below, compared with the positive claims-based findings observed in NORC’s Third Annual Report, is likely to reflect the multiple challenges that NORC faced in constructing comparison groups, as well as the fact that fewer quarters of data were used in this report for three programs (ED Guides, Standard Transitions, C-TRAIN) to better reflect the period of anticipated impact on those programs.
Core Measures: Health Resilience Program (HRP)
Our analysis compares the experiences of Health Share enrollees in the Health Resilience Program (HRP) with those of a matched group of comparators. We examine the impact of the HRP program on participants’ cost and utilization over the entire enrollment period and in each quarter of program enrollment.
Finder File and Creation of Analytic Sample, HRP. PPMC provided a finder file that listed program participants and enrollment dates, enabling us to use Oregon Medicaid Alpha-MAX claims to calculate outcome measures. 151 We identified 1,474 unique beneficiaries enrolled in HRP and further limited this number by Medicaid identifiers, risk scores, and comorbidities to yield an analytic sample of 1,337 beneficiaries.
150 McConnell, K. J., Renfro, S., Lindrooth, R. C., Cohen, D. J., Wallace, N. T., & Chernew, M. E. (2017). Oregon’s Medicaid Reform And Transition To Global Budgets Were Associated With Reductions In Expenditures. Health Affairs, 36(3), 451-459. 151 Medicaid claims from the Oregon Medicaid Alpha-MAX are available for the time period January 1, 2011 through June 30, 2015.
Measures (per 1,000 beneficiaries unless noted) Total Cost of Care per beneficiary All-Cause Hospitalizations Emergency Department (ED) Visits

NORC | HCIA Complex/High-Risk Patient Targeting
ADDENDUM TO THE THIRD ANNUAL REPORT | 119
Comparison Group, HRP. The comparison pool consists of beneficiaries who were enrolled in Oregon Medicaid during the same time period as HRP participants and had an initial primary care visit occurring from September 2012 to June 2015, as identified from Alpha-MAX claims. We use propensity score matching to find appropriate comparators.152 The final propensity score model included age, race, chronic illness and disability payment system (CDPS) risk score, indicators for dual eligibility and disability eligibility, indicator for high utilization of emergency department services, prior year utilization (hospitalizations and ED visits) and cost, and chronic medical condition flags (chemical dependency, psychiatric conditions, chronic obstructive pulmonary disease, congestive heart failure, depression, and diabetes). Tests of common support and covariate balance across treatment and comparison groups indicate that propensity score matching improves comparability.153
Descriptive Characteristics, HRP. Exhibit PPMC.2 displays the descriptive characteristics of beneficiaries in the treatment and comparison groups, with respect to demographics, comorbidities, and prior utilization.154 HRP participants are more likely to be female, between the ages of 40-49 years, be a high utilizer, and have more hospitalizations and ED visits in the period prior to enrollment.155
152 For more information on propensity score matching, please refer to NORC’s Third Annual Report, Appendix C. 153 For more detailed information on propensity score matching and tests of common support and covariate balance for this awardee, refer to Appendix D. 154 We test differences between the groups with a t-test for continuous measures (CDPS risk score and utilization in the year prior to the index date) or a chi-square test for categorical variables (age, race, disability, eligibility, and chronic diseases). 155 Patients qualify as high utilizers if any of the following conditions are met based on a 12-month review of claims activity: 1) no inpatient admissions and 6+ ED visits, 2) two or more inpatient admissions OR one inpatient admission and six or more ED visits, or 3) one inpatient admission and up to five ED visits.

NORC | HCIA Complex/High-Risk Patient Targeting
ADDENDUM TO THE THIRD ANNUAL REPORT | 120
Exhibit PPMC.2: Descriptive Characteristics for PPMC HRP and Comparison Group Beneficiaries
Variable HRP Comparison Number of Beneficiaries 1,337 1,337 Mean Number of Quarters Enrolled [Range] 5.0 [1-11] 5.0 [1-11] Gender % (N) Female** 64.3 (859) 59.8 (799) Age % (N) <20 years 1.1 (14) 2.2 (29) 20-29 years 11.7 (157) 13.6 (182) 30-39 years 17.1 (228) 16.7 (223) 40-49 years** 23.1 (309) 19.2 (256) 50-59 years 30.9 (413) 28.1 (375) >60 years*** 16.2 (216) 20.3 (272) Race/Ethnicity % (N) White 63.9 (854) 65.7 (879) Black/African American 23.0 (308) 22.4 (299) Hispanic 5.5 (74) 4.9 (66) Dual Eligible Status % (N) Dually Eligible 19.0 (254) 20.7 (277) Reason for Medicaid Eligibility % (N) Disability 52.4 (701) 53.4 (714) Risk Score CDPS Risk Score, Mean (Standard Deviation) 3.0 (1.9) 3.1 (2.6) High Utilizer Flag§ (N)*** 80.0 (1,070) 73.2 (979) Condition % (N) Chemical Dependency 13.2 (176) 12.9 (173) Chronic Obstructive Pulmonary Disease (COPD) 22.2 (297) 22.4 (300) Congestive Heart Failure (CHF) 19.4 (259) 18.7 (250) Depression 31.3 (419) 34.0 (455) Diabetes 36.1 (483) 35.8 (478) Psychiatric Conditions 10.9 (145) 12.0 (161) Mean Utilization and Cost in Year Prior to Program Enrollment (per 1,000 beneficiaries unless noted) Total Medicaid Cost (SD) per beneficiary $15,007 ($16,043) $15,215 ($20,190) Hospitalizations (SD)** 1,423 (2,177) 1,242 (1,689) ED Visits (SD)*** 7,144 (8,487) 5,962 (11,773) NOTE: *p<0.10, **p<0.05, ***p<0.01. §High utilizer flag is based on a 12-month review of claims activity. Patients qualify as high utilizers if any of the following conditions are met: 1) no inpatient admissions and 6+ ED visits, 2) two or more inpatient admissions OR one inpatient admission and six or more ED visits, or 3) one inpatient admission and up to five ED visits.

NORC | HCIA Complex/High-Risk Patient Targeting
ADDENDUM TO THE THIRD ANNUAL REPORT | 121
Impact of the PPMC HRP. Exhibit PPMC.3 displays the average quarterly and aggregate impact of HRP on its participants relative to the comparison group. .
156 Utilization measures are reported as counts, noting the number of occurrences of an event in each quarter for a specific beneficiary. We find the following for HRP, relative to the comparison group:
■ Cost: A significant increase in total quarterly cost of care ($417 per beneficiary per quarter).
■ Utilization Measures: A significant increase in the number of hospitalizations (86 per 1,000beneficiaries per quarter) and ED visits (201 per 1,000 beneficiaries per quarter).
Exhibit PPMC.3: Impact of PPMC HRP on Outcomes
AVERAGE QUARTERLY IMPACT§ Outcome Measure (per 1,000 beneficiaries unless noted) Adjusted Estimate 90% Confidence
Interval 80% Confidence
Interval Total Cost of Care per beneficiary ($) $417** $129, $705 $192, $641 Hospitalizations 86*** 45, 127 54, 118 ED Visits 201** 41, 361 76, 326
AGGREGATE IMPACT§§
Outcome Measure Adjusted Estimate 90% Confidence Interval
80% Confidence Interval
Total Cost of Care ($) $2,798,663** $863,050, $4,734,276 $1,290,572, $4,306,753 Hospitalizations 575*** 297, 853 359, 791 ED Visits 1,351** 277, 2,425 514, 2,188
NOTE: +p<0.20, *p<0.10, **p<0.05, ***p<0.01. Bold font indicates findings that are statistically significant at p<0.10. §Quarterly impact is the average quarterly DID estimate per quarter of program implementation. §§Aggregate impact is the total DID estimate for all program participants across all quarters of program implementation. Aggregate impact is estimated for this awardee based on the total number of program participants (1,337), with an average length of program enrollment of 5.0 quarters. Disclaimer: Standard statistical practice is to use confidence intervals of 90% or higher. 80% confidence intervals are provided here for comparison purposes.
Impact of the PPMC HRP in Each Quarter of Enrollment. Findings from a quarterly fixed effects (QFE) DID model of impact —for each quarter individually rather than for an average quarter as presented above— are consistent with the average quarterly impact summarized above. Please see Appendix D for presentation of these findings.
Overall, our analysis of PPMC’s HRP suggests that the program is not associated with reductions in cost or utilization, relative to a comparison group. However, these results should be interpreted with caution due to limitations in our ability to construct an appropriate comparison group from claims data. When constructing the comparison group for this HRP, we were unable to achieve balance on prior year utilization and the percentage of high utilizers.157 Thus, the estimates presented here may be impacted by this pre-intervention imbalance in beneficiary characteristics. Additionally, we were unable to fully account for variations in social determinants of health that impact this population (e.g., psychosocial
156 Adjustment factors include age, race, gender, year of enrollment, dual eligibility, disability eligibility, CDPS risk score, high utilizer flag, asthma, CHF, COPD, depression, diabetes, and liver disease. Results are interpreted as significant when p<0.10. 157 Patients qualify as high utilizers if any of the following conditions are met based on a 12-month review of claims activity: 1) no inpatient admissions and 6+ ED visits, 2) two or more inpatient admissions OR one inpatient admission and six or more ED visits, or 3) one inpatient admission and up to five ED visits.

NORC | HCIA Complex/High-Risk Patient Targeting
ADDENDUM TO THE THIRD ANNUAL REPORT | 122
needs, barriers to care). These types of measures are not readily available in claims data, and thus we could not take them into account when constructing the comparison group.
Core Measures: New Directions Program
Our analysis compares the experiences of Health Share enrollees in the New Directions program with those of a matched group of comparators. We examine the impact of the New Directions program on participants’ cost and utilization over the entire enrollment period and in each quarter of program enrollment.
Finder File and Creation of Analytic Sample, New Directions. PPMC provided a finder file that listed program participants and enrollment dates, enabling us to use Oregon Medicaid Alpha-MAX claims to calculate outcome measures..
158 We identified 191 unique beneficiaries enrolled in the New Directions program and further limited this number by enrollment date, Medicaid identifiers, risk scores, and comorbidities to yield an analytic sample of 173 beneficiaries.
Comparison Group, New Directions. The comparison pool consists of beneficiaries who were enrolled in Oregon Medicaid during the same time period as New Directions participants and had an ED visit occurring during the same calendar year as New Directions participants, as identified from Alpha-MAX claims. We use propensity score matching without replacement to find appropriate comparators.159 The final propensity score model included age, race, CDPS risk score, indicators for dual eligibility and disability eligibility, indicator for high utilization of emergency department services, chronic medical condition flags (affective disorders, chemical dependency, psychiatric conditions, depression, and hypertension), and prior year utilization (hospitalizations and ED visits) and cost. Tests of common support and covariate balance across treatment and comparison groups indicate that propensity score matching improves comparability.160
Descriptive Characteristics, New Directions. Exhibit PPMC.4 displays the descriptive characteristics of beneficiaries in the treatment and comparison groups, with respect to demographics, comorbidities, and prior utilization.161 We observe few differences in demographics, original Medicare coverage reason, comorbidities, and prior year cost and utilization, although New Directions participants are less likely to be female and more likely to be 30-39 years old, Black, and high utilizers.162
158 Medicaid claims from the Oregon Medicaid Alpha-MAX are available for the time period January 1, 2011 through June 30, 2015. 159 For more information on propensity score matching, refer to NORC’s Third Annual Report, Appendix C. 160 For more detailed information on propensity score matching and tests of common support and covariate balance for this awardee, refer to Appendix D. 161 We test differences between the groups with a t-test for continuous measures (CDPS risk score and utilization in the year prior to the index date) or a chi-square test for categorical variables (age, race, disability, eligibility, and chronic diseases). 162 Patients qualify as high utilizers if any of the following conditions are met based on a 12-month review of claims activity: 1) no inpatient admissions and 6+ ED visits, 2) two or more inpatient admissions OR one inpatient admission and six or more ED visits, or 3) one inpatient admission and up to five ED visits.
Measures (per 1,000 beneficiaries unless noted) Total Cost of Care per beneficiary All-Cause Hospitalizations Emergency Department (ED) Visits

NORC | HCIA Complex/High-Risk Patient Targeting
ADDENDUM TO THE THIRD ANNUAL REPORT | 123
Exhibit PPMC.4: Descriptive Characteristics for New Directions Program and Comparison Group Beneficiaries
Variable New Directions Comparison Number of Beneficiaries 173 173 Mean Number of Quarters Enrolled [Range] 5.0 [1-8] 5.0 [1-8] Gender % (N) Female *** 41.0 (71) 55.5 (96) Age % (N)** 20-29 years 9.8 (17) 9.8 (17) 30-39 years ** 19.7 (34) 11.6 (20) 40-49 years 27.2 (47) 25.4 (44) 50-59 years 32.4 (56) 37.0 (64) >60 years 11.0 (19) 16.2 (28) Race/Ethnicity % (N White 77.5 (134) 83.2 (144) Black/African American ** 13.3 (23) 6.4 (11) Hispanic 4.6 (8) 5.2 (9) Dual Eligible Status % (N) Dually Eligible 13.9 (24) 18.5 (32) Reason for Medicaid Eligibility % (N) Disability 70.5 (122) 75.7 (131) Risk Score CDPS Risk Score, Mean (Standard Deviation) 3.7 (2.1) 4.1 (3.3) High Utilizer Flag§ (N) *** 93.1 (161) 88.4 (153) Condition % (N) Affective Disorders 52.6 (91) 48.6 (84) Chemical Dependency 36.4 (63) 40.5 (70) Depression 38.7 (67) 40.5 (70) Hypertension 4.1 (7) 5.8 (10) Psychiatric Conditions 20.2 (35) 20.2 (35) Mean Utilization and Cost in Year Prior to Program Enrollment (per 1,000 beneficiaries unless noted) Total Medicaid Cost (SD) per beneficiary $18,391 ($18,335) $19,893 ($24,964) Hospitalizations (SD) 2,601 (2,742) 2,341 (2,831) ED Visits (SD) 14,850 (15,515) 12,543 (18,282) NOTE: *p<0.10, **p<0.05, ***p<0.01. §High utilizer flag is based on a 12-month review of claims activity. Patients qualify as high utilizers if any of the following conditions are met: 1) no inpatient admissions and 6+ ED visits, 2) two or more inpatient admissions OR one inpatient admission and six or more ED visits, or 3) one inpatient admission and up to five ED visits.

NORC | HCIA Complex/High-Risk Patient Targeting
ADDENDUM TO THE THIRD ANNUAL REPORT | 124
Impact of the PPMC New Directions Program. Exhibit PPMC.5 displays the average quarterly and aggregate impact of the New Directions Program on its participants relative to the comparison group.163 Utilization measures are reported as counts, noting the number of occurrences of an event in each quarter for a specific beneficiary. We find the following for the New Directions program, relative to the comparison group:
■ Cost: A non-significant increase in total quarterly cost of care.
■ Utilization Measures: A non-significant decrease in ED visits and a non-significant increase inhospitalizations.
Exhibit PPMC.5: Impact of New Directions Program on Outcomes
AVERAGE QUARTERLY IMPACT§ Outcome Measure (per 1,000 beneficiaries unless noted) Adjusted Estimate 90% Confidence
Interval 80% Confidence
Interval Total Cost of Care per beneficiary ($) $1,098+ -$160, $2,356 $118, $2,078 Hospitalizations 23 -103, 149 -75, 121 ED Visits -385 -1,029, 259 -887, 117
AGGREGATE IMPACT§§
Outcome Measure Adjusted Estimate 90% Confidence Interval
80% Confidence Interval
Total Cost of Care ($) $994,170+ -$137,734, $2,026,074 $101,009, $1,787,331 Hospitalizations 18 -84, 120 -62, 98 ED Visits -331 -885, 223 -763, 101
NOTE: +p<0.20, *p<0.10, **p<0.05, ***p<0.01. Bold font indicates findings that are statistically significant at p<0.10. §Quarterly impact is the average quarterly DID estimate per quarter of program implementation. §§Aggregate impact is the total DID estimate for all program participants across all quarters of program implementation. Aggregate impact is estimated for this awardee based on the total number of program participants (173), with an average length of program enrollment of 5.0 quarters. Please note that the estimate for aggregate impact may be smaller thant the estimate for average quarterly impact if there are fewer than 1,000 enrolled beneficiaries, as the aggregate estimate is equal to the average quarterly estimate multipled by the sample size in each quarter, divided by 1,000. Disclaimer: Standard statistical practice is to use confidence intervals of 90% or higher. 80% confidence intervals are provided here for comparison purposes.
Impact of the PPMC New Directions Program in Each Quarter of Enrollment. Findings from a quarterly fixed effects (QFE) DID model of impact —for each quarter individually rather than for an average quarter as presented above— are consistent with the average quarterly impact summarized above. Please see Appendix D for presentation of these findings.
Overall, our analysis of PPMC’s New Directions program suggests that the program is not associated with reductions in cost or utilization, relative to a comparison group. However, these results should be interpreted with caution due to limitations in our ability to construct an appropriate comparison group from claims data. When constructing the comparison group for this HRP, we were unable to achieve balance on several key covariates, including prior year cost and utilization and the percentage of high
163 Adjustment factors include age, race, gender, year of enrollment, dual eligibility, disability eligibility, CDPS risk score, high utilizer flag, asthma, depression, affective disorders, diabetes, and hypertension. Results are interpreted as significant when p<0.10.

NORC | HCIA Complex/High-Risk Patient Targeting
ADDENDUM TO THE THIRD ANNUAL REPORT | 125
utilizers.164 Thus, the higher cost and utilization seen in the New Directions group may be due in part to this pre-intervention imbalance in beneficiary characteristics. Additionally, we were unable to fully account for variations in social determinants of health that impact this population (e.g., psychosocial needs, barriers to care). These types of measures are not readily available in claims data, and thus we could not take them into account when constructing the comparison group.
Core Measures: ED Guides Program
Our analysis compares the experiences of Health Share enrollees in the ED Guides program with those of a matched group of comparators. We examine the impact of the ED Guides program on participants’ cost and utilization over the entire enrollment period and in each quarter of program enrollment.
Finder File and Creation of Analytic Sample, ED Guides. PPMC provided a finder file that listed program participants and enrollment dates, enabling us to use Oregon Medicaid Alpha-MAX claims to calculate outcome measures. .
165 We identified 5,515 unique beneficiaries enrolled in the ED Guides program and further limited this number by enrollment date, Medicaid identifiers, risk scores, and comorbidities to yield an analytic sample of 4,822 beneficiaries.
Comparison Group, ED Guides. The comparison pool consists of beneficiaries who were enrolled in Oregon Medicaid during the same time period as New Directions participants and had an ED visit occurring during the same calendar year as ED Guides participants (2012-2015), as identified from Alpha-MAX claims. We use propensity score matching without replacement to find appropriate comparators.166 The final propensity score model includes age, race, gender, CDPS risk score, indicators for dual eligibility and disability eligibility, chronic medical condition flags (asthma, affective disorders, depression, and diabetes), and prior year hospitalizations and cost. Tests of common support and covariate balance across treatment and comparison groups indicate that propensity score matching improves comparability.167
Descriptive Characteristics, ED Guides. Exhibit PPMC.6 displays the descriptive characteristics of beneficiaries in the treatment and comparison groups, with respect to demographics, comorbidities, and prior utilization.168 We observe few differences in demographics, original Medicare coverage reason,
164 Patients qualify as high utilizers if any of the following conditions are met based on a 12-month review of claims activity: 1) no inpatient admissions and 6+ ED visits, 2) two or more inpatient admissions OR one inpatient admission and six or more ED visits, or 3) 1 inpatient admission and up to five ED visits. 165 Medicaid claims from the Oregon Medicaid Alpha-MAX are available for the time period January 1, 2011 through June 30, 2015. We limit the ED Guides analysis to the first the two quarters after program enrollment claims data to focus on the intention of those interventions to guide patients through short-term care transitions; for supplementary analysis presenting outcomes for all quarters of available data, refer to Appendix D. 166 For more information on propensity score matching, refer to NORC’s Third Annual Report, Appendix C. 167 For more detailed information on propensity score matching and tests of common support and covariate balance for this awardee, refer to Appendix D. 168 We test differences between the groups with a t-test for continuous measures (age, CDPS risk score and utilization in the year prior to the index date) or a chi-square test for categorical variables (race, disability, eligibility, and chronic diseases).
Measures (per 1,000 beneficiaries unless noted) Total Cost of Care per beneficiary All-Cause Hospitalizations Emergency Department (ED) Visits
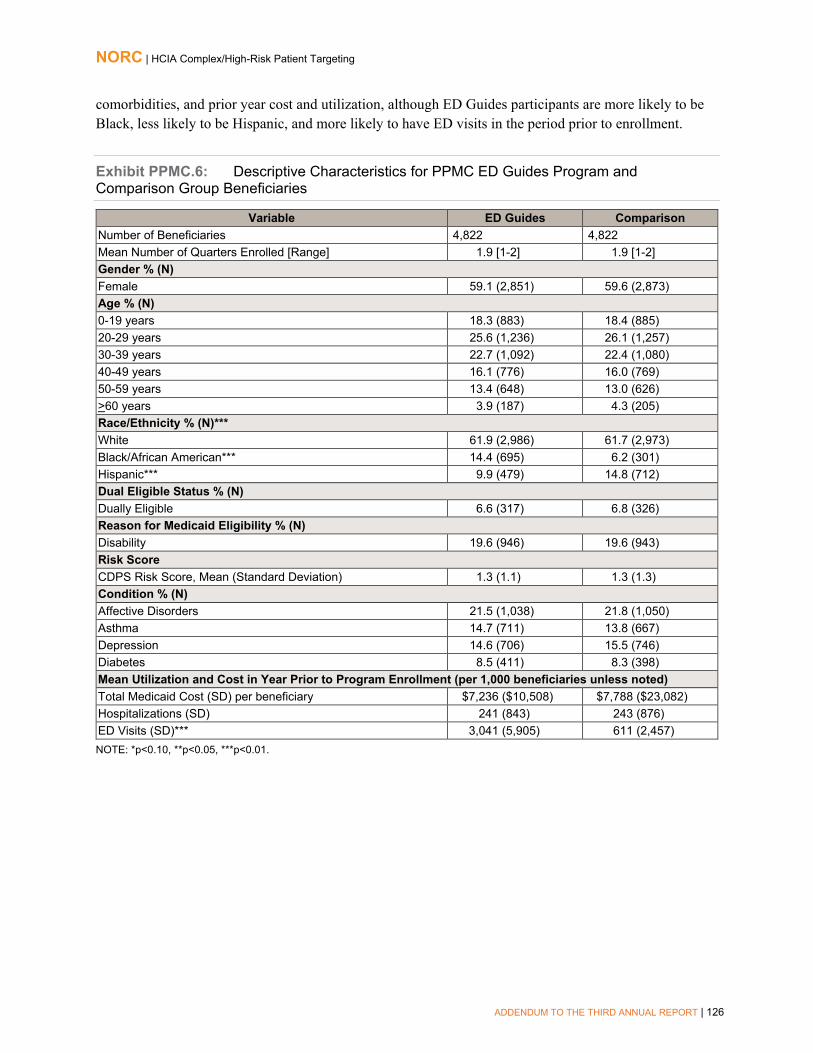
NORC | HCIA Complex/High-Risk Patient Targeting
ADDENDUM TO THE THIRD ANNUAL REPORT | 126
comorbidities, and prior year cost and utilization, although ED Guides participants are more likely to be Black, less likely to be Hispanic, and more likely to have ED visits in the period prior to enrollment.
Exhibit PPMC.6: Descriptive Characteristics for PPMC ED Guides Program and Comparison Group Beneficiaries
Variable ED Guides Comparison Number of Beneficiaries 4,822 4,822 Mean Number of Quarters Enrolled [Range] 1.9 [1-2] 1.9 [1-2] Gender % (N) Female 59.1 (2,851) 59.6 (2,873) Age % (N) 0-19 years 18.3 (883) 18.4 (885) 20-29 years 25.6 (1,236) 26.1 (1,257) 30-39 years 22.7 (1,092) 22.4 (1,080) 40-49 years 16.1 (776) 16.0 (769) 50-59 years 13.4 (648) 13.0 (626) >60 years 3.9 (187) 4.3 (205) Race/Ethnicity % (N)*** White 61.9 (2,986) 61.7 (2,973) Black/African American*** 14.4 (695) 6.2 (301) Hispanic*** 9.9 (479) 14.8 (712) Dual Eligible Status % (N) Dually Eligible 6.6 (317) 6.8 (326) Reason for Medicaid Eligibility % (N) Disability 19.6 (946) 19.6 (943) Risk Score CDPS Risk Score, Mean (Standard Deviation) 1.3 (1.1) 1.3 (1.3) Condition % (N) Affective Disorders 21.5 (1,038) 21.8 (1,050) Asthma 14.7 (711) 13.8 (667) Depression 14.6 (706) 15.5 (746) Diabetes 8.5 (411) 8.3 (398) Mean Utilization and Cost in Year Prior to Program Enrollment (per 1,000 beneficiaries unless noted) Total Medicaid Cost (SD) per beneficiary $7,236 ($10,508) $7,788 ($23,082) Hospitalizations (SD) 241 (843) 243 (876) ED Visits (SD)*** 3,041 (5,905) 611 (2,457) NOTE: *p<0.10, **p<0.05, ***p<0.01.

NORC | HCIA Complex/High-Risk Patient Targeting
ADDENDUM TO THE THIRD ANNUAL REPORT | 127
Impact of the PPMC ED Guides Program. Exhibit PPMC.7 displays the average quarterly and aggregate impact of ED Guides on its participants relative to the comparison group.169 The analysis is for the first two post-enrollment quarters; see Appendix D for supplementary analysis of all available quarters of claims data. As the intent of the ED Guides program is to affect short-term outcomes (i.e., outcomes in a short-term transitional care period) rather than long-term outcomes, we present outcomes related to only two quarters of post intervention claims data here. Utilization measures are reported as counts, noting the number of occurrences of an event in each quarter for a specific beneficiary. We find the following for the ED Guides program, relative to the comparison group:
■ Cost: A non-significant decrease in total quarterly cost of care.
■ Utilization Measures: A significant decrease in ED visits (700 per 1,000 beneficiaries perquarter) and a non-significant increase in hospitalizations.170
Exhibit PPMC.7: Impact of PPMC ED Guides Program on Outcomes
AVERAGE QUARTERLY IMPACT§ Outcome Measure (per 1,000 beneficiaries unless noted) Adjusted Estimate 90% Confidence
Interval 80% Confidence
Interval Total Cost of Care per beneficiary ($) -$81+ -$176, $14 -$155, -$7 Hospitalizations 1 -10, 12 -8, 10 ED Visits -700*** -752, -648 -741, -659
AGGREGATE IMPACT§§
Outcome Measure Adjusted Estimate 90% Confidence Interval
80% Confidence Interval
Total Cost of Care ($) -$746,644+ -$1,626,942, $133,654 -$1,432,688, -$60,600 Hospitalizations 12 -91, 115 -68, 92 ED Visits -6,469*** -6,952, -5,986 -6,845, -6,093
NOTE: +p<0.20, *p<0.10, **p<0.05, ***p<0.01. Bold font indicates findings that are statistically significant at p<0.10. §Quarterly impact is the average quarterly DID estimate per quarter of program implementation. §§Aggregate impact is the total DID estimate for all program participants across all quarters of program implementation. Aggregate impact is estimated for this awardee based on the total number of program participants (4,822), with an average length of program enrollment of 1.9 quarters. Disclaimer: Standard statistical practice is to use confidence intervals of 90% or higher. 80% confidence intervals are provided here for comparison purposes.
Impact of the PPMC ED Guides Program in Each Quarter of Enrollment. Findings from a quarterly fixed effects (QFE) DID model of impact —for each quarter individually rather than for an average quarter as presented above— are consistent with the average quarterly impact summarized above. Please see Appendix D for presentation of these findings.
Overall, our analysis of PPMC’s ED Guides program suggests that the program is associated with a significant reduction in ED visits, as well as a non-significant reduction in total cost of care. While we were able to achieve balance on all key covariates while constructing the comparison group for the ED Guides program, these results should be interpreted with caution due to limitations in our ability to
169 Adjustment factors include age, race, gender, year of enrollment, dual eligibility, disability eligibility, CDPS risk score, high utilizer flag, asthma, congestive heart failure, chronic obstructive pulmonary disease, depression, diabetes, and liver disease. Results are interpreted as significant when p<0.10. Results represent outcomes in the two quarters after program enrollment; for supplementary analysis presenting outcomes for all quarters of available data, refer to Appendix D. 170 For supplementary analysis presenting outcomes for all quarters of available data, refer to Appendix D.

NORC | HCIA Complex/High-Risk Patient Targeting
ADDENDUM TO THE THIRD ANNUAL REPORT | 128
account for variations in social determinants of health that impact this population (e.g., psychosocial needs, barriers to care). These types of measures are not readily available in claims data, and thus we could not take them into account when constructing the comparison group.
Core Measures: Standard Transitions Program
Our analysis compares the experiences of Health Share enrollees in Standard Transitions with those of a matched group of comparators. We examine the impact of the HRP program on participants’ cost and utilization over the entire enrollment period and in each quarter of program enrollment.
Finder File and Creation of Analytic Sample, Standard Transitions. PPMC provided a finder file that listed program participants and enrollment dates, enabling us to use Oregon Medicaid Alpha-MAX claims to calculate outcome measures.171 We identified 5,500 unique beneficiaries enrolled in the Standard Transitions program and further limited this number by enrollment date, Medicaid identifiers, risk scores, and comorbidities to yield an analytic sample of 3,705 beneficiaries.
Comparison Group, Standard Transitions. The comparison pool consists of beneficiaries who were enrolled in Oregon Medicaid during the same time period as New Directions participants and had a hospital discharge during the study period between September 2012 and June 2015, as identified from Alpha-MAX claims. We use propensity score matching without replacement to find appropriate comparators.172 The final propensity score model includes age, gender, race/ethnicity, CDPS risk score, indicators for dual eligibility and disability eligibility, major diagnostic category, and prior year utilization (hospitalizations and ED visits) and cost. Tests of common support and covariate balance across treatment and comparison groups indicate that propensity score matching improves comparability.173
Descriptive Characteristics, Standard Transitions. Exhibit PPMC.8 displays the descriptive characteristics of beneficiaries in the treatment and comparison groups, with respect to demographics, comorbidities, and prior utilization.174 Standard Transitions participants are more likely to be 30-39 years old, Hispanic, have a higher CDPS risk score, be a high utilizer, have comorbidities, and be discharged to home.175
171 Medicaid claims from the Oregon Medicaid Alpha-MAX are available for the time period January 1, 2011 through June 30, 2015. We limit the Standard Transitions analysis to the first the two quarters after program enrollment claims data to focus on the intention of those interventions to guide patients through short-term care transitions; for supplementary analysis presenting outcomes for all quarters of available data, refer to Appendix D. 172 For more information on propensity score matching, refer to NORC’s Third Annual Report, Appendix C. 173 For more detailed information on propensity score matching and tests of common support and covariate balance for this awardee, refer to Appendix D. 174 We test differences between the groups with a t-test for continuous measures (age, CDPS risk score and utilization in the year prior to the index date) or a chi-square test for categorical variables (race, disability, eligibility, and chronic diseases). 175 Patients qualify as high utilizers if any of the following conditions are met based on a 12-month review of claims activity: 1) no inpatient admissions and 6+ ED visits, 2) two or more inpatient admissions OR one inpatient admission and six or more ED visits, or 3) one inpatient admission and up to five ED visits.
Measures (per 1,000 beneficiaries unless noted) Total Cost of Care per beneficiary All-Cause Hospitalizations Emergency Department (ED) Visits
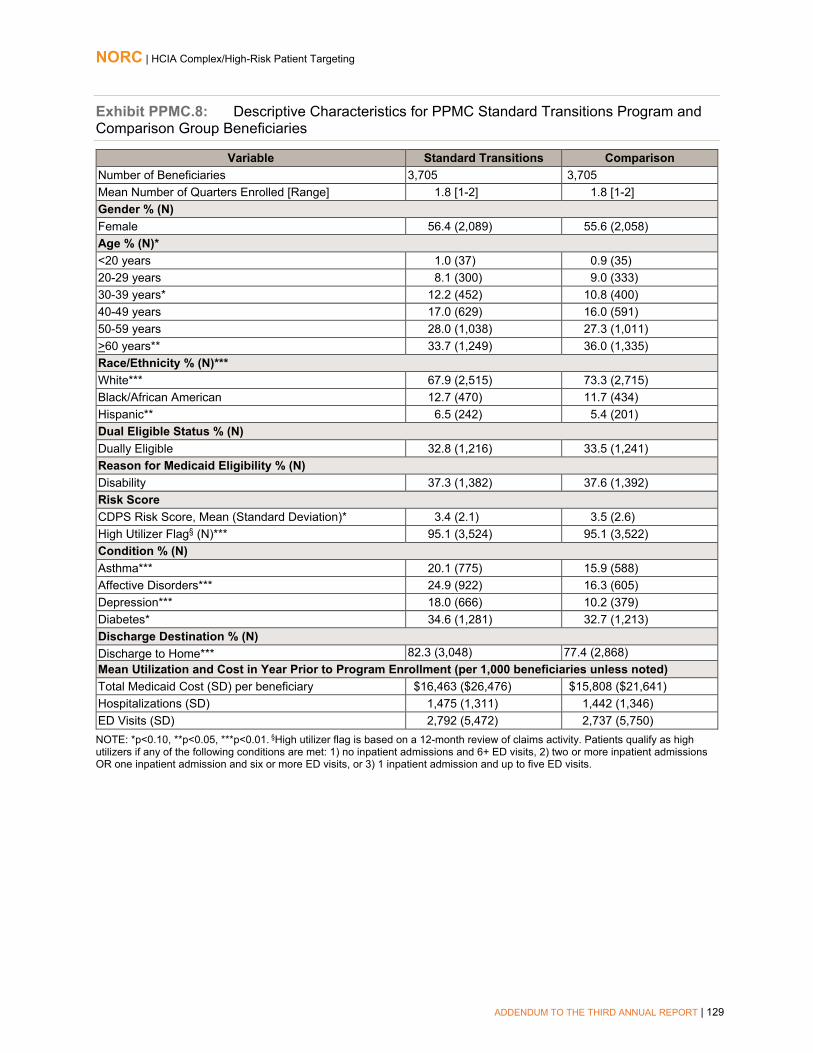
NORC | HCIA Complex/High-Risk Patient Targeting
ADDENDUM TO THE THIRD ANNUAL REPORT | 129
Exhibit PPMC.8: Descriptive Characteristics for PPMC Standard Transitions Program and Comparison Group Beneficiaries
Variable Standard Transitions Comparison Number of Beneficiaries 3,705 3,705 Mean Number of Quarters Enrolled [Range] 1.8 [1-2] 1.8 [1-2] Gender % (N) Female 56.4 (2,089) 55.6 (2,058) Age % (N)* <20 years 1.0 (37) 0.9 (35) 20-29 years 8.1 (300) 9.0 (333) 30-39 years* 12.2 (452) 10.8 (400) 40-49 years 17.0 (629) 16.0 (591) 50-59 years 28.0 (1,038) 27.3 (1,011) >60 years** 33.7 (1,249) 36.0 (1,335) Race/Ethnicity % (N)*** White*** 67.9 (2,515) 73.3 (2,715) Black/African American 12.7 (470) 11.7 (434) Hispanic** 6.5 (242) 5.4 (201) Dual Eligible Status % (N) Dually Eligible 32.8 (1,216) 33.5 (1,241) Reason for Medicaid Eligibility % (N) Disability 37.3 (1,382) 37.6 (1,392) Risk Score CDPS Risk Score, Mean (Standard Deviation)* 3.4 (2.1) 3.5 (2.6) High Utilizer Flag§ (N)*** 95.1 (3,524) 95.1 (3,522) Condition % (N) Asthma*** 20.1 (775) 15.9 (588) Affective Disorders*** 24.9 (922) 16.3 (605) Depression*** 18.0 (666) 10.2 (379) Diabetes* 34.6 (1,281) 32.7 (1,213) Discharge Destination % (N) Discharge to Home*** 82.3 (3,048) 77.4 (2,868) Mean Utilization and Cost in Year Prior to Program Enrollment (per 1,000 beneficiaries unless noted) Total Medicaid Cost (SD) per beneficiary $16,463 ($26,476) $15,808 ($21,641) Hospitalizations (SD) 1,475 (1,311) 1,442 (1,346) ED Visits (SD) 2,792 (5,472) 2,737 (5,750) NOTE: *p<0.10, **p<0.05, ***p<0.01. §High utilizer flag is based on a 12-month review of claims activity. Patients qualify as high utilizers if any of the following conditions are met: 1) no inpatient admissions and 6+ ED visits, 2) two or more inpatient admissions OR one inpatient admission and six or more ED visits, or 3) 1 inpatient admission and up to five ED visits.

NORC | HCIA Complex/High-Risk Patient Targeting
ADDENDUM TO THE THIRD ANNUAL REPORT | 130
Impact of the PPMC Standard Transitions Program. Exhibit PPMC.9 displays the average quarterly and aggregate impact of the Standard Transitions intervention on its participants relative to the comparison group.176 The analysis is for the first two post-enrollment quarters; see Appendix D for supplementary analysis of all available quarters of claims data. As the intent of the Standard Transitions program is to impact short-term outcomes (i.e., outcomes in a short-term transitional care period) rather than long-term outcomes, we present outcomes related to only two quarters of post intervention claims data here. Utilization measures are reported as counts, noting the number of occurrences of an event in each quarter for a specific beneficiary. We find the following for the Standards Transitions program, relative to the comparison group:
■ Cost: A significant increase in total cost of care of ($372 per beneficiary per quarter).
■ Utilization Measures: Significant increases in number of hospitalizations (33 per 1,000beneficiaries per quarter) and ED visits (147 per 1,000 beneficiaries per quarter).
Exhibit PPMC.9: Impact of PPMC Standard Transitions Program on Outcomes
AVERAGE QUARTERLY IMPACT§ Outcome Measure (per 1,000 beneficiaries unless noted) Adjusted Estimate 90% Confidence Interval
80% Confidence Interval
Total Cost of Care per beneficiary ($) $372*** $187, $557 $228, $516 Hospitalizations 33** 9, 57 14, 52 ED Visits 147*** 76, 218 91, 203
AGGREGATE IMPACT§§
Outcome Measure Adjusted Estimate 90% Confidence Interval 80% Confidence
Interval Total Cost of Care ($) $2,538,724*** $1,277,616, $3,799,832 $1,555,903, $3,521,545 Hospitalizations 227** 61, 393 98, 356 ED Visits 1,000*** 513, 1,487 621, 1,379
NOTE: +p<0.20, *p<0.10, **p<0.05, ***p<0.01. Bold font indicates findings that are statistically significant at p<0.10. §Quarterly impact is the average quarterly DID estimate per quarter of program implementation. §§Aggregate impact is the total DID estimate for all program participants across all quarters of program implementation. Aggregate impact is estimated for this awardee based on the total number of program participants (3,705), with an average length of program enrollment of 1.8 quarters. Disclaimer: Standard statistical practice is to use confidence intervals of 90% or higher. 80% confidence intervals are provided here for comparison purposes.
Impact of the PPMC Standard Transitions Program in Each Quarter of Enrollment. Findings from a quarterly fixed effects (QFE) DID model of impact —for each quarter individually rather than for an average quarter as presented above— are consistent with the average quarterly impact summarized above. Please see Appendix D for presentation of these findings.
Overall, our analysis of PPMC’s Standard Transitions program suggests that the program is not associated with significant reductions in cost or utilization. While we were able to achieve balance on all key covariates while constructing the comparison group for the Standard Transitions program, these results should be interpreted with caution due to limitations in our ability to account for variations in social
176 Adjustment factors include age, race, gender, year of enrollment, dual eligibility, disability eligibility, CDPS risk score, high utilizer flag, asthma, depression, diabetes, and discharges home. Results are interpreted as significant when p<0.10. Results represent outcomes in the two quarters after program enrollment; for supplementary analysis presenting outcomes for all quarters of available data, refer to Appendix D.

NORC | HCIA Complex/High-Risk Patient Targeting
ADDENDUM TO THE THIRD ANNUAL REPORT | 131
determinants of health that impact this population (e.g., psychosocial needs, barriers to care). These types of measures are not readily available in claims data, and thus we could not take them into account when constructing the comparison group.
Core Measures: Care Transitions Program (C-TRAIN)
Our analysis compares the experiences of Health Share enrollees in the Care Transitions (C-TRAIN) arm of the intervention with those of a matched group of comparators. We examine the impact of C-TRAIN on participants’ cost and utilization over the entire enrollment period and in each quarter of program enrollment.
Finder File and Creation of Analytic Sample, C-TRAIN. PPMC provided a finder file that listed program participants and enrollment dates, enabling us to use Oregon Medicaid Alpha-MAX claims to calculate outcome measures.177 We identified 780 unique beneficiaries enrolled in the C-TRAIN program and further limited this number by enrollment date, Medicaid identifiers, risk scores, and comorbidities to yield an analytic sample of 604 beneficiaries.
Comparison Group, C-TRAIN. The comparison pool consists of beneficiaries who were enrolled in Oregon Medicaid during the same time period as C-TRAIN participants and had a hospital discharge during the study period between September 2012 and June 2015, as identified from Alpha-MAX claims. We use propensity score matching without replacement to find appropriate comparators.178 The final propensity score model includes age, gender, race/ethnicity, CDPS risk score, indicators for dual eligibility and disability eligibility, indicator for high utilization of emergency department services, major diagnostic category, and prior year utilization (hospitalizations and ED visits) and cost. Tests of common support and covariate balance across treatment and comparison groups indicate that propensity score matching improves comparability.179
Descriptive Characteristics, C-TRAIN. Exhibit PPMC.10 displays the descriptive characteristics of beneficiaries in the treatment and comparison groups, with respect to demographics, comorbidities, and prior utilization.180 We observe few differences in demographics, original Medicare coverage reason, and prior year cost and utilization, although C-TRAIN participants are more likely to be 40-49 years old, and have asthma, affective disorder, and depression.
177 Medicaid claims from the Oregon Medicaid Alpha-MAX are available for the time period January 1, 2011 through June 30, 2015. We limit the C-TRAIN analysis to the first the two quarters after program enrollment claims data to focus on the intention of those interventions to guide patients through short-term care transitions; for supplementary analysis presenting outcomes for all quarters of available data, refer to Appendix D. 178 For more information on propensity score matching, refer to NORC’s Third Annual Report, Appendix C. 179 For more detailed information on propensity score matching and tests of common support and covariate balance for this awardee, refer to Appendix D. 180 We test differences between the groups with a t-test for continuous measures (CDPS risk score and utilization in the year prior to the index date) or a chi-square test for categorical variables (age, race, disability, eligibility, and chronic diseases).
Measures (per 1,000 beneficiaries unless noted) Total Cost of Care per beneficiary All-Cause Hospitalizations Emergency Department (ED) Visits

NORC | HCIA Complex/High-Risk Patient Targeting
ADDENDUM TO THE THIRD ANNUAL REPORT | 132
Exhibit PPMC.10: Descriptive Characteristics for PPMC C-TRAIN and Comparison Group Beneficiaries
Variable C-TRAIN Comparison Number of Beneficiaries 604 604 Mean Number of Quarters Enrolled [Range] 1.9 [1-2] 1.9 [1-2] Gender % (N) Female 51.3 (310) 49.5 (299) Age % (N) <19 years 1.2 (7) 2.2 (13) 20-29 years 7.0 (42) 8.9 (54) 30-39 years 11.3 (68) 11.1 (67) 40-49 years** 21.9 (132) 16.2 (98) 50-59 years 36.1 (218) 32.8 (198) >60 years** 22.7 (137) 28.8 (174) Race/Ethnicity % (N) White 65.2 (394) 66.7 (403) Black/African American 19.5 (118) 20.9 (126) Hispanic 5.3 (32) 4.8 (29) Dual Eligible Status % (N) Dually Eligible 18.7 (113) 21.9 (132) Reason for Medicaid Eligibility % (N) Disability 52.0 (314) 52.8 (319) Risk Score CDPS Risk Score, Mean (Standard Deviation) 3.4 (2.0) 3.6 (2.6) High Utilizer Flag§ (N) 92.1 (556) 92.2 (557) Condition % (N) Asthma*** 29.0 (175) 17.6 (106) Affective Disorder*** 31.0 (187) 21.0 (127) Depression*** 21.4 (129) 13.3 (80) Diabetes 39.1 (236) 37.4 (226) Discharge destination % (N) Discharge to Home 84.1 (508) 80.8 (488) Mean Utilization and Cost in Year Prior to Program Enrollment (per 1,000 beneficiaries unless noted) Total Medicaid Cost (SD) per beneficiary $14,225 ($21,167) $13,999 ($13,234) Hospitalizations (SD) 1,829 (1,883) 1,722 (2,006) ED Visits (SD) 3,934 (6,319) 3,470 (5,999) NOTE: *p<0.10, **p<0.05, ***p<0.01. §High utilizer flag is based on a 12-month review of claims activity. Patients qualify as high utilizers if any of the following conditions are met: 1) no inpatient admissions and 6+ ED visits, 2) two or more inpatient admissions OR one inpatient admission and six or more ED visits, or 3) one inpatient admission and up to five ED visits.

NORC | HCIA Complex/High-Risk Patient Targeting
ADDENDUM TO THE THIRD ANNUAL REPORT | 133
Impact of the PPMC C-TRAIN. Exhibit PPMC.11 displays the average quarterly and aggregate impact of C-TRAIN on its participants relative to the comparison group.181 As the intent of the C-TRAIN program is to influence short-term outcomes (i.e., outcomes in a short-term transitional care period) rather than long-term outcomes, we present outcomes related to only two quarters of post intervention claims data here. Utilization measures are reported as counts, noting the number of occurrences of an event in each quarter for a specific beneficiary. We find the following for the C-TRAIN program, relative to the comparison group:
■ Cost: A non-significant increase in total cost of care.
■ Utilization Measures: Significant increases in hospitalizations (170 per 1,000 beneficiaries perquarter) and ED visits (501 per 1,000 beneficiaries per quarter).
Exhibit PPMC.11: Impact of PPMC C-TRAIN Program on Outcomes
AVERAGE QUARTERLY IMPACT§ Outcome Measure (per 1,000 beneficiaries unless noted) Adjusted Estimate 90% Confidence
Interval 80% Confidence
Interval Total Cost of Care per beneficiary ($) $160 -$176, $496 -$102, $422 Hospitalizations 170*** 81, 259 100, 240 ED Visits 501*** 254, 748 309, 693
AGGREGATE IMPACT§§
Outcome Measure Adjusted Estimate 90% Confidence Interval
80% Confidence Interval
Total Cost of Care ($) $181,359 -$199,178, $561,896 -$115,206, $477,924 Hospitalizations 192*** 91, 293 113, 271 ED Visits 568*** 288, 848 350, 786
NOTE: +p<0.20, *p<0.10, **p<0.05, ***p<0.01. Bold font indicates findings that are statistically significant at p<0.10. §Quarterly impact is the average quarterly DID estimate per quarter of program implementation. §§Aggregate impact is the total DID estimate for all program participants across all quarters of program implementation. Aggregate impact is estimated for this awardee based on the total number of program participants (604), with an average length of program enrollment of 1.9 quarters. Disclaimer: Standard statistical practice is to use confidence intervals of 90% or higher. 80% confidence intervals are provided here for comparison purposes.
Impact of the PPMC C-TRAIN Program in Each Quarter of Enrollment. Findings from a quarterly fixed effects (QFE) DID model of impact—for each quarter individually rather than for an average quarter as presented above— are consistent with the average quarterly impact summarized above. Please see Appendix D for presentation of these findings.
Overall, our analysis of PPMC’s C-TRAIN program suggests that the program is not associated with significant reductions in cost or utilization. While we were able to achieve balance on all key covariates while constructing the comparison group for the C-TRAIN program, these results should be interpreted with caution due to limitations in our ability to account for variations in social determinants of health that impact this population (e.g., psychosocial needs, barriers to care). These types of measures are not readily
181 Adjustment factors include age, race, gender, year of enrollment, dual eligibility, disability eligibility, CDPS risk score, high utilizer flag, asthma, CHF, COPD, depression, diabetes, and liver disease. Results are interpreted as significant when p<0.10. Results represent outcomes in the two quarters after program enrollment; for supplementary analysis presenting outcomes for all quarters of available data, refer to Appendix D.

NORC | HCIA Complex/High-Risk Patient Targeting
ADDENDUM TO THE THIRD ANNUAL REPORT | 134
available in claims data, and thus we could not take them into account when constructing the comparison group.
Core Measures: Intensive Transition Team (ITT) Program
Our analysis compares the descriptive characteristics of Health Share enrollees in the Intensive Transitions Team Program (ITT) with those of a matched group of comparators. We examine the impact of the ITT program on participants’ cost and utilization over the entire enrollment period and in each quarter of program enrollment.
Finder File and Creation of Analytic Sample, ITT. PPMC provided a finder file that listed program participants and enrollment dates, enabling us to use Oregon Medicaid Alpha-MAX claims to calculate outcome measures. 182 We identified 666 unique beneficiaries enrolled in the ITT program and further limited this number by enrollment date, Medicaid identifiers, risk scores, and comorbidities to yield an analytic sample of 583 beneficiaries.
Comparison Group, ITT. The comparison pool consists of beneficiaries who were enrolled in Oregon Medicaid during the same time period as C-TRAIN participants and had a hospital discharge during the study period between September 2012 and June 2015, as identified from Alpha-MAX claims. We use propensity score matching without replacement to find appropriate comparators. The final propensity score model includes age, gender, race, CDPS risk score, indicators for dual eligibility and disability eligibility, chronic medical condition flags (psychiatric conditions, affective disorders, depression, chemical dependence, and nonorganic psychoses), and prior year utilization (hospitalizations and ED visits) and cost. Tests of common support and covariate balance across treatment and comparison groups indicate that propensity score matching improves comparability.183
Descriptive Characteristics, ITT. Exhibit PPMC.12 displays the descriptive characteristics of beneficiaries in the treatment and comparison groups, with respect to demographics, comorbidities, and prior utilization.184 We observe few differences in demographics, original Medicare coverage reason, and prior year cost and utilization, although ITT participants are younger, more likely to be Black, and less likely to be a high utilizer.185
182 Medicaid claims from the Oregon Medicaid Alpha-MAX are available for the time period January 1, 2011 through June 30, 2015. We limit the ITT analysis to the first the two quarters after program enrollment claims data to focus on the intention of those interventions to guide patients through short-term care transitions; for supplementary analysis presenting outcomes for all quarters of available data, refer to Appendix D. 183 For more detailed information on propensity score matching and tests of common support and covariate balance for this awardee, refer to Appendix D. 184 We test differences between the groups with a t-test for continuous measures (CDPS risk score and utilization in the year prior to the index date) or a chi-square test for categorical variables (age, race, disability, eligibility, and chronic diseases). 185 Patients qualify as high utilizers if any of the following conditions are met based on a 12-month review of claims activity: 1) no inpatient admissions and 6+ ED visits, 2) two or more inpatient admissions OR one inpatient admission and six or more ED visits, or 3) one inpatient admission and up to five ED visits.
Measures (per 1,000 beneficiaries unless noted) Total Cost of Care per beneficiary All-Cause Hospitalizations Emergency Department (ED) Visits

NORC | HCIA Complex/High-Risk Patient Targeting
ADDENDUM TO THE THIRD ANNUAL REPORT | 135
Exhibit PPMC.12: Descriptive Characteristics for PPMC ITT and Comparison Group Beneficiaries
Variable ITT Comparison Number of Beneficiaries 583 583 Mean Number of Quarters Enrolled [Range] 1.9 [1-2] 1.9 [1-2] Gender % (N) Female 56.4 (329) 55.8 (325) Age % (N) <20 years*** 5.2 (30) 10.8 (63) 20-29 years** 21.3 (124) 16.5 (96) 30-39 years*** 26.2 (153) 19.6 (114) 40-49 years 23.8 (139) 26.9 (157) 50-59 years 19.2 (112) 19.7 (115) >60 years* 4.3 (25) 6.5 (38) Race/Ethnicity % (N)** White 75.5 (440) 76.7 (447) Black/African American*** 8.2 (48) 4.1 (24) Hispanic 6.5 (38) 6.9 (40) Dual Eligible Status % (N) Dually Eligible 12.4 (72) 12.0 (70) Reason for Medicaid Eligibility % (N) Disability 39.6 (231) 38.6 (225) Risk Score CDPS Risk Score, Mean (Standard Deviation) 2.2 (1.4) 2.3 (1.3) High Utilizer Flag§ (N)*** 77.7 (453) 99.1 (578) Condition % (N) Affective Disorder 78.2 (456) 78.7 (459) Chemical Dependence 17.5 (102) 16.1 (94) Depression 59.2 (345) 62.3 (363) Psychiatric Conditions 27.8 (162) 28.3 (165) Non-Organic Psychoses 37.7 (220) 34.3 (200) Mean Utilization and Cost in Year Prior to Program Enrollment (per 1,000 beneficiaries unless noted) Total Medicaid Cost (SD) per beneficiary $10,676 ($12,635) $10,260 ($11,289) Hospitalizations (SD) 1,437 (2,096) 1,391 (976) ED Visits (SD) 4,852 (7,467) 4,285 (8,504) NOTE: *p<0.10, **p<0.05, ***p<0.01. §High utilizer flag is based on a 12-month review of claims activity. Patients qualify as high utilizers if any of the following conditions are met: 1) no inpatient admissions and 6+ ED visits, 2) two or more inpatient admissions OR one inpatient admission and six or more ED visits, or 3) one inpatient admission and up to five ED visits.
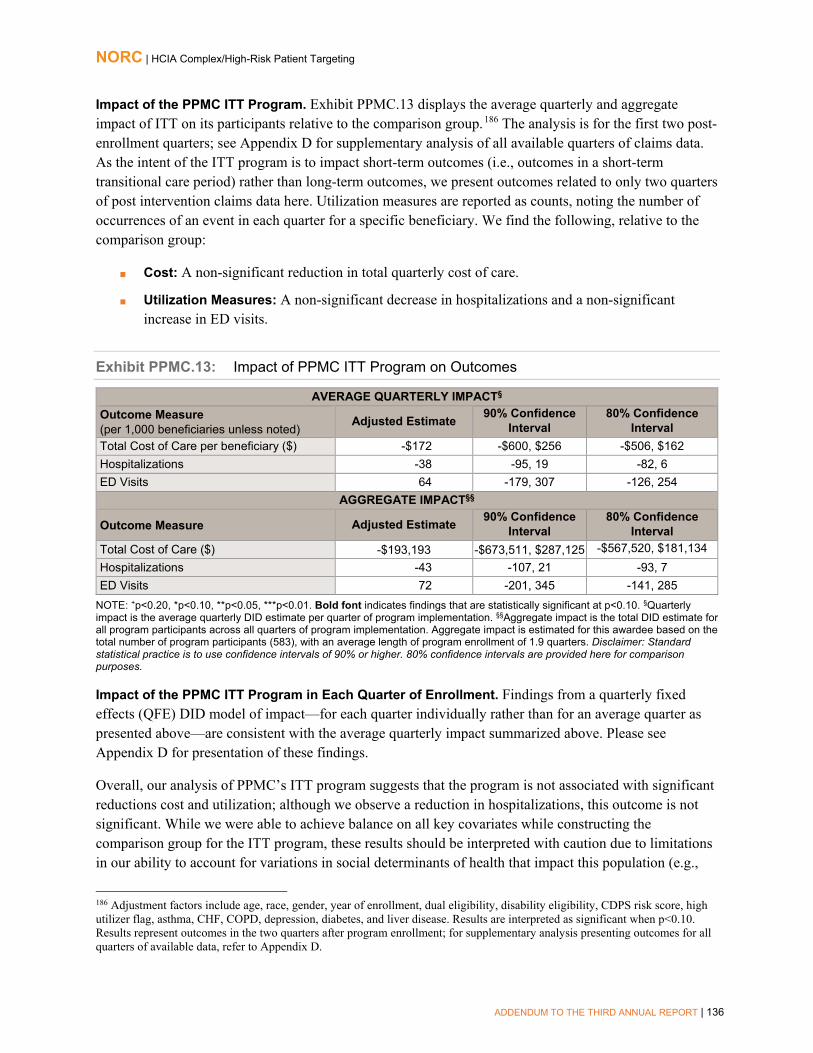
NORC | HCIA Complex/High-Risk Patient Targeting
ADDENDUM TO THE THIRD ANNUAL REPORT | 136
Impact of the PPMC ITT Program. Exhibit PPMC.13 displays the average quarterly and aggregate impact of ITT on its participants relative to the comparison group.186 The analysis is for the first two post-enrollment quarters; see Appendix D for supplementary analysis of all available quarters of claims data. As the intent of the ITT program is to impact short-term outcomes (i.e., outcomes in a short-term transitional care period) rather than long-term outcomes, we present outcomes related to only two quarters of post intervention claims data here. Utilization measures are reported as counts, noting the number of occurrences of an event in each quarter for a specific beneficiary. We find the following, relative to the comparison group:
■ Cost: A non-significant reduction in total quarterly cost of care.
■ Utilization Measures: A non-significant decrease in hospitalizations and a non-significantincrease in ED visits.
Exhibit PPMC.13: Impact of PPMC ITT Program on Outcomes
AVERAGE QUARTERLY IMPACT§ Outcome Measure (per 1,000 beneficiaries unless noted) Adjusted Estimate 90% Confidence
Interval 80% Confidence
Interval Total Cost of Care per beneficiary ($) -$172 -$600, $256 -$506, $162 Hospitalizations -38 -95, 19 -82, 6 ED Visits 64 -179, 307 -126, 254
AGGREGATE IMPACT§§
Outcome Measure Adjusted Estimate 90% Confidence Interval
80% Confidence Interval
Total Cost of Care ($) -$193,193 -$673,511, $287,125 -$567,520, $181,134 Hospitalizations -43 -107, 21 -93, 7 ED Visits 72 -201, 345 -141, 285
NOTE: +p<0.20, *p<0.10, **p<0.05, ***p<0.01. Bold font indicates findings that are statistically significant at p<0.10. §Quarterly impact is the average quarterly DID estimate per quarter of program implementation. §§Aggregate impact is the total DID estimate for all program participants across all quarters of program implementation. Aggregate impact is estimated for this awardee based on the total number of program participants (583), with an average length of program enrollment of 1.9 quarters. Disclaimer: Standard statistical practice is to use confidence intervals of 90% or higher. 80% confidence intervals are provided here for comparison purposes.
Impact of the PPMC ITT Program in Each Quarter of Enrollment. Findings from a quarterly fixed effects (QFE) DID model of impact—for each quarter individually rather than for an average quarter as presented above—are consistent with the average quarterly impact summarized above. Please see Appendix D for presentation of these findings.
Overall, our analysis of PPMC’s ITT program suggests that the program is not associated with significant reductions cost and utilization; although we observe a reduction in hospitalizations, this outcome is not significant. While we were able to achieve balance on all key covariates while constructing the comparison group for the ITT program, these results should be interpreted with caution due to limitations in our ability to account for variations in social determinants of health that impact this population (e.g.,
186 Adjustment factors include age, race, gender, year of enrollment, dual eligibility, disability eligibility, CDPS risk score, high utilizer flag, asthma, CHF, COPD, depression, diabetes, and liver disease. Results are interpreted as significant when p<0.10. Results represent outcomes in the two quarters after program enrollment; for supplementary analysis presenting outcomes for all quarters of available data, refer to Appendix D.

NORC | HCIA Complex/High-Risk Patient Targeting
ADDENDUM TO THE THIRD ANNUAL REPORT | 137
psychosocial needs, barriers to care). These types of measures are not readily available in claims data, and thus we could not take them into account when constructing the comparison group.
Summary
Analyses of program impacts for PPMC’s interventions using Oregon Alpha-MAX claims showed that ED Guides resulted in significant reduction in ED utilization across the two post-intervention quarters associated with this report. However, we saw no significant decreases in cost or utilization for any of the other PPMC programs, and significant cost savings and decreases in utilization observed in AR3 were not sustained. For two programs, HRP and New Directions, we observed significant increases in both cost and utilization measures. The range of findings observed for these six programs emphasizes the fact that these six programs, while implemented together by PPMC and Health Share of Oregon, are distinct programs with widely varying target populations, program goals, and impact on enrolled participants.
Important distinctions exist between this analysis and that in the Third Annual Report. The current analysis for HRP incorporates seven additional quarters of data and more than twice as many beneficiaries compared to the Third Annual Report. For New Directions, there are also almost twice as many beneficiaries and four additional quarters of data. Given this increase in available data, the difference in results between this report and the Third Annual Report are not surprising. Even in the remainder of the programs (ED Guides, Standard Transitions, C-TRAIN, and ITT) for which we analyzed two quarters of data, there was an average of a nine-fold increase in the number of beneficiaries available to analyze (from a threefold increase for C-TRAIN to a 17-fold increase for ITT). We suspect this increase to be one of the main drivers in differences between this analysis and the previous one.
As noted previously, two key limitations apply to our assessment of Health Commons’ program effectiveness.
■ First, PPMC’s intervention programs targeted Medicaid beneficiaries with psycho-social needsand other barriers to care. We were unable to obtain variables corresponding to these needs andcare barriers from Medicaid claims data used for the evaluation of the Health Commons program.Hence, even though the intervention and comparison were matched, to the extent possible, onobserved demographic, clinical and utilization characteristics- systematic differences between thegroups are likely to persist due to important omitted variables, biasing results negatively againstthe awardee.
■ Second, during the study period, the state of Oregon expanded the number of its CoordinatedCare Organizations (CCOs) that serve the Medicaid population to a total of 16 regional CCOs.These CCOs had reduced spending targets tied to quality of care for their Medicaid populations.Services provided by the CCOs to achieve these goals may lead to similar outcomes of reducedcost of care and utilization as those intended for Health Share enrollees. A recent evaluation ofOregon’s CCO efforts showed that the state significantly reduced Medicaid spending for itsbeneficiaries during this period relative to a comparison group form a neighboring state.187 In ourevaluation, we were unable to identify and exclude comparison group beneficiaries enrolled in
187 McConnell, K. J., Renfro, S., Lindrooth, R. C., Cohen, D. J., Wallace, N. T., & Chernew, M. E. (2017). Oregon’s Medicaid Reform And Transition To Global Budgets Were Associated With Reductions In Expenditures. Health Affairs, 36(3), 451-459.

NORC | HCIA Complex/High-Risk Patient Targeting
ADDENDUM TO THE THIRD ANNUAL REPORT | 138
Medicaid CCOs from the AlphaMax claims data. Also, since our analysis was based on beneficiary-quarters of exposure to the intervention, we are unable to demonstrate how program impacts attenuated over time as a result of the expansion of CCOs in Oregon’s Medicaid program during the study period. Nevertheless, the impacts shown by Medicaid CCOs point to the potential of Health Commons’ interventions to provide accountable care for high-risk Medicaid beneficiaries.

NORC | HCIA Complex/High-Risk Patient Targeting
ADDENDUM TO THE THIRD ANNUAL REPORT | 139
St. Francis Healthcare Foundation of Hawaii
Home Outreach Program & E-Health (H.O.P.E.). Telehealth monitoring for high-risk beneficiaries living independently who have chronic heart failure (CHF); acute myocardial infarction (AMI); chronic obstructive pulmonary disease (COPD); and/or end-stage renal disease (ESRD). There are two intervention arms: one for patients whose condition may be unstable at time of hospital discharge, for whom telemonitoring is provided for 30 days post hospitalization (hospital); and the other for high-risk patients living at home, who participate in telemonitoring for one year (community).
PROGRAM MODELS: Beneficiary/Caregiver Engagement, Chronic Disease Self-Management, Clinician Decision Supports, Home Health/Home Care, Rural Health
LOCATION: Hawaii REACH: 1,803 beneficiaries (84% of target) § GRANT: $5,299,706 POPULATIONS: Adults, Rural, Chronic Conditions AWARD DATES: 11/27/12 to 6/30/16 DATA, ADDENDUM REPORT: Medicare claims
(October 2012 to June 2016) NO-COST EXTENSION: 12 month, full program PAYER(S): Medicare, Medicaid
OUTCOMES§§
Findings not statistically significant
Community arm shows increase in hospitalizations (64 per 1,000 beneficiaries per quarter)
Hospital arm shows increase in 7-day practitioner follow-up (111 per 1,000 beneficiaries per quarter)
Analysis limited due to small sample sizes.
SUMMARY: Neither H.O.P.E.’s 30-day post-acute hospital arm nor the one-year telemonitoring (community) arm is associated with significant Medicare cost savings or expenditures, while the additional quarters of claims data analyzed in this report yield significant estimates of more hospitalizations (community arm) and improved post-discharge practitioner follow-up (hospital arm). These findings suggest that the hospital arm is succeeding in strengthening connections for enrolled beneficiaries with their providers, without affecting the cost of care, utilization, or quality. For the community arm, engagement of beneficiaries in monitoring their own health, in telephone contact with a telehealth nurse, appears to facilitate access to care, including hospitalizations, which may be needed for this high-risk population over time; a one quarter significant decrease in 30-day readmissions, one year post-enrollment, reinforces this conclusion.
§ Target is for initial performance period, through 6/30/2015.§§ Outcomes for cost, utilization, and quality of care are from analyses that include a comparison group and are statistically significant at the p<0.10 level.

NORC | HCIA Complex/High-Risk Patient Targeting
ADDENDUM TO THE THIRD ANNUAL REPORT | 140
Program Effectiveness
We present results of difference-in-differences (DID) analyses for Medicare fee-for-service (FFS) beneficiaries in St. Francis’ H.O.P.E. program from October 1, 2012, through June 30, 2016, relative to a comparison group. This analysis looks at both arms of the H.O.P.E. program –a 30-day, post-acute intervention (hospital arm) and a 1-year telemonitoring intervention (community arm) and includes an additional quarter of claims data, compared with the analysis presented in NORC’s Third Annual Report.
We find that the hospital arm is associated with greater follow-up with a practitioner within 7 days of discharge, relative to the comparison group, and the community arm is significantly associated with fewer hospitalizations as well as increased 30-day readmissions, relative to the comparison group. These findings update our understanding of the H.O.P.E. program’s impacts as presented in NORC’s Third Annual Report. For the hospital arm, improved 7-day post discharge practitioner follow up gains statistical significance. For the community arm, cost savings noted in the Third Annual Report are now expenditures, relative to the comparison group; the decrease in hospitalizations remains significant, although smaller (from -47 per 1,000 beneficiaries per quarter to -31 per 1,000 beneficiaries per quarter), and the nonsignificant increase in 30-day readmissions noted in the Third Annual Report gains significance. Despite the additional quarters of claims data, the analytic sample size remains modest for both arms (n=153 for the hospital arm, n=252 for the community arm). For this reason, these results should be interpreted with caution.
Core and Supplemental Measures: Hospital Arm
Our hospital analysis compares the experiences of H.O.P.E. enrollees in the 30-day post-acute care arm of the intervention with those of a weighted comparison group. It considers the impact on cost, utilization, and quality of care of the awardee’s H.O.P.E. program over the implementation period as a whole and in quarter of program implementation. Our analysis is for Medicare FFS beneficiaries, who comprise 34 percent of the awardee’s targeted patients.188
Finder File and Creation of Analytic Sample. St. Francis provided a finder file that lists program participants and their enrollment dates, enabling us to use Medicare claims in the CMS Virtual Research Data Center (VRDC) to calculate outcome measures.189 We identified 340 unique beneficiary-episodes and further limited this number by enrollment date, Medicare identifiers, admission date, discharge date,
188 The awardee’s self-reported data, as presented in the HCIA Fourteenth Quarterly Reporting Period (Q14), October, November, and December 2015. Submitted to CMMI by St. Francis Healthcare Foundation of Hawaii, March 2, 2016. 189 Medicare claims are available through September 30, 2016, for the analysis in this report. We used June 30, 2016, as the cut-off date to account for the 90-day claims runoff.
Measures (per 1,000 beneficiary-episodes unless noted) 90-day Total Cost of Care per beneficiary-episode 90-day Hospitalizations 90-day Emergency Department (ED) Visits 30-day Readmissions 7-day Practitioner Follow-Up 30-day Practitioner Follow-Up

NORC | HCIA Complex/High-Risk Patient Targeting
ADDENDUM TO THE THIRD ANNUAL REPORT | 141
and whether the episode was an inpatient claim (to better align with our comparison group, which is identified based on inpatient claims), to yield an analytic sample of 153 beneficiary-episodes.190
Comparison Group, Hospital Arm. The comparison pool consisted of similar Medicare beneficiary-episodes discharged from two comparison hospitals in Hawaii, during the pre- and post-intervention periods.191 We use propensity weighting (standardized mortality ratio weights) to minimize observed differences between the St. Francis treatment and comparison groups.192 The final propensity model includes age, gender, race/ethnicity, Hierarchical Condition Category (HCC) score, disability status, prior year utilization (hospitalizations and ED visits) and cost, and indicators for target conditions (CHF, AMI, COPD, ESRD). Tests of common support and covariate balance across treatment and comparison groups indicate that propensity score weighting improves comparability.193
Descriptive Characteristics, Hospital Arm. Exhibit HOPE.1 displays the descriptive characteristics of H.O.P.E. beneficiary-episodes for the treatment and comparison groups before and after implementation of the intervention, prior to propensity score weighting. We compare St. Francis and comparison group beneficiary-episodes in the post-intervention period with respect to demographics, comorbidities, and prior utilization.194 We observe few differences in demographics, original Medicare coverage reason, comorbidities, and prior year cost and utilization, although beneficiary-episodes attributed to the H.O.P.E. hospital arm are younger (p<0.05) and more likely to be dually eligible (p<0.01) than comparison group beneficiary-episodes.
Exhibit HOPE.1: Descriptive Characteristics for the H.O.P.E. and Comparison Group Beneficiary-Episodes, Hospital Arm
Variable Pre-Intervention Period Post-Intervention Period
St. Francis Comparison St. Francis Comparison Number of Beneficiary-Episodes 410 248 153 419
Gender % (N) Female 45.6 (187) 42.3 (105) 47.1 (72) 46.5 (195) Age Group % (N) ** <70 years old 26.1 (107) 35.9 (89) 34.0 (52) 35.8 (150) 70-74 years old 17.3 (71) 20.2 (50) 15.7 (24) 11.7 (49) 75-79 years old 13.7 (56) 9.7 (24) 19.0 (29) 14.8 (62) 80-84 years old 15.4 (63) 8.5 (21) 17.0 (26) 12.4 (52) ≥85 years old 27.6 (113) 25.8 (64) 14.4 (22) 25.3 (106)
190 These beneficiary-episodes are incurred by the 34% of the 1,803 beneficiaries who have Medicare FFS; this is approximately 1 beneficiary-episode per 2 enrollees. This is a very rough estimate, as the total count of beneficiaries is based on the awardee’s self-report to CMMI, while the number of beneficiary episodes is based on Medicare claims data linked to a finder file. 191 Kona Community Hospital and Kaiser Foundation Hospital were selected as the comparison hospitals for Hilo Medical Center and Queen’s Medical Center West, respectively. 192 For more information on our propensity score methodology, please see NORC’s Third Annual Report, Appendix C. 193 For more detailed information on propensity score weighting and test of common support and covariate balance, please refer to Appendix D. 194 We tested differences between the groups with a t-test for continuous measures (comorbidities and utilization before index hospitalization) and a chi-square test for categorical parameters (age, race, ethnicity, coverage reason, and dual coverage).

NORC | HCIA Complex/High-Risk Patient Targeting
ADDENDUM TO THE THIRD ANNUAL REPORT | 142
Variable Pre-Intervention Period Post-Intervention Period
St. Francis Comparison St. Francis Comparison Race/Ethnicity % (N) White 39.3 (161) 56.5 (140) 37.9 (58) 45.1 (189) Asian 1.5 (6) 0.8 (2) 0.7 (1) 1.2 (5) Other 56.3 (231) 42.3 (105) 60.8 (93) 53.2 (223) Dual Eligibility % (N) *** Dual Enrolled 37.6 (154) 34.3 (85) 35.3 (54) 22.2 (93) Coverage Reason % (N) Age 74.6 (306) 68.1 (169) 70.6 (108) 75.7 (317) Disability 21.0 (86) 25.8 (64) 26.1 (40) 19.6 (82) ESRD 0.7 (3) 2.0 (5) 2.6 (4) 2.9 (12) Disability and ESRD 3.7 (15) 4.0 (10) 0.7 (1) 1.9 (8) Hierarchical Chronic Conditions (HCC) Mean HCC Score (Standard Deviation) 2.8 (1.5) 2.7 (1.5) 3.0 (1.6) 2.7 (1.5)
Mean Utilization and Cost in Year Prior to Program Enrollment (per 1,000 beneficiary-episodes, unless noted) Total Medicare Cost (SD) per beneficiary-episode
$26,675 ($35,783) $30,858 ($46,208) $26,866 ($37,198) $23,455 ($32,984)
Hospitalizations (SD) 1,041.5 (1446.9) 1185.5 (1792.3) 980.4 (1227.3) 1050.1 (1571.2) ED Visits (SD) 1,387.8 (2450.2) 1133.1 (2596.0) 1437.9 (2264.8) 1198.1 (2015.8)
NOTE: *p<0.10, **p<0.05, ***p<0.01.
Impact of H.O.P.E. Program, Hospital Arm. Exhibit HOPE.2 presents the average quarterly and aggregate impact of the H.O.P.E. innovation on its participants relative to the comparison group.195 Utilization measures are reported as binary indicators, noting whether an event occurred in each quarter for a specific beneficiary-episode. We find the following, relative to the comparison group:
■ Cost: A non-significant decrease in total cost of care.
■ Utilization Measures: Small non-significant decreases in 90-day hospitalizations and 30-dayreadmissions, and a non-significant increase in 90-day ED visits.
■ Quality of Care Measures: A significant increase in 7-day practitioner follow-up (111 per 1,000beneficiaries per quarter) and a non-significant decrease in 30-day practitioner follow-up visits.
Despite the relatively small sample size (N=153), which limits the analytic power of this analysis, we do see trends toward Medicare cost savings, decreasing hospitalizations and 30-day readmissions, paired with a trend of increased ED visits and statistically significant increases in 7-day practitioner follow up visits post-discharge. H.O.P.E.’s transitional care telemonitoring shows promise for reducing costs and improving utilization and quality of care.
195 Adjustment factors include age category, gender, race/ethnicity, extent of FFS coverage, dual eligibility indicator, HCC score, and disability indicator. Results are interpreted as significant where p<0.10.

NORC | HCIA Complex/High-Risk Patient Targeting
ADDENDUM TO THE THIRD ANNUAL REPORT | 143
Exhibit HOPE.2: Impact of the H.O.P.E. Program on Outcomes, Hospital Arm
AVERAGE QUARTERLY IMPACT§ Outcome Measure (per 1,000 beneficiary-episodes unless noted) Adjusted Estimate
90% Confidence Interval
80% Confidence Interval
Total Cost of Care per beneficiary ($) $751 -$5,480, $6,982 -$4,105, $5,607 Hospitalizations -18 -108, 72 -88, 52 ED Visits 49 -46, 144 -25, 123 30-Day Readmissions 9 -59, 77 -44, 62 7-Day Practitioner Follow-Up 111* 5, 217 28, 194 30-Day Practitioner Follow-Up -14 -121, 93 -97, 69
AGGREGATE IMPACT§§ Outcome Measure Adjusted Estimate 90% Confidence Interval 80% Confidence Interval Total Cost of Care ($) $108,916 -$794,568, $1,012,400 -$595,198, $813,030 Hospitalizations -3 -16, 10 -13, 7 ED Visits 7 -7, 21 -4, 18 30-Day Readmissions 1 -9, 11 -7, 9 7-Day Practitioner Follow-Up 17* 1, 33 4, 30 30-Day Practitioner Follow-Up -2 -15, 11 -12, 8
NOTE: +p<0.20, *p<0.10, **p<0.05, ***p<0.01. Bold font indicates findings that are statistically significant at p<0.10. §Quarterly impact is the average quarterly DID estimate per quarter of program implementation. §§Aggregate impact is the total DID estimate for all program participants across all quarters of program implementation. Aggregate impact is estimated for this awardee based on the total number of beneficiary-episodes (153) and total length of program implementation included in analysis (12 quarters). Please note that the estimate for aggregate impact may be smaller thant the estimate for average quarterly impact if there are fewer than 1,000 enrolled beneficiaries, as the aggregate estimate is equal to the average quarterly estimate multipled by the sample size in each quarter, divided by 1,000. Disclaimer: Standard statistical practice is to use confidence intervals of 90% or higher. 80% confidence intervals are provided here for comparison purposes.
Impact of H.O.P.E. Program in Each Quarter of Enrollment, Hospital Arm. Findings from a quarterly fixed effects (QFE) DID model of impact —for each quarter individually rather than for an average quarter as presented above— enable a more nuanced assessment of the H.O.P.E. model, showing quarters with cost-savings, decreased ED visits within 90 days post-discharge, decreased 30-day readmissions, and higher 7-day and 30-day practitioner visits post-discharge, relative to a comparison group. 196 Exhibit HOPE.3 displays the results of the QFE DID model for these measures for H.O.P.E. participants, relative to a comparison group.197 We find the following, relative to the comparison group:
■ Cost: Lower estimates in 90-day total cost of care in six of the twelve post-intervention quarters;this decrease is statistically significant in quarters I4 and I5.
196 For a more detailed explanation of the QFE DID model and measure specification, please refer to NORC’s Third Annual Report, Appendix C. 197 For utilization and quality of care measures, the effect is displayed as the average difference between treatment and comparison per 1,000 beneficiary-episodes for each quarter during the post-intervention (I1–I12) period, after adjusting for pre-intervention differences between the two groups. For total cost of care, this effect is displayed per beneficiary-episode. We present both 90% confidence intervals (indicated by vertical lines around the estimate) and 80% confidence intervals (indicated by shaded boxes around the estimate). Results are interpreted as significant where p<0.10.

NORC | HCIA Complex/High-Risk Patient Targeting
ADDENDUM TO THE THIRD ANNUAL REPORT | 144
■ Utilization Measures: A significant decrease in 30-day readmissions in quarters I2 and I10, and asignificant decrease in 90-day ED visits in the fifth post-implementation quarter.198
■ Quality of Care Measures: Significantly higher estimates for 7-day practitioner follow-up visitsin quarters I10 and I12, and in quarter I7 for 30-day practitioner follow-up visits.199
The overall, non-significant trend toward Medicare cost savings becomes significant for beneficiaries enrolled toward the end of the first implementation year, and there is a contrast between a trend toward increased ED visits and a statistically significant decrease in ED visits toward the start of the second implementation year; both indicate increased positive impact with maturation of the H.O.P.E. model. In addition, the finding of a significant increase in 7-day practitioner follow-up post discharge is strengthened by a similar finding of increased 30-day post-discharge visits during the intervention’s second year.
198 In quarter I11, we are not able to calculate an adjusted estimate for 90-day ED visits because there were no such beneficiary-episodes in that quarter. 199 For the 30-day follow-up measure, we are unable to calculate an adjusted difference for two post-intervention quarters (I2 and I4) because all beneficiary-episodes in the H.O.P.E. program had 30-day practitioner follow-up.

NORC | HCIA Complex/High-Risk Patient Targeting
ADDENDUM TO THE THIRD ANNUAL REPORT | 145
Exhibit HOPE.3: Impact of the H.O.P.E. Program by Quarter, Hospital Arm
Disclaimer: Standard statistical practice is to use confidence intervals of 90% or higher. 80% confidence intervals are provided here for comparison purposes.

NORC | HCIA Complex/High-Risk Patient Targeting
ADDENDUM TO THE THIRD ANNUAL REPORT | 146
Summary
For H.O.P.E.’s hospital arm overall, we observe a significant increase in 7-day practitioner follow-up visits post-discharge, as well as a non-significant decrease in 90-day hospitalizations and a non-significant increase in 90-day total cost of care, relative to the comparison group. Considering impacts from quarter to quarter, there are quarters with cost-savings, decreased ED visits within 90 days post-discharge, decreased 30-day readmissions, and higher 7-day and 30-day practitioner visits post-discharge. Small sample size in the post-intervention treatment group limits our ability to draw conclusions about H.O.P.E’s impacts, as our analyses may not be sufficiently powered to detect differences.
These findings update our understanding of the H.O.P.E. program’s impacts as presented in NORC’s Third Annual Report. Despite the relatively small sample size (N=153), which limits the analytic power of this analysis, we do see trends toward Medicare cost savings, decreasing hospitalizations and 30-day readmissions, paired with a trend of increased ED visits and statistically significant increases in 7-day practitioner follow up visits post-discharge. H.O.P.E.’s transitional care telemonitoring shows promise for reducing costs and improving utilization and quality of care.
Core and Supplemental Measures: Community Arm
Our community (ambulatory care) analysis compares the experience of H.O.P.E. program enrollees in the one-year community telemonitoring program with those of a matched group of comparators. It considers the impact on cost, utilization, and quality of care of the awardee’s H.O.P.E. program over the enrollment period as a whole and in each quarter of enrollment. Our analysis is for Medicare FFS beneficiaries, comprising 34 percent of the awardee’s targeted patients.200
Finder File and Creation of Analytic Sample, Community Arm. St. Francis provided a finder file of program participants and enrollment dates, enabling us to use Medicare claims in the CMS Virtual Research Data Center (VRDC) to calculate outcome measures.201 We identified 480 unique participants and further limited this number by enrollment date, Medicare identifiers, and chronic conditions, yielding an analytic sample of 252 beneficiaries.
Comparison Group, Community Arm. The comparison pool consisted of non-institutionalized Medicare FFS patients in the same zip codes in Hawaii as the H.O.P.E. program participants. We use propensity score matching to find appropriate comparators.202 The final propensity score model included age, race, gender, disability status, HCC score, and prior year utilization (hospitalization and ED visits) and cost.
200 The awardee’s self-reported data, as presented in the HCIA Fourteenth Quarterly Reporting Period (Q14), October, November, and December 2015. Submitted to CMMI by St. Francis Healthcare Foundation of Hawaii, March 2, 2016. 201 Medicare claims are available through September 30, 2016, for the analysis in this report. We used June 30, 2016, as the cut-off date to account for the 90-day claims runoff. 202 For more information on propensity score matching, please refer to NORC’s Third Annual Report, Appendix C.
Measures (per 1,000 beneficiaries unless noted) Total Cost of Care per beneficiary All-cause Hospitalizations Emergency Department (ED) Visits 30-day Readmissions Ambulatory Care Sensitive (ACS) Hospitalizations

NORC | HCIA Complex/High-Risk Patient Targeting
ADDENDUM TO THE THIRD ANNUAL REPORT | 147
Tests of common support and covariate balance across treatment and comparison groups indicate that propensity score matching improves comparability.203
Descriptive Characteristics, Community Arm. Exhibit HOPE.4 displays the descriptive characteristics of beneficiaries in the treatment and comparison groups, with respect to demographics, comorbidities, and prior utilization.204 We observe no differences in demographics, comorbidities, or prior utilization measures.
Exhibit HOPE.4: Descriptive Characteristics for H.O.P.E. and Comparison Group Beneficiaries, Community Arm
Variable St. Francis Comparison Number of Persons 252 252 Mean Number of Quarters Enrolled [Range] 4.4 [1 - 11] 4.4 [1 - 11] Gender % (N) Female 48.8 (123) 50.8 (128) Age Group % (N) <70 years old 26.2 (66) 26.2 (66) 70-74 years old 13.9 (35) 12.7 (32) 75-79 years old 18.3 (46) 19.8 (50) 80-84 years old 18.3 (46) 14.7 (37) ≥85 years old 23.4 (59) 26.6 (67) Race/Ethnicity % (N) White 28.2 (71) 28.2 (71) Asian 31.3 (79) 34.9 (88) Other 40.5 (102) 36.9 (93) Dual Eligibility % (N) Dual Enrolled 20.2 (51) 21.0 (53) Coverage Reason % (N) Age 75.4 (190) 76.6 (193) Disability 17.9 (45) 16.7 (42) ESRD 2.8 (7) 2.4 (6) Disability and ESRD 4.0 (10) 4.4 (11) Hierarchical Chronic Conditions (HCC) Mean HCC Score (Standard Deviation) 3.1 (1.6) 3.1 (1.7) Mean Count of HCCs (SD) 5.6 (2.9) 5.4 (3.0) Mean Utilization and Cost in Year Prior to Program Enrollment (per 1,000 beneficiaries unless noted) Total Medicare Cost per beneficiary (SD) $38,630 ($38,108) $39,507 ($37,215) Hospitalizations (SD) 1654.8 (1337.4) 1682.5 (991.2) ED Visits (SD) 1464.3 (2190.8) 1317.5 (2103.5)
NOTE: *p<0.10, **p<0.05, ***p<0.01.
203 For more detailed information on propensity score matching and tests of common support and covariate balance for this awardee, please refer to Appendix D. 204 We tested differences between these groups with a t-test for continuous measures (comorbidities and utilization one year prior to program enrollment) or a chi-square test for categorical parameters (gender, age, race, dual eligibility, and coverage reason).

NORC | HCIA Complex/High-Risk Patient Targeting
ADDENDUM TO THE THIRD ANNUAL REPORT | 148
Impact of H.O.P.E. Program, Community Arm. Exhibit HOPE.5 displays the average quarterly and aggregate impact of the H.O.P.E. innovation on its participants relative to the comparison group.205 Utilization measures are reported as binary indicators, noting whether an event occurred in each quarter for a specific beneficiary (beneficiary-quarter). We find the following for the H.O.P.E. program, relative to the comparison group:
■ Cost: A non-significant increase in total quarterly cost of care.
■ Utilization Measures: A significant increase in hospitalizations (64 per 1,000 beneficiaries perquarter), a non-significant increase in ED visits, and a non-significant decrease in 30-dayreadmissions.
■ Quality of Care: A small non-significant increase in ACS hospitalizations.
While findings in NORC’s Third Annual Report suggested a non-significant trend toward Medicare cost savings for H.O.P.E.’s community arm, additional claims data analyzed for this Report yield a trend in the opposite direction, toward an increase in Medicare cost of care, a new observation of a significant increase in hospitalizations, and non-significant increases in ED visits and ambulatory care-sensitive hospitalizations. The community arm’s 1-year telemonitoring model may be enabling greater access to care on the part of H.O.P.E.’s geographically dispersed and isolated enrollees.
Exhibit HOPE.5: Impact of the H.O.P.E. Program on Outcomes, Community Arm
AVERAGE QUARTERLY IMPACT§ Outcome Measure (per 1,000 beneficiaries unless noted) Adjusted Estimate
90% Confidence Interval
80% Confidence Interval
Total Cost of Care per beneficiary ($) $1,598 + -$94, $3,290 $279, $2,917 Hospitalizations 64 *** 25, 103 34, 94 ED Visits 26 -13, 65 -4, 56 30-Day Readmissions -7 -84, 70 -67, 53 ACS Hospitalizations 18 -12, 48 -5, 41
AGGREGATE IMPACT§§
Outcome Measure Adjusted Estimate 90% Confidence
Interval 80% Confidence
Interval Total Cost of Care ($) $1,764,546 + -$103,621, $3,632,713 $308,625, $3,220,467 Hospitalizations 69 *** 27, 111 37, 101 ED Visits 29 -14, 72 -4, 62 30-Day Readmissions -2 -22, 18 -17, 13 ACS Hospitalizations 19 -13, 51 -6, 44
NOTE: +p<0.20, *p<0.10, **p<0.05, ***p<0.01. Bold font indicates findings that are statistically significant at p<0.10. §Quarterly impact is the average quarterly DID estimate per quarter of program enrollment. §§Aggregate impact is the total DID estimate for all program participants across all observed quarters of program enrollment. Aggregate impact is estimated for this awardee based on the total number of program participants (252), with an average length of enrollment of 4.4 quarters. Please note that the estimate for aggregate impact may be smaller thant the estimate for average quarterly impact if there are fewer than 1,000 enrolled beneficiaries, as the aggregate estimate is equal to the average quarterly estimate multipled by the sample size in each quarter, divided by 1,000. Disclaimer: Standard statistical practice is to use confidence intervals of 90% or higher. 80% confidence intervals are provided here for comparison purposes.
205 Adjustment factors include age category, gender, race/ethnicity, extent of FFS coverage, dual eligibility indicator, HCC score, and disability indicator. Results are interpreted as significant where p<0.10.

NORC | HCIA Complex/High-Risk Patient Targeting
ADDENDUM TO THE THIRD ANNUAL REPORT | 149
Impact of H.O.P.E. Program in Each Quarter of Enrollment, Community Arm. With the exception of 30-day readmissions, findings from a quarterly fixed effects (QFE) DID model of impact —for each quarter individually rather than for an average quarter as presented above— are consistent with the average quarterly impact summarized above.206 Looking at 30-day readmissions by quarter can give more nuanced information about possible impacts on quality of care. Exhibit HOPE.6 displays the results of the QFE DID model for 30-day readmissions for H.O.P.E. participants, relative to a comparison group.207,208 We observe a significant decrease in 30-day readmissions in quarter I5.
The overall finding for the implementation period of a non-significant decrease in 30-day readmissions becomes significant early in the second year post-enrollment. Observations that the community arm is associated with increased utilization may also mean that access reduces the likelihood of readmissions for those enrolled over at least a year’s time.
Exhibit HOPE.6: Impact of the H.O.P.E. Program by Quarter, Community Arm
30-Day Readmissions (per 1,000 Beneficiaries)
Disclaimer: Standard statistical practice is to use confidence intervals of 90% or higher. 80% confidence intervals are provided here for comparison purposes.
206 See Appendix D for presentation of these results. 207 For a more detailed explanation of the QFE DID model and measure specification, please see NORC’s Third Annual Report, Appendix C. 208 For 30-day readmissions, the effect is displayed as the average difference between treatment and comparison per 1,000 beneficiaries for each quarter during the post-intervention (I1–I11) period, after adjusting for pre-intervention differences between the two groups. For total cost of care, this effect is displayed per beneficiary. We present both 90% confidence intervals (indicated by vertical lines around the estimate) and 80% confidence intervals (indicated by shaded boxes around the estimate). Results are interpreted as significant where p<0.10.
NORC | HCIA Complex/High-Risk Patient Targeting
ADDENDUM TO THE THIRD ANNUAL REPORT | 150
Summary
For H.O.P.E.’s community arm overall, we observe an association with greater access to care, as reflected in non-significant trends toward increased Medicare cost of care, a significant increase in hospitalizations, and non-significant increases in ED visits and ambulatory care-sensitive hospitalizations. These trends are more pronounced than in the Third Annual Report, and a non-significant finding of more 30-day readmissions becomes a non-significant decrease, one that gains significance in one quarter nearly a year post-enrollment. Observations that the community arm is associated with increased utilization may also mean that access reduces the likelihood of readmissions for those enrolled over at least a year’s time.

NORC | HCIA Complex/High-Risk Patient Targeting
ADDENDUM TO THE THIRD ANNUAL REPORT | 151
Sutter Health Corporation
Advanced Illness Management (AIM). AIM coordinates care across multiple care settings (hospital, home health, provider offices, on-call triage) for late-stage patients and their caregivers. It is supported by a unified electronic health record (HER) system and nurse-led, interdisciplinary teams. Its organization relies on a rubric of five pillars of care: (1) personal goals and advance care planning, (2) symptom management, (3) medication management, (4) follow-up with provider(s), and (5) patient engagement.
PROGRAM MODELS: Advanced Care Planning, Care/Case Coordination, Home Health/Home Care, Patient Navigation, Transitional Care
LOCATION: California REACH: 9,406 beneficiaries (88% of target) § GRANT: $13,000,000 POPULATIONS: Older Adults, Racial/Ethnic Minority AWARD DATES: 7/1/12 to 6/30/15 DATA, ADDENDUM REPORT: Medicare, claims
(January 2010 to June 2016) NO-COST EXTENSION: N/A PAYER(S): Medicare
OUTCOMES§§
Decrease in total cost of care during the last 30 days of life (-$4,968 per beneficiary)
Decrease in hospitalizations in the last 30 days of life (-58 per 1,000 beneficiaries per quarter) Increase in ED visits in the last 30 days of life (21 per 1,000 beneficiaries per quarter)
SUMMARY: Consistent with findings presented in NORC’s Third Annual Report, we find that the AIM intervention is associated with statistically significant reductions in Medicare total cost of care for beneficiaries in the last 30 days of life, likely attributable, in part, to the statistically significant decrease seen in hospitalizations and despite an increase in ED visits during the same time period. The AIM program’s emphasis on coordinating care across settings to enable beneficiaries to live stably and safely at home and supporting a seamless transition to hospice for many of their enrollees appears to be successful for this group of enrollees. A significant increase in ED visits may reflect the high acuity of beneficiaries; AIM may be more effective in preventing hospitalizations. In addition, findings may be confounded by unmeasured frailty or physical functioning among AIM enrollees. Finally, the cross-sectional design and short period of time being examined (30 days) limit the robustness of the study design, making this analysis more exploratory than definitive.
§ Target is for initial performance period, through 6/30/2015.§§ Outcomes for cost and utilization are from analyses that include a comparison group and are statistically significant at the p<0.01 level.

NORC | HCIA Complex/High-Risk Patient Targeting
ADDENDUM TO THE THIRD ANNUAL REPORT | 152
Program Effectiveness
We present results of end-of-life analyses for Medicare fee-for-service (FFS) beneficiaries in Sutter Health Corporation’s Advanced Illness Management (AIM) program, updating the analyses presented in NORC’s Third Annual Report. As noted previously, we have not identified a suitable comparison group to assess the claims experiences of all enrolled beneficiaries, given substantial unmeasured variation in mortality experience between treatment and comparison group; for this reason, analyses are not presented for all beneficiaries. In both the Third Annual Report and this chapter, an adequately matched pool of comparators has been identified for beneficiaries in the last 30 days of life, enabling an evaluation of the impact of AIM for this population of beneficiaries, for the time period from January 1, 2013 through June 30, 2016, relative to a comparison group.209 The analysis presented in this chapter includes 366 additional participants, compared with what we presented in NORC’s Third Annual Report.
We find that the AIM intervention is significantly associated with lower total cost of care and reduced hospitalizations among enrollees in the last 30 days of life, relative to the comparison group. These findings are consistent with those presented in NORC’s Third Annual Report, although savings are more modest (-$4,968 per beneficiary per quarter, versus -$5,657) and the reduction in hospitalizations is less marked (-58 per 1,000 beneficiaries per quarter, versus -71) In addition, similar to the Third Annual Report, we find the intervention is significantly associated with an increase in ED visits in the last 30 days of life (21 visits per 1,000 beneficiaries per quarter, versus 28).
Core Measures: End-of-Life Experience
Our community, cross-sectional analysis compares the experiences of AIM enrollees in the last 30 days of life with those of a matched group of comparators. It considers the impact on cost and utilization of the awardee’s AIM intervention. Our analysis is for Medicare FFS beneficiaries, comprising 59 percent of all AIM enrollees.210
Finder File and Creation of Analytic Sample. Sutter Health provided a finder file that lists program participants and date of death, enabling us to use Medicare claims through June 30, 2016 in the CMS Virtual Research Data Center (VRDC) to calculate outcome measures.211 We constructed an index date for AIM participants and comparators that is one month prior to the date of death. We used cost and utilization variables noted in claims during the 60 days prior to this index date in the end-of-life analysis, yielding a final analytic sample of 3,705 AIM beneficiaries.
Comparison Group. The comparison pool consisted of Medicare FFS beneficiaries in two comparison counties in California (Alameda and Santa Clara) similar to the treatment counties (Yolo/Sacramento,
209 The awardee’s period of performance concluded on June 30, 2015, as Sutter Health did not receive a no-cost extension for HCIA funding. Our analysis considers claims for the following year, as we understand that the AIM program has continued to operate; extension of the analysis enables a more comprehensive view of program impact. 210 The awardee’s self-reported data, as presented in the HCIA Final Performance Progress Report. Submitted to CMMI by Sutter Health, September 28, 2015. 211 Medicare claims are available through September 30, 2016, for the analyses in this report. We used June 30, 2016 as the cut-off date to account for the 90-day claims runoff period.
Measures (per 1,000 beneficiaries unless noted) Total Cost of Care per beneficiary All-cause Hospitalizations Emergency Department (ED) Visits
NORC | HCIA Complex/High-Risk Patient Targeting
ADDENDUM TO THE THIRD ANNUAL REPORT | 153
Placer/El Dorado, Sonoma, San Mateo, Solano, Alameda, Contra Costa, and San Francisco).212 We use claims-based rules to select comparison beneficiaries in Alameda and Santa Clara counties who were not enrolled in the AIM program and who died in 2013, 2014, 2015, or 2016. We use propensity score matching to find suitable comparators.213 The final propensity score models include age, race, ethnicity, gender, disability eligibility, comorbidity (hierarchical chronic condition) scores, and number of hospitalizations, number of ED visits, and total cost of care in the 60 days prior to the last 30 days of life. Test of common support and covariate balance across treatment and comparison groups indicate that propensity score matching improves comparability.214
Descriptive Characteristics, End-of-Life Analysis. Exhibit AIM.1 displays the descriptive characteristics of beneficiaries in the treatment and comparison group. We compare the two groups with respect to demographics, comorbidities, and prior utilization.215 AIM participants are more likely to be White or Black (p<0.01), less likely to be Hispanic (p<0.1), and have fewer comorbidities than the comparison group (p<0.01). In the 60 days prior to the last 30 days of life, AIM participants have a greater average number of ED visits (p<0.05), lower average total cost (p<0.05), and have elected for hospice more often than have comparators (p<0.01).
212 Selection was based on a set of county-level variables that include the number and characteristics of Medicare beneficiaries, Medicare Advantage penetration rate, hospice use, hospital and hospice capacities, readmission rates, ED visit rates, and per capita costs. Alameda was selected as a comparison county since only a small proportion of AIM program participants lived in this county; we distinguished potential comparison beneficiaries living in Alameda County from those enrolled in the AIM program to ensure no contamination occurred between the treatment and comparison groups. See NORC’s Third Annual Report, Appendix C for details about our analytic approach. 213 For more information on our propensity score matching methodology, please refer to NORC’s Third Annual Report, Appendix C. 214 For more detailed information on propensity score matching and test of common support and covariate balance for this awardee, please refer to Appendix D. 215 We test difference between these groups with a t-test for continuous measures (comorbidities and utilization in the last 60 days prior to the last 30 days of life) or a chi-square test for categorical parameters (gender, age, race, ethnicity, and coverage reason).

NORC | HCIA Complex/High-Risk Patient Targeting
ADDENDUM TO THE THIRD ANNUAL REPORT | 154
Exhibit AIM.1: Descriptive Characteristics for AIM and Comparison Group Beneficiaries, End-of-Life Analysis
Variable AIM Comparison Number of Beneficiaries 3,705 3,705 Gender % (N) Female 53.1 (1,967) 54.4 (2,017) Age Group % (N) <70 years 18.0 (665) 17.7 (656) 70-74 years 10.9 (403) 10.6 (391) 75-79 years 13.1 (487) 11.7 (434) 80-84 years 15.0 (556) 15.2 (562) 85-89 years 17.8 (660) 18.2 (673) 90+ years 25.2 (934) 26.7 (989) Race*** % (N) White 78.1 (2,893) 74.7 (2,766) Black 8.9 (331) 7.2 (266) Other 13.0 (481) 18.2 (673) Ethnicity* % (N) Hispanic 8.6 (319) 10.0 (370) Coverage Reason (N) Age 81.1 (3,003) 80.7 (2,989) Disability 17.8 (661) 17.8 (659) ESRD/Disability and ESRD 1.1 (41) 1.5 (57) Hierarchical Chronic Conditions (HCC) Mean HCC Score (Standard Deviation)*** 4.6 (2.3) 4.8 (2.6) Mean Utilization and Cost in the 60 Days Prior to Last 30 Days of Life Total Cost of Care per beneficiary (SD)** $18,042 ($22,277) $19,360 ($27,364) Hospitalizations per 1,000 (SD) 524 (774) 519 (787) ED Visits per 1,000 (SD)** 332 (755) 295 (734) Election of hospice care (N)*** 104 (184) 53 (105)
NOTE: *p<0.10, **p<0.05, ***p<0.01.
Impact of AIM Program. Exhibit AIM.2 displays the average impact and the aggregate impact of AIM on its participants in the last 30 days of life, relative to the comparison group.216 Utilization measures are reported as binary indicators, noting whether an event occurred for a specific beneficiary. We find the following, relative to the comparison group:
■ Cost: A significant decrease in cost of care during the last 30 days of life (-$4,968 perbeneficiary).
■ Utilization Measures: A significant decrease in hospitalizations (-58 per 1,000 beneficiaries) anda significant increase in ED visits (21 per 1,000 beneficiaries) in the last 30 days of life.
216 Adjustment factors include age, race, ethnicity, gender, HCC risk score, and disability eligibility. Results are interpreted as significant where p<0.10.

NORC | HCIA Complex/High-Risk Patient Targeting
ADDENDUM TO THE THIRD ANNUAL REPORT | 155
Findings are consistent with those presented in NORC’s Third Annual Report. For enrollees in their last 30 days of life, the AIM program’s transitional care, home-based care coordination and engagement with patients and caregivers, and functioning as a bridge to hospice appears to be successful in lowering Medicare cost of care by reducing hospitalizations, with no adverse impact on quality of care.
Exhibit AIM.2: Impact of the AIM Program on Outcomes
AVERAGE IMPACT IN LAST 30 DAYS OF LIFE Outcome Measure
(per 1,000 beneficiaries unless noted) Adjusted
Difference 90% Confidence
Interval 80% Confidence
Interval Total Cost of Care per Beneficiary ($) -$4,968 *** -$5,697, -$4,240 -$5,536, -$4,401 Hospitalizations -58 *** -76, -40 -72, -44 ED Visits 21 ** 7, 35 10, 32
AGGREGATE IMPACT§
Outcome Measure Adjusted Difference
90% Confidence Interval
80% Confidence Interval
Total Cost of Care per Beneficiary ($) -$18,406,440 *** -$21,107,385, -$15,709,200
-$20,510,880, -$16,305,705
Hospitalizations -215 *** -282, -148 -267, -163 ED Visits 78 ** 26, 130 37, 119
NOTE: +p<0.20, *p<0.10, **p<0.05, ***p<0.01. Bold font indicates findings that are statistically significant at p<0.10. §Aggregate Impact is the total adjusted difference estimate for all program participants across all observed periods of enrollment (last 30 days of life), derived by multiplying the estimate by the number of program participants (3,705).
Feasibility Assessment: Using Minimum Data Set Data to Identify Comparison Group
In NORC’s Third Annual Report, we noted the limitation of assessing the impact of the AIM program for all beneficiaries relative to a well-matched comparison group using a DID approach, due to systematic differences in their prognoses. Relative to the matched comparison group, AIM participants were more than three times likey to die during the analytic period. To improve the comparability of the two groups with respect to their unobserved prognoses, we assess the feasibility of supplementing Medicare claims data with prognostic indicator variables from Minimum Data Set (MDS) data. We plan to use MDS assessment data for short-term SNF stays (prospective payment system assessments, or MDS-PPS) from the two quarters prior to the intervention period (enrollment) to obtain prognostic indicator variables.
Exibit AIM.3 shows the number and proportion of AIM and comparison group beneficiaries with MDS assessment data from short-term SNF stays. Only 4 percent of the AIM beneficiaires (250 of 5,743) and 1 percent of the comparison group beneficiaries (1,978 out of 231,375) had MDS-PPS assessment data that were usable for our proposed analysis. For this reason, the MDS data were deemed unusable to adjust for differences in prognoses between enrolled beneficiaries and comparators, limiting our ability to evaluate the impact of AIM program for all enrollees using a DID approach.

NORC | HCIA Complex/High-Risk Patient Targeting
ADDENDUM TO THE THIRD ANNUAL REPORT | 156
Exhibit AIM.3: AIM and Comparison Group Beneficiaries with MDS Assessment Data
AIM (N=5,743) Comparison (N=231,375) Number of beneficiaries with one or more MDS-PPS assessments 727 (12.7%) 19,627 (8.5%)
Number of beneficiaries with one or more MDS-PPS assessments in two quarters prior to enrollment 250 (4.4%) 1,978 (0.8%)
Summary
We find that the AIM intervention is associated with statistically significant reductions in hospitalizations and total cost of care as well as a significant increase in ED visits for beneficiaries in the last 30 days of life. These findings are consistent with those presented in NORC’s Third Annual Report.
The cross-sectional design and short period of time being examined (30 days) limits the robustness of the study design and this analysis is meant to be strictly exploratory. As noted above, our analysis does not assess the claims experience of all enrolled beneficiaries, as we have been unable to select an appropriate comparison group. In addition, although we included many demographic- and health-related factors in our propensity score models to achieve suitable matches and found excellent balance in these measures, our results may still be confounded by unmeasured frailty or physical functioning among AIM enrollees; although our comparison group is well matched on many measurable factors such as number and types of comorbidities, we could be selecting comparators who are slightly healthier than AIM participants. For these reasons, estimates should be interpreted with caution.

NORC | HCIA Complex/High-Risk Patient Targeting
ADDENDUM TO THE THIRD ANNUAL REPORT | 157
University Emergency Medical Services
Better Health through Social and Health Care Linkages beyond the Emergency Department (HealthiER). Community health workers recruit participants among non-urgent hospital emergency department (ED) patients and primary care settings, providing weekly, one-on-one coaching to facilitate patient-directed goal-setting, navigation and referrals to community supports, and connection to primary care.
PROGRAM MODELS: Beneficiary/ Caregiver Engagement, Care/Case Coordination, ED Diversion, Patient Navigation
LOCATION: Buffalo, NY REACH: 1,739 beneficiaries (72% of target) §
GRANT: $2,570,749 POPULATIONS: Adults, Behavioral Health/Substance Abuse, Disability, Racial/Ethnic Minorities, Urban
AWARD DATES: 12/27/12 to 1/31/16 DATA, ADDENDUM REPORT: Medicaid claims (January 2011 to June 2015) NO-COST EXTENSION: 7 month, full program
PAYER(S): Medicaid
OUTCOMES§§
Decrease in total cost of care (-$407 per beneficiary per quarter)
Decrease in hospitalizations (-15 per 1,000 beneficiaries per quarter) Decrease in ED visits (-132 per 1,000 beneficiaries per quarter)
Increase in practitioner follow-up visits at 30 days (43 per 1,000 beneficiaries per quarter)
SUMMARY: Overall, our findings are consistent with those presented in NORC’s Third Annual Report and suggest that the program accomplished its aim of cost savings, achieved by reduced utilization and increased access to outpatient care (as measured by practitioner follow-up visits), for adults presenting with non-urgent concerns from emergency services. While access to primary care remains a challenge for enrolled beneficiaries, as reflected in the lack of significant improvement in practitioner follow-up at 7 days and 90 days post-enrollment, we find a significant increase in practitioner follow-up visits at 30 days post-enrollment. This is a marked change from estimates presented in the Third Annual Report and likely reflects the maturation of HealthiER in the latter part of implementation. While the analysis in this report is based on two additional quarters of claims data, the number of claims from later implementation quarters remains relatively small and for this reason, the findings should be interpreted with caution.
§ Target is for initial performance period, through 6/30/2015.§§ Outcomes for cost, utilization, and quality of care are from analyses that include a comparison group and are statistically significant at the p<0.10 level or greater.

NORC | HCIA Complex/High-Risk Patient Targeting
ADDENDUM TO THE THIRD ANNUAL REPORT | 158
Program Effectiveness
We present results of quarterly fixed effects (QFE) difference-in-differences (DID) analyses for Medicaid beneficiaries in UEMS’s HealthiER program from October 1, 2012, through June 30, 2015. This analysis includes two additional quarters of claims data, compared with the analysis presented in NORC’s Third Annual Report.
We find that HealthiER is significantly associated with lower total cost of care, decreased hospitalizations and ED visits, and decreased practitioner follow-up, relative to the comparison group. These findings update those presented in NORC’s Third Annual Report: estimates of positive impact increase in size for cost savings (from -$143 to -$407 per beneficiary per quarter) and for decreases in ED visits (from -40 to -132 per 1,000 beneficiaries per quarter), while a decrease in hospitalizations reaches statistical significance (-15 per 1,000 beneficiaries per quarter). Impact on practitioner follow-up visits at 90 days post-enrollment remains negative but changes in size, decreasing from -94 to -8 per 1,000 beneficiaries per quarter.217 For practitioner follow-up visits at 30 and 60 days post-enrollment, we now see positive trends (16 and 43 per 1,000 beneficiaries per quarter, respectively). We see one quarter in which there is a decrease in potentially avoidable hospitalizations.
Core and Supplemental Measures
Our community (ambulatory care) analysis compares the experiences of HealthiER enrollees with a matched group of comparators. It considers the impact on cost, utilization, and quality of care of the awardee’s HealthiER program over the implementation period as a whole and in each quarter of program implementation. Our analysis is for Medicaid beneficiaries, who comprise 100 percent of HealthiER enrollees.218
Finder File and Creation of Analytic Sample. UEMS provided a finder file that lists program participants and their enrollment dates, enabling us to use Alpha-MAX Medicaid claims for these beneficiaries to calculate outcome measures.219 We identified 1,736 unique beneficiaries and further limited these by presence of a valid social security number (SSN), linkage with New York Alpha-MAX records, date of enrollment in the Medicaid program and in HealthiER (e.g., participants were excluded from the analysis if they were not enrolled in Medicaid when they enrolled into HealthiER), and dual eligibility for Medicaid and Medicare; this yielded an analytic sample of 1,033 beneficiaries.
Comparison Group. The comparison pool consisted of Medicaid beneficiaries aged 18 and older residing in the Utica or Rochester zip code areas. We sampled from the Utica and Rochester areas due to concerns about saturation of the HealthiER program in the Buffalo area. From this pool, we selected non-
217 This dramatic change is due in part to the inclusion of additional factors in the adjusted models presented in this report that allow us to more accurately adjust for differences between treatment and comparison beneficiaries. 218 The awardee’s self-reported data, as presented in the HCIA Fourteenth Quarterly Reporting Period (Q14), October, November, and December 2015. Submitted to CMMI by University Emergency Medical Services, Inc., March 2, 2016. 219 Medicaid claims are available through June 30, 2015, for the analysis in this report.
Measures (per 1,000 beneficiaries unless noted) Total Cost of Care per beneficiary All-cause Hospitalizations Emergency Department (ED) Visits Practitioner Follow-up at 7, 30, and 90 days Potentially Avoidable Hospitalizations
NORC | HCIA Complex/High-Risk Patient Targeting
ADDENDUM TO THE THIRD ANNUAL REPORT | 159
dual eligible beneficiaries who had an ED visit in 2012, set this as the index date, and required that they also have at least two other ED visits in the year prior to their index date. We use propensity score matching to minimize observed differences in beneficiary characteristics between the treatment and comparison groups.220 The final propensity score model used included age, race, gender, disability status, Chronic Illness and Disability Payment risk score (CDPS), prior year hospitalization and ED visits, and prior year costs. Tests of common support and covariate balance across treatment and comparison groups indicate that propensity score matching improves comparability.221
Descriptive Characteristics. Exhibit UEMS.1 displays the descriptive characteristics of beneficiaries in the HealthiER program and in the comparison group. We compare the two groups of beneficiaries with respect to demographics, comorbidities, and prior utilization.222 Beneficiaries in the HealthiER program are significantly less likely to be Hispanic (p<0.01), less likely to be enrolled in a Medicaid managed care plan (p<0.01), and have significantly lower CDPS risk scores (p<0.10), relative to the comparison group.
220 For more information on our propensity score matching methodology, please see NORC’s Third Annual Report, Appendix C. 221 For more detailed information on propensity score matching and tests of common support and covariate balance for this awardee, please see Appendix D. 222 We test differences between these groups with a t-test for continuous measures (CDPS risk score and utilization before program enrollment) or a chi-square test for categorical parameters (gender, age, race, Medicaid plan, and disability status).

NORC | HCIA Complex/High-Risk Patient Targeting
ADDENDUM TO THE THIRD ANNUAL REPORT | 160
Exhibit UEMS.1: Descriptive Characteristics for HEALTHIER and Comparison Group Beneficiaries
Variable HealthiER Comparison Number of Persons 1,033 1,033 Mean Number of Quarters Enrolled [Range] 5.4 [1-11] 5.4 [1-11] Gender % (N) Female 57.4 (593) 58.4 (603) Age Group % (N) 18-29 years 33.3 (344) 29.5 (305) 30-39 years 19.8 (204) 18.7 (193) 40-49 years 19.9 (206) 21.6 (223) 50-59 years 21.1 (218) 23.2 (240) >60 years 5.9 (61) 7.0 (72) Race/Ethnicity % (N) White 18.2 (188) 18.7 (193) Hispanic*** 3.2 (33) 10.9 (113) Medicaid Plan % (N) Enrolled in a Managed Care plan*** 81.3 (840) 88.6 (915) Disability Status % (N) Disability 26.8 (277) 29.5 (305) Chronic Illness and Disability Payment System (CDPS) CDPS Risk Score (Standard Deviation)* 2.1 (2.2) 2.3 (1.9) Mean Utilization and Cost in Year Prior to Program Enrollment (per 1,000 beneficiaries unless noted) Total Cost of Care per beneficiary (SD) $9,065 ($14,537) $9,508 ($12,639) Hospitalizations (SD) 636 (2,125) 647 (1,569) ED Visits (SD) 4,716 (9,044) 4,733 (9,200)
NOTE: *p<0.10, **p<0.05, ***p<0.01. Ethnicity data are missing for 18 percent of treatment patients and 9 percent of comparison patients.
Impact of HealthiER Program. Exhibit UEMS.2 displays the average quarterly and aggregate impact of HealthiER on its participants relative to a matched comparison group.223 Utilization measures are reported as binary indicators, noting whether an event occurred in each quarter for a specific beneficiary (beneficiary-quarter). We find the following, relative to the comparison group:
■ Cost: A statistically significant decrease in total quarterly cost of care (-$407 per beneficiary perquarter).
■ Utilization Measures: Significant decreases in hospitalizations (-15 per 1,000 beneficiaries perquarter) and ED visits (-132 per 1,000 beneficiaries per quarter).
■ Quality of Care Measures: Significant increase in practitioner follow-up visits at 30 days (43 per1,000 beneficiaries per quarter), and a non-significant decrease in potentially avoidablehospitalizations.
223 Adjustment factors include age, gender, race/ethnicity, enrollment in a managed care plan, CDPS risk score, and disability indicator. Results are interpreted as significant where p<0.10.
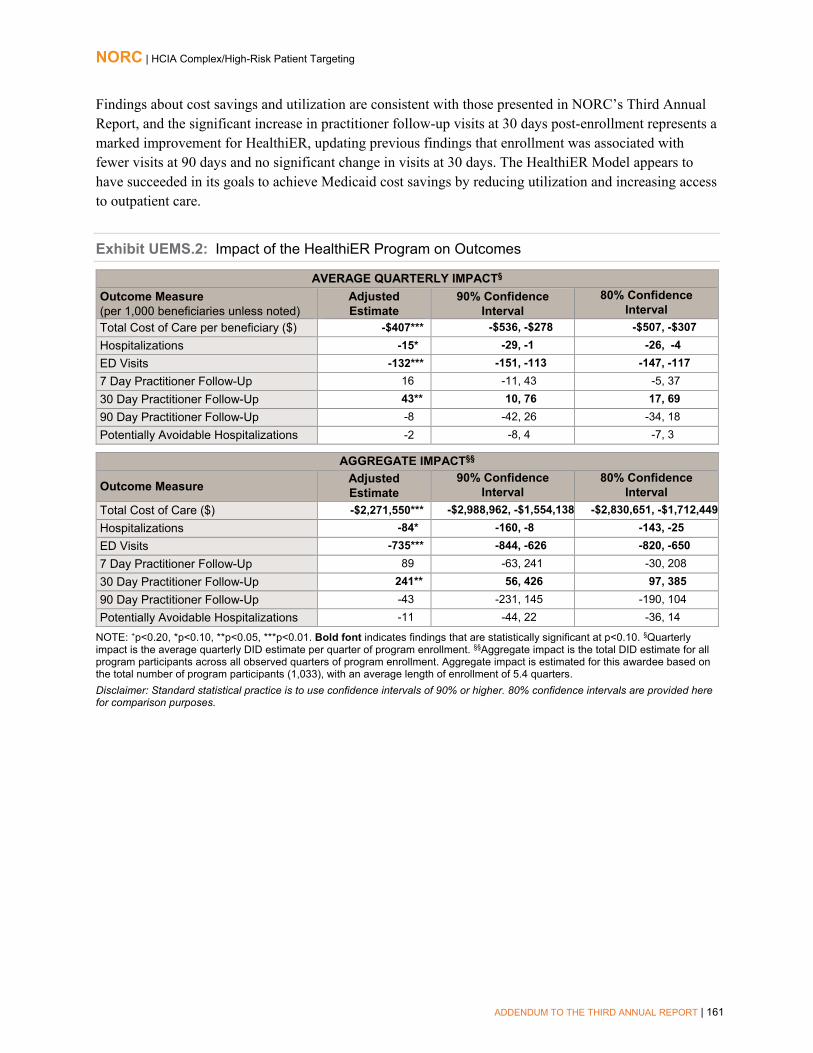
NORC | HCIA Complex/High-Risk Patient Targeting
ADDENDUM TO THE THIRD ANNUAL REPORT | 161
Findings about cost savings and utilization are consistent with those presented in NORC’s Third Annual Report, and the significant increase in practitioner follow-up visits at 30 days post-enrollment represents a marked improvement for HealthiER, updating previous findings that enrollment was associated with fewer visits at 90 days and no significant change in visits at 30 days. The HealthiER Model appears to have succeeded in its goals to achieve Medicaid cost savings by reducing utilization and increasing access to outpatient care.
Exhibit UEMS.2: Impact of the HealthiER Program on Outcomes
AVERAGE QUARTERLY IMPACT§ Outcome Measure (per 1,000 beneficiaries unless noted)
Adjusted Estimate
90% Confidence Interval
80% Confidence Interval
Total Cost of Care per beneficiary ($) -$407*** -$536, -$278 -$507, -$307 Hospitalizations -15* -29, -1 -26, -4 ED Visits -132*** -151, -113 -147, -117 7 Day Practitioner Follow-Up 16 -11, 43 -5, 37 30 Day Practitioner Follow-Up 43** 10, 76 17, 69 90 Day Practitioner Follow-Up -8 -42, 26 -34, 18 Potentially Avoidable Hospitalizations -2 -8, 4 -7, 3
AGGREGATE IMPACT§§
Outcome Measure Adjusted Estimate
90% Confidence Interval
80% Confidence Interval
Total Cost of Care ($) -$2,271,550*** -$2,988,962, -$1,554,138 -$2,830,651, -$1,712,449 Hospitalizations -84* -160, -8 -143, -25 ED Visits -735*** -844, -626 -820, -650 7 Day Practitioner Follow-Up 89 -63, 241 -30, 208 30 Day Practitioner Follow-Up 241** 56, 426 97, 385 90 Day Practitioner Follow-Up -43 -231, 145 -190, 104 Potentially Avoidable Hospitalizations -11 -44, 22 -36, 14
NOTE: +p<0.20, *p<0.10, **p<0.05, ***p<0.01. Bold font indicates findings that are statistically significant at p<0.10. §Quarterly impact is the average quarterly DID estimate per quarter of program enrollment. §§Aggregate impact is the total DID estimate for all program participants across all observed quarters of program enrollment. Aggregate impact is estimated for this awardee based on the total number of program participants (1,033), with an average length of enrollment of 5.4 quarters. Disclaimer: Standard statistical practice is to use confidence intervals of 90% or higher. 80% confidence intervals are provided here for comparison purposes.

NORC | HCIA Complex/High-Risk Patient Targeting
ADDENDUM TO THE THIRD ANNUAL REPORT | 162
Impact of HealthiER in Each Quarter of Enrollment. With the exception of potentially avoidable hospitalizations, findings from a quarterly fixed effects (QFE) DID model of impact—for each quarter individually rather than for an average quarter as presented above— consistent with the average quarterly impact summarized above.224 For potentially avoidable hospitalizations, the impact in a given quarter offers more insight into the HealthiER program that does the summary estimate presented above. For this reason, we include the results of the model in each quarter, displayed in Exhibit UEMS.3, relative to a comparison group.225 We observe a significant decrease in potentially avoidable hospitalizations in quarter I10.
Exhibit UEMS.3: Impact of the HealthiER Intervention by Quarter
Potentially Avoidable Hospitalizations (per 1,000 Beneficiaries)
Disclaimer: Standard statistical practice is to use confidence intervals of 90% or higher. 80% confidence intervals are provided here for comparison purposes.
Summary
We find significant cost savings and decreases in both hospitalizations and ED visits for HealthiER participants, relative to a comparison group. We also find a significant increase in practitioner follow-up visits at 30 days post-enrollment. Considering impacts from quarter to quarter, there is a shift to increasing 30 day practitioner follow-up visits (for two post-enrollment quarters) and a decrease in potentially avoidable hospitalizations (for one quarter). Overall, these findings are consistent with those presented in NORC’s Third Annual Report.
Overall, our findings indicate that the program accomplished its aim of cost savings, achieved by reduced utilization and increased access to outpatient care (as measured by practitioner follow-up visits), for adults presenting with non-urgent concerns from emergency services. Impact may extend to a decrease in potentially avoidable hospitalizations, although this is seen only after many quarters of enrollment and
224 Please see Appendix D for presentation of these results. For a more detailed explanation of the QFE DID model and measure specification, please refer to NORC’s Third Annual Report, Appendix C. 225 The effect is displayed as the average difference between treatment and comparison per 1,000 beneficiaries for each quarter during the post-intervention (I1–I10) period, after adjusting for pre-intervention differences between the two groups. We present both 90% confidence intervals (indicated by vertical lines around the estimate) and 80% confidence intervals (indicated by shaded boxes around the estimate). Results are interpreted as significant where p<0.10.
NORC | HCIA Complex/High-Risk Patient Targeting
ADDENDUM TO THE THIRD ANNUAL REPORT | 163
with relatively few claims. While access to primary care remains a challenge for enrolled beneficiaries, as reflected in the lack of significant improvement in practitioner follow-up at 7 days and 90 days post-enrollment, we find a significant increase in practitioner follow-up visits at 30 days post-enrollment. This is a marked improvement from estimates presented in the Third Annual Report, where there was a significant decrease in follow-up visits at 90 days post-enrollment. Part of the improvement seen with additional quarters of claims data likely reflects maturation of the HealthiER model, with seasoned staff implementing the program toward the latter half of the performance period. Ongoing challenges faced by the staff community health workers in engaging high-needs beneficiaries, amidst changes in Medicaid health plans and eligibility, may contribute to continuing difficulty in boosting the number of practitioner follow up visits. While the analysis in this report is based on two additional quarters of claims data, the number of claims from later implementation quarters remains relatively small and should be interpreted with caution.
While the analysis in this report is based on two additional quarters of claims data, the number of claims from later implementation quarters remains relatively small (smaller sample size), as reflected in the wide confidence intervals depicted in the QFE DID charts. For this reason, estimates should be interpreted with caution.

NORC | HCIA Complex/High-Risk Patient Targeting
ADDENDUM TO THE THIRD ANNUAL REPORT | 164
University of New Mexico
Extension for Community Healthcare Outcomes (ECHO Care). This program expands on the Project ECHO model to deliver weekly virtual grand rounds, linking a team of specialists at the University of New Mexico with multidisciplinary outpatient intensivist teams (OITs) at six sites around the state. The teams deliver clinic and home-based care to high-risk adult Medicaid beneficiaries.
PROGRAM MODELS: Beneficiary/Caregiver Engagement, Care/Case Coordination, Clinician Decision Supports, Collaborative Medical Home, Home Health/Home Care
LOCATION: New Mexico REACH: 746 beneficiaries (100% of target)§
GRANT: $8,473,809 POPULATIONS: Adults, Behavioral Health/Substance Abuse, Rural
AWARD DATES: 9/01/13 to 6/30/16 DATA, ADDENDUM REPORT: Medicaid claims (September 2013 to March 2016) NO-COST EXTENSION: 12 month, full program
PAYER(S): Medicaid
OUTCOMES§§
Decrease in total cost of care (-$1,270 per beneficiary per quarter)
No changes reach statistical significance
Decrease in potentially avoidable hospitalizations (-15 per 1,000 beneficiaries per quarter)
SUMMARY: Consistent with findings from NORC’s Third Annual Report, analyses in this report show that Project ECHO is associated with significantly lower total Medicaid cost of care, although of smaller size, and a decrease in potentially avoidable hospitalizations that reaches statistical significance. The fact that avoidable hospitalizations reached statistical significance in these analyses likely reflects the greater number of claims in the analytic sample. Decreases in utilization (hospitalizations and 30-day readmissions) are significant for beneficiaries in quarters beyond their first year of ECHO Care enrollment, while there are mixed findings for ED visits (a significant increase in the first quarter of enrollment and a decrease in the seventh quarter post-enrollment). These improvements over time make sense for the program’s target population of complex, hard-to-reach adult patients, who may require intensive attention from interprofessional teams for extended periods of time before improvements in health and engagement with the health care system occur. These findings must be interpreted with caution, given the relatively small number of beneficiaries included in our analysis of claims experience.
§ Target is for initial performance period, through 6/30/2015.§§ Outcomes for cost, utilization, and quality of care are from analyses that include a comparison group and, if a numeric value is given or noted, statistically significant at the P<0.10 level.

NORC | HCIA Complex/High-Risk Patient Targeting
ADDENDUM TO THE THIRD ANNUAL REPORT | 165
Program Effectiveness
We present results of quarterly fixed effects (QFE) difference-in-differences (DID) analyses for Medicaid managed care beneficiaries in University of New Mexico’s Project Extension for Community Healthcare Outcomes (ECHO) Care program from October 1, 2013, through March 31, 2016, relative to a comparison group. This analysis includes two additional quarters of claims data, compared with the analysis presented in NORC’s Third Annual Report.
We find that ECHO Care is significantly associated with lower total cost of care and fewer potentially avoidable hospitalizations, relative to the comparison group. These findings are consistent with those presented in NORC’s Third Annual Report; estimates of total cost savings remain statistically significant but are lower (-$1,270 per beneficiary per quarter, compared with -$2,044 per beneficiary per quarter as presented in the Third Annual Report) and the decrease in potentially avoidable hospitalizations reaches statistical significance, likely reflecting the greater number of claims comprising the analytic sample.
Core and Supplemental Measures
Our community (ambulatory care) analysis compares the experience of U New Mexico enrollees with those of a matched group of comparators. It considers the impact on utilization, cost, and quality of care of ECHO Care over the enrollment period as a whole and in each quarter of enrollment. Our analysis is for Medicaid beneficiaries, which comprises 100 percent of all ECHO Care enrollees.226
Finder File and Creation of Analytic Sample. NORC received claims data from New Mexico from an internal evaluation led by New York University (NYU). NYU provided a finder file of program participants and enrollment dates for ECHO Care, enabling us to use Medicaid claims for these beneficiaries to calculate outcome measures.227 We identified 746 unique participants in the ECHO Care program. We further limited this number by enrollment date, yielding a sample of 719 beneficiaries.
Comparison Group. The comparison pool consisted of Medicaid patients in the state of New Mexico. We used propensity score matching to find appropriate comparators.228 The final propensity score model includes age, race, gender, a measure of morbidity (JEN frailty score), dual eligibility, prior year hospitalization and ED visits, and prior year costs. Tests of common support and covariate balance across treatment and comparison groups indicate that propensity score matching improves comparability.229
226 The awardee’s self-reported data, as presented in the HCIA Final Performance Progress Report. Submitted to CMMI by the University of Mexico Health Sciences Center, September 29, 2016. 227 Medicaid claims are available through March 31, 2016 for the analyses in this report. 228 For more information on our propensity score matching methodology, please see NORC’s Third Annual Report, Appendix C. 229 For more detailed information on propensity score matching and tests of common support and covariate balance for this awardee, please see Appendix D.
Measures (per 1,000 beneficiaries unless noted) Total Cost of Care per beneficiary All-cause Hospitalizations Emergency Department (ED) Visits 30-day Readmissions Potentially Avoidable Hospitalizations

NORC | HCIA Complex/High-Risk Patient Targeting
ADDENDUM TO THE THIRD ANNUAL REPORT | 166
Descriptive Characteristics. Exhibit ECHO.1 displays the descriptive characteristics of beneficiaries in ECHO Care and comparison group, with respect to demographics, comorbidities, and prior utilization.230 We observe few differences in demographics, dual enrollment, or prior cost, although beneficiaries in the ECHO Care program are less likely to be disabled (p<0.05), have lower CDPS risk scores (p<0.01), and have significantly lower prior year hospitalizations and ED visits (p<0.01), relative to the comparison group.
Exhibit ECHO.1: Descriptive Characteristics for ECHO Care and Comparison Group Beneficiaries
Variable ECHO Care Comparison Number of Persons 719 719 Mean Number of Quarters Enrolled [Range] 6.5 [2 - 11] 6.5 [2 - 11] Gender % (N) Female 52.0 (374) 50.3 (362) Age Group % (N) <25 years 4.2 (30) 5.8 (42) 25-44 years 34.6 (249) 37.6 (270) 45-64 years 59.9 (431) 55.2 (397) 65+ years 1.3 (9) 1.4 (10) Race/Ethnicity % (N) White 72.5% (521) 69.1% (497) Black 2.9% (21) 3.2% (23) Hispanic 18.8% (135) 22.3% (160) Other 5.8% (42) 5.4% (39) Dual Eligibility % (N) Dually Enrolled 7.1% (51) 7.0% (50) Disability Status % (N) Disability** 33.7% (242) 38.7% (278) Chronic Illness and Disability Payment System (CDPS) Risk Score CDPS Risk Score (Standard Deviation)*** 3.0 (2.4) 3.3 (2.1) Mean Utilization and Cost in Year Prior to Program Enrollment (per 1,000 beneficiaries unless noted) Total Cost of Care per beneficiary (SD) $55,941 ($97,453) $57,036 ($63,639) Hospitalizations (SD)*** 1,229 (2,358) 1,659 (2,479) ED Visits (SD)*** 4,881 (9,208) 6,343 (9,618)
NOTE: *p<0.10, **p<0.05, ***p<0.01.
Impact of ECHO Care. Exhibit ECHO.2 displays the average quarterly and aggregate impact of ECHO Care on its participants relative to the comparison group.231 Utilization measures are reported as binary indicators, noting whether an event occurred in each quarter for a specific beneficiary (beneficiary-quarter). We find the following, relative to the comparison group:
230 We test differences between these groups with a t-test for continuous measures (comorbidities and utilization one year prior to program enrollment) or a chi-square test for categorical parameters (gender, age, race, dual eligibility, and disability status). 231 Adjustment factors include age category, gender, race/ethnicity, dual eligibility indicator, CDPS risk score, disability indicator, and prior utilization (hospitalizations and ED visits). Results are interpreted as significant where p<0.10.

NORC | HCIA Complex/High-Risk Patient Targeting
ADDENDUM TO THE THIRD ANNUAL REPORT | 167
■ Cost: A statistically significant decrease in total quarterly cost of care (-$1,270 per beneficiary per quarter).
■ Utilization Measures: Non-significant decreases in hospitalizations and 30-day readmissions and a non-significant increase in ED visits.
■ Quality of Care: A significant decrease in potentially avoidable hospitalizations (-15 per 1,000 beneficiaries per quarter).
These summative findings over an average enrollment of almost two years are for the most part consistent with those presented in NORC’s Third Annual Report. The cost savings seen with the ECHO Care Model are smaller than those reported earlier and the estimated decrease in potentially avoidable hospitalizations gains statistical significance, the latter as a likely contributor to cost savings. The greater number of claims used to derive these estimates gives them greater weight, compared with those presented previously. On the basis of these findings, the ECHO Care Model does not appear to significantly reduce hospitalizations, ED visits, or 30-day readmissions over time.
Exhibit ECHO.2: Impact of the ECHO Care Program on Outcomes
AVERAGE QUARTERLY IMPACT§ Outcome Measure
(per 1,000 beneficiaries unless noted) Adjusted Estimate
90% Confidence Interval
80% Confidence Interval
Total Cost of Care per beneficiary ($) -$1,270 ** -$2,218, -$322** -$2,009, -$531 Hospitalizations -9 -27, 9 -23, 5 ED Visits 2 -23, 27 -17, 21 30-Day Readmissions -10 -69, 49 -56, 36 Potentially Avoidable Hospitalizations -15 ** -25, -5** -23, -7
AGGREGATE IMPACT§§
Outcome Measure Adjusted Estimate
90% Confidence Interval
80% Confidence Interval
Total Cost of Care ($) -$5,951,342 ** -$10,392,921, -$1,509,763
-$9,412,804, -$2,489,880
Hospitalizations -43 -128, 42 -109, 23 ED Visits 11 -106, 128 -80, 102 30-Day Readmissions -6 -40, 28 -32, 20 Potentially Avoidable Hospitalizations -66 ** -111, -21 -101, -31
NOTE: +p<0.20, *p<0.10, **p<0.05, ***p<0.01. Bold font indicates findings that are statistically significant at p<0.10. §Quarterly impact is the average quarterly DID estimate per quarter of program enrollment. §§Aggregate impact is the total DID estimate for all program participants across all observed quarters of program enrollment. Aggregate impact is estimated for this awardee based on the total number of program participants (719), with an average length of enrollment of 6.5 quarters. Please note that the estimate for aggregate impact may be smaller thant the estimate for average quarterly impact if there are fewer than 1,000 enrolled beneficiaries, as the aggregate estimate is equal to the average quarterly estimate multipled by the sample size in each quarter, divided by 1,000. Disclaimer: Standard statistical practice is to use confidence intervals of 90% or higher. 80% confidence intervals are provided here for comparison purposes.
Impact of ECHO Care in Each Quarter of Enrollment. With the exception of hospitalizations and 30-day readmissions, findings from a quarterly fixed effects (QFE) DID model of impact—for each quarter individually rather than for an average quarter as presented above— are consistent with the average

NORC | HCIA Complex/High-Risk Patient Targeting
ADDENDUM TO THE THIRD ANNUAL REPORT | 168
quarterly impact summarized above.232 For hospitalizations and 30-day readmissions, these findings offer more nuanced insights into ECHO Care, compared with the summary estimates of impacts presented above and for this reason, are included below, in Exhibit ECHO.3, relative to a comparison group.233 We observe a decreasing trend for hospitalizations that reaches statistical significance in the last three quarters of the post-intervention period (I8-I10). There is also a significant decrease in 30-day readmissions in two post-intervention quarters (I4, I7). Over the full implementation period, there are small, non-significant decreases in hospitalizations and 30-day readmissions; the quarterly findings indicate that beneficiaries enrolled for at least one year are likely to experience fewer hospitalizations and 30-day readmissions, relative to a comparison group.
Exhibit ECHO.3: Impact of the ECHO Care Program by Quarter
Disclaimer: Standard statistical practice is to use confidence intervals of 90% or higher. 80% confidence intervals are provided here for comparison purposes.
Summary
We find significantly lower total costs of care and fewer potentially avoidable hospitalizations for ECHO Care enrollees, relative to a comparison group. Observed decreases in utilization (hospitalizations and 30-day readmissions) do not reach statistical significance overall but are significant for beneficiaries in quarters beyond their first year of ECHO Care enrollment, while there are mixed findings for ED visits (a significant increase in the first quarter of enrollment and a decrease in the seventh quarter post-enrollment).
These findings are for the most part consistent with those presented in NORC’s Third Annual Report. The cost savings seen with the ECHO Care Model most likely reflect the reduction over time in potentially
232 Please see Appendix D for presentation of these results. For a more detailed explanation of the QFE DID model and measure specification, please see NORC’s Third Annual Report, Appendix C. 233 For both measures, the effect is displayed as the average difference between treatment and comparison per 1,000 beneficiaries for each quarter during the post-intervention (I1–I10) period, after adjusting for pre-intervention differences between the two groups. We present both 90% confidence intervals (indicated by vertical lines around the estimate) and 80% confidence intervals (indicated by shaded boxes around the estimate). Results are interpreted as significant where p<0.10.

NORC | HCIA Complex/High-Risk Patient Targeting
ADDENDUM TO THE THIRD ANNUAL REPORT | 169
avoidable hospitalizations, as well as hospitalizations and 30-day readmissions for those enrolled for longer periods of time (e.g., at least one year). Although claims-based descriptive characteristics for enrolled beneficiaries indicate that they are somewhat healthier than their comparators (in terms of disability, complexity as reflected in CDPS risk score, and lower prior year utilization), they remain a population that is at high risk due to the prevalence of mental health conditions and substance abuse and because of barriers to access related to their rural communities. Sustained engagement with ECHO Care over a period of months would be expected prior to seeing improvements in health and engagement with the health care system.
While the analysis in this report is based on two additional quarters of claims data, the number of claims from later implementation quarters remains relatively small – as reflected in the wide confidence intervals depicted in the QFE DID charts above – and for this reason, estimates should be interpreted with caution.

NORC | HCIA Complex/High-Risk Patient Targeting
ADDENDUM TO THE THIRD ANNUAL REPORT | 170
University of North Texas
Brookdale Senior Living Transitions of Care (BSLTOC). The University of North Texas and its primary partner, Brookdale Senior Living (BSL), created this program to adapt INTERACT quality improvement tools for use in selected BSL skilled nursing facilities (SNFs); assisted living/memory care (AL/MC) and independent living (IL) residences; and home health agencies.
PROGRAM MODELS: Advance Care Planning, Beneficiary/Caregiver Engagement, Care/Case Coordination, Clinician Decision Supports, Home Health/Home Care, Transitional Care
LOCATION: Colorado, Florida, Kansas, Tennessee, Texas REACH: Cumulative count unavailable GRANT: $7,329,714 POPULATIONS: Older Adults, Disability AWARD DATES: 11/30/12 to 6/30/16 DATA, ADDENDUM REPORT: Medicare claims
(January 2013 to June 2015); Minimum Data Set (MDS) 3.0
NO-COST EXTENSION: N/A PAYER(S): Medicare
OUTCOMES§
For residents in skilled nursing facilities, small, non-significant increases in urinary tract infections and falls resulting in injuries.
§Outcomes for cost, utilization, and quality of care are from analyses that include a comparison group and are statistically significantat the P<0.10 level.w
SUMMARY: In NORC’s Third Annual Report, we presented evidence of statistically significant costsavings for BSLTOC’s skilled nursing facility (SNF) and assisted living/memory care (AL/MC) arms,together with reduced hospitalizations, 30-day readmissions, and ambulatory care-sensitivehospitalizations for beneficiaries enrolled in the AL/MC arm. New analyses of two quality measures forSNF arm beneficiaries finds that this significant decrease in the 30-day total cost of care is not associatedwith significant change in either urinary tract infections or falls resulting in injuries.

NORC | HCIA Complex/High-Risk Patient Targeting
ADDENDUM TO THE THIRD ANNUAL REPORT | 171
Program Effectiveness
We present results of quarterly fixed effects (QFE) difference-in-differences (DID) analyses for Medicare fee-for-service (FFS) beneficiaries in the Brookdale Senior Living Transitions of Care (BSLTOC) program from January 1, 2013, through June 30, 2015, relative to a comparison group. These analyses do not assess the BSLTOC program beyond the initial period of performance, as the awardee did not receive a no-cost extension. Rather, in this chapter, we consider the impact of the BSLTOC program on skilled nursing facility (SNF) residents during the initial performance period, looking at changes in two quality of care measures (urinary tract infections, falls resulting in injury) that are part of the Minimum Data Set (MDS) 3.0 . Please see NORC’s Third Annual Report234 for a full presentation of evaluation results for this awardee.
We observed no clear overall trends in rates of urinary tract infections (UTIs) or falls resulting in injury (falls) during SNF stays for BSLTOC beneficiary-episodes, relative to comparison group beneficiary-episodes.
Supplemental Measures: Skilled Nursing Facility Arm
Our hospital (post-discharge) analysis compares the experiences of University of North Texas enrollees with those of a matched group of comparators. It considers the impact on quality of care of the awardees’ BSLTOC intervention over the implementation period as a whole and in each quarter of program implementation. Our analysis is for Medicare Fee-For-Service beneficiaries, comprising 83 percent of all BSLTOC SNF enrollees. 235
Finder File and Creation of Analytic Sample. Brookdale provided a finder file that lists program participants and their enrollment dates, enabling us to use Medicare claims in the CMS Virtual Research Data Center (VRDC) to calculate outcome measures. 236 We identified 31,273 unique beneficiary-episodes, of which 7,613 were matched to a Medicare identifier, enrolled in Medicare FFS at the time of SNF admission, and occurred in the post-intervention period. We then applied measure-specific exclusions for UTIs (i.e., presence of UTI on admission or readmission; UTI value missing) and falls (i.e., occurrence of falls or injury not assessed). Finally, we dropped any BSLTOC SNF beneficiary-episodes occurring within 90 days of any previous BSLTOC SNF beneficiary-episode for the same individual, to create a “clean period” unlikely to include overlapping SNF claims. This yielded a sample of 5,794 BSLTOC SNF beneficiary-episodes in the post-intervention for the UTI analysis and 6,661 BSLTOC SNF beneficiary-episodes in the post-intervention period for the fall analysis.
Comparison Group. We use Medicare claims to identify a comparison group of beneficiary-episodes discharged to 55 non-BSLTOC SNFs associated with 25 partner hospitals that discharge a large volume of patients (greater than 100 episodes) to 14 Brookdale SNFs. We select comparison SNFs based on
234 Available at https://downloads.cms.gov/files/cmmi/hcia-chspt-thirdannualrpt.pdf . 235 Estimated percentage of Medicare FFS participation is cumulative, based on the finder file, rather than cross-sectional, based on awardee self-reported data. See NORC’s Third Annual Report, Appendix C for more information about our analysis. 236 Medicare claims are available through December 31, 2015, for this report. We used June 30, 2015, as the cut-off date, reflecting the end date of the awardee’s period of performance with HCIA support.
Measures (per 1,000 beneficiary-episodes) Urinary tract infections (UTIs) Falls resulting in injury (Falls)

NORC | HCIA Complex/High-Risk Patient Targeting
ADDENDUM TO THE THIRD ANNUAL REPORT | 172
number of admissions from partner hospitals (at least 50 episodes), similarity in size to the respective BSL SNF, and best match on cost and demographic variables. We exclude any comparison group SNF with facility-level UTI or falls rates outside the upper and lower bounds of the BSLTOC SNFs. We use propensity score weighting (standardized mortality ratio weighting) to minimize observed differences in beneficiary-episode characteristics between the BSLTOC treatment and comparison groups.237 Tests of common support and covariate balance across treatment and comparison groups indicate that propensity score weighting improves comparability.238
Descriptive Characteristics. For both the UTI and falls analyses, findings are the same as those presented in NORC’s Third Annual Report. Beneficiary-episodes attributed to the BSLTOC SNFs are significantly more likely to be older, White, have a lower Hierarchical Condition Category (HCC) score and fewer total HCCs, be covered due to age, and have lower cost and fewer hospitalizations in the year prior to enrollment.239
Impact of BSLTOC Program. Exhibit BSLTOC.1 presents the average quarterly impact of the BSLTOC intervention on its participants relative to the comparison group.240 We find small, non-significant increases in UTIs and falls, relative to the comparison group:
Exhibit BSLTOC.1: Impact of the BSLTOC Program on UTIs and Falls
AVERAGE QUARTERLY IMPACT§ Outcome Measure
(per 1,000 beneficiary-episodes unless noted) Adjusted Estimate
90% Confidence Interval
80% Confidence Interval
UTIs 7 -4, 18 -2, 15 Falls resulting in injury 5+ -1, 10 0, 9
AGGREGATE IMPACT§§
Outcome Measure Adjusted Estimate
90% Confidence Interval
80% Confidence Interval
UTIs 41 -23, 104 -12, 87 Falls resulting in injury 33+ -7, 67 0, 60
NOTE: +p<0.20, *p<0.10, **p<0.05, ***p<0.01. Bold font indicates findings that are statistically significant at p<0.10. §Quarterly impact is the average quarterly DID estimate per quarter of program enrollment. §§Aggregate impact is the total DID estimate for all program participants across all quarters of program implementation. The aggregate impact is derived by multiplying the estimate by the total number of beneficiary-episodes (UTIs analysis: 5,794; Falls analysis: 6,661). Disclaimer: Standard statistical practice is to use confidence intervals of 90% or higher. 80% confidence intervals are provided here for comparison purposes.
237 For more information on our propensity score methodology, please see NORC’s Third Annual Report, Appendix C. 238 For more detailed information on propensity score weighting and test of common support and covariate balance, please refer to Appendix D. 239 For presentation of descriptive characteristics for the analytic populations for UTIs and falls, see Appendix D. 240 Due to small sample size in each quarter, we estimated average quarterly impacts using a summative DID model that examine the impact of the awardee across the entire post-intervention period. For the summative DID model, we compare the average outcomes of beneficiary-episodes in the BLSTOC program with those of the comparison groups across the entire post-intervention period, after adjusting for differences in secular trends and risk factors across both groups. See Appendix C for more detailed information about measure specification for UTIs and falls.

NORC | HCIA Complex/High-Risk Patient Targeting
ADDENDUM TO THE THIRD ANNUAL REPORT | 173
Impact of BSLTOC in Each Quarter of Enrollment. Findings from a quarterly fixed effects (QFE) DID model of impact—for each quarter individually rather than for an average quarter as presented above— are consistent with the average quarterly impact summarized above.241
Summary
Our claims-based analysis of two quality of care measures–urinary tract infections and falls resulting in injury--finds no clear overall trends in quality of care for beneficiary-episodes at BSLTOC SNFs relative to a comparison group. In combination with the results presented in NORC’s Third Annual Report, our claims-based analysis of the BSLTOC program for SNF residents finds there are significant decreases in 30-day total cost of care without adverse effects on utilization or quality of care.242
241 See Appendix D for presentation of these findings and NORC’s Third Annual Report, Appendix C, for a detailed explanation of QFE DID models. 242 Available at: https://downloads.cms.gov/files/cmmi/hcia-chspt-thirdannualrpt.pdf .

NORC | HCIA Complex/High-Risk Patient Targeting
ADDENDUM TO THE THIRD ANNUAL REPORT | 174
TECHNICAL APPENDICES

NORC | HCIA Complex/High-Risk Patient Targeting
ADDENDUM TO THE THIRD ANNUAL REPORT | 175
Appendix A: Awardee and Intervention Names and Abbreviations
Awardee Intervention Full Name Abbreviation Full Name Abbreviation
California Long-Term Care Education Center
CLTCEC Care Team Integration of the Home-Based Workforce
IHSS Integration
Courage Kenny Rehabilitation Institute
CKRI Advanced Primary Care Clinic APCC
Developmental Disabilities Health Services
DDHS Developmental Disabilities Health Home DD Health Home
Johns Hopkins University J-CHiP Community Health Partnership J-CHiP Johns Hopkins University School of Nursing
JHU SON Project Community Aging in Place, Advancing Better Living for Elders
Project CAPABLE
LifeLong Medical Care LifeLong LifeLong Comprehensive Care Initiative LCCI Northland Healthcare Alliance Northland Northland Care Coordination for Seniors NCCS Palliative Care Consultants of Santa Barbara
PCCSB Doctors Assisting Seniors at Home DASH
Pittsburgh Regional Health Initiative
PRHI Primary Care Resource Center PCRC
Providence Portland Medical Center
PPMC Health Commons Health Commons
St. Francis Healthcare Foundation of Hawaii
St. Francis Home Outreach Program and E-Health HOPE
Sutter Health Corporation Sutter Health Advanced Illness Management AIM University Emergency Medical Services
UEMS Better Health through Social and Health Care Linkages Beyond the Emergency Department
HealthiER
University of New Mexico Health Sciences Center
U New Mexico
Extension for Community Healthcare Outcomes (ECHO) Care
ECHO
University of North Texas Health Science Center
U North Texas
Brookdale Senior Living Transitions of Care
BSLTOC

NORC | HCIA Complex/High-Risk Patient Targeting
ADDENDUM TO THE THIRD ANNUAL REPORT | 176
Appendix B: Definition of Acronyms
Acronym Description ACS, ACSC ambulatory care sensitive condition ACP advance care planning ADE adverse drug event (associated with hospitalization) ADL Activities of Daily Living AL/MC assisted living/memory care residence APN advanced practice nurse AT assistive technology ATE average treatment effects BAA business associate’s agreement CAD coronary artery disease CAHPS, HCAHPS Consumer Assessment of Healthcare Providers and Systems, hospital CAHPS CDPS chronic illness and disability payment system risk score CDSMP chronic disease self-management program CHC community health center CHF congestive heart failure CHIP Children’s Health Insurance Program CMS VRDC Centers for Medicare & Medicaid Services Virtual Research Data Center COPD chronic obstructive pulmonary disease DID difference-in-differences method DME durable medical equipment DUA data use agreement E&M evaluation and management ED (hospital) emergency department EDB eligibility data base EHR electronic health record EOL end of life ESRD end-stage renal disease FQHC federally qualified health center GEE generalized estimating equation GLM generalized linear model HH home health HCC hierarchical condition categories HTN Hypertension IADL Instrumental Activities of Daily Living ICU hospital intensive care unit IDD intellectual and/ developmental disability IL independent living residence ILS independent living skills IP, HC/IP inpatient, hospital IRR Inter rater reliability LOS length of stay LPN licensed practical nurse LTC, LTSS long term care, long term services and supports MCC multiple chronic conditions MCO managed care organization

NORC | HCIA Complex/High-Risk Patient Targeting
ADDENDUM TO THE THIRD ANNUAL REPORT | 177
Acronym Description MDS-PPS minimum data set 3.0 prospective payment system assessments Medicaid FFS Medicaid Fee-For-Service Medicaid MC Medicaid Managed Care MS-DRG diagnosis-related group, coding system used by Medicare, also known as CMS-DRG NH nursing home NPI national provider identifier OT occupational therapist PAC post-acute care PACE Program of All-Inclusive Care for the Elderly PC, PCP primary care, primary care provider PHCA personal health care agency PMPM per-member, per-month (capitation payment) POLST Physician Orders for Life-Sustaining Treatment POST Physician Orders for Scope of Treatment PT physical therapist SNF skilled nursing facility

NORC | HCIA Complex/High-Risk Patient Targeting
ADDENDUM TO THE THIRD ANNUAL REPORT | 178
Appendix C: Methods, Claims-based Analyses
Overview
Details about secondary data collection and analytic methods for the NORC evaluation are given in our Third Annual Report.243 This appendix offers an update specifically to support the analyses presented in this report.
Analytic Approach
For the purpose of evaluation, we have identified two broad types of interventions—post-acute care (PAC) interventions and ambulatory care (community) programs. For more details on these two intervention settings and the analytic design for these awardees, please refer to the Third Annual Report.244
Analytic Design
Our design for each awardee begins with an assessment of data quality and adequacy; for more details on the assessment process, please refer to the Third Annual Report.245 Exhibit C.1 presents a summary of NORC’s selected measures and models for our claims-based analyses.
243 Available at: https://downloads.cms.gov/files/cmmi/hcia-chspt-thirdannualrpt.pdf . 244 Available at: https://downloads.cms.gov/files/cmmi/hcia-chspt-thirdannualrpt.pdf . 245 Available at: https://downloads.cms.gov/files/cmmi/hcia-chspt-thirdannualrpt.pdf .

NORC | HCIA Complex/High-Risk Patient Targeting
ADDENDUM TO THE THIRD ANNUAL REPORT | 179
Exhibit C.1: Types of Analyses for Claims-Based Measures in NORC Addendum Report
Awardee Claims Data
Difference in Differences (DID) Models
Notes Core
Measures Supplemental Measures CLTCEC Medicare ■ ACS hospitalizations Subgroup analysis for second year
post-enrollment only CKRI Medicaid &
Medicare ■
DDHS Medicaid ■ J-CHiP Medicare &
Medicaid ■ Hospital Arm:
Cost of care categories for Medicare and Medicaid
7-day and 30-day practitioner follow-up visits post-discharge for Medicare and Medicaid
Community Arm: ACS hospitalizations for Medicare
Potentially avoidable hospitalizations for Medicaid
Community Arm (Medicaid): Subgroup analysis for dually eligible and Medicaid only beneficiaries Crossover analysis: Hospital arm participants enrolled in the community arm within 30-days of index hospital discharge [in Appendix] Community Arm: Subgroup analysis by dose (continuous contact vs. non-continuous contact)
JHU SON Medicare & Medicaid
■ ACS hospitalizations
LifeLong Medicaid ■ Northland Medicare ■ ACS hospitalizationsPCCSB Medicare ■ ACS hospitalizationsPRHI Medicare ■ 7-day and 30-day practitioner
follow-up visits post-dischargeSubgroup analyses for beneficiaries with AMI, CHF, COPD diagnoses
PPMC Medicaid ■ Subgroup analyses for six different programs within PPMC
St Francis Medicare ■ 7-day and 30-day practitionerfollow-up visits post-dischargeACS hospitalizations
Sutter Health
Medicare ■ Analysis looks at end of life experience for decedents; Feasibility assessment of using Minimum Data Set (MDS) to identify comparison group
UEMS Medicaid ■ 7-day, 30-day, and 90-daypractitioner follow-up visitspost-ED dischargePotentially avoidablehospitalizations
U New Mexico
Medicaid ■ Potentially avoidablehospitalizations
U North Texas
Medicare Measures from MDS for SNF subgroup:
Urinary tract infections Falls resulting in injuries
NOTE: ACS = ambulatory care-sensitive hospitalization; AMI = acute myocardial infarction; CHF = congestive heart failure; COPD = chronic obstructive pulmonary disease; MDS = Minimum Data Set; SNF = skilled nursing facility.

NORC | HCIA Complex/High-Risk Patient Targeting
ADDENDUM TO THE THIRD ANNUAL REPORT | 180
Data Collection Update
For the 8 awardees in our portfolio whose participants are predominantly Medicaid enrollees, evaluation results presented in the NCE report used Medicaid data sources summarized in Exhibit C.2 below, for the time periods noted.
Exhibit C.2: Status of Medicaid Data Sources
Awardee State(s)
% Medicaid Enrollees for
Awardee Source of Medicaid Data Time Period CKRI MN 100 MN Department of Human Services 1/01/2011 – 6/30/2016 DDHS NY Alpha-MAX
1/01/2011 – 6/30/2015
J-CHiP MD 36 MD State MMIS 1/01/2011 – 3/31/2016 JHU SON MD 100 MD State MMIS 1/01/2011 – 6/30/2016 LifeLong CA 100 Plan partner (Alameda Alliance) 3/01/2011 – 6/30/2015 PPMC OR 95 Alpha-MAX
9/01/ 2011 – 6/30/2015
UEMS NY 100 Alpha-MAX
1/01/2011 – 6/30/2015
U New Mexico
NM 100 New Mexico MMIS data from Awardee 9/01/2011 – 3/31/2016
In the subsequent sections, we summarize for both the hospital and community awardees the details of our methods to assess program effectiveness using claims data, including data sources, specification of measures, approach to identifying comparison groups, use of propensity score methods to ensure similarity between the treatment and comparison groups, specification of analytic models to assess program impacts, and presentation of both summative and aggregate impacts.
Post-Acute Care (Hospital) Awardees
Participants are enrolled in these intervention programs when they are admitted (or discharged) from an inpatient facility, typically a hospital but sometimes a skilled nursing facility (SNF). Although each intervention focuses on different populations and uses different approaches, they all have the common goals of improving health, increasing quality of care, and decreasing cost in the post-acute care period. For more details on how we operationalize post-acute care episodes and analyze post-acute care awardees in our analyses (including descriptions of data sources and populations, measure specification, and analytic methods), please refer to the Third Annual Report.246 In Exhibit C.3 below we detail the specifications of supplemental measures that were not included in the third annual report for J-CHiP’s hospital arm and University of North Texas-Brookdale.
246 Available at: https://downloads.cms.gov/files/cmmi/hcia-chspt-thirdannualrpt.pdf .

NORC | HCIA Complex/High-Risk Patient Targeting
ADDENDUM TO THE THIRD ANNUAL REPORT | 181
Exhibit C.3: Supplemental Measures for Post-Acute Care Awardees
Awardee Measure Definition J-CHiP Hospital Arm (Medicare)
90-day Acute Inpatient Cost per beneficiary-episode
Medicare facility and professional costs associated with acute inpatient hospitalizations within 90-days of index hospital discharge per beneficiary-episode
90-day SNF Cost per beneficiary-episode
Medicare facility and professional costs associated with skilled-nursing facility (SNF) care within 90-days of index hospital discharge per beneficiary-episode
90-day Other Post-Acute Care Cost per beneficiary-episode
Medicare facility and professional costs associated with long-term hospital, inpatient rehabilitation, and home health agency care within 90-days of index hospital discharge per beneficiary-episode
90-day Outpatient Cost per beneficiary-episode
Medicare facility and professional costs associated with hospital outpatient, and ambulatory care within 90-days of index hospital discharge per beneficiary-episode
90-day Hospice Cost per beneficiary-episode
Medicare costs associated with hospice care within 90-days of index hospital discharge per beneficiary-episode
90-day DME Cost per beneficiary-episode
Medicare costs associated with durable medical equipment (DME) within 90-days of index hospital discharge per beneficiary episode
J-CHiP Hospital Arm (Medicaid)
90-day Inpatient Care Cost per beneficiary-episode
Medicaid facility and professional costs associated with inpatient hospitalizations within 90-days of index hospital discharge per beneficiary-episode
90-day Outpatient Care Cost per beneficiary-episode
Medicaid facility and professional costs associated with outpatient hospital and ambulatory care within 90-days of index hospital discharge per beneficiary-episode
90-day Long-term Care Cost per beneficiary-episode
Medicaid facility and professional costs associated with institutional and home & community based long-term care within 90-days of index hospital discharge per beneficiary-episode
90-day Prescription Drug Cost per beneficiary-episode
Medicaid costs associated with prescription drugs within 90-days of index hospital discharge per beneficiary-episode
University of North Texas Brookdale Senior Living Transitions of Care (BSLTOC)
Urinary Tract Infections per 1,000 beneficiary-episodes
Number of Medicare beneficiary-episodes with a non-admission/readmission, where MDS-PPS SNF assessment documents incidence of Urinary Tract Infection (UTI) after admission to the facility
Falls resulting in injury per 1,000 beneficiary-episodes
Number of Medicare beneficiary-episodes with a non-admission/non-readmission, where Minimum Data Set- Prospective Payment System (MDS-PPS) SNF assessment documents one or more falls occurring since admission that have resulted in an injury
Ambulatory Care (Community) Awardees
Unlike the post-acute interventions, the community awardee programs do not identify their participants based on events like a hospitalization. In general, these programs focus on improving health, increasing quality of care, and decreasing cost for patients in the outpatient setting. For more details on how we operationalize and analyze ambulatory care awardees in our analyses (including descriptions of data sources and populations, measure specification, and analytic methods), please refer to the Third Annual Report.247
247 Available at: https://downloads.cms.gov/files/cmmi/hcia-chspt-thirdannualrpt.pdf .

NORC | HCIA Complex/High-Risk Patient Targeting
ADDENDUM TO THE THIRD ANNUAL REPORT | 182
Appendix D: Claims-based Analyses: Supporting Exhibits
Overview
This appendix provides technical exhibits that support the Difference-in-Difference (DID) analyses in 14 awardee chapters, as follows:
■ Displays of the test of common support and covariate balance for analyses in which propensityscore matching or weighting is used as part of comparison group creation. We use three types ofpropensity score estimation: matching, relative weighting, and standardized mortality ratio (SMR)weighting.
■ Charts that present quarterly fixed effects (QFE) findings for an intervention’s impact by quarter,for awardee chapters where these findings are not central to our evaluation of programeffectiveness.
In addition, selected claims-based subgroup analyses are presented in this appendix, for J-CHiP (subgroup analyses for hospital arm discharge to SNF and community arm by program and dose), and U North Texas (impact of hospital arm on two quality of care measures –urinary tract infections and falls resulting in injury).
Please see Appendix C for more information about analytic approaches. Exhibit D.1 lists the awardees for whom tests of common support and covariate balance are presented in this appendix. Exhibit D.2 lists the awardees for whom QFE charts are presented in this appendix.

NORC | HCIA Complex/High-Risk Patient Targeting
ADDENDUM TO THE THIRD ANNUAL REPORT | 183
Exhibit D.1: Analyses that Include Common Support and Covariance Balance Charts by Awardee
Awardee Evaluation Design Payer Propensity Score Model CLTCEC Community Medicare Matching
CKRI Community Medicare Matching Community Medicaid Matching
DDHS Community Medicaid Matching J-CHiP Hospital Medicare Relative weighting
Medicaid Community Medicare Matching
Medicaid JHU SON Community Medicare Matching
Medicaid Matching LifeLong Community Medicaid Matching Northland Community Medicare Matching PCCSB Community Medicare Matching PRHI Hospital Medicare SMR weighting PPMC Community Medicaid Matching St. Francis Hospital Medicare SMR weighting
Community Medicare Matching Sutter Health Community Medicare Matching UEMS Community Medicaid Matching U New Mexico Community Medicaid Matching U North Texas Hospital Medicare SMR weighting
Community Medicare Matching Community Medicare Matching

NORC | HCIA Complex/High-Risk Patient Targeting
ADDENDUM TO THE THIRD ANNUAL REPORT | 184
Exhibit D.2: Analyses that Include Quarterly Fixed Effects Charts of the Impact of HCIA-Funded Innovations on Outcomes by Quarter by Awardee
Awardee Evaluation Design,
Payer
Outcome Measures
QFE Charts Included in
Awardee Chapter?
CMMI Core Measures
Supplemental Measures
Hos
pita
lizat
ions
ED V
isits
Rea
dmis
sion
s
Tota
l Cos
t of C
are
Am
bula
tory
Car
e-se
nsiti
ve
Hos
pita
lizat
ions
Pote
ntia
lly
Avo
idab
le
Hos
pita
lizat
ions
Prac
titio
ner
Follo
w-u
p Vi
sits
CLTCEC Community, Medicare X X X X X Yes CKRI Community, Medicare X X X Yes
Community, Medicaid X X X No DDHS Community, Medicaid X X X No J-CHiP Hospital, Medicare X X X X X Yes
Hospital, Medicaid X X X X X No Community, Medicare X X X X X Yers Community, Medicaid X X X X X No
JHU SON Community, Medicare X X X X X Yes Community, Medicaid X X X Yes
LifeLong Community, MediCal X X X X Yes Northland Community, Medicare X X X X X No PCCSB Community, Medicare X X X X X Yes PRHI Hospital, Medicare X X X X X No PPMC Community, Medicaid X X X No St. Francis Hospital, Medicare X X X X X Yes
Community, Medicare X X X X X Yes Sutter Health EOL, Medicare X X X No UEMS Community, Medicaid X X X X X Yes U New Mexico Community, Medicaid X X X X X Yes U North Texas Hospital, Medicare X X X X No

NORC | HCIA Complex/High-Risk Patient Targeting
ADDENDUM TO THE THIRD ANNUAL REPORT | 185
California Long-Term Care Education Center
Medicare Analysis
Exhibit D.CLTCEC.1 presents common support and covariate balance across treatment and comparison groups.
■ After matching, we observe nearly identical overlap in the density curves for propensity scores in the treatment and comparison groups.
■ In the matched sample, we are able to obtain balance on demographic covariates, comorbidities, and prior year utilization measures (hospitalizations and ED visits). Overall, the chart indicates that propensity score matching greatly improved the comparability of the treatment and comparison group.
Exhibit D.CLTCEC.1: Test of Common Support and Covariate Balance, CLTCEC Program

NORC | HCIA Complex/High-Risk Patient Targeting
ADDENDUM TO THE THIRD ANNUAL REPORT | 186
Courage Kenny Rehabilitation Center
Tests of common support and covariate balance across treatment and comparison groups indicate that propensity score matching improves comparability. Exhibit D.CKRI.1 and D.CKRI.2 presents common support and covariate balance across treatment and comparison groups for the Medicare and Medicaid beneficiaries.
■ After matching, we observe nearly identical overlap in the density curves for propensity scores inthe treatment and comparison groups.
■ In the matched samples, we are able to obtain balance on demographic covariates, comorbidities,and prior year utilization measures (hospitalizations and ED visits). Overall, the charts indicatesthat propensity score matching greatly improved the comparability of the treatment andcomparison group.
Exhibit D.CKRI.1: Test of Common Support and Covariate Balance, Medicare
Exhibit D.CKRI.2: Test of Common Support and Covariate Balance, Medicaid

NORC | HCIA Complex/High-Risk Patient Targeting
ADDENDUM TO THE THIRD ANNUAL REPORT | 187
Impact of CKRI Program in Each Quarter of Enrollment, Medicaid. Findings from a quarterly fixed effects (QFE) DID model of impact are consistent with the average quarterly impact summarized in the awardee chapter. Exhibit D.CKRI.3 displays the results of the QFE DID model for total cost of care, hospitalizations, and ED visits for CKRI participants, relative to a comparison group.248,249
Exhibit D.CKRI.3: Impact of the CKRI Program on Outcomes for Medicaid Beneficiaries, by Quarter
Disclaimer: Standard statistical practice is to use confidence intervals of 90% or higher. 80% confidence intervals are provided here for comparison purposes.
248 For a more detailed explanation of the QFE DID model and measure specification, please refer to NORC’s Third Annual Report, Appendix C. 249 For utilization and quality of care measures, the effect is displayed as the average difference between treatment and comparison per 1,000 beneficiaries (and 90 percent confidence interval) for each quarter during the post-intervention (I1–I14) period, after adjusting for pre-intervention differences between the two groups. For total cost of care, this effect is displayed per beneficiary. We present both 90% confidence intervals (indicated by vertical lines around the estimate) and 80% confidence intervals (indicated by shaded boxes around the estimate). Results are interpreted as significant where p<0.10.

NORC | HCIA Complex/High-Risk Patient Targeting
ADDENDUM TO THE THIRD ANNUAL REPORT | 188
Developmental Disabilities Health System
Exhibit D.DDHS.1 presents common support and covariate balance across the treatment and comparison groups.
■ After matching, we observe nearly identical overlap in the density curves for propensity scores inthe treatment and comparison groups.
■ In the matched sample, we are able to obtain balance on demographic covariates, comorbidities,and prior year utilization measures (hospitalizations and ED visits) and costs. Overall, the chartindicates that propensity score matching greatly improved the comparability of the treatment andcomparison group.
Exhibit D.DDHS.1: Test of Common Support and Covariate Balance, DD Health Home
Impact of DD Health Home in Each Quarter of Enrollment. Findings from a quarterly fixed effects (QFE) DID model of impact are consistent with the average quarterly impact summarized in the awardee chapter.250 Exhibit D.DDHS.2 displays the results of the QFE models.251
250 For a more detailed explanation of the QFE DID model and measure specification, please see NORC”s Third Annual Report, Appendix C. 251 For cost and utilization outcomes, the effect is displayed as the average difference between treatment and comparison per 1,000 beneficiaries (and 90 percent confidence interval) for each quarter during the post-intervention (I1–I6) period, after adjusting for pre-intervention differences between the two groups. For total cost of care, this effect is displayed per beneficiary. We present both 90% confidence intervals (indicated by vertical lines around the estimate) and 80% confidence intervals (indicated by shaded boxes around the estimate).
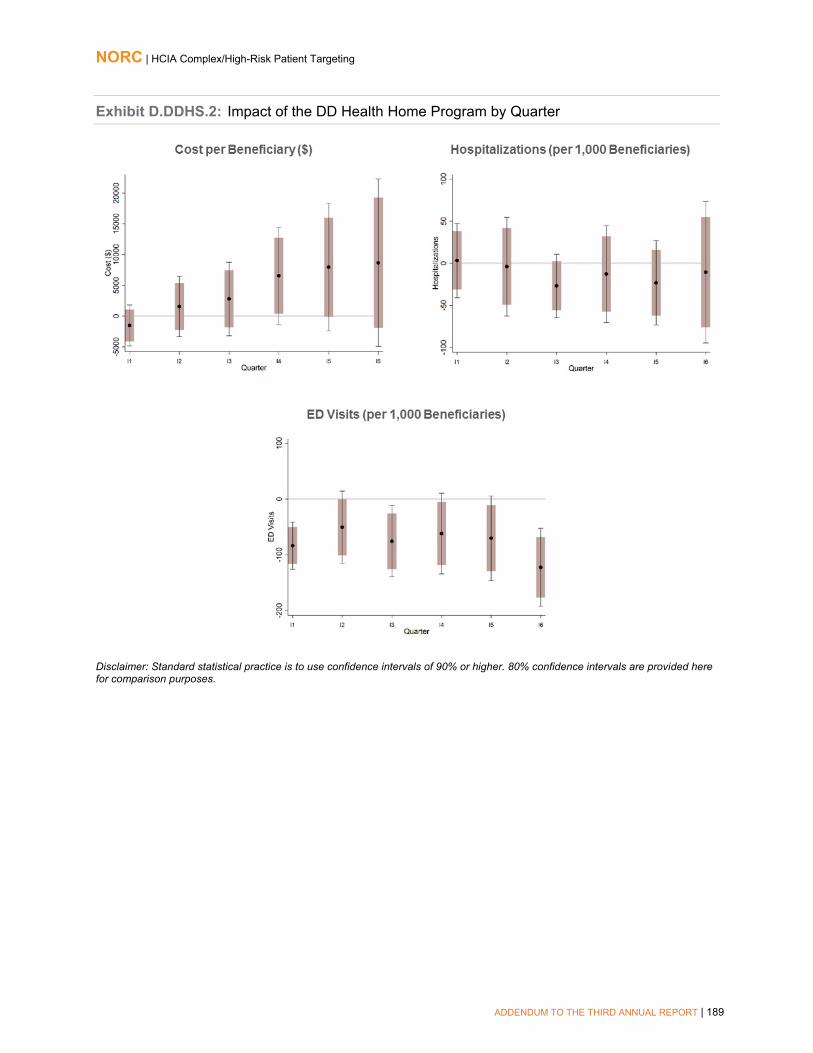
NORC | HCIA Complex/High-Risk Patient Targeting
ADDENDUM TO THE THIRD ANNUAL REPORT | 189
Exhibit D.DDHS.2: Impact of the DD Health Home Program by Quarter
Disclaimer: Standard statistical practice is to use confidence intervals of 90% or higher. 80% confidence intervals are provided here for comparison purposes.

NORC | HCIA Complex/High-Risk Patient Targeting
ADDENDUM TO THE THIRD ANNUAL REPORT | 190
Johns Hopkins Community Health Partnership
Hospital Arm, Medicare Analysis
Exhibit D.J-CHiP.1 presents common support and covariate balance across J-CHiP Medicare post-treatment, post-comparison, pre-treatment, and pre-comparison group beneficiary-episodes.
After relative weighting, we observe a high level of overlap in the distribution of estimated propensity scores across J-CHiP and comparison pre-intervention and post-intervention beneficiary-episodes.
In the weighted sample, we are able to obtain balance between the four groups on demographic and clinical covariates, comorbidities, and cost and utilization in the year prior to program enrollment.
Exhibit D.J-CHiP.1: Common Support and Covariate Balance for J-CHiP and Comparison Beneficiary-Episodes, Medicare

NORC | HCIA Complex/High-Risk Patient Targeting
ADDENDUM TO THE THIRD ANNUAL REPORT | 191
Hospital Arm, Medicaid Analysis
Exhibits D.J-CHiP.2 and D.J-CHiP.3 present common support and covariate balance across J-CHiP Medicaid post-treatment, post-comparison, pre-treatment, and pre-comparison group beneficiary-episodes for both dually eligible and non-dually eligible beneficiaries in the hospital arm.
After relative weighting, we observe a high level of overlap in the distribution of estimated propensity scores across J-CHiP and comparison pre-intervention and post-intervention beneficiary-episodes.
In the weighted sample, we are able to obtain balance between the four groups on demographic and clinical covariates, comorbidities, and cost and utilization in the year prior to program enrollment. Although we were not able to achieve balance on a few covariates, overall, the chart indicates that propensity score weighting greatly improved the comparability of the treatment and comparison groups.
Exhibit D.J-CHiP.2: Common Support and Covariate Balance for Dually Eligible J-CHiP and Comparison Beneficiary-Episodes, Medicaid Analysis
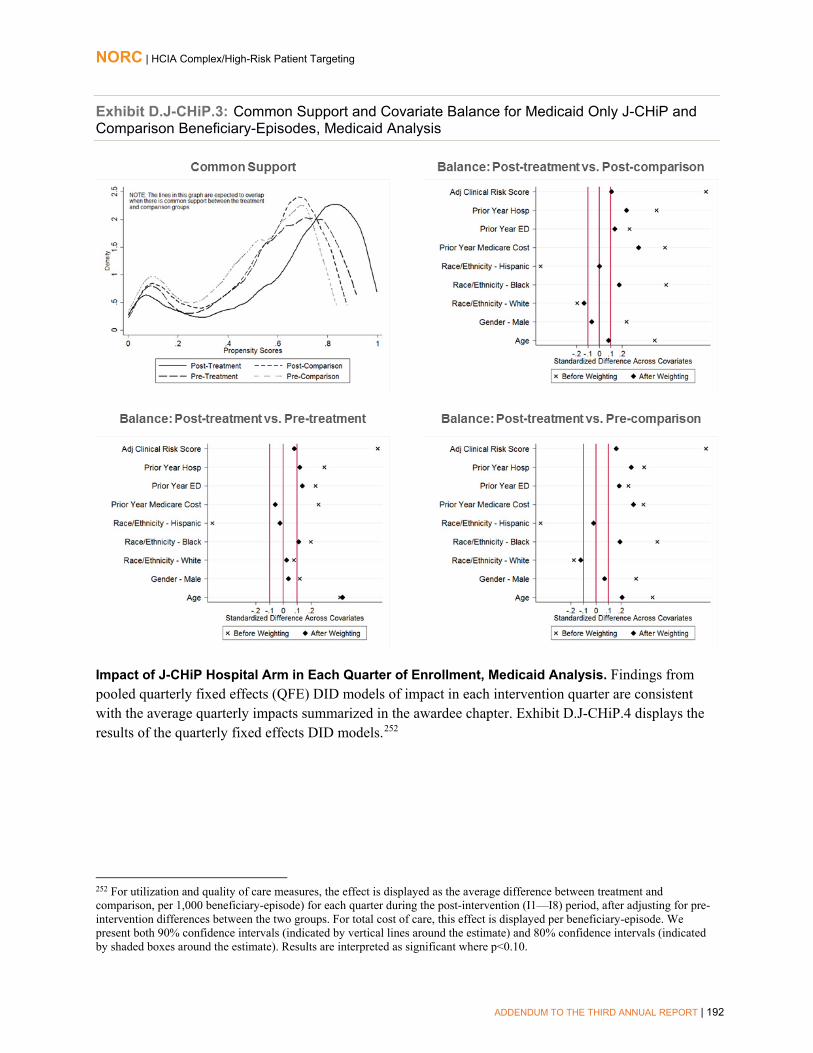
NORC | HCIA Complex/High-Risk Patient Targeting
ADDENDUM TO THE THIRD ANNUAL REPORT | 192
Exhibit D.J-CHiP.3: Common Support and Covariate Balance for Medicaid Only J-CHiP and Comparison Beneficiary-Episodes, Medicaid Analysis
Impact of J-CHiP Hospital Arm in Each Quarter of Enrollment, Medicaid Analysis. Findings from pooled quarterly fixed effects (QFE) DID models of impact in each intervention quarter are consistent with the average quarterly impacts summarized in the awardee chapter. Exhibit D.J-CHiP.4 displays the results of the quarterly fixed effects DID models.252
252 For utilization and quality of care measures, the effect is displayed as the average difference between treatment and comparison, per 1,000 beneficiary-episode) for each quarter during the post-intervention (I1—I8) period, after adjusting for pre-intervention differences between the two groups. For total cost of care, this effect is displayed per beneficiary-episode. We present both 90% confidence intervals (indicated by vertical lines around the estimate) and 80% confidence intervals (indicated by shaded boxes around the estimate). Results are interpreted as significant where p<0.10.

NORC | HCIA Complex/High-Risk Patient Targeting
ADDENDUM TO THE THIRD ANNUAL REPORT | 193
Exhibit D.J-CHiP.4: Impact of the J-CHiP Hospital Arm on Outcomes by Quarter, Medicaid
Disclaimer: Standard statistical practice is to use confidence intervals of 90% or higher. 80% confidence intervals are provided here for comparison purposes.

NORC | HCIA Complex/High-Risk Patient Targeting
ADDENDUM TO THE THIRD ANNUAL REPORT | 194
Community Arm, Medicare Analysis
Exhibit D.J-CHiP.5 presents common support and covariate balance across J-CHiP Medicare treatment and comparison group beneficiaries in the community arm.
After matching, we observe a high level of overlap in the distribution of estimated propensity scores across treatment and comparison groups.
In the matched sample, we are able to obtain balance on demographic characteristics, comorbidities, and prior-year utilization. Overall, the chart indicates that propensity score matching greatly improved the comparability of the treatment and comparison groups.
Exhibit D.J-CHiP.5: Common Support and Covariate Balance for J-CHiP and Comparison Participants, Medicare
Impact of J-CHiP Community Arm in Each Quarter of Enrollment, Medicare Analysis. Findings from quarterly fixed effects DID models of impact in each intervention quarter for hospitalizations, ED visits, readmissions, and ACS hospitalizations are consistent with the average quarterly impacts summarized in the awardee chapter. Exhibit D.J-CHiP.6 displays the results of the quarterly fixed effects DID models.253 Findings from the QFE model for total cost of care departed from the matched quarterly and aggregate results and thus we present and discuss them in the awardee chapter.
253 For utilization and quality of care measures, the effect is displayed as the average difference between treatment and comparison, per 1,000 beneficiaries (and 90 percent confidence intervals) for each quarter during the post-intervention (I1—11) period, after adjusting for pre-intervention differences between the two groups. We present both 90% confidence intervals (indicated by vertical lines around the estimate) and 80% confidence intervals (indicated by shaded boxes around the estimate). Results are interpreted as significant where p<0.10. One fewer quarter is shown for 30-day readmissions due to small sample size in the last quarter.

NORC | HCIA Complex/High-Risk Patient Targeting
ADDENDUM TO THE THIRD ANNUAL REPORT | 195
Exhibit D.J-CHiP.6: Impact of the J-CHiP Community Arm on Medicare Outcomes by Quarter
Disclaimer: Standard statistical practice is to use confidence intervals of 90% or higher. 80% confidence intervals are provided here for comparison purposes.
Community Arm, Medicaid Analysis
Exhibits D.J-CHiP.7 and D.J-CHiP.8 present common support and covariate balance across treatment and comparison groups for dually eligible and non-dually eligible Medicaid beneficiaries in the community arm.
After matching, we observe a high level of overlap in the distribution of estimated propensity scores across treatment and comparison groups.
In the matched sample, we are able to obtain balance on demographic characteristics, comorbidities, and prior-year utilization. Overall, the chart indicates that propensity score matching greatly improved the comparability of the treatment and comparison groups.

NORC | HCIA Complex/High-Risk Patient Targeting
ADDENDUM TO THE THIRD ANNUAL REPORT | 196
Exhibit D.J-CHiP.7: Common Support and Covariate Balance for Dually Eligible and Comparison Participants, Medicaid Analysis
Exhibit D.J-CHiP.8: Common Support and Covariate Balance for Medicaid Only and Comparison Participants, Medicaid Analysis
Impact of J-CHiP Community Arm in Each Quarter of Enrollment, Medicaid Analysis. Findings from pooled quarterly fixed effects DID models of impact in each intervention quarter are consistent with the average quarterly impacts summarized in the awardee chapter. Exhibit D.J-CHiP.9 displays the results of the quarterly fixed effects DID models.254
254 For utilization and quality of care measures, the effect is displayed as the average difference between treatment and comparison, per 1,000 beneficiaries (and 90 and 80 percent confidence intervals) for each quarter during the post-intervention (I1—I9) period, after adjusting for pre-intervention differences between the two groups. For total cost of care, this effect is displayed per beneficiary. One fewer quarter is shown for readmissions due to small sample size.

NORC | HCIA Complex/High-Risk Patient Targeting
ADDENDUM TO THE THIRD ANNUAL REPORT | 197
Exhibit D.J-CHiP.9: Impact of the J-CHiP Community Arm on Medicaid Outcomes by Quarter
Disclaimer: Standard statistical practice is to use confidence intervals of 90% or higher. 80% confidence intervals are provided here for comparison purposes.

NORC | HCIA Complex/High-Risk Patient Targeting
ADDENDUM TO THE THIRD ANNUAL REPORT | 198
Hospital to Community Crossover Analysis, Medicaid
Exhibits D.J-CHiP.10 and D.J-CHiP.11 present common support and covariate balance across treatment and comparison groups for dually eligible and non-dually eligible Medicaid beneficiaries, respectively, in the hospital to community crossover analysis.
■ After weighting, we observe a high level of overlap in the distribution of estimated propensityscores across treatment and comparison groups.
■ In the weighted sample, we are able to obtain balance on demographic characteristics,comorbidities, and prior-year utilization. Overall, the chart indicates that propensity scoreweighting greatly improved the comparability of the treatment and comparison groups.
Exhibit D.J-CHiP.10: Common Support and Covariate Balance for Dually Eligible J-CHiP and Comparison Beneficiary-Episodes, Hospital to Community Crossover Analysis, Medicaid

NORC | HCIA Complex/High-Risk Patient Targeting
ADDENDUM TO THE THIRD ANNUAL REPORT | 199
Exhibit D.J-CHiP.11: Common Support and Covariate Balance for Non-dually Eligible J-CHiP and Comparison Beneficiary-Episodes, Hospital to Community Crossover Analysis, Medicaid
J-CHiP Subgroup Analyses
Impact of J-CHiP, Community Arm, Medicare, Dose. Exhibit D.J-CHiP.12 present results of impacts enrollees for participants who had and did not have continuous (quarterly) contact with program staff.255 We find the following, relative to the comparison group:
■ Cost: Non-significant increases in total cost of care each quarter for those with continuouscontact and those without continuous contact.
255 Due to small sample size in each quarter, we estimated average quarterly impacts using a summative DID model that examines the impact of the awardee across the entire post-intervention period. For the summative DID model, we compare the average outcomes of participants in the J-CHiP program with those of the comparison groups across the entire post-intervention period, after adjusting for differences in secular trends and risk factors across both groups. Adjustment factors are: post-intervention indicator, age category, gender, race/ethnicity, dual eligibility indicator, HCC Risk score, discharge category, a disability indicator, and an ESRD indicator. We excluded beneficiaries from the analysis if the case was closed.
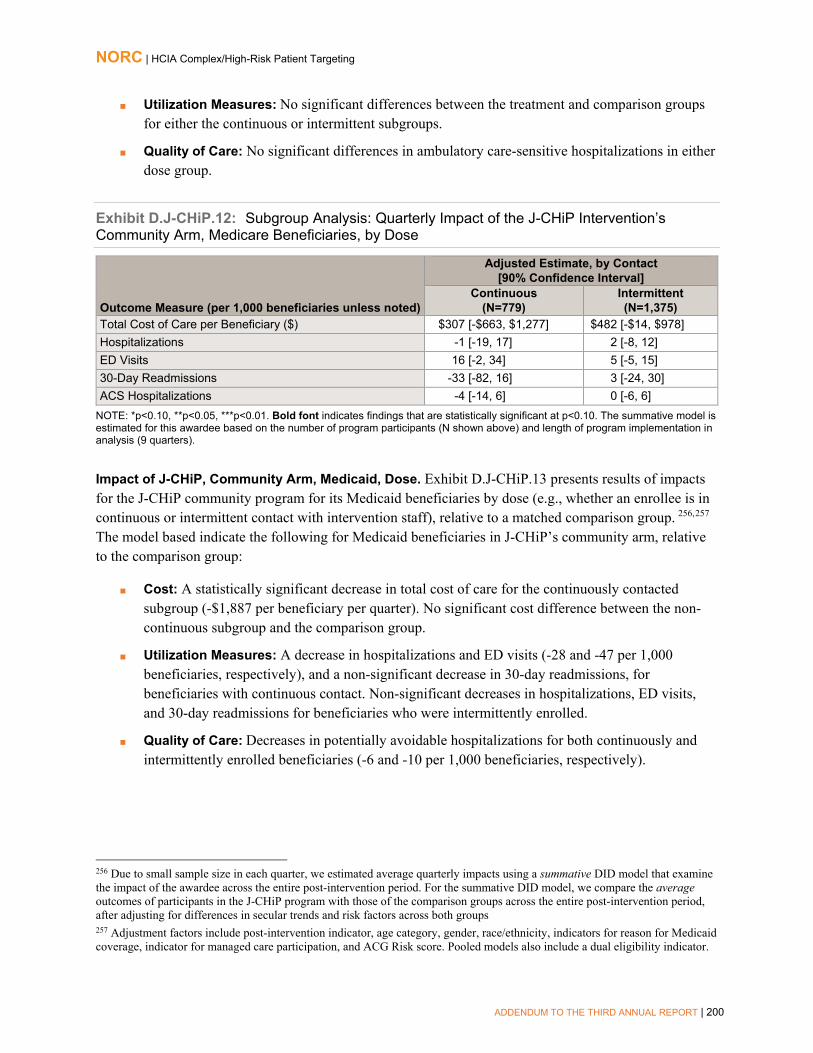
NORC | HCIA Complex/High-Risk Patient Targeting
ADDENDUM TO THE THIRD ANNUAL REPORT | 200
■ Utilization Measures: No significant differences between the treatment and comparison groupsfor either the continuous or intermittent subgroups.
■ Quality of Care: No significant differences in ambulatory care-sensitive hospitalizations in eitherdose group.
Exhibit D.J-CHiP.12: Subgroup Analysis: Quarterly Impact of the J-CHiP Intervention’s Community Arm, Medicare Beneficiaries, by Dose
Outcome Measure (per 1,000 beneficiaries unless noted)
Adjusted Estimate, by Contact [90% Confidence Interval]
Continuous (N=779)
Intermittent (N=1,375)
Total Cost of Care per Beneficiary ($) $307 [-$663, $1,277] $482 [-$14, $978] Hospitalizations -1 [-19, 17] 2 [-8, 12] ED Visits 16 [-2, 34] 5 [-5, 15] 30-Day Readmissions -33 [-82, 16] 3 [-24, 30] ACS Hospitalizations -4 [-14, 6] 0 [-6, 6]
NOTE: *p<0.10, **p<0.05, ***p<0.01. Bold font indicates findings that are statistically significant at p<0.10. The summative model is estimated for this awardee based on the number of program participants (N shown above) and length of program implementation in analysis (9 quarters).
Impact of J-CHiP, Community Arm, Medicaid, Dose. Exhibit D.J-CHiP.13 presents results of impacts for the J-CHiP community program for its Medicaid beneficiaries by dose (e.g., whether an enrollee is in continuous or intermittent contact with intervention staff), relative to a matched comparison group. 256,257
The model based indicate the following for Medicaid beneficiaries in J-CHiP’s community arm, relative to the comparison group:
■ Cost: A statistically significant decrease in total cost of care for the continuously contactedsubgroup (-$1,887 per beneficiary per quarter). No significant cost difference between the non-continuous subgroup and the comparison group.
■ Utilization Measures: A decrease in hospitalizations and ED visits (-28 and -47 per 1,000beneficiaries, respectively), and a non-significant decrease in 30-day readmissions, forbeneficiaries with continuous contact. Non-significant decreases in hospitalizations, ED visits,and 30-day readmissions for beneficiaries who were intermittently enrolled.
■ Quality of Care: Decreases in potentially avoidable hospitalizations for both continuously andintermittently enrolled beneficiaries (-6 and -10 per 1,000 beneficiaries, respectively).
256 Due to small sample size in each quarter, we estimated average quarterly impacts using a summative DID model that examine the impact of the awardee across the entire post-intervention period. For the summative DID model, we compare the average outcomes of participants in the J-CHiP program with those of the comparison groups across the entire post-intervention period, after adjusting for differences in secular trends and risk factors across both groups 257 Adjustment factors include post-intervention indicator, age category, gender, race/ethnicity, indicators for reason for Medicaid coverage, indicator for managed care participation, and ACG Risk score. Pooled models also include a dual eligibility indicator.
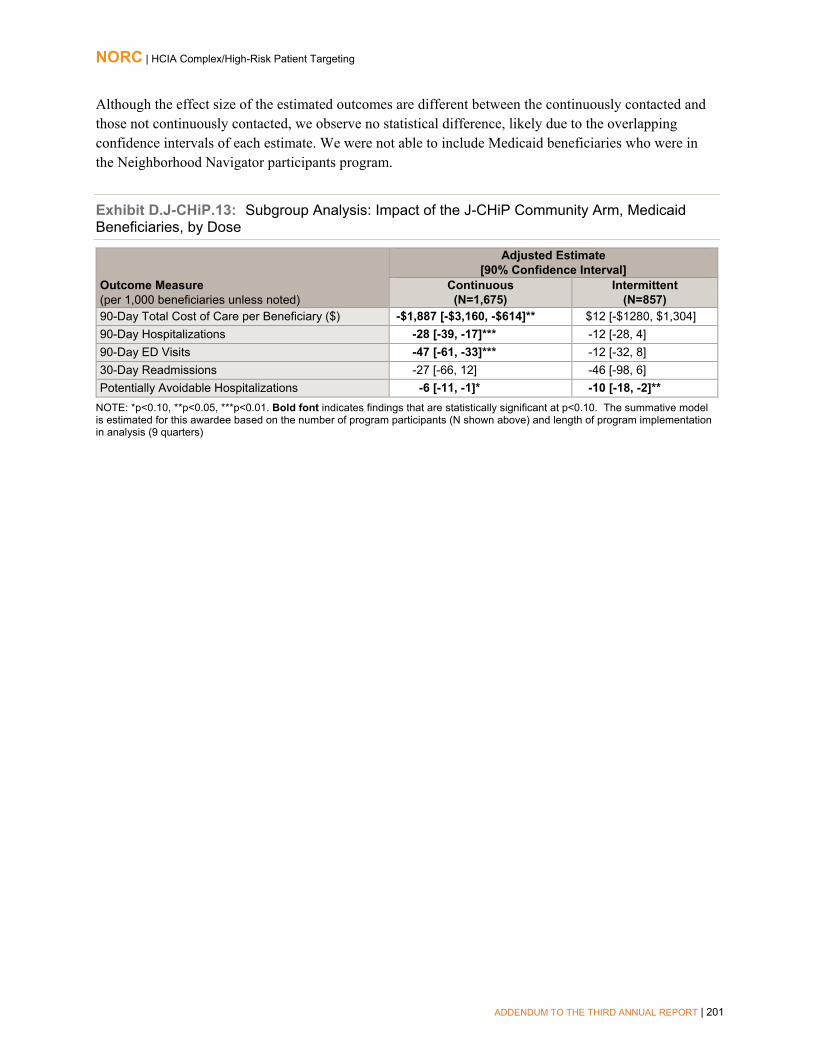
NORC | HCIA Complex/High-Risk Patient Targeting
ADDENDUM TO THE THIRD ANNUAL REPORT | 201
Although the effect size of the estimated outcomes are different between the continuously contacted and those not continuously contacted, we observe no statistical difference, likely due to the overlapping confidence intervals of each estimate. We were not able to include Medicaid beneficiaries who were in the Neighborhood Navigator participants program.
Exhibit D.J-CHiP.13: Subgroup Analysis: Impact of the J-CHiP Community Arm, Medicaid Beneficiaries, by Dose
Outcome Measure (per 1,000 beneficiaries unless noted)
Adjusted Estimate [90% Confidence Interval]
Continuous (N=1,675)
Intermittent (N=857)
90-Day Total Cost of Care per Beneficiary ($) -$1,887 [-$3,160, -$614]** $12 [-$1280, $1,304] 90-Day Hospitalizations -28 [-39, -17]*** -12 [-28, 4] 90-Day ED Visits -47 [-61, -33]*** -12 [-32, 8] 30-Day Readmissions -27 [-66, 12] -46 [-98, 6] Potentially Avoidable Hospitalizations -6 [-11, -1]* -10 [-18, -2]**
NOTE: *p<0.10, **p<0.05, ***p<0.01. Bold font indicates findings that are statistically significant at p<0.10. The summative model is estimated for this awardee based on the number of program participants (N shown above) and length of program implementation in analysis (9 quarters)

NORC | HCIA Complex/High-Risk Patient Targeting
ADDENDUM TO THE THIRD ANNUAL REPORT | 202
Johns Hopkins University School of Nursing
Exhibit D.JHUSON.1 presents common support and covariate balance across treatment and comparison groups.
■ After matching, we observe nearly identical overlap in the density curves for propensity scores inthe treatment and comparison groups.
■ In the matched sample, we are able to obtain balance on demographic covariates, comorbidities,and prior year utilization measures (hospitalizations and ED visits) and cost. Overall, the chartindicates that propensity score matching greatly improved the comparability of the treatment andcomparison group.
Exhibit D.JHUSON.1: Test of Common Support and Covariate Balance, Project CAPABLE, Medicare
Impact of Project CAPABLE Program in Each Quarter of Enrollment, Medicare Analysis. Findings from the quarterly fixed effects (QFE) DID model of impact in each intervention quarter for ED visits are consistent with average quarterly impacts summarized in the awardee chapter. 258 Exhibit D.JHUSON.2 displays the results of the QFE DID models.259 Findings from the QFE models for total cost of care, hospitalizations, 30-day readmissions, and ACS hospitalizations departed from the quarterly and aggregate results, and thus we present and discuss them in the awardee chapter.
258 For a more detailed explanation of the QFE DID model and measure specification, please see NORC’s Third Annual Report, Appendix C. 259 The effect is displayed as the average difference between treatment and comparison, per 1,000 beneficiaries (and 90 percent confidence interval) for each quarter during the post-intervention (I1—I12) period, after adjusting for pre-intervention differences between the two groups. We present both 90% confidence intervals (indicated by vertical lines around the estimate) and 80% confidence intervals (indicated by shaded boxes around the estimate). Results are interpreted as significant where p<0.10.

NORC | HCIA Complex/High-Risk Patient Targeting
ADDENDUM TO THE THIRD ANNUAL REPORT | 203
Exhibit D.JHUSON.2: Impact of the Project CAPABLE Program on Outcomes for Medicare Beneficiaries, by Quarter
ED Visits (per 1,000 Beneficiaries)
Disclaimer: Standard statistical practice is to use confidence intervals of 90% or higher. 80% confidence intervals are provided here for comparison purposes.
Supplemental Appendix- JHUSON, Medicaid Analysis
Exhibit D.JHUSON.3 presents common support and covariate balance across treatment and comparison groups.
■ After matching, we observe nearly identical overlap in the density curves for propensity scores inthe treatment and comparison groups.
■ In the matched sample, we are able to obtain balance on demographic covariates, CDPS riskscore, and prior year utilization measures (hospitalizations and ED visits) and cost. Overall, thechart indicates that propensity score matching greatly improved the comparability of thetreatment and comparison group.
Exhibit D.JHUSON.3: Test of Common Support and Covariate Balance, Project CAPABLE Medicaid

NORC | HCIA Complex/High-Risk Patient Targeting
ADDENDUM TO THE THIRD ANNUAL REPORT | 204
Impact of Project CAPABLE Program in Each Quarter of Enrollment, Medicaid. Findings from a quarterly fixed effects (QFE) DID model of impact in each intervention quarter for total cost of care are consistent with average quarterly impacts summarized in the awardee chapter. Exhibit D.JHUSON.4 displays the results of the QFE DID models.260,261 Findings from the QFE models for hospitalizations and ED visits departed from the quarterly and aggregate results, and thus we present and discuss them in the awardee chapter.
Exhibit D.JHUSON.4: Impact of the Project CAPABLE Program on Outcomes for Medicaid Beneficiaries, by Quarter
Cost per Beneficiary ($)
Disclaimer: Standard statistical practice is to use confidence intervals of 90% or higher. 80% confidence intervals are provided here for comparison purposes.
260 For a more detailed explanation of the QFE DID model and measure specification, please see NORC’s Third Annual Report, Appendix C. 261 The effect is displayed as the average difference between treatment and comparison, per beneficiary for each quarter during the post-intervention (I1—I8) period, after adjusting for pre-intervention differences between the two groups. We present both 90% confidence intervals (indicated by vertical lines around the estimate) and 80% confidence intervals (indicated by shaded boxes around the estimate). Results are interpreted as significant where p<0.10.

NORC | HCIA Complex/High-Risk Patient Targeting
ADDENDUM TO THE THIRD ANNUAL REPORT | 205
LifeLong Medical Care
Exhibit D.LCCI.1 presents common support and covariate balance across treatment and comparison groups.
■ After matching, we observe nearly identical overlap in the density curves for propensity scores inthe treatment and comparison groups.
■ In the matched sample, we are able to obtain balance on demographic covariates, comorbidities,and prior year utilization measures (hospitalizations and ED visits). Although we were not able toachieve balance on the prior year hospitalization measure, overall, the chart indicates thatpropensity score matching greatly improved the comparability of the treatment and comparisongroup.
Exhibit D.LCCI.1: Test of Common Support and Covariate Balance, LCCI Program
Impact of LCCI Program in Each Quarter of Enrollment. Findings from quarterly fixed effects (QFE) DID model of impact for total cost of care and ED visits are consistent with the average quarterly impact summarized in the awardee chapter. Exhibit D.LCCI.2 displays the results of the QFE DID models.262,263 We observe two quarters in which LCCI participants had a significantly lower ED visit rate (I3, I8), and three quarters in which LCCI participants had significantly lower total cost of care (I5, I7-I8).
262 For a more detailed explanation of the QFE DID model and measure specification, please see NORC’s Third Annual Report, Appendix C. 263 For both measures, the effect is displayed as the average difference between treatment and comparison per 1,000 beneficiaries for each quarter during the post-intervention (I1–I9) period, after adjusting for pre-intervention differences between the two groups. We present both 90% confidence intervals (indicated by vertical lines around the estimate) and 80% confidence intervals (indicated by shaded boxes around the estimate). Results are interpreted as significant where p<0.10.
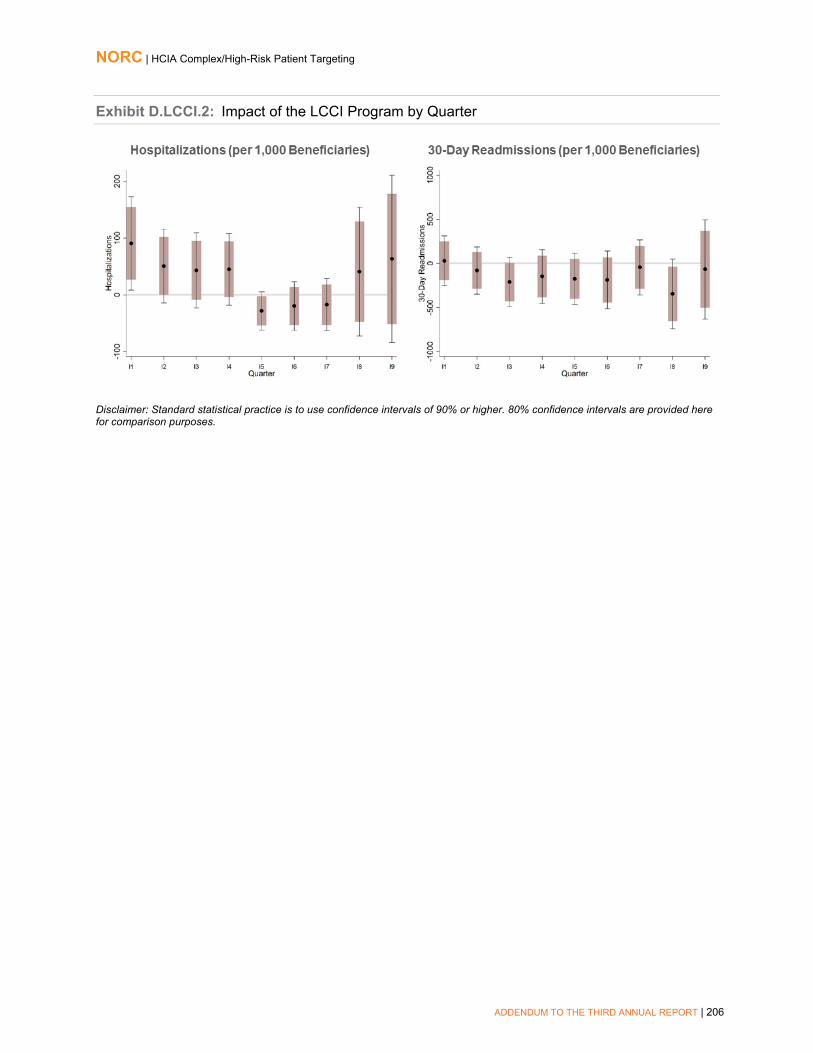
NORC | HCIA Complex/High-Risk Patient Targeting
ADDENDUM TO THE THIRD ANNUAL REPORT | 206
Exhibit D.LCCI.2: Impact of the LCCI Program by Quarter
Disclaimer: Standard statistical practice is to use confidence intervals of 90% or higher. 80% confidence intervals are provided here for comparison purposes.

NORC | HCIA Complex/High-Risk Patient Targeting
ADDENDUM TO THE THIRD ANNUAL REPORT | 207
Northland Healthcare Alliance
Exhibit D.NCCS.1 presents common support and covariate balance across treatment and comparison groups.
■ After matching, we observe close overlap in the density curves for propensity scores in thetreatment and comparison groups.
■ In the matched sample, we are able to obtain balance on demographic covariates, comorbidities,and prior year utilization measures. Overall, the chart indicates that propensity score matchinggreatly improved the comparability of the treatment and comparison group.
Exhibit D.NCCS.1: Test of Common Support and Covariate Balance, NCCS Program
Impact of NCCS in Each Quarter of Enrollment. Findings from a quarterly fixed-effects (QFE) DID model of impact are consistent with the average quarterly impact summarized in the awardee chapter.264 Exhibit D.NCCS.2 displays the results of the QFE DID models. 265
264 For a more detailed explanation of the QFE DID model and measure specification, please see NORC’s Third Annual Report, Appendix C. 265 For utilization and quality of care measures, the effect is displayed as the average difference between treatment and comparison per 1,000 beneficiaries for each quarter during the post-intervention (I1–I11) period, after adjusting for pre-intervention differences between the two groups. For total cost of care, this effect is displayed per beneficiary. We present both 90% confidence intervals (indicated by vertical lines around the estimate) and 80% confidence intervals (indicated by shaded boxes around the estimate).

NORC | HCIA Complex/High-Risk Patient Targeting
ADDENDUM TO THE THIRD ANNUAL REPORT | 208
Exhibit D.NCCS.2: Impact of the NCCS Program by Quarter
Disclaimer: Standard statistical practice is to use confidence intervals of 90% or higher. 80% confidence intervals are provided here for comparison purposes.
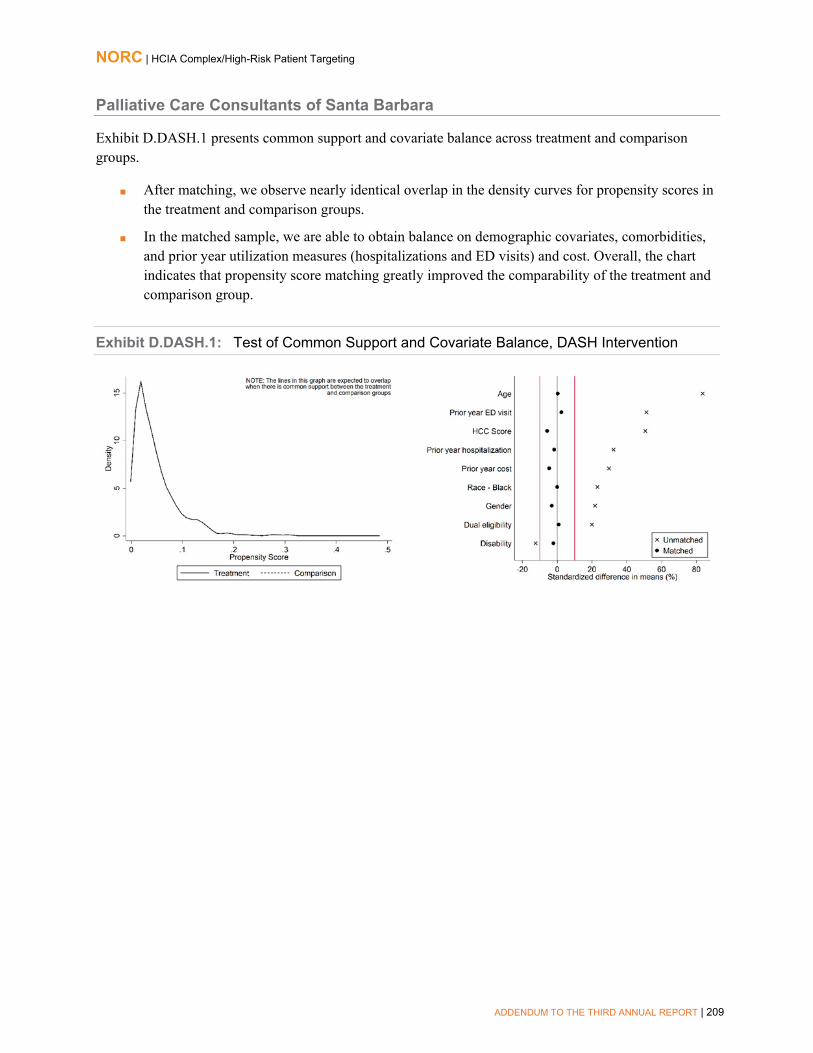
NORC | HCIA Complex/High-Risk Patient Targeting
ADDENDUM TO THE THIRD ANNUAL REPORT | 209
Palliative Care Consultants of Santa Barbara
Exhibit D.DASH.1 presents common support and covariate balance across treatment and comparison groups.
■ After matching, we observe nearly identical overlap in the density curves for propensity scores inthe treatment and comparison groups.
■ In the matched sample, we are able to obtain balance on demographic covariates, comorbidities,and prior year utilization measures (hospitalizations and ED visits) and cost. Overall, the chartindicates that propensity score matching greatly improved the comparability of the treatment andcomparison group.
Exhibit D.DASH.1: Test of Common Support and Covariate Balance, DASH Intervention

NORC | HCIA Complex/High-Risk Patient Targeting
ADDENDUM TO THE THIRD ANNUAL REPORT | 210
Pittsburgh Regional Health Initiative
Exhibit D.PRHI.1 presents common support and covariate balance across treatment and comparison groups.
■ After weighting, we observe close overlap in the density curves for propensity scores in thetreatment and comparison groups in the post-intervention period.
■ In the weighted sample, we are able to obtain balance on demographic covariates, comorbidities,and prior year cost. Overall, the chart indicates that propensity score matching greatly improvedthe comparability of the treatment and comparison group.
Exhibit D.PRHI.1: Test of Common Support and Covariate Balance, PCRC Program
Impact of PCRC Program in Each Quarter of Enrollment. Findings from a quarterly fixed effects (QFE) DID model of impact are consistent with the average quarterly impact summarized in the awardee chapter. 266 Exhibit D.PRHI.2 displays the results of the QFE DID model.267
266 For a more detailed explanation of the QFE DID model and measure specification, please refer to NORC’s Third Annual Report, Appendix C. 267 For utilization and quality of care measures, the effect is displayed as the average difference between treatment and comparison per 1,000 beneficiary-episodes (and 90 percent confidence interval) for each quarter during the post-intervention (I1-I12) period, after adjusting for pre-intervention differences between the two groups. For total cost of care, this effect is displayed per beneficiary.

NORC | HCIA Complex/High-Risk Patient Targeting
ADDENDUM TO THE THIRD ANNUAL REPORT | 211
Exhibit D.PRHI.2: Impact of the PCRC Intervention on Outcomes, by Quarter

NORC | HCIA Complex/High-Risk Patient Targeting
ADDENDUM TO THE THIRD ANNUAL REPORT | 212
Disclaimer: Standard statistical practice is to use confidence intervals of 90% or higher. 80% confidence intervals are provided here for comparison purposes.

NORC | HCIA Complex/High-Risk Patient Targeting
ADDENDUM TO THE THIRD ANNUAL REPORT | 213
Providence Portland Medical Center
Health Resilience Program (HRP) Analysis
Exhibit D.PPMC.1 presents common support and covariate balance across Health Resilience Program treatment and comparison group beneficiaries.
■ After matching, we observe nearly identical overlap in the density curves for propensity scores in thetreatment and comparison groups.
■ In the matched sample, we are able to obtain balance on demographic covariates, comorbidities, andprior-year costs. Although we were not able to achieve balance on prior year utilization and the highutilizer indicator, overall, the chart indicates that propensity score weighting greatly improved thecomparability of the treatment and comparison group.
Exhibit D.PPMC.1: Test of Common Support and Covariate Balance, PPMC Health Resilience Program
Impact of Health Resilience Program in Each Quarter of Enrollment. Findings from quarterly fixed effects DID models of impact in each intervention quarter are consistent with the average quarterly impacts summarized in the awardee chapter. Exhibit D.PPMC.2 displays the results of the quarterly fixed effects DID models. 268
268 For utilization measures, the effect is displayed as the average difference between treatment and comparison, per 1,000 beneficiaries for each quarter during the post-intervention (I1-I11) period, after adjusting for pre-intervention differences between the two groups. For total cost of care, this effect is displayed per beneficiary. We present both 90% confidence intervals (indicated by vertical lines around the estimate) and 80% confidence intervals (indicated by shaded boxes around the estimate).

NORC | HCIA Complex/High-Risk Patient Targeting
ADDENDUM TO THE THIRD ANNUAL REPORT | 214
Exhibit D.PPMC.2: Impact of the PPMC Health Resilience Program, by Quarter
Disclaimer: Standard statistical practice is to use confidence intervals of 90% or higher. 80% confidence intervals are provided here for comparison purposes.
New Directions Program Analysis
Exhibit D.PPMC.3 presents common support and covariate balance across New Directions Program treatment and comparison group beneficiaries.
■ After matching, we observe nearly identical overlap in the density curves for propensity scores inthe treatment and comparison groups.
■ In the matched sample, although we were not able to achieve balance on several covariates,including prior year utilization, the chart indicates that propensity score matching greatlyimproved the comparability of the treatment and comparison group.
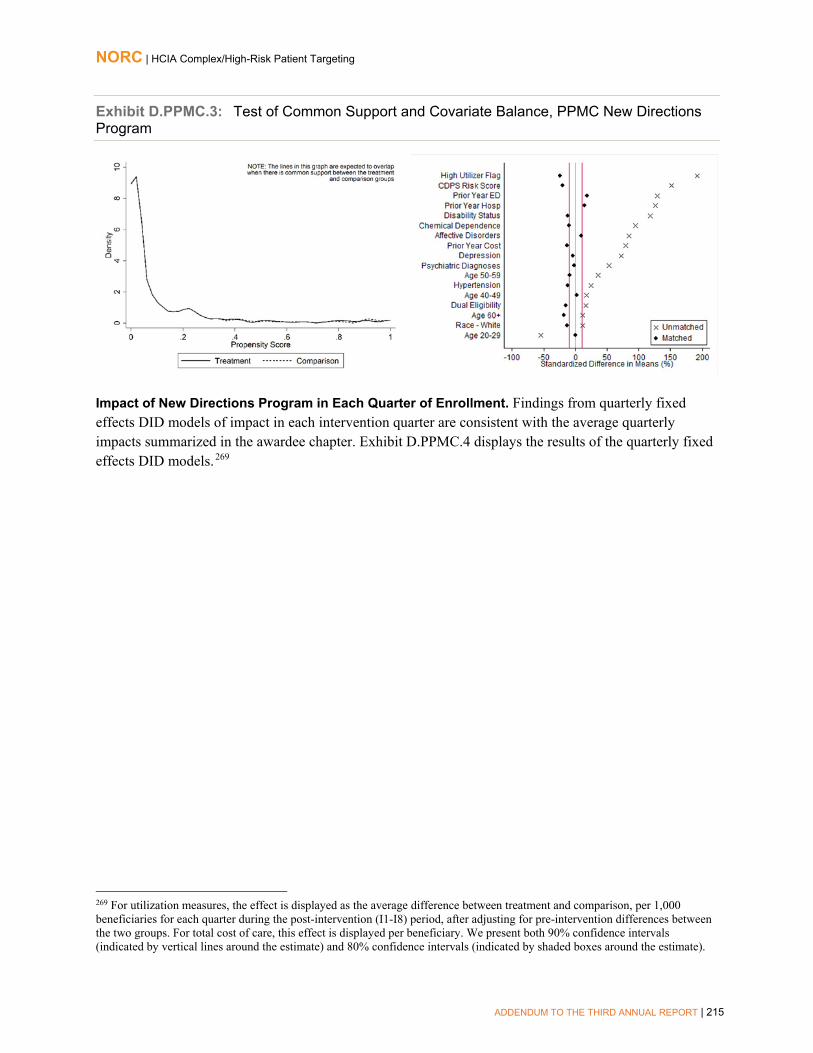
NORC | HCIA Complex/High-Risk Patient Targeting
ADDENDUM TO THE THIRD ANNUAL REPORT | 215
Exhibit D.PPMC.3: Test of Common Support and Covariate Balance, PPMC New Directions Program
Impact of New Directions Program in Each Quarter of Enrollment. Findings from quarterly fixed effects DID models of impact in each intervention quarter are consistent with the average quarterly impacts summarized in the awardee chapter. Exhibit D.PPMC.4 displays the results of the quarterly fixed effects DID models. 269
269 For utilization measures, the effect is displayed as the average difference between treatment and comparison, per 1,000 beneficiaries for each quarter during the post-intervention (I1-I8) period, after adjusting for pre-intervention differences between the two groups. For total cost of care, this effect is displayed per beneficiary. We present both 90% confidence intervals (indicated by vertical lines around the estimate) and 80% confidence intervals (indicated by shaded boxes around the estimate).

NORC | HCIA Complex/High-Risk Patient Targeting
ADDENDUM TO THE THIRD ANNUAL REPORT | 216
Exhibit D.PPMC.4: Impact of the PPMC New Directions Program, by Quarter
Disclaimer: Standard statistical practice is to use confidence intervals of 90% or higher. 80% confidence intervals are provided here for comparison purposes.
ED Guides Program Analysis
Exhibit D.PPMC.5 presents common support and covariate balance across ED Guides Program treatment and comparison group beneficiaries.
■ After matching, we observe nearly identical overlap in the density curves for propensity scores in thetreatment and comparison groups.
■ In the matched sample, we are able to obtain balance on demographic covariates, comorbidities, andprior year utilization measures (hospitalizations and ED visits). Overall, the charts indicates thatpropensity score matching greatly improved the comparability of the treatment and comparisongroup.

NORC | HCIA Complex/High-Risk Patient Targeting
ADDENDUM TO THE THIRD ANNUAL REPORT | 217
Exhibit D.PPMC.5: Test of Common Support and Covariate Balance, PPMC ED Guides Program
Impact of ED Guides Program in Each Quarter of Enrollment. Findings from quarterly fixed effects DID models of impact in each intervention quarter are consistent with the average quarterly impacts summarized in the awardee chapter. Exhibit D.PPMC.6 displays the results of the quarterly fixed effects DID models. 270
270 For utilization measures, the effect is displayed as the average difference between treatment and comparison, per 1,000 beneficiaries for each quarter during the post-intervention (I1-I2) period, after adjusting for pre-intervention differences between the two groups. For total cost of care, this effect is displayed per beneficiary. We present both 90% confidence intervals (indicated by vertical lines around the estimate) and 80% confidence intervals (indicated by shaded boxes around the estimate).

NORC | HCIA Complex/High-Risk Patient Targeting
ADDENDUM TO THE THIRD ANNUAL REPORT | 218
Exhibit D.PPMC.6: Impact of the PPMC ED Guides Program, by Quarter
Disclaimer: Standard statistical practice is to use confidence intervals of 90% or higher. 80% confidence intervals are provided here for comparison purposes.
Impact of the PPMC ED Guides Program, All Quarters. Exhibit D.PPMC.7 displays the average quarterly and aggregate impact of ED Guides on its participants relative to the comparison group, across all ten quarters of available post-intervention data.271 Utilization measures are reported as counts, noting the number of occurrences of an event in each quarter for a specific beneficiary. We find the following, relative to the comparison group:
■ Cost: A non-significant increase in total cost of care.
■ Utilization Measures: Significant increases in hospitalizations (20 per 1,000 beneficiaries perquarter) and ED visits (542 per 1,000 beneficiaries per quarter).
271 Adjustment factors include age, race, gender, dual eligibility, disability eligibility, CDPS risk score, high utilizer flag, asthma, CHF, COPD, depression, diabetes, and liver disease. Results are interpreted as significant when p<0.10.

NORC | HCIA Complex/High-Risk Patient Targeting
ADDENDUM TO THE THIRD ANNUAL REPORT | 219
Exhibit D.PPMC.7: Impact of the PPMC ED Guides Program on Outcomes
AVERAGE QUARTERLY IMPACT§ Outcome Measure (per 1,000 beneficiary-episodes unless noted)
Adjusted Estimate 90% Confidence Interval
80% Confidence Interval
Total Cost of Care per beneficiary ($) $1 -$94, $96 -$73, 75 Hospitalizations 20*** 8, 32 11, 29 ED Visits -542*** -596, -488 -584, -500
AGGREGATE IMPACT§§
Outcome Measure Adjusted Estimate 90% Confidence Interval
80% Confidence Interval
Total Cost of Care ($) $17,504 -$1,845,671, $1,880,679 -$1,434,526, 1,469,534 Hospitalizations 403*** 173, 633 224, 582 ED Visits -10,689*** -11,748, -9,630 -11,514, -9,864
NOTE: +p<0.20, *p<0.10, **p<0.05, ***p<0.01. Bold font indicates findings that are statistically significant at p<0.10. §Quarterly impact is the average quarterly DID estimate per quarter of program implementation. §§Aggregate impact is the total DID estimate for all program participants across all quarters of program implementation. Aggregate impact is estimated for this awardee based on the total number of program participants (4,822), with an average length of program enrollment of 4.1 quarters. Disclaimer: Standard statistical practice is to use confidence intervals of 90% or higher. 80% confidence intervals are provided here for comparison purposes.
Impact of ED Guides Program in Each Quarter of Enrollment. All Quarters. Findings from quarterly fixed effects DID models of impact in each intervention quarter are consistent with the average quarterly impacts summarized above. Exhibit D.PPMC.8 displays the results of the quarterly fixed effects DID models.272
272 For utilization measures, the effect is displayed as the average difference between treatment and comparison, per 1,000 beneficiaries for each quarter during the post-intervention (I1-I10) period, after adjusting for pre-intervention differences between the two groups. For total cost of care, this effect is displayed per beneficiary. We present both 90% confidence intervals (indicated by vertical lines around the estimate) and 80% confidence intervals (indicated by shaded boxes around the estimate).

NORC | HCIA Complex/High-Risk Patient Targeting
ADDENDUM TO THE THIRD ANNUAL REPORT | 220
Exhibit D.PPMC.8: Impact of the PPMC ED Guides Program, by Quarter
Disclaimer: Standard statistical practice is to use confidence intervals of 90% or higher. 80% confidence intervals are provided here for comparison purposes.
Standard Transitions Program Analysis
Exhibit D.PPMC.9 presents common support and covariate balance across Standard Transitions Program treatment and comparison group beneficiaries.
■ After matching, we observe nearly identical overlap in the density curves for propensity scores inthe treatment and comparison groups.
■ In the matched sample, we are able to obtain balance on demographic covariates, comorbidities,and prior year utilization measures (hospitalizations and ED visits) and costs. Overall, the chartindicates that propensity score matching greatly improved the comparability of the treatment andcomparison group.

NORC | HCIA Complex/High-Risk Patient Targeting
ADDENDUM TO THE THIRD ANNUAL REPORT | 221
Exhibit D.PPMC.9: Test of Common Support and Covariate Balance, PPMC Standard Transitions Program
Impact of Standard Transitions Program in Each Quarter of Enrollment. Findings from quarterly fixed effects DID models of impact in each intervention quarter are consistent with the average quarterly impacts summarized in the awardee chapter. Exhibit D.PPMC.10 displays the results of the quarterly fixed effects DID models. 273
273 For utilization measures, the effect is displayed as the average difference between treatment and comparison, per 1,000 beneficiaries for each quarter during the post-intervention (I1-I2) period, after adjusting for pre-intervention differences between the two groups. For total cost of care, this effect is displayed per beneficiary. We present both 90% confidence intervals (indicated by vertical lines around the estimate) and 80% confidence intervals (indicated by shaded boxes around the estimate).

NORC | HCIA Complex/High-Risk Patient Targeting
ADDENDUM TO THE THIRD ANNUAL REPORT | 222
Exhibit D.PPMC.10: Impact of the PPMC Standard Transitions Program, by Quarter
Disclaimer: Standard statistical practice is to use confidence intervals of 90% or higher. 80% confidence intervals are provided here for comparison purposes.
Impact of the PPMC Standard Transitions Program, All Quarters. Exhibit D.PPMC.11 displays the average quarterly and aggregate impact of the Standard Transitions Program on its participants relative to the comparison group, across all nine quarters of available post-intervention data.274 Utilization measures are reported as counts, noting the number of occurrences of an event in each quarter for a specific beneficiary. We find the following, relative to the comparison group:
■ Cost: A significant increase in total cost of care ($341 per beneficiary per quarter).
■ Utilization Measures: Significant increases in hospitalizations (45 per 1,000 beneficiaries perquarter) and ED visits (102 per 1,000 beneficiaries per quarter).
274 Adjustment factors include age, race, gender, dual eligibility, disability eligibility, CDPS risk score, high utilizer flag, asthma, CHF, COPD, depression, diabetes, and liver disease. Results are interpreted as significant when p<0.10.

NORC | HCIA Complex/High-Risk Patient Targeting
ADDENDUM TO THE THIRD ANNUAL REPORT | 223
Exhibit D.PPMC.11: Impact of the PPMC Standard Transitions Program on Outcomes
AVERAGE QUARTERLY IMPACT§ Outcome Measure (per 1,000 beneficiary-episodes unless noted)
Adjusted Estimate 90% Confidence
Interval 80% Confidence
Interval
Total Cost of Care per beneficiary ($) $341*** $165, $517 $204, $478 Hospitalizations 45*** 22, 68 27, 63 ED Visits 102*** 40, 164 53, 151
AGGREGATE IMPACT§§
Outcome Measure Adjusted Estimate 90% Confidence Interval
80% Confidence Interval
Total Cost of Care ($) $4,214,861*** $2,032,221, $6,397,501 $2,513,861, $5,915,861
Hospitalizations 562*** 281, 843 343, 781 ED Visits 1261*** 486, 2,036 657, 1,865
NOTE: +p<0.20, *p<0.10, **p<0.05, ***p<0.01. Bold font indicates findings that are statistically significant at p<0.10. §Quarterly impact is the average quarterly DID estimate per quarter of program implementation. §§Aggregate impact is the total DID estimate for all program participants across all quarters of program implementation. Aggregate impact is estimated for this awardee based on the total number of program participants (3,705), with an average length of program enrollment of 3.3 quarters. Disclaimer: Standard statistical practice is to use confidence intervals of 90% or higher. 80% confidence intervals are provided here for comparison purposes.
Impact of Standard Transitions Program in Each Quarter of Enrollment, All Quarters. Findings from quarterly fixed effects DID models of impact in each intervention quarter are consistent with the average quarterly impacts summarized above. Exhibit D.PPMC.12 displays the results of the quarterly fixed effects DID models. 275
275 For utilization measures, the effect is displayed as the average difference between treatment and comparison, per 1,000 beneficiaries for each quarter during the post-intervention (I1-I9) period, after adjusting for pre-intervention differences between the two groups. For total cost of care, this effect is displayed per beneficiary. We present both 90% confidence intervals (indicated by vertical lines around the estimate) and 80% confidence intervals (indicated by shaded boxes around the estimate).

NORC | HCIA Complex/High-Risk Patient Targeting
ADDENDUM TO THE THIRD ANNUAL REPORT | 224
Exhibit D.PPMC.12: Impact of the PPMC Standard Transitions Program, by Quarter
Disclaimer: Standard statistical practice is to use confidence intervals of 90% or higher. 80% confidence intervals are provided here for comparison purposes.
Care Transitions (C-TRAIN) Program Analysis
Exhibit D.PPMC.13 presents common support and covariate balance across Care Transitions Program treatment and comparison groups.
■ After matching, we observe nearly identical overlap in the density curves for propensity scores in the treatment and comparison groups.
■ In the matched sample, we are able to obtain balance on demographic covariates, comorbidities, and prior year utilization measures (hospitalizations and ED visits) and costs. Overall, the chart indicates that propensity score matching greatly improved the comparability of the treatment and comparison group.

NORC | HCIA Complex/High-Risk Patient Targeting
ADDENDUM TO THE THIRD ANNUAL REPORT | 225
Exhibit D.PPMC.13: Test of Common Support and Covariate Balance, PPMC C-TRAIN Program
Impact of C-TRAIN Program in Each Quarter of Enrollment. Findings from quarterly fixed effects DID models of impact in each intervention quarter are consistent with the average quarterly impacts summarized in the awardee chapter. Exhibit D.PPMC.14 displays the results of the quarterly fixed effects DID models. 276
276 For utilization measures, the effect is displayed as the average difference between treatment and comparison, per 1,000 beneficiaries for each quarter during the post-intervention (I1-I2) period, after adjusting for pre-intervention differences between the two groups. For total cost of care, this effect is displayed per beneficiary. We present both 90% confidence intervals (indicated by vertical lines around the estimate) and 80% confidence intervals (indicated by shaded boxes around the estimate).

NORC | HCIA Complex/High-Risk Patient Targeting
ADDENDUM TO THE THIRD ANNUAL REPORT | 226
Exhibit D.PPMC.14: Impact of the PPMC C-TRAIN Program, by Quarter
Disclaimer: Standard statistical practice is to use confidence intervals of 90% or higher. 80% confidence intervals are provided here for comparison purposes.
Impact of the PPMC C-TRAIN Program, All Quarters. Exhibit PPMC.15 displays the average quarterly and aggregate impact of the Care Transitions Program on its participants relative to the comparison group, across all eight quarters of available post-intervention data.277 Utilization measures are reported as counts, noting the number of occurrences of an event in each quarter for a specific beneficiary. We find the following, relative to the comparison group:
■ Cost: A significant increase in total cost of care ($408 per beneficiary per quarter).
■ Utilization Measures: Significant increases in hospitalizations (179 per 1,000 beneficiaries per quarter) and in ED visits (335 per 1,000 beneficiaries per quarter).
277 Adjustment factors include age, race, gender, dual eligibility, disability eligibility, CDPS risk score, high utilizer flag, asthma, CHF, COPD, depression, diabetes, and liver disease. Results are interpreted as significant where p<0.10.

NORC | HCIA Complex/High-Risk Patient Targeting
ADDENDUM TO THE THIRD ANNUAL REPORT | 227
Exhibit D.PPMC.15: Impact of the PPMC C-TRAIN Program on Outcomes
AVERAGE QUARTERLY IMPACT§ Outcome Measure (per 1,000 beneficiary-episodes unless noted)
Adjusted Estimate 90% Confidence
Interval 80% Confidence
Interval
Total Cost of Care per beneficiary ($) $408** $77, $739 $150, $666 Hospitalizations 179*** 95, 263 114, 244 ED Visits 335*** 134, 536 178, 492
AGGREGATE IMPACT§§
Outcome Measure Adjusted Estimate 90% Confidence Interval
80% Confidence Interval
Total Cost of Care ($) $970,052** $184,333, $1,755,771 $357,716, $1,582,388
Hospitalizations 425*** 226, 624 270, 580 ED Visits 797*** 319, 1,275 425, 1,169
NOTE: +p<0.20, *p<0.10, **p<0.05, ***p<0.01. Bold font indicates findings that are statistically significant at p<0.10. §Quarterly impact is the average quarterly DID estimate per quarter of program implementation. §§Aggregate impact is the total DID estimate for all program participants across all quarters of program implementation. Aggregate impact is estimated for this awardee based on the total number of program participants (604), with an average length of program enrollment of 3.9 quarters. Disclaimer: Standard statistical practice is to use confidence intervals of 90% or higher. 80% confidence intervals are provided here for comparison purposes.
Impact of the PPMC C-TRAIN Program in Each Quarter of Enrollment, All Quarters. Findings from quarterly fixed effects DID models of impact in each intervention quarter are consistent with the average quarterly impacts summarized above. Exhibit D.PPMC.16 displays the results of the quarterly fixed effects DID models. 278
278 For utilization measures, the effect is displayed as the average difference between treatment and comparison, per 1,000 beneficiaries for each quarter during the post-intervention (I1-I8) period, after adjusting for pre-intervention differences between the two groups. For total cost of care, this effect is displayed per beneficiary. We present both 90% confidence intervals (indicated by vertical lines around the estimate) and 80% confidence intervals (indicated by shaded boxes around the estimate).

NORC | HCIA Complex/High-Risk Patient Targeting
ADDENDUM TO THE THIRD ANNUAL REPORT | 228
Exhibit D.PPMC.16: Impact of the PPMC C-TRAIN Program, by Quarter
Disclaimer: Standard statistical practice is to use confidence intervals of 90% or higher. 80% confidence intervals are provided here for comparison purposes.
Intensive Transition Team (ITT) Program Analysis
Exhibit D.PPMC.17 presents common support and covariate balance across Intensive Transition Team treatment and comparison group beneficiaries.
■ After matching, we observe nearly identical overlap in the density curves for propensity scores in the treatment and comparison groups.
■ In the matched sample, we are able to obtain balance on demographic covariates, comorbidities, and prior year utilization measures (hospitalizations and ED visits) and costs. Overall, the chart indicates that propensity score matching greatly improved the comparability of the treatment and comparison group.

NORC | HCIA Complex/High-Risk Patient Targeting
ADDENDUM TO THE THIRD ANNUAL REPORT | 229
Exhibit D.PPMC.17: Test of Common Support and Covariate Balance, PPMC ITT Program
Impact of the PPMC Intensive Transition Team Program in Each Quarter of Enrollment. Findings from quarterly fixed effects DID models of impact in each intervention quarter are consistent with the average quarterly impacts summarized in the awardee chapter. Exhibit D.PPMC.18 displays the results of the quarterly fixed effects DID models. 279
279 For utilization measures, the effect is displayed as the average difference between treatment and comparison, per 1,000 beneficiaries for each quarter during the post-intervention (I1-I2) period, after adjusting for pre-intervention differences between the two groups. For total cost of care, this effect is displayed per beneficiary. We present both 90% confidence intervals (indicated by vertical lines around the estimate) and 80% confidence intervals (indicated by shaded boxes around the estimate).

NORC | HCIA Complex/High-Risk Patient Targeting
ADDENDUM TO THE THIRD ANNUAL REPORT | 230
Exhibit D.PPMC.18: Impact of the PPMC ITT Program, by Quarter
Disclaimer: Standard statistical practice is to use confidence intervals of 90% or higher. 80% confidence intervals are provided here for comparison purposes.
Impact of the PPMC Intensive Transition Team Program, All Quarters. Exhibit D.PPMC.19 displays the average quarterly and aggregate impact of the ITT Program on its participants relative to the comparison group, across all three quarters of available post-intervention data.280 Utilization measures are reported as counts, noting the number of occurrences of an event in each quarter for a specific beneficiary. We find the following, relative to the comparison group:
■ Cost: A non-significant decrease in total quarterly cost of care.
■ Utilization Measures: A non-significant decrease in hospitalizations and a nonsignificant increase in ED visits.
280 Adjustment factors include age, race, gender, dual eligibility, disability eligibility, CDPS risk score, high utilizer flag, asthma, CHF, COPD, depression, diabetes, and liver disease. Results are interpreted as significant when p<0.10.

NORC | HCIA Complex/High-Risk Patient Targeting
ADDENDUM TO THE THIRD ANNUAL REPORT | 231
Exhibit D.PPMC.19: Impact of the PPMC ITT Program on Outcomes
AVERAGE QUARTERLY IMPACT§ Outcome Measure (per 1,000 beneficiary-episodes unless noted)
Adjusted Estimate 90% Confidence
Interval 80% Confidence
Interval
Total Cost of Care per beneficiary ($) -$189 -$623, $245 -$527, $149 Hospitalizations -43+ -97, 11 -85, -1 ED Visits 46 -185, 277 -134, 226
AGGREGATE IMPACT§§
Outcome Measure Adjusted Estimate 90% Confidence Interval
80% Confidence Interval
Total Cost of Care ($) -$283,028 -$933,037, $366,981 -$789,601, $223,545
Hospitalizations -64+ -145, 17 -127, -1 ED Visits 68 -278, 414 -201, 337
NOTE: +p<0.20, *p<0.10, **p<0.05, ***p<0.01. Bold font indicates findings that are statistically significant at p<0.10. §Quarterly impact is the average quarterly DID estimate per quarter of program implementation. §§Aggregate impact is the total DID estimate for all program participants across all quarters of program implementation. Aggregate impact is estimated for this awardee based on the total number of program participants (583), with an average length of program enrollment of 2.6 quarters. Disclaimer: Standard statistical practice is to use confidence intervals of 90% or higher. 80% confidence intervals are provided here for comparison purposes.
Impact of Intensive Transition Team Program in Each Quarter of Enrollment, All Quarters. Findings from quarterly fixed effects DID models of impact in each intervention quarter are consistent with the average quarterly impacts summarized above. Exhibit D.PPMC.20 displays the results of the quarterly fixed effects DID models. 281
281 For utilization measures, the effect is displayed as the average difference between treatment and comparison, per 1,000 beneficiaries for each quarter during the post-intervention (I1-I3) period, after adjusting for pre-intervention differences between the two groups. For total cost of care, this effect is displayed per beneficiary. We present both 90% confidence intervals (indicated by vertical lines around the estimate) and 80% confidence intervals (indicated by shaded boxes around the estimate).
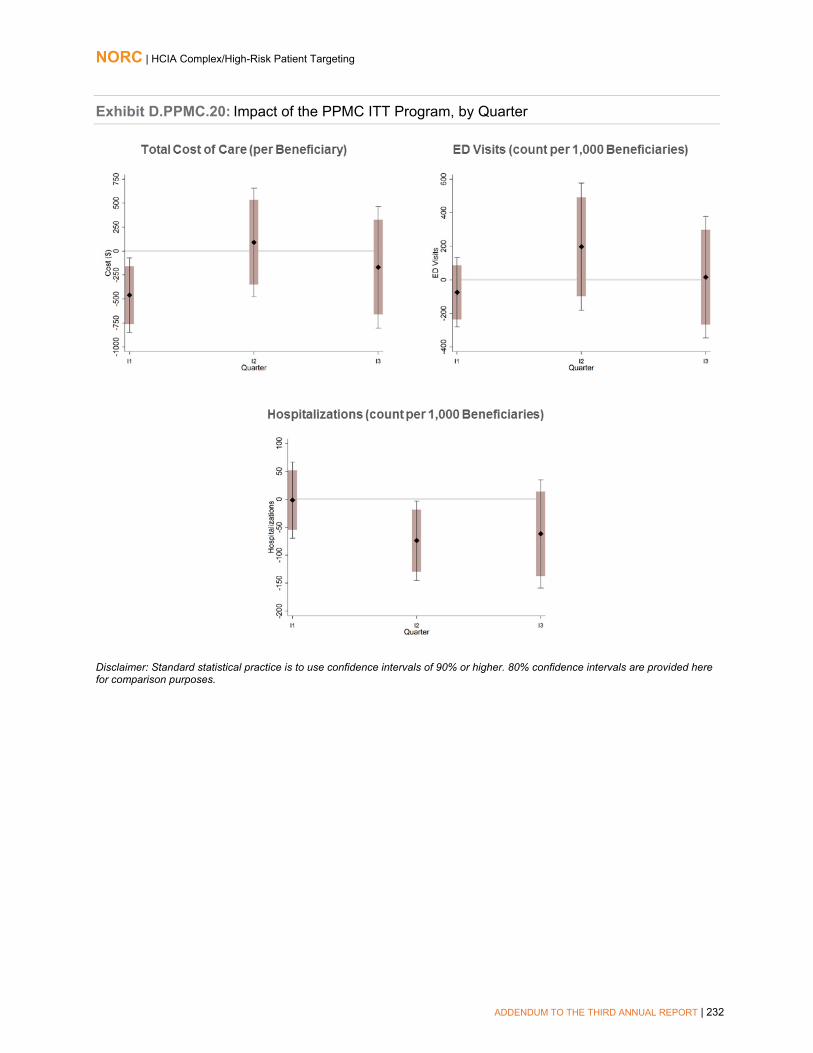
NORC | HCIA Complex/High-Risk Patient Targeting
ADDENDUM TO THE THIRD ANNUAL REPORT | 232
Exhibit D.PPMC.20: Impact of the PPMC ITT Program, by Quarter
Disclaimer: Standard statistical practice is to use confidence intervals of 90% or higher. 80% confidence intervals are provided here for comparison purposes.

NORC | HCIA Complex/High-Risk Patient Targeting
ADDENDUM TO THE THIRD ANNUAL REPORT | 233
St. Francis Healthcare Foundation of Hawaii
St. Francis PAC
Exhibit D.HOPE.1 presents common support and covariate balance across treatment and comparison groups.
■ After weighting, we observe a great deal of overlap in the density curves for propensity scores in the treatment and comparison groups.
■ In the weighted sample, we are able to obtain balance on demographic covariates, comorbidities, prior year utilization measures (hospitalizations and ED visits) and prior year cost. Although we were not able to achieve balance on the CHF indicator, overall, the chart indicates that propensity score weighting greatly improved the comparability of the treatment and comparison group.
Exhibit D.HOPE.1: Test of Common Support and Covariate Balance, H.O.P.E. Hospital Arm
Impact of H.O.P.E. Program in Each Quarter of Enrollment, Hospital Arm. Findings from a quarterly fixed effects (QFE) DID model of impact in each enrollment quarter for 90-day hospitalizations are consistent with the average quarterly impacts summarized in the awardee chapter.282,283 Exhibit D.HOPE.2 displays the results of the QFE DID model for 90-day hospitalizations. Findings from the QFE models for all other measures departed from the quarterly and aggregate results, and thus we present and discuss them in the awardee chapter.
282 For a more detailed explanation of the QFE DID model and measure specification, please see NORC’s Third Annual Report, Appendix C. 283 The effect is displayed as the average difference between treatment and comparison per 1,000 beneficiaries for each quarter during the post-intervention (I1–I12) period, after adjusting for pre-intervention differences between the two groups. We present both 90% confidence intervals (indicated by vertical lines around the estimate) and 80% confidence intervals (indicated by shaded boxes around the estimate). Results are interpreted as significant where p<0.10.

NORC | HCIA Complex/High-Risk Patient Targeting
ADDENDUM TO THE THIRD ANNUAL REPORT | 234
Exhibit D.HOPE.2: Impact of the H.O.P.E. Program by Quarter, Hospital Arm
90-Day Hospitalizations (count per 1,000 Beneficiaries)
Disclaimer: Standard statistical practice is to use confidence intervals of 90% or higher. 80% confidence intervals are provided here for comparison purposes.
St. Francis Community Arm
Exhibit D.HOPE.3 presents common support and covariate balance across treatment and comparison groups.
■ After matching, we observe nearly identical overlap in the density curves for propensity scores in the treatment and comparison groups.
■ In the matched sample, we are able to obtain balance on demographic covariates, comorbidities, and prior year utilization measures (hospitalizations and ED visits). Overall, the chart indicates that propensity score matching greatly improved the comparability of the treatment and comparison group.
Exhibit D.HOPE.3: Test of Common Support and Covariate Balance, H.O.P.E. Community Arm

NORC | HCIA Complex/High-Risk Patient Targeting
ADDENDUM TO THE THIRD ANNUAL REPORT | 235
Impact of H.O.P.E. Program in Each Quarter of Enrollment, Community Arm. Findings from quarterly fixed effects (QFE) DID models of impact in each intervention quarter are consistent with the average quarterly impacts summarized in the awardee chapter for total cost of care, hospitalizations, ED visits, and ACS hospitalizations. Exhibit D.HOPE.4 displays the results of the QFE DID models.284,285 Findings from the QFE models for 30-day readmissions departed from the quarterly and aggregate results, and thus we present and discuss them in the awardee chapter.
Exhibit D.HOPE.4: Impact of the H.O.P.E. Program by Quarter, Community Arm
Disclaimer: Standard statistical practice is to use confidence intervals of 90% or higher. 80% confidence intervals are provided here for comparison purposes.
284 For a more detailed explanation of the QFE DID model and measure specification, please see NORC’s Third Annual Report, Appendix C. 285 For utilization and quality of care measures, the effect is displayed as the average difference between treatment and comparison per 1,000 beneficiaries for each quarter during the post-intervention (I1–I11) period, after adjusting for pre-intervention differences between the two groups. We present both 90% confidence intervals (indicated by vertical lines around the estimate) and 80% confidence intervals (indicated by shaded boxes around the estimate). Results are interpreted as significant where p<0.10.

NORC | HCIA Complex/High-Risk Patient Targeting
ADDENDUM TO THE THIRD ANNUAL REPORT | 236
Sensitivity Analysis, Impact of H.O.P.E. Program on Total Cost of Care, Community Arm. In light of the overall findings of no significant change in total cost of care, we conduct a sensitivity analysis to investigate impacts in the first four quarters after enrollment (i.e., when participants were actively engaged in the program). We find a non-significant increase in total quarterly cost of care per beneficiary for the H.O.P.E. program, relative to the comparison group; see Exhibit D.HOPE.5.
Exhibit D.HOPE.5: Impact of the H.O.P.E. Program on Cost, Sensitivity Analysis, Community Arm
AVERAGE QUARTERLY IMPACT§ Outcome Measure (per beneficiary) Adjusted Estimate 90% Confidence Interval 80% Confidence Interval
Total Cost of Care ($) $833 -$764, $2,340 -$411, $2,077
AGGREGATE IMPACT§§ Outcome Measure Adjusted Estimate 90% Confidence Interval 80% Confidence Interval Total Cost of Care ($) $641,489 -$588,443, $1,871,420 -$316,785, $1,599,763
NOTE: +p<0.20, *p<0.10, **p<0.05, ***p<0.01. Bold font indicates findings that are statistically significant at p<0.10. §Quarterly impact is the average quarterly DID estimate per quarter of program enrollment. §§Aggregate impact is the total DID estimate for all program participants across all observed quarters of program enrollment. Aggregate impact is estimated for this awardee based on the total number of program participants (252), with an average length of enrollment of 4.4 quarters. Disclaimer: Standard statistical practice is to use confidence intervals of 90% or higher. 80% confidence intervals are provided here for comparison purposes.

NORC | HCIA Complex/High-Risk Patient Targeting
ADDENDUM TO THE THIRD ANNUAL REPORT | 237
Sutter Health Corporation
Exhibit D.AIM.1 presents common support and covariate balance across treatment and comparison groups.
■ After matching, we observe nearly identical overlap in the distribution of estimated propensity scores across treatment and comparison groups.
■ In the matched sample, we are able to obtain balance on demographic characteristics, comorbidities, and utilization and costs prior to the last 30 days of life. Overall, the chart indicates that propensity score matching greatly improved the comparability of the treatment and comparison group.
Exhibit D.AIM.1: Test for Common Support and Covariate Balance, AIM Program

NORC | HCIA Complex/High-Risk Patient Targeting
ADDENDUM TO THE THIRD ANNUAL REPORT | 238
University Emergency Medical Services
Exhibit D.UEMS.1 presents common support and covariate balance across treatment and comparison groups.
■ After matching, we observe nearly identical overlap in the density curves for propensity scores in the treatment and comparison groups.
■ In the matched sample, we are able to obtain balance on demographic covariates, comorbidities, and prior year utilization measures (hospitalizations and ED visits). Although we were not able to achieve balance in Medicaid managed care, overall, the chart indicates that propensity score matching greatly improved the comparability of the treatment and comparison group.
Exhibit D.UEMS.1: Test of Common Support and Covariate Balance, HealthiER Program
Impact of HealthiER in Each Quarter of Enrollment. Findings from a QFE DID model of impact in each enrollment quarter for total cost of care, hospitalizations, ED visits, and 7-, 30-, and 90-day practitioner follow-up are consistent with the average quarterly impact summarized in the awardee chapter.286 Exhibit D.UEMS.2 displays the results of the QFE DID models for HealthiER participants, relative to a comparison group.287,288 Findings for potentially avoidable hospitalizations departed from the quarterly and aggregate results, and thus we present and discuss them in the awardee chapter.
286 Please see Appendix D for presentation of these results. 287 For a more detailed explanation of the QFE DID model and measure specification, please refer to NORC’s Third Annual Report, Appendix C. 288 For utilization and quality of care measures, the effect is displayed as the average difference between treatment and comparison per 1,000 beneficiaries for each quarter during the post-intervention (I1–I10) period, after adjusting for pre-intervention differences between the two groups. For total cost of care, this effect is displayed per beneficiary. We present both 90% confidence intervals (indicated by vertical lines around the estimate) and 80% confidence intervals (indicated by shaded boxes around the estimate). Results are interpreted as significant where p<0.10.
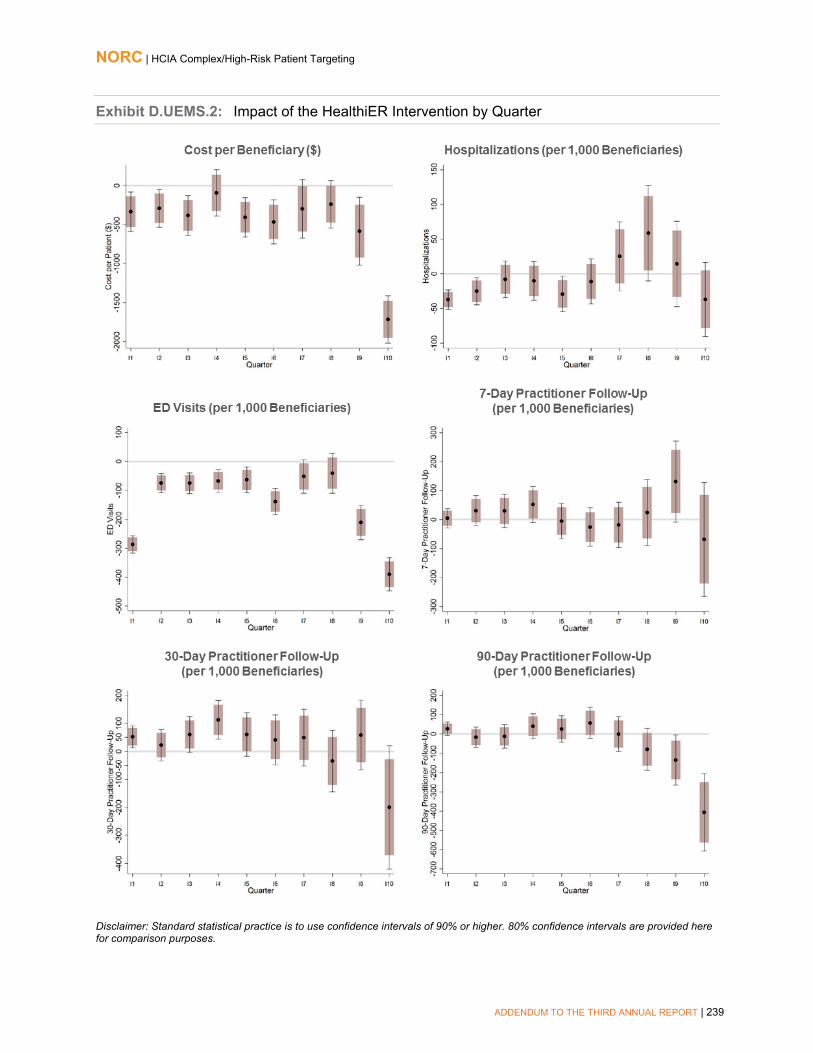
NORC | HCIA Complex/High-Risk Patient Targeting
ADDENDUM TO THE THIRD ANNUAL REPORT | 239
Exhibit D.UEMS.2: Impact of the HealthiER Intervention by Quarter
Disclaimer: Standard statistical practice is to use confidence intervals of 90% or higher. 80% confidence intervals are provided here for comparison purposes.

NORC | HCIA Complex/High-Risk Patient Targeting
ADDENDUM TO THE THIRD ANNUAL REPORT | 240
University of New Mexico
Exhibit ECHO.1 presents common support and covariate balance across treatment and comparison groups.
■ After matching, we observe nearly identical overlap in the density curves for propensity scores in the treatment and comparison groups.
■ In the matched sample, we are able to obtain balance on demographic covariates, dual eligibility, and prior year cost. Although we were not able to achieve balance on morbidity (CDPS risk score) or prior utilization (hospitalizations and ED visits), overall, the chart indicates that propensity score matching greatly improved the comparability of the treatment and comparison group.
Exhibit D.ECHO.1: Test of Common Support and Covariate Balance, ECHO Care Program
Impact of ECHO Care in Each Quarter of Enrollment. Findings from quarterly fixed effects (QFE) DID models of impact in each intervention quarter for total cost of care, ED visits, and potentially avoidable hospitalizations are consistent with the average quarterly impacts summarized in the awardee chapter. Exhibit D.ECHO.2 displays the results of the QFE DID models.289,290 Findings from the QFE models for hospitalizations and 30-day readmissions departed from the quarterly and aggregate results, and thus we present and discuss them in the awardee chapter.
289 For a more detailed explanation of the QFE DID model and measure specification, please see NORC’s Third Annual Report, Appendix C. 290 For ED visits and potentially avoidable hospitalizations, the effect is displayed as the average difference between treatment and comparison per 1,000 beneficiaries for each quarter during the post-intervention (I1–I10) period, after adjusting for pre-intervention differences between the two groups. For total cost of care, this effect is displayed per beneficiary. We present both 90% confidence intervals (indicated by vertical lines around the estimate) and 80% confidence intervals (indicated by shaded boxes around the estimate).

NORC | HCIA Complex/High-Risk Patient Targeting
ADDENDUM TO THE THIRD ANNUAL REPORT | 241
Exhibit D.ECHO.2: Impact of the ECHO Care Program on Outcomes by Quarter
Disclaimer: Standard statistical practice is to use confidence intervals of 90% or higher. 80% confidence intervals are provided here for comparison purposes.

NORC | HCIA Complex/High-Risk Patient Targeting
ADDENDUM TO THE THIRD ANNUAL REPORT | 242
University of North Texas
Exhibits D.BSLTOC.1 and D.BSLTOC.2 present common support and covariate balance across treatment and comparison group beneficiary-episodes in the SNF arm of the BSLTOC intervention for the UTIs and falls analysis, respectively. For both analyses:
■ After SMR weighting, we observe a high level of overlap in the density curves for propensity scores across BSLTOC and comparison group beneficiary-episodes.
■ In the weighted sample, we are able to achieve balance on demographic characteristics, comorbidities, and prior-year utilization and cost. Overall, the chart indicates that propensity score matching greatly improved the comparability of the treatment and comparison group.
Exhibit D.BSLTOC.1: Common Support and Covariate Balance for BSLTOC and Comparison Beneficiary-Episodes, UTI Analysis
Exhibit D.BSLTOC.2: Common Support and Covariate Balance for BSLTOC and Comparison Beneficiary-Episodes, Falls Analysis

NORC | HCIA Complex/High-Risk Patient Targeting
ADDENDUM TO THE THIRD ANNUAL REPORT | 243
Descriptive Characteristics. Exhibits D.BSLTOC.3 and D.BSLTOC.4 display the characteristics of BSLTOC SNF beneficiary-episodes for the treatment and comparison groups before and after implementation of the intervention for the UTI and falls analysis, respectively, prior to propensity score weighting.291 We compare BSLTOC and comparison group beneficiary-episodes occurring in the post-intervention period with respect to demographics, comorbidities, and prior utilization.292
Exhibit D.BSLTOC.3: Descriptive Characteristics for BSLTOC and Comparison Group Beneficiary-Episodes, UTIs Analysis
Variable Pre-Intervention Period Post-Intervention Period
BSLTOC Comparison BSLTOC Comparison Number of Beneficiary-Episodes 5,331 9,155 5,794 12,211 Gender % (N) Female 64.5 (3,441) 65.6 (6,002) 64.3 (3,724) 64.6 (7,891) Age*** <65 years 2.5 (132) 6.0 (550) 2.7 (158) 6.3 (774) 65-69 years 4.6 (243) 7.6 (697) 6.2 (359) 8.3 (1,018) 70-74 years 8.1 (434) 10.8 (988) 9.5 (551) 11.1 (1,357) 75-79 years 13.8 (734) 14.6 (1,338) 13.6 (787) 14.4 (1,763) 80-84 years 21.9 (1,165) 19.5 (1,784) 19.6 (1,136) 19.5 (2,387) ≥ 85 years 49.2 (2,623) 41.5 (3,798) 48.4 (2,803) 40.2 (4,912) Race/Ethnicity*** White 94.8 (5,056) 90.7 (8,308) 94.6 (5,480) 91.1 (11,127) Black 3.6 (191) 6.7 (611) 3.4 (196) 6.4 (785) Other 1.6 (84) 2.6 (236) 2.0 (118) 2.4 (299) Coverage Reason*** Age 91.7 (4,891) 84.6 (7,749) 90.4 (5,240) 84.1 (10,274) Disability 7.8 (418) 14.4 (1,322) 9.1 (525) 14.9 (1,816) End-Stage Renal Disease (ESRD) 0.1 (4) 0.3 (24) 0.3 (16) 0.4 (43) Disability and ESRD 0.3 (18) 0.7 (60) 0.2 (13) 0.6 (78) Hierarchical Condition Categories (HCCs) Mean Count of HCCs (Standard Deviation)** 4.6 (3.0) 4.7 (3.2) 4.7 (3.0) 4.8 (3.2)
Mean HCC Score (SD)*** 2.8 (1.7) 2.8 (1.9) 2.8 (1.7) 2.9 (1.8) Mean Utilization and Cost in Year Prior to Program Enrollment (per 1,000 Beneficiary-episodes unless noted) Total Medicare Cost (SD)*** $40,670 ($50,969) $44,876 ($59,452) $38,629 ($40,267) $44,769 ($61,025) Hospitalizations (SD)*** 2,104 (2,899) 2,274 (4,919) 2,024 (2,393) 2,223 (3,171) ED Visits (SD) 951 (1,456) 948 (1,690) 980 (1,686) 974 (1,840)
NOTE: *p<0.10, **p<0.05, ***p<0.01.
291 The exclusion criteria for falls is different from that of UTI, resulting in different analytic samples. 292 We test differences between BSLTOC and comparison SNFs during the post-intervention implementation period with a t-test for continuous measures (comorbidities, utilization, and cost) and a chi-square test for categorical parameters (age, race, ethnicity, gender, coverage reason).

NORC | HCIA Complex/High-Risk Patient Targeting
ADDENDUM TO THE THIRD ANNUAL REPORT | 244
Exhibit D.BSLTOC.4: Descriptive Characteristics for BSLTOC and Comparison Group Beneficiary-Episodes, Falls Analysis
Variable Pre-Intervention Period Post-Intervention Period
Brookdale Comparison Brookdale Comparison Number of Beneficiary-Episodes 6,192 9,743 6,661 11,109 Gender % (N) Female 66.3 (4,106) 67.0 (6,523) 66.1 (4,402) 65.6 (7,291) Age*** <65 years 2.3 (141) 5.2 (505) 2.5 (168) 5.7 (633) 65-69 years 4.5 (277) 7.2 (703) 5.9 (393) 8.0 (887) 70-74 years 7.8 (485) 10.7 (1,041) 9.1 (609) 11.0 (1,219) 75-79 years 13.6 (844) 14.5 (1,412) 13.2 (882) 14.5 (1,609) 80-84 years 21.8 (1,350) 20.8 (2,028) 19.5 (1,296) 19.8 (2,197) ≥ 85 years 50.0 (3,095) 41.6 (4,054) 49.7 (3,313) 41.1 (4,564) Race/Ethnicity*** White 95.0 (5,881) 91.9 (8,953) 94.7 (6,309) 91.2 (10,131) Black 3.6 (221) 5.7 (553) 3.4 (226) 6.1 (682) Other 1.5 (90) 2.4 (237) 1.9 (126) 2.7 (296) Coverage Reason*** Age 92.0 (5,699) 85.9 (8,370) 90.7 (6,042) 85.2 (9,470) Disability 7.6 (469) 13.3 (1,298) 8.8 (583) 13.8 (1,537) End-Stage Renal Disease (ESRD) 0.1 (4) 0.2 (23) 0.3 (20) 0.3 (34) Disability and ESRD 0.3 (20) 0.5 (52) 0.2 (16) 0.6 (68) Hierarchical Condition Categories (HCCs) Mean Count of HCCs (Standard Deviation)*** 4.5 (3.0) 4.6 (3.1) 4.6 (3.0) 4.8 (3.2)
Mean HCC Score (SD)*** 2.7 (1.6) 2.8 (1.8) 2.8 (1.7) 2.9 (1.8) Mean Utilization and Cost in Year Prior to Program Enrollment (per 1,000 Beneficiary-episodes unless noted) Total Medicare Cost (SD)*** $39,392 ($48,546) $43,057 ($57,089) $37,906 ($40,265) $44,513 ($90,779) Hospitalizations (SD)*** 2,056 (2,749) 2,132 (3,035) 2,002 (2,399) 2,206 (6,055) ED Visits (SD) 968 (1,527) 932 (1,621) 986 (1,663) 974 (1,864)
NOTE: *p<0.10, **p<0.05, ***p<0.01.
Impact of BSLTOC Program in Each Quarter of Enrollment, SNF Arm. Findings from quarterly fixed effects (QFE) DID models of impact in each intervention quarter are consistent with the average quarterly impacts summarized in the awardee chapter. 293 Exhibit D.BSLTOC.5 displays the results of the QFE DID models.294
293 The effect is displayed as the average difference between treatment and comparison, per 1,000 beneficiary-episodes (with 80 and 90 percent confidence intervals) for each quarter during the post-intervention (I1—I10) period, after adjusting for pre-intervention differences between the two groups. We present both 90% confidence intervals (indicated by vertical lines around the estimate) and 80% confidence intervals (indicated by shaded boxes around the estimate). 294 For a more detailed explanation of the QFE DID model and measure specification, please see NORC’s Third Annual Report, Appendix C.

NORC | HCIA Complex/High-Risk Patient Targeting
ADDENDUM TO THE THIRD ANNUAL REPORT | 245
Exhibit D.BSLTOC.5: Impact of the BSLTOC Program on Quality Outcomes by Quarter
Disclaimer: Standard statistical practice is to use confidence intervals of 90% or higher. 80% confidence intervals are provided here for comparison purposes.

NORC | HCIA Complex/High-Risk Patient Targeting
ADDENDUM TO THE THIRD ANNUAL REPORT | 246
Appendix E: List of Evaluation Questions
Exhibit E.1: Evaluation Research Questions, HCIA Evaluation Statement of Work
Domain Questions Questions for CHRPT Cohort of Awardees I. IMPLEMENTATION EFFECTIVENESS A. Program drivers 1. Theory of change What are the central processes or drivers in the innovation by
which change in behavior and/or systems is supposed to come about?
What implementation activities are designed to activate the innovation’s theory of change?
What are the commonalities and differences among the various models posited by awardees
What are the awardee theories of action that support the innovation theory of change for the complex/high risk target population?
Which implementation activities are designed to activate the innovation’s theories of change and of action?
2. Theory of action What are the central processes or drivers in the innovation by which patient or system-level action is meant to come about?
B. Intervention 1. Components of the intervention
What intervention components (e.g., training and technical assistance) are provided in support of implementation?
How much of each component is provided? To what extent were the components available on an ongoing basis?
How did unexpected events support or conflict with successful implementation of the innovation?
How much of each component is provided and according to what schedule (e.g., one time, periodically)?
2. Dosage What “dosage” of the innovation is delivered to patients, providers, and other target populations?
Does it differ among provider sites within an awardee’s program?
How does the “dosage” of intervention programs compare with the dosage provided from a usual source of care?
How do variations in the dosage of the intervention that was delivered to the target population impact innovation award outcomes of health, health care, or costs, with health broadly defined to include well-being, function, and health-related quality of life?
3. Fidelity In what ways is the innovation intended to be customized to specific use contexts?
To what extent were systems in place to monitor implementation on an ongoing basis?
How well did providers and sites adhere to planned procedures (including, as appropriate, procedures for customization)?
To what extent were the innovation and its components properly understood and used by target populations?
Were there unintended consequences as a result of deviations from program fidelity?
Did deviations in program fidelity occur for complex/high risk models?
If so, to what degree did deviations from fidelity impact outcomes of health, health care, or costs (with health broadly defined)?

NORC | HCIA Complex/High-Risk Patient Targeting
ADDENDUM TO THE THIRD ANNUAL REPORT | 247
Domain Questions Questions for CHRPT Cohort of Awardees What role did complex/high risk care recipient self-determination or informal caregiver preferences play in deviating from planned procedures?
Modification to Intervention: Did awardees and their delivery sites modify the interventions?
To what extent did these modifications or variations in model affect quality, cost, or health outcomes
To what extent did patient self-determination or caregiver preferences account for deviations from planned procedures?
4. Self-monitoring What changes were made in response to self-monitoring? To what extent are systems in place to monitor implementation on an ongoing basis?
Do awardees in the HCIA complex/high risk group use self-monitoring to make changes in their programs?
Which approach or system do they use (e.g., process measures, outcomes analysis, CQI)?
If so, what types of changes had a greater impact on outcomes (health, health care, or costs)?
C. Reach 1. Coverage What was the target population (e.g., patients, providers) after
implementation? How many patients, providers were reached?
Did the program meet its proposed target enrollments of patients and trainees (relevant to evaluability/sample size)?
2. Timeliness of implementation To what extent was implementation timely, conducted as planned, and responsive to site-level constraints?
3. Secondary use of tools What secondary uses, if any, were discovered for IT, decision support and other intervention tools?
How could secondary uses be exploited to enhance benefits of the intervention(s) in other settings?
Were any of the interventions redeployed or adopted beyond their original proposed uses?
Assistive Technology: Was assistive technology utilized in the implementation of complex/high risk models?
What role did assistive technology play in implementing the innovation?
Durable Medical Equipment: What role did the use of
durable medical equipment play in implementing the innovation?

NORC | HCIA Complex/High-Risk Patient Targeting
ADDENDUM TO THE THIRD ANNUAL REPORT | 248
Domain Questions Questions for CHRPT Cohort of Awardees II. PROGRAM EFFECTIVENESS A. Outcomes 1. Health outcomes To what extent does the intervention improve desired health
outcomes? Does the intervention result in any unanticipated negative health outcomes?
Does the intervention affect health outcomes that are most important to the target population?
Can we learn anything about causal pathways? In particular, for interventions with multiple components, which aspects of the intervention are primarily responsible for observed effects?
To what extent does the intervention improve patient desired outcomes (satisfaction, support for patient’s priority goals, confidence in care system), reported directly or via proxy?
Does the impact of the intervention vary by population subgroup, e.g., Medicare only/dual eligible; disability status; age; race or ethnicity, geographic location?
2. HRQoL To what extent does the intervention improve quality of life? Can we learn anything about causal pathways? In particular, for interventions with multiple components, which aspects of the intervention are primarily responsible for observed effects?
B. Cost 1. Program Costs What were the fixed costs associated with program start-up?
What are the variable costs associated with program operation? What are the anticipated new fixed costs associated with program sustainability?
Were aspects of the intervention or other services curtailed because of cost considerations? Were any curtailed because of regulations, anti-trust, or other policy-related considerations?
What types of in-kind contributions to complex/high risk care occurred (e.g., informal caregiving and donated technology)?
2. Utilization To what extent have levels of appropriate and inappropriate utilization changed?
To what extent were there any unintended consequences for utilization?
To what extent have levels of ED utilization changed? To what extent have rates of hospitalization and re-hospitalization changed?
To what extent has intensity of inpatient utilization changed?
How do changes in utilization and improvements in care coordination vary among subgroups of patients?
3. Expenditures How are the models designed to reduce expenditures (e.g., changing the service the population utilizes, reducing the volume or utilization of services, changing the cost of services, etc.)?
To what extent did the program change charges and expenditures for all care in the target population?
To what extent did the program result in unintended charges and expenditures in the target population?
To what extent did the program change charges and expenditures for all care (including social supports) in the target population?

NORC | HCIA Complex/High-Risk Patient Targeting
ADDENDUM TO THE THIRD ANNUAL REPORT | 249
Domain Questions Questions for CHRPT Cohort of Awardees To what extent do the models reduce or eliminate variations in charges or expenditures that are not attributable to differences in health status?
What is the expected cost of sustaining these changes? C. Quality 1. Safety To what extent do the models improve patient safety? Which measures of patient safety are available or can be
developed for complex/high risk patients in community settings that are innovating?
2. Clinical Effectiveness To what extent do the models improve the effectiveness of patient care?
To what extent have clinical condition indicators changed? To what extent does the intervention affect key performance goals, such as compliance with treatment guidelines?
3. Patient experience In what ways are aspects of patient experience (e.g., access, perceived care coordination, provider-patient communication, etc.) are enhanced by the intervention(s)?
In what ways are aspects of patient experience worsened by the intervention?
To what extent does the intervention affect measures of patient activation?
Satisfaction with Care: How satisfied are patients with the care they receive?
Informal Caregiver Experience: In what ways are aspects of the patient’s informal caregiver’s experience (e.g., access, perceived care coordination, provider-patient communication) enhanced or worsened by the intervention(s)?
In what ways are aspects of informal caregivers’ experiencing face-to-face access, seamlessness of services, and provider communications affected by the interventions?
4. Timeliness To what extent do the models improve the timeliness of care? To what degree did the timeliness of services to complex/high risk patients in a community setting impact patient outcomes?
Was there perceived delay in receipt of services? In availability of needed service?
Which aspects of timeliness impacted delivery of services of this set of awardees in the community?
5. Efficiency To what extent do the models improve the efficiency of care? 6. Care Coordination To what extent did the models improve care coordination?

NORC | HCIA Complex/High-Risk Patient Targeting
ADDENDUM TO THE THIRD ANNUAL REPORT | 250
Domain Questions Questions for CHRPT Cohort of Awardees D. Cross-Cutting Considerations
1. Equity & Disparities What contribution did the program make in reducing disparities in patient access to care?
What contribution did the program make in reducing disparities in enrollment of targeted patients in intervention?
To what degree do the model(s) result in reductions in or elimination of disparities in quality of care?
To what degree does the program result in reductions in or elimination of disparities in patient outcomes?
What program characteristics influenced reductions of disparities in access, quality, or outcomes?
2. Subgroup effects In outcomes of interest (health, costs, quality) for which a main effect was not detected, was there a subgroup in whom an effect was detected?
In outcomes of interest (health, costs, quality) for which a main effect was detected, was there a subgroup of patients for whom the effect was stronger, weaker, or not detected?
What were the characteristics of patients, providers, and settings in which a subgroup effect was detected?
What characteristics of patients and settings influencing subgroup effects could be used to target the intervention(s) in other settings?
3. Spillover effects What, if any, were the positive and negative spillover effects of the intervention(s)?
· At site(s) /Among providers/Among non-targeted patients (through unintended effects on all services)
· Among targeted patients (through unintended utilization of other beneficial services)
What program characteristics and factors influenced these effects? To what extent did workflow redesign, HIT, telemedicine, and other structural aspects of the intervention result in spillover effects at the site(s) or among providers?
To what extent did care coordination, patient navigators, shared decision making, and other aspects of the intervention(s) result in spillover effects among non-targeted patients?
How can spillover effects be exploited in future implementation efforts using similar models of care?

NORC | HCIA Complex/High-Risk Patient Targeting
ADDENDUM TO THE THIRD ANNUAL REPORT | 251
Domain Questions Questions for CHRPT Cohort of Awardees III. WORKFORCE A. Development & Training To what extent do programs provide training to use existing staff
versus incorporate new kinds of staff effectively? Are specialized providers required with training relevant to any of the diseases/systems being targeted?
What level of investment in training is required to fill these workforce gaps?
How effective and efficient are the various training models? Are providers given feedback on their own performance and relative to others?
To what degree do awardees employ competency-based training?
If they do, what is the impact of competency-based training techniques on well-being, function, HRQOL? On costs?
What is awardee retention of trainees in workforce? What can be learned from modifications in trainee roles and tasks after training that may inform workforce transformation, regulation, and policy?
B. Deployment To what extent do programs succeed in developing effective
work teams that address care needs of the served populations? Are provider-to-provider interactions/discussions more frequent and effective?
What is the most effective way to carry out the intervention with patients: to work with patients one-on-one (and in what settings) versus in groups?
What are the best ways to contact patients? (both from the patient and the provider point of view)
Are patients, themselves, trained on new behavior or interactions with information technology? How do the workers follow-up to ensure that the trainings stick with the patients (long-term adherence)
Is it more effective to hire new workers or contract for a portion of the time of existing workers in other organizations (or freelance)?
Are providers able to work at the ‘top of their license’?
C. Satisfaction How has the innovation changed the incidence of burnout
among staff? How has the innovation changed incidence of stress among staff?
What are current rates of staff intent-to-leave current practice? How have rates of staff retention and turnover changed over the course of the innovation?
To what extent are different kinds and levels of staff satisfied or dissatisfied with the care they are able to provide?
To what extent are different kinds and levels of staff satisfied with their working conditions? This would include factors such

NORC | HCIA Complex/High-Risk Patient Targeting
ADDENDUM TO THE THIRD ANNUAL REPORT | 252
Domain Questions Questions for CHRPT Cohort of Awardees as satisfaction with colleagues, other staff, income, organizational policies, etc.
To what extent do different kinds and levels of staff report satisfaction or dissatisfaction with specific components of the intervention? This would include components introduced as part of the intervention (e.g. a mobile computing platform; a new workflow process; support from community health workers).
How has staff satisfaction or dissatisfaction changed as a result of the intervention?
If the innovation is limited to a subgroup of staff/providers within an organization, what are the unintended consequences/spillover effects on the satisfaction of staff/providers not involved in the intervention?
IV. PRIORITY POPULATIONS A. Populations 1. Medical priority groups To what extent do the awardee interventions include patients
from priority populations? To what extent do the awardee interventions address meeting the needs of priority populations as a primary focus?
To what extent do the awardee interventions focus on addressing the needs of priority populations (e.g., functional limitations which would impact ability to manage conditions)?
Does the intervention affect health outcomes that are most important to the target population?
What contribution did the program make in reducing disparities in patient access to care?
To what degree do the complex/high risk patient models serve non- Medicare and Medicaid populations? (e.g., non-beneficiary populations: uninsured or private pay)?
2. Non-medical priority groups To what extent do the awardees address non-medical priority groups and underserved populations?
Were awardees able to increase access to care for non-medical priority groups and underserved populations, and how? In what types of care settings?
Are there key underserved populations that were not included in the awardees’ patient populations?
B. Impact 1.Cost reduction/savings 2. Clinical outcomes
What are the estimated cost savings, if any, among priority groups?
What are the estimated health and health care (e.g., access, QoL, quality, care coordination) outcomes among priority groups?
V. CONTEXT A. Endogenous factors 1. Leadership Was there a clearly designated champion/leader/point person(s)
to oversee implementation?

NORC | HCIA Complex/High-Risk Patient Targeting
ADDENDUM TO THE THIRD ANNUAL REPORT | 253
Domain Questions Questions for CHRPT Cohort of Awardees To what extent were “point-of-service” providers and/or patients involved in planning and implementing the innovation? How was the need for the innovation communicated to them?
To what extent did senior management in the organization provide resources (e.g., staffing, time, funding) needed to implement the innovation?
To what extent did implementation of the innovation involve coordination with outside stakeholders (e.g., units and/or organizations)?
2. Team science What were the key characteristics of the awardee team that would affect implementation of the innovation?
Are providers given feedback on their own performance and relative to others?
3. Organizational features What were the unique characteristics of the awardee that affected the implementation and success of the innovation?
What key assumptions are required concerning the host organizations’ capacities?
To what extent did organizational features support or conflict with implementation?
4. Stakeholder Engagement To what extent did stakeholder engagement affect the relevance, transparency, or adoption of the innovation?
B. Exogenous factors 1.Policy/political environment To what extent did the policy and political environment support or
conflict with implementation?
What is the impact of community context on awardees’ approaches to serving complex and high risk patients?
What community supports enhance the interventions and which hinder implementation?