Embed Size (px)
Citation preview

July 31, 2021
Mark Ghaly, Chair Attn: Rick Kronick and Marian Mulkey
Consulting Team Leads Healthy California for All Commission
RE: Feedback on HCFA Commission Methods and Assumptions Documents
Dear Chairman Ghaly:
Thank you for providing Commissioners with the document summarizing the methods and assumptions of the consulting team’s analytic findings as well as the Excel spreadsheet with further details on their estimates. In the overwhelming interest of public accountability for the Commission’s work, it is necessary to have clear, open, and accurate descriptions of any modeling of unified financing, underlying data of such modeling, as well as assumptions made in such modeling that may be included in or influence our work on the Commission. So, I appreciate this opportunity to provide publicly available feedback and the analytic findings of the consulting team.
Below I have provided general comments and comments on each of the methodological categories described in the summary provided by the consulting team. I also include in these comments a number of system design considerations that should be incorporated in the consulting teams modeling of unified financing in order aid a more precise estimation of the savings potential of a single-payer unified financing system or what the consulting team refers to as the direct payment scenario.
I am also attaching the comments I provided the consulting team in May 2021 as feedback on the Draft Analytic Plan.
I. Overall Comments.
a. The Consulting Team’s Analysis Reiterates the Savings Potential of aDirect Payment, Single-Payer System.
The consulting team’s analytic findings and modeling on unified financing provide yet another economic analysis, among a long list of others that have come before it, demonstrating the massive savings potential of a direct payment, single payer system of health care. This finding from the consulting team’s modeling—that, when compared to the current system and even compared to an “intermediary” model, a single-payer system would save California billions while providing more care through universal coverage and comprehensive benefits—should be clearly articulated in our final report.

Commissioner Comsti, Comments on Methods and Assumptions Healthy California for All Commission July 31, 2021 Page 2 of 20
In all variations modeled by the consulting team, the direct payment scenario (or single-payer model) results in lower total health expenditures for California (in other words aggregate savings) compared to the current system by at least Year 10. And without the expansion of long-term care coverage, a direct-payment scenario would result in savings in Year 1.1
Importantly, a direct payment, single-payer system would result in lower total health expenditures compared to a health care model that includes a role for health plans or health systems (i.e., the intermediary scenario) under each and every variation modeled by the consulting team. From the Year 1 calculations to the Year 10 calculations, a single-payer health system would result in lower total health expenditure than the intermediary scenario.2
Strikingly, the consulting team’s modeling demonstrates the savings potential of a single payer health care system despite the fact that their assumptions present a very conservative estimate. As I note throughout these comments, the consulting team’s analysis at times underestimates the savings potential of a single-payer system. Thus, even without accounting for additional savings under the direct payment scenario as I suggest below, it is clear that under a single-payer health care system California would spend less and get more care when compared to both to our current fragmented health system and to the intermediary scenario—we must make these findings clear in the Commission’s final report.
b. Include a Clear Presentation of the Potential Savings and Improvementsin Californian’s Lives Under Unified Financing in the Final Report inDollars.
As I mentioned in my May 2021 comments on the Draft Analytic Plan, the consulting team’s modeling and the Commission’s final report should include a projection of aggregate savings under a single-payer or unified financing system when compared to spending under the current system. Preferably these protected savings would be clearly presented in the final report as dollar figures and not just percentage savings as were presented in the consulting team’s presentation of analytic findings. To reiterate my previous feedback, it is critical that any modeling presented in our final report include accurate representations of statewide health care spending and savings under a single-payer, unified financing system in contrast to what we would spend under the current system. These estimates of savings are important to the development of financing plans and to aiding the public’s understanding of the potential benefit of a single-payer, unified financing system of health care.
It is also important that findings on changes in spending are presented in an understandable fashion for the public such that spending and savings are broken down by major category. Again, the consulting team should include in final analytic findings and the
1 See “Output_1” worksheet from the consulting team’s detailed Excel calculations. 2 Ibid.

Commissioner Comsti, Comments on Methods and Assumptions Healthy California for All Commission July 31, 2021 Page 3 of 20
Commission should include in our final report all of the following factors when estimating aggregate changes in spending:
Administrative savings (for both providers and the single-payer system) Savings on prescription drug prices Savings from changes to individual provider payment rates Savings from changes to hospital payment rates Savings from reduced fraud and abuse Utilization changes
These categories of savings and spending would aid in understanding two fundamental questions about single-payer, unified financing: (1) how much more care Californians can expect to get under a single-payer health care system, and (2) how much less California would spend on costs that do not go to the provision of care under a single-payer health care system.
The final report should also include projections and discussions about the improvements to the lives of Californians under a single-payer health care system, including estimates and discussion on:
Increased access to health care by number of newly covered lives Increased autonomy of physicians and other clinicians Decreased deaths Decreased delays in care Decreased self-rationing of care as a result of eliminating financial barriers Decreased rationing of care by managed care organizations under the direct payments
model
It is important to include a projection of the changes in these non-financial categories in our final report. The most valuable information that we can provide to the public in our analytic findings is not about how much total health expenditures may or may not increase but rather about the improvements in health and health care access that would result from the unified financing plan that the Commission presents. The value of a financial analysis only becomes tangible when coupled with description and discussion about the real improvements to the health of Californians and to their quality of life when they no longer live under the shadow of massive medical debt nor must they make difficult choices between food or shelter and medical treatment because they are un- or underinsured.
c. Include Provider Price Adjustments (i.e., Rate Reductions) to the Model.
As we have discussed at Commission meetings, one benefit from a direct payment, single payer health care system is the ability of the system to direct negotiated reductions in health care prices (i.e., provider reimbursement rates), which we know have driven outsized health expenditures in the United States in contrast to other wealthy countries. However, in both the
Commissioner Comsti, Comments on Methods and Assumptions Healthy California for All Commission July 31, 2021 Page 4 of 20
summary and the Excel calculations, it is not clear whether price reductions that could be attained through direct negotiations between providers and the state single-payer system reflected in the consulting team’s analysis. Provider rate adjustments could result in significant savings under the direct payment scenario. However, without accounting for provider rate adjustments, the analytic modeling will underestimate the potential savings in total health expenditures under a direct payment, single-payer system.
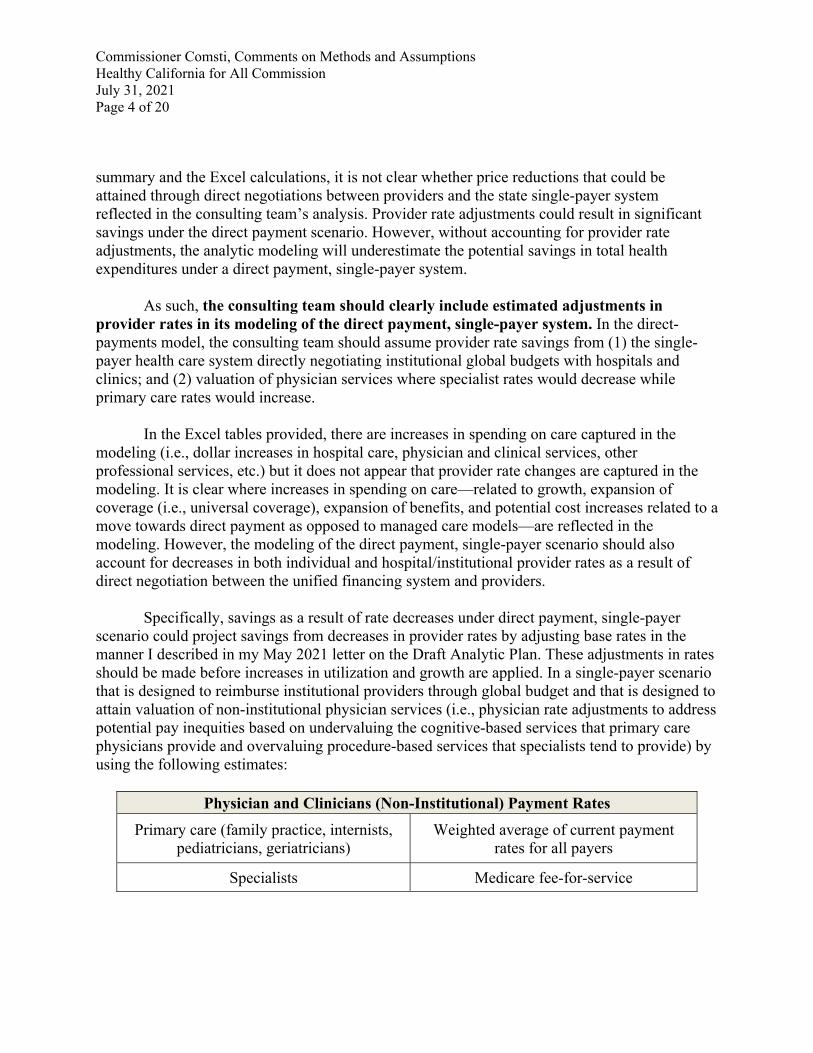
As such, the consulting team should clearly include estimated adjustments in provider rates in its modeling of the direct payment, single-payer system. In the direct-payments model, the consulting team should assume provider rate savings from (1) the single-payer health care system directly negotiating institutional global budgets with hospitals and clinics; and (2) valuation of physician services where specialist rates would decrease while primary care rates would increase.
In the Excel tables provided, there are increases in spending on care captured in the modeling (i.e., dollar increases in hospital care, physician and clinical services, other professional services, etc.) but it does not appear that provider rate changes are captured in the modeling. It is clear where increases in spending on care—related to growth, expansion of coverage (i.e., universal coverage), expansion of benefits, and potential cost increases related to a move towards direct payment as opposed to managed care models—are reflected in the modeling. However, the modeling of the direct payment, single-payer scenario should also account for decreases in both individual and hospital/institutional provider rates as a result of direct negotiation between the unified financing system and providers.
Specifically, savings as a result of rate decreases under direct payment, single-payer scenario could project savings from decreases in provider rates by adjusting base rates in the manner I described in my May 2021 letter on the Draft Analytic Plan. These adjustments in rates should be made before increases in utilization and growth are applied. In a single-payer scenario that is designed to reimburse institutional providers through global budget and that is designed to attain valuation of non-institutional physician services (i.e., physician rate adjustments to address potential pay inequities based on undervaluing the cognitive-based services that primary care physicians provide and overvaluing procedure-based services that specialists tend to provide) by using the following estimates:
Physician and Clinicians (Non-Institutional) Payment Rates
Primary care (family practice, internists, pediatricians, geriatricians)
Weighted average of current payment rates for all payers
Specialists Medicare fee-for-service

Commissioner Comsti, Comments on Methods and Assumptions Healthy California for All Commission July 31, 2021 Page 5 of 20
Hospital and Outpatient Clinic Payments
Hospitals Operating expenses (estimated using
OSHPD hospital data)
Outpatient clinics Operating expenses (estimated using
OSHPD clinic data)
d. Explain Assumptions Regarding Intermediaries.
As we have discussed at previous Commission meetings, I have continued concerns about both the inclusion of and the assumptions being made under what we have been colloquially calling the intermediary scenario (or Option B in the consulting team’s methods and assumptions documents). Given that we as a Commission have yet to clearly define the basic structures of system that includes a role for health plans or health systems as intermediaries, I had expected that either the consulting team would drop their modeling of the intermediary scenario or, at minimum, there would be a clear explanation of their assumptions.
Given the lack of discussion and agreement on the Commission as to what the intermediary scenario exactly is, it is important that throughout the modeling on the intermediary scenario that the consulting team notes where it has made assumptions about system design that has yet to be discussed by the Commission. An intermediary scenario with private insurers with the same benefits (like the Dutch model) may have very different modeling results than a Medicare Advantage-like model or a model that only contemplates the use of capitation but provides no role for private health insurers.
Fundamental assumptions about what is meant by intermediary scenario must be clear before we, as Commissioners, can accurately review and examine the modeling presented by the consulting team. For example, it is difficult to provide feedback on and assess whether the assumptions made regarding potential payer administrative savings under the intermediary scenario are accurate when it is not clear what the system would look like with respect to the number and type of plans/systems, whether rates would vary across plans/systems, membership management structures, etc.
Additionally, at times throughout the summary, the consulting team assumes that the intermediary scenario would have the same or similar savings, growth rates, and other effects as the direct payment, single-payer scenario. Although sometimes these assumptions are stated, the summary provides conclusory or incomplete explanations for these assumptions. I have noted where further explanation about the rationale behind an assumption or further detailed documentation of the calculations made based on an assumption should be explained.

Commissioner Comsti, Comments on Methods and Assumptions Healthy California for All Commission July 31, 2021 Page 6 of 20
e. Publish Underlying Data and Assumptions on the Commission Website.
As I have requested previously, the underlying calculations and data as well as the summary of the methods and assumptions should be made public. Specifically, the Excel worksheets provided to Commissioners should be included online on the Commission’s website so that calculations. The summary of the methods and assumptions should also be made public and include all clear citations to any studies used in assumptions and clear application of such assumptions in the consulting team’s Excel worksheet calculations should be clearly cross referenced in the summary. Additionally, where there are no studies or citations undergirding an assumption made by the consulting team that should be clearly noted in the summary.
f. Adjust Modeling if Federal Health Care Programs are Expanded.
In the past months, Congress has been engaged in serious discussions to pass legislation that would expand federal health care programs. Current federal legislation discussions include:
Medicare prescription drug price negotiations and applying negotiated prices to allhealth plans
Expansion of Medicare benefits to include dental, vision, and hearing Lowering the Medicare eligibility age to 60 Capping Medicare out-of-pocket costs Expansion of long-term services and supports programs Increases in federal health care subsidies under the Patient Protection and Affordable
Care Act
Each of these proposals, if passed, would have an impact on the modeling of a unified financing system in California. These proposals have the potential to reduce overall health expenditures or could increase the federal share of California’s total health expenditures. If any of these proposals is passed on the federal level, the Commission’s modeling and final report should be adjusted accordingly.
g. Model Options for Generating New Revenue.
Accurate dollar figure estimates of potential savings and spending is important to the development of a financing plan for a unified financing system. As I have previously mentioned, it is important that the Commission examine and present in our final report potential combinations of new state revenue sources that could be generated to account for the state share of health expenditures under a unified financing system. If possible, I urge the consulting team to provide a dollar range of potential new revenue sources that California may need to finance a unified financing system so that we can better develop tools for the legislature, governor, and the public to understand what varying combinations of revenue sources and varying levels of taxation or fees could be used to have a progressive, publicly financed unified financing system in California.

Commissioner Comsti, Comments on Methods and Assumptions Healthy California for All Commission July 31, 2021 Page 7 of 20
II. California Health Expenditures at Baseline and Under Unified Financing
Include clear presentation of savings potential of the direct payment, single-payer scenario.
As I discuss above, the consulting team’s modeling reiterates what other economic analyses of single-payer health care have repeatedly demonstrated—that single-payer health care would result in massive savings in health expenditures while providing more care to more people. Although there are areas in the modeling which may underestimate potential savings under a single-payer health system and underestimate the costs of the intermediary scenario (as I note in these comments), it is important that our final report clearly present the savings potential under unified financing presented by the consulting teams modeling.
Include California health expenditures and projected savings in numerical dollar in the final report.
Specifically, the numerical dollar findings in the consulting teams modeling of health expenditures under unified financing should be presented in the final report in contrast to the baseline California health expenditures. The value in the consulting team’s modeling is from this comparison between spending under the status quo, fragmented health care system with the projected spending under a single-payer unified financing system.
III. Estimated Effects
a. Universal Coverage
The estimates of the baseline expenditures for the uninsured and projected increases in expenditures for the currently uninsured (39% increase per person per year) fall within the range from other studies and give a reasonable basis for the modeling presented.
b. Expanding Adult Dental
As I note above, Congress is considering expansion of Medicare benefits to include dental coverage. If such legislation is passed before the Commission’s final report is completed, then we should adjust this modeling to reflect those changes in federal health program coverage and the federal share of health expenditures.
c. Reducing Cost Sharing
Include qualitative and quantitative analysis of self-rationing of care as a result of cost-sharing in final report.
It is important in our discussion of cost-sharing in our final report to examine and emphasize that the use of copayments or other kinds of cost-sharing result in self-rationing of care. Although I disagree with the inclusion of cost-sharing under a unified financing system, if

Commissioner Comsti, Comments on Methods and Assumptions Healthy California for All Commission July 31, 2021 Page 8 of 20
the consulting team’s modeling ultimately retains these variations that include cost-sharing, we must be clear that cost-sharing comes at a price beyond dollars—cost-sharing will result in patients avoiding and delaying needed care. Additionally, we must be clear that cost-sharing inappropriately shifts the burden of assessing what health care services are needed onto patients when that role should be played by a licensed health care professional after assessing the individual patient and applying their professional judgment.
Importantly, the RAND Health Insurance Experiment referenced in the consulting team’s
summary clearly demonstrated how cost-sharing, even in low dollar amounts, results in this problem of self-rationing of care. The inclusion of cost-sharing in a unified financing system is not merely a matter of reducing total health expenditures paid by the system, but rather cost-sharing will also have the effect of patients “reduc[ing] the use of both highly effective and less effective services in roughly equal proportions.”3
Finally, in addition to a qualitative discussion about the problem of care rationing
as a result of cost-sharing, the consulting team should include estimates of care rationing that may result from the cost-sharing levels that they have chosen to model. Along with the RAND Health Insurance Experiment, there are numerous other studies on how people self-ration care (care avoidance) or delay care as a result of cost-sharing at various levels. I would be happy to share some additional studies, if necessary, to aid the consulting teams on the analysis of self-rationing of care as a result of cost-sharing.
d. Lower Drug Prices Clearly state that drug price negotiation savings is a conservative estimate.
I appreciate the summary’s description of various studies on potential drug prices savings under a unified financing system, particularly the inclusion of analyses of drug price savings under the Department of Veteran Affairs (VA)-negotiated drug pricing model. That said, the consulting team’s modeling ultimately assumes a lower projected savings in drug pricing than each of the estimates of potential drug price savings from HR 3, VA-negotiated drug pricing, presented. Thus, in our final report we should be clear that the projected drug price savings of 40% under a unified financing system is a conservative estimate.
Below I have reiterated the prescription drug pricing analyses mentioned in the
consulting team’s summary, and I have provided direct links to the CBO and GAO studies mentioned and referenced in summary through secondary sources.
3 RAND Corporation. “The Health Insurance experiment: A Classic RAND Study Speaks to the Current Health
Care Reform Debate.” Research Brief, RAND Health (2006). https://www.rand.org/pubs/research_briefs/ RB9174.html

Commissioner Comsti, Comments on Methods and Assumptions Healthy California for All Commission July 31, 2021 Page 9 of 20
The Congressional Budget Office analysis of HR 3 estimates approximately price reductions between 57% to 75% when compared to Medicare Part D spending.4
The Government Accountability Office analysis of VA-negotiated drug pricing model estimates an average of 54% price reductions when compared to Medicare Part D prices (with a 68% reduction for generic drugs and 49% of brand-name drugs).5
The JAMA analysis of VA-negotiated drug pricing found that Medicare would have saved 44% if it had use VA list prices.6
e. Unwinding Managed Care
Set aside the problematic assumption that utilization control and provider risk-bearing under managed care is a laudable goal and acknowledge that managed care results in care denials and patient cherry-picking.
The discussion of managed care in presentations to the Commission and the summary of analytic findings presents managed care in a problematic value neutral manner. In our final report, we must clearly recognize that the retention or expansion of the managed care model would—by design—result in care denials, care delays, and cherry-picking by managed care as well as higher administrative costs, higher growth rates, limited networks, etc.
Importantly, in the discussion about managed care, we must not assume that utilization control and provider risk-bearing—two key design mechanism embedded in the managed care model—are goals that we ought to achieve. Utilization control and provider-risk bearing under managed care models fixate on reducing costs by limiting care and, thus, are antithetical to the Commission’s guiding principles of accessibility, equity, high quality, and universality. Managed care has not done what it was set out to do in California; the move to managed care has not controlled health care costs to the extent promised and has not resulted in better care. As discussed above, the analytic findings demonstrate that the intermediary scenario (i.e., the health system with managed care) would not save on costs overall compared to the direct payment scenario. There is much to discuss about whether managed care plan spending actually goes towards the provision of care, but I will reserve this discussion for our future Commission meetings. However, I wanted to briefly note two recent studies.
4 Adams, C. “CBO’s Model of Drug Price Negotiations Under the Elijah E. Cummings Lower Costs Now Act.”
Congressional Budget Office. Working Paper Series, Working Paper 2021-01 (Feb. 2021), https://www.cbo.gov/ system/files/2021-02/56905-Drug-Price-Negotiations.pdf.
5 U.S. Government Accountability Office. “Prescription Drugs: Department of Veterans Affairs Paid About Half as Much as Medicare Part D for Selected Drugs in 2017.” U.S. Government Accountability Office. GAO-
21-111 (Dec. 2020). https://www.gao.gov/assets/720/711467.pdf. 6 Venker, B, Stephenson, K, and Gellad, W. “Assessment of Spending in Medicare Part D If Medication Prices
From the Department of Veterans Affairs Were Used.” JAMA Intern Med. Research Letter, 179(3):431-33 (2019). https://jamanetwork.com/journals/jamainternalmedicine/fullarticle/2720124.

Commissioner Comsti, Comments on Methods and Assumptions Healthy California for All Commission July 31, 2021 Page 10 of 20
First, a recent March 2021 analysis compared traditional Medicare patient experiences of
integrated care with Medicare Advantage (MA) or Medicare Accountable Care Organizations (ACOs) patient experiences of integrated care.7 The study found that, despite the theoretical assertion that MA and ACOs as managed care models would promote integrated care, there was no observable benefit of MA or ACOs relative to traditional Medicare fee-for-service plans with respect to patient-perceived integrated care.
Second, a study from this year by consulting team lead Rick Kronick8 is helpful in
understanding whether and to what extent managed care plans actually use health expenditures on patient care or for profit. The study finds that Medicare Advantage plans applied increased revenues that the plans received from higher intensity coding of plan enrollees towards medical loss ratios at twice the magnitude than towards reducing bids. In other words, Medicare Advantage plans pocket twice as much Medicare dollars from higher intensity coding of enrollees as profit (or net revenue) than they pass back to patients.
With respect to quality, the findings of the 2019 California Health Care Foundation report on quality trends from Medi-Cal’s managed care plans are revealing. That report demonstrates that, under managed care, quality trends stagnated and that increased competition between plans did not improve quality.9 Notably, the report shows that California’s county organized health system—i.e., entities that are not motivated by profit and that are directly paying for and providing care in a single risk pool with no competition—did the best on quality and had lower administrative costs that privately run managed care plans.10
Additionally, we have known for decades that managed care models are correlated with
corporate consolidation of health care providers and vertical integration.11 As recently recognized by President Biden and the Federal Trade Commission, hyper-concentration of market power can drive harmful business practices. President Biden just issued an Executive Order making it the policy of the Administration to enforce antitrust laws to combat excessive concentration, abuses of market power, and harmful effects of monopoly and monopsony in health care markets, because the anticompetitive behavior of market consolidation has a high
7 Frean M et al. (2021). “Patient experiences of integrated care in Medicare accountable care organizations and
Medicare Advantage versus traditional fee-for-service.” Medical Care. 59(3): 195-201. https://pubmed.ncbi.nlm.nih .gov/33273291/.
8 Jacobs P, Kronick R (2021). “The effects of coding intensity in Medicare Advantage on plan benefits and finances.” Health Serv Res. 56(2):178-87. https://onlinelibrary.wiley.com/doi/abs/10.1111/1475-6773.13591.
9 Bindman A, Hulett D, Ostrer I, and Kang T (Sept. 2019). “A Close Look at Medi-Cal Managed Care: Statewide Quality Trends from the Last Decade.” California Health Care Foundation. https://www.chcf.org/wp-content/uploads/2019/09/CloseLookMediCalStatewideQualityTrends.pdf.
10 Ibid. 11 See Dranove, Simon C, White W (2002). “Is Managed Care Leading to Consolidation in Health-Care
Markets?” Health Serv Res. 37(3): 573–594. https://www.ncbi.nlm.nih.gov/pmc/articles/PMC1434652/.

Commissioner Comsti, Comments on Methods and Assumptions Healthy California for All Commission July 31, 2021 Page 11 of 20
potential to result in harm and lower quality of care for patients, 12 and the Federal Trade Commission just recognized mergers and acquisitions in health care markets as an enforcement priority.13 Finally, we know that managed care organizations in California have had a history of unlawfully denying and limiting care. For example, in December 2019, the Department of Managed Health Care (DMHC) fined a dozen health plans in enforcement actions for delayed care for high-cost patients, restricting access to specialists, and falsifying documents to cover it up.14 As I also noted at our last meeting, Kaiser Foundation Health Plans, often presented as exemplary of the managed care model, received one of the largest fines that the DMHC ever imposed, receiving a fine of $4 million in 2013 for limiting access to mental health care.15 Years after the 2013 fines from DMHC, it still had ongoing issues with timely access to mental health care issues and only settled with DMHC in 2017.16 On the national level, the U.S. Department of Justice has just intervened in six complaints against members of the Kaiser Permanente consortium for violations under the False Claims Act by submitting inaccurate diagnosis codes for its Medicare Advantage Plan enrollees in order to receive higher reimbursements from the Medicare managed care program (i.e., upcoding).17 For all the above reasons, I again urge us to not include the intermediary scenario or other options for managed care expansion in our final report. If we do retain the intermediary option, all of these issues with managed care—care denials, cherry picking/lemon dropping, corporate consolidations, limited networks, high administrative costs, etc.— should be enumerated and
12 See Office of the White House. “FACT SHEET: Executive Order on Promoting Competition in the American
Economy.” Office of the White House. Press Release (Jul. 9, 2021). https://www.whitehouse.gov/briefing-room/statements-releases/2021/07/09/fact-sheet-executive-order-on-promoting-competition-in-the-american-economy/.
13 See Federal Trade Commission. “FTC Authorizes Investigations into Key Enforcement Priorities.” Federal Trade Commission. Press Release (Jul. 1, 2021). https://www.ftc.gov/news-events/press-releases/2021/07/ftc-authorizes-investigations-key-enforcement-priorities.
14 California Department of Managed Health Care. “DMHC Fines 12 Health Plans $1.9 Million for Improperly Denying Care to Enrollees.” California Department of Managed Health Care. Press Release (Dec. 2019). https://www.dmhc.ca.gov/AbouttheDMHC/Newsroom/December18,2019.aspx.
15 California Department of Managed Health Care. “MHC Fines Kaiser $4 million for Deficiencies that Limit Access to Mental Health Services.” California Department of Managed Health Care. Press Release (Jun. 2013). https://www.dmhc.ca.gov/AbouttheDMHC/Newsroom/June25,2013.aspx.
16 California Department of Managed Health Care. “Final Report, routine Survey of Kaiser Foundation Health Plan, Inc. A Full Service Health Plan.” California Department of Managed Health Care (Jun. 12, 2017). https://dmhc.ca.gov/desktopmodules/dmhc/medsurveys/surveys/055_r_full%20service-behavioral%20health _061217.pdf
“Settlement Reached on Kaiser Permanente’s Repeated Mental Health Care Deficiencies.” California Healthline (Jul. 19, 2017). https://californiahealthline.org/news/settlement-reached-on-kaiser-permanentes-repeated-mental-health-care-deficiencies/
17 U.S. Department of Justice. “Government Intervenes in False Claims Act Lawsuits Against Kaiser Permanente Affiliates for Submitting Inaccurate Diagnosis Codes to the Medicare Advantage Program.” U.S. Department of Justice. Press Release (Jul. 30, 2021). https://www.justice.gov/opa/pr/government-intervenes-false-claims-act-lawsuits-against-kaiser-permanente-affiliates.

Commissioner Comsti, Comments on Methods and Assumptions Healthy California for All Commission July 31, 2021 Page 12 of 20
discussed in our final report; and we must analyze the intermediary scenario beyond its impact on total health expenditures.
Avoid repeating the false dichotomy between managed care and fee-for service.
As I have noted at several Commission meetings, we must avoid falling into the false assumption that the difference between the direct payment scenario and the intermediary scenario is the difference between managed care and fee-for-service. While it is not entirely clear from the summary and the detailed worksheets what precisely is being adjusted under this category of assumptions, it appears that the consulting team is assuming that under the direct payment scenario utilization and, thus, health care expenditures would increase as a result of managed care plans being replaced by fee-for-service. It bears repeating, however, that this assumption—that the direct payment model will use only fee-for-service—is a false one.
Adjust provider rates under the direct payment scenario to account for institutional global budgeting, valuation of physician services, and options for salaries.
Adjustment of expenditures under the direct payment scenario should reflect provisions on provider reimbursements in the leading proposals on single-payer health care, which include (1) institutional global budgeting, (2) valuation of physician services where primary care physician reimbursement rates would increase and specialists may see decreases, and (3) an option for salaried reimbursement for physicians as an alternative to fee-for-service. While it may be admittedly difficult to adjust modeling to account for a salaried reimbursement option for physicians, above and in my previous comments on the Draft Analytic Plan I have made suggestions for modeling to account for non-fee-for-service reimbursement options under current single-payer proposals.
Again, as I comment above, it does not appear that the modeling for the direct payment
scenario accounts for reductions in provider rates as a result of direct negotiations with providers. Although there is an adjustment in the modeling with respect to global budgeting for hospitals, that adjustment (as I discuss in more detail below) appears only to consider reductions in marginal cost increases under hospital global budgeting but does not account for reductions in the baseline hospital expenditures.
Account for provider time-savings under the direct payment scenario.
As I discuss below and in my comments on the Draft Analytic Plan, an important aspect of the direct payment, single-payer model is the reduction in billing and insurance-related administrative tasks results in increased time for providers to care for patients—or, in a phrase, provider administrative time savings. Because of the simplified billing and insurance processes under a single payer system, providers would have more time to care for the increased patient load thereby increasing their billable services and offsetting any losses due to changes in payer mix or reduced fees.
Commissioner Comsti, Comments on Methods and Assumptions Healthy California for All Commission July 31, 2021 Page 13 of 20
The 2020 Congressional Budget Office (CBO) analysis of Medicare for All proposals included estimates on increased supply or billable provider hours as a result of reduced administrative time for providers under a single-payer health care system. I detailed the CBO estimates of provider administrative time savings and resulting increases in the provision of care (supply) in my comments on the Draft Analytic Plan. I again urge us to include in our analytic findings or in our final report a discussion that accounts for provider administrative time savings and resulting increases in the provision of care that we can expect to result from the move to a direct payment model.
Account for differences in California’s private and public managed care models.
Finally, the modeling of managed care does not capture the differences between publicly and privately administered managed care plans. As I noted above, publicly administered managed care plans in California’s Medi-Cal managed care program—which are administered by public health systems where a county pays for and provides care—have better quality of care scores and lower administrative costs than privately administered managed care plans.18 Notably, increased competition in counties with two managed care plans, one county-run and one commercial insurer plan, did not see improvements in quality of care scores.
f. Hospital Pricing Adjustments
I appreciate the consulting team’s assumption that hospitals would be paid through institutional global budgeting in the direct payment scenario and the inclusion of the marginal cost analysis described in the summary. This said, as I mentioned above, it is unclear from the materials provided whether reductions in provider rates, including reductions in hospital rates is fully accounted for in the modeling.
Include savings from overall hospital rate reductions and lower marketing costs from global budgeting in addition to marginal cost reductions.
With respect to hospital pricing adjustments, it is unclear whether the modeling presented has sufficiently accounted for savings under institutional global budgeting as a result of direct negotiations between health care institutional providers and the unified financing system. For example, the institutional global budgeting process—if based on a combination of historical, projected, actual, and comparative costs—would overtime be able to bring hospital payments closer to actual costs. In other words, hospital global budgeting could reduce excess profit/net revenue that is not reinvested into providing care. Are the projected savings from hospital pricing adjustments solely based on reductions in marginal costs? Or does the modeling account for overall reductions in hospital expenditures?
18 Bindman A, Hulett D, Ostrer I, and Kang T. “A Close Look at Medi-Cal Managed Care: Statewide Quality
Trends from the Last Decade.” California Health Care Foundation (Sept. 2019). https://www.chcf.org/wp-content/uploads/2019/09/CloseLookMediCalStatewideQualityTrends.pdf.

Commissioner Comsti, Comments on Methods and Assumptions Healthy California for All Commission July 31, 2021 Page 14 of 20
Clarify the baseline cost estimates for hospitals and projected increases.
With respect to hospital pricing specifically, it is unclear whether reductions in hospital prices are only reflected in the marginal cost analysis described in the summary of methods and assumptions. Thus, to aid analysis of the assumptions presented on hospital global budgeting, it would be helpful for the consulting team to explain what they assume is the baseline costs for hospitals under the status quo, where those baseline estimates come from, and whether or how those baseline hospital costs are being applied to hospital global budgeting projects.
Similarly, it would be helpful if the consulting team explain and answer the following
questions:
Where in the detailed calculations are the projected marginal cost reductions from hospital global budgeting accounted for? Which worksheets and cells?
How are increases in hospital volume estimated?
Where does the unit of service come into the calculation of changes to hospital care expenditures?
Is the unit of service per patient or something else? From my best reading of the worksheet labelled “UF_Assumptions_1”, it appears that
only marginal costs are being accounted for in modeling. Is it accurate to say that, in the “UF_Assumptions_1” worksheet, marginal cost reductions in hospital pricing are captured in cell B4, which takes the “assumed growth rate for relevant types of expenditures” listed in B3 and divides that growth rate in half?
Provide the rationale behind 50% marginal cost reduction rate.
In addition to clarifying the baseline costs for hospitals being used for the consulting team’s model, it would be helpful if the consulting team explains why they chose to estimate marginal costs at 50% of average costs. Apply projected savings from institutional global budgeting to outpatient clinics.
Finally, as I explain elsewhere in these comments, pricing reduction based on global budgeting should also apply to outpatient clinics and it would be helpful if such savings in lower outpatient clinic rates are accounted for in this modeling.
g. Provider Administrative Savings
Clarify what is included in BIR administrative costs.
In order to provide better feedback to the consulting team on their modeling of provider administrative savings, it would be helpful if the consulting team provide definitions of what they are including as billing and insurance related (BIR) administrative costs. In the projections

Commissioner Comsti, Comments on Methods and Assumptions Healthy California for All Commission July 31, 2021 Page 15 of 20
on provider administrative savings, there may be some savings that are not captured in the modeling, but it is difficult to analyze without further detail.
A number of questions specifically come to mind with respect to what should be included
in the BIR administrative savings projects or elsewhere in the modeling: Given that the need for marketing will be greatly reduced for providers under a direct
payment system, is marketing and potential reductions costs related to reduced need for marketing under a direct payment scenario included in BIR administrative cost baselines and projections?
Given that billing need would be reduced if hospitals and other institutional providers are reimbursed through negotiated institutional global budgets, is administrative savings for institutional providers using global budgeting accounted for in BIR administrative savings?
Include time savings from reduced BIR administrative & other non-BIR administrative effects.
Beyond BIR administrative savings, modeling should account for non-BIR administrative savings and, in particular, the impact of administrative time savings for providers should be discussed in our final report and reflected in modeling as appropriate. As I mentioned in my comments on the Draft Analytic Plan, the simplified billing and insurance processes under the direct payment model would result in providers having reduced time spent on administrative activities and more time to provide care to patients.
As I requested in previous comments on the Draft Analytic Plan, the consulting team
should use the CBO’s 2020 analysis of single-payer proposals as well as PERI’s 2018 analysis of the Medicare for All Act to estimate increased supply or billable provider hours as a result of reduced administrative time for providers.
In addition to the aggregate increases in provider time to spend on care (or supply),
estimating administrative time savings—meaning increases in provider time to engage in billable services—is also important for the Commission’s analysis on the impact of unified financing on individual providers themselves. Administrative time savings under the direct payment model could serve as an offset to a provider’s losses due to changes in payer mix or reduced fees.
Clarify and detail the rationale behind assumptions on potential administrative savings in the intermediary scenario.
Why was 50% of the direct payment scenario savings chosen as the projected administrative savings under the intermediary scenario? The summary provides no rationale behind the assumption that BIR savings for providers under the intermediary scenario would be half the amount shown for the direct payment scenario. Considering that, under any intermediary scenario, fragmentation of the health system would still exist and providers would still have

Commissioner Comsti, Comments on Methods and Assumptions Healthy California for All Commission July 31, 2021 Page 16 of 20
multiple plans to bill to and multiple administrative systems to manage, we should not expect massive reductions in provider administrative costs.
Additionally, the administrative costs for providers under the intermediary scenario
would depend how that system is designed and on what differences in plans would be permissible. As I comment above, it is difficult to analyze the accuracy of this estimate for the intermediary scenario when there is no clear description of what that scenario would entail and because the Commission has yet to determine what the design of such scenario would look like or whether to include such alternative modeling at all in our final report. I understand that the consulting team assumes that under an intermediary scenario that managed care insurers and systems would only have one health plan with each provider. However, it is not clear that it would actually be the case that plans only would be permitted to have a single plan. For example, an intermediary scenario could allow for different provider networks, rates, deductibles, cost-sharing (within a permitted range), membership/enrollee rules, etc.
Clarify why and how assumptions about the Kaiser adjustment was reached.
From the summary provided, it is not clear how the 17.4% adjustment was calculated or how the 17.4% adjustment was applied. The consulting team should provide more details and clarity on what exactly is being done here. I have several questions and potential concerns about this adjustment.
First, is this Kaiser adjustment being applied to both the direct payment scenario and the
intermediary scenario? While it may be appropriated to apply the 17.4% downward adjustment in provider administrative savings to the intermediary scenario, given that Kaiser providers (Kaiser Foundation Hospitals and the Kaiser Permanente Medical Groups) as part of Kaiser managed care plan network presumably would not see any administrative changes, it would be inappropriate to downwardly adjust administrative saving under the direct payment scenario based on Kaiser’s share of California health expenditures.
Kaiser, even though it is an integrated delivery system, must still expend administrative
costs on numerous BIR activities that would be significantly reduced or altogether eliminated under the direct payment scenario. For example, Kaiser providers and Kaiser’s managed care plans have costs associated with billing to its multiple health plans, billing members for cost-sharing, debt collection from members, membership management, and, significantly, the costs associated with insurance adjustment and care denials under the managed care model.
Second, it is not clear whether marketing costs are accounted for in the Kaiser
adjustment. Under the intermediary scenario, costs associated from marketing related activities of Kaiser providers should be deducted from administrative savings relative to the direct payment model because marketing would still be required among competing health plans and systems. Oppositely, under the direct payment scenario, Kaiser’s marketing costs would no longer exist and, thus, should not be deducted from the administrative savings.

Commissioner Comsti, Comments on Methods and Assumptions Healthy California for All Commission July 31, 2021 Page 17 of 20
h. Payer Administrative Savings
My comments here concern the assumptions made about payer administrative savings under the intermediary scenario. To reiterate, it is difficult to assess the accuracy of the intermediary scenario modeling given that the Commission has not agreed nor discussed what this intermediary scenario would look like.
First, what is the rationale for assuming payer administrative expenses would be 6%
for the intermediary scenario? The only explanation that I can extrapolate from the materials provided is that 6% administrative expenses would be twice as much as the 3% payer administrative expenses assumed for the direct payment scenario (which is supported by several estimates about single-payer systems from other researchers). The consulting team should provide more detail on the rationale behind their assumption, supporting documentation for such assumptions (if any). In short, it should be clearly explained why the consulting team thinks there would be this amount of savings under the intermediary scenario.
Second, considering that “intermediary” systems would have to manage and regulate
multiple health plans or systems as well as membership under such plans or systems, why would payer administrative savings go down when there are still multiple plans and payers under the intermediary scenario?
Next, what is the rationale for assuming that health plans or systems under the intermediary scenario would have administrative costs similar to large self-insured employers at 5% and how was this estimate calculated? It is not clear why the consulting team believes that large self-insured employers would have similar administrative costs as health plans or systems under an intermediary scenario. A more detailed explanation of the rationale for comparing large self-insured employers with health plans or systems is necessary to assess whether this assumption is reasonable. Given that the enrollee pool for large self-insured employers is both easily identifiable and limited, large self-insured employers would not have similar marketing expenses and would presumably engage in less (or no) cherry-picking and associated membership management. Moreover, health plans or systems under an intermediary scenario may have higher numbers of plans that it administers as compared to large self-insured employers.
Additionally, the March 2021 report from the Acting U.S. Secretary of Labor to Congress
on self-insured health plans does not appear to provide percentage estimates of administrative costs for large self-insured employer plans. The consulting team should provide clear explanation about the calculations made or page numbers in the report to the figures used to reach the conclusion that large self-insured employer plans have administrative costs of 5%.
Finally, given that the unified financing system would have significantly more regulatory responsibilities over multiple health plans and systems under an intermediary scenario, the assumption that the system under the intermediary scenario would only have

Commissioner Comsti, Comments on Methods and Assumptions Healthy California for All Commission July 31, 2021 Page 18 of 20
1% administrative expenses seems to be a gross underestimate. At best, the administrative costs to the system under the intermediary scenario should be the same as the direct payment scenario at 3% not 1%. However, under the intermediary scenario, the system would likely have higher costs than the direct payment scenario. In comparison to the direct payment scenario, the system under the intermediary scenario would similarly have to regulate reimbursement rates with providers, negotiate drug prices with pharmaceutical companies, and administer enrollment in the unified financing system, and additionally, the system would also have higher administrative costs associated with the regulation of health plans, negotiating pricing and contracts with health plans, enforcing health plan requirements, fielding more patient complaints with the Department of Managed Health Care, etc. Additionally, depending on whether health plans or the system negotiates rates with providers, provider rate negotiations may be an additional administrative cost to the system. Given my questions above, the consulting team should, at minimum, provide additional detail on what assumptions they are making about the division of administrative responsibilities between the unified financing system and health plans or systems.
i. Just Transition for Administrative Workers I want to reaffirm the importance of including in the Commission’s plan for unified
financing a discussion about a just transition for workers who may be displaced or otherwise affected by the move to a unified financing system. Our plan should ensure that these workers have the greatest amount of flexibility. In addition to the wage replacement, retirement benefits, and job training mentioned in the summary, a just transition plan would also include job placement programs, preferential higher of these workers in the unified financing system, and education benefits to cover tuition for those workers who may want to return to school to learn new skills.
j. Costs for Reserves Given that, as the summary notes, the reserves modeled are “generous estimates” it
would be helpful if moderate estimates of reserves are also provided.
k. Expanding Long Term Supports and Services As mentioned above, the modeling for expansion of long-term supports and services
should be adjusted if the federal government moves forward with proposals to expand long-term supports and services, including home- and community-based services, provided through federal programs.
l. Reducing Health Expenditure Growth
Project more generous growth rate reductions in addition to the model’s conservative estimates.

Commissioner Comsti, Comments on Methods and Assumptions Healthy California for All Commission July 31, 2021 Page 19 of 20
Linking projected growth to the GDP growth rate is a good start to capture the potential savings from reduced. That said, the model’s most conservative estimates on growth rates, which assumes half a percent of reduced growth relative to national health expenditures (NHE), is very low. As I suggested in my comments on the Draft Analytic Plan, it would be helpful to project more generous estimates on reductions in health expenditure growth at 2% per year more slowly than NHE starting the second year of implementation.
Increase growth rate projections for the intermediary scenario relative to the direct payment scenario.
Given that it remains unclear whether or how provider rates would be negotiated under the intermediary scenario and given that an intermediary scenario would have higher administrative costs than the direct payment model, it would be reasonable to assume that the intermediary scenario would not attain the same levels of reductions in health expenditure growth than the direct payment model.
With respect to the intermediary scenario, however, it appears that the model assumes
that this kind of system which includes a role for health plans and systems would have similar reductions in growth as a direct payment, single-payer model. But the consulting team does not provide an explanation for assuming the same reductions in growth in both the direct payment scenario and the intermediary scenario.
Can the consulting team explain their assumptions on growth rate reductions in the intermediary scenario? It does not seem reasonable to assume that the same growth rate reductions for both the direct payment scenario and the intermediary scenario.
V. Additional Comments
a. Include Outpatient/Clinical Pricing Adjustments Through the Use of
Institutional Global Budgeting in the Direct Payment Scenario.
To reiterate a point that I made above with respect to provider rate reductions under the direct payment model generally, the modeling of the direct payment scenario should reflect potential reductions in prices related to institutional global budgeting for outpatient clinical services. As I mentioned in my comments on the Draft Analytic Plan, the direct payment model can be designed to reimburse outpatient clinics through institutional global budgeting processes, similar to hospital global budgeting. Again, OSHPD data for clinics, specifically annually reported data on clinic operating expenses, could be used to model projected price adjustment for outpatient clinics. My comments on the Draft Analytic Plan provide a more detailed discussion.
Commissioner Comsti, Comments on Methods and Assumptions Healthy California for All Commission July 31, 2021 Page 20 of 20
b. Include Assumptions on Savings From Reduced Fraud and Abuse Under the Direct Payment Scenario.
The methods and assumptions presented do not appear to consider reductions from fraud and abuse. The consulting team’s modeling should be adjusted to make such assumptions. The model should assume that reductions in fraud and abuse would be higher in the direct payment model than in the intermediary scenario given that the retention of multiple payers, plans, and risk-bearing health systems presents a greater opportunity for fraud and abuse.
As I discussed in my comments on the Draft Analytic Plan, the consulting team could
conservatively estimate reductions in fraud and abuse reductions under the direct payment scenarios by using the midpoint estimates from Donald Berwick and Andrew Hackbarth’s estimates of health care waste as a baseline and reducing those estimates by half.
c. Potential Error in Slide 23 Comparing the May and July versions of the slides on the analytic findings, there appears
to be an error in the slide on estimated changes in health expenditures under the direct payment scenario (Slide 23 in the July version). The May version of the slide states that, in 2031, capping provider payment growth would result in -10.4% change and the July version of the slides this figure is -10.1%. However, one or both of these projections must be in error. Given that the year 2022 savings projected in the May version is -0.4% and in the July version -3.0%, it would be reasonable to expect that savings in year 2031 would be greater for the July number given its greater year 2022 savings compared the Mary version.
I understand that there were minor technical corrections made in the July version, but it
would be helpful to understand why the 2031 savings figure is not higher in the updated version.
VI. Conclusion
I look forward hearing from the consulting team on my questions and comments, and I would be more than happy to provide further detail or clarification.
Sincerely,
Carmen Comsti, Commissioner Healthy California for All Commission
Attachment: Commissioner Comsti, Feedback on Draft Analytic Plan (May 6, 2021)

May 9, 2021 Rick Kronick and Marian Mulkey Consulting Team Leads Attn: Mark Ghaly, Chair Healthy California for All Commission
RE: Feedback on Draft Analytic Plan as of March 28, 2021 Dear Professor Kronick, Ms. Mulkey, and consulting team members:
I am writing to follow up on our April 7, 2021, meeting to discuss the consulting team’s Draft Analytic Plan (version dated March 28, 2021) to provide additional written feedback on the Draft Analytic Plan. As we discussed, I request that the Commission’s report model AB 1400, the bill introduced this legislative session by Assemblymember Ash Kalra and sponsored by the California Nurses Association (CNA) to establish a single-payer health care program called CalCare in California, as a design scenario for Unified Financing (UF). Modeling current legislation would best serve the Commission’s legislative mandate. Below, I have detailed some of the assumptions the consulting team should make when modeling AB 1400
I also wanted to raise a number of other key issues with regard to modeling the single-
payer scenario and modeling process as proposed by in the consulting team’s draft analytical plan. I address those issue below.
Please contact me if you have questions on the assumptions for modeling AB 1400 that I
have outlined below.
I. The Consulting Team’s Quantitative Modeling Process, Analytical Tools, and Data Must be Made Public and Open for Review.
As we discussed, ensuring that any program modeling processes, tools, and data are transparent and open to the public for review is paramount to ensuring the legitimacy of the Commission’s design modeling process. Importantly, the consulting team’s modeling and underlying assumptions and inputs must be made public well in advance of the Commission’s vote on the final report and with ample time for both Commissioners as well as the public to provide feedback. All quantitative modeling processes or analytical tools used by the consulting team must not be proprietary and must be disclosed for public review.
Moreover, in order to adequately obtain review and feedback from independent experts
outside of the consulting team as well as from the Commissioners, transparency in both the consulting team’s modeling and data must be available to the Commissioners and the public before a draft report is circulated. The highly abbreviated time frame for review allotted by the consulting team to the Commissioners and public last year for the Commission’s first report was

Commissioner Comsti, Feedback on Draft Analytic Plan as of March 28, 2021 Healthy California for All Commission May 6, 2021 Page 2 of 19
utterly inadequate. I again implore the consulting team to make every effort to avoid a similarly truncated process for the Commission’s second report. Limitations on public review of the consulting teams modeling process and data will result in justifiable public mistrust in the Commission’s work.
II. To Accurately Model Single-Payer, the Consulting Team Should Model Spending and Savings in the Aggregate.
The consulting team’s draft analytic plan states that it will project aggregate spending for
the first ten years, but it is not clear whether the consulting team plans on modeling aggregate savings under single-payer. The consulting team must project both aggregate spending and aggregate savings when compared to spending under the current system in its modeling of AB 1400 with spending and savings broken down by major category. The consulting team should apply a savings rate (relative to estimated spending under the current system in consideration of any changes in utilization) for all major categories of spending under AB 1400. It is critical that this kind of modeling with accurate representations of actual statewide health care spending and savings under single-payer is modeled for legislators, the Governor, and the public alike.
When estimating aggregate changes in spending, the consulting team should include in its modeling all of the following factors:
Administrative savings (for both providers and the single-payer system) Savings on prescription drug prices Savings from changes to individual provider payment rates Savings from changes to hospital payment rates Savings from reduced waste Utilization changes
Below I have included assumptions on changes in utilization and for each major category of spending in Table 1. The consulting team should model this scenario for AB 1400. After calculating aggregate spending, the consulting team should model the aggregate savings rates in health expenditures under AB 1400.
In the subsections that follows Table 1, I have included a brief discussion of the
assumptions for changes in utilization and for each major category of spending. I would be happy to discuss these assumptions with the consulting team further if you have any questions.

Commissioner Comsti, Feedback on Draft Analytic Plan as of March 28, 2021 Healthy California for All Commission May 6, 2021 Page 3 of 19
Table 1. Input Assumptions for AB 1400 Modeling.
CATEGORY ASSUMPTION
Utilization 11.5% increase compared to current system
utilization
Physicians and clinicians (non-institutional) payments
--
Primary care (family practice, internists, pediatricians,
geriatricians)
Weighted average of current payment rates for all payers
Specialists Medicare FFS
Growth Rate -2% than growth rate nationally
Hospital and outpatient clinic payments Operating expenses
Growth Rate -2% than growth rate nationally
Prescription drug spending 54% savings compared to current system prices
Administrative costs (billing and insurance-related for payers and
providers)
6.2% savings (as a percentage reduction in total health
expenditures)
Reduced waste 3.3% savings
(as a percentage reduction in total health expenditures)
a. Assumptions on changes in utilization.
The consulting team can use the CBO’s 2020 estimated increases in supply for the lower payment rate/lower cost-sharing scenario (Option 3) can be used to project increases in utilization under single-payer, which would be a 5.3% increase in utilization. For the lower payment rate/lower cost-sharing scenario (Option 3), CBO projects that supply under single-payer will increase by 5.3% in year five (2030) over the projected utilization under current law.1
1 Congressional Budget Office. “How CBO Analyzes the Costs of Proposals for Single-Payer Health Care
Systems That Are Based on Medicare’s Fee-for-Service Program.” Congressional Budget Office. Working Paper Series, Working Paper 2020-08 (2020), at pp. 134-135 (Exhibit 12-2). https://www.cbo.gov/system/files/2020-12/56811-Single-Payer.pdf.

Commissioner Comsti, Feedback on Draft Analytic Plan as of March 28, 2021 Healthy California for All Commission May 6, 2021 Page 4 of 19
b. Assumptions on savings from changes to individual physician/provider payments.
See Part III below.
c. Assumptions on savings from changes to hospital and clinical services payments.
See Part III below.
d. Assumptions on savings from reductions in prescription drug spending. Estimates on prescription drug price savings for the Veterans Health Administration
(VA) are useful in modeling AB 1400’s prescription drug price savings. The consulting team should use VA-negotiated drug price savings to estimate reductions in prescription drug prices under AB 1400, which on average are 54% less than Medicare Part D prescription drug prices. California can be expected to have similar or even greater bargaining power to negotiate lower prescription drug prices as the Veterans Health Administration (VA) given that California, under a single-payer system, would be negotiating on behalf of a significantly larger number of enrollees (39 million California residents) as the VA currently serves (8.7 million veterans). Estimates of VA-negotiated drug price savings include a GAO comparison of 399 brand-name and generic prescription drug prices paid by Medicare Part D to what the VA paid, even after accounting for applicable rebates and price concessions in the Part D program.2
The GAO study on VA prescription drug price found:
On average, the VA paid 54% less per unit than Medicare Part D, even after taking into account rebates and discounts.
The GAO also found that 233 of the 399 drugs in the sample were at least 50% cheaper in VA than in Medicare, and 106 drugs were at least 75%t cheaper.
Only 43 drugs were cheaper in Medicare than in VA.
The percent difference in price between the two programs was greater on average for generic drugs. Specifically, VA's prices were 68% lower than Medicare prices for the 203 generic drugs (an average difference of $0.19 per unit) and 49% lower for the 196 brand-name drugs (an average difference of $4.11 per unit).
2 U.S. Government Accountability Office. “Prescription Drugs: Department of Veterans Affairs Paid About
Half as Much as Medicare Part D for Selected Drugs in 2017.” U.S. Government Accountability Office. GAO-21-111 (Dec. 2020). https://www.gao.gov/assets/720/711467.pdf.

Commissioner Comsti, Feedback on Draft Analytic Plan as of March 28, 2021 Healthy California for All Commission May 6, 2021 Page 5 of 19
e. Assumptions on savings from reductions in administrative costs.
The consulting team, in its modeling of administrative savings from reduction in billing and insurance related costs, should consider such administrative savings for both the system overall (or what the CBO’s 2020 analysis calls payers’ administrative savings) as well as providers’ administrative savings; and the consulting team should model such administrative savings in the aggregate.
Administrative savings under AB 1400 as a percentage of total health expenditures can
be calculated from CBO’s 2020 reports estimates on the savings from reductions in payers’ administrative spending under the lower payment rate/lower cost sharing scenario (Option 3). Converting CBO’s dollar estimates of savings into a percentage of total health expenditures, administrative savings as a percentage reduction in total health expenditures would be 6.2%.3 Thus, to account for reductions in administrative spending under AB 1400, the consulting team should model AB 1400 by reducing total health expenditures by 6.2%.
f. Assumption on savings from reduced waste.
There are several estimates on the potential reduction of waste and fraud under a single-payer system. I suggest using the analysis of estimates of waste in the U.S. health care system by Donald Berwick, former head of the Centers for Medicare and Medicaid Services (CMS) and Andrew Hackbark.4 Berwick and Hackback’s study divides health care waste into several categories, including fraud and abuse among five other categories, and estimates the low, midpoint, and high national spending on waste in our health care system. To estimate the potential cost savings as a portion of total health expenditures, the consulting team should assume the midpoint of Berwick and Hackback’s estimates of national spending on fraud and abuse could be saved under AB 1400. In its modeling of savings from reduced waste under AB 1400, the consulting team should assume half of fraud and abuse spending at Berkwick and Hackbach’s midpoint estimate of 6.6% of total health expenditures could be saved under AB 1400, which is a savings of 3.3% of total health expenditures. Berkwick and Hackback’s study of U.S. health care system waste estimated that total spending on waste in its midpoint estimate is 34% of total national health care spending. They also estimated that spending on fraud and abuse, within total spending on waste. Using this midpoint estimate from Berkwick and Hackback, spending on fraud and abuse as a portion of total national health care spending can be calculated to be 6.6% (Table 2). Conservatively estimating that AB 1400 can reduce the fraud and abuse portion of U.S. health care waste by
3 A 6.2% savings rate was calculated by converting CBO’s estimated total savings in administrative spending in
Option 3 ($414 Billion) as a percentage of total NHE under current law ($6,631 Billion) as estimated by CBO for 2030. See CBO (2020), p. 121, Exhibit 11-1.
4 Berwick and Hackbarth. “Eliminating Waste in US Health Care.” JAMA (2012), 307(14): 1513-16, at doi:10.1001/jama.2012.362.

Commissioner Comsti, Feedback on Draft Analytic Plan as of March 28, 2021 Healthy California for All Commission May 6, 2021 Page 6 of 19
half, the consulting team should assume that the savings rate from reductions in waste under AB 1400, as a portion of total health spending, will be 3.3% (6.6% divided by 2). Table 2. Berwick and Hackback Analysis - Annual US Health Care Waste, Midpoint
Estimate (2011)
III. Payment Modeling for the Single-Payer Scenario Must Consider Payment Rates that Reflect Current Single-Payer Proposals, including Payment Based on Cost, Payment Based on Medicare Rates, and Institutional Global Budgeting.
a. Medicare Rates as a Baseline and CBO’s Scenarios as Separate
Estimates.
With respect to modeling payments under the single-payer scenario, the consulting team should model the following for (1) physician payment rates and (2) hospital and clinical payment rates.
1. Physician/Individual Provider Payment Rates.
As we discussed in our meeting last month and in response to the consulting team’s
question posed in its draft analytic plan, the consulting team should adjust primary care physician rates to account for the valuation of services provisions of AB 1400 to increase payment rates for primary care. As we also discussed, AB 1400 includes mechanisms to address existing provider payment structure inequities that undervalue cognitive-based services that primary care physicians provide and overvalue procedure-based services that specialists tend to provide.5 Thus, payment modeling for AB 1400 should adjust provider rates in a manner where
5 See Sinsky and Dugdale. “Medicare Payment for Cognitive vs Procedural Care: Minding the Gap.” JAMA
Intern Med. (2013), 173(18): 1733-37 doi:10.1001/jamainternmed.2013.9257, and Goodson. “Patient Protection and Affordable Care Act: Promise and Peril for Primary Care.” Annals Intern Med. (2010), 152(11): 742-44. https://doi.org/10.7326/0003-4819-152-11-201006010-00249.
Category of Spending Percentage of total national spending
Total Spending on Waste 34%
Spending on Fraud and Abuse 6.6%*
* Calculated using Berwick and Hackback’s dollar estimates on the total spending on waste for the midpoint estimate and the percentage of waste as a portion of total national spending (34%) to estimate the portion of spending on fraud and abuse spending in of total national spending.

Commissioner Comsti, Feedback on Draft Analytic Plan as of March 28, 2021 Healthy California for All Commission May 6, 2021 Page 7 of 19
cognitive-based services and primary care may be paid more than rates under the current system while certain procedure-based specialty care payments may decrease to more closely align with costs of care. To this end, the consulting team should model physician/individual provider payment rates under AB 1400 using Medicare fee-for-service rates ONLY FOR specialist. Primary care providers (individual providers in family practice, internists, pediatricians, geriatricians) would be paid the weighted average rate of all payers for primary care providers.
b. Hospital Funding at Operating Costs. As we discussed last month, given AB 1400’s and other recent proposals for single-payer
programs’ inclusion of hospital funding through institutional global budgets, modeling of AB 1400 should also estimate payment rates at operating costs as a baseline for hospital payment modeling. AB 1400’s hospital global budgeting is designed to bring hospital payments closer to costs. Under AB 1400, hospitals and other institutional providers would be paid quarterly lump sums from the CalCare program with adjustments for facilities experiencing interim payments available between quarterly payments under certain circumstances as well as special projects funds available to providers. It is important to note that hospital global budgeting under AB 1400 is neither a capitated model nor a fee for service model, which is different than some other permutations of hospital global budgeting that may be used in other systems across the world.
Intuitional global budgets under AB 1400 cover all operating expenses while eliminating
waste and excessive executive compensation, or, in other words, AB 1400’s institutional global budgeting is meant to align hospital and other institutional provider payments closer to cost. Tailored to each hospital, AB 1400’s institutional global budgets would ensure that hospitals and other institutional providers receive the appropriate funding for the services that their patients need. AB 1400’s use of institutional global budgets will stabilize rural and medically underserved hospitals at risk of closure by ensuring they have the resources to fully cover their operating expenses. The bill explicitly allows for adjustments to rural and medically underserved hospital operating budgets in global budget negotiations to decrease health care disparities as well as for justifiable differences in costs among providers, including the need for increased health care services in rural and medically underserved areas. Institutional providers would be funded separately for capital expenditures under AB 1400.
In addition to capital expenditures funding, AB 1400 would also include special projects
funding to help ensure hospitals in rural and medically underserved areas can stay open and modernize. The capital expenditure and special projects funding would help underfunded hospitals renovate and modernize their facilities, purchase new equipment, and hire the professional staff needed to ensure they can stay open and continue to provide high quality care to their patients and communities. Given AB 1400’s design for hospital payments through institutional global budgeting, the consulting team estimate for AB 1400 hospital payments by using reported “operating expenses” from California’s hospitals, which are available in OSHPD hospital data.

Commissioner Comsti, Feedback on Draft Analytic Plan as of March 28, 2021 Healthy California for All Commission May 9, 2021 Page 8 of 19
c. Clinic Funding at Operating Costs. As we also discussed, AB 1400 allows for outpatient clinics, as institutional providers, to
be paid through the institutional global budgeting process. As with hospitals under the institutional global budgeting process, this means clinics would be paid quarterly lump sums from the CalCare program with adjustments for facilities experiencing interim payments available between quarterly payments under certain circumstances as well as special projects funds available to providers. Like hospital funding, AB 1400 explicitly allows for adjustments to rural and medically underserved clinic operating budgets in global budget negotiations to decrease health care disparities as well as for justifiable differences in costs among providers, including the need for increased health care services in rural and medically underserved areas. As institutional providers, clinics would be funded separately for capital expenditures under AB 1400.
Again, institutional global budgets under AB 1400 cover all operating expenses while eliminating waste and excessive executive compensation, or, in other words, AB 1400’s institutional global budgeting is meant to align clinic payments, as institutional provider payments, closer to cost. Given AB 1400’s design for clinic payments through institutional global budgeting, the consulting team estimate outpatient clinic payments for both the low-end and high-end scenarios for AB 1400 by using OSHPD data for clinics, specifically annually reported data on operating expenses.
In California, each licensed clinic, including primary care clinics and specialty clinics, is
required to file an annual report with OSHPD containing financial, utilization, and patient demographic information. OSHPD annual clinic data from 2019 includes reports from Federally Qualified Health Clinics (FQHC), FQHS look alike clinics, community clinics, free clinics, chronic dialysis clinics, psychology clinics, rehabilitation clinics, surgical clinics as well as other clinics. Operating expense data collected by OSHPD for these clinics include data on salaries, wages, and benefits; contracted services; supplies (medical and dental); supplies (office); outpatient care services; rent/depreciation/interest; utilities; continuing education; information technology; and other operating expenses. OSHPD annual clinic data can be found here: https://oshpd.ca.gov/data-and-reports/healthcare-utilization/clinic-utilization/.
IV. The Consulting Team Should Create Interactive Calculators to Model New Revenue and Redirected Revenue Sources for Single-Payer.
As we briefly discussed, there is clear interest that the Commission more closely examine
potential combinations of new state revenue sources for a single-payer program. As I have mentioned before at previous Commission meetings, it is important that any such examination of potential new state revenue sources consider a diversity of revenue sources as well as multiple combinations of such revenue sources.

Commissioner Comsti, Feedback on Draft Analytic Plan as of March 28, 2021 Healthy California for All Commission May 9, 2021 Page 9 of 19
To this end, I suggest that the consulting team develop a publicly available interactive online calculator or tool where legislators, researchers, and members of the public alike can select varying combinations of revenue sources and varying levels of taxation or fees for each source. A hands-on calculator or visualization on single-payer financing would aid a robust public discussion on the potential financing plans for a single-payer system.
In any calculator or analysis of varying new state revenue, I request that, including but
not limited to, all of the following new revenue sources be included in an interactive online calculator:
Payroll employer-side Payroll employee-side Gross receipts tax Corporate income and profit tax Marginal personal income tax on high-income individuals/households Sales tax
Additionally, existing revenue streams could be redirected into a UF system or existing tax exemptions could be eliminated and revenue directed into a UF system. The consulting team should also include in its analysis of state revenue generation for a UF system the following:
Elimination of tax exemptions for corporations, including those identified in the California Budget & Policy Center’s January 2020 report on California tax breaks.6
Reducing health provider tax breaks for charity care or hospital fees to compensate for the reduction in charity care under a UF system.
Redirecting state funds from policing and incarceration into a UF system The consulting team should also consider potential revenue sources such as the following:
Wealth taxes Use taxes Sin taxes Oil or other natural resource extraction taxes
Importantly, the consulting team should ensure that it includes in its analysis of any new or redirected revenue options exemptions (or tax credits) for low- and middle-income families as well as exemptions for small businesses. Exemptions and tax credits included in the Political
6 Note that the consulting team should not include in financing calculations the elimination of tax breaks for
low- and middle-income households. See California Budget & Policy Center. “Tax Breaks: California’s $60 Billion Loss. ” California Budget & Policy Center. (Jan. 2020). https://calbudgetcenter.org/wp-content/uploads/2020/01/ CA_Budget_Center_tax-expenditures-2020.pdf.

Commissioner Comsti, Feedback on Draft Analytic Plan as of March 28, 2021 Healthy California for All Commission May 9, 2021 Page 10 of 19
Economy Research Institute (PERI)’s 2017 financing analysis for SB 562 could serve as a model for appropriate exemptions and tax credits.
Additionally, the consulting team should also examine several levels of new taxation for
each type of new revenue source. For example, one financing combination for a UF system calculator could use the type of taxes, taxation levels, and exemptions described in the 2017 financing analysis for SB 562 by PERI, which included a 2.3% gross receipts tax on businesses (with an exemption of the first $2 million in business receipts so that small businesses would pay not gross receipts tax); and a 2.3% sales tax increase (with exemptions for spending on housing, utilities, and food, and a 2% income tax credit for low-income families).7 A different combination of a financing calculator for a UF system could use a 2.3% gross receipts tax (with PERI institute exemptions) but, instead of including a 2.3% sales tax, it could include a small payroll tax divided equally between employers and employees. I urge the consulting team, at minimum, produce a table of varying new state revenue or redirected revenue sources and how much each type of revenue source could generate with a range of taxation or fee levels. This kind of visualization of what varying combinations of new state revenue or redirected revenue sources may look like and the amount of revenue they may generate would be an incredibly useful tool for legislators, the Commission, and the public to have as we continue in our discussion of single-payer health care in California.
I would be happy to discuss further what levels of taxation and what exemptions could be considered in these new or redirected revenue calculations.
V. The Consulting Team Should Model the CalCare Program in AB 1400 Based on the Following Assumptions and Design Specifications.
As we discussed last month, I request that the consulting team model AB 1400 as a
system design scenario for single-payer in California rather than, as you indicated, SB 562, which was introduced in the 2017-2018 legislative session. AB 1400 is the current state single-payer program being considered by the state legislature and it would serve the interests of the people of California best for the Commission to consider the AB 1400 rather than SB 562.
Below, I have outlined key modeling specifications for the CalCare program under AB
1400 using the framework and categories that the consulting team used in the March 28, 2021, draft analytic plan. If you have any questions about the design specifications and modeling assumptions that I detail below, please contact me. As you know, the California Nurses Association (CNA) is the sponsor of AB 1400. I played a key role in CNA’s legislative drafting team for AB 1400 and would be happy to further explain design features of the CalCare program.
7 Pollin et al. “Economic Analysis of the Healthy California Single-Payer Health Care Proposal (SB-562).”
Political Economy Research Institute (PERI): University of Massachusetts, Amherst (2017). https://www.peri.umass .edu/publication/item/996-economic-analysis-of-the-healthy-california-single-payer-health-care-proposal-sb-562.
Commissioner Comsti, Feedback on Draft Analytic Plan as of March 28, 2021 Healthy California for All Commission May 9, 2021 Page 11 of 19
AB 1400 Design Features
Modeling Specifications: How Unified Financing Would Be Implemented Under AB 1400
1) Eligibility. All California residents will be covered by CalCare, although for residents also covered by the Indian Health Service or TRICARE could continue to receive services under those programs. Individuals receiving Medicare, Medi-Cal, employer-sponsored insurance, individual market coverage, and the health portion of workers’ compensation will be incorporated into the system of CalCare.
Note that the health care portion of workers’ compensation should not be included as a cost of AB 1400 financing as this could lead to moral hazard among employers.
2) Covered Benefits. CalCare will cover Essential Health Benefits, including behavioral health conditions. In addition, CalCare will cover adult dental benefits, vision, hearing, and long term care. Care coordination under AB 1400 is not a specified benefit and should not be included as a cost of AB 1400.
3) Provider Networks. CalCare will be modeled under the AB 1400 scenario in which Californians can choose to receive services from any licensed provider, and in which CalCare makes direct payments to hospitals, physicians, and other health care providers.
4) Cost-Sharing. The AB 1400 model does not include cost-sharing for any enrollee.
5) Provider Payments. Under AB 1400, the UF authority, CalCare, will provide direct payments to participating providers and set provider payment rates. No health plans will be used as intermediaries. CalCare would (1) pay institutional providers (hospitals and outpatient clinics) through institutional global budgeting negotiations as outlined in the legislation; and (2) give individual providers (physicians and physician groups) the option to be paid through collectively negotiated fee-for-service rates or through salaries determined through institutional provide global budgeting negotiations.
a. Institutional Provider Payments. For institutional providers (including hospitals and outpatient clinics), AB 1400 modeling should assume payments as institutional operating costs.
i. For hospitals. Operating costs can be estimated by using annually reported “operating expense” data from hospitals to OSHPD.
ii. For outpatient clinics. Operating costs can be estimated by using annually reported “operating expense” data from clinics to OSHPD in annual utilization reports.

Commissioner Comsti, Feedback on Draft Analytic Plan as of March 28, 2021 Healthy California for All Commission May 9, 2021 Page 12 of 19
b. Physician (Non-Institutional) Payments. Because AB 1400 includes provisions on the valuation of services of primary care, physician payments should be modeled to increase the rates of primary care physicians (family practice, internists, pediatricians, geriatricians) relative to specialists. See Part III above for more detail on modeling these assumptions under AB 1400. Non-institutional physician payment design features of AB 1400 include the following:
i. For noninstitutional providers, AB 1400 includes a rebuttable presumption that the Medicare fee-for-service rates of reimbursement are reasonable.
ii. AB 1400 sets fee-for-service payment rates to reflect the value for health care items and services furnished. It would address potential pay inequities based on undervaluing the cognitive-based services that primary care physicians provide and overvaluing procedure-based services that specialists tend to provide.8 This means that primary care physicians may see their fees increase while specialists may see their fees decrease.
iii. Because of the simplified billing and insurance processes, fee-for-service providers would have more time to care for the increased patient load under AB 1400 thereby increasing their billable services and offsetting any losses due to changes in payer mix or reduced fees.
c. Estimating providers’ administrative savings (monetary and time savings). While estimated monetary savings for providers from reduced billing and insurance related costs could be assumed to lead to reduced payment rates as estimated by in the CBO’s 2020 analysis, it is equally as important that both (1) administrative savings for CalCare as a whole system as a whole in the aggregate is accounted for outside of payment rate modeling (see discussion in Part III above) and (2) that administrative time savings for providers (the decrease in time spent on administrative activities) is also factored into modeling of increased provider supply (see discussion of administrative time savings below).
6) Payment Growth Rates. In the second and subsequent years of AB 1400, payment rates to health care providers should be modeled at 2.0% per year more slowly than payment rates nationwide.
7) Prescription Drug Price Savings. The UF authority in AB 1400, CalCare, will negotiate
drug prices with manufacturers. Estimates on prescription drug price savings for the Veterans
8 See Sinsky and Dugdale. “Medicare Payment for Cognitive vs Procedural Care: Minding the Gap.” JAMA
Intern Med. (2013), 173(18): 1733-37 doi:10.1001/jamainternmed.2013.9257, and Goodson. “Patient Protection and Affordable Care Act: Promise and Peril for Primary Care.” Annals Intern Med. (2010), 152(11): 742-44. https://doi.org/10.7326/0003-4819-152-11-201006010-00249.

Commissioner Comsti, Feedback on Draft Analytic Plan as of March 28, 2021 Healthy California for All Commission May 9, 2021 Page 13 of 19
Health Administration (VA) would also be useful in modeling the scenario for AB 1400’s prescription drug price savings.
Modeling Specifications: Generating New State-Based Revenues
Please see Part IV above. Key Assumptions on Utilization and Spending 1) Aggregate Health Expenditure Savings. As discussed in Part II above, billing and
insurance related administrative savings should be subtracted in the aggregate after provider payment costs are calculated to determine changes in national health expenditures. Estimated aggregate administrative savings—when considered as a percentage of administrative savings—in the CBO’s estimates on changes in national health expenditures are instructive here. Please see Part II for a discussion on the varying factors that should be considered when the consulting team models aggregate savings under AB 1400.
2) Increased Supply. Reduced time spent by providers on administrative activities under AB
1400 would increase the amount of care that those providers would be able to supply. In other words, health care providers—nurses, doctors, hospitals, and other providers—would all have more time to spend to provide care for patients.
The CBO’s 2020 analysis of single-payer proposals as well as PERI’s 2018 analysis of the Medicare for All Act include estimates on increased supply or billable provider hours as a result of reduced administrative time for providers. The consulting team should use both CBO’s 2020 analysis and PERI’s 2018 analysis, as described below, when modeling supply increases under AB 1400.
a. CBO’s 2020 estimates on reduced administrative time for providers and increased
supply under single-payer proposals.
i. Estimated reductions in administrative time under single-payer for doctors and nurses. CBO estimates that physicians currently spend about 10% of their time on
administrative activities, and nurses spend about 23%.9 Note that these estimates on administrative time currently spent by physicians and nurses may be low in that it is unclear whether CBO’s estimate includes time spent on reporting requirements tied to provider payments.
9 See CBO (2020) at pp. 72-73.
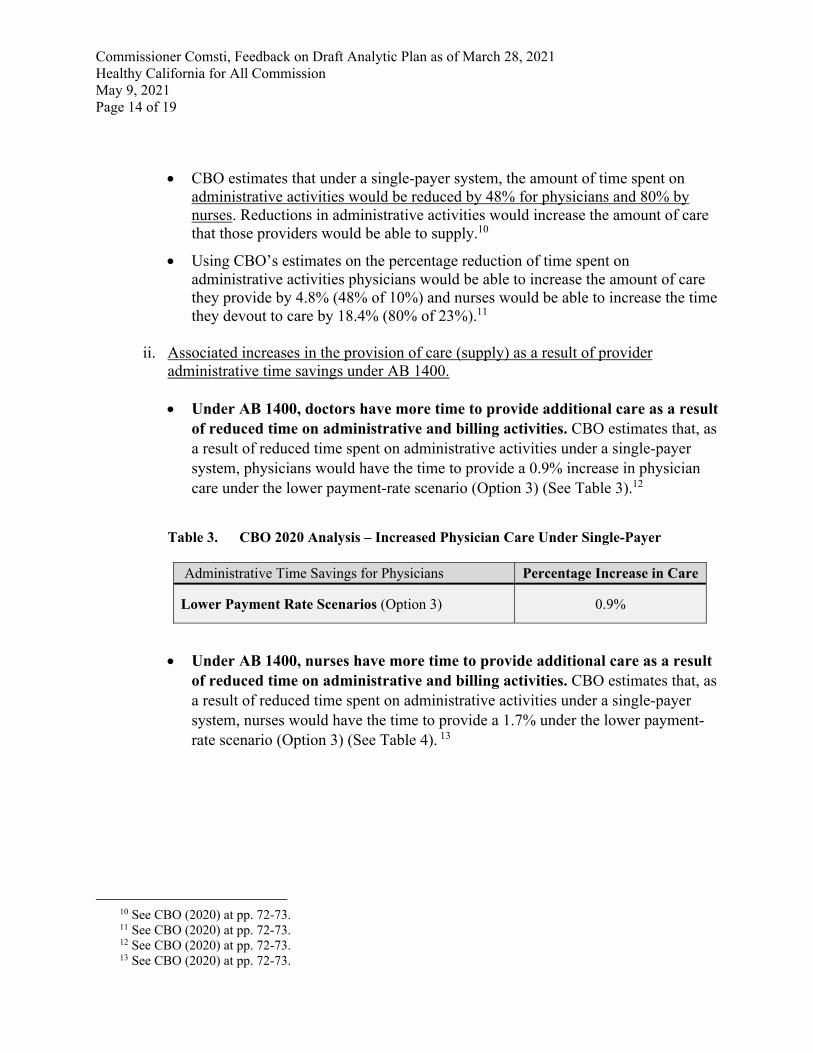
Commissioner Comsti, Feedback on Draft Analytic Plan as of March 28, 2021 Healthy California for All Commission May 9, 2021 Page 14 of 19
CBO estimates that under a single-payer system, the amount of time spent on administrative activities would be reduced by 48% for physicians and 80% by nurses. Reductions in administrative activities would increase the amount of care that those providers would be able to supply.10
Using CBO’s estimates on the percentage reduction of time spent on administrative activities physicians would be able to increase the amount of care they provide by 4.8% (48% of 10%) and nurses would be able to increase the time they devout to care by 18.4% (80% of 23%).11
ii. Associated increases in the provision of care (supply) as a result of provider administrative time savings under AB 1400. Under AB 1400, doctors have more time to provide additional care as a result
of reduced time on administrative and billing activities. CBO estimates that, as a result of reduced time spent on administrative activities under a single-payer system, physicians would have the time to provide a 0.9% increase in physician care under the lower payment-rate scenario (Option 3) (See Table 3).12
Table 3. CBO 2020 Analysis – Increased Physician Care Under Single-Payer
Administrative Time Savings for Physicians Percentage Increase in Care
Lower Payment Rate Scenarios (Option 3) 0.9%
Under AB 1400, nurses have more time to provide additional care as a result of reduced time on administrative and billing activities. CBO estimates that, as a result of reduced time spent on administrative activities under a single-payer system, nurses would have the time to provide a 1.7% under the lower payment-rate scenario (Option 3) (See Table 4). 13
10 See CBO (2020) at pp. 72-73. 11 See CBO (2020) at pp. 72-73. 12 See CBO (2020) at pp. 72-73. 13 See CBO (2020) at pp. 72-73.

Commissioner Comsti, Feedback on Draft Analytic Plan as of March 28, 2021 Healthy California for All Commission May 9, 2021 Page 15 of 19
Table 4. CBO 2020 Analysis – Increased Nursing Care Under Single-Payer
Administrative Time Savings for Nurses Percentage Increase in Care
Lower Payment Rate Scenarios (Option 3) Increases in hospital care Increases in doctor’s office care
1.7% 1.1%
Under AB 1400, other providers have more time to provide additional care as a result of reduced time on administrative and billing activities. CBO estimates that, as a result of reduced time spent on administrative activities, providers of other services would have the time to provide a 1.0% increase in health care services under the lower payment-rate scenario (Option 3) (See Table 5).14
Table 5. CBO 2020 Analysis – Increased Care by Other Providers Under Single-Payer
Administrative Time Savings for Other Providers Percentage Increase in Care
Lower Payment Rate Scenarios (Option 3) 1.0%
b. PERI’s 2018 estimates on reduced administrative time and increased billable provider hours under the Medicare for All Act. PERI estimates in its 2018 analysis of the Medicare for All Act that the reduction in administrative tasks for physicians would increase the time they could devote to patient care by 4 hours per week or an estimated 8% of physician’s workweek (based on a 50-hour week).15 Thus, physician administrative time savings would translate into an 8% increase in billable hours.
c. CBO’s 2020 estimates of total increases in supply under single-payer. CBO estimates
total increases in supply under single-payer due to changes in payments, reduction in provider administrative spending, reduction in provider administrative time, among other estimates. For lower provider payment rate Option 3, CBO estimates a total increase in supply of 5.3% with estimate made for 2030 (year 5 of single-payer program implementation).16
14 See CBO (2020) at pp. 72-73. 15 Pollin et al. “Economic Analysis of Medicare for All.” Political Economy Research Institute (PERI):
University of Massachusetts, Amherst (2018), at p. 102, 104. https://www.peri.umass.edu/publication/item /996-economic-analysis-of-the-healthy-california-single-payer-health-care-proposal-sb-562.
16 CBO (2020), at pp. 134-135 (Exhibit 12-2).

Commissioner Comsti, Feedback on Draft Analytic Plan as of March 28, 2021 Healthy California for All Commission May 9, 2021 Page 16 of 19
3) Changes in Utilization.
a. Changes in utilization will vary by types of provider service. Changes in the utilization of health care services with the adoption of a AB 1400 are not likely to be uniform across all types of providers because barriers to primary and preventive care—including uninsurance, underinsurance, and other financial barriers to care—would be eliminated and, thus, individuals may seek more primary and preventive care but need less specialty and acute care as health care access improves. Thus, changes in utilization ideally would be modelled to account for differences in utilization of different kinds of services.
b. Changes in utilization calculated by increase supply. Estimating increases in supply is helpful in modeling what actual increases in utilization would be as increased utilization would be limited by increases in supply. Please see Part II, Section a. to see estimated changes in utilization based on increased supply under AB 1400 modeling.
Modeling Output 1) Aggregate savings on health expenditures under AB 1400. As mentioned above, the
consulting team’s draft analytic plan does not clearly plan on modeling aggregate savings under single-payer as compared to our current system. It is important that savings in the aggregate is estimated and appropriately discounted from projected health expenditures. (See discussion in Part II above.)
2) AB 1400 modeling must discount provider administrative monetary savings from total spending or costs to providers. To estimate the monetary administrative savings for providers from the reduced billing and insurance activities, output modeling should consider decreases in administrative spending for different types of providers and subtract those saving from estimated spending or costs to provider. CBO’s 2020 analysis includes estimates of monetary administrative savings for providers which is instructive in the consulting team’s output modeling. CBO’s 2020 analysis includes estimates of administrative savings for providers by type. CBO’s estimates on the changes in provider administrative spending and overall reductions (or savings) for providers on administrative spending under single-payer have been placed into a table format below in Table 6.

Commissioner Comsti, Feedback on Draft Analytic Plan as of March 28, 2021 Healthy California for All Commission May 9, 2021 Page 17 of 19
Table 6. CBO 2020 Analysis – Administrative Savings for Providers17
Type of Provider
Current Spending on Administrative
Activities (as a % of net revenue)
Spending on Administrative
Activities Under Single-Payer (as a %
of net revenue)
Percentage Reduction/Savings Under Single-Payer
Hospitals 19% 12% 35%
Physician and clinical services
15% 9% 40%
Other services 9% 6% 33%
2) Potential reductions in provider payments should be offset with increased reimbursable care as a result of providers’ administrative time savings. Both the CBO in its 2020 analysis of single-payer and PERI’s 2018 analysis of the Medicare for All Act estimate potential increases in billable provider hours as a result of administrative time savings (or provider time freed up from a reduction in administrative tasks) and other administrative savings. When examining the effect of payment rate changes on physicians, the draft analytic plan appears only to consider changes in a physician’s payer mix. However, output modeling must also offset potential changes in payment rates with increased take home pay as a result of administrative savings.
As discussed above, CBO states in its 2020 analysis of single-payer that “[p]roviders would shift resources from paying for administrative staff and equipment to providing care, thus expanding available care[,]” and that “[p]roviders’ responses to their administrative savings partially offset the effects of any reductions in payments—and amplify the effects of any increases in payments—on the amount of care provided.”18
a. PERI’s 2018 analysis of increased physician billable hours would offset estimated
reductions in payment rates. Using estimates on changes in physician payments (7-9% reduction) as well as estimates on increases in billable physician hours (8% increase) from PERI’s 2018 analysis of the Medicare for All Act, physician incomes on average would stay relatively the same. In other words, reductions in payment rates for physicians would be offset by the increase in billable hours. PERI estimates that physician compensation levels would, as a result of addition of uniform Medicare payment rates, fall between 7% to 9% (depending on specialty) and that an aggregate decline in spending on physician payments would be 7.1%.19 As mentioned above, PERI’s 2018
17 CBO (2020), at p. 69. 18 CBO (2020), at pp. 67-70. 19 Pollin et al. (2018), at pp. 130-33, Appendix 2.
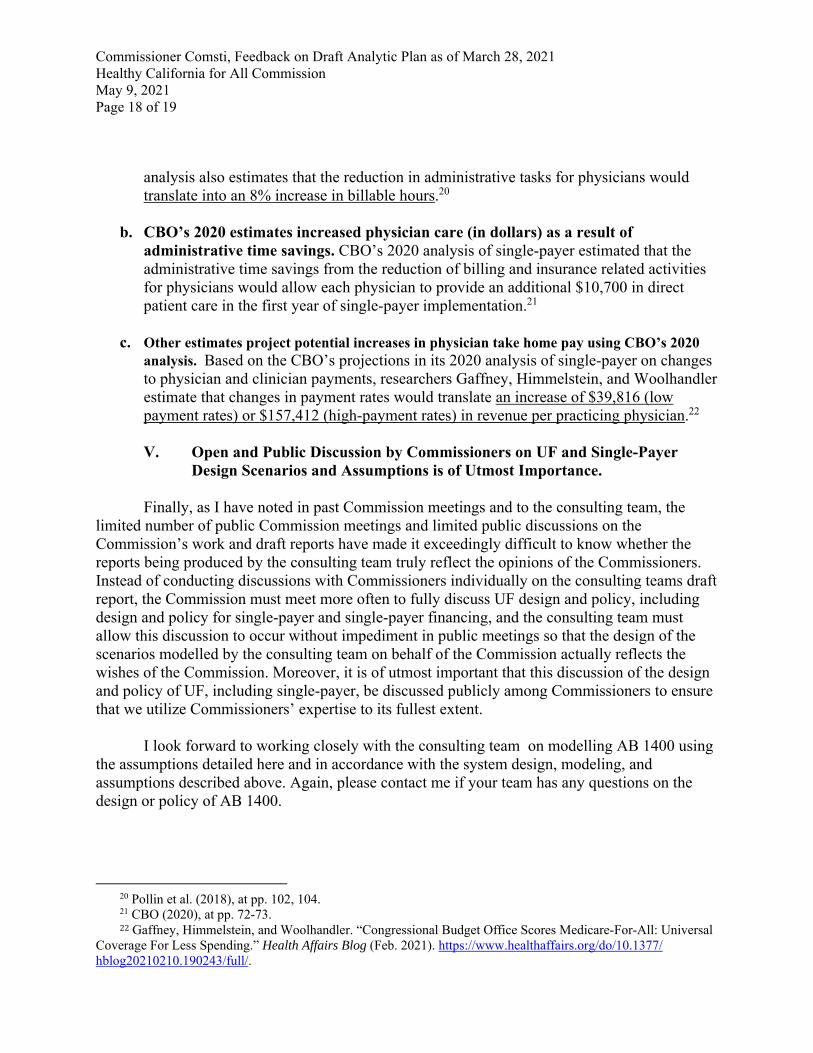
Commissioner Comsti, Feedback on Draft Analytic Plan as of March 28, 2021 Healthy California for All Commission May 9, 2021 Page 18 of 19
analysis also estimates that the reduction in administrative tasks for physicians would translate into an 8% increase in billable hours.20
b. CBO’s 2020 estimates increased physician care (in dollars) as a result of
administrative time savings. CBO’s 2020 analysis of single-payer estimated that the administrative time savings from the reduction of billing and insurance related activities for physicians would allow each physician to provide an additional $10,700 in direct patient care in the first year of single-payer implementation.21
c. Other estimates project potential increases in physician take home pay using CBO’s 2020
analysis. Based on the CBO’s projections in its 2020 analysis of single-payer on changes to physician and clinician payments, researchers Gaffney, Himmelstein, and Woolhandler estimate that changes in payment rates would translate an increase of $39,816 (low payment rates) or $157,412 (high-payment rates) in revenue per practicing physician.22
V. Open and Public Discussion by Commissioners on UF and Single-Payer
Design Scenarios and Assumptions is of Utmost Importance.
Finally, as I have noted in past Commission meetings and to the consulting team, the limited number of public Commission meetings and limited public discussions on the Commission’s work and draft reports have made it exceedingly difficult to know whether the reports being produced by the consulting team truly reflect the opinions of the Commissioners. Instead of conducting discussions with Commissioners individually on the consulting teams draft report, the Commission must meet more often to fully discuss UF design and policy, including design and policy for single-payer and single-payer financing, and the consulting team must allow this discussion to occur without impediment in public meetings so that the design of the scenarios modelled by the consulting team on behalf of the Commission actually reflects the wishes of the Commission. Moreover, it is of utmost important that this discussion of the design and policy of UF, including single-payer, be discussed publicly among Commissioners to ensure that we utilize Commissioners’ expertise to its fullest extent.
I look forward to working closely with the consulting team on modelling AB 1400 using
the assumptions detailed here and in accordance with the system design, modeling, and assumptions described above. Again, please contact me if your team has any questions on the design or policy of AB 1400.
20 Pollin et al. (2018), at pp. 102, 104. 21 CBO (2020), at pp. 72-73. 22 Gaffney, Himmelstein, and Woolhandler. “Congressional Budget Office Scores Medicare-For-All: Universal
Coverage For Less Spending.” Health Affairs Blog (Feb. 2021). https://www.healthaffairs.org/do/10.1377/ hblog20210210.190243/full/.

Commissioner Comsti, Feedback on Draft Analytic Plan as of March 28, 2021 Healthy California for All Commission May 9, 2021 Page 19 of 19
Sincerely,
Carmen Comsti, Commissioner Healthy California for All Commission