Embed Size (px)
Citation preview

Chapter 9Profit Planning
Solutions to Questions
9-1 A budget is a detailed quantitative plan for the acquisition and use of financial and other resources over a given time period. Budgetary control involves the use of budgets to control the actual activities of a firm.
9-21. Budgets communicate manage-
ment’s plans throughout the organization.2. Budgets force managers to think
about and plan for the future.3. The budgeting process provides a
means of allocating resources to those parts of the organization where they can be used most effectively.
4. The budgeting process can uncover potential bottlenecks before they occur.
5. Budgets coordinate the activities of the entire organization by integrating the plans of its various parts. Budgeting helps to ensure that everyone in the organiza-tion is pulling in the same direction.
6. Budgets define goals and objectives that can serve as benchmarks for evaluat-ing subsequent performance.
9-3 Responsibility accounting is a system in which a manager is held responsible for those items of revenues and costs—and only those items—that the manager can control to a significant extent. Each line item in the budget is made the responsibility of a manager who is then held responsible for differences between budgeted and actual results.
9-4 A master budget represents a summary of all of management’s plans and goals for the future, and outlines the way in which these plans are to be accomplished. The master budget is
composed of a number of smaller, specific budgets encompassing sales, production, raw materials, direct labor, manufacturing overhead, selling and administrative expenses, and inventories. The master budget generally also contains a budgeted income statement, budgeted balance sheet, and cash budget.
9-5 The level of sales impacts virtually every other aspect of the firm’s activities. It determines the production budget, cash collections, cash disbursements, and selling and administrative budget that in turn determine the cash budget and budgeted income statement and balance sheet.
9-6 No. Planning and control are different, although related, concepts. Planning involves developing goals and developing budgets to achieve those goals. Control, by contrast, involves the means by which management attempts to ensure that the goals set down at the planning stage are attained.
9-7 The flow of budgeting information moves in two directions—upward and downward. The initial flow should be from the bottom of the organization upward. Each person having responsibility over revenues or costs should prepare the budget data against which his or her subsequent performance will be measured. As the budget data are communicated upward, higher-level managers should review the budgets for consistency with the overall goals of the organization and the plans of other units in the organization. Any issues should be resolved in discussions between the
© The McGraw-Hill Companies, Inc., 2008. All rights reserved.Solutions Manual, Chapter 9 455

individuals who prepared the budgets and their managers.
All levels of an organization should participate in the budgeting process—not just top management or the accounting department. Generally, the lower levels will be more familiar with detailed, day-to-day operating data, and for this reason will have primary responsibility for developing the specifics in the budget. Top levels of management should have a better perspective concerning the company’s strategy.
9-8 A self-imposed budget is one in which persons with responsibility over cost control prepare their own budgets. This is in contrast to a budget that is imposed from above. The major advantages of a self-imposed budget are: (1) Individuals at all levels of the organization are recognized as members of the team whose views and judgments are valued. (2) Budget estimates prepared by front-line managers are often more accurate and reliable than estimates prepared by top managers who have less intimate knowledge of markets and day-to-day operations. (3) Motivation is generally higher when individuals participate in setting their own goals than when the
goals are imposed from above. Self-imposed budgets create commitment. (4) A manager who is not able to meet a budget that has been imposed from above can always say that the budget was unrealistic and impossible to meet. With a self-imposed budget, this excuse is not available.
Self-imposed budgets do carry with them the risk of budgetary slack. The budgets prepared by lower-level managers should be carefully reviewed to prevent too much slack.
9-9 Budgeting can assist a company forecast its workforce staffing needs through direct labor and other budgets. By careful planning through the budget process, a company can often smooth out its activities and avoid erratic hiring and laying off employees.
9-10 No, although this is clearly one of the purposes of the cash budget. The principal purpose is to provide information on probable cash needs during the budget period, so that bank loans and other sources of financing can be anticipated and arranged well in advance.
© The McGraw-Hill Companies, Inc., 2008. All rights reserved.456 Managerial Accounting, 12th Edition
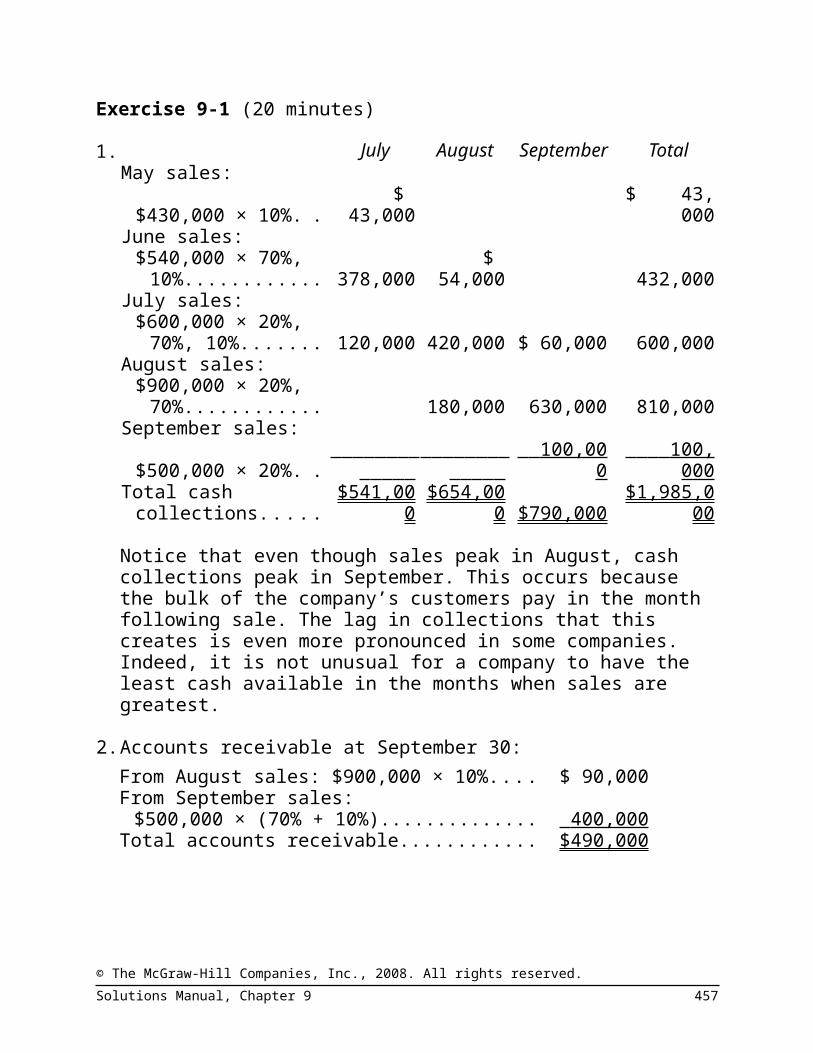
Exercise 9-1 (20 minutes)
1. July AugustSeptem-
ber TotalMay sales:
$430,000 × 10%.....$
43,000$ 43,00
0June sales:
$540,000 × 70%, 10%...................... 378,000
$ 54,000 432,000
July sales:$600,000 × 20%,
70%, 10%............. 120,000 420,000 $ 60,000 600,000August sales:
$900,000 × 20%, 70%...................... 180,000 630,000 810,000
September sales:
$500,000 × 20%..... 100,000 100,00
0
Total cash collections$541,00
0$654,00
0 $790,000$1,985,00
0
Notice that even though sales peak in August, cash collections peak in September. This occurs because the bulk of the company’s customers pay in the month following sale. The lag in collections that this creates is even more pronounced in some companies. Indeed, it is not unusual for a company to have the least cash available in the months when sales are greatest.
2. Accounts receivable at September 30:From August sales: $900,000 × 10%............. $ 90,000From September sales:
$500,000 × (70% + 10%)........................... 400,000 Total accounts receivable.............................. $490,000
© The McGraw-Hill Companies, Inc., 2008. All rights reserved.Solutions Manual, Chapter 9 457

Exercise 9-2 (10 minutes)
JulyAu-gust
Sep-tember Quarter
Budgeted sales in units....... 30,000 45,000 60,000 135,000Add desired ending inven-
tory*.................................. 4,500 6,000 5,000 5,000 Total needs.......................... 34,500 51,000 65,000 140,000Less beginning inventory.... 3,000 4,500 6,000 3,000 Required production............ 31,500 46,500 59,000 137,000
*10% of the following month’s sales
© The McGraw-Hill Companies, Inc., 2008. All rights reserved.458 Managerial Accounting, 12th Edition

Exercise 9-3 (15 minutes)Quarter—Year 2 Year 3
First Second Third Fourth FirstRequired production of calculators.... 60,000 90,000 150,000 100,000 80,000Number of chips per calculator......... × 3 × 3 × 3 × 3 × 3
Total production needs—chips...........180,00
0 270,000 450,000 300,000 240,000
Year 2First Second Third Fourth Year
Production needs—chips................... 180,000 270,000 450,000 300,000 1,200,000
Add desired ending inventory—chips 54,000 90,00
0 60,00
0 48,00
0 48,000 Total needs—chips............................. 234,000 360,000 510,000 348,000 1,248,000
Less beginning inventory—chips....... 36,000 54,00
0 90,00
0 60,00
0 36,000
Required purchases—chips................ 198,000 306,00
0 420,00
0 288,00
0 1,212,000
Cost of purchases at $2 per chip.......$396,00
0$612,00
0$840,00
0$576,00
0$2,424,00
0
© The McGraw-Hill Companies, Inc., 2008. All rights reserved.Solutions Manual, Chapter 9 459

Exercise 9-4 (20 minutes)1. Assuming that the direct labor workforce is adjusted each quarter, the direct labor budget would be:
1st Quarter
2nd Quarter
3rd Quarter
4th Quarter Year
Units to be produced............... 5,000 4,400 4,500 4,900 18,800Direct labor time per unit
(hours).................................. × 0.40 × 0.40 × 0.40 × 0.40 × 0.40 Total direct labor hours
needed.................................. 2,000 1,760 1,800 1,960 7,520Direct labor cost per hour....... × $11.00 × $11.00 × $11.00 × $11.00 × $11.00 Total direct labor cost............. $22,000 $19,360 $19,800 $21,560 $82,720
2. Assuming that the direct labor workforce is not adjusted each quarter and that overtime wages are paid, the direct labor budget would be:
1st Quarter
2nd Quarter
3rd Quarter
4th Quarter Year
Units to be produced............... 5,000 4,400 4,500 4,900 18,800Direct labor time per unit
(hours).................................. × 0.40 × 0.40 × 0.40 × 0.40 × 0.40 Total direct labor hours
needed.................................. 2,000 1,760 1,800 1,960 7,520Regular hours paid.................. 1,800 1,800 1,800 1,800 7,200Overtime hours paid............... 200 0 0 160 360 Wages for regular hours
(@ $11.00 per hour)............. $19,800 $19,800 $19,800 $19,800 $79,200Overtime wages (@ $11.00
per hour × 1.5 hours)........... 3,300 0 0 2,640 5,940 Total direct labor cost............. $23,100 $19,800 $19,800 $22,440 $85,140
© The McGraw-Hill Companies, Inc., 2008. All rights reserved.460 Managerial Accounting, 12th Edition

Exercise 9-5 (15 minutes)1. Krispin Corporation
Manufacturing Overhead Budget1st
Quarter2nd
Quarter3rd
Quarter4th
Quarter YearBudgeted direct labor-hours. . . 5,000 4,800 5,200 5,400 20,400Variable overhead rate............ × $1.75 × $1.75 × $1.75 × $1.75 × $1.75 Variable manufacturing over-
head...................................... $ 8,750 $ 8,400 $ 9,100 $ 9,450 $ 35,700Fixed manufacturing overhead 35,000 35,000 35,000 35,000 140,000 Total manufacturing overhead 43,750 43,400 44,100 44,450 175,700Less depreciation.................... 15,000 15,000 15,000 15,000 60,000 Cash disbursements for manu-
facturing overhead............... $28,750 $28,400 $29,100 $29,450$115,70
0
2.Total budgeted manufacturing overhead for the year (a)..........................
$175,700
Total budgeted direct labor-hours for the year (b)..................................... 20,400Predetermined overhead rate for the year (a) ÷ (b).................................. $8.61
© The McGraw-Hill Companies, Inc., 2008. All rights reserved.Solutions Manual, Chapter 9 461

Exercise 9-6 (15 minutes)
Haerve CompanySelling and Administrative Expense Budget
1st Quarter
2nd Quarter
3rd Quarter
4th Quarter Year
Budgeted unit sales............................. 12,000 14,000 11,000 10,000 47,000Variable selling and administrative ex-
pense per unit................................... × $2.75 × $2.75 × $2.75 × $2.75 × $2.75 Variable expense.................................
$ 33,000 $ 38,500 $ 30,250 $ 27,500 $129,25
0Fixed selling and administrative ex-
penses:Advertising........................................ 12,000 12,000 12,000 12,000 48,000Executive salaries............................. 40,000 40,000 40,000 40,000 160,000Insurance.......................................... 6,000 6,000 12,000Property taxes................................... 6,000 6,000Depreciation...................................... 16,000 16,000 16,000 16,000 64,000
Total fixed selling and administrative expenses........................................... 68,000 74,000 74,000 74,000 290,000
Total selling and administrative ex-penses............................................... 101,000 112,500 104,250 101,500 419,250
Less depreciation................................ 16,000 16,000 16,000 16,000 64,000 Cash disbursements for selling and
administrative expenses................... $ 85,000 $ 96,500 $ 88,250 $ 85,500 $355,25
0
© The McGraw-Hill Companies, Inc., 2008. All rights reserved.462 Managerial Accounting, 12th Edition

Exercise 9-7 (20 minutes)Quarter (000 omitted)
1 2 3 4 Year
Cash balance, beginning..... $ 9 *$
5 $ 5$
5 $ 9Add collections from cus-
tomers.............................. 76 90 125 * 10
0 391 *
Total cash available............. 85 * 95 130 10
5 400 Less disbursements:
Purchase of inventory....... 40 * 58 * 36 32 * 166Operating expenses.......... 36 42 * 54 * 48 180 *Equipment purchases....... 10 * 8 * 8 * 10 36 *Dividends.......................... 2 * 2 * 2 * 2 * 8
Total disbursements............ 88 11
0 * 100 92 390 Excess (deficiency) of cash
available over disburse-ments................................ (3 )* (15 ) 30 * 13 10
Financing:Borrowings........................ 8 20 * 0 0 28Repayments (including in-
terest)............................. 0 0 (25 ) (7 )* (32 )
Total financing..................... 8 2
0 (25 ) (7 ) (4 )
Cash balance, ending.......... $ 5 $
5 $ 5 $
6 $ 6
*Given.
© The McGraw-Hill Companies, Inc., 2008. All rights reserved.Solutions Manual, Chapter 9 463

Problem 9-8 (30 minutes)1. Cadence and Cross used a top-down approach to prepare the
budget. That is, they prepared the budget with little or no input from the individuals who would have to implement the budget. In contrast, the recommended approach is a participative budget in which the individuals who have cost control responsibility initiate and fully participate in the budgeting process. Participatory budgets have a number of advantages including: 1) those who are closest to the action are likely to have better information; 2) managers are likely to be more committed to and understand a budget they participated in preparing than a budget that is imposed from above; and 3) participative budgets help to foster a sense that everyone’s input is valued.
2. While Cadence and Cross are undoubtedly pleased with their work, the dissatisfaction expressed by some employees with the budget process is a sign that there may be storm clouds ahead. If employees feel that the budget is unrealistic, the fact that it was imposed can lead to resentment, anger, and a sense of helplessness. Employees may, as a consequence, spend their time and energy complaining about the budget rather than creatively solving problems. And if the budget is indeed unrealistic and managers are held responsible for meeting the budget, unproductive finger-pointing is likely to result as reality fails to live up to expectations.
© The McGraw-Hill Companies, Inc., 2008. All rights reserved.464 Managerial Accounting, 12th Edition

Problem 9-9 (30 minutes)1. September cash sales....................................... $ 7,400
September collections on account:July sales: $20,000 × 18%.............................. 3,600August sales: $30,000 × 70%......................... 21,000September sales: $40,000 × 10%................... 4,000
Total cash collections......................................... $36,000
2. Payments to suppliers:August purchases (accounts payable)............ $16,000September purchases: $25,000 × 20%.......... 5,000
Total cash payments.......................................... $21,000
3. Calgon ProductsCash Budget
For the Month of September
Cash balance, September 1...........................$
9,000Add cash receipts:
Collections from customers......................... 36,000 Total cash available before current financing 45,000Less disbursements:
Payments to suppliers for inventory...........$21,00
0Selling and administrative expenses........... 9,000 *Equipment purchases................................. 18,000Dividends paid............................................ 3,000
Total disbursements...................................... 51,000 Excess (deficiency) of cash available over
disbursements............................................ (6,000 )Financing:
Borrowings.................................................. 11,000Repayments................................................ 0Interest....................................................... 0
Total financing............................................... 11,000
Cash balance, September 30.........................$
5,000 *$13,000 – $4,000 = $9,000.
© The McGraw-Hill Companies, Inc., 2008. All rights reserved.Solutions Manual, Chapter 9 465

Problem 9-10 (45 minutes)1. Stokes is using the budget as a club to pressure employees and
as a way to find someone to blame rather than as a legitimate planning and control tool. His planning seems to consist of telling everyone to increase sales volume by 40%. This kind of “planning” requires no analysis, no intelligence, no business insight, and is very likely viewed with contempt by the employees of the company.
2. The way in which the budget is being used is likely to breed hostility, tension, mistrust, lack of respect, and actions designed to meet targets using any means available. Unreasonable targets imposed from the top, coupled with a “no excuses” policy and the threat of being fired, create an ideal breeding ground for questionable business practices. Managers who would not, under ordinary circumstances, cheat or cut corners may do so if put under this kind of pressure.
3. As the old saying goes, Keri Kalani is “between a rock and a hard place.” The Standards of Ethical Conduct for Management Accountants states that management accountants have a responsibility to “disclose fully all relevant information that could reasonably be expected to influence an intended user’s understanding of the reports, comments, and recommendations presented.” Assuming that Keri helps prepare the Production Department’s reports to top management, collaborating with her boss in hiding losses due to defective disk drives would clearly violate this standard. Apart from the misrepresentation on the accounting reports, the policy of shipping defective returned units to customers is bound to have a negative effect on the company’s reputation. If this policy were to become widely known, it would very likely have a devastating effect on the company’s future sales. Moreover, this practice may be illegal under statutes designed to protect consumers.Having confronted her boss with no satisfactory resolution of the problem, Keri must now decide what to do. The Standards of Ethical Conduct for Management Accountants suggests that Keri go to the next higher level in management to present her
© The McGraw-Hill Companies, Inc., 2008. All rights reserved.466 Managerial Accounting, 12th Edition

case. Unfortunately, in the prevailing moral climate at PrimeDrive, she is unlikely to win any blue ribbons for blowing the whistle on her boss. All of the managers below Stokes are likely to be in fear of losing their own jobs and many of them may have taken actions to meet Stokes’ targets that they are not proud
© The McGraw-Hill Companies, Inc., 2008. All rights reserved.Solutions Manual, Chapter 9 467

Problem 9-10 (continued)of either. It would take tremendous courage for Keri to take the problem all the way up to Stokes himself—particularly in view of his less-than-humane treatment of subordinates. And going to the Board of Directors is unlikely to work either since Stokes and his venture capital firm apparently control the Board. Resigning, with a letter of memorandum to the individual who is most likely to be concerned and to be able to take action, may be the only ethical course of action that is left open to Keri in this situation. Of course, she must pay her rent, so hopefully she has good alternative employment opportunities.
Note: This problem is very loosely based on the MiniScribe scandal reported in the December, 1992 issue of Management Accounting as well as in other business publications. After going bankrupt, it was discovered that managers at MiniScribe had perpetrated massive fraud as a result of the unrelenting pressure to meet unrealistic targets. Q. T. Wiles, the real chairman of MiniScribe, was reported to have behaved much as described in this problem. Keri Kalani is, alas, a fabrication. Hopefully, there were people like Keri at MiniScribe who tried to do something to stop the fraud.
© The McGraw-Hill Companies, Inc., 2008. All rights reserved.468 Managerial Accounting, 12th Edition

Problem 9-11 (45 minutes)1. Production budget:
July AugustSeptem-
berOcto-ber
Budgeted sales (units)...... 40,000 50,000 70,000 35,000Add desired ending inven-
tory................................. 20,000 26,000 15,500 11,000Total needs........................ 60,000 76,000 85,500 46,000Less beginning inventory. . 17,000 20,000 26,000 15,500Required production.......... 43,000 56,000 59,500 30,500
2. During July and August the company is building inventories in anticipation of peak sales in September. Therefore, production exceeds sales during these months. In September and October inventories are being reduced in anticipation of a decrease in sales during the last months of the year. Therefore, production is less than sales during these months to cut back on inventory levels.
3. Direct materials budget:
July AugustSeptem-
ber
Third Quar-
terRequired production
(units)........................... 43,000 56,000 59,500158,50
0Material A135 needed
per unit......................... × 3 lbs. × 3 lbs. × 3 lbs. × 3 lbs.
Production needs (lbs.).... 129,000168,00
0 178,500475,50
0Add desired ending in-
ventory (lbs.)................ 84,000 89,250 45,750 * 45,750 Total Material A135
needs............................ 213,000257,25
0 224,250521,25
0Less beginning inventory
(lbs.)............................. 64,500 84,000 89,250 64,500 Material A135 purchases
(lbs.)............................. 148,500173,25
0 135,000456,75
0* 30,500 units (October production) × 3 lbs. per unit= 91,500
lbs.; 91,500 lbs. × 0.5 = 45,750 lbs.© The McGraw-Hill Companies, Inc., 2008. All rights reserved.Solutions Manual, Chapter 9 469

As shown in part (1), production is greatest in September. However, as shown in the raw material purchases budget, the purchases of materials is greatest a month earlier because materials must be on hand to support the heavy production scheduled for September.
© The McGraw-Hill Companies, Inc., 2008. All rights reserved.470 Managerial Accounting, 12th Edition

Problem 9-12 (30 minutes)1. Priston Company
Direct Materials Budget1st
Quarter2nd
Quarter3rd
Quarter4th
Quarter YearRequired production........................ 6,000 7,000 8,000 5,000 26,000Raw materials per unit.................... × 3 × 3 × 3 × 3 × 3 Production needs............................. 18,000 21,000 24,000 15,000 78,000Add desired ending inventory......... 4,200 4,800 3,000 3,700 3,700 Total needs...................................... 22,200 25,800 27,000 18,700 81,700Less beginning inventory................ 3,600 4,200 4,800 3,000 3,600 Raw materials to be purchased....... 18,600 21,600 22,200 15,700 78,100 Cost of raw materials to be pur-
chased at $2.50 per pound........... $46,500 $54,000 $55,500 $39,250 $195,250
Schedule of Expected Cash Disbursements for MaterialsAccounts payable, beginning bal-
ance..............................................$11,775 $ 11,775
1st Quarter purchases..................... 32,550 $13,950 46,5002nd Quarter purchases.................... 37,800 $16,200 54,0003rd Quarter purchases.................... 38,850 $16,650 55,5004th Quarter purchases.................... 27,475 27,475 Total cash disbursements for mate-
rials...............................................$44,325 $51,750 $55,050 $44,125 $195,250
© The McGraw-Hill Companies, Inc., 2008. All rights reserved.Solutions Manual, Chapter 9 471

Problem 9-12 (continued)2. Priston Company
Direct Labor Budget1st
Quarter2nd
Quarter3rd
Quarter4th
Quarter YearUnits to be produced..................... 6,000 7,000 8,000 5,000 26,000
Direct labor time per unit (hours).. × 0.50 ×
0.50 ×
0.50 ×
0.50 ×
0.50Total direct labor-hours needed.... 3,000 3,500 4,000 2,500 13,000
Direct labor cost per hour.............×
$12.00×
$12.00×
$12.00×
$12.00×
$12.00
Total direct labor cost...................$ 36,000 $ 42,00
0$ 48,00
0$ 30,00
0$156,00
0
© The McGraw-Hill Companies, Inc., 2008. All rights reserved.472 Managerial Accounting, 12th Edition

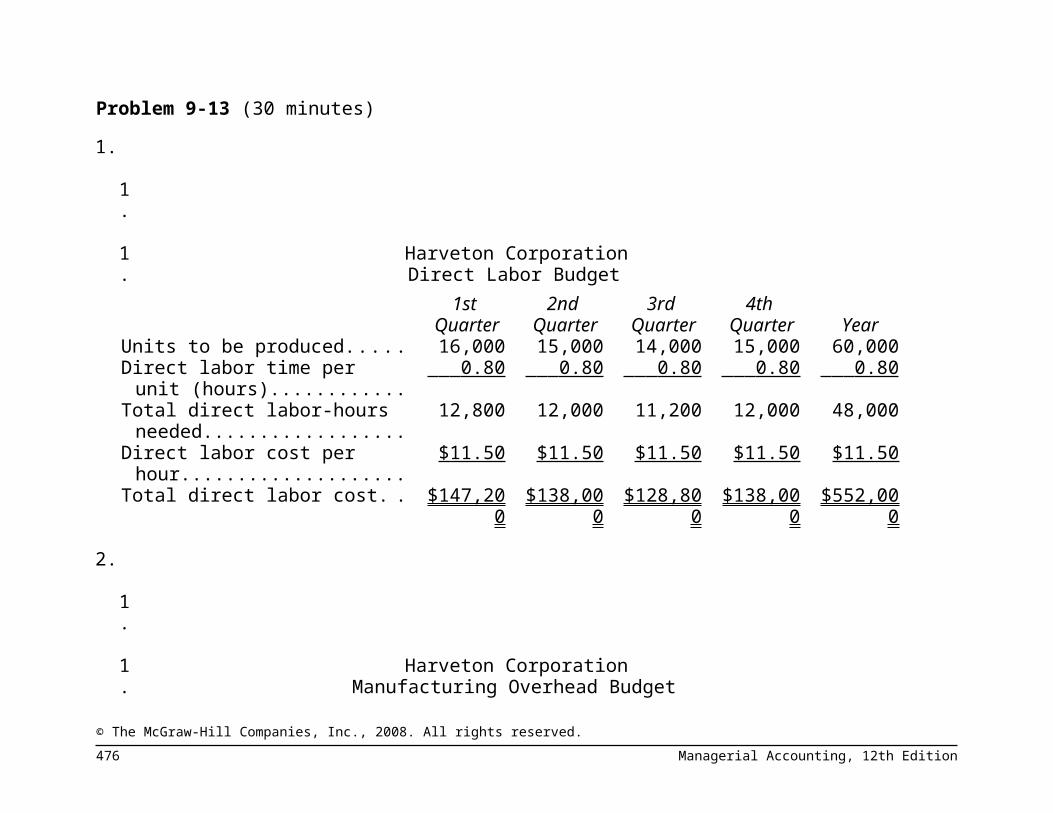
Problem 9-13 (30 minutes)1.
1.
1.
Harveton CorporationDirect Labor Budget
1st Quarter
2nd Quarter
3rd Quarter
4th Quarter Year
Units to be produced............... 16,000 15,000 14,000 15,000 60,000Direct labor time per unit
(hours).................................. 0.80 0.80 0.80 0.80 0.80
Total direct labor-hours needed..................................
12,800 12,000 11,200 12,000 48,000
Direct labor cost per hour....... $11.50 $11.50 $11.50 $11.50 $11.50Total direct labor cost............. $147,20
0$138,00
0$128,80
0$138,00
0$552,00
0
2.
1.
1.
Harveton CorporationManufacturing Overhead Budget
1st 2nd 3rd 4th Year
© The McGraw-Hill Companies, Inc., 2008. All rights reserved.Solutions Manual, Chapter 9 473

Quarter Quarter Quarter QuarterBudgeted direct labor-hours. . . 12,800 12,000 11,200 12,000 48,000Variable overhead rate............ $2.50 $2.50 $2.50 $2.50 $2.50Variable manufacturing over-
head...................................... $ 32,000 $ 30,000 $ 28,000 $ 30,000$120,00
0Fixed manufacturing overhead 90,000 90,000 90,000 90,000 360,000 Total manufacturing overhead 122,000 120,000 118,000 120,000 480,000Less depreciation.................... 34,000 34,000 34,000 34,000 136,000 Cash disbursements for manu-
facturing overhead............... $ 88,000 $ 86,000 $ 84,000 $ 86,000 $344,00
0
© The McGraw-Hill Companies, Inc., 2008. All rights reserved.474 Managerial Accounting, 12th Edition

Problem 9-14 (45 minutes)1. Schedule of expected cash collections:
MonthApril May June Quarter
From accounts receiv-able........................... $141,000 $ 7,200
$148,200
From April sales:20% × 200,000......... 40,000 40,00075% × 200,000......... 150,000 150,0004% × 200,000........... $ 8,000 8,000
From May sales:20% × 300,000......... 60,000 60,00075% × 300,000......... 225,000 225,000
From June sales:20% × 250,000......... 50,000 50,000
Total cash collections. . $181,000$217,20
0$283,00
0$681,20
0
© The McGraw-Hill Companies, Inc., 2008. All rights reserved.Solutions Manual, Chapter 9 475
Problem 9-14 (continued)2. Cash budget:
MonthApril May June Quarter
Cash balance, begin-ning........................ $ 26,000 $ 27,000 $ 20,200 $ 26,000
Add receipts:Collections from
customers............ 181,000 217,200 283,000 681,200 Total available........... 207,000 244,200 303,200 707,200 Less disbursements:
Merchandise pur-chases.................. 108,000 120,000 180,000 408,000
Payroll..................... 9,000 9,000 8,000 26,000Lease payments..... 15,000 15,000 15,000 45,000Advertising............. 70,000 80,000 60,000 210,000Equipment pur-
chases.................. 8,000 — — 8,000 Total disbursements. . 210,000 224,000 263,000 697,000 Excess (deficiency)
of receipts over disbursements........ (3,000 ) 20,200 40,200 10,200
Financing:Borrowings.............. 30,000 — — 30,000Repayments............ — — (30,000) (30,000)Interest................... — — (1,200 ) (1,200 )
Total financing........... 30,000 — (31,200 ) (1,200 )Cash balance, end-
ing.......................... $ 27,000 $ 20,200 $ 9,000 $ 9,000
3. If the company needs a minimum cash balance of $20,000 to start each month, the loan cannot be repaid in full by June 30. If the loan is repaid in full, the cash balance will drop to only $9,000 on June 30, as shown above. Some portion of the loan balance will have to be carried over to July, at which time the cash inflow should be sufficient to complete repayment.
© The McGraw-Hill Companies, Inc., 2008. All rights reserved.476 Managerial Accounting, 12th Edition

Problem 9-15 (60 minutes)1. Schedule of cash receipts:
Cash sales—June......................................... $ 60,000Collections on accounts receivable:
May 31 balance......................................... 72,000June (50% × 190,000)............................... 95,000
Total cash receipts....................................... $227,000
Schedule of cash payments for purchases:May 31 accounts payable balance............... $ 90,000June purchases (40% × 200,000)................ 80,000 Total cash payments.................................... $170,000
Phototec, Inc.Cash Budget
For the Month of JuneCash balance, beginning............................. $ 8,000Add receipts from customers (above).......... 227,000 Total cash available..................................... 235,000 Less disbursements:
Purchase of inventory (above).................. 170,000Selling and administrative expenses......... 51,000Purchases of equipment............................ 9,000
Total cash disbursements............................ 230,000 Excess of receipts over disbursements........ 5,000 Financing:
Borrowings—note...................................... 18,000Repayments—note.................................... (15,000)Interest...................................................... (500 )
Total financing............................................. 2,500 Cash balance, ending.................................. $ 7,500
© The McGraw-Hill Companies, Inc., 2008. All rights reserved.Solutions Manual, Chapter 9 477

Problem 9-15 (continued)2. Phototec, Inc.
Budgeted Income StatementFor the Month of June
Sales.................................................. $250,000Cost of goods sold:
Beginning inventory........................ $ 30,000Add purchases................................ 200,000 Goods available for sale.................. 230,000Ending inventory............................. 40,000 Cost of goods sold........................... 190,000
Gross margin..................................... 60,000Selling and administrative expenses
($51,000 + $2,000)........................ 53,000 Net operating income........................ 7,000Interest expense................................ 500 Net income........................................ $ 6,500
3. Phototec, Inc.Budgeted Balance Sheet
June 30Assets
Cash.................................................................. $ 7,500Accounts receivable (50% × 190,000).............. 95,000Inventory........................................................... 40,000Buildings and equipment, net of depreciation
($500,000 + $9,000 – $2,000)........................ 507,000 Total assets........................................................ $649,500
Liabilities and EquityAccounts payable (60% × 200,000).................. $120,000Note payable..................................................... 18,000Capital stock...................................................... 420,000Retained earnings ($85,000 + $6,500)............. 91,500 Total liabilities and equity.................................. $649,500
© The McGraw-Hill Companies, Inc., 2008. All rights reserved.478 Managerial Accounting, 12th Edition

Problem 9-16 (60 minutes)1. The sales budget for the third quarter:
July Aug. Sept. QuarterBudgeted sales (pairs) 6,000 7,000 5,000 18,000Selling price per pair... × $ 50 × $ 50 × $ 50 × $ 50
Total budgeted sales. . .$300,00
0$350,00
0$250,00
0$900,00
0
The schedule of expected cash collections from sales:July Aug. Sept. Quarter
Accounts receivable, beginning balance....
$130,000
$130,000
July sales:$300,000 × 40%, 50%.......................... 120,000
$150,000 270,000
August sales:$350,000 × 40%, 50%.......................... 140,000
$175,000 315,000
September sales:$250,000 × 40%....... 100,000 100,000
Total cash collections. .$250,00
0$290,00
0$275,00
0$815,00
0
2. The production budget for July through October:July Aug. Sept. Oct.
Budgeted sales (pairs)................. 6,000 7,000 5,000 4,000Add desired ending inventory...... 700 500 400 300 Total needs.................................. 6,700 7,500 5,400 4,300Less beginning inventory............ 600 700 500 400 Required production (pairs)......... 6,100 6,800 4,900 3,900
© The McGraw-Hill Companies, Inc., 2008. All rights reserved.Solutions Manual, Chapter 9 479

Problem 9-16 (continued)3. The direct materials budget for the third quarter:
July Aug. Sept.Quar-
terRequired production—
pairs (above)................. 6,100 6,800 4,900 17,800Raw materials needs per
pair............................... × 2lbs. × 2lbs. × 2lbs. × 2lbs.Production needs (lbs.).... 12,200 13,600 9,800 35,600Add desired ending in-
ventory......................... 2,720 1,960 1,560 * 1,560 Total needs...................... 14,920 15,560 11,360 37,160Less beginning inven-
tory 2,440 2,720 1,960 2,440 Raw materials to be pur-
chased.......................... 12,480 12,840 9,400 34,720 Cost of raw materials to
be purchased at $2.50 per lb............................
$31,200
$32,100
$23,500
$86,800
*3,900 pairs (October) × 2 lbs. per pair= 7,800 lbs.; 7,800 lbs. × 20% = 1,560 lbs.
The schedule of expected cash disbursements:
July Aug. Sept.Quar-
terAccounts payable, begin-
ning balance..................... $11,400$11,40
0July purchases:
$31,200 × 60%, 40%........ 18,720$12,48
0 31,200August purchases:
$32,100 × 60%, 40%........ 19,260$12,84
0 32,100September purchases:
$23,500 × 60%................. 14,100 14,100
Total cash disbursements.... $30,120$31,74
0$26,94
0$88,80
0
© The McGraw-Hill Companies, Inc., 2008. All rights reserved.480 Managerial Accounting, 12th Edition

Problem 9-17 (120 minutes)1. Schedule of expected cash collections:
April May June Total
Cash sales......................... $14,000$17,00
0$18,00
0$
49,000Credit sales....................... 48,000 56,000 68,000 172,000
Total collections................. $62,000$73,00
0$86,00
0$221,00
0
2. a. Merchandise purchases budget:April May June Total
Budgeted cost of goods sold................................... $42,000
$51,000
$54,000
$147,000
Add desired ending inven-tory*................................. 15,300 16,200 9,000 9,000
Total needs.......................... 57,300 67,200 63,000 156,000Less beginning inventory.... 12,600 15,300 16,200 12,600
Required purchases............. $44,700$51,90
0$46,80
0$143,40
0*At April 30: $51,000 × 30% = $15,300. At June 30: $50,000 July sales × 60% × 30% = $9,000.
b. Schedule of cash disbursements for purchases:April May June Total
For March purchases......... $18,300 $18,300
For April purchases........... 22,350$22,35
0 44,700
For May purchases............ 25,950$25,95
0 51,900For June purchases............ 23,400 23,400
Total cash disbursements.. $40,650$48,30
0$49,35
0$138,30
0
© The McGraw-Hill Companies, Inc., 2008. All rights reserved.Solutions Manual, Chapter 9 481

Problem 9-17 (continued)3. Schedule of cash disbursements for selling and administrative
expenses:April May June Total
Salaries and wages............... $ 7,500$
7,500$
7,500 $22,500Shipping................................ 4,200 5,100 5,400 14,700Advertising............................ 6,000 6,000 6,000 18,000Other expenses..................... 2,800 3,400 3,600 9,800 Total cash disbursements for
operating expenses............ $20,500$22,00
0$22,50
0 $65,000
4. Cash budget:April May June Total
Cash balance, beginning....... $ 9,000$
8,350$
8,050 $ 9,000Add cash collections.............. 62,000 73,000 86,000 221,000
Total cash available............ 71,000 81,350 94,050 230,000 Less disbursements:
For inventory purchases..... 40,650 48,300 49,350 138,300For selling and administra-
tive expenses................... 20,500 22,000 22,500 65,000For equipment purchases. . . 11,500 3,000 0 14,500For dividends...................... 0 0 3,500 3,500
Total disbursements.............. 72,650 73,300 75,350 221,300 Excess (deficiency) of cash... (1,650) 8,050 18,700 8,700 Financing:
Borrowings.......................... 10,000 0 0 10,000
Repayments........................ 0 0(10,000
) (10,000)Interest ($10,000 × 1% ×
3)...................................... 0 0 (300 ) (300 )
Total financing....................... 10,000 0 (10,300
) (300 )
Cash balance, ending............ $ 8,350$
8,050$
8,400 $ 8,400
© The McGraw-Hill Companies, Inc., 2008. All rights reserved.482 Managerial Accounting, 12th Edition

Problem 9-17 (continued)5. Income Statement:
Nordic CompanyIncome Statement
For the Quarter Ended June 30
Sales.................................................... $245,000Cost of goods sold:
Beginning inventory (given).............. $ 12,600Add purchases (Part 2)...................... 143,400 Goods available for sale.................... 156,000Ending inventory (Part 2).................. 9,000 147,000
Gross margin....................................... 98,000Selling and administrative expenses:
Salaries and wages (Part 3)............... 22,500Shipping (Part 3)............................... 14,700Advertising (Part 3)........................... 18,000Depreciation...................................... 6,000Other expenses (Part 3).................... 9,800 71,000
Net operating income.......................... 27,000Less interest expense (Part 4)............. 300 Net income.......................................... $ 26,700
© The McGraw-Hill Companies, Inc., 2008. All rights reserved.Solutions Manual, Chapter 9 483

Problem 9-17 (continued)6. Balance sheet:
Nordic CompanyBalance Sheet
June 30
AssetsCurrent assets:
Cash (Part 4)........................................................... $ 8,400Accounts receivable (80% × $90,000).................... 72,000Inventory (Part 2).................................................... 9,000
Total current assets.................................................... 89,400Buildings and equipment, net
($214,100 + $14,500 – $6,000).............................. 222,600 Total assets................................................................ $312,000
Liabilities and EquityCurrent liabilities:
Accounts payable (Part 2: 50% × $46,800)............................................. $ 23,400
Stockholders’ equity:Capital stock......................................... $190,000Retained earnings*................................ 98,600 288,600
Total liabilities and equity........................ $312,000
* Retained earnings, beginning............ $ 75,400Add net income................................. 26,700 Total................................................... 102,100Less dividends................................... 3,500 Retained earnings, ending................. $ 98,600
© The McGraw-Hill Companies, Inc., 2008. All rights reserved.484 Managerial Accounting, 12th Edition

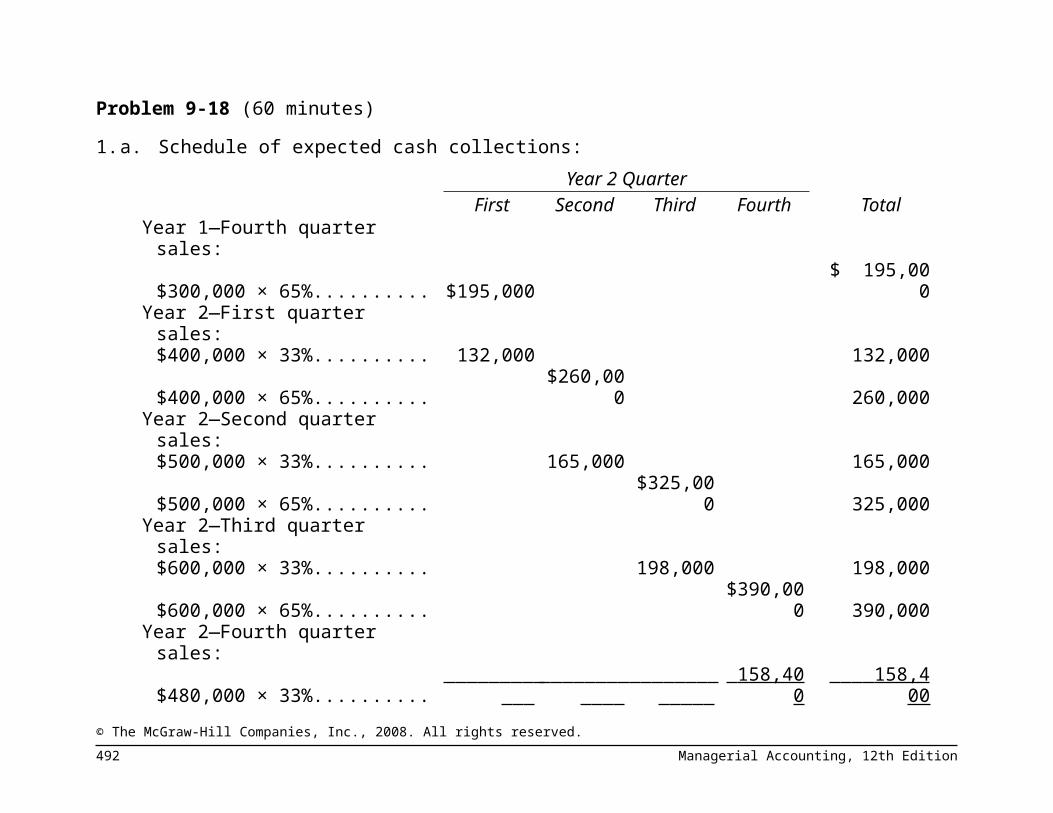
Problem 9-18 (60 minutes)1. a. Schedule of expected cash collections:
Year 2 QuarterFirst Second Third Fourth Total
Year 1—Fourth quarter sales:$300,000 × 65%................... $195,000 $ 195,000
Year 2—First quarter sales:$400,000 × 33%................... 132,000 132,000
$400,000 × 65%...................$260,00
0 260,000Year 2—Second quarter sales:
$500,000 × 33%................... 165,000 165,000
$500,000 × 65%...................$325,00
0 325,000Year 2—Third quarter sales:
$600,000 × 33%................... 198,000 198,000
$600,000 × 65%...................$390,00
0 390,000Year 2—Fourth quarter sales:
$480,000 × 33%................... 158,400 158,400
Total cash collections............... $327,000$425,00
0$523,00
0$548,40
0$1,823,40
0
© The McGraw-Hill Companies, Inc., 2008. All rights reserved.Solutions Manual, Chapter 9 485

Problem 9-18 (continued)b. Schedule of budgeted cash disbursements for merchandise purchases:
Year 2 QuarterFirst Second Third Fourth Total
Year 1—Fourth quarter pur-chases:
$180,000 × 80%................... $144,000$ 144,00
0Year 2—First quarter pur-
chases:$260,000 × 20%................... 52,000 52,000
$260,000 × 80%...................$208,00
0 208,000Year 2—Second quarter pur-
chases:$310,000 × 20%................... 62,000 62,000
$310,000 × 80%...................$248,00
0 248,000Year 2—Third quarter pur-
chases:$370,000 × 20%................... 74,000 74,000
$370,000 × 80%...................$296,00
0 296,000Year 2—Fourth quarter pur-
chases:$240,000 × 20%................... 48,000 48,000
Total cash disbursements........ $196,000$270,00
0$322,00
0$344,00
0$1,132,00
0© The McGraw-Hill Companies, Inc., 2008. All rights reserved.486 Managerial Accounting, 12th Edition

Problem 9-18 (continued)2. Year 2 Quarter
First Second Third Fourth Year
Budgeted sales............. $400,000$500,00
0$600,00
0$480,00
0$1,980,00
0Variable expense rate. . . × 12% × 12% × 12% × 12% × 12% Variable expenses......... 48,000 60,000 72,000 57,600 237,600Fixed expenses.............. 90,000 90,000 90,000 90,000 360,000 Total expenses.............. 138,000 150,000 162,000 147,600 597,600Less depreciation.......... 20,000 20,000 20,000 20,000 80,000
Cash disbursements...... $118,000$130,00
0$142,00
0$127,60
0$ 517,60
0
© The McGraw-Hill Companies, Inc., 2008. All rights reserved.Solutions Manual, Chapter 9 487

Problem 9-18 (continued)3. Cash budget for Year 2:
Year 2 QuarterFirst Second Third Fourth Year
Cash balance, beginning..............$
20,000 $ 23,000$
18,000 $ 18,500 $ 20,000Add collections from sales............ 327,000 425,000 523,000 548,400 1,823,400 Total cash available...................... 347,000 448,000 541,000 566,900 1,843,400 Less disbursements:
Merchandise purchases............. 196,000 270,000 322,000 344,000 1,132,000Operating expenses................... 118,000 130,000 142,000 127,600 517,600Dividends.................................. 10,000 10,000 10,000 10,000 40,000Land.......................................... 0 80,000 48,500 0 128,500
Total disbursements..................... 324,000 490,000 522,500 481,600 1,818,100 Excess (deficiency) of receipts
over disbursements.................. 23,000 (42,000 ) 18,500 85,300 25,300 Financing:
Borrowings................................ 0 60,000 0 0 60,000Repayments.............................. 0 0 0 (60,000) (60,000)Interest ($60,000 × 1% × 9)..... 0 0 0 (5,400 ) (5,400 )
Total financing.............................. 0 60,000 0 (65,400 ) (5,400 )
Cash balance, ending...................$
23,000 $ 18,000$
18,500 $ 19,900 $ 19,900
© The McGraw-Hill Companies, Inc., 2008. All rights reserved.488 Managerial Accounting, 12th Edition

Problem 9-19 (60 minutes)1. Collections on sales: July August Sept. Quarter
Cash sales........................... $ 8,000$14,00
0$10,00
0$
32,000Credit sales:
May: $30,000 × 80% × 20%................................ 4,800 4,800
June: $36,000 × 80% × 70%, 20%....................... 20,160 5,760 25,920
July: $40,000 × 80% × 10%, 70%, 20%.............. 3,200 22,400 6,400 32,000
Aug.: $70,000 × 80% × 10%, 70%....................... 5,600 39,200 44,800
Sept.: $50,000 × 80% × 10%................................ 4,000 4,000
Total cash collections.......... $36,160$47,76
0$59,60
0$143,52
0
2. a. Merchandise purchases budget:July August Sept. Oct.
Budgeted cost of goods sold................................... $24,000
$42,000
$30,000
$27,000
Add desired ending inven-tory*................................. 31,500 22,500 20,250
Total needs.......................... 55,500 64,500 50,250Less beginning inventory.... 18,000 31,500 22,500 Required inventory pur-
chases.............................. $37,500$33,00
0$27,75
0*75% of the next month’s budgeted cost of goods sold.
b. Schedule of expected cash disbursements for merchandise purchases:
July August Sept.Quar-
ter
Accounts payable, June 30. . $11,700$11,70
0July purchases..................... 18,750 $18,750 37,500August purchases................ 16,500 $16,500 33,000
© The McGraw-Hill Companies, Inc., 2008. All rights reserved.Solutions Manual, Chapter 9 489

September purchases......... 13,875 13,875
Total cash disbursements.... $30,450 $35,250 $30,375$96,07
5
© The McGraw-Hill Companies, Inc., 2008. All rights reserved.490 Managerial Accounting, 12th Edition

Problem 9-19 (continued)3. Janus Products, Inc.
Cash BudgetFor the Quarter Ended September 30
July August Sept. QuarterCash balance, beginning... $ 8,000 $ 8,410 $ 8,020 $ 8,000Add collections from sales 36,160 47,760 59,600 143,520
Total cash available........ 44,160 56,170 67,620 151,520 Less disbursements:
For inventory purchases. 30,450 35,250 30,375 96,075For selling expenses....... 7,200 11,700 8,500 27,400For administrative ex-
penses.......................... 3,600 5,200 4,100 12,900For land........................... 4,500 0 0 4,500For dividends.................. 0 0 1,000 1,000
Total disbursements.......... 45,750 52,150 43,975 141,875 Excess (deficiency) of cash
available over disburse-ments............................. (1,590 ) 4,020 23,645 9,645
Financing:Borrowings...................... 10,000 4,000 14,000Repayment..................... 0 0 (14,000) (14,000)Interest........................... 0 0 (380 ) (380 )
Total financing................... 10,000 4,000 (14,380) (380 )Cash balance, ending........ $ 8,410 $ 8,020 $ 9,265 $ 9,265
* $10,000 × 1% × 3 = $300
$4,000 × 1% × 2 = 80 $380
© The McGraw-Hill Companies, Inc., 2008. All rights reserved.Solutions Manual, Chapter 9 491
Problem 9-20 (90 minutes)1. April May June Quarter
Budgeted sales............... 20,000 35,000 50,000 105,000Add desired ending in-
ventory*........................ 7,000 10,000 9,000 9,000 Total needs...................... 27,000 45,000 59,000 114,000Less beginning inventory 4,000 7,000 10,000 4,000 Required production........ 23,000 38,000 49,000 110,000*20% of the next month’s sales.
2. Material #208: April May June QuarterRequired production—
units......................... 23,000 38,000 49,000 110,000
Material #208 per unit × 4
lbs. × 4
lbs. × 4
lbs. × 4 lbs. Production needs—
pounds...................... 92,000 152,000 196,000 440,000Add desired ending in-
ventory*.................... 76,00
0 98,00
0 84,00
0 84,000 Total needs—pounds... 168,000 250,000 280,000 524,000Less beginning inven-
tory........................... 46,00
0 76,00
0 98,00
0 46,000 Required purchases—
pounds...................... 122,00
0 174,00
0 182,00
0 478,000 Required purchases at
$5.00 per pound.......$610,00
0$870,00
0$910,00
0$2,390,00
0* 50% of the following month’s production needs. For June:
July production 45,000 + 6,000 – 9,000 = 42,000 units; 42,000 units × 4 lbs. per unit = 168,000 lbs.; 168,000 lbs. × 50% = 84,000 lbs.
© The McGraw-Hill Companies, Inc., 2008. All rights reserved.492 Managerial Accounting, 12th Edition

Problem 9-20 (continued)Material #311: April May June QuarterRequired production—
units.......................... 23,000 38,000 49,000 110,000Material #311 per unit × 9 ft. × 9 ft × 9 ft × 9 ft Production needs—
feet........................... 207,000 342,000 441,000 990,000Add desired ending in-
ventory*.................... 114,00
0 147,00
0 126,00
0 126,000 Total needs—feet......... 321,000 489,000 567,000 1,116,000Less beginning inven-
tory........................... 69,00
0 114,00
0 147,00
0 69,000 Required purchases—
feet........................... 252,00
0 375,00
0 420,00
0 1,047,000 Required purchases at
$2.00 per foot...........$504,00
0$750,00
0$840,00
0$2,094,00
0* 1/3 of the following month’s production needs. For
June: July production 45,000 + 6,000 – 9,000 = 42,000 units; 42,000 units × 9 ft. per unit = 378,000 ft.;378,000 ft. × 1/3 = 126,000 ft.
3. Direct labor budget:Direct Labor
HoursUnits Pro-
ducedPer Unit Total
Cost per DLH Total Cost
Shaping..... 110,000 0.25 27,500 $18.00 $ 495,000Assembly. . 110,000 0.70 77,000 $16.00 1,232,000Finishing.... 110,000 0.10 11,000 $20.00 220,000
115,500$1,947,00
0
© The McGraw-Hill Companies, Inc., 2008. All rights reserved.Solutions Manual, Chapter 9 493

Problem 9-20 (continued)4. Manufacturing overhead budget:
Expected production for the year...................... 250,000Actual production through March 31.................. 32,000 Expected production, April through December.. 218,000Variable manufacturing overhead rate per unit
($112,000 ÷ 32,000 units).............................. × $3.50 Variable manufacturing overhead...................... $ 763,000Fixed manufacturing overhead ($4,628,000 ×
¾).................................................................... 3,471,000 Total manufacturing overhead........................... 4,234,000Less depreciation ($2,910,000 × ¾).................. 2,182,500 Cash disbursement for manufacturing over-
head................................................................ $2,051,500
© The McGraw-Hill Companies, Inc., 2008. All rights reserved.494 Managerial Accounting, 12th Edition

Problem 9-21 (120 minutes)1. Schedule of expected cash collections:
JanuaryFebru-
ary March Quarter
Cash sales.......................$28,00
0 $32,000 $34,000$ 94,00
0Credit sales*.................... 36,000 42,000 48,000 126,000
Total collections...............$64,00
0 $74,000 $82,000$220,00
0*60% of the preceding month’s sales.
2. Merchandise purchases budget:Janu-ary
Febru-ary March Quarter
Budgeted cost of goods sold (70% of sales).......
$49,000 $56,000 $59,500 $164,500
Add desired ending in-ventory*........................ 11,200 11,900 7,700 7,700
Total needs...................... 60,200 67,900 67,200 172,200Less beginning inventory 9,800 11,200 11,900 9,800
Required purchases.........$50,40
0 $56,700 $55,300 $162,400*At March 30: April sales $55,000 × 70% × 20% = $7,700.
Schedule of expected cash disbursements—merchandise purchases
Janu-ary
Febru-ary March Quarter
December purchases...... $32,55 $ 32,550January purchases........... 12,600 $37,800 50,400February purchases......... 14,175 $42,525 56,700March purchases............. 13,825 13,825 Total disbursements........ $45,15
0$51,975 $56,350 $153,47
5
© The McGraw-Hill Companies, Inc., 2008. All rights reserved.Solutions Manual, Chapter 9 495

Problem 9-21 (continued)3. Schedule of expected cash disbursements—selling and
administrative expenses
JanuaryFebru-
ary March Quarter
Commissions...................$12,00
0 $12,000$12,00
0 $36,000Rent................................ 1,800 1,800 1,800 5,400Other expenses............... 5,600 6,400 6,800 18,800
Total disbursements........$19,40
0 $20,200$20,60
0 $60,200
4. Cash budget:
JanuaryFebru-
ary March QuarterCash balance, begin-
ning............................ $ 6,000 $ 5,450 $ 5,275 $ 6,000
Add cash collections..... 64,000 74,000 82,000 220,00
0
Total cash available.... 70,000 79,450 87,275 226,00
0Less cash disburse-
ments:For inventory.............. 45,150 51,975 56,350 153,475For operating ex-
penses...................... 19,400 20,200 20,600 60,200
For equipment............ 3,000 8,000 0 11,00
0
Total disbursements...... 67,550 80,175 76,950 224,67
5Excess (deficiency) of
cash............................ 2,450 (725 ) 10,325 1,325 Financing:
Borrowings.................. 3,000 6,000 0 9,000Repayments................ 0 0 (5,000) (5,000)Interest*..................... 0 0 (210 ) (210 )
Total financing............... 3,000 6,000 (5,210 ) 3,790 Cash balance, ending.... $ 5,450 $ 5,275 $ 5,115 $ 5,115
© The McGraw-Hill Companies, Inc., 2008. All rights reserved.496 Managerial Accounting, 12th Edition

* $3,000 × 1% × 3 = $ 90$6,000 × 1% × 2 = 120 Total interest $210
© The McGraw-Hill Companies, Inc., 2008. All rights reserved.Solutions Manual, Chapter 9 497

Problem 9-21 (continued)5.
Picanuy CorporationIncome Statement
For the Quarter Ended March 31
Sales ($70,000 + $80,000 + $85,000)$235,00
0Cost of goods sold:
Beginning inventory (Given)............. $ 9,800
Add purchases (Part 2)...................... 162,40
0Goods available for sale.................... 172,200
Less ending inventory (Part 2).......... 7,70
0 164,500 Gross margin....................................... 70,500Selling and administrative expenses:
Commissions (Part 3)........................ 36,000Rent (Part 3)...................................... 5,400Depreciation (Given)......................... 2,400
Other expenses (Part 3).................... 18,80
0 62,600 Net operating income.......................... 7,900Less interest expense.......................... 210 Net income.......................................... $ 7,690
© The McGraw-Hill Companies, Inc., 2008. All rights reserved.498 Managerial Accounting, 12th Edition

Problem 9-21 (continued)6.
Picanuy CorporationBalance Sheet
March 31
AssetsCurrent assets:
Cash (Part 4)....................................................... $ 5,115Accounts receivable ($85,000 × 60%)................ 51,000Inventory (Part 2)................................................ 7,700
Total current assets................................................ 63,815Fixed assets—net
($110,885 + $3,000 + $8,000 – $2,400)............. 119,485
Total assets............................................................$183,30
0
Liabilities and EquityAccounts payable (Part 2: $55,300 ×
75%)..................................................... $ 41,475Bank loan payable................................... 4,000Stockholders’ equity:
Capital stock (Given).............................$100,00
0Retained earnings*................................ 37,825 137,825
Total liabilities and equity........................$183,30
0
* Retained earnings, beginning........... $30,135Add net income................................ 7,690 Retained earnings, ending................ $37,825
© The McGraw-Hill Companies, Inc., 2008. All rights reserved.Solutions Manual, Chapter 9 499

Case 9-22 (45 minutes)1. The budgetary control system has several important
shortcomings that reduce its effectiveness and may cause it to interfere with good performance. Some of the shortcomings are explained below.a. Lack of Coordinated Goals. Emory had been led to believe
high-quality output is the goal; it now appears low cost is the goal. Employees do not know what the goals are and thus cannot make decisions that further the goals.
b. Influence of Uncontrollable Factors. Actual performance relative to budget is greatly influenced by uncontrollable factors (i.e., rush orders, lack of prompt maintenance). Thus, the variance reports serve little purpose for performance evaluation or for locating controllable factors to improve performance. As a result, the system does not encourage coordination among departments.
c. The Short-Run Perspectives. Monthly evaluations and budget tightening on a monthly basis results in a very short-run perspective. This results in inappropriate decisions (i.e., inspect forklift trucks rather than repair inoperative equipment, fail to report supplies usage).
d. System Does Not Motivate. The budgetary system appears to focus on performance evaluation even though most of the essential factors for that purpose are missing. The focus on evaluation and the weaknesses take away an important benefit of the budgetary system—employee motivation.
2. The improvements in the budgetary control system should correct the deficiencies described above. The system should:a. more clearly define the company’s objectives.b. develop an accounting reporting system that better matches
controllable factors with supervisor responsibility and authority.
c. establish budgets for appropriate time periods that do not change monthly simply as a result of a change in the prior month’s performance.
© The McGraw-Hill Companies, Inc., 2008. All rights reserved.500 Managerial Accounting, 12th Edition

The entire company from top management down should be educated in sound budgetary procedures.
(Unofficial CMA Solution, adapted)
© The McGraw-Hill Companies, Inc., 2008. All rights reserved.Solutions Manual, Chapter 9 501

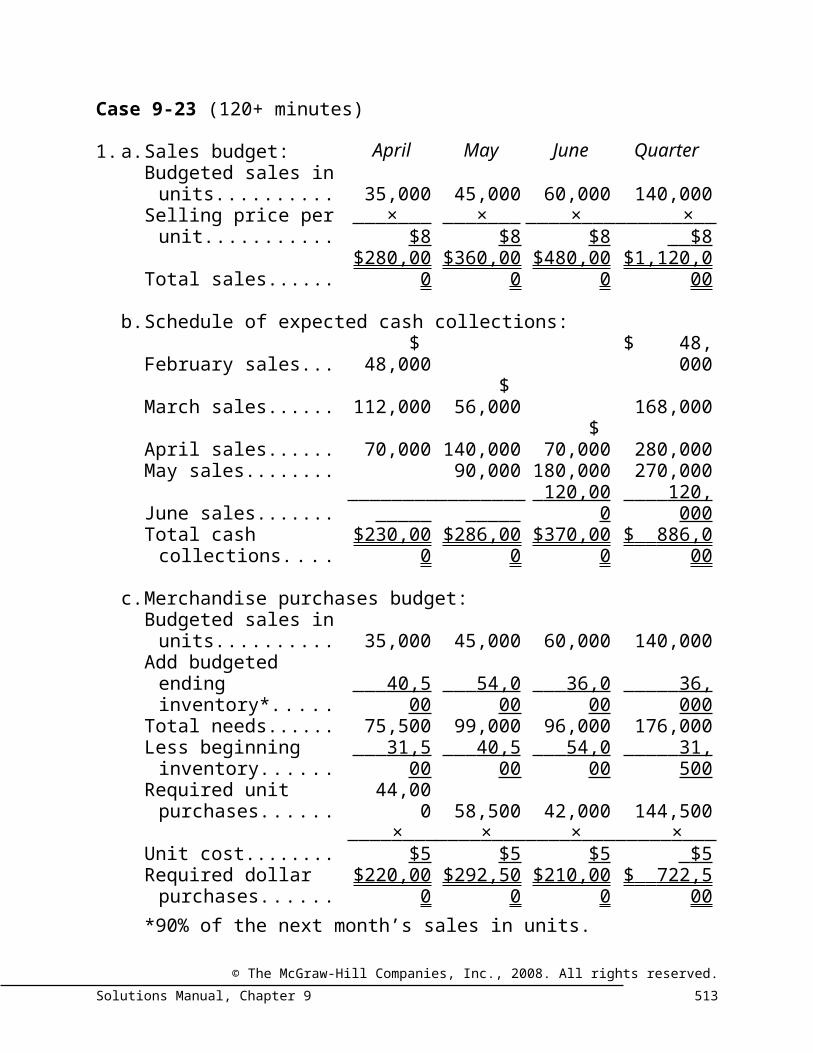
Case 9-23 (120+ minutes)1. a. Sales budget: April May June Quarter
Budgeted sales in units...................... 35,000 45,000 60,000 140,000
Selling price per unit....................... × $8 × $8 × $8
× $ 8
Total sales...............$280,00
0$360,00
0$480,00
0$1,120,00
0
b. Schedule of expected cash collections:
February sales.........$
48,000$ 48,00
0
March sales............. 112,000$
56,000 168,000
April sales................ 70,000 140,000$
70,000 280,000May sales................ 90,000 180,000 270,000
June sales................ 120,000 120,00
0Total cash collec-
tions......................$230,00
0$286,00
0$370,00
0$ 886,00
0
c. Merchandise purchases budget:Budgeted sales in
units...................... 35,000 45,000 60,000 140,000Add budgeted end-
ing inventory*....... 40,500 54,000 36,000 36,000 Total needs.............. 75,500 99,000 96,000 176,000Less beginning in-
ventory................. 31,500 40,500 54,000 31,500 Required unit pur-
chases.................. 44,000 58,500 42,000 144,500Unit cost.................. × $5 × $5 × $5 × $5 Required dollar pur-
chases..................$220,00
0$292,50
0$210,00
0$ 722,50
0*90% of the next month’s sales in units.
© The McGraw-Hill Companies, Inc., 2008. All rights reserved.502 Managerial Accounting, 12th Edition

Case 9-23 (continued)d. Budgeted cash disbursements for merchandise purchases:
April May June QuarterMarch purchases. $ 85,750 $ 85,750April purchases. . . 110,000 $110,000 220,000May purchases.... 146,250 $146,250 292,500June purchases.... 105,000 105,000 Total cash dis-
bursements....... $195,750 $256,250 $251,250 $ 703,250
© The McGraw-Hill Companies, Inc., 2008. All rights reserved.Solutions Manual, Chapter 9 503

Case 9-23 (continued)2. Cravat Sales Company
Cash BudgetFor the Three Months Ending June 30
April May June QuarterCash balance, begin-
ning........................... $ 14,000 $ 10,250 $ 10,000 $ 14,000Add receipts from cus-
tomers (Part 1 b.)...... 230,000 286,000 370,000 886,000 Total cash available..... 244,000 296,250 380,000 900,000 Less disbursements:
Purchase of inventory (Part 1 d.)............... 195,750 256,250 251,250 703,250
Sales commissions.... 35,000 45,000 60,000 140,000Salaries and wages... 22,000 22,000 22,000 66,000Utilities...................... 14,000 14,000 14,000 42,000Miscellaneous........... 3,000 3,000 3,000 9,000Dividends paid.......... 12,000 0 0 12,000Land purchases......... 0 25,000 0 25,000
Total disbursements.... 281,750 365,250 350,250 997,250 Excess (deficiency) of
receipts over dis-bursements............... (37,750 ) (69,000 ) 29,750 (97,250 )
Financing:Borrowings................ 48,000 79,000 0 127,000Repayments*............ 0 0 (16,000) (16,000)Interest*.................... 0 0 (3,020 ) (3,020 )
Total financing............. 48,000 79,000 (19,020 ) 107,980 Cash balance, ending. . $ 10,250 $ 10,000 $ 10,730 $ 10,730
* This is the maximum amount (in increments of $1,000) that the company could repay to the bank and still have at least a $10,000 ending balance.
** $48,000 × 1% × 3 =
$1,440
$79,000 × 1% × 2 = 1,580
Total interest = $3,02
© The McGraw-Hill Companies, Inc., 2008. All rights reserved.504 Managerial Accounting, 12th Edition

0
© The McGraw-Hill Companies, Inc., 2008. All rights reserved.Solutions Manual, Chapter 9 505

Case 9-23 (continued)3. Cravat Sales Company
Budgeted Income StatementFor the Three Months Ended June 30
Sales revenue (Part 1 a.)...............$1,120,00
0Variable expenses:
Cost of goods sold (140,000 ties @ $5 per tie)...... $700,000
Commissions (140,000 ties @ $1 per tie)...... 140,000 840,000
Contribution margin...................... 280,000Fixed expenses:
Wages and salaries..................... 66,000Utilities........................................ 42,000Insurance expired....................... 3,600Depreciation............................... 4,500
Miscellaneous............................. 9,000 125,10
0Net operating income.................... 154,900Less interest expense.................... 3,020
Net income....................................$ 151,88
0
© The McGraw-Hill Companies, Inc., 2008. All rights reserved.506 Managerial Accounting, 12th Edition

Case 9-23 (continued)4. Cravat Sales Company
Budgeted Balance SheetJune 30
AssetsCash (Part 2)...................................................... $ 10,730Accounts receivable (see below)....................... 450,000Inventory (36,000 ties @ $5 per tie)................. 180,000Unexpired insurance ($14,400 – $3,600)........... 10,800Fixed assets, net of depreciation
($172,700 + $25,000 – $4,500)...................... 193,200 Total assets........................................................ $844,730
Liabilities and EquityAccounts payable, purchases
(50% × $210,000 from Part 1 c.).................... $105,000Dividends payable............................................. 12,000Loans payable, bank (Part 2; $127,000 –
$16,000)......................................................... 111,000Capital stock, no par.......................................... 300,000Retained earnings (see below).......................... 316,730 Total liabilities and equity.................................. $844,730
Accounts receivable at June 30:25% × May sales of $360,000.......... $ 90,00075% × June sales of $480,000.......... 360,000 Total.................................................. $450,000
Retained earnings at June 30:Balance, March 31............................ $176,850Add net income (Part 3).................... 151,880 Total.................................................. 328,730Less dividends declared.................... 12,000 Balance, June 30............................... $316,730
© The McGraw-Hill Companies, Inc., 2008. All rights reserved.Solutions Manual, Chapter 9 507

Research and Application 9-24 (240 minutes)1. Procter & Gamble (P&G) succeeds first and foremost because
of its product leadership customer value proposition. Page 26 of the annual report says that P&G succeeds by winning two “moments of truth.” First, P&G must win the moment of truth “when a consumer stands in front of the shelf and chooses a product from among many competitive offerings.” This moment of truth alludes to a dimension of product leadership called perceived quality, or brand recognition. P&G must also win the second moment of truth “when the consumer uses the product and evaluates how well the product meets his or her expectations.” This moment of truth alludes to the actual functionality of the product. If P&G cannot win these two “moments of truth” all other dimensions of competitiveness are moot.Students can make defensible arguments in favor of customer intimacy and operational excellence. For example, the Market Development Organization (MDO) operates in over 80 countries in an effort to tailor P&G’s brands to local consumer preferences. However, these customer intimacy efforts are targeted at fairly large customer segments. Companies that succeed primarily because of customer intimacy tailor their offerings to individual customers, not large customer segments. P&G also cites economies of scale as being important to its success. While this is certainly true, scale does not differentiate P&G from its major competitors. What differentiates P&G from its competitors is the leadership position of its 17 “billion dollar brands.”
2. P&G faces numerous business risks, some of which are described on page 28 and throughout the annual report. Students may mention other risks beyond those specifically mentioned in the annual report. Here are four risks faced by P&G with suggested control activities: Risk: Patents granted to competitors may introduce product
innovations that threaten P&G’s product leadership position. Control activity: Create a competitive intelligence depart-
© The McGraw-Hill Companies, Inc., 2008. All rights reserved.508 Managerial Accounting, 12th Edition

ment that legally gathers information about the plans and actions of competitors.
Risk: One customer, Wal-Mart, accounted for 16% of P&G’s sales in 2005 (see page 60 of the annual report). Control ac-tivity: Seek to diversify sources of sales revenue. P&G ap-pears to be doing this because Wal-Mart was responsible for 17% and 18% of P&G’s sales in 2004 and 2003, respectively.
© The McGraw-Hill Companies, Inc., 2008. All rights reserved.Solutions Manual, Chapter 9 509

Research and Application 9-24 (continued) Risk: P&G’s pipeline of product innovations will dissipate,
thereby threatening the company’s product leadership posi-tion. Control activities: Invest generously in research & de-velopment and create performance measures that monitor the number of patents generated per dollar of investment.
Risk: Globalization efforts may fail to grow sales. Page 7 of the annual report mentions that P&G currently generates only 23% of its sales from countries that comprise 86% of the world’s population. Control activities: Continue to invest in the Market Development Organization and ask it to survey customers in target markets to ensure a good fit between P&G products and local consumer tastes.
3. P&G’s quarterly sales (in millions) for 2005 were as follows: September 30th, $13,744; December 31st, $14,452; March 31st, $14,287; and June 30th, $14,258. Federated Department Stores had quarterly sales (in millions) in 2004 of: March 31st, $3,517; June 30th, $3,548; September 30th, $3,491; and December 31st, $5,074. P&G’s quarterly sales trend is relatively smooth, whereas Federated’s sales spiked upward in the fourth quarter.Federated has strong sales during the year-end holiday season, whereas P&G sells products that are daily essentials—Crest, Bounty, Charmin, Downy, and Folgers are used by consumers 365 days a year. Generally speaking, companies with seasonal customer demand will have greater cash budgeting concerns. These companies need to have enough cash available to buy large amounts of inventory even though the related cash inflows may not be received for months.
4. The “Item 2: Properties” section of P&G’s 10-K states that the company operates 33 manufacturing plants in 21 different states in the United States. P&G also operates 91 manufacturing facilities in 42 other countries.P&G’s three Global Business Units (GBUs) include P&G Beauty, P&G Family Health, and P&G Household Care. P&G Beauty includes five of the company’s billion dollar brands—Pantene, Olay, Head & Shoulders, Wella, and Always. P&G Family Health
© The McGraw-Hill Companies, Inc., 2008. All rights reserved.510 Managerial Accounting, 12th Edition

includes six of the company’s billion dollar brands—Pampers, Charmin, Bounty, Crest, Actonel, and
© The McGraw-Hill Companies, Inc., 2008. All rights reserved.Solutions Manual, Chapter 9 511

Research and Application 9-24 (continued)Iams. P&G Household Care includes the remaining six billion dollar brands—Folgers, Downy, Tide, Pringles, Dawn, and Ariel. Page 25 of the annual report mentions that P&G markets a total of over 300 branded products in more than 160 countries. The company’s Market Development Organization operates in 80 countries.
5. Numerous uncertainties discussed on page 28 of the annual report complicate P&G’s forecasting process. These include: (1) raw material cost fluctuations, (2) competitor advertising, pricing and promotion decisions, (3) global economic and political conditions, (4) changes in the regulatory environment, and (5) unforeseen difficulties integrating acquisitions such as Wella and Gillette.
6. The potential for data redundancy and data inconsistencies in a company the size of P&G is enormous. For example, disintegrated computer systems may allow each P&G plant to create its own unique terminology for identifying particular types of raw material. This kind of data inconsistency creates problems when P&G attempts to roll-up the underlying budgets from all of its manufacturing plants into one cohesive whole. The amount of time required to enable disintegrated software programs used at more than 120 manufacturing facilities across more than 40 countries to dovetail with one another would be overwhelming.Enterprise systems would enable each data element to have only one unique identifier across the entire company. All plants would have a common language for categorizing raw material costs as well as other types of expenses. Furthermore, the process of rolling-up the budget would be greatly simplified because all parts of the organization could easily share financial information rather than having to rely on extraordinary amounts of computer code to forge linkages between disconnected legacy systems.
© The McGraw-Hill Companies, Inc., 2008. All rights reserved.512 Managerial Accounting, 12th Edition
Research and Application 9-24 (continued)7. Differences in budgeting practices could definitely create
cultural differences in terms of accountability and internal communication. For example, if one company uses inflexible and non-negotiable budget targets to blame and punish its employees it would create a counter-productive culture of accountability. This would stand in stark contrast to a company that uses budgets to plan, coordinate, and improve its operations, rather than to assign blame.Furthermore, a “top-down” approach to budgeting would create a different cultural environment in terms of internal communication than a “bottom-up” participative approach to budgeting. The “top-down” approach would create a sub-optimal environment of one-way communication where the knowledge of those closest to the customer is disregarded. The “bottom-up” approach would empower subordinates to improve the quality of the budget by sharing their knowledge while at the same time recognizing the need for strategic oversight from senior managers.
© The McGraw-Hill Companies, Inc., 2008. All rights reserved.Solutions Manual, Chapter 9 513