Embed Size (px)
Citation preview

Visiting adress: Skaraborgsvägen 3 Postal adress: 501 90 Borås Website: www.hb.se/ths
Thesis for the Degree of Master in Science with a major in Textile Engineering
The Swedish School of Textiles Report no. 2018.14.02 31
st of May 2018
Chemical and physical changes in
PET fibres due to exhaust dyeing
- Issues in thermo-mechanical recycling of dyed PET textiles
Frida Lindström


i
ABSTRACT Polyethylene terephthalate (PET) is the most used fibre in the textile industry. PET
is also used in other products, e.g. soft-drink bottles and food packaging. Approxi-
mately 60% of the globally produced PET is intended for production of textile
fibres and the demand for polyester fibres have steadily increased over the last
decade. Yet, most of the recycled PET fibres are produced from discarded bottles
and not discarded textiles even though the generation of textile waste is increasing
year by year. The importance of finding efficient recycling routes for discarded
PET textiles is obvious. In thermo-mechanical recycling the thermoplastic charac-
teristic of PET is utilized to re-melt and re-form PET waste into new valuable
products. Today, this is used for bottle-to-fibre recycling but not for fibre-to-fibre
recycling. The main research question asked in this Master thesis is if the process
of exhaust dyeing compromise the possibility to recycle PET textiles through re-
melt spinning. It is believed that PET degradation through hydrolysis may occur
during dyeing. The degradation behaviour of PET has been widely studied. How-
ever, degradation during exhaust dyeing has not been investigated.
The process parameters temperature, time and number of dyeing cycles have been
investigated. Also, possible effects of different auxiliary chemicals have been stud-
ied. Dyeing and characterisation of two PET fabrics with filaments of different titer
was performed in order to investigate if the filament titer is also a parameter to
consider.
Tensile testing and surface characterisation through demand absorbency test
showed that the filament titer seems to affect how the tensile and moisture related
properties change due to dyeing. Differential scanning calorimetry showed that the
crystallisation rate is affected by the dyeing process. This can be an effect of for-
mation of shorter PET chains during dyeing. The auxiliary chemicals have been
shown to be the most critical factor in changes of the crystallisation behaviour.
Fourier-Transform infrared spectroscopy indicated that chain scission has occurred
during dyeing.
The results have shown that the exhaust dyeing process causes changes in tensile
properties, moisture related properties, degree of crystallinity as well as crystallisa-
tion behaviour. DSC and FTIR results indicate chain scission. Based on the results
it cannot be concluded if the changes are large enough to compromise the possibil-
ity to recycle PET textiles thermo-mechanically. Further research is required in
order to correlate the observed changes with possible problems in thermo-
mechanical recycling of dyed PET textiles.
Key words: Polyethylene terephthalate, polyester, exhaust dyeing, auxiliary chem-
icals, degradation, hydrolysis, thermo-mechanical recycling, fibre-to-fibre recy-
cling, FTIR, DSC, tensile properties, demand absorbency test.

ii
POPULAR ABSTRACT Polyester is the most used fibre in the textile industry. Polyester is a synthetic ma-
terial and the actual name of the material used for most polyester textiles is poly-
ethylene terephthalate or PET. The same material is used for production of PET-
bottles. When labels on clothing and other textile products state “Recycled polyes-
ter” it is usually textile fibres made from discarded PET bottles. One way to create
recycled fibres is by turning the bottles into smaller pieces which can be melted.
From the melt PET fibres can be formed.
The recycling of bottles to fibres is one step towards a more sustainable production
of textiles. Another important step would be to recycle fibres back to fibres. The
question is why fibre-to-fibre recycling is not used when bottle-to-fibre recycling
has been successfully established. Since the material in PET bottles can be melted
and formed into fibres, it is thought that the material in textiles could also be turned
back into fibres through a similar method.
In this Master thesis it has been studied if the dyeing of PET textiles could cause
any problems in a future recycling process. It is believed that properties of the PET
fibres changes as the textile is being dyed. Testing showed that strength, stiffness,
and how the fabric absorbs water differ between un-dyed and dyed polyester fab-
rics. The changes depend on how the fabrics are dyed, dyeing temperature and how
many times the fabrics are dyed affects the changes. Also, what chemicals are used
during dyeing affects the changes.
The dyeing process does cause changes in the PET but these changes may be too
small to cause problems in a future recycling process. The result of this Master
thesis is only one piece in a larger context. Therefore more research is necessary to
connect these results with fibre-to-fibre recycling and potential problems in such a
process.

iii
ACKNOWLEDGEMENTS First of all I would like to thank my supervisor Anders Persson for initiating this
project and for patiently providing guidance along the way. Our discussions and
your input have been very helpful. I appreciate how you always believe in your
students, and how that motivates me to always try my best, thank you! I would like
to thank the technicians in the dyeing- and finishing lab at the Swedish School of
Textiles, Carin Backe, Ulrika Norén and Catrin Tammjärv, for all your help and
guidance. It has been a lot of fun working with you in the lab! Thank you, Ellinor
Niit, for valuable feedback and advices. I also want to thank the lab technicians at
the polymer lab and the chemistry lab at the University of Borås for showing and
helping me with all necessary equipment.
I want to thank F.O.V. Fabrics AB for providing fabrics and chemicals for this
project. And I want to specially thank Stefan Gustafson for providing valuable
information as well as great input to this project.
I want to thank my fellow students for being there throughout this process provid-
ing valuable feedback and discussions. But mostly, thank you for creating so many
moments of laughter even during challenging times.
Last but not least, I want to thank my family and friends for all of their support and
for always believing in me. And a special thanks to Milo for being the very best of
friends.
Frida Lindström
June 2018

iv

v
TABLE OF CONTENTS 1. Introduction ........................................................................................................ 1
1.1. Background ............................................................................................... 1
1.1.1. Polyethylene terephthalate ................................................................ 1
1.1.2. Polymerisation of PET ...................................................................... 2
1.1.3. Dyeing of PET .................................................................................. 4
1.1.4. Overview of recycling of PET .......................................................... 5
1.2. Problem description .................................................................................. 8
1.3. Scope and Research questions .................................................................. 9
1.4. Limitations ................................................................................................ 9
2. Literature Review ............................................................................................. 10
2.1. Degradation behaviour of PET ............................................................... 10
2.1.1. Hydrolytic degradation ................................................................... 10
2.1.2. Chemically induced degradation ..................................................... 13
2.1.3. Thermal degradation ....................................................................... 13
2.1.4. Degradation induced by photo radiation ......................................... 14
2.1.5. Enzymatically induced degradation ................................................ 15
2.2. PET oligomers ........................................................................................ 15
2.2.1. Oligomers and dyeing ..................................................................... 16
2.3. Side effects of dyeing and processing ..................................................... 16
2.4. Thermo-mechanical recycling of PET .................................................... 18
2.5. Polymer characterisation ......................................................................... 20
2.5.1. Molecular weight determination ..................................................... 20
2.5.2. Fourier-Transform Infrared spectroscopy ....................................... 21
2.5.3. Characterisation of the fine structure of PET .................................. 23
3. Materials and Methods ..................................................................................... 24
3.1. Materials ................................................................................................. 24
3.1.1. Sample preparation ......................................................................... 24
3.2. Experimental ........................................................................................... 25

vi
3.2.1. Exhaust dyeing ................................................................................ 27
3.2.2. Characterisation............................................................................... 28
3.3. Statistical analyses .................................................................................. 31
3.4. Data modification for graph construction ............................................... 31
4. Results .............................................................................................................. 32
4.1. Weight differences .................................................................................. 32
4.1.1. Weight differences due to dyeing.................................................... 32
4.1.2. Vacuum drying ................................................................................ 34
4.2. Tensile properties .................................................................................... 37
4.2.1. Breaking strength ............................................................................ 37
4.2.2. Elongation at break ......................................................................... 40
4.2.3. Young’s modulus ............................................................................ 42
4.3. Demand absorbency capacity and Moisture absorption rate ................... 45
4.4. Fourier-Transform Infrared spectroscopy ............................................... 51
4.4.1. Absorbance ratios ............................................................................ 55
4.5. Differential Scanning Calorimetry .......................................................... 59
4.5.1. DSC curves for PETC samples ........................................................ 64
4.5.2. DSC curves for PETM samples ........................................................ 67
4.6. Dissolving of PET fabrics ....................................................................... 70
5. Discussion and analysis .................................................................................... 71
5.1. Weight differences .................................................................................. 71
5.1.1. Vacuum drying ................................................................................ 72
5.2. Tensile properties .................................................................................... 73
5.3. Correlations and relationships ................................................................. 74
5.3.1. The effects of exposure time above Tg ............................................ 74
5.3.2. The effects of dyeing temperature ................................................... 74
5.3.3. DSC results, tensile properties and demand absorbency ................. 75
5.4. FTIR results ............................................................................................. 76
5.4.1. Trans-gauche relationships .............................................................. 79

vii
5.5. DSC results ............................................................................................. 79
5.6. Methodology ........................................................................................... 80
5.6.1. Demand absorbency test ................................................................. 80
5.6.2. DSC ................................................................................................. 81
5.6.3. FTIR ................................................................................................ 81
5.7. Recyclability of dyed PET fabrics .......................................................... 81
6. Conclusions ...................................................................................................... 83
7. Future research ................................................................................................. 85
7.1. Variety of processing conditions and materials ...................................... 85
7.2. Re-melt spinning of dyed fabrics ............................................................ 85
7.3. Further characterisation .......................................................................... 85
7.3.1. Characterisation of oligomers ......................................................... 86
Reference list .......................................................................................................... 87
Appendix I. Tukey test: Breaking strength for PETC .......................................... 93
Appendix II. Tukey test: Breaking strength for PETM ..................................... 94
Appendix III. Tukey test: Elongation at break for PETC ................................... 95
Appendix IV. Tukey test: Elongation at break for PETM .................................. 96
Appendix V. Tukey test: Young’s modulus for PETC ...................................... 97
Appendix VI. Tukey test: Young’s modulus for PETM ..................................... 98
Appendix VII. Tukey test: Demand absorbency capacity for PETC ................... 99
Appendix VIII. Tukey test: Maximum absorption rate for PETC ................... 100
Appendix IX. Tukey test: Demand absorbency capacity for PETM ................. 101
Appendix X. Tukey test: Maximum absorption rate for PETM ...................... 102
Appendix XI. FTIR spectra – PETC ................................................................. 103
Appendix XII. FTIR Spectra – PETM ............................................................... 106
Appendix XIII. Correlation analysis PETC ..................................................... 111
Appendix XIV. Correlation analysis PETM .................................................... 113

viii

1
1. INTRODUCTION The textile industry faces many problems related to sustainability and sustainable
development. Natural resources like fossil fuels, fresh water, and land areas are
exploited in order to produce textile fibres and textile products for several different
purposes. Fossil fuels are used as a source for energy in production plants as well
as a raw material for synthetic fibres. In dyeing and finishing of textiles huge
amounts of water, chemicals and energy are consumed. Despite this heavy con-
sumption of resources, mass produced textiles like clothing are produced at very
low costs and sold at low prices.
The world is facing the problem of increased consumption, and fashion and textile
goods are a part of this problem. As the consumption increases so does the waste.
Huge amounts of recyclable textiles and clothes find their way to landfills and in-
cineration meaning wastage of potentially valuable resources (Textile Exchange
2017). It is of great importance for the sustainable development within the textile
industry to create efficient and sustainable recycling routes that utilize the waste in
order to turn it into once again useful resources.
Polyester or more specifically polyethylene terephthalate (PET) is by far the most
used fibre in the textile industry today. According to Preferred Fiber & Materials
Market Report 2017 (Textile Exchange 2017) synthetic fibres held a market share
of about 68% of the total fibre market in 2016 and almost 80% of that share was
held by polyester. The largest application area for PET is textile fibres (ICIS 2007;
Park & Kim 2014). About 60% of the globally produced PET is intended to be
used for textile fibre production (Oekotex 2011; Park & Kim 2014; Plastic Insight
2017) yet recycling of PET textiles is not very common.
1.1. BACKGROUND According to Textile Exchange (2017) approximately 52 million tonnes of polyes-
ter fibres was produced during 2016, and even though the usage of recycled PET
(rPET) in the textile industry grew by 58% from 2015 to 2016 only 7% of the total
PET usage was estimated to be rPET. One great advantage of PET is its thermo-
plastic characteristic which creates a possibility to re-melt and spin recycled fibres
from discarded PET products, e.g. drinking bottles. This method may have the
potential to be used in recycling of PET textiles as well.
Dyeing is one important processing step in textile production that adds value to the
final product. As mentioned previously the processes for dyeing and finishing of
textiles consume very large volumes of water as well as chemicals and energy. At
the same time there is a risk that the textile is affected by the dyeing process, which
is likely to reduce the life span and probably the recyclability of the textile.
1.1.1. POLYETHYLENE TEREPHTHALATE
Polyesters are a group of polymers containing ester linkages in the backbone chain
and the polymers within this category can be classified as aliphatic or aromatic
(Albertsson, Edlund & Odelius 2012). PET is an aromatic polyester of thermo-
plastic nature with a characteristic glass transition temperature (Tg) and melting

2
point (Tm). The thermoplastic characteristic can be utilized both in production and
recycling processes (Grishanov 2011). Tg and Tm depend on different factors, e.g.
molecular weight (MW) and degree of crystallinity, and can therefore vary be-
tween different PET products. According to Albertsson, Edlund and Odelius (2012
pp. 253) Tg of PET is approximately 74°C and Tm is approximately 265°C. Accord-
ing to Cowie and Arrighi (2008 pp. 423) PET used for fibre forming purposes have
a Tg of approximately 70°C and a Tm around 265°C. The fine structure of PET can
be explained by a two-fraction or a three-fraction model. The former consider that
PET consists of one crystalline fraction and on amorphous fraction while the latter
consider three fractions. The three fractions are suggested to be the crystalline frac-
tion, the mobile/randomly organised amorphous fraction, and the rigid/organised
fraction (Burkinshaw 2015; Badia, Strömberg, Karlsson & Ribes-Greus 2012).
The repeating unit in PET is ethylene terephthalate and it is shown in Figure 1. For
general application textile fibres the average number of units in one PET chain is
100 and the average MW is about 20 000. Higher MW result in stronger fibres
(Venkatachalam et al. 2012). The MW of PET differs depending on the final appli-
cation.
The polymerisation process affects the intrinsic viscosity of the final PET polymer
(Farah, Kunduru, Basu & Domb 2015). Textile-grade PET has an intrinsic viscosi-
ty of 0.40 – 0.70 dl/g while PET for carbonated soft drinks has an intrinsic viscosi-
ty of 0.73 – 0.85 dl/g (Awaja & Pavel 2005; Gupta & Bashir 2005, see Farah et al.
(2015) pp. 144). The intrinsic viscosity is related to the MW and both of these
properties are important in thermo-mechanical recycling.
FIGURE 1 REPEATING UNIT IN POLYETHYLENE TEREPHTHALATE
1.1.2. POLYMERISATION OF PET
PET is polymerised through condensation polymerisation, a type of step-growth
polymerisation in which the reactions lead to elimination of small molecules or
condensation products, e.g. water (Albertsson, Edlund & Odelius 2009; Cowie &
Arrighi 2008). In the case of PET there are different possible polymerisation
routes. Most common is polymerisation from ethylene glycol and terephthalic acid
(TPA) or dimethyl terephthalate (DMT). The two different polymerisation routes
are shown in Figure 2 and Figure 3. The polymerisation reactions are equilibrium
reactions, meaning possibilities for reversible reactions to take place, e.g. hydroly-
sis which is further explained in section 2.1.1. Hydrolytic degradation. This means
that the condensation products have to be removed to avoid de-polymerisation
reaction to take place and in order to achieve high molecular weights (Albertsson,
Edlund & Odelius 2009).

3
FIGURE 2 STEP-GROWTH POLYMERISATION OF PET USING TPA AND ETHYLENE GLYCOL
FIGURE 3 STEP-GROWTH POLYMERISATION OF PET USING DMT AND ETHYLENE GLYCOL

4
1.1.3. DYEING OF PET
Due to the highly crystalline nature of PET fibres and the rigidity in the polymer
chains elevated pressures and high temperatures should be used in order to success-
fully dye PET textiles (Grishanov 2011). The crystallinity of the PET fibres makes
it difficult for dye molecules to penetrate the fibres at temperatures below 100°C
(Richards 2015). The dye type most commonly used for dyeing of PET fibres and
textiles is disperse dyes (Grishanov 2011; Burkinshaw 2015) and the dominating
method for dyeing PET with disperse dyes is high temperature dyeing (Burkinshaw
2015). High temperature dyeing is carried out under pressure in temperatures be-
tween 130°C and 140°C. In addition to the high temperature dyeing method carrier
dyeing and dry-heat fixation or thermosol method can be used for dyeing of PET
fibres (Burkinshaw 2015; Roy Choudhury 2011). Pressurised dyeing machines,
e.g. jet machines, are the most commonly used dyeing equipment for PET (Clark
2011). Dyeing is usually followed by clearing treatments with detergent or through
reductive or oxidative treatments. The aim of this is to remove residuals dye stuff
and auxiliary chemicals (Burkinshaw 1995).
Exhaust dyeing with disperse dyes
Exhaust dyeing is a discontinuous process that is being used for different fibre
types. Dyeing can be carried out on fibres, yarns or fabrics. In the case of exhaust
dyeing of PET fibres and textiles with disperse dyes, the dye is dispersed in a dye
bath and the textile material is immersed into the bath (Bellini, Bonetti, Franzetti,
Rosace & Vago 2006). The temperature is raised to 130-140°C so that the dye stuff
can access the interior of the fibres.
Exhaust dyeing has been described as a four stage process with the following four
stages by Bellini et al. (2006):
I. Dispersion of dye in dye bath
II. Adsorption of dye molecules from dye bath onto fibre surface
III. Diffusion from fibre surface into fibre interior
IV. Migration for even dye concentration throughout the fibre
Gulrajani (2008) described exhaust dyeing as a three stage process consisting of a
sorption phase, a diffusion phase, and a levelling phase.
Disperse dyes and auxiliary chemicals
A disperse dye is defined as “a substantially water-insoluble dye having substan-
tivity for one or more hydrophobic fibres, e.g. cellulose acetate, and usually ap-
plied from fine aqueous dispersion” (The Society of Dyers and Colourists (UK) see
Roy Choudhury (2011) p. 47). Disperse dyes are suitable for dyeing of PET fibres
since PET is hydrophobic and therefore not easily dyed with water-soluble dyes.
Disperse dyes have a very low solubility in water, that is increased with increasing
temperature and also by the use of dispersing agents (Burkinshaw 2015). Dispers-
ing agents are used in mixture with disperse dyes with the aim to ease dispersion of
the dye in the aqueous dye bath. For this purpose the dispersing agent and the dye
are milled together to achieve a suitable particle size and particle size distribution
of the dye. The role of the dispersing agent during milling is to prevent agglomera-

5
tion. Also, the dispersing agent plays a vital role in maintenance of a stable disper-
sion during dyeing. Additional dispersing agent can be added directly into the dye
bath with the purpose of stabilising the dispersion, improving the dye-to-fibre mi-
gration, and levelling during dyeing at high temperatures (ibid.). Dispersing agents
consist of different chemical compounds, some examples are naphthalene sulphon-
ic acid, 1-naphtol 6-sulphonic acid, and fatty alcohol-ethylene oxide condensate
(Chakraborty 2010).
Levelling agents are used in dyeing of PET and their role is to facilitate migration
of the disperse dyes from aqueous phase to fibre and to improve the levelling be-
haviour (Burkinshaw 2015; Roy Choudhury 2011). Anionic and non-ionic level-
ling agents are used in the dyeing of PET. The function of the anionic levelling
agent is to improve migration to and diffusion in the fibre. The function of non-
ionic levelling agents is to improve levelling by retarding the dye uptake (Burkin-
shaw 2015).
1.1.4. OVERVIEW OF RECYCLING OF PET
Polymer waste can be recycled, used for energy recovery (incineration) or end up
in landfills (Ragaert, Delva & Van Geem 2017). Two important reasons behind
recycling are to prevent wastage of useful materials and to reduce the consumption
of valuable raw materials (Vadicherla & Saravanan 2014). According to Park and
Kim (2014) recycling of PET is desirable since it will lead to reduced CO2 emis-
sions and oil usage. Another important reason for recycling is that PET degrades
very slowly in natural conditions so recycling is a way to take care of PET waste
(Awaja & Pavel 2005). Recycled PET can be used for production of e.g. bottles,
packaging and fibres. In both USA and EU the largest end market share for rPET
in 2009 was fibres. However, these market shares have decreased during 2001-
2009 in favour for increased application of rPET in bottles and food packaging
(Welle 2011).
Generally, recycling of plastic waste is closed-loop recycling or open-loop recy-
cling (Ragaert, Delva & Van Geem 2017). PET bottles recycled into textile fibres
is an example of open-loop recycling while recycling of textile fibres into textile
fibres is an example of closed-loop recycling.
Mechanical recycling
One great advantage of PET that is often mentioned in the literature is the thermo-
plastic characteristic that creates a possibility for recycling through re-melting. In
case of PET textiles recycling from fibres to fibres can theoretically be achieved
through re-melt spinning, meaning that PET fibres are melted and the melt is ex-
truded into new fibres. However, this is not yet established as a recycling method
for PET textiles.
The steps in mechanical recycling of PET differ based on the type and quality of
waste. Post-industrial waste and post-consumer waste requires different recycling
routes (Ragaert, Delva & Van Geem 2017). A general overview of the steps in
mechanical recycling of post-consumer waste is presented in Figure 4.

6
FIGURE 4 GENERAL OVERVIEW OF THE MECHANICAL RECYCLING PROCESS OF POST-
CONSUMER PET-WASTE
The most commonly used mechanical recycling method for production of rPET
fibres is melt extrusion of PET flakes from PET bottle waste directly into fibres.
The other method involves a middle step, namely conversion of the PET flakes into
granulates or pellets before melt extrusion into fibres (Park & Kim 2014). Today,
mechanical recycling of PET-bottles is well-established and discarded bottles are
mostly recycled into fibres or other packaging products. Two challenges in me-
chanical recycling of PET are degradation during the re-processing and degrada-
tion that have occurred during the lifetime of the PET product (Ragaert, Delva &
Van Geem 2017).
A more extensive review on thermo-mechanical recycling of PET is presented in
section 2.4. Thermo-mechanical recycling of PET.
Chemical recycling
Chemical recycling is achieved through depolymerisation of the PET polymers
through glycolysis, hydrolysis, methanolysis, or aminolysis reactions (Park & Kim
2014; Ragaert, Delva & Van Geem 2017). In addition ammonolysis and hydro-
henation can be utilized in chemical recycling of PET (Ragaert, Delva & Van
Geem 2017). The different methods result in different monomers, oligomers or
other chemicals (Al-Sabagh, Yehia, Eshaq, Rabie & ElMetwally 2015; Ragaert,
Delva & Van Geem 2017). An overview of chemical recycling processes and the
resulting products is presented in Figure 5.
Guo, Lindqvist and de la Motte (2018) presented a recycling route for PET into
bis(2-hydroxyethyl) terephthalate monomers (BHET) through glycolysis. By intro-
ducing a pre-degradation step before depolymerisation it was shown that the effi-
ciency of recycling PET into BHET can be enhanced. The efficiency depends on
the type of catalyst used in the pre-degradation step. BHET is used as a source in
re-polymerisation reactions back to PET (ibid.). BHET can also be used for manu-
facturing hydrophobic disperse dyes or acrylic and allylic monomers (Ragaert,
Delva & Van Geem 2017).

7
FIGURE 5 OVERVIEW OF CHEMICAL RECYCLING ROUTES AND RECYCLED PRODUCTS FOR
PET WASTE
Polyols can be used for condensation polymerisation of e.g. polyurethanes and
epoxy resin. Terephthalic acid (TPA) and dimethyl terephthalate (DMT) can both
be used for polymerisation of PET. Diamides of TPA can be used for several dif-
ferent products, e.g. for plasticiser in polyvinyl chloride (PVC) (Ragaert, Delva &
Van Geem 2017).
Difficulties in PET recycling
Post-consumer waste can be difficult to recycle since the waste stream is very
complex and the waste is usually contaminated. Degradation products, contamina-
tions and different residues from production and usage can cause problems in PET
recycling. During the usage phase PET products are exposed to different conditions
that may lead to degradation, e.g. UV radiation, oxygen, and mechanical stresses
(Park & Kim 2014). Contaminants like PVC and adhesives used for labels can
produce acids during the recycling process. Some acids, e.g. acetic acid, rosin acid
and abietic acid, act as catalysts in chain scission reactions that occur during re-
processing. Dyes and colourants are also considered to contaminate the waste (Al-
Sabagh et al. 2015; Awaja & Pavel 2005). Acetaldehyde is a by-product from deg-
radation reactions that occur in PET. This contaminant is problematic since it can
migrate from PET packages into food and drinks (Awaja & Pavel 2005).
Water can create big problems in mechanical recycling since even very low mois-
ture content causes hydrolysis of the polymer in the molten state (Al-Sabagh et al.
2015). Hydrolysis of PET result in an increase of carboxyl end-groups, meaning
increased hydrophilicity (Zimmerman & Kim 1980). Since moisture is problematic
in re-melting of PET this can obviously be problematic in a potential recycling
step, since the ability to retain moisture will increase if the PET is hydrolysed.
Another difficulty in recycling is maintaining constant quality between the rPET-
batches, since the quality and the properties of the waste will affect the final prop-
erties of the rPET. Due to thermal and thermal-oxidative degradation during the
recycling process the mechanical properties are negatively affected. The colour of
the rPET can also be affected due to degradation (Venkatachalam et al. 2012).
Degradation and side effects due to re-processing will be further described in sec-
tion 2.3 Side effects of dyeing and processing.

8
1.2. PROBLEM DESCRIPTION Virgin PET (vPET) is mostly made from crude oil, a fossil raw material source
likely to be exhausted in a foreseeable future. By using rPET instead of vPET the
dependence on oil as a raw material is reduced (Park & Kim 2014). Recycling is of
great importance when it comes to satisfying the future fibre demand in a more
sustainable way. In order to develop efficient routes and methods for recycling of
textiles the knowledge field regarding the waste that is intended to be recycled
needs to be broadened.
PET recycling using discarded bottles and packages as the main resource is today
well established. A large share of rPET from these sources ends up as fibres. How-
ever, this share has decreased over the years because more and more rPET is used
for production of bottles and packaging (Welle 2011). The largest application area
of vPET is textile fibres and the generation of textile waste is assumed to increase
globally within the near future. This waste could potentially serve as a source for
production of rPET fibres through thermo-mechanical recycling. The question is
why thermo-mechanical fibre-to-fibre recycling is not yet applied, while bottle-to-
fibre recycling is a well-established method. This Master thesis focuses on if and
how dyeing may affect thermo-mechanical recycling of PET textiles.
The exhaust dyeing process is widely used to dye PET textiles in form of both
yarns and fabrics. Aside from obvious sustainability problems related to dyeing of
textiles there are risks of damaging or partly degrading the fibres during dyeing. In
extent, this could affect both the quality of the textile product as well as the possi-
bility to recycle the textile when discarded as waste. Degradation of PET has been
widely studied, however degradation studies considering temperatures and time
relevant for dyeing are limited.
During exhaust dyeing the PET polymers are exposed to aqueous steam at tem-
peratures above Tg, usually about 130°C, for a considerable time. Significant hy-
drolysis occurs in PET when it is exposed to aqueous environments at temperatures
above Tg (McIntyre 1985 see Allen, Edge & Mohammadian 1991), so it seems that
during exhaust dyeing there is a risk of hydrolysing the PET textiles. It has been
suggested that treatment at temperatures above Tg after the primary crystallisation
affects degree of crystallinity (Gupta & Kumar 1981a) and mechanical properties
of PET fibres (Gupta & Kumar 1981c). Auxiliary chemicals are important for suc-
cessful outcomes in PET dyeing. For pH-regulating of the bath compounds con-
taining acetic acid is used, and as mentioned previously acetic acid is one of the
most harmful and problematic contaminants causing problems in thermo-
mechanical recycling of PET (Al-Sabagh et al. 2015; Awaja & Pavel 2005).
Recelj, Gorenšek, and Žigon (2002) studied quality and quantity of oligomers ex-
tracted from PET textiles due to treatment at elevated temperatures. It was found
that the amount of PET oligomers consisting of 6-10 repeating units and more than
10 repeating units increased after treatment of the textiles. Based on this it was
concluded that during treatment at elevated temperatures hydrolysis of PET textiles
occur.

9
1.3. SCOPE AND RESEARCH QUESTIONS The aim of this Master thesis is to study possible side effects on the PET polymer
due to exhaust dyeing from aqueous phase under conventional acidic conditions. In
extent the consequences of these side effects will be related to the possibility for
PET textiles to be thermo-mechanically recycled.
The work takes off in the following hypothesis: The polymer structure of PET is
affected by the exhaust dyeing process to such an extent that re-melt spinning is
compromised. The polymer is exposed to water and chemicals for a considerable
time and that environment can possibly cause hydrolysis and chemical reactions,
and thereby the polymer could be degraded. In extent, this is also believed to affect
the possibility to mechanically recycle polyester textiles through re-extrusion.
Based on the hypothesis the overall focus of this thesis project is to investigate
what kind of chemical and/or physical changes that occur in PET due to exhaust
dyeing and if any dyeing parameters can be identified as critical. The parameters to
be addressed in this project are:
I. Dyeing temperature
II. Dyeing time (at dyeing temp.)
III. Bath composition (auxiliary chemicals)
IV. No. of dyeing cycles (related to both time and auxiliary chemicals)
V. Filament titer
To fulfil the aim of this Master thesis the following research questions are to be
answered:
- Is the polymer structure of PET affected by exhaust dyeing? If so, how is
the polymer structure affected? Can any dyeing parameters be identified
as critical?
- Are the tensile properties of PET affected by exhaust dyeing? If so, how
are the properties affected and which dyeing parameters are critical?
- Are the surface characteristics of PET affected by exhaust dyeing? If so,
how are the properties affected and which dyeing parameters are critical?
- Are any changes induced by the exhaust dyeing process related to fila-
ment titer?
- Can changes induced by exhaust dyeing negatively affect the possibility
to recycle PET textiles through a thermo-mechanical process?
1.4. LIMITATIONS This Master thesis is limited to study possible side effects of exhaust dyeing with
disperse dyes and common auxiliary chemicals on PET. Other dyeing processes
and dye types are excluded from this study. Dyeing is limited to dyeing of fabrics,
and not yarns or fibres. Textiles consisting of 100% PET are investigated in this
Master thesis, textiles made from material blends are excluded. There are different
types of polyesters used for textiles and among them PET is the by far the most
extensively used and therefore this thesis work will focus on PET only. Other pro-
cesses as well as the usage phase can possibly interfere in thermo-mechanical recy-
cling of textiles but that will not be investigated in the frame of this Master thesis.

10
2. LITERATURE REVIEW The literature review covers different degradation behaviours and mechanisms of
PET, which could affect the possibility for recycling. Literature regarding side
effects induced through processing of PET and PET textiles is presented. Also,
literature regarding mechanical recycling of PET is covered.
2.1. DEGRADATION BEHAVIOUR OF PET Degradation will affect several characteristics of a polymeric material. Chemical
composition, chain conformation, MW, MW distribution, and crystallinity are
characteristics affected by degradation (Venkatachalam et al. 2012). For example
McMahon, Birdsall, Johnson and Camilli (1959) observed changes in crystallinity
of PET due to hydrolysis and reduced tensile strength in PET fibres due to degra-
dation. Allen, Edge and Mohammadian (1991) also observed changes in crystal-
linity due to hydrolysis of PET. Changes in chain conformation and chemical com-
position on the surface of rPET pellets due to degradation induced by UV radiation
have been observed (Al-Azzawi 2015).
Awareness and knowledge regarding degradation mechanisms are of great im-
portance when considering recycling of textile materials. Throughout both pro-
cessing and usage the materials are exposed to different conditions which can lead
to degradation. Different types of degradation occur in PET, the main types being
thermal degradation, oxidative degradation, and hydrolytic degradation. Degrada-
tion can also be induced by photo radiation, enzymatically catalysed reactions,
chemical reactions, and mechanical stresses (Venkatachalam et al. 2012).
2.1.1. HYDROLYTIC DEGRADATION
Hydrolysis is defined as “a double decomposition reaction with water as one of the
reactants” (Britannica Academic 2016). Degradation occurs as the polymer is hy-
drolysed, in extent when the polymer reacts with water molecules. In the case of
PET reaction with water molecules result in chain scission of the polymer chain at
the ester linkage which cleaves the polymer. This process is schematically shown
in Figure 6. A reaction with one water molecule will break one ester linkage in the
polymer (Venkatachalam et al. 2012; Park & Kim 2014).
FIGURE 6 HYDROLYSIS AND RESULTING MOLECULES WITH HYDROXYL AND CARBOXYL END
GROUPS, BASED ON VENKATACHALAM ET AL. (2012) AND PARK AND KIM (2014)

11
Carboxyl end-group concentration has proven to be related to the rate of hydrolysis
and the hydrolysis is described as an autocatalytic process driven by the end-group
concentration (e.g. Zimmerman & 1980; Ravens & Ward 1961; Sammon, Yarwood
& Everall 2000). Zimmerman and Kim (1980) showed that the hydrolytic degrada-
tion of PET is an autocatalytic reaction in which the rate of hydrolysis is dependent
on the carboxyl end-group concentration. Increasing carboxyl end-group concen-
tration leads to increased rate of hydrolysis. Also, there is a relationship between
the initial carboxyl end-group content and the rate of formation of carboxyl end
groups. A higher initial content will result in faster hydrolysis of the polymer
(ibid). Sammon, Yarwood and Everall (2000) concluded that the hydrolysis of
amorphous PET in pure water is an autocatalytic process. Through Fourier-
Transform Infrared spectroscopy (FTIR) of hydrolysed thin PET films it was
shown that the number of hydrophilic end-groups increases as hydrolysis progress-
es, which provides conditions for autocatalysis. The analysis showed that hydroly-
sis of PET result in hydroxyl end-groups and carboxyl end-groups (as shown in
Figure 3).
Hosseini et al. (2007) studied hydrolytic degradation of fibre-grade PET with the
purpose of showing how this process can be a problem during washing of PET
textiles. By exposing PET chips to hydrolytic conditions the authors showed that
the intrinsic viscosity (IV) and MW decreases as the retention time increases. The
carboxyl end-group concentration increased with increased retention time.
According to Venkatachalam et al. (2012) hydrolytic degradation of PET is 10 000
times faster than thermal degradation in temperatures between 100°C and 120°C.
McMahon et al. (1959) showed that in PET yarns hydrolysis is much more domi-
nant than thermal degradation as well as thermo-oxidative degradation, in tempera-
tures between 70°C and 90°C. By exposing amorphous PET sheet materials to dif-
ferent temperatures and humidity conditions Allen, Edge and Mohammadian
(1991) concluded that hydrolysis is the most dominant degradation process in PET
in temperatures between 70°C and 90°C. It was shown that hydrolysis leads to
changes in degree of crystallinity and these changes depend on both temperature
and humidity percentage in the surrounding atmosphere (ibid.).
It has been shown in several studies that PET hydrolysis occur when exposed to
aquatic or humidity conditions at temperatures above Tg. Several studies on PET
hydrolysis in temperatures between 50°C and 100°C have been published, e.g.
Sammon, Yarwood and Everall (2000), Pirzadeh, Zadhoush and Haghighat (2007),
and Burgoyne and Merii (2007) among others. Studies concerning PET hydrolysis
at temperatures in the interval used in high temperature dyeing (130°C-140°C)
have not been found. Also, it is common that hydrolysis and degradation over a
long period of time is investigated, e.g. from five up to 28 days (Pirzadeh,
Zadhoush & Haghighat 2007) and up to 500 days (Allen, Edge & Mohammadian
1991). These periods of time are much longer than the exposure times in the dyeing
processes of PET.
Hydrolysis of PET textiles
Burgoyne and Merii (2007) presented a comprehensive study on hydrolysis of two
PET yarns with different carboxyl end-group concentrations. Tensile strength and

12
elongation at break of PET yarns was affected by hydrolysis in 50, 70, and 85°C in
aqueous environment (pH 7). Loss in breaking strength was found for all tempera-
tures in the two PET yarns, and the largest loss was observed in samples hydro-
lysed at 85°C. Initial carboxyl end-group concentration plays a vital role in the
extent of hydrolysis. After 130 days of exposure to aqueous conditions in 85°C
breaking strength had decreased from 85.5 N to 58.4 N (31.75%) for the lower
carboxyl end-group concentration and from 82.3 N to 40.2 N (51.15%) for the
higher carboxyl end-group concentration. Increases in elongation at break were
also observed. (ibid) Hydrolysis in acidic conditions (pH 4), aqueous conditions
(pH7), and alkali conditions (pH 11) at 70°C also resulted in decreased breaking
strength and increased elongation at break. The exposure times were between 190
and 197 days. No significant differences between the conditions were found. Also
in these conditions the end-group concentration was found to affect the outcome,
leading to higher extent of hydrolysis for the yarn with higher initial carboxyl end-
group concentration (ibid.).
Pirzadeh, Zadhoush and Haghighat (2007) investigated the effects of temperature
and humidity conditions on hydrolysis of fibre-grade PET granules and PET yarns.
Exposure to water in 60, 70, 80, and 87°C for 28 days showed that granules and
yarns were hydrolysed to a higher extent when exposed above Tg (87°C). It was
suggested that temperature plays a more vital role than moisture content in hydrol-
ysis of fibre-grade PET granules and PET yarns. It has been suggested that hydrol-
ysis of PET occur in the amorphous fractions. By investigating hydrolysis in PET
yarns with different orientations and different degree of crystallinity Pirzadeh,
Zadhoush and Haghighat (2007) concluded that the degree of crystallinity strongly
influences hydrolysis. A higher degree of crystallinity acts as prevention to hydrol-
ysis.
Alkaline hydrolysis at temperatures below Tg is suggested to act on the surface of
the fibre causing changes in how PET yarns and PET fabric interact with water.
Through wicking tests it has been shown that water transportation of yarns and
fabrics is affected by hydrolysis, leading to improved water transportation (Sanders
& Zeronian 1982). Hydrolysed PET fabrics more easily transport water from the
fabric surface to the fabric interior than reference fabrics. Sanders and Zeronian
(1982) suggested that alkaline hydrolysis at 60°C results in increased porosity and
spacing between fibres and this affects the capillary forces behind the water trans-
portation. This is also suggested to increase the ability to hold water in the fabric.
According to Sanders and Zeronian (1982) it is difficult to detect hydrolysis based
on moisture regain determination. Weight increase due to moisture absorption was
shown to not differ particularly between untreated and hydrolysed samples.
According to Burkinshaw (1995 pp. 1-2) hydrolysis of PET “is of relatively little
significance even under high-temperature dyeing conditions (130°C) provided that
the pH is maintained within the range of 4.5 to 6.” Other than this no information
on hydrolysis during dyeing has been found. Dyeing and potential side-effects are
presented in 2.2 Side-effects of dyeing and processing.

13
Chemicrystallisation
It is suggested that hydrolysis occur in the amorphous phases of the polymer.
Chain cleavage result in shorter polymer chains and increased mobility of these
chains creates possibilities for the chains to rearrange from an entangled structure
to a more ordered one. This provides conditions for chemicrystallisation, which
means that the chains from the amorphous phase align and contribute to the crystal-
line phase (Allen, Edge & Mohammadian 1991).
2.1.2. CHEMICALLY INDUCED DEGRADATION
As explained in 1.1.2. Polymerisation of PET, molecules like water and ethylene
glycol can cause de-polymerisation of PET. Chemically induced degradation or de-
polymerisation reactions are used for chemical recycling of PET (Ragaert, Delva &
Van Geem 2017). Several different chemical compounds can be used for the pur-
pose of de-polymerisation.
Ethylene glycol, di-ethylene glycol, and propylene glycol can de-polymerize PET
through a process called glycolysis. It has been shown that the degree of de-
polymerisation by ethylene glycol is affected by the presence of catalysts (Baliga
& Wong 1989).
Methanol can be used for de-polymerisation of PET back to the monomers dime-
thyl terephthalate and ethylene glycol. The methanol breaks the ester linkages in
the PET chain during leading to de-polymerisation. De-polymerisation by the use
of methanol is called alcoholysis (Dutt & Soni 2013).
Shukla & Harad (2006) showed that PET can be depolymerised through aminolysis
using ethanolamine generating bis(2-hydroxy ethylene)terephthalamide (BHETA).
Ethanolamine causes de-polymerisation by attacking the ester linkages in the PET
chain.
2.1.3. THERMAL DEGRADATION
Thermal degradation is degradation induced by elevated temperatures in the ab-
sence of oxygen. The mechanism behind thermal degradation is chain scission of
the PET polymer (Jabarin & Lofgren 1984; Venkatachalam et al. 2012). The ther-
mal degradation of PET is illustrated in Figure 7. As can be seen in the figure,
chain scission due to thermal degradation results in vinyl ester end-groups with an
unsaturated carbon-carbon bond.

14
FIGURE 7 THERMAL DEGRADATION AND RESULTING MOLECULES WITH VINYL ESTER END
GROUP AND CARBOXYL END GROUP, BASED ON VENKATACHALAM ET AL. (2012) AND PARK
AND KIM (2014).
Thermo-oxidative degradation
Just as thermal degradation thermo-oxidative degradation is induced by elevated
temperature, but as indicated by name this type of degradation involves reactions
with oxygen (Venkatachalam et al. 2012).
Jabarin and Lofgren (1984) investigated short-term thermal and thermo-oxidative
degradation of PET in the temperature range 275°C to 350°C. Weight and inherent
viscosity are more affected by thermo-oxidative degradation than thermal degrada-
tion in the presence of nitrogen. This was shown to be the case in different melt
temperatures and for different exposure times. Also, it was shown that the drying
conditions and melting conditions in terms of atmosphere conditions plays a vital
role in thermal and thermo-oxidative degradation of PET. Drying before melting is
very important, since hydrolytic degradation occur quickly upon melting in pres-
ence of moisture. In addition to this, drying condition is of great importance to
avoid degradation in the PET melt. PET pellets dried in air exhibit greater weight
loss and decrease in inherent viscosity due to degradation in the melt, compared to
vacuum dried pellets (ibid.). This is very important when considering re-melt spin-
ning of PET textiles.
2.1.4. DEGRADATION INDUCED BY PHOTO RADIATION
Gok (2016) investigated the role of photo radiation and humidity on degradation of
PET. It was shown that chain scission is the main degradation mechanism affecting
the properties of the degraded PET. Also, changes in the degree of crystallinity
were observed after degradation and this was also proposed to affect the properties.
It was suggested that crystallinity increases due to the formation of shorter chains,
with an increased mobility so crystallisation is facilitated.
Al-Azzawi (2015) proposed that degradation of rPET induced by UV radiation is a
surface effect. It was suggested that UV radiation affects the structure of rPET,
leading to a more random structure due to degradation. This was shown to result in
decreased mechanical properties, changes in spectral data, and changes in thermal
behaviour.

15
2.1.5. ENZYMATICALLY INDUCED DEGRADATION
Enzymes and enzyme treatments have been investigated for the purpose of modify-
ing PET fibres and textiles. Lee and Song (2010) studied if and under what condi-
tions cutinase and lipase could be used to change the hydrophilicity of PET fabrics.
The role of the enzymes is catalyse hydrolysis of the ester linkages in PET chains
in the fabric surface and thereby cause an increase of hydrophilic carboxyl and
hydroxyl end-groups and in extent an increase in hydrophilicity.
The enzyme cutinase can be used for hydrolysing of PET. This was investigated
and compared to alkaline hydrolysis by Donelli, Freddi, Nierstrasz and Taddei
(2010). It was shown that both amorphous and crystalline PET films can be hydro-
lysed using cutinase but the degradation mechanism is different depending on the
fine structure of the films. Enzymatically induced hydrolysis was shown to result
in increased hydrophilicity.
2.2. PET OLIGOMERS PET oligomers of different shape and size exist in PET as residuals from the
polymerisation process. Also, oligomers in PET can be formed as a result of pro-
cessing (Cimecioglu, Zeronian, Alger & Collins 1986). Characteristics and content
of oligomers in bottle-grade PET flakes obtained from post-consumer bottles was
investigated by Dulio, Po, Borrelli, Guarini and Santini (1994). The recycled PET
flakes were exposed to heat treatment in vacuum and/or extrusion before character-
isation of oligomers. High performance liquid chromatography (HPLC), size ex-
clusion chromatography (SEC), and desorption chemical ionization/mass spectra
(DCI/MS) were used for the characterisation. It was shown that the concentration
of cyclic trimer (oligomer with three ethylene terephthalate units) in the heat treat-
ed and extruded samples were very similar to the concentration in the untreated
PET flakes. Larger oligomers, both cyclic and linear, were identified in the samples
after extrusion, and the content seemed to be affected by the extrusion temperature
as well as processing time. Dulio et al. (1994) suggested that the larger oligomers
are decomposition products formed during re-processing.
Cimecioglu et al. (1986) observed migration of oligomers to the PET fibre surface
upon exposure to methylene chloride vapour. Cyclic trimers as well as oligomers
of higher degree of polymerisation (DP) were observed on the fibre surface. It was
suggested that oligomers, mainly the cyclic trimers, crystallise during heat treat-
ment of PET fabrics at 200°C. Moisture regain of extracted oligomers and PET
fibres differ after heat treatment. The cyclic oligomers exhibited lower moisture
regain than the fibres and it is suggested that this is due to the crystalline nature of
the oligomers (ibid.).
Connections between oligomer content and alkaline hydrolysis in PET fibres have
been demonstrated by Collins and Zeronian (1992). Hydrolysis in aqueous sodium
hydroxide (NaOH) and methanolic NaOH causes formation of oligomeric species.
HPLC showed a larger content of oligomers in fabrics treated in methanolic NaOH,
indicating that process conditions will affect oligomer content. The MW distribu-
tion of the oligomers was higher in methanolic NaOH treated PET than in aqueous
NaOH treated PET. Oligomer was clearly present on the surface of hydrolysed
PET fibres, which was shown through scanning electron microscopy (SEM) (ibid.).

16
Hydrolysis in methanolic and aqueous NaOH causes weight loss of PET. Collins
and Zeronian (1992) also demonstrated weight loss as a result of extraction of oli-
gomers by two different solvents. Surface oligomers could be extracted by per-
chloromethane and residual perchloromethane and remaining oligomers could be
extracted by chloroform.
2.2.1. OLIGOMERS AND DYEING
The nature of the PET oligomers decides if they are problematic during dyeing or
not. Linear oligomers are partially soluble in water and thereby these oligomers do
not cause problems in dyeing. Cyclic oligomer, however, exhibit a very low solu-
bility in water as well very high crystallisation rates and thereby these oligomers
create problems in dyeing (Burkinshaw 1995; Recelj, Gorenšek & Žigon 2002).
The oligomers can affect the surface properties of PET fibres if the oligomers mi-
grate to the fibre surface. During dyeing the temperature is above Tg and this in-
duces flexibility to the polymer chains which facilitate migration of oligomers
from the interior of the fibre to the surface of the fibre (Recelj, Gorenšek & Žigon
2002). When considering dyeing of PET fibres, the cyclic oligomers are the most
problematic and should be kept below 0.5 weight percentage (Dulio et al. 1994).
Recelj, Gorenšek and Žigon (2002) showed that the quantity of oligomers present
after dyeing was affected by the processing conditions. It was shown that the quan-
tity of oligomers after dyeing in acidic conditions (pH 4.5-5) increases as the dye-
ing temperature increases. The quantity of oligomers on dyed PET fabrics can be
reduced by using alkaline pre-treatment before acidic dyeing or by dyeing in alka-
line conditions (ibid.).
There are different methods to reduce the quantity of cyclic oligomers in PET after
dyeing, as well as from the machines. One method is to dye in alkaline conditions
instead of acidic conditions. This is suggested to hydrolyse the oligomers (Recelj,
Gorenšek & Žigon 2002). Different types of surfactants have been shown to reduce
the amount of cyclic oligomers in dyed fibre surfaces (Vavilova, Prorokova & Ka-
linnikov 2003). Also, reduction clearing can be used to remove oligomers from
dyed PET fabrics (Burkinshaw 1995).
2.3. SIDE EFFECTS OF DYEING AND PROCESSING Gulrajani, Saxena and Sengupta (1979) studied if and how PET stress-strain char-
acteristics changes due to dyeing with disperse dyes. It was found that the elastic
modulus of PET filaments at initial strain, approximately below 8%, differed be-
tween dyed and un-dyed samples but the samples exhibited the same stress-strain
behaviour at higher stresses until breaking. The modulus was higher for the dyed
samples than for the untreated samples. The authors speculated that the difference
in elastic modulus could be an effect of mechanical hindrance provided by the dye
molecules or due to formation of hydrogen bonds between dye molecules and pol-
ymers. By investigating a second disperse dye the first speculation was stated to be
the most likely reason behind the change in elastic modulus (ibid.). In a second
study Gulrajani, Saxena and Sengupta (1980) further investigated possible mechan-
ical hindrance provided by disperse dye molecules. Also, possible structural
changes in the polymer due to dyeing were investigated by measuring critical dis-
solution time (CDT). It was expected that mechanical hindrance, structural chang-

17
es, or a combination of the two could affect the mechanical properties of dyed pol-
yester fabrics (ibid.). Recelj, Gorenšek and Žigon (2002) observed changes in
breaking stress and elongation at break due to dyeing. Breaking stress and elonga-
tion at break for the warp yarn was shown to increase after dyeing in acidic condi-
tions. However, elongation at break for the weft yarn decreased. This indicates that
changes depend on the yarn type. The authors do not state differences between
warp and weft yarns.
Smole and Zipper (2002) compared the effects of dyeing from different treatment
media on the supramolecular structure of PET. Supercritical CO2 dyeing, conven-
tional water dyeing, and hot air thermo-fixation dyeing was studied. The tempera-
ture used for all treatments was 130°C. Dyeing was carried out for 60 minutes. The
PET was dyed in form of yarn. According to Smole and Zipper (2002) all investi-
gated dyeing processes lead to increased crystalline regions of the samples. The
crystallite size of the crystals that contribute to the increase depends slightly on the
dyeing treatment media and treatment temperature. The crystallinity increase due
to supercritical CO2 dyeing was estimated to be around 20%. For the water dyeing
and hot air thermo-fixation dyeing the crystallinity increase was smaller. Density
increases were observed due to all the treatment. The largest increase was observed
due to supercritical CO2 dyeing (1.3881 g/cm3 to 1.4001 g/cm
3) and the smallest
increase was observed due to water dyeing (1.3881 g/cm3 to 1.3961 g/cm
3). It was
not shown whether the observed changes were statistically significant or not, but
the authors claim that the changes induced by the treatments do not have any ef-
fects on the mechanical properties of the PET fibres. The investigated treatments
resulted in a decrease in MW and DP. The water dyeing resulted in the smallest
changes. The average MW was decreased from 21750 (untreated) to 20050 and the
average DP decreased from 108 to 99 due to water dyeing. This was calculated
based on intrinsic viscosity measurements (ibid.).
The effects of heat setting on various properties of PET have been studied. Gupta
and Kumar (1981a) demonstrated how heat setting temperature and heat setting
time affect the degree of crystallinity. Heat setting temperatures between 100°C
and 220°C was investigated and heat setting time was between 1 and 60 minutes.
Heat setting was performed on multifilament PET yarns in silicone oil bath. Tem-
perature was suggested to affect the degree of crystallinity, the higher the heat set-
ting temperature the higher degree of crystallinity was observed. On the other
hand, degree of crystallinity showed a more complex time-dependence. Heat set-
ting of fibres in the time interval 1 to 20 minutes was shown to result in increased
degree of crystallinity. In the time interval 20 to 60 minutes, decreased degree of
crystallinity was observed. The authors explain that this may be an effect of im-
provement of the perfection of the crystalline structure in the PET fibres. This was
suggested to occur due to the heat treatment after the primary crystallisation and
due to diffusion of dislocations, vacancies and chain ends from the crystalline
phase into the amorphous phase. With increased treatment time the degree of crys-
tallinity can therefore be reduced. Gupta and Kumar (1981a) suggest that heat
treatment in a taut state can improve the orientation of the polymers in the crystal-
line phase. Taut state being a state when the PET yarns are exposed to heat treat-
ment stretched to a constant length.

18
Heat treatment above Tg after primary crystallisation have been shown to affect the
Young’s modulus of multifilament PET yarns. When samples were exposed to heat
treatment in taut state smaller differences in Young’s modulus was detected com-
pared to differences detected in samples treated in relaxed state (Gupta & Kumar
1981b). In this case, the PET yarns were either exposed to heat treatment in a re-
laxed state or in a taut state at a constant length (Gupta & Kumar 1981a). Based on
this, Gupta and Kumar (1981b) suggested that the Young’s modulus of a multi-
filament PET yarn is more affected by the orientation of the polymers rather than
the degree of crystallinity. Samples heat set in taut state was found to exhibit a
higher Young’s moduli, indicating correlation between the increased orientation
and higher moduli. Heat treatment above Tg in a taut and relaxed state was shown
to result in decreased orientation of the polymers present in the amorphous phase,
the decrease being larger when heat treated in a relaxed state (Gupta & Kumar
1981a). According to Gupta and Kumar (1981b) Young’s moduli seem to be more
dependent on treatment temperature than exposure time.
Gupta and Kumar (1981c) discussed the role of the interface between crystalline
and amorphous phases on the tensile properties of PET. Samples exposed to heat
treatment in taut condition exhibited higher Young’s moduli and higher yield point
than samples treated in relaxed condition. The reason behind this was proposed to
be differences in distribution of strain. Due to different interphases between crys-
talline and amorphous regions in the differently treated samples the strain distribu-
tion is expected to differ. If there is a sharp interphase, hence a sharp transition
between the phases, the distribution of strain is thought to be less uniform than if
there is a smooth transition between the phases (ibid.). The elongation at break was
observed to increase due to heat treatment in relaxed condition, and the increase
was supposedly dependent on the treatment temperature. The heat treatment in
relaxed state resulted in shrinkage of the filaments and decreased orientation (Gup-
ta & Kumar 1981a) and this was suggested as a reason behind the changes of elon-
gation at break. Tenacity showed similar dependence on treatment temperature as
elongation at break. Gupta and Kumar (1981c) claim that exposure time of heat
treatment does not significantly affect elongation at break or tenacity, it is rather
the degree of orientation that these properties depend on.
2.4. THERMO-MECHANICAL RECYCLING OF PET It is important to point out that no information on thermo-mechanical fibre-to-fibre
recycling has been found. However, several authors mention that one of the great
advantages of PET products in general is that they can be recycled through re-
melting due to its thermoplastic nature (e.g. Venkatachalam et al. 2012; Park &
Kim 2014).
It has been shown that thermo-mechanical recycling of PET result in changes of
different properties. Thermal and mechanical properties are affected by recycling
(Torres, Robin & Boutevin 2000; López et al. 2014). Melt viscosity and average
MW has also been shown to be affected by mechanical recycling (Assadi, Colin &
Verdu 2004; López et al. 2014).
Injection moulding causes thermo-mechanical degradation in rPET from bottle
scraps. Compared to injection moulded vPET (bottle-grade), injection moulding of

19
rPET results in a more brittle material with lower average MW and intrinsic viscos-
ity (Torres, Robin & Boutevin 2000). Decreased MW and intrinsic viscosity due to
injection moulding of rPET has also been observed by López et al. (2014). Accord-
ing to Torres, Robin and Boutevin (2000) the decrease in intrinsic viscosity makes
rPET from bottles suitable for fibre production.
According to Assadi, Colin and Verdu (2004) extrusion of rPET flakes obtained
from bottles lead to both reversible and irreversible changes of the polymer. The
reversible changes are said to be caused by hydrolysis or transesterification reac-
tions. The irreversible changes are said to be dependent on the presence of oxygen
during extrusion. In absence of oxygen random chain scission causes irreversible
changes during re-extrusion. In presence of oxygen the irreversible changes are
claimed to be caused by radical chain oxidation of the methylene (CH2) groups in
the PET chain. Assadi, Colin and Verdu (2004) showed that the oxygen pressure
and the exposure time are critical factors for how the MW changes during re-
processing of rPET.
Based on the three-fraction model Badia et al. (2012) studied how multiple injec-
tion moulding cycles affect the fine structure and in extent the mechanical proper-
ties of bottle-grade PET and rPET (recycled from bottle-grade PET). DSC results
showed that the percentage of the mobile amorphous fraction decreases while the
percentage of the rigid amorphous fraction increases as a result of increased num-
ber of injection moulding cycles. The authors suggest that this is due to chain scis-
sion of the polymers in the mobile amorphous fraction that occur due to degrada-
tion during re-processing. Chain scission result in shorter chains and these chains
can more easily re-arrange and organise and thereby contribute to the rigid amor-
phous phase (ibid.). This behaviour called chemicrystallisation has also been sug-
gested to occur in PET when exposed to hydrolysis by others (Hosseini et al. 2007;
Sammon, Yarwood & Everall 2000). López et al. (2014) observed through DSC
that rPET (bottle-grade) reprocessed by injection moulding crystallise faster than
vPET. The vPET samples exhibited slow crystallisation rate which emerged as
very wide crystallisation peaks upon cooling. The heat of crystallisation [J/g] was
almost twice as high in re-processed samples compared to virgin samples. López et
al. (2014) suggested that this is due to the chain scission that occurs during re-
processing.
Dulio et al. (1994) suggested that recycling of bottle-grade PET through extrusion
result in formation of PET oligomers. The extrusion temperature seems to be vital
for the size of the oligomers formed. In extent, this can affect further processing of
rPET products, e.g. dyeing.
Awaja and Pavel (2005) presented an overview on requirements that post-
consumer PET in form of flakes must meet for successful re-processing to be pos-
sible. Intrinsic viscosity should be higher than 0.7 g/dl, melting temperature should
be higher than 240°C, and the moisture content should be kept below 0.02wt%.
Also, requirements regarding the concentration of contaminants like dye and PVC
are presented.
20
According to Welle (2011) thermo-mechanical recycling of PET bottles is well-
established. rPET from bottles are used for different products, e.g. bottles and fi-
bres. Over the years methods involved in the thermo-mechanical recycling of PET
have been developed and studied with the aim to improve different properties of
the rPET-products. Different modifiers that can be added during re-processing have
been studied, e.g. functionalised polypropylene (Oromiehie & Mamizadeh 2004)
and chain-extender (Makkam & Harnnarongchai 2014). Mixing of rPET and vPET
and the ratios between the two have also been researched (Lee, Lim, Hahm & Kim
2012; Oromiehie & Mamizadeh 2004).
Oromiehie & Mamizadeh (2004) compared the final properties of rPET,
rPET/vPET-blends, and rPET/vPET-blends containing functionalised polypropyl-
ene. It was shown that the MW and the mechanical properties depend on the
weight percentage of rPET used in blends. Also, crystallinity has been suggested to
depend on the weight percentage of rPET used in blends. Crystallinity increases
has been observed as the percentage of rPET increases in rPET/vPET-blends. Since
MW was lower in rPET it was argued that crystallisation occur more easily than in
vPET.
To obtain good enough fibres rPET can be mixed with vPET. The fractions of
vPET and rPET (from discarded bottles) in fibres affect thermal and mechanical
properties. The crystallisation behaviour and more specifically the crystallisation
rate has been shown to increase in fibres with higher fraction of rPET (Lee et al.
2012).
Contaminants like acids and dye stuff in post-consumer PET are mentioned to
cause difficulties in thermo-mechanical recycling (e.g. Awaja & Pavel 2005; Ven-
katachalam et al. 2012). It has been shown that disperse dyes can be extracted from
dyed PET fabrics by using the solvent 1,3 Dimethyl-2-Imidazolidinone (DMI)
(Andersson Drugge & Svensson 2016). It has also been claimed that the solvent
dimethyl sulfoxide (DMSO) can be used for removal of dye from PET textiles
(Wu, Wu, Wang & Gan 2014). It has not been investigated if extraction of dye by
DMI or DMSO results in changes of the polymer. Gupta, Bandi, Mehta & Schiraldi
(2007) demonstrated that material from coloured PET bottles could be bleached
using hydrogen peroxide before thermo-mechanical recycling. It was shown that
this method results in decreased intrinsic viscosity and the intrinsic viscosity de-
pends on how bleached the material is.
2.5. POLYMER CHARACTERISATION In this part of the literature review different methods for polymer characterisation
are described in the context of characterisation of PET. The review of FTIR is fo-
cused on characterisation of changes related to degradation.
2.5.1. MOLECULAR WEIGHT DETERMINATION
Several different methods are used for MW determination of polymers. The differ-
ent methods result in different average molecular weights. Some methods will also
be useful for investigating polydispersity (Albertsson, Edlund & Odelius 2009).

21
SEC is one of the most commonly used methods for determining MW and MW
distribution of polymers (Albertsson, Edlund & Odelius 2009). It has been demon-
strated that gel permeation chromatography (GPC) which is a form of SEC can be
used for PET. However, this method can be somewhat problematic since PET is
difficult to dissolve in commonly used solvents in room temperature (Farah et al.
2015).
One important method used for determination of MW is through measuring intrin-
sic viscosity. This can be measured in solution or determined by measuring melt-
flow index (MFI) (Farah et al. 2015). Al-Azzawi (2015) used MFI measurements
to determine the MW of rPET before and after photo degradation.
Du, Yang and Xie (2014) studied if FTIR with an attenuated total reflectance ac-
cessory (ATR) would be a proper method for investigation of hydrolytic degrada-
tion in PET by correlating FTIR-ATR results with MW changes measured by vis-
cometry. The ratio between carboxylic acids and esters was investigated and relat-
ed to the extent of hydrolysis.
2.5.2. FOURIER-TRANSFORM INFRARED SPECTROSCOPY
FTIR is a vibrational spectroscopic technique that uses infra-red radiation. When a
sample is exposed to radiation the molecules vibrate depending on how they absorb
the radiation. The type of vibration (e.g. wagging, rocking and bending) depends
on e.g. configuration, conformation and orientation in the sample (Siesler 2012).
FTIR have been used for investigations of hydrolysis (Sammon, Yarwood & Ever-
all 2000; Du, Yang & Xie 2014), degradation during thermo-mechanical recycling
(Badia et al. 2012), degradation induced by UV radiation (Al-Azzawi 2015), and
surface modification of PET (Donelli et al. 2010).
The absorbance of amorphous PET and semi-crystalline PET differs, therefore
some specific peaks can be identified as crystalline marker bands and other peaks
can be identified as amorphous marker bands. Several important bands in the infra-
red spectrum of PET that depends upon the crystallinity of the polymer have been
established (Miayke 1959). When the crystallinity of PET increases the CH2 rock-
ing of the ethylene glycol changes from a gauche conformation (amorphous) to
trans conformation (crystalline). This has been observed to cause an intensity in-
crease in the infrared spectrum at wavenumber 848 cm-1
and an intensity decrease
at 895 cm-1
. Miyake (1959) claim that changes in crystallinity should be studied by
investigating intensity of wavenumber that form trans-gauche couples, like 848
cm-1
-895 cm-1
. Other trans-gauche couples that can be related to other types of
vibration that have been suggested are 1456 cm-1
and 1453 cm-1
; 1337 cm-1
and
1370 cm-1
; and 973 cm-1
and 1042 cm-1
(ibid.). Donelli et al. (2010) suggested
1341, 972, and 849 cm-1
to be crystalline marker bands and 1371, 1044, and 898
cm-1
to be amorphous marker bands based on FTIR characterisation of amorphous
and semi-crystalline PET films.
Sammon, Yarwood and Everall (2000) observed spectral changes in PET films due
to hydrolysis. Two peaks in between 2800 and 3000 cm-1
was found to emerge due
to hydrolysis. These peaks were presented to be associated with chain scission
leading to shorter chains and formation of carboxyl and hydroxyl end-groups.

22
Changes in the absorbance at wavenumber associated with the carbonyl bonds have
been observed as a result of hydrolysis (Sammon, Yarwood & Everall 2000) and
hygrothermal degradation (Chen, Hay & Jenkins 2012). Sammon, Yarwood and
Everall (2000) showed that the intensity of the absorbance peak related to the car-
bonyl bonds (C=O) decreases as a result of hydrolysis of PET film. Donelli et al.
(2010) showed that the intensity of the peak related to the carbonyl bonds de-
creased after hydrolysis induced by enzymes. The absorbance associated with the
carbonyl bonds have also been shown to be affected by photo degradation (Al-
Azzawi 2015; Gok 2016). Gok (2016) concluded that chain scission induced by
photo radiation and hydrolytic conditions result in intensity decrease of the peak at
the (C=O) associated wavenumber (1711 cm-1
).
Chen, Hay & Jenkins (2012) studied how infrared spectral data changes due to
crystallisation of PET. Due to increased crystallinity, intensity decrease at 1572
cm-1
and 1578 cm-1
and intensity increase at 1502 cm-1
and 1508 cm-1
were report-
ed. Absorbance changes at several other wavenumbers have also been reported.
In Table 1 wavenumbers of importance for characterisation of PET that have been
found in the literature are summarized. It is shown in the table what can be investi-
gated through absorbance at different wavenumber.
TABLE 1 WAVENUMBERS WITH CORRESPONDING ASSIGNMENTS SUMMARISED FROM THE
LITERATURE.
Wavenumber
(cm-1
)
Assignment Comment References
793 - Normalising reference
peak
Smole and Zipper (2002)
845 - 849 CH2 rocking Trans ethylene glycol
(crystalline)
Miyake (1959)
Badia et al. (2012)
Donelli et al. (2010)
Awaja and Pavel (2005)
898 – 899 CH2 rocking Gauche ethylene glycol
(amorphous)
Miyake (1959)
Badia et al. (2012)
Donelli et al. (2010)
Smole and Zipper (2002)
973
975
C-O stretching Trans
(crystalline)
Awaja and Pavel (2005)
Smole and Zipper (2002)
Gok (2016)
Miyake (1959)
1040 – 1044 C-O stretching Gauche
(amorphous)
Donelli et al. (2010)
Awaja and Pavel (2005)
1099 C-O stretching Gauche
(amorphous)
Miyake (1959)
1340
1341
1343
CH2 wagging Trans ethylene glycol
(crystalline)
Donelli et al. (2010)
Awaja and Pavel (2005)
Gok (2016)
1370
1371
1376
CH2 wagging Gauche ethylene glycol
(amorphous)
Miyake (1959)
Smole and Zipper (2002)
Al-Azzawi (2015)
Donelli et al. (2010)
1410 - Normalising reference
peak
Awaja and Pavel (2005)
Donelli et al. (2010)
Smole and Zipper (2002)
1453 CH2 bending Gauche ethylene glycol
(amorphous)
Miyake (1959)
1456 CH2 bending Trans ethylene glycol
(crystalline)
Miyake (1959)

23
1471 C-H bending Crystalline marker band Badia et al. (2012)
Donelli et al. (2010)
1610 – 1685 C=O Arises from carboxylic
acid formation
Du, Yang and Xie (2014)
1711 – 1719 Carbonyl bonds
C=O
Crystalline phase: 1718
Amorphous phase: 1725
Al-Azzawi (2015)
Donelli et al. (2010)
Gok (2016)
3550 O-H Polymeric bonded OH-
end-group
Badia et al. (2012)
2.5.3. CHARACTERISATION OF THE FINE STRUCTURE OF PET
The crystallinity in PET can be investigated by using FTIR spectroscopy. This was
done by Sammon, Yarwood and Everall (2000) whose result indicated changes in
the degree of crystallisation in PET film due to hydrolytic degradation. The eth-
ylene glycol group in the PET backbone chain have different conformations in the
crystalline and in the amorphous phases, and this result in differences in a FTIR
spectrum. In the amorphous phase the ethylene glycol group can have trans or
gauche conformation. In the crystalline phase the ethylene group can only have
trans conformation (Miyake 1959; Burkinshaw 2015). As stated previously this
affects the absorbance of infra-red radiation.
Badia et al. (2012) investigated how re-processing by means of injection moulding
affect the crystalline, rigid amorphous, and mobile amorphous fraction of bottle-
grade PET. DSC was used to determine the percentage of the different fractions. It
was suggested that degradation of PET through chain cleavage occur in the mobile
amorphous fraction during re-processing. Due to the degradation in this fraction
the residual chains can re-organise into rigid amorphous fraction. This was sug-
gested to be the reason behind changes in viscoelastic and mechanical properties
that were observed after re-processing. It was observed that the mobile amorphous
fraction decreases as the number of re-processing cycles increase and as an effect
the elastic behaviour of PET was negatively affected. The Young’s modulus of the
virgin PET was after five re-processing cycles decreased from approximately 1400
MPa to 1300 MPa. The strain at break decreased from approximately 350% to
20%. The stress at break decreased from approximately 44 MPa to 18 MPa (ibid.).
It is important to highlight that the processing temperature differ a lot from that of
dyeing and the polymer is exposed to degradation in the molten state.
Based on DSC results the degree of crystallinity can be calculated using Equation 1
(Badia, Vilaplana, Karlsson & Ribes-Greus 2009; Albertsson, Edlund & Odelius
2012 pp. 226)):
Equation 1
From the DSC results melting enthalpy or heat of melting can be obtained.
The assumed value, , for perfect crystalline PET is 140 J/g (Badia et al. 2009).

24
3. MATERIALS AND METHODS In the upcoming sections materials and methods used for the experimental study
are described in detail.
3.1. MATERIALS Polyester fabrics, dye stuff and auxiliary chemicals were provided by F.O.V. Fab-
rics AB, Borås Sweden. In Table 2 important properties of the two PET weaves
used in the study is presented. Two different weaves have been used for this study,
one conventional PET weave (further called PETC) and one microfibre PET weave
(further called PETM).
TABLE 2 PROPERTIES OF THE POLYESTER FABRICS USED IN THE STUDY.
Property PETC PETM
Area weigh (g/m2) 146,7 117,3
Yarn type warp Multifilament Multifilament
Yarn type weft Two-thread multifilament Multifilament
Titer warp yarn 167 dtex 110 dtex
No. of filaments in warp
yarn
48 144
Filament titer warp yarn 3.48 dtex 0.69 dtex
Titer weft yarn 334 dtex 76 dtex
No. of filaments in weft
yarn
96 144
Filament titer weft yarn 3.48 dtex 0.53 dtex
Fixation Heat set, 190°C Heat set, 180°C
Optical brightener No No
The dye used in the study was Teratop Blue HL-B 150%, which is an anthraqui-
none dye. Neutracid BO 45 was used for pH regulation of the dye baths. The level-
ling agent used was Egasol UP and the dispersing agent used was Lyocol RDN.
3.1.1. SAMPLE PREPARATION
Fabric duplicates with a size of 20 cm × 15 cm (warp × weft) were cut out from the
polyester weaves using a heat cutter hot knife. This cutting method was chosen in
order to obtain stable edges to minimise the risk of unravelling during dyeing. Four
reference duplicates from each weave was randomly picked. The fabric duplicates
were numbered from 1 to 140 (for PETC and PETM respectively) and by randomi-
sation the fabric duplicates were assigned to a certain sample. The aim of this was
to minimise systematic errors. Randomisation was performed in Excel.

25
3.2. EXPERIMENTAL The following five parameters were decided to be investigated in the experimental
part of this Master thesis:
I. Dyeing temperature
II. Dyeing time (at dyeing temp.)
III. Bath composition (auxiliary chemicals)
IV. No. of dyeing cycles (related to both time and auxiliary chemicals)
V. Filament titer
Table 3 summarizes the values that were decided to be used for each of the five
parameters.
TABLE 3 VARIED PARAMETERS AND CHOSEN VALUES.
Parameter Values
Dyeing tempera-
ture
105°C, 120°C or 135°C
Dyeing time 30, 60 or 180 minutes
Bath composition 1) Dye stuff, pH regulator
2) Dye stuff, pH regulator, levelling agent
3) Dye stuff, pH regulator, levelling agent, dispersing agent
No. of dyeing
cycles
1, 3 or 5
- For 105°C and 135°C
- 30 and 60 min
- Bath composition 3
Filament titer 3.48 dtex or 0.69 dtex
Based on the parameters and values 35 different combinations (further called sam-
ples) were decided to be used for the study. Table 4 summarises how the values
were coded to give the sample names. The sample names with corresponding pa-
rameter values are presented in Table 5. The reference samples are further called
PETC Ref and PETM Ref. All samples were prepared using PETC and PETM, which
is presented initially in the code (e.g. PETCT1p30). Dye stuff was included in all
dye baths and is therefore not included in the coding. The exposure time above Tg
depends on dyeing time and dyeing temperature. To calculate the exposure time
above Tg the heating time, dyeing time and cooling time has been added. This is
schematically shown in Figure 8. The higher the dyeing temperature, the longer the
heating and cooling time will be.
TABLE 4 VALUES AND CORRESPONDING CODING FOR SAMPLES.
Value Coding
Conventional PET PETC
Microfibre PET PETM
105°C T1
120°C T2
135°C T3
Dye + pH p
Dye + pH + levelling agent l
Dye + pH + levelling agent + dispersing agent d

26
TABLE 5 SAMPLE NAMES AND CORRESPONDING PARAMETER VALUES.
Sample
name
Dyeing
temp.
Bath
composition
Dyeing
time
No. of
dyeing cycles
Exposure time
above Tg
T1p30 105°C p 30 1 55
T1l30 105°C l 30 1 55
T1d30 105°C d 30 1 55
T1d30×3 105°C p 30 3 165
T1d30×5 105°C l 30 5 275
T1p60 105°C p 60 1 85
T1l60 105°C l 60 1 85
T1d60 105°C d 60 1 85
T1d60×3 105°C d 60 3 255
T1d60×5 105°C d 60 5 425
T1p180 105°C p 180 1 205
T1l180 105°C l 180 1 205
T1d180 105°C d 180 1 205
T2p30 120°C p 30 1 67.5
T2l30 120°C l 30 1 67.5
T2d30 120°C d 30 1 67.5
T2p60 120°C p 60 1 97.5
T2l60 120°C l 60 1 97.5
T2d60 120°C d 60 1 97.5
T2p180 120°C p 180 1 217.5
T2l180 120°C l 180 1 217.5
T2d180 120°C d 180 1 217.5
T3p30 135°C p 30 1 80
T3l30 135°C l 30 1 80
T3d30 135°C d 30 1 80
T3d30×3 135°C p 30 3 240
T3d30×5 135°C l 30 5 400
T3p60 135°C p 60 1 110
T3l60 135°C l 60 1 110
T3d60 135°C d 60 1 110
T3d60×3 135°C p 60 3 330
T3d60×5 135°C l 60 5 550
T3p180 135°C p 180 1 230
T3l180 135°C l 180 1 230
T3d180 135°C d 180 1 230

27
FIGURE 8 GENERAL EXHAUST DYEING PROFILE SHOWING HOW EXPOSURE TIME ABOVE TG
HAVE BEEN CALCULATED .
3.2.1. EXHAUST DYEING
Dyeing was carried out in the laboratory machine Pyrotec 2000 from Roaches. The
Pyrotec 2000 uses infrared heat to reach the required treatment temperature. Two
fabric duplicates were dyed in each beaker. A fabric/liquor ratio of 1:10 was used.
After dyeing the fabrics duplicates were rinsed in hot water, then in cold water, and
last in running cold water. Soft tap water was used for dyeing and rinsing. For the
fabric duplicates dyed three and five times no rinsing between the dyeing cycles
was performed. The dye bath was exchanged before every dyeing cycle.
The dyeing recipes that were used for PETC and PETM are shown in Table 6 and
Table 7, respectively. Weight percentage of chemicals and dye stuff is calculated
as weight percentage of the fabric weight. The dyeing recipes are based on infor-
mation provided by F.O.V Fabrics AB, Borås Sweden. The dye baths was prepared
in bigger volumes (1.5 litres at a time) to avoid systematic errors. An analytical
scale with a resolution of 0.1 mg was used to weigh the chemicals. The dye was
first dispersed in hot tap water after which the auxiliary chemicals were added.
After this the required amount of tap water was added to reach the total bath vol-
ume.
TABLE 6 DYEING RECIPE FOR PETC
Dye/Chemical Function Amount Total
amount
Teratop Blue HL-B 150% Dye 0.5wt.% 0.045 g
Neutracid BO 45 pH regulator 1.5 g/l 0.135 g
Egasol UP Levelling agent 1.8wt.% 0.162 g
Lyocol RDN Dispersing agent 1 g/l 0.09 g
Fabric/Liquor ratio:
1:10 Fabric weight:
9 g
(two duplicates)
Total
volume:
90 ml

28
TABLE 7 DYEING RECIPE FOR PETM
Dye/Chemical Function Amount Total
amount
Teratop Blue HL-B 150% Dye 0.5wt.% 0.035 g
Neutracid BO 45 pH regulator 1.5 g/l 0.105 g
Egasol UP Levelling agent 1.8wt.% 0.11 g
Lyocol RDN Dispersing agent 1 g/l 0.07 g
Fabric/Liquor ratio:
1:10 Fabric weight:
7 g
(two duplicates)
Total
volume:
70 ml
3.2.2. CHARACTERISATION
Area weight, tensile test, and water absorption demand test were chosen for charac-
terisation in order to indicate possible changes in properties due to exhaust dyeing.
FTIR and DSC were chosen in order to prove structural changes due to exhaust
dyeing.
Weighing
All fabric duplicates were weighted before and after dyeing on a calibrated scale
from Kern & Sohn GmbH of type ABJ 220-4M, with a resolution of 0.1 mg. Prior
to weighing the samples were conditioned for at least 24 hours in standardised
atmosphere for conditioning of textiles, the temperature in the standardised atmos-
phere is 20°C ± 2°C and the relative humidity is 65% ± 2%. The scale used was not
located in standardised atmosphere. An average weight before and after dyeing for
every sample was calculated and based on the average values the weight difference
in percentage was calculated.
Vacuum drying and weighing
Vacuum drying was carried out in a vacuum cabinet Vacucell 22 from MMM
Medcenter Einrichtungen GmbH. The fabric duplicates were dried in 50°C for 17
hours. Two fabric duplicates from each sample was weighed before and after vacu-
um drying and an average percentage weight difference was calculated. The fabric
duplicates were weighed by a calibrated scale from Kern & Sohn GmbH of type
ALS 120-4, with a resolution of 0.1 mg. The fabric duplicates were kept in a desic-
cator between vacuum drying and weighing.
Tensile test
Tensile tests were performed on filament warp yarns from dissembled fabric sam-
ples on Mesdan electromechanical tensile tester. The instrument was equipped with
pneumatic grips and a 0.1 kN load cell.
Five warp yarns from each fabric duplicate were tested, meaning tensile testing of
20 yarns per sample. The test parameters used in the Tensolab software are shown
in Table 8. No preload was used. Before tensile testing the fabric duplicates were
conditioned for at least 24 hours in standardised atmosphere for conditioning of
textiles. The tests were performed in standardised atmosphere for testing of tex-
tiles.

29
TABLE 8 TENSILE TEST PARAMETERS USED IN TENSOLAB SOFTWARE
Test parameter Value
Method Yarn traction
Sample length 50.0 mm
Yarn count 16.7 tex for PETC
11.0 tex for PETM
Test speed 50.0 mm/min
Recording rate 0.1 mm
Average values on breaking strength and elongation at break was obtained through
the Tensolab software. Young’s modulus was calculated from the raw data based
on the initial, steepest part of the stress-strain curves.
Demand absorbency test
To investigate potential changes in hydrophilicity demand absorbency tests were
carried out according to ISO 9073-12:2002. Demand Absorbency Capacity (DAC)
and Maximum Absorption Rate (MAR) was investigated. DAC is the maximum
absorbed mass of liquid divided by the mass of the test specimen. DAC is ex-
pressed in g/g. MAR is the maximum change in liquid absorbed mass per time
interval. MAR is expressed in g/s. (European Committee for Standardization 2004)
Four fabric duplicates for each sample and four reference duplicates for PETC and
PETM were tested. The fabric duplicates were conditioned for at least 24 hours in
standardised atmosphere for conditioning of textiles before testing. The tests were
performed in standardised atmosphere for testing of textiles. Deionised water was
used for the tests.
Fourier-Transform Infrared spectroscopy
FTIR was performed using Nicolet iS10 with diamond SMART iTX from Thermo
Scientific. The software Omnic (Thermo Scientific) was used for data collection.
Four fabric duplicates for each sample and four reference duplicates were charac-
terised. An average of 64 readings per duplicate was noted and based on that an
average spectrum for each sample was constructed. Before analysis the spectra
were normalised to the maximum peak at the band around 1410 cm-1
using Excel
(Microsoft). This band has been used for normalisation in the literature investigat-
ing degradation and modification PET (e.g. Donelli et al. 2010; Badia et al. 2012).
Differential Scanning Calorimetry
DSC was performed using DSC Q1000 from TA Instruments. One fabric duplicate
for each sample and one reference from each weave (PETC and PETM) were char-
acterised. The sample sizes used was between 3.5 mg and 4.5 mg. Two heating
cycles and one cooling cycle were performed in a nitrogen atmosphere, in the tem-
perature range 25 – 300°C. Ramping rate was set to 20°C/min.
The software used for analysis of the data was TA Universal Analysis (TA Instru-
ments). Temperature intervals were decided, and within these intervals the peak
areas representing heat of melting (∆Hm) and heat of crystallisation (∆Hc) were
defined. The temperature intervals that were used are presented in Table 9.

30
TABLE 9 TEMPERATURE INTERVALS USED FOR DSC DATA ANALYSIS
Heat Temperature interval
1st heat of melting (∆Hm1), PETC 215 - 265°C
Heat of crystallisation (∆Hc), PETC 140 - 215°C
2nd
heat of melting (∆Hm2), PETC 215 - 265°C
1st heat of melting (∆Hm1), PETM 215 – 265°C
Heat of crystallisation (∆Hc), PETM 150 – 220°C
2nd
heat of melting (∆Hm2), PETM 215 – 265°C
Dissolving of PET fabrics
Trials on dissolving the PET fabrics were carried out using three different solvents,
with the aim to perform Size Exclusion Chromatography (SEC). Tetrahydrofuran
(THF), dimethyl sulfoxide (DMSO), and chloroform was used, based on what
could be used in the SEC column. A device for recirculation boiling (as shown in
Figure 9) was used for all trials.
FIGURE 9 RECIRCULATION BOILING DEVICE USED FOR TRIALS ON DISSOLVING OF PET
FABRICS.
A trial on dissolving a PETM fabric test specimen was performed using 30.3 mg of
fabric and 30.3 g of chloroform. Solvent and fabric was placed in the round bottom
flask (see Figure 9) and boiled for around 15 minutes.
A first trial of dissolving a PETC fabric test specimen was performed using DMSO
and lithium bromide. 14.5 mg of lithium bromide was added to 16.67 g of DMSO
to create a 0.1 molar concentration. Solvent and 50 mg of fabric was placed in the
round bottom flask and boiled for around 15 minutes. A second trial using 16.67 g

31
of THF and 50 mg of PETC fabric test specimen was performed. Solvent and fab-
ric was placed in the round bottom flask and boiled for around 15 minutes.
3.3. STATISTICAL ANALYSES Analysis of variance (ANOVA) and Tukey tests were performed to investigate
significant differences between the means of the samples. All dyed samples and the
reference samples for PETC and PETM were compared by ANOVA and Tukey tests
respectively. A confidence level of 95% was used for ANOVA. For Tukey tests an
error rate for comparisons of 5 was used. Statistical tests were performed using
Minitab 17 Statistical Software (Minitab).
Pearson correlation coefficients (linear correlation) were established using Minitab
17 Statistical Software. For correlation analysis a significance level of 95% was
applied. This means that if the p-value for the correlation coefficient is equal to or
smaller than 0.05 the correlation is statistically significant (Minitab Express 2016).
3.4. DATA MODIFICATION FOR GRAPH CONSTRUCTION Before presentation of the obtained data in form of graphs certain modifications
were performed. The data was exaggerated with a certain value depending on the
property presented, in order to separate the graphs for each bath composition. This
was done in order to construct multiple graphs within one figure in order for com-
parison to be possible. The values that have been exaggerated and how (addition or
subtraction) the values have been exaggerated is described in the figure texts.

32
4. RESULTS The results obtained from the characterisation of the samples are presented in the
upcoming sections.
4.1. WEIGHT DIFFERENCES First, percentage weight differences due to dyeing are presented. Second, percent-
age weight differences in dyed samples due to vacuum drying are presented.
4.1.1. WEIGHT DIFFERENCES DUE TO DYEING
The weight differences observed have been plotted against the exposure time above
Tg. The values presented in the graphs below are averages of four fabric duplicates
per sample. The percentage weight differences for the PETC samples due to dyeing
are shown in the graphs in Figure 10 and Figure 11. Figure 10 shows the weight
differences for the samples that have been exposed to one dyeing cycle, and the
three different bath compositions. Figure 10 shows the weight differences for the
samples that have been exposed to one, three, and five dyeing cycles in the bath
containing all auxiliary chemicals.
FIGURE 10 AVERAGE WEIGHT DIFFERENCE OBSERVED IN PETC SAMPLES EXPOSED TO ONE
DYEING CYCLE. FOR CLARITY, AVERAGE WEIGHT DIFFERENCE FOR BATH L AND BATH D
HAS BEEN EXAGGERATED BY 0.5% AND 1% RESPECTIVELY.
0
0.2
0.4
0.6
0.8
1
1.2
1.4
1.6
0 50 100 150 200 250
Aver
ag
e w
eig
ht
dif
fere
nce
[%
]
Exposure time above Tg [min]
105°C
120°C
135°C
105°C
120°C
135°C
105°C
120°C
135°C
Bath d
Bath l
Bath p

33
FIGURE 11 AVERAGE WEIGHT DIFFERENCE OBSERVED IN PETC SAMPLES EXPOSED TO
ONE, THREE OR FIVE DYEING CYCLES IN BATH D. FOR CLARITY, AVERAGE WEIGHT DIF-
FERENCE FOR 135°C, 30 MIN AND 135°C, 60 MIN HAS BEEN EXAGGERATED BY 1%.
The percentage weight differences for the PETM samples due to dyeing are shown
in the graphs in Figure 12 and Figure 13. Figure 12 shows the weight differences
for the samples that have been exposed to one dyeing cycle, and the three different
bath compositions. Figure 13 shows the weight differences for the samples that
have been exposed to one, three, and five dyeing cycles and bath containing all
auxiliary chemicals.
FIGURE 12 AVERAGE WEIGHT DIFFERENCE OBSERVED IN PETM SAMPLES EXPOSED TO ONE
DYEING CYCLE. FOR CLARITY, AVERAGE WEIGHT DIFFERENCE FOR BATH L AND BATH D
HAS BEEN EXAGGERATED BY 0.5% AND 1% RESPECTIVELY.
0
0.5
1
1.5
2
2.5
3
0 100 200 300 400 500 600
Aver
ag
e w
eig
ht
dif
fere
nce
[%
]
Exposure time above Tg [min]
105°C, 30 min
105°C, 60 min
135°C, 30 min
135°C, 60 min
0
0.2
0.4
0.6
0.8
1
1.2
1.4
1.6
0 50 100 150 200 250
Aver
ag
e w
eig
ht
dif
fere
nce
[%
]
Exposure time above Tg [min]
105°C
120°C
135°C
105°C
120°C
135°C
105°C
120°C
135°C
Bath d
Bath l
Bath p

34
FIGURE 13 AVERAGE WEIGHT DIFFERENCE OBSERVED IN PETM SAMPLES EXPOSED TO
ONE, THREE OR FIVE DYEING CYCLES IN BATH D. FOR CLARITY, AVERAGE WEIGHT DIF-
FERENCE FOR 135°C, 30 MIN AND 135°C, 60 MIN HAS BEEN EXAGGERATED BY 1%.
The figures above show that the weight difference depends on the exposure time
above Tg (Figure 11 and Figure 13). Since new bath was added for every dyeing
cycle it seems that the concentration of chemicals that the fabric duplicates have
been exposed to is also a contributing factor. The average weight differences ob-
served in PETC and PETM are quite similar.
4.1.2. VACUUM DRYING
The average weight differences before and after vacuum drying are presented in
the figures below. The values presented are averages of the percentage weight dif-
ference for two fabric duplicates for each sample. Figure 14 to Figure 17 show the
result for PETC samples. Figure 18 to Figure 21 show the result for PETM samples.
As can be seen in the figures below, all PETC samples exhibited a decrease in
weight due to vacuum drying. This was not observed in PETM samples.
FIGURE 14 AVERAGE PERCENTAGE WEIGHT DIFFERENCE AFTER VACUUM DRYING OB-
SERVED IN PETC SAMPLES EXPOSED TO ONE DYEING CYCLES IN BATH P.
0
0.5
1
1.5
2
2.5
3
0 100 200 300 400 500 600
Aver
ag
e w
eig
ht
dif
fere
nce
[%
]
Exposure time above Tg [min]
105°C, 30 min
105°C, 60 min
135°C, 30 min
135°C, 60 min
-0.35
-0.3
-0.25
-0.2
-0.15
-0.1
-0.05
0
0 50 100 150 200 250
Aver
ag
e w
eig
ht
dif
fere
nce
[%
]
Exposure time above Tg [min]
105°C
120°C
135°C
Bath p

35
FIGURE 15 AVERAGE PERCENTAGE WEIGHT DIFFERENCE AFTER VACUUM DRYING OB-
SERVED IN PETC SAMPLES EXPOSED TO ONE DYEING CYCLES IN BATH L.
FIGURE 16 AVERAGE PERCENTAGE WEIGHT DIFFERENCE AFTER VACUUM DRYING OB-
SERVED IN PETC SAMPLES EXPOSED TO ONE DYEING CYCLES IN BATH D.
FIGURE 17 AVERAGE PERCENTAGE WEIGHT DIFFERENCE AFTER VACUUM DRYING OB-
SERVED IN PETC SAMPLES EXPOSED TO ONE, THREE AND FIVE DYEING CYCLES IN BATH D.
-0.35
-0.3
-0.25
-0.2
-0.15
-0.1
-0.05
0
0 50 100 150 200 250
Aver
ag
e w
eig
ht
dif
fere
nce
[%
]
Exposure time above Tg [min]
105°C
120°C
135°C
Bath l
-0.35
-0.3
-0.25
-0.2
-0.15
-0.1
-0.05
0
0 50 100 150 200 250
Aver
ag
e w
eig
ht
dif
fere
nce
[%
]
Exposure time above Tg [min]
105°C
120°C
135°C
Bath d
-0.35
-0.3
-0.25
-0.2
-0.15
-0.1
-0.05
0
0 100 200 300 400 500 600
Aver
ag
e w
eig
ht
dif
fere
nce
[%
]
Exposure time above Tg [min]
105°C, 30 min
105°C, 60 min
135°C, 30 min
135°C, 60 min

36
FIGURE 18 AVERAGE PERCENTAGE WEIGHT DIFFERENCE AFTER VACUUM DRYING OB-
SERVED IN PETM SAMPLES EXPOSED TO ONE DYEING CYCLES IN BATH P.
FIGURE 19 AVERAGE PERCENTAGE WEIGHT DIFFERENCE AFTER VACUUM DRYING OB-
SERVED IN PETM SAMPLES EXPOSED TO ONE DYEING CYCLES IN BATH L.
FIGURE 20 AVERAGE PERCENTAGE WEIGHT DIFFERENCE AFTER VACUUM DRYING OB-
SERVED IN PETM SAMPLES EXPOSED TO ONE DYEING CYCLES IN BATH D.
-0.25
-0.15
-0.05
0.05
0.15
0.25
0.35
0 50 100 150 200 250
Aver
ag
e w
eig
ht
dif
fere
nce
[%
]
Exposure time above Tg [min]
105°C
120°C
135°C
Bath p
-0.25
-0.15
-0.05
0.05
0.15
0.25
0.35
0 50 100 150 200 250
Aver
ag
e w
eig
ht
dif
fere
nce
[%
]
Exposure time above Tg [min]
105°C
120°C
135°C
Bath l
-0.25
-0.15
-0.05
0.05
0.15
0.25
0.35
0 50 100 150 200 250
Aver
ag
e w
eig
ht
dif
fere
nce
[%
]
Exposure time above Tg [min]
105°C
120°C
135°C
Bath d

37
FIGURE 21 AVERAGE PERCENTAGE WEIGHT DIFFERENCE AFTER VACUUM DRYING OB-
SERVED IN PETM SAMPLES EXPOSED TO ONE, THREE AND FIVE DYEING CYCLES IN BATH D.
4.2. TENSILE PROPERTIES The tensile properties presented are averages of 20 yarn tests for each sample.
Breaking strength, elongation at break, and Young’s modulus have been investi-
gated and statistically analysed.
4.2.1. BREAKING STRENGTH
Average breaking strengths for the PETC samples are shown in the graphs in Figure
22 and Figure 23. Figure 24 and Figure 25 show average breaking strengths for
PETM samples. The values presented in the graphs below are averages of four fab-
ric duplicates per sample. Figure 22 and 24 shows the average breaking strength
for samples that have been exposed to one dyeing cycle, in the three different
baths. Figure 23 and 25 shows the average breaking strength for the samples that
have been exposed to one, three and five dyeing cycles, in bath containing all aux-
iliary chemicals.
Statistical analysis showed that the samples with significantly different breaking
strength from PETC Ref exhibit a decreased breaking strength. This is the case for
both PETC and PETM samples. In Table 10 the PETC samples with significantly
different breaking strength are presented. The breaking strength of the PETC Ref
was 6.67 N. The complete Tukey test is presented in Appendix I. In Table 11 the
PETM samples with significantly different breaking strength are presented. The
breaking strength of the PETM Ref was 4.85 N. The complete Tukey test is pre-
sented in Appendix II. Significant results are also marked in the figures below.
As can be seen in Figure 23 there seem to be a decreasing trend in breaking
strength for the PETC samples exposed to 135°C for 60 min as the exposure time
above Tg increases. This seems to be the case also for PETM samples exposed to
the same dyeing conditions, as seen in Figure 25.
-0.35
-0.25
-0.15
-0.05
0.05
0.15
0.25
0.35
0 100 200 300 400 500 600
Aver
ag
e w
eig
ht
dif
fere
nce
[%
]
Exposure time above Tg [min]
105°C, 30 min
105°C, 60 min
135°C, 30 min
105°C, 60 min

38
TABLE 10 PETC SAMPLES WITH BREAKING STRENGTH SIGNIFICANTLY DIFFERENT FROM
PETC REF.
Sample Average breaking
strength [N]
Temp. [°C] Exposure time above
Tg [min]
PETCT3d30×5 6.17 135 550
PETCT2p60 6.11 120 97.5
PETCT2d60 5.34 120 97.5
PETCT2l60 5.15 120 97.5
FIGURE 22 AVERAGE BREAKING STRENGTH OBSERVED IN PETC SAMPLES EXPOSED TO ONE
DYEING CYCLE. FOR CLARITY , AVERAGE BREAKING STRENGTH FOR BATH L AND BATH D
HAS BEEN EXAGGERATED BY 2 N AND 4 N RESPECTIVELY. VALUES SIGNIFICANTLY DIF-
FERENT FROM THE REFERENCE ARE MARKED WITH *.
FIGURE 23 AVERAGE BREAKING STRENGTH OBSERVED IN PETC SAMPLES EXPOSED TO
ONE, THREE AND FIVE DYEING CYCLES IN BATH D. FOR CLARITY, AVERAGE BREAKING
STRENGTH FOR 135°C, 30 MIN AND 135°C, 60 MIN HAS BEEN EXAGGERATED BY 2 N. VAL-
UES SIGNIFICANTLY DIFFERENT FROM THE REFERENCE ARE MARKED WITH *.
*
*
*
5
6
7
8
9
10
11
0 50 100 150 200 250
Aver
ag
e b
reak
ing
str
eng
th [
N]
Exposure time above Tg [min]
105°C
120°C
135°C
105°C
120°C
135°C
105°C
120°C
135°C
Bath d
Bath l
Bath p
*
5
6
7
8
9
10
0 100 200 300 400 500 600
Aver
ag
e b
reak
ing
str
eng
th [
N]
Exposure time above Tg [min]
105°C, 30 min
105°C, 60 min
135°C, 30 min
135°C, 60 min

39
TABLE 11 PETM SAMPLES WITH BREAKING STRENGTH SIGNIFICANTLY DIFFERENT FROM
PETM REF.
Sample Average breaking
strength [N]
Temp. [°C] Exposure time above
Tg [min]
PETMT3l60 4.61 135 110
PETMT3d30×5 4.58 135 400
PETMT2p60 4.57 120 97.5
PETMT3p180 4.56 135 230
PETMT3d60×3 4.55 135 330
PETMT3d180 4.49 135 230
PETMT3l180 4.44 135 230
PETMT3d60×5 4.41 135 550
FIGURE 24 AVERAGE BREAKING STRENGTH OBSERVED IN PETM SAMPLES EXPOSED TO
ONE DYEING CYCLE. FOR CLARITY, AVERAGE BREAKING STRENGTH FOR BATH L AND BATH
D HAS BEEN EXAGGERATED BY 2 N AND 4 N RESPECTIVELY. VALUES SIGNIFICANTLY DIF-
FERENT FROM THE REFERENCE ARE MARKED WITH *.
FIGURE 25 AVERAGE BREAKING STRENGTH OBSERVED IN PETM SAMPLES EXPOSED TO
ONE, THREE AND FIVE DYEING CYCLES IN BATH D. FOR CLARITY, AVERAGE BREAKING
STRENGTH FOR 135°C, 30 MIN AND 135°C, 60 MIN HAS BEEN EXAGGERATED BY 2 N. VAL-
UES SIGNIFICANTLY DIFFERENT FROM THE REFERENCE ARE MARKED WITH *.
*
* *
* * 4
5
6
7
8
9
10
0 50 100 150 200 250
Aver
ag
e b
reak
ing
str
eng
th [
N]
Exposure time above Tg [min]
105°C
120°C
135°C
105°C
120°C
135°C
105°C
120°C
135°C
Bath d
Bath l
Bath p
* * *
3
4
5
6
7
8
0 100 200 300 400 500 600
Aver
ag
e b
reak
ing
str
eng
th [
N]
Exposure time above Tg [min]
105°C, 30 min
105°C, 60 min
135°C, 30 min
135°C, 60 min

40
4.2.2. ELONGATION AT BREAK
In Table 12 the PETC samples with significantly different elongation at break com-
pared to PETC Ref are presented. The significantly different samples exhibit a de-
crease in elongation at break. The elongation at break of the PETC Reference sam-
ple was 19.27 mm. The complete Tukey test is presented in Appendix III. The re-
sult for PETC is also presented in Figure 26 and Figure 27.
In Table 13 the PETM sample with significantly different elongation at break com-
pared to PETM Ref is presented. The significantly different sample exhibits an in-
crease in elongation at break. The elongation at break of the PETM Ref was 24.7
mm. The complete Tukey test is presented in Appendix IV. The result for PETM is
also presented in Figure 28 and Figure 29.
TABLE 12 PETC SAMPLES WITH ELONGATION AT BREAK SIGNIFICANTLY DIFFERENT FROM
PETC REF.
Sample Average elongation at
break [mm]
Temp.
[°C]
Exposure time
above Tg [min]
PETCT1d30×3 17.8 105 165
PETCT1d60×3 17.8 105 425
PETCT1d30×5 17.7 105 275
PETCT2d60 17.6 120 97.5
PETCT3l60 17.0 120 97.5
FIGURE 26 AVERAGE ELONGATION AT BREAK OBSERVED IN PETC SAMPLES EXPOSED TO
ONE DYEING CYCLE. FOR CLARITY, AVERAGE ELONGATION AT BREAK FOR BATH 2 AND
BATH 3 HAS BEEN EXAGGERATED BY 5 MM AND 10 MM, RESPECTIVELY. VALUES SIGNIFI-
CANTLY DIFFERENT FROM THE REFERENCE ARE MARKED WITH *.
*
*
16
18
20
22
24
26
28
30
32
0 50 100 150 200 250
Aver
ag
e el
on
gati
on
at
bre
ak
[m
m]
Time above Tg [min]
105°C
120°C
135°C
105°C
120°C
135°C
105°C
120°C
135°C
Bath 3
Bath 2
Bath 1

41
FIGURE 27 AVERAGE ELONGATION AT BREAK OBSERVED IN PETC SAMPLES EXPOSED TO
ONE, THREE AND FIVE DYEING CYCLES. FOR CLARITY, AVERAGE ELONGATION AT BREAK
FOR 135°C, 30 MIN AND 135°C, 60 MIN HAS BEEN EXAGGERATED BY 5 MM. VALUES SIGNIF-
ICANTLY DIFFERENT FROM THE REFERENCE ARE MARKED WITH *.
TABLE 13 PETM SAMPLES WITH ELONGATION AT BREAK SIGNIFICANTLY DIFFERENT FROM
PETM REF.
Sample Average elongation at
break [mm]
Temp.
[°C]
Exposure time
above Tg [min]
PETCT3p30 26.5 135 80
FIGURE 28 AVERAGE ELONGATION AT BREAK OBSERVED IN PETM SAMPLES EXPOSED TO
ONE DYEING CYCLE. FOR CLARITY, AVERAGE ELONGATION AT BREAK FOR BATH L AND
BATH D HAS BEEN EXAGGERATED BY 5 MM AND 10 MM, RESPECTIVELY. VALUES SIGNIFI-
CANTLY DIFFERENT FROM THE REFERENCE ARE MARKED WITH *.
* * *
16
18
20
22
24
26
0 100 200 300 400 500 600
Aver
ag
e el
on
gati
on
at
bre
ak
[m
m]
Time above Tg [min]
105°C, 30 min
105°C, 60 min
135°C, 30 min
135°C, 60 min
*
22
24
26
28
30
32
34
36
38
0 50 100 150 200 250
Aver
ag
e el
on
gati
on
at
bre
ak
[m
m]
Exposure time above Tg [min]
105°C
120°C
135°C
105°C
120°C
135°C
105°C
120°C
135°C
Bath d
Bath l
Bath p

42
FIGURE 29 AVERAGE ELONGATION AT BREAK OBSERVED IN PETM SAMPLES EXPOSED TO
ONE, THREE AND FIVE DYEING CYCLES IN BATH D. FOR CLARITY, AVERAGE ELONGATION
AT BREAK FOR 135°C, 30 MIN AND 135°C, 60 MIN HAS BEEN EXAGGERATED BY 5 MM. NO
VALUES WERE FOUND TO BE STATISTICALLY DIFFERENT FROM PETM REF.
4.2.3. YOUNG’S MODULUS
Statistical analysis showed that 16 of the PETC samples have a Young’s modulus
significantly different from PETC Ref, these samples are presented in Table 14.
The Young’s moduli for these samples are larger than the modulus for the refer-
ence sample. The complete Tukey test is presented in Appendix V. The average
Young’s modulus of the PETC Ref was 0.0301 N/tex. The result is also shown in
graphs in Figure 30 and Figure 31.
Statistical analysis showed that three of the PETM samples have Young’s modulus
significantly different from PETM Ref, these samples are presented in Table 15.
Two samples have significantly larger moduli than PETM Ref and one sample have
a modulus significantly smaller than the reference. The complete Tukey test is
presented in Appendix VI. The average Young’s modulus of the PETM Ref was
0.0534 N/tex. The result is also shown in graphs in Figure 32 and Figure 33.
22
24
26
28
30
32
0 100 200 300 400 500 600Aver
ag
e el
on
gati
on
at
bre
ak
[m
m]
Exposure time above Tg [min]
105°C, 30 min
105°C, 60 min
135°C, 30 min
135°C, 60 min

43
TABLE 14 PETC SAMPLES WITH A YOUNG’S MODULUS SIGNIFICANTLY DIFFERENT FROM
PETC REF.
Sample Average Young’s
modulus [N/tex]
Temperature
[°C]
Exposure time
above Tg [min]
PETCT2p30 0.0504 120 67.5
PETCT1l60 0.0498 105 85
PETCT1l30 0.0494 105 55
PETCT1p180 0.0479 105 205
PETCT1l180 0.0478 105 205
PETCT3p180 0.0469 135 230
PETCT1d30 0.0468 105 55
PETCT3d180 0.0446 135 230
PETCT3p60 0.0427 135 110
PETCT3d30×3 0.0425 135 240
PETCT3d60×5 0.0413 135 550
PETCT2d60 0.0399 120 97.5
PETCT1d30×3 0.0395 105 165
PETCT1d60 0.0394 105 85
PETCT2p60 0.0392 120 97.5
PETCT1d60×3 0.0391 105 255
FIGURE 30 AVERAGE YOUNG'S MODULUS OBSERVED IN PETC SAMPLES EXPOSED TO ONE
DYEING CYCLE. FOR CLARITY, AVERAGE YOUNG’S MODULUS FOR BATH L AND BATH D HAS
BEEN EXAGGERATED BY 0.1 N/TEX AND 0.2 N/TEX RESPECTIVELY. VALUES SIGNIFICANTLY
DIFFERENT FROM THE REFERENCE ARE MARKED WITH *.
* * * *
* * *
* * * * *
0
0.05
0.1
0.15
0.2
0.25
0.3
0 50 100 150 200 250
Aver
ag
e Y
ou
ng
's m
od
ulu
s [N
/tex
]
Time above Tg [min]
105°C
120°C
135°C
105°C
120°C
135°C
105°C
120°C
135°C
Bath d
Bath l
Bath p

44
FIGURE 31 AVERAGE YOUNG'S MODULUS OBSERVED IN PETC SAMPLES EXPOSED TO ONE,
THREE OR FIVE DYEING CYCLES IN BATH D. FOR CLARITY, AVERAGE YOUNG'S MODULUS
FOR 135°C, 30 MIN AND 135°C, 60 MIN HAS BEEN EXAGGERATED BY 0.1 N/TEX. VALUES
SIGNIFICANTLY DIFFERENT FROM THE REFERENCE ARE MARKED WITH *.
TABLE 15 PETM SAMPLES WITH A YOUNG’S MODULUS SIGNIFICANTLY DIFFERENT FROM
PETM REF.
Sample Average Young’s
modulus [N/tex]
Temperature
[°C]
Exposure time
above Tg [min]
PETMT3l180 0.0331 135 230
PETMT1d60 0.0692 105 85
PETMT2p180 0.0698 120 217.5
FIGURE 32 AVERAGE YOUNG'S MODULUS OBSERVED IN PETM SAMPLES EXPOSED TO ONE
DYEING CYCLE. FOR CLARITY, AVERAGE YOUNG’S MODULUS FOR BATH D AND BATH L HAS
BEEN EXAGGERATED BY 0.1 N/TEX AND 0.2 N/TEX RESPECTIVELY. VALUES SIGNIFICANTLY
DIFFERENT FROM THE REFERENCE ARE MARKED WITH *.
* * * *
* *
0.00
0.05
0.10
0.15
0.20
0 100 200 300 400 500 600
Aver
ag
e Y
ou
ng
's m
od
ulu
s [N
/tex
]
Time above Tg [min]
105°C, 30 min
105°C, 60 min
135°C, 30 min
135°C, 60 min
*
*
*
0
0.05
0.1
0.15
0.2
0.25
0.3
0 50 100 150 200 250
Aver
ag
e Y
ou
ng
's m
od
ulu
s [N
/tex
]
Exposure time above Tg [min]
105°C
120°C
135°C
105°C
120°C
135°C
105°C
120°C
135°C
Bath d
Bath l
Bath p

45
FIGURE 33 AVERAGE YOUNG'S MODULUS OBSERVED IN PETM SAMPLES EXPOSED TO ONE,
THREE OR FIVE DYEING CYCLES IN BATH D. FOR CLARITY, AVERAGE YOUNG'S MODULUS
FOR 135°C, 30 MIN AND 135°C, 60 MIN HAS BEEN EXAGGERATED BY 0.1 N/TEX. NO VALUES
WERE FOUND TO BE STATISTICALLY DIFFERENT FROM PETM REF.
4.3. DEMAND ABSORBENCY CAPACITY AND MOISTURE ABSORPTION
RATE The result of the demand absorbency test is presented in Table 16 and Table 17.
The values presented in the tables are average values of tests of four fabric dupli-
cates. Statistical analysis showed that two PETC sample exhibit a significantly dif-
ferent DAC compared to PETC Ref. The PETC samples exhibit a higher average
DAC than PETC Ref. Three samples exhibit a statistically significant MAR, com-
pared to PETC Ref, these samples have a higher MAR. The complete Tukey test for
DAC for PETC samples is presented in Appendix VII and the Tukey test for MAR
for PETC is presented in Appendix VIII. As can be seen in Table 16 the lowest
DAC for PETC is observed in PETC Ref.
The statistical analysis showed that all PETM samples exhibit an average DAC
significantly different from the PETM Ref. Dyeing of the PETM samples have re-
sulted in lower DAC compared to PETM Ref. Two samples exhibit a statistically
significant MAR, compared to PETM Ref, these samples have a higher MAR. The
complete Tukey test for DAC for PETM samples is presented in Appendix IX and
the Tukey test for MAR for PETM is presented in Appendix X. As can be seen in
Table 17 most of the dyed PETM samples exhibit a MAR lower than PETM Ref.
0
0.05
0.1
0.15
0.2
0 100 200 300 400 500 600
Aver
ag
e el
on
gati
on
at
bre
ak
[m
m]
Exposure time above Tg [min]
105°C, 30 min
105°C, 60 min
135°C, 30 min
135°C, 60 min

46
TABLE 16 AVERAGE DEMAND ABSORBENCY CAPACITY AND AVERAGE MOISTURE ABSORP-
TION RATE OBSERVED IN PETC SAMPLES. SAMPLES WITH SIGNIFICANTLY DIFFERENT VAL-
UES COMPARED TO THE REFERENCE SAMPLES ARE MARKED WITH *.
Sample Average DAC [g/g] Average MAR [g/s]
PETCRef 1.08 0.16
PETCT1p30 1.30 0.11
PETCT1l30 1.31 0.23
PETCT1d30 1.16 0.22
PETCT1d30×3 1.19 0.22
PETCT1d30×5 1.21 0.22
PETCT1p60 1.25 0.13
PETCT1l60 1.23 0.26*
PETCT1d60 1.40 0.22
PETCT1d60×3 1.30 0.22
PETCT1d60×5 1.22 0.20
PETCT1p180 1.41 0.16
PETCT1l180 1.19 0.22
PETCT1d180 1.20 0.21
PETCT2p30 1.41 0.18
PETCT2l30 1.43 0.22
PETCT2d30 1.30 0.23
PETCT2p60 1.43 0.20
PETCT2l60 1.45 0.29*
PETCT2d60 1.80* 0.22
PETCT2p180 1.47 0.19
PETCT2l180 1.23 0.22
PETCT2d180 1.40 0.22
PETCT3p30 1.33 0.17
PETCT3l30 1.39 0.22
PETCT3d30 1.30 0.22
PETCT3d30×3 1.41 0.27*
PETCT3d30×5 1.48 0.23
PETCT3p60 1.20 0.19
PETCT3l60 1.38 0.23
PETCT3d60 1.29 0.21
PETCT3d60×3 1.25 0.22
PETCT3d60×5 1.31 0.22
PETCT3p180 1.34 0.17
PETCT3l180 1.40 0.21
PETCT3d180 1.65* 0.20

47
TABLE 17 AVERAGE DEMAND ABSORBENCY CAPACITY AND AVERAGE MOISTURE ABSORP-
TION RATE OBSERVED IN PETM SAMPLES. SAMPLES WITH SIGNIFICANTLY DIFFERENT
VALUES COMPARED TO THE REFERENCE SAMPLES ARE MARKED WITH *.
Sample Average DAC [g/g] Average MAR [g/s]
PETMRef 1.92 0.32
PETMT1p30 1.33* 0.21
PETMT1l30 1.18* 0.62*
PETMT1d30 1.30* 0.22
PETMT1d30×3 1.29* 0.22
PETMT1d30×5 1.25* 0.21
PETMT1p60 1.08* 0.18
PETMT1l60 0.95* 0.17
PETMT1d60 1.03* 0.19
PETMT1d60×3 1.22* 0.20
PETMT1d60×5 1.18* 0.18
PETMT1p180 1.33* 0.20
PETMT1l180 1.25* 0.54*
PETMT1d180 1.13* 0.48
PETMT2p30 1.03* 0.16
PETMT2l30 1.07* 0.18
PETMT2d30 0.96* 0.18
PETMT2p60 1.07* 0.18
PETMT2l60 0.95* 0.18
PETMT2d60 0.98* 0.18
PETMT2p180 1.04* 0.17
PETMT2l180 0.91* 0.16
PETMT2d180 0.97* 0.17
PETMT3p30 1.02* 0.17
PETMT3l30 1.17* 0.20
PETMT3d30 1.09* 0.30
PETMT3d30×3 1.14* 0.19
PETMT3d30×5 1.19* 0.19
PETMT3p60 1.15* 0.17
PETMT3l60 1.04* 0.18
PETMT3d60 1.22* 0.19
PETMT3d60×3 1.14* 0.19
PETMT3d60×5 1.14* 0.18
PETMT3p180 1.14* 0.17
PETMT3l180 1.08* 0.18
PETMT3d180 1.11* 0.20
Table 16 and Table 17 show that DAC of the two different PET fabrics seem to be
affected in opposite manner by the dyeing processes. The thinner filaments (PETM)
exhibit decreased DAC while the thicker filaments (PETC) exhibit increased DAC.
This can also be seen in Figure 34 and Figure 35 (PETC) and in Figure 36 and Fig-
ure 37 (PETM). PETC and PETM samples exposed to multiple dyeing cycles exhibit
similar change in the MAR, which can be seen in Figure 37 and Figure 39.

48
FIGURE 34 AVERAGE DAC OBSERVED IN PETC SAMPLES EXPOSED TO ONE DYEING CYCLE.
FOR CLARITY, AVERAGE DAC FOR BATH L AND BATH D HAS BEEN EXAGGERATED BY 1 G/G
AND 2 G/G RESPECTIVELY. VALUES SIGNIFICANTLY DIFFERENT FROM PETC REF ARE
MARKED WITH *.
FIGURE 35 AVERAGE DAC OBSERVED IN PETC SAMPLES EXPOSED TO ONE, THREE AND
FIVE DYEING CYCLES IN BATH D. FOR CLARITY, AVERAGE DAC FOR 135°C, 30 MIN AND
135°C, 60 MIN HAS BEEN EXAGGERATED BY 1 G/G. NO VALUES WERE FOUND TO BE
SIGIFICANTLY DIFFERENT FROM PETC REF.
* *
0.00
0.50
1.00
1.50
2.00
2.50
3.00
3.50
4.00
0 50 100 150 200 250
Aver
ag
e D
eman
d A
bso
rben
cy C
ap
aci
ty
[g/g
]
Exposure time above Tg [min]
105°C
120°C
135°C
105°C
120°C
135°C
105°C
120°C
135°C
Bath d
Bath l
Bath p
0
0.5
1
1.5
2
2.5
3
0 100 200 300 400 500 600
Aver
ag
e D
eman
d A
bso
rben
cy
Cap
aci
ty [
g/g
]
Exposure time above Tg [min]
105°C, 30 min
105°C, 60 min
135°C, 30 min
135°C, 60 min

49
FIGURE 36 AVERAGE DAC OBSERVED IN PETM SAMPLES EXPOSED TO ONE DYEING CYCLE .
FOR CLARITY, AVERAGE DAC FOR BATH L AND BATH D HAS BEEN EXAGGERATED BY 1 G/G
AND 2 G/G RESPECTIVELY. ALL VALUES ARE SIGNIFICANTLY DIFFERENT FROM PETM REF
AND THEREFORE NOT MARKED IN THIS FIGURE.
FIGURE 37 AVERAGE DAC OBSERVED IN PETM SAMPLES EXPOSED TO ONE, THREE AND
FIVE DYEING CYCLES IN BATH D. FOR CLARITY, AVERAGE DAC FOR 135°C, 30 MIN AND
135°C, 60 MIN HAS BEEN EXAGGERATED BY 1 G/G. ALL VALUES ARE SIGNIFICANTLY DIF-
FERENT FROM PETM REF AND THEREFORE NOT MARKED IN THIS FIGURE.
0.0
0.5
1.0
1.5
2.0
2.5
3.0
3.5
4.0
0 50 100 150 200 250
Aver
ag
e D
eman
d A
bso
rben
cy C
ap
aci
ty [
g/g
]
Exposure time above Tg [min]
105°C
120°C
135°C
105°C
120°C
135°C
105°C
120°C
135°C
Bath d
Bath l
Bath p
0
0.5
1
1.5
2
2.5
3
0 100 200 300 400 500 600
Aver
ag
e M
ax
imu
m A
bso
rpti
on
Rate
[g
/s]
Exposure time above Tg [min]
105°C, 30 min
105°C, 60 min
135°C, 30 min
135°C, 60 min

50
FIGURE 38 AVERAGE MAR OBSERVED IN PETC SAMPLES EXPOSED TO ONE DYEING CY-
CLE. AVERAGE MAR FOR BATH L AND BATH D HAS BEEN EXAGGERATED BY 0.5 G/S AND 1
G/S RESPECTIVELY. VALUES SIGNIFICANTLY DIFFERENT FROM PETC REF ARE MARKED
WITH *.
FIGURE 39 AVERAGE MAR OBSERVED IN PETC SAMPLES EXPOSED TO ONE, THREE AND
FIVE DYEING CYCLES IN BATH D. FOR CLARITY, AVERAGE MAR FOR 135°C, 30 MIN AND
135°C, 60 MIN HAS BEEN EXAGGERATED BY 1 G/S. VALUES SIGNIFICANTLY DIFFERENT
FROM PETC REF ARE MARKED WITH *.
* *
0.00
0.25
0.50
0.75
1.00
1.25
1.50
0 50 100 150 200 250
Aver
ag
e M
ax
imu
m A
bso
rpti
on
Rate
[g
/s]
Exposure time above Tg [min]
105°C
120°C
135°C
105°C
120°C
135°C
105°C
120°C
135°C
Bath d
Bath l
Bath p
*
0
0.25
0.5
0.75
1
0 100 200 300 400 500 600
Aver
ag
e M
ois
ture
Ab
sorp
tion
Rate
[g
/s]
Exposure time above Tg [min]
105°C, 30 min
105°C, 60 min
135°C, 30 min
135°C, 60 min

51
FIGURE 40 AVERAGE MAR OBSERVED IN PETM SAMPLES EXPOSED TO ONE DYEING CY-
CLE. AVERAGE MAR FOR BATH 2 AND BATH 3 HAS BEEN EXAGGERATED BY 0.5 G/S AND 1
G/S RESPECTIVELY. VALUES SIGNIFICANTLY DIFFERENT FROM PETM REF ARE MARKED
WITH *.
FIGURE 41 AVERAGE MAR OBSERVED IN PETM SAMPLES EXPOSED TO ONE, THREE AND
FIVE DYEING CYCLES. FOR CLARITY, AVERAGE MAR FOR 135°C, 30 MIN AND 135°C, 60
MIN HAS BEEN EXAGGERATED BY 1 G/S. NO VALUES WERE FOUND TO BE SIGIFICANTLY
DIFFERENT FROM PETM REF.
4.4. FOURIER-TRANSFORM INFRARED SPECTROSCOPY The results of the FTIR are presented in form of spectra and absorbance ratios. All
spectra in full scale can be seen in Appendix XI (PETC) and Appendix XII (PETM).
The spectra in the figures below have been normalised at 1409 cm-1
. Also, the rati-
os are calculated from normalised spectra.
As can be seen in Figure 42 and Figure 43 changes in the spectral data in the range
of 1420 – 1620 cm-1
can be observed. These changes are observed after exposure to
three and five dyeing cycles in 105°C in bath composition 3. Around 1585 cm-1
a
new peak has emerged in PETCT1d30×5 and PETCT1d30×5. An intensity increase
* *
0
0.25
0.5
0.75
1
1.25
1.5
0 50 100 150 200 250
Aver
ag
e M
ax
imu
m A
bso
rpti
on
Rate
[g
/s]
Exposure time above Tg [min]
105°C
120°C
135°C
105°C
120°C
135°C
105°C
120°C
135°C
Bath 3
Bath 2
Bath 1
0
0.25
0.5
0.75
1
1.25
1.5
0 100 200 300 400 500 600
Aver
ag
e M
ax
imu
m A
bso
rpti
on
Rate
[g
/s]
Exposure time above Tg [min]
105°C, 30 min
105°C, 60 min
135°C, 30 min
135°C, 60 min

52
can be observed at 1578 cm-1
for samples exposed to three and five dyeing cycles
for both 30 and 60 minutes.
Around 1534 cm-1
emerging peaks can also be observed. The intensity increases
with increased number of dyeing cycles for the samples dyed in both 30 and 60
minutes. Intensity increase of the peaks at 1449 cm-1
can also be observed depend-
ent on the number of dyeing cycles. Intensity increase can also be observed at 1469
cm-1
.
FIGURE 42 MAGNIFIED FTIR SPECTRA FOR PETC SAMPLES EXPOSED TO DYEING IN 105°C
FOR 30 MINUTES.
FIGURE 43 MAGNIFIED FTIR SPECTRA FOR PETC SAMPLES EXPOSED TO DYEING IN 105°C
FOR 60 MINUTES.
Similar changes in spectral data can be observed in PETM samples, as seen in Fig-
ure 44 to Figure 47. For PETM changes are observed also in samples dyed in
135°C. However, the spectral changes in the samples dyed in 135°C are not as
large as those observed in samples dyed in 105°C.
14
49
14
69
15
34
15
78
1
58
5
0
0.05
0.1
0.15
0.2
13001400150016001700A
bso
rban
ce
Wavenumber [cm-1]
PETC Ref
PETC T1 p 30
PETC T1 l 30
PETC T1 d 30
PETC T1 d 30×3
PETC T1 d 30×5
14
49
14
69
15
34
15
78
15
85
0
0.05
0.1
0.15
0.2
13001400150016001700
Ab
sorb
an
ce
Wavenumber [cm⁻¹]
PETC Ref
PETC T1 p 60
PETC T1 l 60
PETC T1 d 60
PETC T1 d 60×3
PETC T1 d 60×5

53
FIGURE 44 MAGNIFIED FTIR SPECTRA FOR PETM SAMPLES EXPOSED TO DYEING IN 105°C
FOR 30 MINUTES.
FIGURE 45 MAGNIFIED FTIR SPECTRA FOR PETM SAMPLES EXPOSED TO DYEING IN 105°C
FOR 60 MINUTES.
14
49
14
69
15
34
15
78
15
85
0
0.05
0.1
0.15
0.2
13001400150016001700
Ab
sorb
an
ce
Wavenumber [cm-1]
PETM Ref
PETM T1 p 30
PETM T1 l 30
PETM T1 d 30
PETM T1 d 30×3
PETM T1 d 30×5
14
49
14
69
15
34
15
78
15
85
0
0.05
0.1
0.15
0.2
13001400150016001700
Ab
sorb
an
ce
Wavenumber [cm-1]
PETM Ref
PETM T1 p 60
PETM T1 l 60
PETM T1 d 60
PETM T1 d 60×3
PETM T1 d 60×5

54
FIGURE 46 MAGNIFIED FTIR SPECTRA FOR PETM SAMPLES EXPOSED TO DYEING IN 135°C
FOR 30 MINUTES.
FIGURE 47 MAGNIFIED FTIR SPECTRA FOR PETM SAMPLES EXPOSED TO DYEING IN 135°C
FOR 60 MINUTES.
14
49
14
69
15
38
15
78
0
0.05
0.1
0.15
0.2
13001400150016001700
Ab
sorb
an
ce
Wavenumber [cm-1]
PETM Ref
PETM T3 p 30
PETM T3 l 30
PETM T3 d 30
PETM T3 d 30×3
PETM T3 d 30×5
14
50
14
69
15
38
15
78
0
0.05
0.1
0.15
0.2
13001400150016001700
Ab
sorb
an
ce
Wavenumber [cm-1]
PETM Ref
PETM T3 p 60
PETM T3 l 60
PETM T3 d 60
PETM T3 d 60×3
PETM T3 d 60×5

55
As can be seen in Figure 48 there are obvious changes in the spectral data for
PETMT3d60×5.
FIGURE 48 MAGNIFIED FTIR SPECTRA FOR PETM SAMPLES EXPOSED TO DYEING AT
135°C FOR DYEING CYCLES OF 60 MIN
4.4.1. ABSORBANCE RATIOS
Absorbance ratios for peaks suggested to be included in trans-gauche couples are
presented in the tables below. Table 18 shows the ratios for PETC samples and
Table 19 shows the ratios for PETM samples.
The peak at 1371 cm-1
arises from CH2 wagging of the ethylene glycol in the
amorphous phase, representing the gauche conformation of the ethylene glycol.
The peak at 1339 cm-1
(PETC) or 1340 cm-1
(PETM) arises from CH2 wagging in
the crystalline phase, representing the trans conformation of the ethylene glycol.
Peaks at these wavenumbers have been suggested to form a trans-gauche couple.
The peaks at 847 cm-1
and 898 cm-1
are also suggested to form a trans-gauche cou-
ple, and are arises from CH2 rocking.
For the suggested trans-gauche couple 970 cm-1
and 1042 cm-1
, no peaks around
wavenumber 1042 cm-1
have been observed and therefore this couple is not inves-
tigated further.
28
49
29
17
0
0.025
0.05
0.075
0.1
275028502950305031503250
Ab
sorb
an
ce
Wavenumber [cm-1]
Reference
PETM T3 p 60
PETM T3 l 60
PETM T3 d 60
PETM T3 d 60×3
PETM T3 d 60×5

56
TABLE 18 ABSORBANCE RATIOS FOR ABSORBANCE PEAKS SUGGESTED TO FORM TRANS-
GAUCHE COUPLES CALCULATED FROM NORMALISED FTIR SPECTRA FOR PETC SAMPLES.
MAXIMUM VALUE IS MARKED WITH * AND MINIMUM VALUE IS MARKED WITH ^.
Sample A1371/A1409
Gauche
A1339/A1409
Trans
A898/A1409
Gauche
A847/A1409
Trans
PETCRef 0.397 1.064 0.870 1.297 PETCT1p30 0.417 1.064 0.880 1.304 PETCT1l30 0.412 1.058 0.864 1.292 PETCT1d30 0.414 1.074 0.913 1.334 PETCT1d30×3 0.453 1.059 0.877 1.312 PETCT1d30×5 0.490* 1.064 0.888 1.337 PETCT1p60 0.421 1.070 0.893 1.333 PETCT1l60 0.428 1.056 0.876 1.315 PETCT1d60 0.416 1.071 0.894 1.330 PETCT1d60×3 0.459 1.070 0.929 1.366 PETCT1d60×5 0.473 1.072 0.910 1.367* PETCT1p180 0.361^ 1.045 0.882 1.325 PETCT1l180 0.407 1.067 0.890 1.320 PETCT1d180 0.410 1.064 0.870 1.298 PETCT2p30 0.417 1.065 0.899 1.337 PETCT2l30 0.415 1.066 0.890 1.330 PETCT2d30 0.418 1.063 0.912 1.342 PETCT2p60 0.411 1.067 0.930* 1.356 PETCT2l60 0.424 1.077 0.924 1.355 PETCT2d60 0.424 1.072 0.917 1.342 PETCT2p180 0.409 1.073 0.913 1.335 PETCT2l180 0.414 1.068 0.913 1.336 PETCT2d180 0.418 1.081* 0.930* 1.342 PETCT3p30 0.387 1.015 0.866 1.267 PETCT3l30 0.394 1.021 0.862 1.266 PETCT3d30 0.386 0.988 0.836 1.228 PETCT3d30×3 0.407 0.987 0.848 1.241 PETCT3d30×5 0.405 0.935^ 0.825^ 1.198 PETCT3p60 0.387 1.002 0.870 1.272 PETCT3l60 0.385 0.987 0.848 1.254 PETCT3d60 0.380 0.980 0.868 1.261 PETCT3d60×3 0.403 0.962 0.868 1.254 PETCT3d60×5 0.414 0.939 0.848 1.223^ PETCT3p180 0.408 1.048 0.927 1.336 PETCT3l180 0.409 1.046 0.916 1.339 PETCT3d180 0.413 1.052 0.925 1.342

57
TABLE 19 ABSORBANCE RATIOS FOR ABSORBANCE PEAKS SUGGESTED TO FORM TRANS-
GAUCHE COUPLES CALCULATED FROM NORMALISED FTIR SPECTRA FOR PETM SAMPLES.
MAXIMUM VALUE IS MARKED WITH * AND MINIMUM VALUE IS MARKED WITH ^.
Sample A1371/A1409
Gauche
A1340/A1409
Trans
A898/A1409
Gauche
A847/A1409
Trans
PETMRef 0.4183 1.036 0.6348 1.075 PETMT1p30 0.3899 1.021 0.5940 1.061^ PETMT1l30 0.3832 1.025 0.5891^ 1.065 PETMT1d30 0.3817^ 1.020 0.5965 1.070 PETMT1d30×3 0.4151 1.021 0.5960 1.083 PETMT1d30×5 0.4616 1.012^ 0.6120 1.119 PETMT1p60 0.3859 1.020 0.6059 1.082 PETMT1l60 0.3845 1.019 0.5899 1.072 PETMT1d60 0.3892 1.013 0.6148 1.088 PETMT1d60×3 0.4115 1.019 0.6112 1.095 PETMT1d60×5 0.4544 1.021 0.6090 1.108 PETMT1p180 0.3863 1.024 0.5947 1.075 PETMT1l180 0.3865 1.019 0.5996 1.084 PETMT1d180 0.3845 1.022 0.5959 1.078 PETMT2p30 0.3874 1.019 0.6110 1.084 PETMT2l30 0.3838 1.024 0.5953 1.075 PETMT2d30 0.3821 1.020 0.5984 1.079 PETMT2p60 0.4271 1.038 0.6418 1.078 PETMT2l60 0.4289 1.029 0.6448 1.086 PETMT2d60 0.4307 1.035 0.6476 1.088 PETMT2p180 0.4271 1.034 0.6468 1.083 PETMT2l180 0.4271 1.036 0.6319 1.079 PETMT2d180 0.4272 1.036 0.6361 1.078 PETMT3p30 0.4241 1.038 0.6427 1.079 PETMT3l30 0.4241 1.035 0.6424 1.084 PETMT3d30 0.4281 1.038 0.6390 1.079 PETMT3d30×3 0.4485 1.048 0.6545 1.095 PETMT3d30×5 0.4691 1.051 0.6616 1.105 PETMT3p60 0.4246 1.042 0.6408 1.080 PETMT3l60 0.4242 1.043 0.6406 1.081 PETMT3d60 0.4279 1.036 0.6501 1.095 PETMT3d60×3 0.4456 1.054* 0.6473 1.087 PETMT3d60×5 0.4921* 1.046 0.6980* 1.127* PETMT3p180 0.4248 1.042 0.6377 1.080 PETMT3l180 0.4238 1.035 0.6450 1.092 PETMT3d180 0.4267 1.043 0.6483 1.088

58
Absorbance ratios for 1712 cm-1
(C=O stretching) for PETC and PETM are present-
ed in Table 20. Absorbance in this region has been studied in relation to degrada-
tion of PET. It is clear that the absorbance ratios for PETC samples have decreased
due to dyeing, meaning a decrease in absorbance intensity. The largest decrease
can be observed in PETCT3d60×5. For PETM the results are not as clear, but the
largest decrease can be observed in PETMT3d60×5.
TABLE 20 ABSORBANCE RATIOS FOR 1712 CM-1
CALCULATED FROM NORMALISED FTIR
SPECTRA FOR PETC AND PETM.
PETC PETM
Sample A1712/A1409
C=O stretching
Sample A1712/A1409
C=O stretching PETCRef 3.066* PETMRef 3.153 PETCT1p30 2.972 PETMT1p30 3.296 PETCT1l30 2.987 PETMT1l30 3.341 PETCT1d30 2.934 PETMT1d30 3.330 PETCT1d30×3 2.863 PETMT1d30×3 3.217 PETCT1d30×5 2.733 PETMT1d30×5 3.044 PETCT1p60 2.976 PETMT1p60 3.295 PETCT1l60 2.932 PETMT1l60 3.358* PETCT1d60 2.951 PETMT1d60 3.301 PETCT1d60×3 2.795 PETMT1d60×3 3.196 PETCT1d60×5 2.803 PETMT1d60×5 3.065 PETCT1p180 3.060 PETMT1p180 3.291 PETCT1l180 2.985 PETMT1l180 3.358* PETCT1d180 2.962 PETMT1d180 3.326 PETCT2p30 2.978 PETMT2p30 3.285 PETCT2l30 2.993 PETMT2l30 3.349 PETCT2d30 2.930 PETMT2d30 3.354 PETCT2p60 2.993 PETMT2p60 3.069 PETCT2l60 2.948 PETMT2l60 3.102 PETCT2d60 2.936 PETMT2d60 3.073 PETCT2p180 2.983 PETMT2p180 3.068 PETCT2l180 2.980 PETMT2l180 3.148 PETCT2d180 2.946 PETMT2d180 3.125 PETCT3p30 2.878 PETMT3p30 3.113 PETCT3l30 2.902 PETMT3l30 3.163 PETCT3d30 2.787 PETMT3d30 3.123 PETCT3d30×3 2.769 PETMT3d30×3 3.009 PETCT3d30×5 2.582 PETMT3d30×5 2.926 PETCT3p60 2.893 PETMT3p60 3.117 PETCT3l60 2.893 PETMT3l60 3.197 PETCT3d60 2.837 PETMT3d60 3.155 PETCT3d60×3 2.720 PETMT3d60×3 3.055 PETCT3d60×5 2.567^ PETMT3d60×5 2.879^ PETCT3p180 3.033 PETMT3p180 3.115 PETCT3l180 3.055 PETMT3l180 3.186 PETCT3d180 3.024 PETMT3d180 3.139

59
4.5. DIFFERENTIAL SCANNING CALORIMETRY The results of the DSC on PETC and PETM samples are presented in Table 21 and
Table 22, respectively. Heat of melting (∆Hm1), heat of crystallisation (∆Hc), and
second heat of melting (∆Hm2) are presented. Ratios between different heats are
presented in the tables. Also, the maximum temperature peaks for melting and
crystallisation are presented. ∆Hm1 is related to the degree of crystallinity according
to Equation 1. Higher heat of melting means higher degree of crystallinity.
TABLE 21 HEATS OF MELTING AND CRYSTALLISATION OBSERVED IN PETC SAMPLES.
MAXIMUM VALUE IS MARKED WITH * AND MINIMUM VALUE IS MARKED WITH ^.
Sample ∆Hm1
[J/g]
Peak
max.
Hm1
∆Hc
[J/g]
Peak
max.
Hc
∆Hm2
[J/g]
Peak
max.
Hm2
PETCRef 58 254 38 182 37 251 1.5 1.6 PETCT1p30 57 253 36 175 37 251 1.6 1.5 PETCT1l30 60 253 36 175 38 251 1.7 1.6 PETCT1d30 58 253 42 185 37 251 1.4 1.6 PETCT1d30×3 59 253 42 182 38 251 1.4 1.6 PETCT1d30×5 56 253 41 179 37 251 1.4 1.5 PETCT1p60 54 253 35^ 176 34^ 251 1.5 1.6 PETCT1l60 58 253 36 177 37 250 1.6 1.6 PETCT1d60 57 253 41 182 37 251 1.4 1.5 PETCT1d60×3 59 253 42 183 38 251 1.4 1.6 PETCT1d60×5 58 254 42 181 37 251 1.4 1.6 PETCT1p180 57 253 36 178 37 251 1.6 1.5 PETCT1l180 58 254 40 179 37 251 1.5 1.6 PETCT1d180 59 253 40 180 36 251 1.5 1.6 PETCT2p30 59 253 38 176 38 251 1.6 1.6 PETCT2l30 57 254 38 179 36 251 1.5 1.6 PETCT2d30 59 253 41 184 37 251 1.4 1.6 PETCT2p60 61 254 47 185 42 253 1.3 1.5 PETCT2l60 59 254 48* 189 43* 253 1.2 1.4 PETCT2d60 57 254 44 190 40 253 1.3 1.4 PETCT2p180 56 254 38 179 36 251 1.5 1.6 PETCT2l180 59 253 41 180 38 251 1.4 1.6 PETCT2d180 56 253 40 184 35 251 1.4 1.6 PETCT3p30 57 253 37 178 37 251 1.5 1.5 PETCT3l30 59 253 42 181 38 251 1.4 1.6 PETCT3d30 57 253 42 184 37 251 1.4 1.5 PETCT3d30×3 58 253 43 185 37 251 1.3 1.6 PETCT3d30×5 53^ 255 41 184 36 252 1.3 1.5 PETCT3p60 57 253 40 178 37 251 1.4 1.5 PETCT3l60 55 254 41 181 36 251 1.3 1.5 PETCT3d60 58 254 42 185 38 252 1.4 1.5 PETCT3d60×3 58 254 43 186 38 252 1.3 1.5 PETCT3d60×5 57 255 44 186 38 252 1.3 1.5 PETCT3p180 62* 254 45 184 41 252 1.4 1.5 PETCT3l180 58 253 41 182 38 252 1.4 1.5 PETCT3d180 59 253 42 185 38 252 1.4 1.6

60
TABLE 22 HEATS OF MELTING AND CRYSTALLISATION OBSERVED IN PETM SAMPLES.
MAXIMUM VALUE IS MARKED WITH * AND MINIMUM VALUE IS MARKED WITH ^.
Sample ∆Hm1
[J/g]
Peak
max.
Hm1
∆HC
[J/g]
Peak
max.
Hc
∆Hm2
[J/g]
Peak
max.
Hm2
PETMRef 60 253 42 191 38 251 1.4 1.6 PETMT1p30 55 254 36 180 36 251 1.5 1.5 PETMT1l30 55 254 35^ 184 35 251 1.6 1.6 PETMT1d30 59 254 42 186 38 251 1.4 1.6 PETMT1d30×3 57 253 37 181 35^ 250 1.5 1.6 PETMT1d30×5 59 253 42 185 38 251 1.4 1.6 PETMT1p60 58 253 39 182 37 250 1.5 1.6 PETMT1l60 59 254 36 179 37 250 1.6 1.6 PETMT1d60 59 253 39 183 37 251 1.5 1.6 PETMT1d60×3 56 253 39 183 36 250 1.4 1.6 PETMT1d60×5 61 253 43* 183 39* 251 1.4 1.6 PETMT1p180 58 253 37 181 37 250 1.6 1.6 PETMT1l180 59 253 36 180 37 251 1.6 1.6 PETMT1d180 59 253 40 182 37 250 1.5 1.6 PETMT2p30 62* 252 39 180 38 250 1.6 1.6 PETMT2l30 59 253 37 181 37 250 1.6 1.6 PETMT2d30 61 253 41 183 38 250 1.5 1.6 PETMT2p60 59 253 39 182 37 250 1.5 1.6 PETMT2l60 60 253 39 181 38 251 1.5 1.6 PETMT2d60 60 253 42 185 38 250 1.4 1.6 PETMT2p180 61 253 42 184 39* 251 1.5 1.6 PETMT2l180 58 253 39 183 37 251 1.5 1.6 PETMT2d180 58 253 40 184 37 251 1.5 1.6 PETMT3p30 60 253 41 184 38 250 1.5 1.6 PETMT3l30 59 253 37 181 37 251 1.6 1.6 PETMT3d30 60 253 42 186 37 250 1.4 1.6 PETMT3d30×3 56 253 40 186 36 251 1.4 1.6 PETMT3d30×5 56 253 41 185 37 251 1.4 1.5 PETMT3p60 60 253 41 183 38 251 1.5 1.6 PETMT3l60 58 254 39 182 37 251 1.5 1.6 PETMT3d60 58 253 40 184 38 251 1.5 1.5 PETMT3d60×3 57 253 42 186 37 251 1.4 1.5 PETMT3d60×5 54^ 253 40 186 36 252 1.4 1.5 PETMT3p180 58 254 43* 186 38 252 1.3 1.5 PETMT3l180 56 254 40 185 36 251 1.4 1.6 PETMT3d180 57 253 41 187 37 251 1.4 1.5
The ratios between ∆Hm1 and ∆Hc are very similar for PETC and PETM. The ratios
between ∆Hm1 and ∆Hm2 are also very similar.
∆Hm1 and ∆Hc were plotted against the exposure time above Tg and the result is
presented in Figure 49 to Figure 56.
For PETC there seems to be an increasing trend in ∆Hc depending on the exposure
time above Tg for the samples exposed to dyeing at 135°C for 60 minutes (Figure
52).

61
For PETM there seems to be a decreasing trend in ∆Hm1 depending on the exposure
time above Tg for the samples exposed to dyeing at 135°C for 60 minutes (Figure
54).
FIGURE 49 HEAT OF MELTING FOR PETC SAMPLES EXPOSED TO ONE DYEING CYCLE. FOR
CLARITY, ∆HM1 FOR BATH P AND BATH D HAVE BEEN EXAGGERATED BY -15 J/G AND 15
J/G, RESPECTIVELY.
FIGURE 50 HEAT OF MELTING FOR PETC SAMPLES EXPOSED TO ONE, THREE AND FIVE
DYEING CYCLES IN BATH D. FOR CLARITY, ∆HM1 FOR 135°C, 30 MIN AND 135°C, 60 MIN
HAVE BEEN EXAGGERATED BY 15 J/G.
20
30
40
50
60
70
80
0 50 100 150 200 250
Hea
t of
mel
tin
g,
∆H
m1 [
J/g
]
Exposure time above Tg [min]
105°C
120°C
135°C
105°C
120°C
135°C
105°C
120°C
135°C
Bath d
Bath l
Bath p
30
40
50
60
70
80
0 100 200 300 400 500 600
Hea
t of
mel
tin
g,
∆H
m1 [
J/g
]
Exposure time above Tg [min]
105°C, 30 min
105°C, 60 min
135°C, 30 min
135°C, 60 min

62
FIGURE 51 HEAT OF CRYSTALLISATION FOR PETC SAMPLES EXPOSED TO ONE DYEING
CYCLE. FOR CLARITY, ∆HC FOR BATH P AND BATH D HAVE BEEN EXAGGERATED BY -15 J/G
AND 15 J/G, RESPECTIVELY.
FIGURE 52 HEAT OF CRYSTALLISATION FOR PETC SAMPLES EXPOSED TO ONE, THREE AND
FIVE DYEING CYCLES IN BATH D. FOR CLARITY, ∆HC FOR 135°C, 30 MIN AND 135°C, 60
MIN HAVE BEEN EXAGGERATED BY 15 J/G.
FIGURE 53 HEAT OF MELTING FOR PETM SAMPLES EXPOSED TO ONE DYEING CYCLE. FOR
CLARITY, ∆HM1 FOR BATH 1 AND BATH 3 HAVE BEEN EXAGGERATED BY -15 J/G AND 15
J/G, RESPECTIVELY.
0
10
20
30
40
50
60
0 50 100 150 200 250
Hea
t of
cry
stall
isati
on
, ∆
Hc
[J/g
]
Exposure time above Tg [min]
105°C
120°C
135°C
105°C
120°C
135°C
105°C
120°C
135°C
Bath d
Bath l
Bath p
0
10
20
30
40
50
60
0 100 200 300 400 500 600Hea
t of
cry
stall
isati
on
, ∆
Hc
[J/g
]
Exposure time above Tg [min]
105°C, 30 min
105°C, 60 min
135°C, 30 min
135°C, 60 min
20
30
40
50
60
70
80
0 50 100 150 200 250
Hea
t of
mel
tin
g,
∆H
m1 [
J/g
]
Exposure time above Tg [min]
105°C
120°C
135°C
105°C
120°C
135°C
105°C
120°C
135°C
Bath d
Bath l
Bath p

63
FIGURE 54 HEAT OF MELTING FOR PETM SAMPLES EXPOSED TO ONE, THREE AND FIVE
DYEING CYCLES IN BATH D. FOR CLARITY, ∆HM1 FOR 135°C, 30 MIN AND 135°C, 60 MIN
HAVE BEEN EXAGGERATED BY 15 J/G.
FIGURE 55 HEAT OF CRYSTALLISATION FOR PETM SAMPLES EXPOSED TO ONE DYEING
CYCLE. FOR CLARITY, ∆HC FOR BATH P AND BATH D HAVE BEEN EXAGGERATED BY -15 J/G
AND 15 J/G, RESPECTIVELY.
FIGURE 56 HEAT OF CRYSTALLISATION FOR PETM SAMPLES EXPOSED TO ONE, THREE AND
FIVE DYEING CYCLES IN BATH D. FOR CLARITY, ∆HC FOR 135°C, 30 MIN AND 135°C, 60
MIN HAVE BEEN EXAGGERATED BY 15 J/G.
30
40
50
60
70
80
0 100 200 300 400 500 600
Hea
t of
mel
tin
g,
∆H
m1 [
J/g
]
Exposure time above Tg [min]
105°C, 30 min
105°C, 60 min
135°C, 30 min
135°C, 60 min
0
10
20
30
40
50
60
0 50 100 150 200 250
Hea
t of
cry
stall
isati
on
, ∆
Hc
[J/g
]
Exposure time above Tg [min]
105°C
120°C
135°C
105°C
120°C
135°C
105°C
120°C
135°C
Bath d
Bath l
Bath p
0
10
20
30
40
50
60
0 100 200 300 400 500 600
Hea
t of
cry
stall
isati
on
, ∆
Hc
[J/g
]
Exposure time above Tg [min]
105°C, 30 min
105°C, 60 min
135°C, 30 min
135°C, 60 min

64
4.5.1. DSC CURVES FOR PETC SAMPLES
In Figure 57 to Figure 65 DSC curves for PETC samples are presented. In all fig-
ures it can be seen that during cooling dyed samples exhibit crystallisation peaks
different from the PETC Ref.
FIGURE 57 OVERLAID DSC CURVES FOR PETC SAMPLES EXPOSED TO DYEING AT 105°C
FOR 30 MIN IN ALL BATH COMPOSITIONS.
FIGURE 58 OVERLAID DSC CURVES FOR PETC SAMPLES EXPOSED TO DYEING AT 105°C
FOR 60 MIN IN ALL BATH COMPOSITIONS.

65
FIGURE 59 OVERLAID DSC CURVES FOR PETC SAMPLES EXPOSED TO DYEING AT 105°C
FOR 180 MIN IN ALL BATH COMPOSITIONS.
FIGURE 60 OVERLAID DSC CURVES FOR PETC SAMPLES EXPOSED TO DYEING AT 120°C
FOR 30 MIN IN ALL BATH COMPOSITIONS.
FIGURE 61 OVERLAID DSC CURVES FOR PETC SAMPLES EXPOSED TO DYEING AT 120°C
FOR 60 MIN IN ALL BATH COMPOSITIONS.
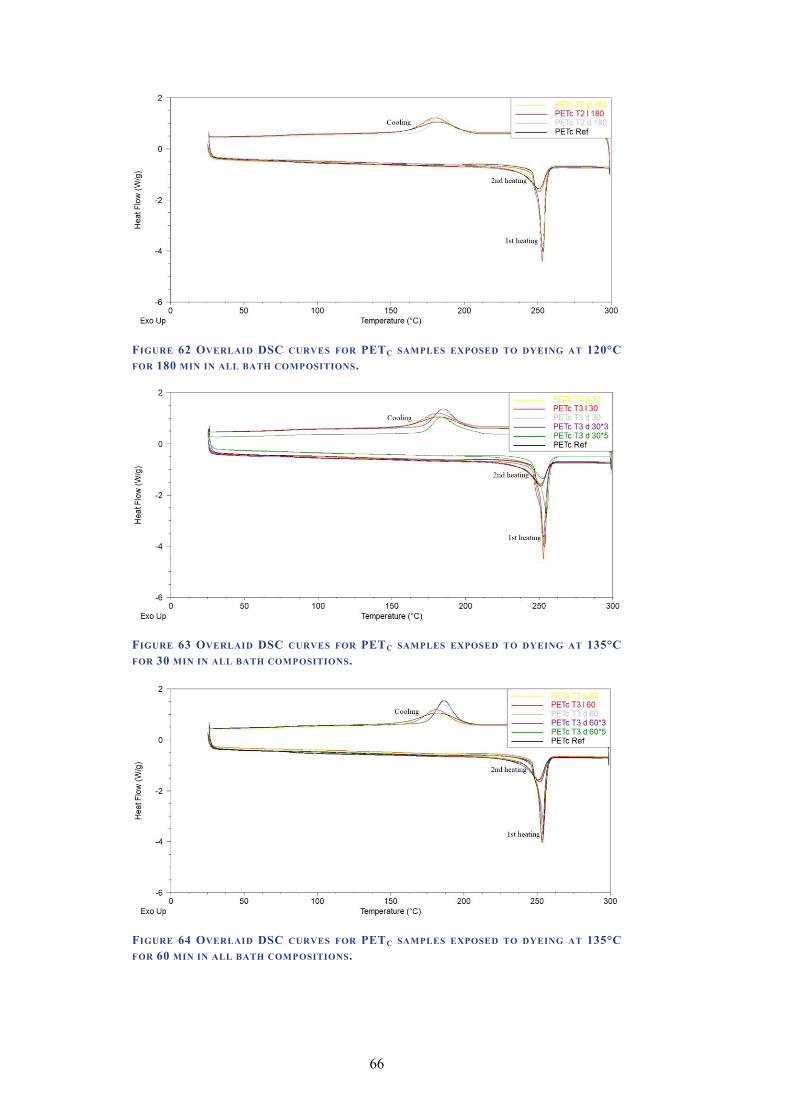
66
FIGURE 62 OVERLAID DSC CURVES FOR PETC SAMPLES EXPOSED TO DYEING AT 120°C
FOR 180 MIN IN ALL BATH COMPOSITIONS.
FIGURE 63 OVERLAID DSC CURVES FOR PETC SAMPLES EXPOSED TO DYEING AT 135°C
FOR 30 MIN IN ALL BATH COMPOSITIONS.
FIGURE 64 OVERLAID DSC CURVES FOR PETC SAMPLES EXPOSED TO DYEING AT 135°C
FOR 60 MIN IN ALL BATH COMPOSITIONS.

67
FIGURE 65 OVERLAID DSC CURVES FOR PETC SAMPLES EXPOSED TO DYEING AT 135°C
FOR 180 MIN IN ALL BATH COMPOSITIONS.
4.5.2. DSC CURVES FOR PETM SAMPLES
In Figure 66 to Figure 74 DSC curves for PETM samples are presented. Just as for
the PETC samples, changes in the crystallisation peaks can be observed during
cooling.
FIGURE 66 OVERLAID DSC CURVES FOR PETM SAMPLES EXPOSED TO DYEING AT 105°C
FOR 30 MIN IN ALL BATH COMPOSITIONS.

68
FIGURE 67 OVERLAID DSC CURVES FOR PETM SAMPLES EXPOSED TO DYEING AT 105°C
FOR 60 MIN IN ALL BATH COMPOSITIONS.
FIGURE 68 OVERLAID DSC CURVES FOR PETM SAMPLES EXPOSED TO DYEING AT 105°C
FOR 180 MIN IN ALL BATH COMPOSITIONS.
FIGURE 69 OVERLAID DSC CURVES FOR PETM SAMPLES EXPOSED TO DYEING AT 120°C
FOR 30 MIN IN ALL BATH COMPOSITIONS.

69
FIGURE 70 OVERLAID DSC CURVES FOR PETM SAMPLES EXPOSED TO DYEING AT 120°C
FOR 60 MIN IN ALL BATH COMPOSITIONS.
FIGURE 71 OVERLAID DSC CURVES FOR PETM SAMPLES EXPOSED TO DYEING AT 120°C
FOR 180 MIN IN ALL BATH COMPOSITIONS.
FIGURE 72 OVERLAID DSC CURVES FOR PETM SAMPLES EXPOSED TO DYEING AT 135°C
FOR 30 MIN IN ALL BATH COMPOSITIONS.

70
FIGURE 73 OVERLAID DSC CURVES FOR PETM SAMPLES EXPOSED TO DYEING AT 135°C
FOR 60 MIN IN ALL BATH COMPOSITIONS.
FIGURE 74 OVERLAID DSC CURVES FOR PETM SAMPLES EXPOSED TO DYEING AT 135°C
FOR 180 MIN IN ALL BATH COMPOSITIONS.
4.6. DISSOLVING OF PET FABRICS The PET fabrics used within this study could not be successfully dissolved in the
proposed solvents: DMSO + lithium bromide, THF, and chloroform. Due to this,
molecular weight determination through SEC has not been possible to perform.

71
5. DISCUSSION AND ANALYSIS In this section the results will be analysed and discussed in relation to the literature
review with the purpose of finding answers to the research questions. Also, the
experimental methods used within this Master thesis will be discussed.
5.1. WEIGHT DIFFERENCES The results indicate that the percentage weight differences observed in PETC sam-
ples are mostly affected by the number of dyeing cycles. The average percentage
weight differences of the samples exposed to multiple dyeing cycles in 135°C seem
to increase proportionally to the number of dyeing cycles. For example, the weight
difference of PETCT3d60×3 is approximately three times the weight difference for
PETCT3d60. For PETCT3d60×5 the difference is approximately five times the
weight difference for PETCT3d60. However, for the samples dyed in 105°C the
differences are not as large.
As can be seen in Figure 75, the exposure time above Tg does not seem to cause as
big differences in the weight as the number of dyeing cycles. It seems that the
number of cycles and hence the concentration of chemicals that the samples have
been exposed are the critical factors. PETCT3d30×3 and PETCT3d180 have been
exposed 240 and 230 min respectively, yet the average weight difference is larger
for PETCT3d30×3. Temperature along with number of dyeing cycles seems to be
the main influencing parameters. Similar weight differences seem to be the case for
PETM samples, as shown in Figure 76.
FIGURE 75 AVERAGE PERCENTAGE WEIGHT DIFFERENCE PLOTTED AGAINST EXPOSURE
TIME ABOVE TG FOR PETC SAMPLES. FOR CLARITY, AVERAGE WEIGHT DIFFERENCES FOR
SAMPLES DYED IN 135°C HAVE BEEN EXAGGERATED BY 1%.
0
0.5
1
1.5
2
2.5
3
0 100 200 300 400 500 600
Aver
ag
e w
eig
ht
dif
fere
nce
[%
]
Exposure time above Tg [min]
105°C, 30 min
105°C, 60 min
105°C, 180 min
135°C, 30 min
135°C, 60 min
135°C, 180 min

72
FIGURE 76 AVERAGE PERCENTAGE WEIGHT DIFFERENCE PLOTTED AGAINST EXPOSURE
TIME ABOVE TG FOR PETM SAMPLES. FOR CLARITY, AVERAGE WEIGHT DIFFERENCES FOR
SAMPLES DYED IN 135°C HAVE BEEN EXAGGERATED BY 1%.
The samples dyed in 105°C and 135°C has been exposed to the same concentra-
tions of dye stuff and auxiliary chemicals. Yet, the weight differences are larger for
the higher temperature. Two potential explanations behind this observation may be
suggested. First, it can be an effect of increased hydrophilicity due to formation of
more hydrophilic end-groups if chain scission has occurred during the dyeing pro-
cess. Second, it could be due to access to the fibre interior since the higher temper-
ature should cause increased mobility in the polymers. This could lead to a higher
concentration of auxiliary chemicals diffusing into the fibres during dyeing.
5.1.1. VACUUM DRYING
The aim of vacuum drying was to investigate the reason behind the weight increase
observed after dyeing. As suggested previously the increase could be an effect of
increased hydrophilicity, the amount of chemicals present in the fabrics, or a com-
bination of both.
PETC samples exhibit a percentage weight decrease after vacuum drying, which
was expected. On the other hand, the vacuum drying and weighing of the PETM
samples resulted in inconclusive and unexpected results. Some samples exhibited a
percentage weight increase while other samples exhibited a percentage weight
decrease. The error of the scales that were used is 0.0001 g and since five signifi-
cant figures were noted, the measurement error is very low. This is therefore not
suggested to be the reason behind the inconclusive result.
The result of the weighing after vacuum drying and the result of the demand absor-
bency test might be related. Therefore, a correlation analysis of the values obtained
through these two tests was performed.
For PETC samples a negative correlation between DAC and the percentage weight
difference after vacuum drying was found. The correlation coefficient established
is -0.416, which is considered a moderate correlation. The correlation means that as
the weight difference becomes smaller so does the demand absorbency capacity.
The complete correlation analysis is shown in Appendix XII, Table 23. This is
0
0.5
1
1.5
2
2.5
3
0 100 200 300 400 500 600
Aver
ag
e w
eig
ht
dif
fere
nce
[%
]
Exposure time above Tg [min]
105°C, 30 min
105°C, 60 min
105°C, 180 min
135°C, 30 min
135°C, 60 min
135°C, 180 min

73
shown graphically in the scatter plot in Figure 77. The potential removal of mois-
ture by vacuum drying is supposed to indicate increased hydrophilicity. The DAC
is also supposed to indicate increased hydrophilicity, since an increased concentra-
tion of hydrophilic end-groups is assumed to result in increased ability to absorb
moisture. Sanders and Zeronian (1982) suggested that moisture related properties
similar to DAC are not sensitive enough to indicate hydrolysis. However, the cor-
relation between DAC and the changes in weight due to vacuum drying contributes
to the cenclusion that dyeing has caused some kind of changes in the PET polymer.
FIGURE 77 SCATTER PLOT OF AVERAGE DAC AGAINST AVERAGE WEIGHT DIFFERENCE
DUE TO VACUUM DRYING FOR PETC SAMPLES. TREND LINE REPRESENTS A MODERATE
NEGATIVE CORRELATION.
No correlation was found for PETM samples (Table 26 in Appendix XIV). What
can be said about the result of the vacuum drying and the PETM fibres is that for
the three different bath compositions and for temperature 105°C and 120°C the
average weight difference follows some sort of patterns. However, explanations for
this have not been found.
5.2. TENSILE PROPERTIES It has been suggested by others that dyeing does not cause large enough changes in
the PET polymer that affects the mechanical properties (Smole & Zipper 2002).
This work shows significant decreases in breaking strength and elongation at break
in multifilament yarns consisting of conventional PET as well as microfibre PET.
When looking into the samples with a breaking strength significantly different
from the reference, there are more significant values among the PETM samples
(eight) than among the PETC samples (four). Out of the significantly different
PETM samples, all samples except one have been exposed to dyeing in 135°C. For
PETC, three of the significantly different samples have been exposed to dyeing at
120°C. It seems as there may be a difference between the effects of temperature
between the two filament titer. The samples with significantly different breaking
strength exhibit a lower breaking strength than the reference samples. This is the
case for both PETC and PETM. It should be noted that the PETC samples that did
not have a breaking strength significantly different from PETC Ref in most cases
1.0
1.1
1.2
1.3
1.4
1.5
1.6
1.7
1.8
1.9
-0.3 -0.25 -0.2 -0.15 -0.1 -0.05 0
Aver
ag
e D
eman
d A
bsr
ob
an
cy
Cap
aci
ty [
g/g
]
Average weight difference [%]

74
(all but four) exhibited a lower breaking strength than the reference. All dyed
PETM samples exhibited a lower breaking strength than PETM Ref.
The Young’s moduli of PETC samples and PETM samples have been affected by
dyeing. All PETC samples with a modulus significantly different from the reference
exhibit higher modulus. Among the significantly different PETM samples both
higher and lower moduli are observed. The difference between PETC Ref and the
sample with the highest moduli is 0.020 N/tex and for PETM the difference is 0.017
N/tex. No correlations between dyeing parameters and Young’s modulus have been
found for any of the PET fabrics. It has been suggested that Young’s modulus of
PET yarn is affected by degree of orientation rather than degree of crystallinity
(Gupta & Kumar 1981b). It has also been suggested that chain scission of PET
result in shorter chains which can disentangle and take a more ordered structure
(Allen, Edge & Mohammadian 1991). This could potentially explain the increases
observed. However, since both higher and lower moduli have been observed it is
difficult to draw any conclusions on what the reason behind this.
5.3. CORRELATIONS AND RELATIONSHIPS Pearson correlation coefficients have been established using Minitab, to find indi-
cations of linear relationships between the investigated variables and properties.
Complete results from Minitab are presented in Appendix XIII for PETC samples
and Appendix XIV for PETM samples.
5.3.1. THE EFFECTS OF EXPOSURE TIME ABOVE TG
For PETC no significant correlations between exposure time above Tg and any of
the tensile or demand absorbency properties have been found. For PETM, however,
significant correlations have been found between exposure time above Tg and
breaking strength and elongation at break. Between exposure time and breaking
strength a negative correlation of -0.584 have been found. Between exposure time
and elongation at break the correlation is also negative, being -0.393.
For PETM samples a significant negative correlation of -0.406 (moderate) has been
found between the exposure time above Tg and ∆Hm1, while no significant correla-
tion between these variables was found for PETC samples. One possible explana-
tion behind this correlation could be that dyeing means exposure to temperatures
above Tg after the primary crystallisation. Gupta and Kumar (1981a) suggested that
this may result in a decreased degree of crystallinity because the imperfections in
the crystalline phase diffuse into the amorphous phase. The extent of such diffusion
could possibly be higher with increased exposure time. This would also explain the
negative correlations between exposure time above Tg and the mechanical proper-
ties, since degree of crystallinity is known to affect both breaking strength and
elongation at break.
5.3.2. THE EFFECTS OF DYEING TEMPERATURE
The correlation analysis showed only three significant correlations between dyeing
temperature and investigated properties. First, correlations between dyeing temper-
ature and demand absorbency capacity have been found for both PETC and PETM.
However, the correlations are of different kind. For PETC a moderate positive cor-
relation between dyeing temperature and DAC was found. For PETM a strong

75
negative correlation between dyeing temperature and DAC was found. The fila-
ment titer in combination with the dyeing temperature seems to be a critical factor
for the changes of the demand absorbency properties.
A weak positive correlation was also found between dyeing temperature and ∆Hc
for PETC samples. This means that increased dyeing temperature will result in in-
creased ∆Hc. A higher value of ∆Hc indicates a faster crystallisation process than a
lower value and changes in crystallisation rate has been shown to depend on degree
of chain scission after re-processing of PET (López et al. 2014). This correlation
could possibly indicate that chain scission has occurred during dyeing when the
exposure times are longer.
5.3.3. DSC RESULTS, TENSILE PROPERTIES AND DEMAND ABSORBENCY
For PETC samples a negative correlation of -0.666 between breaking strength and
heat of crystallisation (∆Hc) was found, this is shown graphically in Figure 78. The
PETC samples that exhibited the most obvious decreases in breaking strength were
found to have among the higher values of ∆Hc. The DSC results show that the
PETC samples exhibiting the highest values of ∆Hc, also exhibit sharper and less
wide crystallisation peaks. This indicates that the breaking strength is related to the
rate of crystallisation, which has been suggested to be related to chain scission
(López et al. 2014). If chain scission has occurred during dyeing it would be ex-
pected that crystallisation occurs faster and easier. Between elongation at break and
∆Hc a negative correlation of -0.407 has been observed.
FIGURE 78 AVERAGE BREAKING STRENGTH PLOTTED AGAINST ∆HC FOR PETC SAMPLES.
TREND LINE REPRESENTS A STRONG NEGATIVE CORRELATION BETWEEN THE TWO VARIA-
BLES.
A negative correlation of -0.526 has been observed between DAC and breaking
strength for PETC. This means that the higher the breaking strength, the lower the
DAC will be. Putting this in relation to the correlation between breaking strength
and ∆Hc, indicates that chain scission may have occurred during dyeing. DAC is
expected to be partially affected by hydrophilicity.
For PETM samples a positive correlation of 0.502 between breaking strength and
∆Hm1 was found to be significant. Also, a positive correlation of 0.642 between
elongation at break and ∆Hm1 was found significant. This is shown graphically in
0
1
2
3
4
5
6
7
8
30 32 34 36 38 40 42 44 46 48 50
Aver
ag
e b
reak
ing
str
eng
th [
N]
Heat of crystallisation [J/g]

76
Figure 79 and Figure 80, respectively. Regarding ∆Hc of PETM, only one correla-
tion was found: a weak negative correlation between ∆Hc and MAR.
FIGURE 79 SCATTER PLOT OF ∆HM1 AGAINST AVERAGE BREAKING STRENGTH FOR PETM
SAMPLES. TREND LINE REPRESENTS A STRONG POSITIVE CORRELATION BETWEEN THE TWO
VARIABLES.
FIGURE 80 SCATTER PLOT OF ∆HM1 AGAINST AVERAGE ELONGATION AT BREAK FOR PETM
SAMPLES. TREND LINE REPRESENTS A STRONG POSITIVE CORRELATION BETWEEN THE TWO
VARIABLES.
5.4. FTIR RESULTS The calculated absorbance ratios do not differ very much. Also, as can be seen in
the spectra presented in Appendix XI (PETC) and Appendix XII (PETM) the differ-
ences between reference spectrum and sample spectra are quite small. However,
some spectral changes may indicate degradation and therefore some further discus-
sion around this is in place.
53
54
55
56
57
58
59
60
61
62
63
4.3 4.4 4.5 4.6 4.7 4.8 4.9
Hea
t of
mel
tin
g [
J/g
]
Average breaking strength [N]
53
54
55
56
57
58
59
60
61
62
63
23 23.5 24 24.5 25 25.5 26 26.5 27
Hea
t of
mel
tin
g [
J/g
]
Average elongation at break [%]

77
Chain scission through hydrolysis has been shown to result in an intensity decrease
at the peak related to C=O bonds (Sammon, Yarwood & Everall 2000; Donelli et
al. 2010). For the PET used in this study the peak related to C=O was detected at
1712 cm-1
, which is in agreement with previously reported results for semi-
crystalline PET. For both PETC and PETM decreased intensity and lower absorb-
ance ratios at this particular wavenumber have been observed. It is most clear in
PETC, where all dyed samples exhibit absorbance ratios lower than the ratio for the
PETC Ref. The most obvious decreases are observed in the samples exposed to
three and five dyeing cycles in the bath containing all auxiliary chemicals. This
seems to be the case for samples exposed to both 105°C and 135°C. For PETM, the
absorbance ratios provide less conclusive results. However, the most obvious de-
creases are observed in samples dyed in 135°C, exposed to five dyeing cycles. It is
therefore proposed that the number of dyeing cycles is a critical factor, as well as
the exposure time above Tg. For both PETC and PETM strong negative correlations
was found between exposure time above Tg and the absorbance ratio (1712/1409).
This means that as the exposure time increases the absorbance ratio decreases. The
correlation coefficients found were quite similar, -0.635 for PETC and -0.632 for
PETM.
One very obvious change in spectral data was found for PETMT3d60×5, see Figure
81. Out of all the PETM samples this is the sample exposed to dyeing for the long-
est time above Tg. This sample has also been dyed five times, meaning that the
concentration of the auxiliary chemicals that the sample has been exposed to is
among the highest. These peaks could indicate hydrolysis. Similar peaks at similar
wavenumbers were presented by Sammon, Yarwood and Everall (2000) in hydro-
lysed PET films.
FIGURE 81 MAGNIFIED FTIR SPECTRA FOR PETM SAMPLES EXPOSED TO DYEING AT
135°C FOR DYEING CYCLES OF 60 MIN.
Looking more closely within these wavenumbers it can be observed that there are
also differences for the PETM samples dyed in 135°C for 30 minutes. The changes
are not at all as apparent but there are differences due to the number of dyeing cy-
28
49
29
17
0
0.025
0.05
0.075
0.1
275028502950305031503250
Ab
sorb
an
ce
Wavenumber [cm-1]
Reference
PETM T3 p 60
PETM T3 l 60
PETM T3 d 60
PETM T3 d 60×3
PETM T3 d 60×5

78
cles, which can be seen in Figure 82. This has not been observed in PETC samples
exposed to the same conditions.
FIGURE 82 MAGNIFIED FTIR SPECTRA FOR PETM SAMPLES EXPOSED TO DYEING AT
135°C FOR DYEING CYCLES OF 30 MIN.
Spectral changes were observed between 1420 cm-1
and 1620 cm-1
. According to
Chen, Hay and Jenkins (2012) spectral changes in this area is related to crystallisa-
tion. The peak at 1578 cm-1
has increased in intensity due to dyeing in both PETC
and PETM samples which can be seen in Figure 42 to Figure 47 in section 4.4. Fou-
rier-Transform Infrared Spectroscopy, and Figure 83 below (moved from section
4.4.). Chen, Hay and Jenkins (2012) observed intensity decrease at this wave-
number as crystallinity increased, and thereby it has been suggested that this is
peak related to the amorphous fraction of PET. Peaks at 1470 cm-1
and 1471 cm-1
has been shown to increase in intensity when crystallinity increases (Donelli et al.
2010; Badia et al. 2012; Chen, Hay & Jenkins 2012). A small intensity increase
can be observed after dyeing at wavenumber 1469 cm-1
.
0
0.02
0.04
0.06
0.08
0.1
275028502950305031503250
Ab
sorb
an
ce
Wavenumber [cm-1]
PETM Ref
PETM T3 p 30
PETM T3 l 30
PETM T3 d 30
PETM T3 d 30×3
PETM T3 d 30×5

79
FIGURE 83 MAGNIFIED FTIR SPECTRA FOR PETC SAMPLES EXPOSED TO DYEING IN 105°C
FOR 30 MINUTES.
It is somewhat unclear what these changes between 1420 cm-1
and 1620 cm-1
actu-
ally indicate. There is a risk that the differences could be due to noise since they
are quite small, but it is also quite clear that these changes depend on the number of
dyeing cycles. Therefore it is suggested that these changes should be further stud-
ied in future work.
5.4.1. TRANS-GAUCHE RELATIONSHIPS
Changes in crystallinity can be observed through FTIR and by investigating chang-
es in absorbance at wavenumber associated with trans-gauche couples (Miyake
1959; Donelli et al. 2010). For PETC samples, only significant positive correlations
between the investigated trans-gauche couples have been found. A strong correla-
tion of 0.923 was found between 847 cm-1
(trans) and 898 cm-1
(gauche). A mod-
erate correlation of 0.429 was found between 1339 cm-1
(trans) and 1371 cm-1
(gauche). When the crystallinity increases it would be expected to find negative
correlations between trans and gauche peaks, since the trans peak intensity would
increase while the gauche peak would decrease (Miyake 1959).
For PETM a strong negative correlation of -0.637 has been found between the max-
imum absorbance at 1340 cm-1
(trans – crystalline) and 1371 cm-1
(gauche – amor-
phous), which is expected if the degree of crystallinity have increased (ibid.). For
the suggested trans-gauche couple at 847 cm-1
and 898 cm-1
a positive correlation
of 0.529 has been found. Hence, the results are somewhat inconclusive. It would be
expected to observe similar correlations for the two different couples.
5.5. DSC RESULTS The result of the DSC shows no large shift in melting temperatures. For PETC the
melting temperatures observed during the first heating cycle is in the range of 252 -
255°C. For the same heating cycle, the range observed in PETM is 252 - 254°C.
The variation in maximum peak crystallisation temperature is larger. For PETC the
crystallisation temperatures are found in the temperature range from 175°C to
190°C. For PETM the temperature range is from 179°C to 191°C. When comparing
maximum and minimum values the differences are larger for PETC than for PETM.
14
49
14
69
15
34
15
78
1
58
5
0
0.05
0.1
0.15
0.2
13001400150016001700
Ab
sorb
an
ce
Wavenumber [cm-1]
PETC Ref
PETC T1 p 30
PETC T1 l 30
PETC T1 d 30
PETC T1 d 30×3
PETC T1 d 30×5

80
The difference between the highest and lowest observed ∆Hm1 for PETC is 9 while
for PETM it is 8. This is not at remarkable difference. However, the difference be-
tween the highest and lowest observed ∆Hc for PETC is 13 while for PETM it is 8.
This indicates that the filament titer affects these changes. The results also indicate
that the amorphous parts of the polymer are more affected by dyeing than the crys-
talline part, since the changes observed in melting behaviour are not as large. This
is in agreement with the suggestion that hydrolysis takes place in the amorphous
fractions of PET (Pirzadeh, Zadhoush & Haghighat 2007).
The crystallisation peaks of the reference samples for both PETC and PETM are
wider than the peaks of the dyed samples. Changes in crystallisation peaks have
been observed after re-processing of PET by means of injection moulding (López
et al. 2014) and have been concluded to be an effect of chain scission. The largest
changes seem to have occurred after dyeing in the bath containing all of the auxil-
iary chemicals. Also, the number of dyeing cycles seems to contribute to the
changes in the crystallisation peaks.
The melting peaks observed during the first heating cycle has also been somewhat
altered due to dyeing. However, these changes are not as prominent as the observed
changes indicating altered crystallisation behaviour. The lowest values of ∆Hm1 for
both PETC and PETM are observed in samples exposed to five dyeing cycles in
135°C.
The DSC result shows that there is a 2% difference in degree of crystallinity be-
tween PETC Ref and PETM Ref. The higher degree of crystallinity was observed in
PETM and was calculated to be 43%. The degree of crystallinity in PETC was cal-
culated to be 41%. Since this is not a large difference it is not suspected to be the
main reason behind the differences observed in the two fabrics after dyeing.
5.6. METHODOLOGY In this section the experimental methods used in this study are discussed. Also,
alternative possible methods are presented in the discussion.
5.6.1. DEMAND ABSORBENCY TEST
The test method used for investigating surface properties in terms of demand ab-
sorbency capacity and maximum absorption rate is appropriate to discuss. EN ISO
9073-12:2002 is a standard developed for testing of non-woven textile materials
but in this case it was used for woven fabrics. Also, it is not only the surface prop-
erties of the fibres that affect the results. Capillary forces play a vital role for the
interaction with water and the absorption behaviour and these forces are affected
by the woven structure and its density.
It is also important to mention that the auxiliary chemicals used in dyeing contain
chemical compounds with surfactant properties. The samples were only rinsed with
water after dyeing and therefore there is a possibility that residuals of auxiliary
chemicals are present on the fabric surface and the surface of the fibres. Obviously
this could have an effect on the outcome of the test.
One alternative method that could have been used for investigating possible chang-
es in hydrophilicity is contact angle measurement. This method has been used by

81
others to investigate hydrophilicity of modified PET films (Donelli et al. 2010).
Just as with the demand absorbency test, contact angle measurement is affected by
fabric structure. Wicking test on the multifilament yarns could have been per-
formed. Results from such a test may be more closely related to changes in the
polymer since any dependence of fabric structure could be excluded.
5.6.2. DSC
It is of importance to point out that only one fabric duplicate for each sample was
characterised using DSC. It would have been preferable to characterise more fabric
duplicates for each sample and thereby establish average values. That would have
created a possibility to statistically analyse the data and to establish if there are any
statistical differences between the reference samples and the dyed samples. Instead,
the data obtained from the DSC has now been used for correlation analysis with the
aim to explain changes in mechanical and moisture related properties.
DSC can provide data on the degree of crystallinity but the degree of orientation
cannot be estimated based on DSC results. The degree of orientation has been
shown to affect both elongation at break and tenacity (Gupta & Kumar 1981c) and
therefore it would be of interest to use methods providing information on this mat-
ter.
5.6.3. FTIR
As stated previously, the results of the FTIR when it comes to trans-gauche cou-
ples are somewhat inconclusive. Raman spectroscopy could possibly bring clarifi-
cation to the FTIR results. These methods are sometimes used as a complement to
one and other.
5.7. RECYCLABILITY OF DYED PET FABRICS One requirement for recycling that the PET polymer should meet is a melting tem-
perature above 240°C (Awaja & Pavel 2005). DSC results show that the melting
temperatures for the fabrics used within this Master thesis remain at or above
252°C after dyeing. Therefore, this requirement could be considered fulfilled.
Considering problematic contaminants the pH-regulator Neutracid BO 45 contain-
ing acetic acid should be discussed. The weight differences observed in both PETC
and PETM suggest that there are auxiliary chemicals present in the fabrics after
dyeing. It has not been investigated if the chemicals are present in the polymers or
at the surface. However, if there are residual auxiliary chemicals in the polymers
these are probably not to be removed by additional washing steps. This could cause
problems since acetic acid act as a catalyst in the chain scission reactions of PET
(Al-Sabagh et al. 2015; Awaja & Pavel 2005) and chain scission reactions are
known to occur during thermo-mechanical recycling of PET.
Based on the results it is difficult to conclude the reason behind the weight increase
observed after dyeing. It is possible that this is due to both increased hydrophilicity
and the presence of auxiliary chemicals. It could also be an effect of changes of the
crystalline fraction, which would show as density changes. The two former expla-
nations could cause problems in recycling. Increased hydrophilicity could probably
be solved with proper pre-drying before re-processing, which is usually done be-

82
fore recycling of bottle-grade PET as well. The potential problem of auxiliary
chemicals may be trickier to solve. It has been demonstrated that dye can be ex-
tracted out of dyed PET fabrics (e.g. Andersson Drugge & Svensson 2016) but
investigations with focus on auxiliary chemicals have not been found. This pro-
vides a route for further research.
It is the author’s opinion that the experimentally obtained results do not provide
conclusive evidence that exhaust dyeing negatively affects the possibility to recy-
cle PET textiles through thermo-mechanical methods. The changes observed due to
exhaust dyeing are not as evident as expected. Chain scission is indicated by the
decreased mechanical properties, crystallisation behaviour, and FTIR results and
this could potentially be problematic in a thermo-mechanical recycling process.
Since research on thermo-mechanical recycling of fibre-grade PET is limited it is
somewhat difficult to connect the results obtained through this work actual recy-
cling. It is believed that this Master thesis provides good information that should be
further researched in the context of thermo-mechanical recycling, in order to find
correlations between the observed changes and possible problems in a re-melt
spinning process.
When it comes recycling of post-consumer textile waste it is important to under-
stand that the dyeing process is just one factor that can affect the recyclability. This
research contributes to this area but further research regarding other processes as
well as exposure to possibly degrading situations is required. The dyeing process
alone cannot be pointed out as the reason why thermo-mechanical fibre-to-fibre
recycling is not used.

83
6. CONCLUSIONS In this section the research question are answered one by one, leading to a conclu-
sion presented in the end of the section.
- Is the polymer structure of PET affected by exhaust dyeing? If so, how is
the polymer structure affected? Can any dyeing parameters be identified
as critical?
Changes in heat of crystallisation as well as in heat of melting indicate that the
polymer structure is somewhat affected by the exhaust dyeing process. The results
indicate that the crystallisation rate has increased due to dyeing. This could be due
to formation of shorter chains during dyeing. The most obvious changes are ob-
served in samples dyed in the bath containing all auxiliary chemicals. Similar
changes are observed for all temperatures and exposure times. Therefore, it is sug-
gested that the bath composition and hence the auxiliary chemicals is one critical
factor considering how the polymer structure is affected.
The changes in spectral data also indicate that dyeing affects the polymer structure.
The spectral data indicate chain scission, but it should be mentioned that the differ-
ences have not been statistically evaluated. For both fabrics the most obvious
changes are observed in the samples dyed at 135°C for 60 minutes, five dyeing
cycles, in the bath containing all auxiliary chemicals. Negative correlations be-
tween exposure time above Tg and absorbance ratio (1712/1409) has been found
significant showing that the exposure time is also a critical factor, possibly affect-
ing chain scission.
- Are the tensile properties of PET affected by exhaust dyeing? If so, how
are the properties affected and which dyeing parameters are critical?
After exposure to exhaust dyeing breaking strength, elongation at break and
Young’s modulus are in some samples significantly different from the reference
samples.
Considering breaking strength, decreasing trends have been observed in both PETC
and PETM samples exposed to multiple dyeing cycles at 135°C. Based on the corre-
lation analyses it can be concluded that the exposure time above Tg seem to be a
critical factor negatively affecting breaking strength and elongation at break for the
investigated microfibre PET. No significant correlation could be found for PETC.
- Are the surface characteristics of PET affected by exhaust dyeing? If so,
how are the properties affected and which dyeing parameters are critical?
The surface characteristics in terms of demand absorbency capacity and maximum
absorption rate have been affected by exhaust dyeing. The changes in DAC were
shown to differ between the two different filaments. For PETC, the DAC increased
due to dyeing while for PETM the DAC decreased due to dyeing. The filament titer
seems to be a critical factor when considering this parameter.
Increased dyeing temperature resulted in higher DAC in PETC but in lower DAC
for PETM. These correlations were statistically significant. Therefore, it is sug-
gested that in addition to filament titer, dyeing temperature is also a critical factor.

84
- Are any changes induced by the exhaust dyeing process related to fila-
ment titer?
Filament titer seems to be related to changes induced by exhaust dyeing consider-
ing specific properties. First, the changes in demand absorbency properties seem to
be related to filament titer. Second, changes in the spectral data regarding the car-
bonyl bonds are more evident and conclusive in PETC samples, the PET with the
larger filament titer. However, changes in the spectral data (wavenumber 2800 cm-1
to 3000 cm-1
) are only observed in PETM, the PET with the smaller filament titer.
Both of these observations indicate chain scission. And third, the changes observed
in crystallisation behaviour are more prominent in the samples with a larger fila-
ment titer.
- Can changes induced by exhaust dyeing negatively affect the possibility to
recycle PET textiles through a thermo-mechanical process?
It is the author’s opinion that the results do not provide clear evidence that the ex-
haust dyeing process leads to changes that would negatively affect thermo-
mechanical recycling. More research is needed in order to completely answer this
research question.
The main purpose of this Master thesis is to investigate if exhaust dyeing of PET
compromises the possibility of thermo-mechanical recycling. The hypothesis that
this Master thesis is based on is: The polymer structure of PET is affected by the
exhaust dyeing process to such an extent that re-melt spinning is compromised.
Changes have been observed due to dyeing, however these changes were not as
large as expected. It is therefore concluded that the results does not provide conclu-
sive evidence that supports the hypothesis. Yet again, changes indicating degrada-
tion has been observed and it is the author’s opinion that the hypothesis should not
be rejected without further research. It should also be noted that the exposure time
above Tg and the auxiliary chemicals seem to be important factors considering
chain scission. Therefore, it is suggested that multiple dyeing cycles should be
applied with caution since this increases the exposure time as well as the exposure
to auxiliary chemicals.

85
7. FUTURE RESEARCH There are several different routes for further research, and these are presented in
the upcoming sections.
7.1. VARIETY OF PROCESSING CONDITIONS AND MATERIALS Even though many parameters have been investigated in this Master thesis there
are still interesting factors to look into. One additional parameter to look into
would be reduction clearing and how this affects the properties of dyed fabrics
exposed to different dyeing conditions. It would also be interesting to see if reduc-
tion clearing has any effects on the demand absorbency properties.
It would als be interesting to investigate multiple dyeing cycles in a bath contain-
ing only pH-regulator and in a bath containing pH-regulator and levelling agent.
This could further clarify the role of the auxiliary chemicals in the dyeing-induced
changes of PET.
Another parameter to investigate would be mixed material fabrics. PET fibres are
often mixed with other materials, e.g. cotton, and if these materials are dyed in
form of fabrics the PET fibres are exposed to the dyeing conditions of cotton and
vice versa. In dyeing of PET fabrics the dye bath is kept at pH between 4.5 and 6.
Dyeing of cotton however, is carried out in alkaline conditions.
7.2. RE-MELT SPINNING OF DYED FABRICS The results of this Master thesis have not provided clear evidence on if dyeing
compromise the possibility of thermo-mechanical recycling. Therefore, an obvious
route for further recycling would be to perform re-melt spinning of dyed fabric
samples. Such a research could possibly establish correlations between dyeing
parameters and the result of re-melt spinning. It would be of interest to investigate
if and how the auxiliary chemicals react and interfere in a recycling process like re-
melt spinning. The auxiliary chemicals may cause harm in such a process since the
process temperatures are higher than dyeing temperatures.
7.3. FURTHER CHARACTERISATION It has been shown that changes arising due to thermal treatment after the primary
crystallisation can depend on if the fabric is in a taut or a relaxed state during the
treatment. During the exhaust dyeing the fabrics are considered to be in a relaxed
state and therefore they may shrink. This would in extent possibly affect the tensile
properties of the yarns and therefore it would be of interest to investigate shrinkage
due to dyeing. Perhaps correlations between shrinkage and tensile properties as
well as processing parameters could be established.
Melt viscosity is considered an important property when PET products are to be
recycled, therefore it would be of great interest to investigate if this is affected by
dyeing or if residual chemicals from dyeing may affect this property.
It would be of great interest to determine the MW of the dyed samples compared to
the reference. The DSC result showed changes in the crystallisation peaks after
dyeing, and this may be due to chain scission. Also, the FTIR results indicate that

86
chain scission may have occurred. Measurement of the MW and MW distribution
would bring clarity to these results.
7.3.1. CHARACTERISATION OF OLIGOMERS
As stated in the literature review, PET oligomers can be formed due to degrading
chain scission reactions. It has also been observed that dyeing conditions do affect
the quantity of oligomers in PET fabrics (Recelj, Gorenšek & Žigon 2002). There-
fore, it would be interesting to study if oligomer distribution differs between the
PET samples exposed to the different dyeing conditions. Since the cyclic trimer
content seems to be approximately constant even after re-processing (Dulio et al.
1994) it is suggested that other oligomers are to be studied, e.g. larger linear oli-
gomers which have been suggested to indicate degradation. It would be interesting
to investigate this with the aim to find correlations to the results presented in this
thesis that indicate degradation.
Considering the cyclic oligomers, the author suggests that SEM should be used to
study the presence of cyclic oligomers on the fibre surface after dyeing. It has been
shown that the presence of such oligomers may affect moisture related properties.
Therefore, further research regarding oligomer on the fibre surface could help ex-
plain the changes in moisture related properties that have been observed in this
work.

87
REFERENCE LIST Al-Azzawi, F. (2015). Degradation Studies on Recycled Polyethylene Tereph-
thalate. Doctoral Thesis, The London Metropolitan University. London: London
Metropolitan University.
Albertsson, A-C., Edlund, U. & Odelius, K. (2012). Polymerteknologi –
Makromolekulär design. Stockholm: Kunliga Tekniska Högskolan. ISBN: 978-91-
7415-449-8.
Allen. N. S., Edge, M. & Mohammadian, M. (1991). Hydrolytic Degradation of
Poly(ethylene terephthalate): Importance of Chain Scission Versus Crystallinity.
European Polymer Journal, 27(12), pp. 1737-1738.
Al-Sabagh, A. M., Yehia. F. Z., Eshaq, Gh., Rabie, A. M. & ElMetwally, A. E.
(2015). Greener routes for recycling of polyethylene terephthalate. Egyptian Jour-
nal of Petroleum, 25(1), pp. 53-64. DOI:
http://dx.doi.org/10.1016/j.ejpe.2015.03.001
Andersson Drugge, G. & Svensson, L. (2016). Tillsatser i polyestertextil.
Avlägsnanade av dispersionsfärg inför mekanisk återvinning genom omsmältning.
Bachelor Thesis, The Swedish School of Textiles. Borås: University of Borås.
http://hb.diva-portal.org/smash/get/diva2:951942/FULLTEXT01.pdf
Assadi, R., Colin, X. & Verdu, J. (2004). Irreversible structural changes during
PET recycling by extrusion. Polymer, 45(13), pp. 4403-4412. DOI:
doi:10.1016/j.polymer.2004.04.029
Awaja, F. & Pavel, D. (2005). Recycling of PET. European Polymer Journal,
41(7), pp. 1453-1477. DOI: doi:10.1016/j.eurpolymj.2005.02.005
Badia, J. D., Vilaplana, F., Karlsson, S. & Ribes-Greus, A. (2009). Thermal analy-
sis as a quality tool for assessing the influence of thermo-mechanical degradation
on recycled poly(ethylene terephthalate). Polymer Testing, 28(2), pp. 169-175.
Badia, J. D., Strömberg, E., Karlsson, S. & Ribes-Greus, A. (2012). The role of
crystalline, mobile amorphous and rigid amorphous fractions in the performance of
recycled poly (ethylene terephthalate) (PET). Polymer Degradation and Stability,
97(1), pp. 98-107. DOI: https://doi.org/10.1016/j.polymdegradstab.2011.10.008
Baliga, S. & Wong, W. T. (1989). Depolymerization of Poly(ethylene Tereph-
thalate) Recycled from Post-Consumer Soft-Drink Bottles. Journal of Polymer
Science: Part A: Polymer Chemistry, 27(6), pp. 2071-2082. https://doi-
org.lib.costello.pub.hb.se/10.1002/pola.1989.080270625
Bellini, P., Bonetti, F., Franzetti, E., Rosace, G. & Vago, S. (2006). Finishing Tex-
tile Reference Book for Technologies. 3rd
ed. Milano: ACIMIT Fondazatione.
Britannica Academic (2016). Hydrolysis.
http://academic.eb.com/levels/collegiate/article/hydrolysis/41741 [2018-02-16]

88
Burgoyne, C. J. & Merii, A. L. (2007). On the hydrolytic stability of polyester
yarns. Journal of Material Science, 42(8), pp. 2867-2878. DOI 10.1007/s10853-
006-1360-5
Burkinshaw, S. M. (1995). Chemical Principles of Synthetic Fibre Dyeing. Dor-
drecht: Springer Science+Business Media. DOI 10.1007/978-94-011-0593-4
Burkinshaw, S. M. (2015). Polyester Fibres. In: Theoretical Aspects of Textile Col-
oration. Wiley. pp. 716-862.
Chen, Z., Hay, J. N. & Jenkins, M. J. (2012). FTIR spectroscopic analysis of
poly(ethylene terephthalate) on crystallization. European Polymer Journal, 48(9),
pp. 1586-1610. DOI: https://doi.org/10.1016/j.eurpolymj.2012.06.006
Cimecioglu, A. L., Zeronian, S. H., Alger, K. W. & Collins, M. J. (1986). Proper-
ties of Oligomer Present in Poly(ethylene Terephthalate). Journal of Applied Poly-
mer Science, 32(4), pp. 4719-1733. DOI:
https://doi.org/10.1002/app.1986.070320436
Chakraborty, J. N. (2010). Dyeing with disperse dyes. In: Fundamentals and Prac-
tices in Colouration of Textiles, pp. 192-201.
Clark, M. (2011). Fundamental principles of dyeing. In: Clark. M. (ed.) Handbook
of Textile and Industrial Dyeing. Volume 1: Principles. processes and types of
dyes. Woodhead Publishing Limited, pp. 3-27. ISBN: 978-1-84569-695-5
Collins, M. J. & Zeronian, S. H. (1992). The Molecular Weight Distribution and
Oligomers of Sodium Hydroxide Hydrolyzed Poly(ethylene terephthalate). Journal
of Applied Polymer Science, 45(5), pp. 797-804. DOI: https://doi-
org.lib.costello.pub.hb.se/10.1002/app.1992.070450505
Cowie, J. M. G. & Arrighi, V. (2008). Structure-Property Relations. In: Polymers:
Chemistry and Physics of Modern Materials. 3rd
ed. Boca Raton: CRC Press Taylor
& Francis Group, pp. 409-454. ISBN: 978-0-8493-9813-1.
Donelli, I., Freddi, G., Nierstrasz, V. A. & Taddei, P. (2010). Surface structure and
properties of poly-(ethylene terephthalate) hydrolyzed by alkali and cutinase. Pol-
ymer Degradation and Stability. 95(9), pp. 1542-1550.
Du, B., Yang, R. & Xie, X-M. (2014). Investigation of Hydrolysis in Poly(ethylene
terephthalate) by FTIR-ATR. Chinese Journal of Polymer Science, 32(2), pp. 230-
235.
Dulio, V., Po, R., Borrelli, R., Guarini, A. & Santini, C. (1994) Characterization of
low-molecular-weight oligomers in recycled poly(ethylene terephthalate). Die An-
gewandte Makromolekulare Chemie, 225, pp.109-122.
Dutt, K. & Soni, R. K. (2013). A Review on Synthesis of Value Added Products
from Polyethylene Terephthalate (PET) Waste. Polymer Science, Series B, 55(7-8),
pp. 430-452. DOI: DOI: 10.1134/S1560090413070075

89
European Committee of Standardization (CEN) (2002). EN ISO 9073-12:2002
Textiles -- Test methods for nonwovens – Part 12: Demand absorbency. Brussels:
CEN.
Farah, S., Kunduru, K. R., Basu, A. & Domb, A. J. (2015). Molecular Weight De-
termination of Polyethylene Terephthalate. In: Visakh, P. M. and Liang, M. (ed.)
Poly(Ethylene Terephthalate) Based Blends. Composites and Nanocomposites.
Elsevier Inc., pp. 143-165. DOI: http://dx.doi.org/10.1016/B978-0-323-31306-
3.00008-7
Gok, A. (2016). DEGRADATION PATHWAY MODELS OF POLY(ETHYLENE-
TEREPHTHALATE) UNDER ACCELERATED WEATHERING EXPOSURES.
Doctoral Thesis, Department of Materials and Science Engineering. Cleveland:
Case Western Reserve University.
Gulrajani, M. L. (2008). Advances in coloration of polyester textiles. In: Deopura.
B. L., Alagirusamy. R., Joshi, M. and Gupta, B. (ed.) Polyesters and Polyamides.
Woodhead Publishing Limited, pp. 279-305. ISBN: 978-1-84569-298-8
Gulrajani, M. L., Saxena, R. K. & Sengupta, A. K. (1979). Effect of Dye-Polymer
Interaction of the Stress-Strain Characteristics of Dyed Polyethylene Terephthalate
Fiber. Textile Research Journal, 49(8), pp. 474-476. DOI:
10.1177/004051757904900807
Gulrajani, M. L., Saxena, R. K. & Sengupta, A. K. (1980). Dye-Induced Structural
Changes and Mechanical Properties of Poyethylene Terephthalate Fibers. Textile
Research Journal, 50(10), pp. 589-591. DOI: 10.1177/004051758005001002
Guo, Z., Lindqvist, K. & de la Motte, H. (2018). An efficient recycling process of
glycolysis of PET in the presence of a sustainable nanocatalyst. Journal of Applied
Polymer Science, 135(21), pp. 46285. DOI: https://doi.org/10.1002/app.46285
Gupta, M., Bandi, S. A., Mehta, S. & Schiraldi, D. A. (2008). Decolorization of
colored poly(ethylene terephthalate) bottle flakes using hydrogen peroxide. Journal
of Applied Polymer Science, 107(5), pp. 3212-3220. DOI: https://doi-
org.lib.costello.pub.hb.se/10.1002/app.27468
Gupta, V. B. & Kumar, S. (1981a). The Effect of Heat Setting on the Structure and
Mechanical Properties of Poly(ethylene terephthalate) Fiber. I. Structural Changes.
Journal of Applied Polymer Science, 26(6), pp. 1865-1876.
Gupta, V. B. & Kumar, S. (1981b). The Effect of Heat Setting on the Structure and
Mechanical Properties of Poly(ethylene terephthalate) Fiber. II. The Elastic Modu-
lus and Its Dependence on Structure. Journal of Applied Polymer Science, 26(6),
pp. 1877-1884.
Gupta, V. B. & Kumar, S. (1981c). The Effect of Heat Setting on the Structure and
Mechanical Properties of Poly(ethylene terephthalate) Fiber. IV. Tensile Properties
Other Than Modulus and Their Dependence on Structure. Journal of Applied Pol-
ymer Science, 26(6), pp. 1897-1905.
90
Grishanov, S. (2011). Structure and properties of textile materials. In: Clark. M.
(ed.) Handbook of Textile and Industrial Dyeing. Volume 1: Principles. processes
and types of dyes. Woodhead Publishing Limited, pp. 28-36. ISBN: 978-1-84569-
695-5
Hosseini, S. S., Taheri, S., Zadhoush, A. & Mehrabani-Zeinabad, A. (2007) Hydro-
lytic Degradation of Poly(ethylene terephthalate). Journal of Applied Polymer Sci-
ence, 103(4), pp. 2304-2309. DOI: 10.1002/app.24142
ICIS (2007). Polyethylene Terephthalate (PET) Uses and Market Data.
https://www.icis.com/resources/news/2007/11/06/9076426/polyethylene-
terephthalate-pet-uses-and-market-data/ [2018-02-25]
Jabarin, S. A. & Lofgren, E. A. (1984). Thermal Stability of Polyethylene Tereph-
thalate. Polymer Engineering and Science, 24(13), pp. 1056-1063.
Lee, J. H., Lim, K. S., Hahm, W. G. & Kim, S. H. (2012). Properties of Recycled
and Virgin Poly(ethylene terephthalate) Blend Fibers. Journal of Applied Polymer
Science, 128(2), pp. 1250-1256. DOI: 10.1002/app.38502
Lee, S. H. & Song, W. S. (2010). Surface Modification of Polyester Fabrics by
Enzyme Treatment. Fibers and Polymers, 11(1), pp 54-59. DOI: 10.1007/s12221-
010-0054-4
López, M. M. C., Ares Pernas, A. I., Abad López, J., Lasagabaster Latorre, A.,
López Vilariño, J. M. & González Rodríguez, V. (2014). Assessing changes on
poly(ethylene terephthalate) properties after recycling: Mechanical recycling in
laboratory versus postconsumer recycled material. Materials Chemistry and Phys-
ics, 147(3), pp. 884-894. DOI: https://doi.org/10.1016/j.matchemphys.2014.06.034
Makkam, S. & Harnnarongchai, W. (2014). Rheological and Mechanical Properties
of Recycled PET Modified by Reactive Extrusion. Energy Procedia, 56, pp. 547-
553. DOI: doi: 10.1016/j.egypro.2014.07.191
McMahon, W., Birdsall, H. A., Johnson, G. R. & Camilli, C. T. (1959) Degrada-
tion Studies of Polyethylene Terephthalate. Journal of Chemical & Engineering
Data, 4(1), pp. 57-79. DOI: 10.1021/je60001a009
Minitab Express Support (2016). Interpret the key results for Correlation.
http://support.minitab.com/en-us/minitab-express/1/help-and-how-to/modeling-
statistics/regression/how-to/correlation/interpret-the-results/ [2018-05-11]
Miyake, A. (1959). The Infrared Spectrum of Polyethylene Terephthalate. I. The
Effect of Crystallization. Journal of Polymer Science, 38(134), pp. 479-495. DOI:
https://doi.org/10.1002/pol.1959.1203813419
Oekotex (2011). Polyester – to recycle or not to recycle?.
https://oecotextiles.wordpress.com/2011/01/12/recycled-polyester-to-recycle-or-
not-to-recycle/ [2018-02-25]

91
Oromiehie, A. & Mamixadeh, A. (2004). Recycling PET beverage bottles and im-
proving properties. Polymer International, 53(6), pp. 728-732. DOI:
https://doi.org/10.1002/pi.1389
Park, S. H. & Kim, S. H. (2014). Poly (ethylene terephthalate) recycling for value
added textiles. Fashion and Textiles, 1(1). DOI:
https://link.springer.com/article/10.1186/s40691-014-0001-x
Pirzadeh, E., Zadhoush, A. & Haghighat, M. (2007). Hydrolytic and Thermal Deg-
radation of PET Fibres and PET Granule: The Effects of Crystallization. Tempera-
ture. and Humidity. Journal of Applied Polymer Science, 106(3), pp. 1544-1549.
DOI: 10.1002/app.26788
Plastic Insight (2017). Polyethylene Terephthalate (PET): Production. Price. Mar-
ket and its Properties. https://www.plasticsinsight.com/resin-intelligence/resin-
prices/polyethylene-terephthalate/ [2018-02-25]
Ragaert, K., Delva, L. & Van Geem, K. (2017). Mechanical and chemical recy-
cling of solid plastic waste. Waste Management, 69, pp. 24-58.
Raven, D. A. S. & Ward, J. M. (1961). Chemical reactivity of polyethylene tereph-
thalate. Hydrolysis and esterification reactions in the solid phase. Transactions of
the Faraday Society, 57, pp. 150-159. DOI: 10.1039/TF9615700150
Recelj, P., Gorenšek, M. & Žigon, M. (2002). The Influence of Treatment Condi-
tions on the Quantity and Composition of Oligomers Extracted from Polyester
Fabric. Textile Research Journal, 72(5), pp. 447-453.
Richards, P. R. (2015). Fabric Finishing: Dyeing and Colouring. In: Sinclair. R.
(ed.). Textiles and Fashion. Materials. Design and Technology. Woodhead Pub-
lishing Limited, pp. 475-505. ISBN: 978-1-84569-931-4
Roy Choudhury, A. K. (2011). Dyeing of synthetic fibres. In: Clark. M. (ed.)
Handbook of Textile and Industrial Dyeing. Applications of Dyes. Woodhead Pub-
lishing Limited, pp. 40-128. ISBN 978-0-85709-491-9
Sammon, C., Yarwood, J. & Everall, N. (2000). An FT-IR study of the effect of
hydrolytic degradation on the structure of thin PET films. Polymer Degradation
and Stability, 67(1), pp. 149-158.
Sanders, E. M. & Zeronian, H. (1982). An Analysis of the Moisture-Related Prop-
erties of Hydrolyzed Polyester. Journal of Applied Polymer Science, 27(11), pp.
4477-4491. DOI: https://doi.org/10.1002/app.1982.070271135
Shukla, S. R. & Harad, A. M. (2006). Aminolysis of polyethylene terephthalate
waste. Polymer Degradation and Stability, 91(8), pp. 1850-1854. DOI:
doi:10.1016/j.polymdegradstab.2005.11.005
Smole, M. S. & Zipper, P. (2002). The influence of different treatment media on
the structure of PET fibres. Materials Research Innovations, 6(2), pp. 55-64. DOI:
https://doi.org/10.1007/s10019-002-0173-7

92
Siesler, H. W. (2012). Vibrational Spectroscopy. Polymer Science: A Comprehen-
sive Reference, 2, pp. 255-300.
Textile Exchange (2017). Preferred Fiber & Materials Market Report 2017.
https://textileexchange.org/downloads/2017-preferred-fiber-materials-market-
report/
Torres, N., Robin, J. J. & Boutevin, B. (2000). Study of thermal and mechanical
properties of virgin and recycled poly(ethylene terephthalate) before and after in-
jection molding. European PolymerJournal, 36(10), pp. 2075-2080. DOI:
https://doi.org/10.1016/S0014-3057(99)00301-8
Vadicherla, T. & Saravanan, D. (2014). Textiles and Apparel Development Using
Recycled and Reclaimed Fibres. In: Muthu, S. S. (ed.). Roadmap to Sustainable
Textiles and Clothing: Eco-friendly Raw Materials, Technologies, and Processing
Methods. Springer, pp. 139-160. https://doi.org/10.1007/978-981-287-065-0_5
Vavilova, S. Y., Prorokova, N. P. & Kalinnikov, Y. A. (2003). The Problem of
Cyclic Oligomers in Dyeing and Processing of Polyester and Ways of Solving It.
Fibre Chemistry, 2, pp. 35-37.
Venkatachalam, S., Nayak, S. G., Labde, J. V., Gharal, P. R., Rao, K. & Kelkar, A.
K. (2012). Degradation and Recyclability of Poly (Ethylene Terephthalate). In:
Saleh. H. E-D. M. (ed.). Polyester. InTech., pp. 75-98. DOI: 10.5772/48612
Welle, F. (2011). Twenty years of PET bottle to bottle recycling – An overview.
Resources. Conservation and Recycling, 55(11), pp.865-875. DOI:
https://doi.org/10.1016/j.resconrec.2011.04.009
Wu, B., Wu, Z., Wang, S. & Gan, S. (2014). Recycled waste polyester textiles
decoloration by DMSO. Journal of Textile Research, 35(4), pp.84- 87.
http://www.fzxb.org.cn/EN/Y2014/V35/I4/84
Zimmerman, H. & Kim, N. T. (1980). Investigations of Thermal and Hydrolytic
Degradation of Poly (Ethylene Terephthalate). Polymer Engineering and Science,
20(10), pp. 680-683.

93
Appendix I. TUKEY TEST: BREAKING
STRENGTH FOR PETC Tukey Pairwise Comparisons
Grouping Information Using the Tukey Method and 95% Confidence
Factor N Mean Grouping
PETC T1 d 60 20 6,7000 A
PETC T2 p 30 20 6,6980 A
PETC T2 l 30 20 6,6855 A
PETC T1 p 30 20 6,6785 A
PETC Ref 20 6,6695 A
PETC T3 p 30 20 6,6690 A
PETC T1 p 180 20 6,6335 A
PETC T1 l 30 20 6,6275 A
PETC T1 l 60 20 6,6225 A
PETC T2 d 30 20 6,6220 A
PETC T1 d 180 20 6,6080 A
PETC T1 p 60 20 6,5855 A
PETC T3 l 30 20 6,5785 A
PETC T2 l 180 20 6,5785 A
PETC T3 d 60 20 6,5760 A
PETC T1 l 180 20 6,5660 A
PETC T1 d 60×5 20 6,5250 A
PETC T3 p 60 20 6,521 A B
PETC T2 d 180 20 6,521 A B
PETC T1 d 30×5 20 6,5085 A B
PETC T1 d 60×3 20 6,4865 A B
PETC T1 d 30 20 6,4770 A B
PETC T3 l 60 20 6,461 A B
PETC T1 d 30×3 20 6,4585 A B C
PETC T3 d 30×3 20 6,4480 A B C
PETC T3 p 180 20 6,4425 A B C
PETC T2 p 180 20 6,4335 A B C
PETC T3 l 180 20 6,4265 A B C
PETC T3 d 60×3 20 6,4215 A B C
PETC T3 d 30 20 6,4145 A B C
PETC T3 d 30×5 20 6,4125 A B C
PETC T3 d 180 20 6,3620 A B C
PETC T3 d 60×5 20 6,1680 B C
PETC T2 p 60 20 6,106 C
PETC T2 d 60 20 5,3410 D
PETC T2 l 60 20 5,1475 D
Means that do not share a letter are significantly different. The
reference is marked in bold. Samples significantly different from
the reference are marked in italic.

94
Appendix II. TUKEY TEST: BREAKING
STRENGTH FOR PETM Tukey Pairwise Comparisons
Grouping Information Using the Tukey Method and 95% Confidence
Factor N Mean Grouping
PETM Ref 20 4,8455 A
PETM T1 l 30 20 4,8130 A B
PETM T1 l 60 20 4,8000 A B
PETM T3 d 30 20 4,7850 A B C
PETM T1 d 30 20 4,7845 A B C
PETM T3 l 30 20 4,7815 A B C
PETM T1 d 60×5 20 4,7760 A B C D
PETM T2 d 180 20 4,7645 A B C D
PETM T1 d 30×5 20 4,7590 A B C D E
PETM T1 l 180 20 4,7540 A B C D E
PETM T2 d 60 20 4,7495 A B C D E
PETM T1 p 60 20 4,7450 A B C D E
PETM T2 l 60 20 4,7365 A B C D E
PETM T2 d 30 20 4,7305 A B C D E
PETM T1 p 30 20 4,7300 A B C D E
PETM T2 l 180 20 4,7300 A B C D E
PETM T2 l 30 20 4,7290 A B C D E
PETM T2 p 180 20 4,7285 A B C D E
PETM T2 p 30 20 4,7240 A B C D E
PETM T3 d 60 20 4,7185 A B C D E
PETM T1 d 30×3 20 4,7175 A B C D E
PETM T3 p 30 20 4,7140 A B C D E
PETM T1 d 60 20 4,7120 A B C D E
PETM T3 p 60 20 4,7060 A B C D E F
PETM T3 d 30×3 20 4,6890 A B C D E F
PETM T1 d 180 20 4,6885 A B C D E F
PETM T1 d 60×3 20 4,6790 A B C D E F
PETM T1 p 180 20 4,6340 A B C D E F G
PETM T3 l 60 20 4,6060 B C D E F G H
PETM T3 d 30×5 20 4,5840 C D E F G H
PETM T2 p 60 20 4,573 C D E F G H
PETM T3 p 180 20 4,5625 D E F G H
PETM T3 d 60×3 20 4,5480 E F G H
PETM T3 d 180 20 4,4930 F G H
PETM T3 l 180 20 4,4445 G H
PETM T3 d 60×5 20 4,4125 H
Means that do not share a letter are significantly different. The
reference is marked in bold. Samples significantly different from
the reference are marked in bold italic.

95
Appendix III. TUKEY TEST: ELONGATION AT
BREAK FOR PETC
Tukey Pairwise Comparisons
Grouping Information Using the Tukey Method and 95% Confidence
Factor N Mean Grouping
PETCT3d60 20 20,115 A
PETCT3l180 20 19,820 A B
PETCT3l60 20 19,780 A B
PETCT3p30 20 19,690 A B C
PETCT3p60 20 19,430 A B C D
PETCT2l180 20 19,385 A B C D
PETCT3l30 20 19,370 A B C D
PETCT3d60×3 20 19,310 A B C D
PETCT3p180 20 19,275 A B C D E
PETC Ref 20 19,265 A B C D E
PETCT2l30 20 19,210 A B C D E
PETCT1p30 20 19,185 A B C D E
PETCT1p180 20 19,080 A B C D E F
PETCT2p30 20 19,050 A B C D E F G
PETCT1d180 20 19,020 A B C D E F G
PETCT2d180 20 19,005 A B C D E F G
PETCT1l60 20 18,915 A B C D E F G H
PETCT3d180 20 18,890 A B C D E F G H
PETCT2p180 20 18,815 A B C D E F G H
PETCT1l180 20 18,780 A B C D E F G H
PETCT1p60 20 18,760 A B C D E F G H
PETCT1d60 20 18,720 B C D E F G H
PETCT3d30×5 20 18,705 B C D E F G H
PETCT3d30 20 18,680 B C D E F G H
PETCT3d30×3 20 18,645 B C D E F G H
PETCT2d30 20 18,630 B C D E F G H
PETCT1l30 20 18,625 B C D E F G H
PETCT3d60×5 20 18,515 B C D E F G H
PETCT2p60 20 18,400 C D E F G H
PETCT1d30 20 18,205 D E F G H I
PETCT1d60×5 20 17,935 E F G H I
PETCT1d30×3 20 17,785 F G H I
PETCT1d60×3 20 17,770 F G H I
PETCT1d30×5 20 17,700 G H I
PETCT2d60 20 17,620 H I
PETCT2l60 20 16,995 I
Means that do not share a letter are significantly different. The
reference is marked in bold. Samples significantly different from
the reference are marked in bold italic.

96
Appendix IV. TUKEY TEST: ELONGATION AT
BREAK FOR PETM
Tukey Pairwise Comparisons
Grouping Information Using the Tukey Method and 95% Confidence
Factor N Mean Grouping
PETM T3 p 30 20 26,515 A
PETM T3 l 30 20 26,460 A B
PETM T1 l 60 20 26,315 A B C
PETM T2 l 30 20 26,250 A B C D
PETM T2 d 60 20 26,215 A B C D
PETM T3 d 30×3 20 26,080 A B C D E
PETM T2 d 180 20 26,075 A B C D E
PETM T2 p 30 20 26,035 A B C D E
PETM T2 d 30 20 26,015 A B C D E
PETM T2 l 60 20 25,995 A B C D E
PETM T3 d 30 20 25,950 A B C D E F
PETM T2 p 180 20 25,820 A B C D E F
PETM T1 p 60 20 25,730 A B C D E F
PETM T3 p 60 20 25,620 A B C D E F G
PETM T1 p 180 20 25,575 A B C D E F G
PETM T1 l 180 20 25,497 A B C D E F G H
PETM T1 d 30×3 20 25,385 A B C D E F G H
PETM T1 d 30 20 25,375 A B C D E F G H
PETM T1 d 60×5 20 25,310 A B C D E F G H
PETM T1 d 60 20 25,205 A B C D E F G H
PETM T3 l 60 20 25,180 A B C D E F G H
PETM T3 d 60 20 25,155 A B C D E F G H
PETM T1 d 30×5 20 25,150 A B C D E F G H
PETM T3 d 30×5 20 25,090 A B C D E F G H
PETM T3 d 60×3 20 25,080 A B C D E F G H
PETM T3 p 180 20 24,970 A B C D E F G H I
PETM T2 l 180 20 24,735 A B C D E F G H I
PETM T1 d 180 20 24,730 A B C D E F G H I
PETM Ref 20 24,690 B C D E F G H I
PETM T1 d 60×3 20 24,510 C D E F G H I
PETM T2 p 60 20 24,470 D E F G H I
PETM T1 l 30 20 24,295 E F G H I
PETM T3 l 180 20 24,180 F G H I
PETM T1 p 30 20 23,910 G H I
PETM T3 d 180 20 23,715 H I
PETM T3 d 60×5 20 23,260 I
Means that do not share a letter are significantly different. The
reference is marked in bold. Samples significantly different from
the Reference are marked in bold italic.

97
Appendix V. TUKEY TEST: YOUNG’S MODU-
LUS FOR PETC Tukey Pairwise Comparisons
Grouping Information Using the Tukey Method and 95% Confidence
Factor N Mean Grouping
PETC T2 p 30 20 0,05038 A
PETC T1 l 60 20 0,04979 A
PETC T1 l 30 20 0,04944 A
PETC T1 p 180 20 0,04795 A B
PETC T1 l 180 20 0,04782 A B
PETC T3 p 180 20 0,04689 A B C
PETC T1 d 30 20 0,04680 A B C
PETC T3 d 180 20 0,04458 A B C D
PETC T3 p 60 20 0,04272 A B C D E
PETC T3 d 30×3 20 0,04250 A B C D E F
PETC T3 d 60×5 20 0,04134 B C D E F G
PETC T2 d 60 20 0,03992 B C D E F G H
PETC T1 d 30×3 20 0,03951 C D E F G H
PETC T1 d 60 20 0,039419 C D E F G H
PETC T2 p 60 20 0,03925 C D E F G H
PETC T1 d 60×3 20 0,03906 C D E F G H
PETC T1 d 60×5 20 0,03746 D E F G H I
PETC T3 p 30 20 0,03726 D E F G H I
PETC T2 d 180 20 0,03723 D E F G H I
PETC T2 p 180 20 0,03657 D E F G H I J
PETC T3 d 60×3 20 0,03644 E F G H I J
PETC T2 l 60 20 0,03616 E F G H I J
PETC T3 d 30 20 0,036067 E F G H I J
PETC T3 l 180 20 0,03520 E F G H I J
PETC T3 d 60 20 0,03464 F G H I J
PETC T1 d 30×5 20 0,03451 F G H I J
PETC T3 d 30×5 20 0,03428 G H I J
PETC T2 d 30 20 0,03422 G H I J
PETC T2 l 30 20 0,03410 G H I J
PETC T3 l 60 20 0,03404 G H I J
PETC T3 l 30 20 0,03331 G H I J
PETC T1 p 60 20 0,033190 H I J
PETC T1 p 30 20 0,03052 I J
PETC T2 l 180 20 0,03023 I J
PETC Ref 20 0,030075 I J
PETC T1 d 180 20 0,02906 J
Means that do not share a letter are significantly different. The
reference is marked in bold. Samples significantly different from
the reference are marked in bold italic above.

98
Appendix VI. TUKEY TEST: YOUNG’S MODU-
LUS FOR PETM Tukey Pairwise Comparisons
Grouping Information Using the Tukey Method and 95% Confidence
Factor N Mean Grouping
PETM T2 p 180 20 0,06985 A
PETM T1 d 60 20 0,06918 A B
PETM T1 d 60*5 20 0,06493 A B C
PETM T2 p 30 20 0,06386 A B C D
PETM T3 d 30*3 20 0,06378 A B C D
PETM T2 l 60 20 0,06361 A B C D
PETM T2 p 60 20 0,06272 A B C D E
PETM T2 l 180 20 0,05989 A B C D E F
PETM T1 d 60*3 20 0,05980 A B C D E F
PETM T3 d 180 20 0,05925 A B C D E F G
PETM T3 d 30 20 0,05744 A B C D E F G H
PETM T1 d 180 20 0,05608 A B C D E F G H I
PETM T3 p 30 20 0,05600 A B C D E F G H I
PETM T3 d 60 20 0,05548 A B C D E F G H I
PETM T3 p 180 20 0,05533 A B C D E F G H I
PETM T2 d 180 20 0,05521 A B C D E F G H I
PETM T1 d 30*5 20 0,05476 B C D E F G H I J
PETM T1 p 180 20 0,05469 B C D E F G H I J
PETM T3 d 30*5 20 0,05372 C D E F G H I J K
PETM Ref 20 0,05339 C D E F G H I J K
PETM T3 l 30 20 0,05333 C D E F G H I J K
PETM T1 l 60 20 0,05288 C D E F G H I J K
PETM T3 l 60 20 0,05103 C D E F G H I J K
PETM T3 d 60*3 20 0,04989 D E F G H I J K
PETM T1 p 30 20 0,04879 E F G H I J K
PETM T1 l 30 20 0,04760 F G H I J K L
PETM T3 d 60*5 20 0,04634 F G H I J K L
PETM T2 d 60 20 0,04525 F G H I J K L
PETM T1 d 30 20 0,04452 G H I J K L
PETM T3 p 60 20 0,04350 H I J K L
PETM T1 d 30*3 20 0,04250 I J K L
PETM T2 l 30 20 0,04240 I J K L
PETM T2 d 30 20 0,04168 I J K L
PETM T1 l 180 20 0,04018 J K L
PETM T1 p 60 20 0,03896 K L
PETM T3 l 180 20 0,03307 L
Means that do not share a letter are significantly different. The
reference is marked in bold. Samples significantly different from
the Reference are marked in italic above.

99
Appendix VII. TUKEY TEST: DEMAND ABSOR-
BENCY CAPACITY FOR PETC Tukey Pairwise Comparisons
Grouping Information Using the Tukey Method and 95% Confidence
Factor N Mean Grouping
PETCT2d60 4 1,800 A
PETCT3d180 4 1,6500 A B
PETCT3d30×5 4 1,480 A B C
PETCT2p180 4 1,468 A B C
PETCT2l60 4 1,4525 A B C
PETCT2l30 4 1,4325 A B C
PETCT2p60 4 1,432 A B C
PETCT2p30 4 1,4125 A B C
PETCT3d30×3 4 1,4075 A B C
PETCT1p180 4 1,4050 A B C
PETCT2d180 4 1,4025 A B C
PETCT3l180 4 1,402 A B C
PETCT1d60 4 1,400 A B C
PETCT3l30 4 1,3850 A B C
PETCT3l60 4 1,3825 A B C
PETCT3p180 4 1,343 A B C
PETCT3p30 4 1,3275 A B C
PETCT1l30 4 1,3075 A B C
PETCT3d60×5 4 1,3050 A B C
PETCT3d30 4 1,3025 A B C
PETCT1p30 4 1,3000 A B C
PETCT1d60×3 4 1,2975 A B C
PETCT2d30 4 1,2950 A B C
PETCT3d60 4 1,2850 B C
PETCT1p60 4 1,250 B C
PETCT3d60×3 4 1,2450 B C
PETCT1l60 4 1,2325 B C
PETCT2l180 4 1,2250 B C
PETCT1d60×5 4 1,2150 B C
PETCT1d30×5 4 1,2075 B C
PETCT3p60 4 1,1975 B C
PETCT1d180 4 1,1975 B C
PETCT1l180 4 1,1900 B C
PETCT1d30×3 4 1,1850 B C
PETCT1d30 4 1,1600 B C
PETCRef 4 1,0800 C
Means that do not share a letter are significantly different. The
reference is marked in bold. Samples significantly different from
the reference are marked in italic above.

100
Appendix VIII. TUKEY TEST: MAXIMUM AB-
SORPTION RATE FOR PETC Tukey Pairwise Comparisons
Grouping Information Using the Tukey Method and 95% Confidence
Factor N Mean Grouping
PETCT2l60 4 0,2900 A
PETCT3d30×3 4 0,2650 A B
PETCT1l60 4 0,2550 A B C
PETCT3d30×5 4 0,23000 A B C D
PETCT2d30 4 0,22750 A B C D
PETCT1l30 4 0,2275 A B C D
PETCT3l60 4 0,22500 A B C D
PETCT3d60×5 4 0,2225 A B C D
PETCT2d180 4 0,22250 A B C D
PETCT1d30 4 0,22250 A B C D
PETCT3d30 4 0,2200 A B C D
PETCT1d60 4 0,22000 A B C D
PETCT3l30 4 0,22000 A B C D
PETCT1d60×3 4 0,2200 A B C D
PETCT1l180 4 0,21750 A B C D
PETCT2l30 4 0,21750 A B C D
PETCT3d60×3 4 0,2175 A B C D
PETCT1d30×5 4 0,2175 A B C D
PETCT1d30×3 4 0,2175 A B C D
PETCT2d60 4 0,2150 A B C D E
PETCT2l180 4 0,2150 A B C D E
PETCT3l180 4 0,21000 A B C D E
PETCT3d60 4 0,21000 A B C D E
PETCT1d180 4 0,2050 A B C D E
PETCT2p60 4 0,2025 A B C D E
PETCT1d60×5 4 0,2025 A B C D E
PETCT3d180 4 0,19750 B C D E F
PETCT2p180 4 0,18750 B C D E F
PETCT3p60 4 0,18500 B C D E F
PETCT2p30 4 0,18000 B C D E F
PETCT3p180 4 0,16750 C D E F
PETCT3p30 4 0,1675 C D E F
PETCRef 4 0,1625 D E F
PETCT1p180 4 0,1550 D E F
PETCT1p60 4 0,1250 E F
PETCT1p30 4 0,11000 F
Means that do not share a letter are significantly different. The
reference is marked in bold. Samples significantly different from
the Reference are marked in italic above.

101
Appendix IX. TUKEY TEST: DEMAND ABSOR-
BENCY CAPACITY FOR PETM Tukey Pairwise Comparisons
Grouping Information Using the Tukey Method and 95% Confidence
Factor N Mean Grouping
PETMRef 4 1,917 A
PETMT1p180 4 1,3325 B
PETMT1p30 4 1,3300 B C
PETMT1d30 4 1,2975 B C D
PETMT1d30×3 4 1,2875 B C D
PETMT1d30×5 4 1,2525 B C D E
PETMT1l180 4 1,2450 B C D E F
PETMT1d60×3 4 1,2175 B C D E F G
PETMT3d60 4 1,2150 B C D E F G
PETMT3d30×5 4 1,1900 B C D E F G H
PETMT1d60×5 4 1,1825 B C D E F G H
PETMT1l30 4 1,1825 B C D E F G H
PETMT3l30 4 1,1675 B C D E F G H
PETMT3p60 4 1,1475 B C D E F G H
PETMT3d60×3 4 1,1400 B C D E F G H
PETMT3d30×3 4 1,1400 B C D E F G H
PETMT3p180 4 1,1375 B C D E F G H
PETMT3d60×5 4 1,1350 B C D E F G H
PETMT1d180 4 1,1300 B C D E F G H
PETMT3d180 4 1,1075 B C D E F G H
PETMT3d30 4 1,0925 B C D E F G H
PETMT3l180 4 1,0750 B C D E F G H
PETMT1p60 4 1,0750 B C D E F G H
PETMT2l30 4 1,0675 B C D E F G H
PETMT2p60 4 1,0650 B C D E F G H
PETMT2p180 4 1,0375 C D E F G H
PETMT3l60 4 1,0350 D E F G H
PETMT1d60 4 1,0300 D E F G H
PETMT2p30 4 1,0275 D E F G H
PETMT3p30 4 1,0175 D E F G H
PETMT2d60 4 0,9800 E F G H
PETMT2d180 4 0,9725 E F G H
PETMT2d30 4 0,9625 E F G H
PETMT2l60 4 0,9525 F G H
PETMT1l60 4 0,9450 G H
PETMT2l180 4 0,9075 H
Means that do not share a letter are significantly different. The
reference is marked in bold. Samples significantly different from
the reference are marked in bold italic above.

102
Appendix X. TUKEY TEST: MAXIMUM AB-
SORPTION RATE FOR PETM Tukey Pairwise Comparisons
Grouping Information Using the Tukey Method and 95% Confidence
Factor N Mean Grouping
PETMT1l30 4 0,62000 A
PETMT1l180 4 0,5400 A
PETMT1d180 4 0,475 A B
PETMRef 4 0,320 B C
PETMT3d30 4 0,300 B C
PETMT1d30 4 0,21750 C
PETMT1d30×3 4 0,21500 C
PETMT1d30×5 4 0,20500 C
PETMT1p30 4 0,20500 C
PETMT1d60×3 4 0,20250 C
PETMT1p180 4 0,20000 C
PETMT3l30 4 0,19750 C
PETMT3d180 4 0,19500 C
PETMT3d30×5 4 0,19250 C
PETMT3d30×3 4 0,19250 C
PETMT3d60 4 0,19000 C
PETMT3d60×3 4 0,18750 C
PETMT1d60 4 0,18750 C
PETMT3l180 4 0,1800 C
PETMT3d60×5 4 0,18000 C
PETMT3l60 4 0,18000 C
PETMT1p60 4 0,18000 C
PETMT2p60 4 0,17750 C
PETMT2d30 4 0,17500 C
PETMT2l30 4 0,1750 C
PETMT2d60 4 0,17500 C
PETMT2l60 4 0,17500 C
PETMT1d60×5 4 0,17500 C
PETMT3p180 4 0,17250 C
PETMT2d180 4 0,17000 C
PETMT3p30 4 0,16750 C
PETMT2p180 4 0,16750 C
PETMT1l60 4 0,16750 C
PETMT3p60 4 0,1675 C
PETMT2l180 4 0,1575 C
PETMT2p30 4 0,15500 C
Means that do not share a letter are significantly different. The
reference is marked in bold. Samples significantly different from
the reference are marked in italic above.

103
Appendix XI. FTIR SPECTRA – PETC In this Appendix all FTIR spectra for PETC samples are shown. Each spectrum has
been normalised to the reference spectrum at peak 1409 cm-1
.
FIGURE 84 NORMALISED FTIR SPECTRA FOR PETC SAMPLES DYED IN 105°C FOR 30
MINUTES.
FIGURE 85 NORMALISED FTIR SPECTRA FOR PETC SAMPLES DYED IN 105°C FOR 60
MINUTES.
0
0.1
0.2
0.3
0.4
0.5
01000200030004000
Ab
sorb
an
ce
Wavenumber [cm-1]
PETC Ref
PETC T1 p 30
PETC T1 l 30
PETC T1 d 30
PETC T1 d 30×3
PETC T1 d 30×5
0
0.1
0.2
0.3
0.4
0.5
01000200030004000
Ab
sorb
an
ce
Wavenumber [cm⁻¹]
PETC Ref
PETC T1 p 60
PETC T1 l 60
PETC T1 d 60
PETC T1 d 60×3
PETC T1 d 60×5

104
FIGURE 86 NORMALISED FTIR SPECTRA FOR PETC SAMPLES DYED IN 105°C FOR 180
MINUTES.
FIGURE 87 NORMALISED FTIR SPECTRA FOR PETC SAMPLES DYED IN 135°C FOR 30
MINUTES.
0
0.1
0.2
0.3
0.4
0.5
01000200030004000
Ab
sorb
an
ce
Wavenumber [cm-1]
PETC Ref
PETC T1 p 180
PETC T1 l 180
PETC T1 d 180
0
0.1
0.2
0.3
0.4
0.5
01000200030004000
Ab
sorb
an
ce
Wavenumber [cm-1]
PETC Ref
PETC T3 p 30
PETC T3 l 30
PETC T3 d 30
PETC T3 d 30×3
PETC T3 d 30×5

105
FIGURE 88 NORMALISED FTIR SPECTRA FOR PETC SAMPLES DYED IN 135°C FOR 60
MINUTES.
FIGURE 89 NORMALISED FTIR SPECTRA FOR PETC SAMPLES DYED IN 135°C FOR 180
MINUTES.
0
0.1
0.2
0.3
0.4
0.5
01000200030004000
Ab
srob
an
ce
Wavenumber [cm-1]
PETC Ref
PETC T3 p 60
PETC T3 l 60
PETC T3 d 60
PETC T3 d 60×3
PETC T3 d 60×5
0
0.1
0.2
0.3
0.4
0.5
01000200030004000
Ab
srob
an
ce
Wavenumber [cm-1]
PETC Ref
PETC T3 p 180
PETC T3 l 180
PETC T3 d 180

106
Appendix XII. FTIR SPECTRA – PETM In this Appendix all FTIR spectra for PETM samples are shown. Each spectrum has
been normalised to the reference spectrum at peak 1409 cm-1
.
FIGURE 90 NORMALISED FTIR SPECTRA FOR PETM SAMPLES DYED IN 105°C FOR 30
MINUTES.
FIGURE 91 NORMALISED FTIR SPECTRA FOR PETM SAMPLES DYED IN 105°C FOR 60
MINUTES.
0
0.1
0.2
0.3
0.4
0.5
0.6
01000200030004000
Ab
sorb
an
ce
Wavenumber [cm-1]
PETM Ref
PETM T1 p 30
PETM T1 l 30
PETM T1 d 30
PETM T1 d 30×3
PETM T1 d 30×5
0
0.1
0.2
0.3
0.4
0.5
0.6
01000200030004000
Ab
sorb
an
ce
Wavenumber [cm-1]
PETM Ref
PETM T1 p 60
PETM T1 l 60
PETM T1 d 60
PETM T1 d 60×3
PETM T1 d 60×5

107
FIGURE 92 NORMALISED FTIR SPECTRA FOR PETM SAMPLES DYED IN 105°C FOR 180
MINUTES.
FIGURE 93 NORMALISED FTIR SPECTRA FOR PETM SAMPLES DYED IN 120°C FOR 30
MINUTES.
0
0.1
0.2
0.3
0.4
0.5
0.6
01000200030004000
Ab
sorb
an
ce
Wavenumber [cm-1]
PETM Ref
PETM T1 p 180
PETM T1 l 180
PETM T1 d 180
0
0.1
0.2
0.3
0.4
0.5
0.6
01000200030004000
Ab
sorb
an
ce
Wavenumber [cm-1]
PETM Ref
PETM T2 p 30
PETM T2 l 30
PETM T2 d 30

108
FIGURE 94 NORMALISED FTIR SPECTRA FOR PETM SAMPLES DYED IN 120°C FOR 60
MINUTES.
FIGURE 95 NORMALISED FTIR SPECTRA FOR PETM SAMPLES DYED IN 120°C FOR 180
MINUTES.
0
0.1
0.2
0.3
0.4
0.5
0.6
01000200030004000
Ab
sorb
an
ce
Wavenumber [cm-1]
PETM Ref
PETM T2 p 60
PETM T2 l 60
PETM T2 d 60
0
0.1
0.2
0.3
0.4
0.5
0.6
01000200030004000
Ab
sorb
an
ce
Wavenumber [cm-1]
PETM Ref
PETM T2 p 180
PETM T2 l 180
PETM T2 d 180

109
FIGURE 96 NORMALISED FTIR SPECTRA FOR PETM SAMPLES DYED IN 135°C FOR 30
MINUTES.
FIGURE 97 NORMALISED FTIR SPECTRA FOR PETM SAMPLES DYED IN 135°C FOR 60
MINUTES.
0
0.1
0.2
0.3
0.4
0.5
0.6
01000200030004000
Ab
sorb
an
ce
Wavenumber [cm-1]
PETM Ref
PETM T3 p 30
PETM T3 l 30
PETM T3 d 30
PETM T3 d 30×3
PETM T3 d 30×5
0
0.1
0.2
0.3
0.4
0.5
0.6
01000200030004000
Ab
sorb
an
ce
Wavenumber [cm-1]
PETM Ref
PETM T3 p 60
PETM T3 l 60
PETM T3 d 60
PETM T3 d 60×3
PETM T3 d 60×5

110
FIGURE 98 NORMALISED FTIR SPECTRA FOR PETM SAMPLES DYED IN 135°C FOR 180
MINUTES.
0
0.1
0.2
0.3
0.4
0.5
0.6
01000200030004000
Ab
sorb
an
ce
Wavenumber [cm-1]
PETM Ref
PETM T3 p 180
PETM T3 l 180
PETM T3 d 180

111
Appendix XIII. CORRELATION ANALYSIS PETC In the tables below the results of correlation analyses for PETC are presented. The
significance level have been set to α = 0.05, meaning that p-values below or equal
to 0.05 indicate significant correlation.
The values in on cells are:
First value = suggested Pearson correlation coefficient
Second value = p-value determining the significance of the coefficient
TABLE 23 PEARSON CORRELATION COEFFICIENTS FOR RELATIONSHIPS BETWEEN MAXI-
MUM ABSORPTION RATE, DEMAND ABSORBENCY CAPACITY, AND DYED-VACUUM DRIED
PERCENTAGE WEIGHT DIFFERENCE FOR PETC SAMPLES. SIGNIFICANT RESULTS ARE
MARKED IN BOLD TEXT.
MAR DAC
DAC 0.134
0.435
Dyed-vacuum
dried weight
difference
-0.082
0.633
-0.416
0.012
TABLE 24 PEARSON CORRELATION COEFFICIENTS FOR RELATIONSHIPS BETWEEN DSC
RESULTS, TENSILE PROPERTIES, MOISTURE RELATED PROPERTIES, AND EXPOSURE TIME
ABOVE TG AND DYEING TEMPERATURE FOR PETC SAMPLES. SIGNIFICANT RESULTS ARE
MARKED IN BOLD TEXT.
∆Hc ∆Hm1 Breaking
strength
E-
modulus
Elongation
at break
DAC MAR
∆Hm1 0.383
0.021
Breaking
strength -0.666
0.000
-0.076
0.661
E-modulus -0.050
0.771
0.316
0.061
-0.005
0.978
Elongation at
break -0.407
0.014
-0.079
0.645 0.586
0.000
-0.145
0.400
DAC 0.252
0.138
-0.091
0.599 -0.526
0.001
0.119
0.491
-0.135
0.433
MAR 0.506
0.002
0.122
0.480 -0.403
0.015
0.134
0.438 -0.381
0.022
0.143
0.407
Time above
Tg 0.305
0.070
-0.162
0.344
-0.082
0.634
0.006
0.972
-0.170
0.323
0.028
0.871
0.160
0.351 Dyeing
temp. 0.328
0.050
-0.041
0.811
-0.191
0.265
0.130
0.451
0.152
0.377 0.444
0.007
0.275
0.105

112
TABLE 25 PEARSON CORRELATION COEFFICIENTS FOR RELATIONSHIPS BETWEEN ABSORB-
ANCE PEAKS SUGGESTED TO FORM TRANS-GAUCHE COUPLES, AND CORRELATION COEFFI-
CIENT BETWEEN ABSORBANCE PEAKS AND DSC RESULTS FOR PETC SAMPLES. SIGNIFI-
CANT RESULTS ARE MARKED IN BOLD TEXT.
A1339 A847 A898 A1371
A847 0.910
0.000
A898 0.761
0.000
0.923
0.000
A1371 0.429
0.009
0.496
0.002
0.378
0.023
∆Hc -0.177
0.303
0.029
0.865
0.246
0.148
0.166
0.333
∆Hm1 0.321
0.056 0.369
0.027
0.417
0.011
0.073
0.671

113
Appendix XIV. CORRELATION ANALYSIS PETM In the tables below the results of correlation analyses for PETC are presented. The
significance level have been set to α = 0.05, meaning that p-values below or equal
to 0.05 indicate significant correlation.
The values in on cells are:
First value = suggested Pearson correlation coefficient
Second value = p-value determining the significance of the coefficient
TABLE 26 PEARSON CORRELATION COEFFICIENTS FOR RELATIONSHIPS BETWEEN MAXI-
MUM ABSORPTION RATE, DEMAND ABSORBENCY CAPACITY, AND DYED-VACUUM DRIED
PERCENTAGE WEIGHT DIFFERENCE FOR PETM SAMPLES. NO SIGNIFICANT RESULTS
FOUND.
MAR DAC
DAC 0.311
0.065
Dyed-vacuum
dried weight
difference
0.046
0.789
0.188
0.273
TABLE 27 PEARSON CORRELATION COEFFICIENTS FOR RELATIONSHIPS BETWEEN DSC
RESULTS, TENSILE PROPERTIES, MOISTURE RELATED PROPERTIES, AND EXPOSURE TIME
ABOVE TG AND DYEING TEMPERATURE FOR PETM SAMPLES. SIGNIFICANT RESULTS ARE
MARKED IN BOLD TEXT.
∆Hc ∆Hm1 Breaking
strength
E-
modulus
Elongation
at break
DAC MAR
∆Hm1 0.332
0.048
Breaking
strength -0.173
0.312 0.502
0.002
E-modulus 0.221
0.195
0.277
0.102
0.114
0.508
Elongation at
break 0.012
0.944 0.642
0.000
0.562
0.000
0.075
0.666
DAC 0.044
0.798
-0.140
0.414
0.172
0.316
-0.133
0.439
-0.309
0.069
MAR -0.350
0.036
-0.142
0.407
0.276
0.103
-0.194
0.257
-0.216
0.206
0.305
0.071
Time above
Tg 0.304
0.071 -0.406
0.014
-0.584
0.000
0.105
0.544 -0.393
0.018
-0.063
0.716
-0.132
0.442 Dyeing
temp. 0.061
0.724
-0.173
0.313
-0.493
0.002
0.001
0.995
0.116
0.502 -0.736
0.000
-0.322
0.056

114
TABLE 28 PEARSON CORRELATION COEFFICIENTS FOR RELATIONSHIPS BETWEEN ABSORB-
ANCE PEAKS SUGGESTED TO FORM TRANS-GAUCHE COUPLES, AND CORRELATION COEFFI-
CIENT BETWEEN ABSORBANCE PEAKS AND DSC RESULTS FOR PETM SAMPLES. SIGNIFI-
CANT RESULTS ARE MARKED IN BOLD TEXT.
A1340 A847 A898 A1371
A847 -0.168
0.328
A898 -0.831
0.000
0.529
0.001
A1371 -0.637
0.000
0.778
0.000
0.814
0.000
∆Hc -0.376
0.024
0.397
0.017
0.474
0.003
0.520
0.001
∆Hm1 0.277
0.103
-0.168
0.327
-0.191
0.265
-0.239
0.160