Embed Size (px)
Citation preview

Hazeldean Crossing Inc.
TIA Forecasting & Strategy Report
Type of Document Final Report
Project Name 5924 Hazeldean Road
Project Number OTT-00250806-B0
Prepared By:
EXP Services Inc. 1595 Clark Boulevard Brampton, ON L6T 4V1
Date Submitted November 2019


Hazeldean Crossing Inc. 5924 Hazeldean Road
OTT-00250806-B0 Nov 2019
EX-i
Legal Notification This report was prepared by EXP Services Inc. for the account of Hazeldean Crossing Inc.
Any use which a third party makes of this report, or any reliance on or decisions to be made based on it, are the responsibility of such third parties. EXP Services Inc. accepts no responsibility for damages, if any, suffered by any third party as a result of decisions made or actions based on this project

Hazeldean Crossing Inc. 5924 Hazeldean Road
OTT-00250806-B0 Nov 2019
i
Table of Contents Page
1 Screening Form ...................................................................................................... 1
2 Description of Proposed Development ................................................................ 1
3 Existing Conditions ................................................................................................ 2
4 Planned Conditions ................................................................................................ 4
5 Study Area .............................................................................................................. 5
6 Time Periods ........................................................................................................... 5
7 Horizon Years ......................................................................................................... 5
8 Exemptions Review ................................................................................................ 5
9 Background Network Travel Demands ................................................................. 6
10 Development Design .............................................................................................. 8
11 Parking Supply ....................................................................................................... 9
12 Boundary Street Design ........................................................................................ 9
13 Access Intersection Design................................................................................. 10
14 Conclusions .......................................................................................................... 10
List of Appendices
Appendix A - TIA Screening Form
Appendix B - Site Plan
Appendix C - Existing Turning Movement Counts
Appendix D - Collision Details Report
Appendix E - Intersection Capacity Analysis

Hazeldean Crossing Inc. 5924 Hazeldean Road
OTT-00250806-B0 Nov 2019
ii
List of Tables Page
Table 1 – Estimated Trip Generation (ITE 10th Edition) ............................................. 6
Table 2 – Estimated Trip Generation by travel mode ................................................. 6
Table 3 – City of Ottawa TMP Modal Share targets for 2031 ...................................... 7
Table 4 – Hazeldean Rd. & Victor St. Intersection Capacity ...................................... 8
Table 5 – MMLOS – Projected Victor Street Segment (West Side of Roadway) ....... 9
List of Figures Page
Figure 1 – Site Plan ....................................................................................................... 1
Figure 2 – Existing Traffic Control and Lane Configuration ...................................... 3
Figure 3 – Existing Peak Hour Travel Demands by Mode .......................................... 4
Figure 4 – Study Area .................................................................................................... 5
Figure 5 – Trip Assignment .......................................................................................... 7
Hazeldean Crossing Inc. 5924 Hazeldean Road
OTT-00250806-B0 Nov 2019
1
1 Screening Form
EXP completed a TIA screening form for the proposed development and submitted on March 29, 2019. A copy of the completed screening form is attached to this report as Appendix A.
The proposed development only satisfies the Safety Trigger due to the proximity of the proposed access to the existing signalized intersection of Hazeldean Road and Victor Street. Neither the Trip Generation Trigger (proposed development is less than 90 units) nor the Location Trigger (proposed development is not in a priority area nor proposes access to a priority street) are satisfied. Considering this, it is proposed that the scope of the TIA be limited to the design review component (Modules 4.1-4.4) and that the network analysis components (Modules 3.1-3.3 and 4.5-4.9) be omitted.
2 Description of Proposed Development
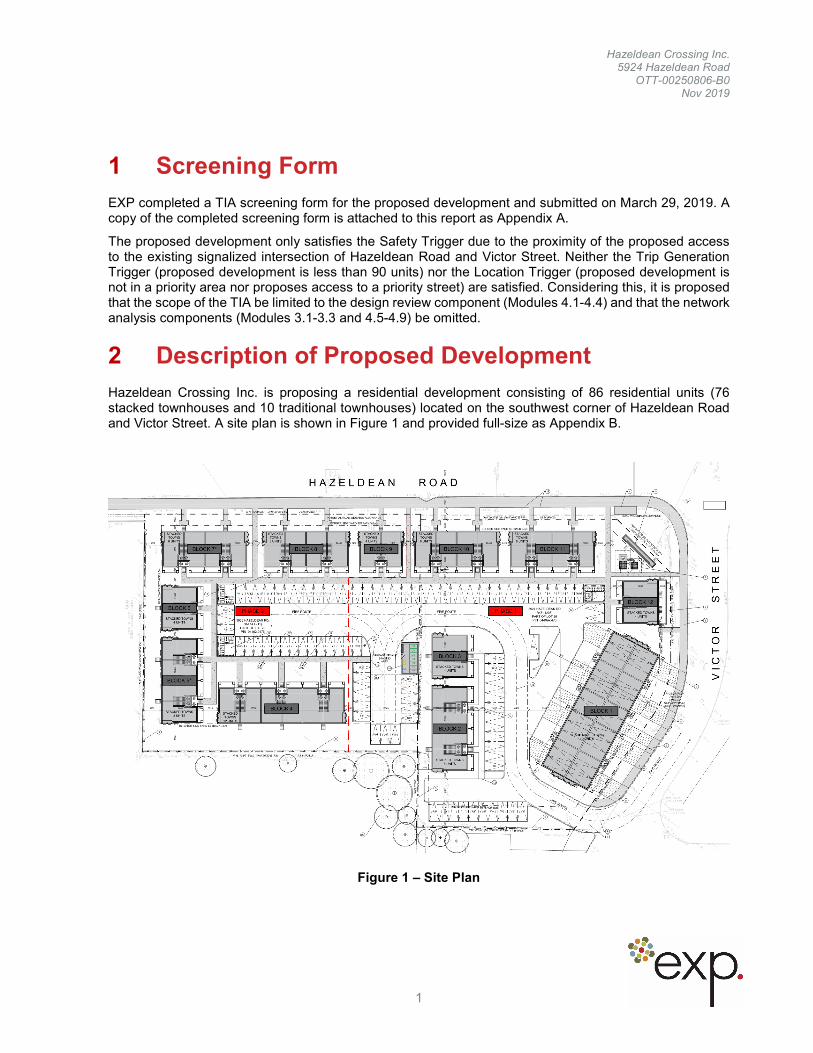
Hazeldean Crossing Inc. is proposing a residential development consisting of 86 residential units (76 stacked townhouses and 10 traditional townhouses) located on the southwest corner of Hazeldean Road and Victor Street. A site plan is shown in Figure 1 and provided full-size as Appendix B.
Figure 1 – Site Plan

Hazeldean Crossing Inc. 5924 Hazeldean Road
OTT-00250806-B0 Nov 2019
2
The proposed residential development allocates 92 parking spaces (76 residential and 16 visitor spaces) for the stacked townhouses and an additional 35 parking spaces (18 residential, 17 visitor) for the traditional townhouses.
The proposed residential development is located in a General Urban Area (section 3.6.1) of the Official Plan and spans two properties which are zoned as follows:
• 5924 Hazeldean Road is currently a vacant property on the southwest corner of Hazeldean Road and Victor Street. It is zoned R4Z – Residential Fourth Density Zone (Subzone Z).
• 5938 Hazeldean Road is currently vacant and previously housed an equipment rental shop. An existing 1-storey building is located on the property. It is zoned GM14 – General Mixed-Use Zone (Subzone 14)
Both R4Z – Residential Fourth Density Zone (Subzone Z) and GM14 – General Mixed-Use Zone (Subzone 14) permit stacked dwellings and townhouse dwellings as detailed in Part 5, Section 138 of the Zoning By-Law. Additional applicable planning regulations are noted as By-Laws 2010-307, 2012-334 and 2018-206.
A total of 86 residential units (76 stacked townhouses and 10 traditional townhouses) are proposed and will be phased as follows:
• Phase 1 – 32 stacked townhouses and 10 traditional townhouses to be occupied in 2020; and
• Phase 2 – 44 stacked townhouses to be occupied in 2021.
The proposed development is arranged with most of the residential buildings around the perimeter of the property and parking in the center. Direct pedestrian access to the existing sidewalk on Hazeldean Road and a proposed new sidewalk on Victor Street to the dwellings fronting the boundary streets are proposed. Pedestrian connections to the center common area, with connections to each dwelling and the parking lot, are proposed at the east side of the property to the corner of Hazeldean Road & Victor Street and near the west side of the property to Hazeldean Road.
Access to the central parking area of the development is provided via a driveway on Victor Street located approximately 110m south of the signalized intersection of Hazeldean Road & Victor Street. There are no access restrictions proposed for this entrance. There are five townhouses with driveway access off of Victor Street with the northernmost driveway located approximately 45m south of the signalized intersection. There are no access restrictions proposed for these five driveways.
3 Existing Conditions
The following boundary roads are adjacent to the proposed development:
• Hazeldean Road is an arterial road (TMP Map 6, 2016 Revision) under the jurisdiction of the City of Ottawa with a 5-lane cross-section (two travel lanes in each direction plus a two-way left turn lane) and painted bicycle lanes. The posted speed limit is 60 km/h.
• Victor Street is a local road (TMP Map 6, 2016 Revision) under the jurisdiction of the City of Ottawa with a two-lane cross-section. The posted speed is 40 km/h.
Hazeldean Road & Victor Street is a signalized intersection with left-turn auxiliary lanes on all approaches. Two three-leg, one-way, stop-controlled intersections are also located near the proposed development: Hazeldean Road (major) & Hartin Street (minor) and Victor Street (major) & Denham Way (minor). The existing control and lane configuration at each intersection is shown in Figure 2. Several driveways exist within 200 m of the proposed site access on Victor Street. North of the proposed access (i.e. closer to Hazeldean Road) is a driveway to a small massage therapist on the opposite side of Victor Street. South of the proposed access, detached houses/ duplexes are served by individual driveways on both sides of Victor Street.

Hazeldean Crossing Inc. 5924 Hazeldean Road
OTT-00250806-B0 Nov 2019
3
There are existing on-street painted cycle lanes provided on each side of Hazeldean Road. Sidewalks abut Hazeldean Road on both sides. No sidewalks or cycle lanes are provided on Victor Street.
The following bus routes stop at the intersection of Hazeldean Road & Victor Street; both the westbound and eastbound bus stops are located on the west side of the intersection:
• Route 61 is a Transitway route (limited stops in Transitway sections, local stops when on Hazeldean Road) which connects to the Transitway at Eagleson Station and proceeds downtown and further east. When Line 1 opens, this route will terminate at Tunney’s Pasture.
• Routes 261 and 263 are peak-only connection routes which travel direct to downtown via Huntmar Drive, Highway 417, and the Transitway. When Line 1 opens, these routes will terminate at Tunney’s Pasture.
• Route 162 is a local route which terminates at Terry Fox Transitway Station.
Figure 2 – Existing Traffic Control and Lane Configuration
An examination of the existing traffic management measures was completed by completing a site visit and through the use of Street View in Google Earth to assess the study area. No existing traffic management measures were identified on-site within the study area during the examination.
The existing peak hour travel demands (by mode) at the signalized intersection of Hazeldean Road & Victor Street are shown in Figure 3. The demands were obtained from a City of Ottawa traffic count conducted in December 2015 (attached as Appendix C). While the observed active transportation mode split is very low, it is noted that these counts were taken in winter and the mode split may change during warmer weather.

Hazeldean Crossing Inc. 5924 Hazeldean Road
OTT-00250806-B0 Nov 2019
4
Figure 3 – Existing Peak Hour Travel Demands by Mode
Nine collisions occurred at the subject intersection for the five most recent years for which data is available (January 2013 to December 2017), an average of 1.8 collisions per year. The collision details report is provided as Appendix D. Seven of these collisions were sideswipe or rear end collisions where vehicles were travelling East or West along Hazeldean Road, and two of these collisions were angle collisions between a vehicle travelling East on Hazeldean Road and a vehicle travelling North on Victor Street. One of the collisions was classified as non-fatal injury while the rest were classified as property damage only.
4 Planned Conditions
No road widening, or other improvements are planned in the 2031 horizon to either of the boundary streets, per Map 10 (Road Network – 2031 Concept) of the Transportation Master Plan. A new north-south arterial connecting to Highway 417 is planned in 2020-2025 east of Huntmar Drive, per Map 11 (Road Network – 2031 Affordable Network). Hazeldean Road is a proposed transit priority corridor (isolated measures) is proposed for Hazeldean Road near the proposed development, per Map 5 (Rapid Transit and Transit Priority Network - 2031 Affordable Network).
It is understood there are four proposed developments within approximately one kilometer of the site which are currently under construction, approved or in the approval process. The first site is located at 5835 Hazeldean Road and Canadian Auto Mall is proposing a 531sq.m one-storey building with a mezzanine to house an automotive sales dealership replacing the existing gravel automotive sales dealership located on the property. The second proposed development is a mixed-use development for Huntington Properties consisting of retail, office, pharmacy and medical space located at 5754 Hazeldean Road. The third proposes a single-story pub-style restaurant and a two-storey office building located at 6150 Hazeldean Road. The final adjacent development is a residential development for the construction of 67 townhomes and 7 single-family homes at 5 Orchard Road by Campanale Homes.

Hazeldean Crossing Inc. 5924 Hazeldean Road
OTT-00250806-B0 Nov 2019
5
Based upon the nature of these developments, it is anticipated the existing and future transit provision on Hazeldean Road should easily absorb the impact of the proposed developments and their impact can be considered negligible and included in the annual growth factor discussed in Section 9.
5 Study Area
The proposed study area is as outlined below and highlighted in Figure 4.
• Hazeldean Road & Victor Street Intersection; and
• Victor Street – adjacent to the site.
Figure 4 – Study Area
6 Time Periods
The proposed residential development will generate peak traffic in the weekday AM and PM peak periods. Considering the existing travel demand peaks and the relatively minor impact of the site generated traffic, it is anticipated that the combined AM and PM peak periods on the boundary roads will remain the same. Therefore, it is proposed to study the weekday AM and PM peak periods.
7 Horizon Years
The proposed residential development of 86 units is anticipated to generate a relatively small number of trips. Therefore, it is proposed to analyze only the full build-out year of the development (2021).
8 Exemptions Review
The proposed development satisfies both the Location Trigger and Safety Trigger of the screening form but does not satisfy the Trip Generation Trigger (see Section 1).

Hazeldean Crossing Inc. 5924 Hazeldean Road
OTT-00250806-B0 Nov 2019
6
Based upon Table 4 in the City of Ottawa TIA Guidelines, the following exemptions are proposed:
• Module 3.3 – Demand Rationalization is only required when the existing network cannot support the future vehicle volumes, which is not the case for this proposed development; and
• Modules 4.5 – 4.9 – As the Trip Generation Trigger was no satisfied, the Traffic Impact Assessment is exempt from the Network Impact Component.
9 Development-generated Travel Demand
Following public comments regarding the development proposal, the City of Ottawa has requested that Module 3.1 be completed as part of the final Traffic Impact Assessment.
9.1 Trip generation and Mode Shares
The ITE Trip Generation manual, 10th edition, was used to estimate the number automobile trips generated. The ITE rates typically represent suburban or low-density conditions which reflect low transit modal shares. Person Trips are calculated by applying a 1.28 expansion factor which includes a default 10% transit mode share and a 1.15 average vehicle occupancy rate. The estimated trip generation calculations were completed for full build-out of the development expected in 2021. Table 1 shows the number of ‘person trips’ generated by the proposed development.
Table 1 – Estimated Trip Generation (ITE 10th Edition)
ITE Land Use
Size Period Rate Total
Person Trips
Entering Exiting
#220 Multi-Family
Housing (Low Rise)
86 units
AM Peak 0.46 65 23% 77%
PM Peak 0.56 63 63% 37%
The 2011 Trans O-D study provide modal splits that are required to convert the proposed ‘person trips’ into trips for different modes of transportation. The O-D table for Kanata-Stittsville will be used to represent current travel patterns for the area. Since the development is residential in nature, and we expect that the majority of trips generated by the development will be from and to the ‘Kanata-Stittsville’ district in the AM and PM peak hours respectively.
Table 2 – Estimated Trip Generation by travel mode
Travel Mode AM Peak TRIPS IN OUT PM Peak TRIPS IN OUT
Auto Driver 59% 38 9 29 61% 38 24 14
Auto Passenger 9% 6 1 5 15% 9 6 3
Transit 24% 16 4 12 21% 13 8 5
Walking 0% 0 0 0 0% 0 0 0
Cycling 0% 0 0 0 0% 0 0 0
Other 7% 5 1 4 3% 2 1 1

Hazeldean Crossing Inc. 5924 Hazeldean Road
OTT-00250806-B0 Nov 2019
7
From the City of Ottawa Transportation Master Plan, the AM Peak hour modal splits are as follows:
Table 3 – City of Ottawa TMP Modal Share targets for 2031
Future Mode Share Targets for the Development
Travel Mode Mode Share Target Rationale
Transit 21% TMP Exhibit 2.13 for Kanata/Stittsville to ‘All Areas’
Walking 23% TMP Exhibit 2.14 for Kanata/Stittsville
Cycling 4% TMP Exhibit 2.14 for Kanata/Stittsville
Auto Passenger 8% TMP Exbibit 2.12 9/50 ‘Auto Driver’ split
Auto Driver 44% [100 – (Transit+Walking+Cycling)] x (50/59)
The 2031 projections show a substantial reduction in the ‘Auto Driver’ mode by 2031. For the purposes of this Traffic Impact Assessment Report, we will use the current (2011) O-D mode splits and existing turning vehicle counts to complete the trip assignment which is illustrated by Figure 5.
Figure 5 – Trip Assignment

Hazeldean Crossing Inc. 5924 Hazeldean Road
OTT-00250806-B0 Nov 2019
8
10 Background Network Travel Demands
As outlined in Section 4 – Planned Conditions, there are no road widening or other improvements planned to either of the boundary streets in the 2031 horizon as per Map 10 (Road Network – 2031 Concept) of the Transportation Master Plan. For adjacent road improvements, refer to Section 4.
An examination of the existing and proposed intersection capacity was completed using the existing intersection geometry and signal timing to evaluate the Intersection Capacity Utilization (ICU) Level of Service. A summary of this examination is provided below in Table 2 with details of the analysis included in Appendix E.
Table 4 – Hazeldean Rd. & Victor St. Intersection Capacity
Intersection
ICU Level of Service (2021 Existing Conditions & 2021 Existing + Proposed)
Morning (AM) Evening (PM)
Existing Proposed Existing Proposed
Hazeldean Rd. & Victor Street
B B C C
An examination of the traffic growth through the Hazeldean/Stittsville study area was examined based upon historical traffic count data from 2008, 2009, 2012 and 2016 provided by the City of Ottawa and detailed through Traffic Impact Assessments completed in the immediately adjacent area. The Hazeldean/Stitsville Main intersection has experienced an approximate 2-4% annual increase in vehicular traffic within recent years. Therefor, a growth factor of 3% per annum is expected for the traffic volumes in the area.
As outlined in Section 4 – Planned Conditions, the additional vehicular traffic generated by the adjacent developments are considered within the 3% per annum growth factor. Furthermore, as the surrounding residential area is enclosed and at full build-out, it is not anticipated there will be additional vehicular traffic generated from Victor Street in the future.
11 Development Design
The proposed development provides residential parking spaces and visitor spaces for the proposed stacked townhouses and shared off-road driveways for the traditional townhouses. The stacked townhouses will each be provided a storage unit and the traditional townhouses are provided a garage to accommodate bicycle storage.
Concrete sidewalks are proposed providing ease of access to Hazeldean Road to promote the use of public transit. Transit service within the vicinity of the site is provided by OC Transpo Routes #61, #162, #261 and #263. Details of the transit routes are provided in Section 3. All residential units are within the 400m walk distance to the nearest transit stop.
All short-stay deliveries and garbage pickup are accommodated within the internal roadway layout. Sufficient turning radii have been provided to accommodate the proposed movement of these vehicles.

Hazeldean Crossing Inc. 5924 Hazeldean Road
OTT-00250806-B0 Nov 2019
9
12 Parking Supply
The proposed development provides 91 parking spaces (76 for residents, 15 for visitors) for the stacked townhouses and an additional 24 spaces (14 for residents, 10 for visitors) for the traditional townhouses. The stacked townhouses do not meet the City requirements of 1.2 parking spaces per dwelling but instead limit each dwelling to 1.0 parking spaces per dwelling. The proposed supply of parking is consistent with parking requirements for elsewhere in the City of Ottawa. Due to the proximity to transit routes and accessibility to bike lanes, overflow parking requirements are not anticipated. Traditional townhouse parking meets the City requirements for 1.0 parking spaces per dwelling and all visitor parking requirements meet the City requirement of 0.2 parking spaces per dwelling.
Garages are provided for each traditional townhouse and storage units are provided for each stacked townhouse unit to accommodate bicycle parking/storage. No additional bicycle parking is required.
13 Boundary Street Design
The boundary street for the proposed development is Victor Street. At this time, there have not been any complete street concepts prepared for the boundary street. The existing roadway geometry consists of the following features:
• 1 vehicular traffic lane in each direction with 1 auxiliary turning lane at the Hazeldean intersection (2-3 lanes);
• Less than 3,000 vehicles per day;
• Posted speed limit of 40km/h, assumed operating speed of 30-40km;
• No dedicated transit facilities;
• No shoulder of road; and
• No on-street parking.
The proposed site extends a 1.8m concrete sidewalk from the development entrance, north to Hazeldean Road. The multi-modal level of service analysis for the road segment along Victor Street is summarized below in Table 3 (below). The truck level of service has not been analyzed as Victor Street is not a designated truck route.
Table 5 – MMLOS – Projected Victor Street Segment (West Side of Roadway)
Road Segment
Level of Service
Pedestrian (PLoS) Bicycle (BLoS) Transit (TLoS)
PLoS Target BLoS Target TLoS Target
Victor Street
B C B B D N/A
Based upon the location of the development in a general urban area, adjacent to a bicycle route and a local roadway, the target levels of service for pedestrians and cyclists are PLoS ‘C’ and BLoS ‘B’. There are currently no transit stops or transit priority plans for Victor Street and therefor there is no level of service target for transit.

Hazeldean Crossing Inc. 5924 Hazeldean Road
OTT-00250806-B0 Nov 2019
10
14 Access Intersection Design
The development access driveway is proposed on Victor Street approximately 110m south of the signalized intersection of Hazeldean Road & Victor Street. The driveway is proposed as full-movement and is noted as 7.1m wide. The proposed access is opposite to a stop-controlled roadway (Denham Way) and will operate similarly to the two residential driveways located to the south of the proposed access. The proximity of the proposed access to the signalized intersection is considered acceptable given the auxiliary turning lane does not extend to the proposed access. It is not anticipated that queues along Victor Street will spill back to the proposed access due to the volumes of traffic travelling northbound being low.
As the Trip Generation Trigger has not been satisfied and the projected traffic volumes are considered negligible, the proposed development access will operate acceptably.
15 Conclusions
Based upon the information examined and presented in this report, the following transportation related conclusions are provided:
• A total of 76 stacked townhouses and 10 traditional townhouses are being proposed at 5924 Hazeldean Road for a total of 86 residential units;
• Vehicle parking will be provided via parking lot and visitor parking spaces for the stacked townhouses and via individual driveways and garages for the traditional townhouses;
• Transit services are provided by OC Transpo and are located immediately to the north of the site at the Hazeldean Road & Victor Street intersection within 400m walking distance of the site;
• The traffic impacts from the proposed development can be considered negligible on the Hazeldean Road & Victor Street signalized intersection;
• One access is proposed to the development which is proposed to be located on Victor Street approximately 110m south of the signalized intersection of Hazeldean Road & Victor Street. The driveway has been located as far south as the site frontage will allow and will not conflict with the operations of the signalized intersection to the north; and
• Based upon the results of the report, no Roadway Modification Application or Monitoring Plan is required.

Hazeldean Crossing Inc. 5924 Hazeldean Road
OTT-00250806-B0 Nov 2019
Appendix A - TIA Screening Form

Transportation Impact Assessment Screening Form
City of Ottawa 2017 TIA Guidelines Screening Form
1. Description of Proposed Development
Municipal Address
Description of Location
Land Use Classification
Development Size (units)
Development Size (m2)
Number of Accesses and Locations
Phase of Development
Buildout Year
If available, please attach a sketch of the development or site plan to this form.
2. Trip Generation Trigger
Considering the Development’s Land Use type and Size (as filled out in the previous section), please refer to the Trip Generation Trigger checks below.
Land Use Type Minimum Development Size
Single-family homes 40 units
Townhomes or apartments 90 units
Office 3,500 m2
Industrial 5,000 m2
Fast-food restaurant or coffee shop 100 m2
Destination retail 1,000 m2
Gas station or convenience market 75 m2
* If the development has a land use type other than what is presented in the table above, estimates of person-tripgeneration may be made based on average trip generation characteristics represented in the current edition of the Institute of Transportation Engineers (ITE) Trip Generation Manual.
If the proposed development size is greater than the sizes identified above, the Trip Generation Trigger is satisfied.
Transportation Impact Assessment Guidelines
71 Revision Date: June, 2017
5938 5924 Hazeldean Road
Residential Development (48 Unit)
R4Z[1208]
86 Units
9578
5 driveways / main entrance
Site Plan Approval
2019-2020
>86

Transportation Impact Assessment Screening Form
3. Location Triggers
Yes No
Does the development propose a new driveway to a boundary street that is designated as part of the City’s Transit Priority, Rapid Transit or Spine Bicycle Networks?
Is the development in a Design Priority Area (DPA) or Transit-oriented Development (TOD) zone?*
*DPA and TOD are identified in the City of Ottawa Official Plan (DPA in Section 2.5.1 and Schedules A and B; TOD in Annex6). See Chapter 4 for a list of City of Ottawa Planning and Engineering documents that support the completion of TIA).
If any of the above questions were answered with ‘Yes,’ the Location Trigger is satisfied.
4. Safety Triggers
Yes No
Are posted speed limits on a boundary street are 80 km/hr or greater?
Are there any horizontal/vertical curvatures on a boundary street limits sight lines at a proposed driveway?
Is the proposed driveway within the area of influence of an adjacent traffic signal or roundabout (i.e. within 300 m of intersection in rural conditions, or within 150 m of intersection in urban/ suburban conditions)?
Is the proposed driveway within auxiliary lanes of an intersection?
Does the proposed driveway make use of an existing median break that serves an existing site?
Is there is a documented history of traffic operations or safety concerns on the boundary streets within 500 m of the development?
Does the development include a drive-thru facility?
If any of the above questions were answered with ‘Yes,’ the Safety Trigger is satisfied.
5. Summary
Yes No
Does the development satisfy the Trip Generation Trigger?
Does the development satisfy the Location Trigger?
Does the development satisfy the Safety Trigger?
If none of the triggers are satisfied, the TIA Study is complete. If one or more of the triggers is satisfied, the TIA Study must continue into the next stage (Screening and Scoping).
Transportation Impact Assessment Guidelines
72 Revision Date: June, 2017
X
X
X
X
X
X
X
X
X
XX
X

Hazeldean Crossing Inc. 5924 Hazeldean Road
OTT-00250806-B0 Nov 2019
Appendix B - Site Plan


Hazeldean Crossing Inc. 5924 Hazeldean Road
OTT-00250806-B0 Nov 2019
Appendix C - Existing Turning Movement Counts

Turning Movement Count - Peak Hour Diagram
Transportation Services - Traffic Services
Start Time:
Survey Date:
HAZELDEAN RD @ JOHNWOODS ST/VICTOR ST
07:00
Tuesday, December 01, 2015 WO No: 35539
Device: Miovision
543
574
31
19
69
Total
1505
48
2
46 1470
34
13
870
11
2
87
61
117
3
24
4722
1
3
3
1
4
67
1
49
1
941
Cars
EW
S
N
Cars
8
483
434
905 36
38
529
0
204
Peak Hour
81
28
8
455
08:45
Comments
07:45
00
0 0
931
836
0
1
HAZELDEAN RD
JOHNWOODS ST/VICTOR ST
1
066
2
48
22
1
22 21
0
0
0
0
0
AM Period
0
00
00
0
0
HeavyVehicles
HeavyVehicles
Page 1 of 42019-Apr-03

Turning Movement Count - Peak Hour Diagram
Transportation Services - Traffic Services
Start Time:
Survey Date:
HAZELDEAN RD @ JOHNWOODS ST/VICTOR ST
07:00
Tuesday, December 01, 2015 WO No: 35539
Device: Miovision
1181
1204
23
62
90
Total
1944
64
1
64 1857
15
35
641
34
0
120
00
121
1
22
2763
3
0
2
1
2
85
1
33
3
679
Cars
EW
S
N
Cars
25
1097
056
661 18
56
1178
0
241
Peak Hour
120
21
25
1076
17:00
Comments
16:00
00
0 0
740
626
0
0
HAZELDEAN RD
JOHNWOODS ST/VICTOR ST
0
384
1
30
5
0
21 5
0
0
0
0
0
Full Study
0
00
00
0
0
HeavyVehicles
HeavyVehicles
Page 2 of 42019-Apr-03

Turning Movement Count - Peak Hour Diagram
Transportation Services - Traffic Services
Start Time:
Survey Date:
HAZELDEAN RD @ JOHNWOODS ST/VICTOR ST
07:00
Tuesday, December 01, 2015 WO No: 35539
Device: Miovision
881
906
25
29
57
Total
1712
53
1
52 1620
17
12
741
11
1
71
10
106
1
18
2730
3
0
6
0
6
76
0
27
0
776
Cars
EW
S
N
Cars
15
812
017
759 17
17
844
0
177
Peak Hour
70
25
15
787
12:30
Comments
11:30
01
0 0
806
724
0
1
HAZELDEAN RD
JOHNWOODS ST/VICTOR ST
1
376
0
27
8
0
18 8
0
0
0
0
0
MD Period
0
00
00
0
0
HeavyVehicles
HeavyVehicles
Page 3 of 42019-Apr-03

Turning Movement Count - Peak Hour Diagram
Transportation Services - Traffic Services
Start Time:
Survey Date:
HAZELDEAN RD @ JOHNWOODS ST/VICTOR ST
07:00
Tuesday, December 01, 2015 WO No: 35539
Device: Miovision
1181
1204
23
62
90
Total
1944
64
1
64 1857
15
35
641
34
0
120
00
121
1
22
2763
3
0
2
1
2
85
1
33
3
679
Cars
EW
S
N
Cars
25
1097
056
661 18
56
1178
0
241
Peak Hour
120
21
25
1076
17:00
Comments
16:00
00
0 0
740
626
0
0
HAZELDEAN RD
JOHNWOODS ST/VICTOR ST
0
384
1
30
5
0
21 5
0
0
0
0
0
PM Period
0
00
00
0
0
HeavyVehicles
HeavyVehicles
Page 4 of 42019-Apr-03

Turning Movement Count - Full Study Diagram
Transportation Services - Traffic Services
Survey Date:
HAZELDEAN RD @ JOHNWOODS ST/VICTOR ST
Tuesday, December 01, 2015 WO#: 35539
Device: Miovision
HeavyVehicles
Cars
Cars
S
N
EW
673
1503
Total
5676 206
120 2
7261
122
5882
268
6276
5983 1956178
12454
183
6
400
106
13
112
5812
413
222 6336
6558
Total
12895
240
508
6
23
4
25
241
11
552
8
16
2
809 694
21
258250
10
124
8
23014544
116 120
121
1
12
1
13
6337
5629
HAZELDEAN RD
JOHNWOODS ST/VICTOR ST
04 4
000
0
0
0
0
0
0
0 2
01
Comments
HeavyVehicles
Page 1 of 12019-Apr-03

Transportation Services - Traffic Services Work Order
Turning Movement Count - Full Study Summary Report
35539
HAZELDEAN RD @ JOHNWOODS ST/VICTOR ST
AADT FactorSurvey Date:
0 0
40
Northbound:
Total Observed U-Turns
Eastbound: Westbound:
Southbound: 1.30
Tuesday, December 01, 2015
SouthboundNorthbound
HAZELDEAN RDJOHNWOODS ST/VICTOR ST
Westbound
GrandTotal
STRTOT
WBTOT
RTSTLTEB
TOTRTSTLT
STRTOT
SBTOT
RTSTLTNB
TOTRTSTLTPeriod
Eastbound
Full Study
1406126036530329689588404714610362239432441508:0007:00
160714565563551011900178354815110256244492512309:0008:00
14011276463194395813676641125926122933241810:0009:00
17831650844178121580612741531331067632727811812:3011:30
171016018303678212771072546109876621922161513:3012:30
188917481020459532272821650571411098112732522516:0015:00
2066191811785610972574035641641481218533327502217:0016:00
18141700101630960266841361457114896512325143818:0017:00
1367612609627226858821226337112581241310678095521624125812113124Sub Total
40 0 0 4U Turns 0 4
1368012613627626858821226337112581241310678095521624125812113124Total
1.31Note: These volumes are calculated by multiplying the Average Daily 12 hr. totals by 12 to 24 expansion factor.
1.30Note: These volumes are calculated by multiplying the Equivalent 12 hr. totals by the AADT factor.
1.39Note: These values are calculated by multiplying the totals by the appropriate expansion factor.
19016175328724373817617088081568079574148411257672233535916818172EQ 12Hr
247202279211341484106292201145120210502746192814629972943546621923224AVG 12Hr
3238329857148566341392428915001265137589782526191513073857061128631294AVG 24Hr
Comments:
Note: U-Turns provided for approach totals. Refer to 'U-Turn' Report for specific breakdown.
Page 1 of 12019-Apr-03

Turning Movement Count - 15 Minute Summary Report
Survey Date:
HAZELDEAN RD @ JOHNWOODS ST/VICTOR STTuesday, December 01, 2015
35539
Total Observed U-TurnsNorthbound:
Eastbound:
Southbound:
Westbound:
00
40
Transportation Services - Traffic Services W.O.
GrandTotal
STRTOT
WTOTRTSTLT
ETOTRTSTLT
STRTOT
STOTRTSTLT
NTOTRTSTLTTime Period
Northbound Southbound Eastbound Westbound
JOHNWOODS ST/VICTOR ST HAZELDEAN RD
29026357352220621931127181107961207:1507:00
369328100128712282211154130172111153307:3007:15
348312985903214220111362215071480607:4507:30
399357110101000247223510423319014950408:0007:45
401361115510912464228144021140719501408:1508:00
4213811491513222324218104030150151080208:3008:15
40336115581425206318914423319113941408:4508:30
3823531377127321662001029188191180309:0008:45
332298105897019311875342415181070309:1509:00
3543241094103221511991530211506980109:3009:15
3593271224116120521901332251618770009:4509:30
357328128312322002190829221507721410:0009:45
4173851873179519831821332272025500511:4511:30
4524242344225519061731128191216951312:0011:45
4754362165208322021991939322408730412:1512:00
4394052075200219811871034282008600612:3012:15
4083852016193218401701423191603440012:4512:30
4394062061518472000193733261907730413:0012:45
439418220920921980187112113922871013:1513:00
4243922036196118901751432292207320113:3013:15
4684422689250917431611026222002400415:1515:00
4434072341221841735151173626161910001015:3015:15
49246127415254518741701331251807621315:4515:30
48643824492314194916817483627091231816:0015:45
51348330122273618281601430271908310216:1516:00
4674172507239416771411950372511113201116:3016:15
540510306122886204111811230231904710616:4516:30
546508321152979187915919383422210410317:0016:45
4894672759263319271721322191405311117:1517:00
4434112437228716841461832251915730417:3017:15
4784522776260917521561726211605521217:4517:30
4073732248209714901409342416081081118:0017:45
Comment:Note: U-Turns are included in Totals.
124 13 121 258 241 16 552 809 1067 413 5812 112 6337 122 5882 268 6276 12613 13680TOTAL:
Page 1 of 12019-Apr-03

Turning Movement Count - Cyclist Volume Report
Count Date:
HAZELDEAN RD @ JOHNWOODS ST/VICTOR ST
Tuesday, December 01, 2015
35539
07:00Start Time:
Work Order Transportation Services - Traffic Services
HAZELDEAN RDJOHNWOODS ST/VICTOR ST
Grand TotalStreet TotalWestboundEastboundStreet TotalSouthboundNorthboundTime Period
000000008:0007:00
000000009:0008:00
000000010:0009:00
110100012:3011:30
111000013:3012:30
111000016:0015:00
000000017:0016:00
000000018:0017:00
Comment:
3321000..........Total
Page 1 of 12019-Apr-03
Note: These volumes consists of bicycles only (no mopeds or motorcycles) and ARE NOT included in the Turning Movement Count Summary.

35539
Tuesday, December 01, 2015
Turning Movement Count - Heavy Vehicle Report
HAZELDEAN RD @ JOHNWOODS ST/VICTOR ST
Survey Date:
W.O. Transportation Services - Traffic Services
GrandTotal
STRTOT
WTOT
RTSTLTE
TOTRTSTLT
STRTOT
STOT
RTSTLTN
TOTRTST
LTTime Period
Eastbound Westbound
JOHNWOODS ST/VICTOR ST HAZELDEAN RD
Northbound Southbound
706419118045142264112200208:0007:00
686232329030226263111310209:0008:00
525030030020019122101000010:0009:00
444425025019117100000000012:3011:30
737032032038036233201000013:3012:30
807144339227122495203401316:0015:00
423721021016115054103100117:0016:00
1919120120706100000000018:0017:00
448417215720622026183133121821110118Sub Total
Heavy Vehicles include Buses, Single-Unit Trucks and Articulated Trucks. Further, they ARE included in the Turning Movement Count Summary.
0 0 0 0
44841721572062202618313312182110118Total
U-Turns (Heavy Vehicles) 0 0 0
Page 1 of 12019-Apr-03

Turning Movement Count - Pedestrian Volume Report
Count Date:
HAZELDEAN RD @ JOHNWOODS ST/VICTOR ST
Tuesday, December 01, 2015 07:00Start Time:
35539
Work Order Transportation Services - Traffic Services
Grand TotalTotalWB Approach
(N or S Crossing)EB Approach
(N or S Crossing)Total
SB Approach(E or W Crossing)
NB Approach(E or W Crossing)
Time Period
100010107:1507:00
420221107:3007:15
330300007:4507:30
210111008:0007:45
1060642208:0007:00
333000008:1508:00
320211008:3008:15
310121108:4508:30
310121109:0008:45
1273453209:0008:00
200022009:1509:00
000000009:3009:15
111000009:4509:30
220200010:0009:45
531222010:0009:00
420222011:4511:30
200022012:0011:45
110100012:1512:00
530322012:3012:15
1260666012:3011:30
000000012:4512:30
100011013:0012:45
000000013:1513:00
200022013:3013:15
300033013:3012:30
220200015:1515:00
210111015:3015:15
200021115:4515:30
000000016:0015:45
630332116:0015:00
000000016:1516:00
310121116:3016:15
110100016:4516:30
100011017:0016:45
520232117:0016:00
500055017:1517:00
000000017:3017:15
000000017:4517:30
000000018:0017:45
500055018:0017:00
Comment:
582742331256..........Total
Page 1 of 12019-Apr-03

Turning Movement Count - 15 Min U-Turn Total Report
Work Order Transportation Services - Traffic Services
HAZELDEAN RD @ JOHNWOODS ST/VICTOR ST
35539
Tuesday, December 01, 2015Survey Date:
TotalWestboundU-Turn Total
EastboundU-Turn Total
SouthboundU-Turn Total
NorthboundU-Turn Total
Time Period
0000007:1507:00
0000007:3007:15
0000007:4507:30
0000008:0007:45
0000008:1508:00
0000008:3008:15
0000008:4508:30
0000009:0008:45
0000009:1509:00
0000009:3009:15
1100009:4509:30
0000010:0009:45
0000011:4511:30
0000012:0011:45
0000012:1512:00
0000012:3012:15
0000012:4512:30
0000013:0012:45
0000013:1513:00
0000013:3013:15
0000015:1515:00
0000015:3015:15
0000015:4515:30
0000016:0015:45
0000016:1516:00
0000016:3016:15
0000016:4516:30
0000017:0016:45
0000017:1517:00
1100017:3017:15
2200017:4517:30
0000018:0017:45
44000Total
2019-Apr-03 Page 1 of 1

Hazeldean Crossing Inc. 5924 Hazeldean Road
OTT-00250806-B0 Nov 2019
Appendix D - Collision Details Report

Collision Details Report - Public Version
City Operations - Transportation Services
January 1, 2013 December 31, 2017From: To:
No. PedFirst EventVehicle typeVehicle Manoeuver Veh. Dir SurfaceCond'n
ClassificationImpact TypeEnvironmentDate/Day/Time
HAZELDEAN RD @ JOHNWOODS ST/VICTOR STLocation:
Traffic Control: Traffic signal 9Total Collisions:
Other motorvehicle
Automobile,station wagon
Turning rightWestDryP.D. onlySideswipeClear2013-May-10, Fri,21:00
Other motorvehicle
Automobile,station wagon
Turning rightWest
Other motorvehicle
Pick-up truckSlowing or stoppingWestDryP.D. onlyRear endClear2013-May-24, Fri,15:00
Other motorvehicle
Automobile,station wagon
StoppedWest
Other motorvehicle
Passenger vanGoing aheadWestDryP.D. onlySideswipeClear2014-Apr-09, Wed,17:33
Other motorvehicle
Pick-up truckGoing aheadWest
Other motorvehicle
Automobile,station wagon
Going aheadEastWetNon-fatal injuryAngleRain2014-Apr-22, Tue,19:11
Other motorvehicle
Pick-up truckGoing aheadNorth
Other motorvehicle
Automobile,station wagon
Slowing or stoppingEastWetP.D. onlyRear endRain2014-Jun-13, Fri,10:30
Other motorvehicle
Automobile,station wagon
Going aheadEast
Other motorvehicle
Passenger vanTurning rightEastLoose snowP.D. onlyAngleSnow2015-Jan-09, Fri,17:30
Page 1 of 2Wednesday, April 24, 2019

Other motorvehicle
Pick-up truckStoppedNorth
Other motorvehicle
Automobile,station wagon
Slowing or stoppingEastDryP.D. onlyRear endClear2016-Aug-24, Wed,10:49
Other motorvehicle
Automobile,station wagon
StoppedEast
Other motorvehicle
Pick-up truckSlowing or stoppingEastIceP.D. onlySideswipeClear2016-Dec-17, Sat,13:31
Other motorvehicle
Automobile,station wagon
StoppedEast
Other motorvehicle
Pick-up truckStoppedEast
Other motorvehicle
Pick-up truckGoing aheadWestDryP.D. onlyRear endClear2017-May-30, Tue,18:28
Other motorvehicle
Pick-up truckGoing aheadWest
Page 2 of 2Wednesday, April 24, 2019

Hazeldean Crossing Inc. 5924 Hazeldean Road
OTT-00250806-B0 Nov 2019
Appendix E - Intersection Capacity Analysis

HCM Signalized Intersection Capacity Analysis Future Background (2021) - AM
3: Victor St/Johnwoods St & Hazeldean Rd 07/29/2019
Baseline Synchro 10 Report
Page 1
Movement EBL EBT EBR WBL WBT WBR NBL NBT NBR SBL SBT SBR
Lane Configurations
Traffic Volume (vph) 52 951 14 9 528 42 26 1 24 54 1 73
Future Volume (vph) 52 951 14 9 528 42 26 1 24 54 1 73
Ideal Flow (vphpl) 1800 1800 1800 1800 1800 1800 1800 1800 1800 1800 1800 1800
Lane Width 3.5 3.6 3.7 3.5 3.5 3.7 3.7 3.3 3.7 3.4 3.4 3.7
Total Lost time (s) 5.1 6.1 6.1 7.3 6.4 6.4 6.6 6.6
Lane Util. Factor 1.00 0.95 1.00 0.95 1.00 1.00 1.00 1.00
Frpb, ped/bikes 1.00 1.00 1.00 1.00 1.00 0.98 1.00 0.98
Flpb, ped/bikes 1.00 1.00 1.00 1.00 0.99 1.00 1.00 1.00
Frt 1.00 1.00 1.00 0.99 1.00 0.86 1.00 0.85
Flt Protected 0.95 1.00 0.95 1.00 0.95 1.00 0.95 1.00
Satd. Flow (prot) 1609 3275 1691 3138 1686 1436 1632 1441
Flt Permitted 0.39 1.00 0.25 1.00 0.70 1.00 0.74 1.00
Satd. Flow (perm) 667 3275 448 3138 1249 1436 1270 1441
Peak-hour factor, PHF 0.90 0.90 0.90 0.90 0.90 0.90 0.90 0.90 0.90 0.90 0.90 0.90
Adj. Flow (vph) 58 1057 16 10 587 47 29 1 27 60 1 81
RTOR Reduction (vph) 0 1 0 0 3 0 0 25 0 0 74 0
Lane Group Flow (vph) 58 1072 0 10 631 0 29 3 0 60 8 0
Confl. Peds. (#/hr) 3 1 1 3 4 3 3 4
Heavy Vehicles (%) 5% 4% 15% 0% 6% 11% 2% 2% 2% 2% 100% 1%
Turn Type pm+pt NA pm+pt NA Perm NA Perm NA
Protected Phases 5 2 1 6 8 4
Permitted Phases 2 6 8 4
Actuated Green, G (s) 90.4 85.1 82.0 80.8 10.1 10.1 9.9 9.9
Effective Green, g (s) 90.4 85.1 82.0 80.8 10.1 10.1 9.9 9.9
Actuated g/C Ratio 0.79 0.74 0.71 0.70 0.09 0.09 0.09 0.09
Clearance Time (s) 5.1 6.1 6.1 7.3 6.4 6.4 6.6 6.6
Vehicle Extension (s) 3.0 3.0 3.0 3.0 3.0 3.0 3.0 3.0
Lane Grp Cap (vph) 567 2423 332 2204 109 126 109 124
v/s Ratio Prot c0.00 c0.33 0.00 0.20 0.00 0.01
v/s Ratio Perm 0.08 0.02 0.02 c0.05
v/c Ratio 0.10 0.44 0.03 0.29 0.27 0.03 0.55 0.06
Uniform Delay, d1 2.8 5.8 4.9 6.4 49.0 48.0 50.4 48.3
Progression Factor 1.00 1.00 1.00 1.00 1.00 1.00 1.00 1.00
Incremental Delay, d2 0.1 0.6 0.0 0.3 1.3 0.1 5.9 0.2
Delay (s) 2.9 6.4 4.9 6.7 50.3 48.0 56.3 48.5
Level of Service A A A A D D E D
Approach Delay (s) 6.2 6.7 49.2 51.8
Approach LOS A A D D
Intersection Summary
HCM 2000 Control Delay 10.9 HCM 2000 Level of Service B
HCM 2000 Volume to Capacity ratio 0.45
Actuated Cycle Length (s) 115.0 Sum of lost time (s) 19.0
Intersection Capacity Utilization 59.1% ICU Level of Service B
Analysis Period (min) 15
c Critical Lane Group

HCM Signalized Intersection Capacity Analysis Future Background (2021) - PM
3: Victor St/Johnwoods St & Hazeldean Rd 07/29/2019
Baseline Synchro 10 Report
Page 1
Movement EBL EBT EBR WBL WBT WBR NBL NBT NBR SBL SBT SBR
Lane Configurations
Traffic Volume (vph) 70 700 38 27 1199 61 24 0 5 36 3 93
Future Volume (vph) 70 700 38 27 1199 61 24 0 5 36 3 93
Ideal Flow (vphpl) 1800 1800 1800 1800 1800 1800 1800 1800 1800 1800 1800 1800
Lane Width 3.5 3.6 3.7 3.5 3.5 3.7 3.7 3.3 3.7 3.4 3.4 3.7
Total Lost time (s) 6.1 6.1 6.1 6.1 6.6 6.6 6.6 6.6
Lane Util. Factor 1.00 0.95 1.00 0.95 1.00 1.00 1.00 1.00
Frpb, ped/bikes 1.00 1.00 1.00 1.00 1.00 1.00 1.00 0.99
Flpb, ped/bikes 1.00 1.00 1.00 1.00 1.00 1.00 1.00 1.00
Frt 1.00 0.99 1.00 0.99 1.00 0.85 1.00 0.85
Flt Protected 0.95 1.00 0.95 1.00 0.95 1.00 0.95 1.00
Satd. Flow (prot) 1691 3322 1691 3291 1642 1479 1534 1467
Flt Permitted 0.15 1.00 0.33 1.00 0.67 1.00 0.75 1.00
Satd. Flow (perm) 262 3322 591 3291 1166 1479 1217 1467
Peak-hour factor, PHF 0.90 0.90 0.90 0.90 0.90 0.90 0.90 0.90 0.90 0.90 0.90 0.90
Adj. Flow (vph) 78 778 42 30 1332 68 27 0 6 40 3 103
RTOR Reduction (vph) 0 2 0 0 2 0 0 5 0 0 94 0
Lane Group Flow (vph) 78 818 0 30 1398 0 27 1 0 40 12 0
Confl. Peds. (#/hr) 2 1 1 2 2 2
Heavy Vehicles (%) 0% 2% 3% 0% 2% 0% 5% 0% 0% 9% 0% 1%
Turn Type pm+pt NA pm+pt NA Perm NA Perm NA
Protected Phases 5 2 1 6 8 4
Permitted Phases 2 6 8 4
Actuated Green, G (s) 92.1 86.6 88.5 84.8 10.9 10.9 10.9 10.9
Effective Green, g (s) 92.1 86.6 88.5 84.8 10.9 10.9 10.9 10.9
Actuated g/C Ratio 0.77 0.72 0.74 0.71 0.09 0.09 0.09 0.09
Clearance Time (s) 6.1 6.1 6.1 6.1 6.6 6.6 6.6 6.6
Vehicle Extension (s) 3.0 3.0 3.0 3.0 3.0 3.0 3.0 3.0
Lane Grp Cap (vph) 266 2397 469 2325 105 134 110 133
v/s Ratio Prot c0.01 0.25 0.00 c0.42 0.00 0.01
v/s Ratio Perm 0.21 0.05 0.02 c0.03
v/c Ratio 0.29 0.34 0.06 0.60 0.26 0.00 0.36 0.09
Uniform Delay, d1 5.6 6.2 4.2 9.0 50.8 49.6 51.3 50.0
Progression Factor 1.00 1.00 1.00 1.00 1.00 1.00 1.00 1.00
Incremental Delay, d2 0.6 0.4 0.1 1.2 1.3 0.0 2.0 0.3
Delay (s) 6.2 6.6 4.3 10.1 52.1 49.6 53.3 50.3
Level of Service A A A B D D D D
Approach Delay (s) 6.5 10.0 51.6 51.1
Approach LOS A B D D
Intersection Summary
HCM 2000 Control Delay 11.7 HCM 2000 Level of Service B
HCM 2000 Volume to Capacity ratio 0.56
Actuated Cycle Length (s) 120.0 Sum of lost time (s) 18.8
Intersection Capacity Utilization 66.4% ICU Level of Service C
Analysis Period (min) 15
c Critical Lane Group

HCM Signalized Intersection Capacity Analysis Future Total (2021) - AM
3: Victor St/Johnwoods St & Hazeldean Rd 11/07/2019
Baseline Synchro 10 Report
Page 1
Movement EBL EBT EBR WBL WBT WBR NBL NBT NBR SBL SBT SBR
Lane Configurations
Traffic Volume (vph) 52 951 20 12 528 42 33 1 46 54 1 73
Future Volume (vph) 52 951 20 12 528 42 33 1 46 54 1 73
Ideal Flow (vphpl) 1800 1800 1800 1800 1800 1800 1800 1800 1800 1800 1800 1800
Lane Width 3.5 3.6 3.7 3.5 3.5 3.7 3.7 3.3 3.7 3.4 3.4 3.7
Total Lost time (s) 5.1 6.1 6.1 7.3 6.4 6.4 6.6 6.6
Lane Util. Factor 1.00 0.95 1.00 0.95 1.00 1.00 1.00 1.00
Frpb, ped/bikes 1.00 1.00 1.00 1.00 1.00 0.98 1.00 0.98
Flpb, ped/bikes 1.00 1.00 1.00 1.00 0.99 1.00 1.00 1.00
Frt 1.00 1.00 1.00 0.99 1.00 0.85 1.00 0.85
Flt Protected 0.95 1.00 0.95 1.00 0.95 1.00 0.95 1.00
Satd. Flow (prot) 1609 3270 1691 3138 1686 1432 1633 1441
Flt Permitted 0.40 1.00 0.24 1.00 0.70 1.00 0.72 1.00
Satd. Flow (perm) 676 3270 434 3138 1249 1432 1243 1441
Peak-hour factor, PHF 0.90 0.90 0.90 0.90 0.90 0.90 0.90 0.90 0.90 0.90 0.90 0.90
Adj. Flow (vph) 58 1057 22 13 587 47 37 1 51 60 1 81
RTOR Reduction (vph) 0 1 0 0 3 0 0 46 0 0 74 0
Lane Group Flow (vph) 58 1078 0 13 631 0 37 6 0 60 8 0
Confl. Peds. (#/hr) 3 1 1 3 4 3 3 4
Heavy Vehicles (%) 5% 4% 15% 0% 6% 11% 2% 2% 2% 2% 100% 1%
Turn Type pm+pt NA pm+pt NA Perm NA Perm NA
Protected Phases 5 2 1 6 8 4
Permitted Phases 2 6 8 4
Actuated Green, G (s) 89.1 83.8 83.1 80.7 10.2 10.2 10.0 10.0
Effective Green, g (s) 89.1 83.8 83.1 80.7 10.2 10.2 10.0 10.0
Actuated g/C Ratio 0.77 0.73 0.72 0.70 0.09 0.09 0.09 0.09
Clearance Time (s) 5.1 6.1 6.1 7.3 6.4 6.4 6.6 6.6
Vehicle Extension (s) 3.0 3.0 3.0 3.0 3.0 3.0 3.0 3.0
Lane Grp Cap (vph) 566 2382 339 2202 110 127 108 125
v/s Ratio Prot c0.00 c0.33 0.00 0.20 0.00 0.01
v/s Ratio Perm 0.07 0.03 0.03 c0.05
v/c Ratio 0.10 0.45 0.04 0.29 0.34 0.04 0.56 0.06
Uniform Delay, d1 3.1 6.3 4.6 6.4 49.2 47.9 50.4 48.2
Progression Factor 1.00 1.00 1.00 1.00 1.00 1.00 1.00 1.00
Incremental Delay, d2 0.1 0.6 0.0 0.3 1.8 0.1 6.1 0.2
Delay (s) 3.1 6.9 4.7 6.7 51.0 48.1 56.4 48.4
Level of Service A A A A D D E D
Approach Delay (s) 6.7 6.7 49.3 51.8
Approach LOS A A D D
Intersection Summary
HCM 2000 Control Delay 11.8 HCM 2000 Level of Service B
HCM 2000 Volume to Capacity ratio 0.46
Actuated Cycle Length (s) 115.0 Sum of lost time (s) 19.0
Intersection Capacity Utilization 59.4% ICU Level of Service B
Analysis Period (min) 15
c Critical Lane Group

HCM Signalized Intersection Capacity Analysis Future Total (2021) - PM
3: Victor St/Johnwoods St & Hazeldean Rd 11/07/2019
Baseline Synchro 10 Report
Page 1
Movement EBL EBT EBR WBL WBT WBR NBL NBT NBR SBL SBT SBR
Lane Configurations
Traffic Volume (vph) 70 700 47 42 1199 61 33 0 10 36 3 93
Future Volume (vph) 70 700 47 42 1199 61 33 0 10 36 3 93
Ideal Flow (vphpl) 1800 1800 1800 1800 1800 1800 1800 1800 1800 1800 1800 1800
Lane Width 3.5 3.6 3.7 3.5 3.5 3.7 3.7 3.3 3.7 3.4 3.4 3.7
Total Lost time (s) 6.1 6.1 6.1 6.1 6.6 6.6 6.6 6.6
Lane Util. Factor 1.00 0.95 1.00 0.95 1.00 1.00 1.00 1.00
Frpb, ped/bikes 1.00 1.00 1.00 1.00 1.00 1.00 1.00 0.99
Flpb, ped/bikes 1.00 1.00 1.00 1.00 1.00 1.00 1.00 1.00
Frt 1.00 0.99 1.00 0.99 1.00 0.85 1.00 0.85
Flt Protected 0.95 1.00 0.95 1.00 0.95 1.00 0.95 1.00
Satd. Flow (prot) 1691 3315 1691 3291 1642 1479 1534 1467
Flt Permitted 0.15 1.00 0.32 1.00 0.67 1.00 0.75 1.00
Satd. Flow (perm) 266 3315 570 3291 1167 1479 1212 1467
Peak-hour factor, PHF 0.90 0.90 0.90 0.90 0.90 0.90 0.90 0.90 0.90 0.90 0.90 0.90
Adj. Flow (vph) 78 778 52 47 1332 68 37 0 11 40 3 103
RTOR Reduction (vph) 0 3 0 0 2 0 0 10 0 0 94 0
Lane Group Flow (vph) 78 827 0 47 1398 0 37 1 0 40 12 0
Confl. Peds. (#/hr) 2 1 1 2 2 2
Heavy Vehicles (%) 0% 2% 3% 0% 2% 0% 5% 0% 0% 9% 0% 1%
Turn Type pm+pt NA pm+pt NA Perm NA Perm NA
Protected Phases 5 2 1 6 8 4
Permitted Phases 2 6 8 4
Actuated Green, G (s) 90.6 85.1 89.8 84.7 11.0 11.0 11.0 11.0
Effective Green, g (s) 90.6 85.1 89.8 84.7 11.0 11.0 11.0 11.0
Actuated g/C Ratio 0.75 0.71 0.75 0.71 0.09 0.09 0.09 0.09
Clearance Time (s) 6.1 6.1 6.1 6.1 6.6 6.6 6.6 6.6
Vehicle Extension (s) 3.0 3.0 3.0 3.0 3.0 3.0 3.0 3.0
Lane Grp Cap (vph) 266 2350 474 2322 106 135 111 134
v/s Ratio Prot c0.01 0.25 0.00 c0.42 0.00 0.01
v/s Ratio Perm 0.21 0.07 0.03 c0.03
v/c Ratio 0.29 0.35 0.10 0.60 0.35 0.01 0.36 0.09
Uniform Delay, d1 5.7 6.8 4.0 9.0 51.1 49.5 51.2 49.9
Progression Factor 1.00 1.00 1.00 1.00 1.00 1.00 1.00 1.00
Incremental Delay, d2 0.6 0.4 0.1 1.2 2.0 0.0 2.0 0.3
Delay (s) 6.3 7.2 4.1 10.2 53.1 49.6 53.2 50.2
Level of Service A A A B D D D D
Approach Delay (s) 7.1 10.0 52.3 51.0
Approach LOS A A D D
Intersection Summary
HCM 2000 Control Delay 12.1 HCM 2000 Level of Service B
HCM 2000 Volume to Capacity ratio 0.56
Actuated Cycle Length (s) 120.0 Sum of lost time (s) 18.8
Intersection Capacity Utilization 66.4% ICU Level of Service C
Analysis Period (min) 15
c Critical Lane Group