Embed Size (px)
Citation preview

Hazard Identification and Risk Analysis: Updatei
Ohio Emergency Management Agency2855 West Dublin-Granville Road
Columbus, Ohio 43235
December 2007

Page 2 of 39
TABLE OF CONTENTS:
TABLE OF CONTENTS:............................................................................................................... 2LIST OF FIGURES ........................................................................................................................ 3INTRODUCTION .......................................................................................................................... 4
A General Overview of Hazards in Ohio.................................................................................... 4An Ohio Profile........................................................................................................................... 7Geography and Climate .............................................................................................................. 7The Economy of Ohio (including transportation)....................................................................... 7A Historical Review of Disasters................................................................................................ 8
RISK ASSESSMENT, THE ANALYSIS PROCESS (METHODOLOGY, FACTORS, ANDVALUES) ..................................................................................................................................... 15
Frequency.................................................................................................................................. 15Average Response Duration ..................................................................................................... 16Average Speed of Onset............................................................................................................ 16Average Magnitude (Impact) .................................................................................................... 16Impact on Business ................................................................................................................... 16Impact on Human (People) ....................................................................................................... 17Impact on Property.................................................................................................................... 17Factor/Value Overview............................................................................................................. 17HAZARD ANALYSIS AND RISK ASSESSMENT AND DETAILED HAZARDOVERVIEW ............................................................................................................................. 18Natural Hazards ........................................................................................................................ 18
Flood, Flash Flood, Seiche ................................................................................................... 18Windstorm, Tornadoes .......................................................................................................... 19Emerging Diseases................................................................................................................ 20Earthquakes .......................................................................................................................... 20Snow, Ice, Hail and Sleet ...................................................................................................... 23Landslide, Mudslide, Subsidence .......................................................................................... 23
Human Caused Hazards............................................................................................................ 25Building/Structure Collapse.................................................................................................. 25Water Control Structure (Dam/Levee Failure)..................................................................... 25Product Defect or Contamination......................................................................................... 26Terrorism (CBRNE and Cyber) ............................................................................................ 26Explosion/Fire....................................................................................................................... 27
ATTACHMENT 1: DETAILED HAZARD ANALYSIS............................................................ 28ATTACHMENT 2: HAZARD RANKING SUMMARY SHEET............................................... 37

Page 3 of 39
LIST OF FIGURES
Figure 1: Hazards Identified ........................................................................................................... 5
Figure 2: Historical Events and Hazards ........................................................................................ 8
Figure 3: Presidential Disaster and Emergency Declarations in Ohio with Costs, by County(1964-01)............................................................................................................................... 10
Figure 4: Flood Damage Comparison Chart for Ohio (1997-98) ................................................. 19
Figure 5: Ohio's Tornado History (1950-99) ................................................................................ 19
Figure 6: Earthquake Epicenters in Ohio and Adjacent Areas ..................................................... 21
Figure 7: Effects of a Major New Madrid Earthquake in Ohio .................................................... 22
Figure 8: Ohio Landslides............................................................................................................. 24
Figure 9: Ohio Subsidence and Landslides................................................................................... 24
Figure 10: Class I Dams in Ohio................................................................................................... 26
Page 4 of 39
INTRODUCTION
The 2007 Edition of the Ohio Hazard Identification and Risk Assessment (HIRA) is a revision from theMarch 2003 document. Similar to the ’03 version, this document was prepared by Plans Branch personnelat Ohio EMA with the assistance of all branches at Ohio EMA and other state/federal partners. Inparticular, the work performed by the Mitigation Branch and its hazard analysis in the EnhancedMitigation Plan was very beneficial.
The intent of this document is to be a useful tool for state and local emergency management partners todiscuss hazard and vulnerability. The HIRA does not provide policy or action-based recommendations tomanage hazards. This document is one element of a comprehensive emergency management program thatincorporates mitigation, preparedness, response and recovery. Mitigation plans, the State of OhioEmergency Operations Plan as well as standard operating procedures round-out a comprehensive programto manage hazards.
Emergency management in Ohio is governed by Ohio Revised Code 5502. Sections 5502.21 mandatesthat the EMA, a division of the Department of Public Safety, is the primary coordinating agency forstatewide emergency readiness activities to meet the threats posed by various hazards.ii In cooperationwith other state offices and agencies, the agency has developed this analysis of the primary hazards thatmay threaten both lives and property.
Much discussion about hazards, hazard identification and risk analysis permeates the professional andacademic literature in emergency management. For the purpose of this HIRA, we will use the OhioRevised Code (ORC) explanation of hazard. ‘Hazards’ in Chapter 5502.21 of the ORC are defined as:"…means any actual or imminent threat to the survival or overall health, safety, or welfare of the civilianpopulation that is caused by any natural, human-made, or technological event.”iii
As defined by the ORC, "Hazard identification means an identification, historical analysis, inventory, orspatial distribution of risks that could affect a specific geographical area and that would cause a threat tothe survival, health, safety, or welfare of the civilian population, the property of that population, or theenvironment.”iv The National Fire Protection Association (NFPA) Standard 1600 requires entities to“identify hazards, monitor those hazards, the likelihood of their occurrence, and the vulnerability ofpeople, property and the environment, and the entity itself to those hazards”v as part of the riskassessment process.
A General Overview of Hazards in Ohio
Upon reviewing the literature in hazard analysis, nearly sixty hazards were identified. These hazardsinclude those listed in NFPA 1600, the 15 National Planning Scenarios, the National Plan Review, areport produced for Ohio EMA by URS, and Ohio EMA’s Enhanced Mitigation Plan. To help simplifythe hazards, three major groups have been created to categorize the hazards based on the categoriesrecommended in NFPA 1600. The categories are Natural Hazards/Events, Human Caused Hazards/Eventsand Technological Hazards/Events as shown in Figure 1. Each of the hazards identified are not mutuallyexclusive. Meaning, rain and flooding may lead to landslides/mudslides/subsidence and hazardousmaterial events. Therefore, the hazard categories are grouped into five sub-groups of hazards below thethree categories. For instance, the Natural Hazards utilize Biological, Geological and Meteorological sub-categories. Some hazards are not germane to Ohio and/or not likely enough a scenario to warrant

Page 5 of 39
consideration in this hazard identification and risk analysis. These non-analyzed hazards are noted by theheading of “Not analyzed for HIRA”.
Figure 1: Hazards Identified
Natural Hazards/Events: Human Caused Hazards/Events:Accidental
Air/Water Pollution, ContaminationBuilding/Structure CollapseCommunications System InterruptionsEnergy/Power/Utility FailureExplosion/FireFuel/Resource ShortageHazardous MaterialTransportation AccidentWater Control Structure
IntentionalCivil Disturbance, Public Unrest, Mass HysteriaCriminal ActivityProduct DefectTerrorism
Not Analyzed for HIRA:
BiologicalAnimal or Insect Infestation or DamageEmerging Disease
GeologicalEarthquakeLandslide, Mudslide, Subsidence
MeteorologicalDroughtExtreme TemperaturesFireFlood, Flash Flood, SeicheLightning StrikesSnow, Ice, Hail, SleetWindstorm, Tornado
Technological Hazards/Events:
Central Computer, Mainframe, Software, or ApplicationFailureEnergy/Power/UtilityTelecommunications
* Not explicitly listed in NFPA 1600
Ancillary Support Equipment Failure (support and lab-basedequipment)AvalancheDiscriminationDisinformation (deliberate)Dust StormElectromagnetic Pulse (intensely fluctuating magnetic field)Enemy Attack/WarFamineFinancial Issues (Economic Depression, Inflation, FinancialSystem Collapse)Geomagnetic Storm (temporary disturbance of atmospherecausing communications disruption, among other things)GlacierHarassmentHurricaneIcebergInsurrection (revolt)Misinformation (non-deliberate)SabotageSand StormStrike or Labor DisputeTidal SurgeTropical CycloneTsunamiWater SpoutWorkplace ViolenceVolcano

Page 6 of 39
The most damaging hazards/events are floods and tornadoes. Other severe weather events, such as winterstorms, have also led to floods or costly recovery actions. Drought has also led to agricultural losses andforced water users to seek assistance during these sustained periods of insufficient precipitation.
For over 200 years, earthquakes, often centered on the Anna (Shelby County) Fault Line, have alsooccurred in Ohio, with most classified as “minor” in nature. A large-scale (regional) event involving theNew Madrid, Missouri fault, could significantly affect portions of southwestern Ohio.
Activities associated with humankind also have their effects; woodland and field fires show a need toreduce this costly resource depletion. Mine closings have led to issues related to subsidence andlandslides. From the 1940s until the present, closings were made without actions to prevent shaftcollapses. Urban expansion, or new highway construction, has led to damages related to these collapses.Class I and other earthen dams also pose a potential threat to adjacent, or downstream, communities(although not to the extent of floods or tornadoes). Many of these dams serve as up-ground reservoirs orrecreational sites. If not properly built or maintained, they may fail, leading to downstream flooding andstrained response capabilities.
Over 50 years, the “technical dependency” of the state and nation has become a fact of life. The increaseduse of synthetics has led to both storage and disposal problems. HAZMAT incidents remain as the mostcommon form of technological threat to Ohio, occurring almost daily. Incidents involving the shipmentand handling of low-level radioactive isotopes have also required state response actions over a period ofyears.
In addition to fossil fuels, electric power generation now uses nuclear technology. Three nucleargenerating facilities are sited in, or within five miles of, Ohio. The 50-mile ingestion pathway from theEnrico Fermi plant in Michigan also extends below the state line. In an emergency involving a singlepower plant, over 95,000 residents could be affected by accidental emissions. Response and recoveryactions could cost millions of public and private sector dollars.
Three separate U.S. Department of Energy (DOE) facilities also pose a potential risk. The issue of on-sitewaste treatment and the removal from these sites poses a unique hazard for adjacent communities. In theevent of a problem, local subdivisions (and the state) would be engaged in extensive recovery actions.
Passenger and cargo airlines continue to cover the state’s airspace daily and railway accidents remain amatter of concern in areas of high traffic density. Like other hazards, transportation events may not occurregularly, but authorities in areas with a high density of air or rail traffic should weigh the potential of atransportation emergency.
Another significant concern has been planning the consideration of emerging diseases, such as Avian Flu.This event type would likely be regional if not global in nature. Unlike other events, this would notdirectly affect our infrastructure but strike the personnel needed to respond and recover. Large numbers ofpeople would likely expire from this type of event.
Since 1964, nearly 45 major emergency events have received a Presidential Declaration of Disaster. As aresult, Ohioans have received over hundreds of millions in federal assistance monies. The EMA hasassisted both the public and private sectors in obtaining this assistance.

Page 7 of 39
Although hazards may either decrease, or increase, from a strictly numerical standpoint, inflationary laborand material trends have caused overall recovery costs to rise. Each new event is more costly to the stateand nation than its predecessors.
As national mutual aid between states grows, our state may have to contend with hazards not necessarilyassociated with Ohio. For instance, Ohio sent numerous resources with the nearly 4,000 Ohio NationalGuard and civilian personnel to Hurricane Katrina and Rita in the fall/winter of 2005. Planning andprocedures are being developed and/or revised to deal with events occurring in other regions of thecountry.
An Ohio Profile
All geographical and political subdivisions of the state are vulnerable to some form of natural,technological, or other hazard. The effects of these (regardless of type or size) upon the state may varydue to differences in climate, geography, or land use. A better understanding of both hazards andassociated risks may be obtained by a brief examination of the characteristics of the state.
Geography and Climate
With a total land area of 40,948 square miles and a 2005 population in excess of 11,464,042, Ohio ranks35th in size and seventh in population in comparison with the balance of the U.Svi.
Topographically, the state presents a varied combination of landforms, which are diagonally dividedbetween the flat, glaciated, areas of the north - northwest to the unglaciated highlands in the south andsoutheast. The steeply incised landforms in the south and east have often contributed to flooding,mudslides, and other effects via rapid runoff from heavy rains and meltwater. In the north and west, thelevel topography has also received a share of flooding when heavy snowstorms have been followed byrapid meltwater discharges.
The state possesses a continental climate ranging through the year from cold, damp winters to warm,humid summers with prevailing westerly wind patterns. Annual temperature ranges vary from an averageof 37.0 degrees F to an average of 85.0 degrees F in July. Average annual precipitation, both rain andsnow, is 37.0 inches overall.
The Economy of Ohio (including transportation)
Ohio has a diversified economy based upon agriculture, extractive, manufacturing, and various serviceindustries or activities. The southeastern highlands are especially rich in mineral resources, and althoughreduced in recent years, extractive mineral and mining activities (coal, oil, gas, and aggregates) add anannual $2+ billion to the economy. Manufacturing contributes $245+ billion to the state’s economicpicture. Agriculture, extractive forestry, and services contribute billions more to the total. The balance ofeconomic activity consists of various research and development efforts.
An extensive transportation network supports this economy. State, federal and interstate highways formconnecting links to, or around, major metropolitan areas. Both large and medium-sized cities hostcommercial air traffic carriers. Although reduced in total mileage and traffic volume, rail lines still linkmining, industrial, and metropolitan centers. Waterborne commerce (via barge or ship) contributes tolocal economies along the Ohio River and the Lake Erie shore.

Page 8 of 39
A Historical Review of Disasters
For almost 200 years, the State of Ohio has experienced disasters varying in origins and effects. Some ofthe more noteworthy of these, which resulted in loss of life or economic damages, are listed in Figure l onthe following page:
Figure 2: Historical Events and Incidents
Name of Disaster Year Hazard/Event Type Location CasualtiesCholera Epidemic 1849/50 Bio/Epidemiological Statewide 5,000 +Rail Bridge Collapse 1876 Transportation Ashtabula 92Collinwood School Fire 1908 Fire Cleveland 17Spring Flood 1913 Flood S/SW Ohio 467Influenza Epidemic 1918 Bio/Epidemiological Statewide Multiple
ThousandsCleveland Clinic Fire 1929 Fire Cuyahoga 123Millwood Mine Disaster 1930 Mine Fire – Collapse Athens Co. 82Penitentiary Fire -Columbus
1930 Prison Fire Franklin Co. 322
Winter Flood 1937 Flood Statewide 250Gas Explosion & Fire 1944 Technological + Fire Cleveland 130Blizzard 1950 Winter Storm Statewide UnknownPenitentiary Fire -Columbus
1952 Prison Fire Franklin Co. 0
Winter/Spring Floods 1959 Flood Statewide UnknownNursing Home Fire 1963 Fire Marietta 95Lake Central/TWACrashes
1967 Transportation N&W Ohio 70 +(Combined)
Prison Riot - Columbus 1968 Other (Prison Riot) Franklin Co. 5Xenia Tornadoes 1974/ 2000 Tornadoes Greene Co. 35
(Combined)Blizzard 1978 Winter Storm Statewide 51Explosion/Fire -Miamisburg
1986 Technological + Fire Butler Co. 0
Train wreck-HAZMATSpill
1986 Transportation Miamisburg 0
Flash Flood – Shadyside 1990 Flash Flood Belmont Co. 26Prison Riot – Lucasville 1993 Other (Prison Riot) Scioto Co. 11Winter/Summer Floods 1996-97-98 Flood E & S Ohio 17
(Combined)
Winter Storms 2004-05 Severe Winter Weather Statewide 0
Source: Ohio Almanac/Contributing agencies/Ohio EMA (Plans)
The previous figure shows some of the historically serious events (with hazards) occurring since 1849 byevents and mortality statistics, but not property damages or other costs.

Page 9 of 39
Since l964, many events have received a Declaration of Disaster by the President of the United States(Figure 2). The figure below provides a breakout of the types of federal assistance, amounts, hazard typeas well as date with federal disaster number.

Pag
e10
of
39
Fig
ure
3:
Pre
sid
enti
alD
isas
ter
and
Em
erge
ncy
Dec
lara
tion
sin
Oh
iow
ith
Cos
ts,b
yC
ou
nty
vii(1
96
4-0
1)
Dis
aste
rN
um
ber
Dat
eD
ecla
red
Dis
aste
rP
rogr
amIn
cid
ent
Typ
eC
oun
ties
Dec
lare
Fu
nd
sP
rovi
ded
DR
-1
67
Mar
ch2
4,
196
4P
AH
eav
yra
ins
and
flo
od
ing
Ad
ams,
Ath
ens,
Au
glai
zeB
elm
ont
,B
row
n,B
utle
r,C
arro
ll,
Cle
rmo
nt,
Cli
nto
n,C
olu
mb
iana
,C
osh
oct
on,
Cu
yaho
ga,
Del
awar
e,F
airf
ield
,F
rank
lin,
Gal
lia,
Gea
uga
,G
uern
sey,
Gre
ene,
Ham
ilto
n,H
arri
son,
Ho
ckin
g,Ja
ckso
n,Je
ffer
son,
Lak
e,L
awre
nce,
Lic
kin
g,M
edin
a,M
eig
s,M
iam
i,M
onr
oe,
Mo
rgan
,M
uski
ng
um
,N
ob
le,
Per
ry,
Pic
kaw
ay,
Pik
e,P
reb
le,
Ric
hlan
d,
Ro
ss,
Sci
oto
,S
um
mit
,T
rum
bul
l,T
usca
raw
as,
Vin
ton,
War
ren,
Was
hin
gto
n,
$5
71
,48
2(P
)
DR
-1
91
Ap
ril
14
,1
965
PA
Tor
nad
oes
and
hig
hw
ind
sA
llen
,C
uya
hoga
,D
elaw
are,
Han
cock
,H
arri
son,
Hig
hlan
d,
Lo
rain
,L
ucas
,M
edin
a,M
erce
r,M
orr
ow
,P
icka
way
,S
enec
a,S
helb
y,V
anW
ert
$2
75
,24
8(P
)
DR
-2
38
May
4,
19
68
PA
Tor
nad
oes
Bro
wn,
Cle
rmo
nt,
Gal
lia,
Lic
kin
g,S
cio
to$
27
0,0
00
(P)
DR
-2
43
June
5,
19
68
PA
Hea
vy
rain
san
dfl
oo
din
gA
dam
s,A
then
s,B
row
n,B
utle
r,C
lerm
ont
,C
lin
ton,
Fai
rfie
ld,
Fra
nkli
n,F
ayet
te,
Gal
lia,
Gre
ene,
Gue
rnse
y,H
amil
ton,
Ho
ckin
g,Ja
ckso
n,L
awre
nce,
Lic
king
,M
eigs
,M
onr
oe,
Mo
ntgo
mer
y,M
org
an,
No
ble
,P
erry
,P
icka
way
,P
ike,
Ro
ss,
Sci
oto
,V
into
n,W
arre
n,W
ashi
ngt
on
$6
00
,00
0(P
)
DR
-2
66
July
15
,1
969
PA
Hea
vy
sto
rms
and
flo
od
sA
shla
nd,
Ash
tab
ula,
Co
sho
cto
n,C
uya
hoga
,E
rie,
Har
riso
n,H
olm
es,
Hur
on,
Lak
e,L
ora
in,
Luc
as,
Med
ina,
Mo
rgan
,M
uski
ng
um
,O
ttaw
a,R
ich
land
,S
and
usk
y,S
enec
a,S
tark
,T
rum
bul
l,T
usca
raw
as,
Way
ne,
Wo
od
$1
,000
,00
0(P
)
DR
-3
45
July
19
,1
972
PA
Sto
rms
and
flo
od
ing
Ash
tab
ula,
Bel
mo
nt,
Cu
yaho
ga,
Jeff
erso
n,L
ake,
Lo
rain
,M
onr
oe
$1
,328
,09
8(P
)
DR
-3
62
No
vem
ber
24
,1
97
2P
AS
torm
san
dfl
oo
din
gE
rie,
Lak
e,L
ora
in,
Luc
as,
Ott
awa
$6
15
,86
3(P
)
DR
-3
77
Ap
ril
27
,1
973
PA
Sto
rms
and
flo
od
ing
Ash
tab
ula,
Cu
yaho
ga,
Eri
e,L
ake,
Lo
rain
,L
ucas
,O
ttaw
a,S
and
usk
y$
1,4
17.9
75
(P)
DR
-3
90
June
4,
19
73
PA
Mud
slid
esH
amil
ton,
Was
hin
gto
n$
1,4
34,6
84
(P)
DR
-4
21
Ap
ril
4,
19
74
PA
/IF
GT
orna
do
esan
dhi
gh
win
ds
Ad
ams,
But
ler,
Cla
rk,
Del
awar
e,F
ayet
te,
Fra
nkl
in,
Gre
ene,
Ham
ilto
n,M
adis
on,
Pau
ldin
g,P
icka
way
,P
utna
m,
Su
mm
it,
War
ren,
$1
0,2
50
,45
4(P
)$
1,9
45,8
33
(I)

Pag
e11
of
39
Dis
aste
rN
um
ber
Dat
eD
ecla
red
Dis
aste
rP
rogr
amIn
cid
ent
Typ
eC
oun
ties
Dec
lare
Fu
nd
sP
rovi
ded
DR
-4
36
May
31
,1
974
PA
Hea
vy
rain
san
dfl
oo
din
gL
ucas
,O
ttaw
a,S
and
usk
y$
85
8,8
24
(P)
DR
-4
45
July
11
,1
974
PA
Hea
vy
rain
san
dfl
oo
din
gW
arre
n$
50
7,3
64
(P)
DR
-4
80
Sep
tem
ber
11
,1
97
5P
AF
loo
ds
Bel
mo
nt,
Cu
yaho
ga,
Jeff
erso
n,
Lak
e,$
3,3
20,4
93
(P)
DR
-3
05
5-E
MJa
nuar
y2
6,
19
78
PA
Sev
ere
bli
zzar
dco
ndit
ions
All
88
cou
ntie
s$
3,5
46,6
69
(P)
DR
-6
30
Au
gust
23
,1
980
PA
/IF
GH
eav
yra
ins
and
flo
od
ing
Bel
mo
nt,
Co
lum
bia
na,
Gue
rnse
y,Je
ffer
son,
Mo
nro
e,M
uski
ngu
m,
No
ble
$1
,653
,32
7(P
)$
66
9,8
20
(I)
DR
-6
42
June
16
,1
981
PA
/IF
GT
orna
do
,hi
ghw
ind
san
dfl
oo
din
gH
anco
ck,
Mo
rro
w,
Put
nam
,W
yand
ot
(IA
)M
orr
ow
(PA
)$
34
6,9
50
(P)
$4
7,3
82
(SC
B)*
*$
51
5,5
93
(I)
DR
-6
53
Mar
ch2
6,
198
2P
A/I
FG
Flo
od
Def
ianc
e,F
ult
on,
Hen
ry,
Cit
yo
fT
ole
do(L
ucas
),P
auld
ing,
Wo
od
Co
unt
y(I
A)
Def
ianc
e,P
auld
ing,
Vil
lage
of
Gra
ndR
apid
s(W
oo
do
nly)
(PA
)
$1
57
,39
0(P
)$
26
8,1
87
(I)
DR
-7
38
June
3,
19
85
PA
/IF
GT
orna
do
esA
shta
bul
a,C
olu
mb
iana
,C
osh
oct
on,
Lic
kin
g,P
ort
age,
Tru
mb
ull
(IA
)T
rum
bu
ll(P
A)
$1
,556
,95
0(P
)$
41
9,7
51
(SC
B)*
*$
42
4,8
93
(I)
DR
-79
61
98
7IF
GF
loo
ds
Cra
wfo
rd,
Mar
ion,
Mo
rro
w,
Ric
hlan
d$
1,0
66,2
58
(I)
$2
66
,56
4(S
CB
)**
DR
-8
31
June
10
,1
989
IFG
Sev
ere
sto
rms
and
flo
od
ing
But
ler,
Co
sho
cto
n,C
uya
hoga
,F
rank
lin,
Gea
uga,
Gre
ene,
Lak
e,L
icki
ng,
Lo
rain
,M
erce
r,M
ont
gom
ery,
Pre
ble
,War
ren
$2
,363
,86
8(I
)$
59
0,9
67
(SC
B)*
*
DR
-8
70
June
6,
19
90
PA
/IF
G/
HM
GP
*S
ever
est
orm
,to
rnad
oes
,an
dfl
oo
din
gA
then
s,B
elm
ont
,B
utle
r,C
olu
mb
iana
,F
airf
ield
,H
amil
ton,
Har
riso
n,H
ock
ing,
Jack
son,
Jeff
erso
n,L
awre
nce,
Lic
king
,M
onr
oe,
Mus
king
um
,P
erry
,P
ike,
Ric
hla
nd,
Vin
ton
(PA
/IA
)C
lerm
ont
,F
ran
klin
,M
aho
nin
g,
Mo
rro
w,
Mad
iso
n,R
oss
,T
rum
bul
l(I
Ao
nly)
$1
0,8
47
,07
5(P
)$
4,3
31,4
97
(I)
$3
,849
,78
3(S
CB
)**
$6
30
,00
0(M
)$
63
0,0
00
(S)
DR
-9
51
Au
gust
4,
19
92
(IA
)A
ugu
st1
4,
19
92(P
A/H
MG
P)
PA
/IF
G/
HM
GP
*S
ever
est
orm
s,to
rnad
oes
,fl
oo
din
gC
uya
hoga
,F
ran
klin
,L
oga
n,M
aho
nin
g,M
edin
a,M
erce
r,R
oss
,S
helb
y,S
um
mit
,T
rum
bul
l,V
anW
ert
(PA
/IA
)A
ugl
aize
,B
elm
on
t,C
olu
mb
iana
,E
rie,
Fai
rfie
ld,
Fu
lto
n,G
eaug
a,Je
ffer
son,
Lo
rain
,L
ucas
,O
ttaw
a,P
ort
age,
Wo
od
(PA
onl
y)
$8
,308
,33
4(P
)$
2,0
81,1
17
(I)
$2
,474
,08
3(S
CB
)**
$2
50
,00
0(M
)$
35
0,0
00
(CD
BG
)+D
R-1
06
5A
ugu
st2
5,
19
95IF
G/H
MG
Sev
ere
sto
rms
and
Cha
mp
aign
,E
rie,
Lo
gan,
Lo
rain
,L
icki
ng,
Mar
ion,
Mer
cer,
Mia
mi,
$3
,493
,31
9(I
)

Pag
e12
of
39
Dis
aste
rN
um
ber
Dat
eD
ecla
red
Dis
aste
rP
rogr
amIn
cid
ent
Typ
eC
oun
ties
Dec
lare
Fu
nd
sP
rovi
ded
Pfl
oo
din
gS
cio
to,
She
lby,
Was
hin
gto
n$
81
,73
1(S
CB
)**
$7
21
,50
0(M
)
DR
-10
97
Janu
ary
27
,1
99
6P
A/I
FG
/H
MG
PO
hio
Riv
erfl
oo
din
gA
dam
s,B
elm
ont
,C
olu
mb
iana
,G
alli
a,Je
ffer
son,
Law
renc
e,M
eigs
,M
onr
oe,
Sci
oto
,W
ashi
ngto
n(P
A/I
A)
Bro
wn,
Cle
rmo
nt,
Ham
ilto
n(I
A)
$4
,335
,00
0(P
)$
1,8
22,0
56
(I)
$1
,617
,99
1(S
CB
)**
$1
,721
,65
5(M
)D
R-1
12
2Ju
ne2
4,
19
96P
A/H
MG
PS
ever
est
orm
san
dfl
oo
din
gA
dam
s,B
elm
ont
,B
row
n,B
utle
r,C
lerm
ont
,G
alli
a,H
amil
ton
,H
ock
ing,
Jeff
erso
n,L
awre
nce,
Mei
gs,
Mo
nro
e,P
auld
ing,
Sci
oto
,V
into
n,W
illi
ams
$1
0,8
11
,83
8(P
)$
2,7
02,9
60
(S)
$1
,137
,95
1(M
)
DR
-11
64
Mar
ch4
,1
997
IA/P
A/H
MG
PF
lash
flo
od
ing
on
inla
ndri
vers
/str
eam
san
dO
hio
Riv
erfl
oo
din
g
Ad
ams,
Ath
ens,
Bro
wn,
Cle
rmo
nt,
Gal
lia,
Ham
ilto
n,H
igh
land
,H
ock
ing,
Jack
son,
Law
renc
e,M
eigs
,M
onr
oe,
Pik
e,R
oss
,S
cio
to,
Vin
ton,
Was
hing
ton
(IA
/PA
/HM
GP
)an
dM
org
an(P
A/H
MG
P)
$2
9,6
66
,82
5(P
)$
22
,19
6,3
50
(I)
$9
,821
,52
4(M
)$
9,8
21,5
24
(S)
$9
,740
,29
4(N
RC
S)*
+D
R-1
22
7Ju
ne3
0,
19
98IA
/PA
/MI
TF
lash
flo
od
ing,
flo
od
ing,
hig
hw
ind
san
dto
rnad
oes
.A
then
s,B
elm
ont
,C
osh
oct
on,
Gue
rnse
y,H
arri
son,
Jack
son,
Jeff
erso
n,K
nox,
Mei
gs,
Mo
nro
e,M
org
an,
Mo
rro
w,
Mus
kin
gum
,N
ob
le,
Ott
awa,
Per
ry,
Pic
kaw
ay,
Ric
hlan
d,
Tus
cara
was
,W
ashi
ngt
on;
(IA
on
ly)
Fra
nkl
in,
San
du
sky
(PA
on
ly)
Ho
lmes
$2
1,8
03
,77
1(P
)$
14
,31
2,3
48
(I)
$9
,000
,00
0(M
)$
9,0
00,0
00
(S)
$1
0,4
10
,81
7(N
RC
S)*
+
DR
-13
21
Mar
ch7
,2
000
IA/M
ITF
lash
flo
od
ing,
flo
od
ing
Ad
ams,
Gal
lia,
Jack
son,
Law
renc
e,M
eig
s,P
ike
and
Sci
oto
$1
,914
,18
9(I
)$
29
7,3
10
(M)
$2
97
,31
0(S
DR
P)*
*D
R-1
33
9A
ugu
st2
5,
20
00IA
/MIT
Flo
od
ing
Luc
as$
7,8
98,8
40
(I)
$8
73
,93
1(M
)$
87
3,9
31
(SD
RP
)**
DR
-13
43
Sep
tem
ber
26
,2
00
0IA
/PA
/MI
TH
igh
win
ds
and
torn
ado
esG
reen
e$
18
9,0
51
(I)
$3
,430
,81
0(P
)$
55
8,0
25
(M)
$5
58
,02
5(S
)
DR
-13
90
Au
gust
8,
20
01
PA
/MIT
Flo
od
ing
Bro
wn,
But
ler,
Cle
rmo
ntan
dH
amil
ton
$7
,71
2,4
56
(P)
$8
76,
439
(M)

Pag
e13
of
39
Dis
aste
rN
um
ber
Dat
eD
ecla
red
Dis
aste
rP
rogr
amIn
cid
ent
Typ
eC
oun
ties
Dec
lare
Fu
nd
sP
rovi
ded
$8
76,
439
(S)
DR
-14
44
No
vem
ber
18
,2
00
2IA
/MIT
Tor
nad
os,
Sev
ere
Sto
rms
Ash
land
,A
ugl
aize
,C
osh
oct
on
,C
uya
hoga
,F
ran
klin
,H
anco
ck,
Hen
ry,
Hur
on,
Lo
rain
,M
edin
a,O
ttaw
a,P
auld
ing,
Put
nam
,S
and
usk
y,S
enec
a,S
um
mit
,U
nio
n,V
anW
ert,
Way
nean
dW
oo
d
$1
1,6
68
,84
9(I
)$
13
9,0
68(M
)–
$4
8,4
09
(S)
$2
,29
7,2
22
(SD
RP
)
DR
-1
45
3*
Mar
ch2
4,
200
3IA
/PA
/MI
TIc
e/S
now
Sto
rmA
dam
s,G
alli
a,Ja
ckso
n,L
awre
nce,
Mei
gs,
Pik
ean
dS
cio
to(I
A/P
A);
Ath
ens,
Bel
mo
nt,
Dar
ke,
Del
awar
e,F
ayet
te,
Fra
nkl
in,
Gre
ene,
Gue
rnse
y,H
arri
son,
Ho
ckin
g,L
icki
ng,
Mad
iso
n,M
iam
i,M
onr
oe,
Mo
rgan
,M
ont
gom
ery,
Mus
king
um
,N
ob
le,
Per
ry,
Pre
ble
,R
oss
,U
nio
n,V
into
nan
dW
ashi
ngto
n(P
A)
$4
,53
0,0
45
(I)
$3
9,6
21
,60
5(P
)*
$2
,41
5,8
99
(M)
–$
2,4
15
,89
9(S
)-
DR
-1
47
8*
July
15
,2
003
IA/M
ITS
ever
eS
torm
san
dfl
oo
din
gA
ugl
aize
,C
olu
mb
iana
,C
raw
ford
,D
arke
,L
oga
n,M
aho
ning
,M
erce
r,P
ike,
She
lby
and
Van
Wer
t(I
A/M
IT);
Ad
ams,
Au
glai
ze,
Dar
ke,
Lo
gan,
Mer
cer,
Pik
e,S
helb
yan
dV
anW
ert
(SD
RP
)
$6
,45
1,7
93
(I)
$1
45,
762
(M)*
$1
3,7
21
(S)
$2
,97
6,9
49
(SD
RP
)
DR
-1
48
4*
Au
gust
1,
20
03
IA/P
A/M
IT
Sev
ere
sto
rms,
torn
ado
esan
dfl
oo
din
gC
arro
ll,
Co
lum
bia
na,
Cu
yaho
ga,
Fra
nkl
in,
Jeff
erso
n,M
aho
nin
g,M
edin
a,P
ort
age,
Ric
hlan
d,
Sta
rk,
Su
mm
itan
dT
rum
bul
l(I
A/M
IT);
Ad
ams,
Co
lum
bia
na,
Car
roll
,Je
ffer
son,
Mah
on
ing,
Med
ina,
Mo
nro
e,P
orta
ge,
Sta
rk,
Su
mm
it,
Tru
mb
ull
and
Vin
ton
(PA
)
$1
35,
723
,395
(I)
$1
3,1
60
,83
4(P
)*$
6,0
16
,48
8(M
)$
16
2,7
90(S
)-
EM
-3
18
7*
Au
gust
23
,2
003
PA
Onl
yP
ow
erO
utag
eA
shla
nd,
Ash
tab
ula,
Cu
yaho
ga,
Eri
e,G
eaug
a,H
uro
n,K
nox,
Lak
e,L
ora
in,
Luc
as,
Po
rtag
e,S
um
mit
and
Tru
mb
ull
$2
,06
7,2
22
(P)*
DR
-1
50
7*
Janu
ary
26
,2
00
4IA
/PA
/MI
TL
and
slid
e,se
vere
sto
rms
and
land
slid
esB
elm
ont
,Je
ffer
son,
Mo
rgan
,R
oss
,T
usca
raw
asan
dW
ashi
ngt
on
(IA
/PA
/MIT
);F
rank
lin
(IA
/MIT
);A
then
s,G
uern
sey,
Har
riso
n,M
onr
oe,
No
ble
and
Per
ry(P
A/M
IT)
$3
,40
8,9
34
(I)
$1
4,8
11
,92
3(P
*)$
87
5,2
65(M
)*$
16
4,8
04(S
)-
DR
-1
51
9*
June
3,
20
04
IA/P
A/M
IT
Sev
ere
sto
rms
and
flo
od
ing
Ath
ens,
Car
roll
,C
olu
mb
iana
,C
uya
hoga
,D
elaw
are,
Gue
rnse
y,H
arri
son,
Ho
ckin
g,H
olm
es,
Med
ina,
No
ble
,P
erry
,P
ort
age,
Su
mm
itan
dT
usca
raw
as(I
A/P
A/M
IT);
Cra
wfo
rd,
Gea
uga,
Lic
kin
g,L
oga
n,L
ora
in,
Mah
oni
ng,
Ric
hlan
dan
dS
tark
(IA
/MIT
)an
dK
nox
and
Jeff
erso
n(P
A/M
IT)
$3
0,2
38
,92
1(I
)*$
14
,06
0,7
50
(P)
*$
2,3
05
,56
0(M
)$
74
8,4
26(S
)-
DR
-1
55
6*
Sep
tem
ber
19
,2
00
4IA
/PA
/Mi
tS
ever
est
orm
san
dfl
oo
din
gA
then
s,B
elm
ont
,C
arro
ll,
Co
lum
bia
na,
Gal
lia,
Gue
rnse
y,H
arri
son,
Jeff
erso
n,M
eigs
,M
onr
oe,
Mor
gan,
Mus
kin
gu
m,
No
ble
,P
erry
,T
usca
raw
as,
Vin
ton
and
Was
hin
gto
n(I
A/P
A/M
IT);
Law
renc
e,
$4
7,4
55
,69
0(I
)$
35
,59
7,4
80(P
)*$
3,9
48
,34
9es
tim
ate

Pag
e14
of
39
Dis
aste
rN
um
ber
Dat
eD
ecla
red
Dis
aste
rP
rogr
amIn
cid
ent
Typ
eC
oun
ties
Dec
lare
Fu
nd
sP
rovi
ded
Mah
oni
ng,
Sta
rkan
dT
rum
bul
l(I
A/M
IT)
(M)*
$2
,30
0,0
00
(S)
EM
-3
19
8*
Janu
ary
11
,2
00
5P
AO
nly
Sno
wR
emo
val
and
Res
po
nse
But
ler,
Cha
mp
aign
,C
lark
,C
raw
ford
,D
arke
,D
elaw
are,
Eri
e,F
rank
lin,
Gre
ene,
Ham
ilto
n,H
ard
in,
Hu
ron,
Lo
gan,
Mad
iso
n,M
ario
n,M
iam
i,M
ont
gom
ery,
Mo
rro
w,
Pre
ble
,R
ichl
and
,S
and
usk
y,S
enec
a,S
helb
y,U
nio
n,W
arre
nan
dW
yand
ot
$1
1,0
93
,34
1(P
)*
DR
-1
58
0*
Feb
ruar
y1
5,
20
05
IA/P
A/M
IT
Sev
ere
win
ter
sto
rms,
ice
and
mud
slid
esC
lark
,S
and
usk
y,W
arre
nan
dM
iam
i(I
A/M
IT);
Ash
land
,A
ugla
ize,
Ath
ens,
Bel
mo
nt,
Co
sho
cto
n,C
raw
ford
,D
elaw
are,
Fai
rfie
ld,
Fra
nkli
n,G
uern
sey,
Hen
ry,
Ho
ckin
g,H
olm
es,
Hur
on,
Jeff
erso
n,L
icki
ng,
Lo
gan,
Mo
rgan
,M
usk
ing
um
,P
icka
way
,P
ike,
Ric
hlan
d,
Ro
ss,
Sci
oto
,S
tark
,T
usca
raw
as,
Was
hing
ton
and
Wya
ndo
t(I
A/P
A/M
IT);
Ad
ams,
All
en,
Bro
wn,
Car
roll
,C
ham
pai
gn,
Cle
rmo
nt,
Co
lum
bia
na,
Dar
ke,
Fay
ette
,H
anco
ck,
Har
din
,H
arri
son,
Hig
hla
nd,
Kno
x,L
ora
in,
Mar
ion,
Med
ina,
Mei
gs,
Mer
cer,
Mo
nro
e,M
ont
gom
ery,
Mo
rro
w,
No
ble
,P
auld
ing,
Per
ry,
Put
nam
,S
enec
a,S
helb
y,U
nio
n,V
anW
ert
and
Way
ne(P
A/M
IT)
$1
3,8
23
,75
7(I
)*$
12
0,4
32,
304
(P)*
$7
,534
,74
6(M
)*$
1,5
00,0
00
(S)
-
EM
-32
50
Sep
tem
ber
13
,2
00
5P
AH
urri
cane
Kat
rina
Em
erge
ncy
She
lter
Op
erat
ions
All
88
Co
unt
ies
wer
ein
clud
edin
the
fed
eral
dec
lara
tio
n$
2,4
23,9
81
(P)*
DR
-1
65
1*
July
2,
20
06
IA/M
ITS
ever
est
orm
san
dfl
oo
din
gC
uya
hoga
,E
rie,
Hur
on,
Luc
as,
San
dus
ky
and
Sta
rk$
24
,93
3,5
05
(I)*
$1
,789
,01
9(M
)es
t.D
R-
16
56
*A
ugu
st1
,2
00
6IA
/PA
/MI
TS
ever
est
orm
san
dfl
oo
din
gA
shta
bul
a.G
eau
gaan
dL
ake
$2
5,0
92
,16
0(I
)*$
13
,94
0,4
53
(P)*
est.
$3
,411
,73
6(M
)es
t.*
HM
GP
firs
tav
aila
ble
wit
hd
isas
ter
dec
lare
daf
ter
19
87.
(M)
–H
azar
dM
itig
atio
nG
ran
t(P
)–
Pub
lic
Ass
ista
nce
(SC
B)*
*-
Sta
teC
on
tro
llin
gB
oar
dfu
nd
s;(S
DR
P)*
*Sta
teD
isas
ter
Rel
ief
Pro
gram
(CD
BG
)+-
Co
mm
un
ity
Dev
elo
pmen
tB
lock
Gra
nt
fun
ds
pro
vid
edb
yth
eO
HD
epar
tmen
to
fD
evel
op
men
t(I
)In
div
idu
alA
ssis
tan
cein
clu
des
FE
MA
Dis
aste
rH
ou
sin
g,S
BA
loan
sfo
rho
mes
,p
erso
nal
pro
per
tyan
db
usi
nes
ses
and
FE
MA
/Sta
teO
ther
Nee
ds
Ass
ista
nce
gran
tsfo
rfa
mil
ies
and
indi
vid
ual
s(N
RC
S)*
+-
Nat
ura
lR
eso
urc
esC
on
serv
atio
nS
ervi
ceE
M31
87is
anE
mer
gen
cyD
ecla
rati
on
for
Pu
blic
Ass
ista
nce
*In
dic
ates
the
dis
aste
ris
not
off
icia
lly
clo
sed
.(S
)–
Sta
teM
atch
toF
eder
alH
azar
dM
itig
atio
nfu
nds

Page 15 of 39
These incidents have affected both people and property. Gubernatorial declarations have often beenissued for a number of other events, not qualifying for federal assistance via Presidential Declarations, as“Emergencies” or “Disasters”. This process serves to initiate coordinated state response efforts for areasrequiring assistance beyond local capabilities.
RISK ASSESSMENT, THE ANALYSIS PROCESS (METHODOLOGY, FACTORS, AND VALUES)
Recent events and changes in planning methodologies at the federal level have affected the generallyaccepted hazards. For instance, while the focus of federal planning and coordination is thrust towardsterrorism, it is the ninth rated hazard in total risk for Ohio. The following section describes the generalprocess by which risk was captured for each of the 27 hazards identified.
A hazard identification and risk analysis consists of two elements. The first is the identification of ahazard. The second element is an assessment of the vulnerability associated with that hazard. Research forthis analysis involved the collection of both historical and statistical data, including interviews withprofessionals in various disciplines. Information was then systematically analyzed for potential risk value.The risks associated with each hazard were further assessed using seven factors with numerical riskvalues. These seven factors are Frequency, Duration, Speed of Onset, Magnitude, Impact on Business,Impact on Human (people), and impact on Property. The Frequency, Duration, Speed of Onset andMagnitude comprise the profile of the hazard. Generally, these factors were considered an averageoccurrence of the hazard, not necessarily a catastrophic incidence. Vulnerability to an agent is based onthe factors of business, human, property. Numerical values were applied to provide a basis on which tocompare assigned weights among hazards and assigned risks. Factor value totals were added, allowinghazards to be compared against each other to obtain final rankings.
Frequency
A key factor in the hazardousness of particular agent is the frequency with which it occurs. Some hazardshave been relatively frequent in this state while others were only sporadic. For this hazard analysis, thefrequency with which an event occurs is based on the number of Gubernatorial Declarations associatedwith the hazard agent from 1991 through 2007. Using Gubernatorial Declarations provides a minimumthreshold of damage as well as provides a wider variety of hazards than utilizing the presidentialdeclarations. The only frustration with this profile is the lack of longevity of the sample. The Secretary ofState for Ohio only has records going back to 1991.
1 2 3 4_______________5None Low Medium High Excessive
If a hazard/event had no occurrences, it scored a one. If the hazard/event occurred from one to two times,it has a Low Probability of occurrence and scored a two. If it occurred three to five times, it has a MediumProbability and numerical score of three. If the hazard was experienced six to eight times, has a HighProbability and scored a four. If the hazard occurred nine or more times, it received an ExcessiveProbability rating and a score of five.
It is important to note that frequency was considered a key factor in determining the hazard profile. Tothat end, the score for this factor was multiplied by 1.5 to weight the score more importantly than otherfactors. See Appendix 1 for more information.

Page 16 of 39
Average Response Duration
Average Response Duration may be defined as “time on the ground” or the time-period of response to ahazard, or event. Transportation accidents may last a few hours whereas a tire fire may last a week or aflood several weeks. Duration, therefore, may not always be indicative of the degree of damage but itremains a factor.
1 2 3 4_________________5Minimal Short Medium Long Excessive
(Less than ½ day) (Less than 1 day) (Less than 1 week) (Less than 1 month) (Less than 1 Year)
Average Speed of Onset
Average Speed of Onset may affect all other factors do to lack of warning or time to prepare for impact.The lead-time required protecting lives and property varies greatly with each event. For instance, a winterstorm may develop so slowly that there is time to alert crews and emplace plows, but flash floods canoccur with no warning.
1 2 3 4Extended Medium Short Short-None
(Over 24 hours) (12 – 24 hours) (6 to 12 hours) (Minimal to no warning)
Average Magnitude (Impact)
Average Magnitude is the geographic dispersion of the hazard. For instance, how many counties would beimpacted by a flood or hazardous material incident? Similar to the Frequency, this hazard deemed moreimportant and therefore received a weighted value of 1.25 above the raw score. The score is based on thenumber of counties potentially impacted by an event.
1 2 3 4Negligible Limited Critical Catastrophic
(Less than 10) (10 to 25) (25 to 50) (More than 50)
Impact on Business
The Impact on Business refers to enduring economic impact of the hazard on the community by an event.A score of one compares to a shutdown of critical facilities for less than 24 hours. Two equals a completeshutdown of critical facilities for one week. A score of three means a complete shutdown of criticalfacilities for at least two weeks. A score of four equals a complete shutdown of critical facilities for 30days or more. This factor was developed and in keeping with the hazard analysis developed by theMitigation Branch at Ohio EMA in their Enhanced Mitigation Plan.
1 2 3 4(Shutdown of critical facilities for less than 24 hours)
(Complete shutdown of critical facilities for one week)(Complete shutdown of critical facilities for at least two
weeks) (Complete shutdownof critical facilities for30 days or more)

Page 17 of 39
Impact on Human (People)
This factor relates to the number of lives potentially lost to a particular hazard agent. This factor can varybetween jurisdictions based on economic, geographic, and demographics of the particular populations.Therefore, some generalization need be inflected on this factor. This factor was developed and in keepingwith the hazard analysis developed by the Mitigation Branch at Ohio EMA in their Enhanced MitigationPlan.
1 2 3 4Minimum Low Medium High
(Minor injuries) (Some injuries) (Multiple severe injuries) (Multiple deaths)
Impact on Property
This factor relates to the amount of property potentially lost to a particular hazard agent. This factor canvary between jurisdictions based on economics, geographic amount owned, and demographics of theparticular populations. Therefore, some generalization need be inflected on this factor. This factor wasdeveloped and in keeping with the hazard analysis developed by the Mitigation Branch at Ohio EMA intheir Enhanced Mitigation Plan.
1 2 3 4Minimum Low Medium High
(Less than 10% of property severely damaged)(More than 10% of property severely damaged)
(More than 25% of property damaged)(More than 50% ofproperty severely
damaged)
Factor/Value Overview
Frequency (Based on Past Gubernatorial Declarations from 1991 through 2007 data): 1 = none; 2 = 1-2;3 = 3-5; 4 = 6-8; 5 = 9 or more
Adjusted Frequency: Same scoring as above, however score is weighted for importance by factor of 1.5
Average Response Duration: 1 = Less than one-half day; 2 = Less than one day; 3 = Less than oneweek; 4 = Less than one month; 5 = Less than one year
Average Speed of Onset: 1 = more than 24 hrs warning; 2 = 12 to 24 hrs warning; 3 = 6 to 12 hrs; 4 =minimal or no warning
Average Magnitude (Average number of counties impacted): 1 = Negligible (Less than 10); 2 = Limited(10 to 25); 3=Critical (25 to 50); 4 = Catastrophic (More than 50)
Adjusted Average Magnitude: Same scoring as above, however score is weighted for importance byfactor of 1.25
Adjusted Total Score: Total of the Adjusted Frequency, Average Response Duration, Average Speed ofOnset, and Adjusted Average Magnitude

Page 18 of 39
Business: 1 = Low (Shutdown of critical facilities for less than 24 hours); 2 = Medium (completeshutdown of critical facilities for one week); 3 = High (complete shutdown of critical facilities for at leasttwo weeks); 4 = Excessive (complete shutdown of critical facilities for 30 days or more)
Human: 1 = Low (Minor injuries); 2 = Medium (Some injuries); 3 = High (Multiple severe injuries; 4 =Excessive (Multiple deaths)
Property: 1 = Low (Less than 10% of property severely damaged); 2 = Medium (More than 10% ofproperty severely damaged); 3 = High (More than 25% of property damaged); 4 = Excessive (More than50% of property severely damaged)
HAZARD ANALYSIS AND RISK ASSESSMENT AND DETAILED HAZARD OVERVIEW
The analysis process discussed in the previous chapter was applied to the entire state employing thehistorical data described in Chapter I. A numerical rating value was developed for each factor(Attachment 1). Since the analysis incorporates data applicable to the entire state, the data for any specific(county) jurisdiction may differ.
Attachment 1 provides a multitude of information for each hazard. Categorized by NFPA 1600 typingeach hazard is noted by which reference documents it was cited. The attachment also shows the numericalscore for the hazard profile as well as vulnerability. The risk score is shown for each hazard.
Attachment 2 provides a rank order of the hazards from greatest to least in terms of total risk. Thisdocument also provides the hazard profile and vulnerability information.
Natural Hazards
Flood, Flash Flood, Seiche
Flood, Flash Flood, Seiche (Total Risk = 28.25), with the highest numerical rating, are the primarydisaster threat to life and property in Ohio. Although often confined to specific drainage systems orgeographic regions, floods can pose a threat to over 700 communities and a potential 5-8 million residentsin all 88 counties. Protective actions (evacuation/sheltering) may deplete both material and fiscalresources. Floodwaters have also damaged key infrastructure elements (roads, bridges and sanitaryfacilities). Infrastructure damages may also lead to an increase in infectious diseases in some affectedareas. Other collateral problems include power outages and transportation delays. Mudslides, acomponent of the 1990 Shadyside event, are often a flood related concern in the S-SE. The costs in labor,time and monies for flood-related mitigation and preparation actions may also be exceedingly high.
The state can experience four types of floods. Riverine (The overflow of rivers and streams from rains ormeltwater); Flash (A fast rising of streams or “dry-gulch” waters after heavy rain/snowmelt); Urban andSmall Stream (An overflow of storm sewers and streams after a heavy rainfall); and Coastal (Floodsalong the Lake Erie shoreline, often associated with severe storms and/or seiche waves)
In a space of 16 months, in the late 1990s, two major floods affected the state. The first, in February 1997,caused flash and riverine flooding in 18 southern counties. In June 1998, a varied weather pattern withtornadoes, severe storms, and flash flooding struck 23 counties on a northwest to southeast track. Theseevents affected thousands of residents and caused millions of dollars in business and residential losses.The following chart provides a comparison of these events:

Page 19 of 39
Figure 4: Flood Damage Comparison Chart for Ohioviii (1997-98)
Critical Element 1997 1998Overall Financial Impact $180 Million $184.3 MillionFederally Declared Counties 18 23Casualties (Deaths) 5 12Residents Evacuated 20,000 9,000
Windstorm, Tornadoes
Windstorms and Tornadoes (Total Risk = 25.25).are the second greatest threat to the state. These violent,rotary windstorms can attain speeds up to 300+ mph and are often accompanied, or followed, by severethunderstorms. They may occur anywhere at any time of the year (most frequently in spring or earlysummer) with unpredictable, severe effects. Other severe storms, not officially classed as tornadoes, maybe almost as violent and damaging. The potential for loss of life and property is high, coupled with anability to overwhelm most response capabilities.
Effects vary according to wind speed, duration on the ground, and topography. Losses over a 30-yearperiod are estimated in excess of $110- million. From 1950 to present, 918 tornadoes were reported inOhio. The Lorain and Xenia storms cost over 30 lives and property damages were calculated in the multi-millions of dollars. As in the case of floods, recovery costs and times may extend over years.
On April 9, 1999, a tornado in Clinton, Hamilton, and Warren Counties, killed 4 and injured 42 whiledestroying or damaging over 400 dwellings. Fiscal losses were estimated at $82- million for the storm,which the NWS termed as the most devastating in terms of casualties since the l985 event, which killed18 Ohioans.
Figure 5: Ohio's Tornado History (1950-99)

Page 20 of 39
ADAM S
LAW RENCE
PIKEJACKSON
GALLIA
MEIGS
VINTON
ATHENS
WASHINGTON
BROWN
HIGHLANDHAMILTON
PREBLEGREENE
MONTGOMERY
FAYETTE
MADISO N
CLARK
MIAMIDARKE
ROSS
HOCKING
FRANKLIN
DELAW ARE
UNION
LICKING
MERCERAUGLAIZE
`
ALLEN
VAN WERT
PAULDING
M ORGANNOBLE
MUSKINGUMGUERNSEY
MARION
MORROW
KNO X
HENRY
PUTNAM HANCOCK
WYANDOT CRAW FORD
SENECA
SANDUSKY
WOOD
OTTAW A
SHELBYLOGAN
CHAM PAIGN
HARDIN
COSHOCTO N
HOLMES
RICHLAND
ASHLAND WAYNESTARK
TUSCARAW ASHARRISON
BELMONT
JEFFERSO N
COLUMBIANA
MAHONING
HURON
ERIELORAIN
CUYAHOGA
SUM MIT
PO RTA GE
TRUMBULLGEAUG A
ASHTABULA
LAKE
WILLIAMS
DEFIANCE
BUTLER
CLERMO NT
SCIOTO
CLINTON
PERRY
PICKAWAY
CARROLL
FAIRFIELD
FULTO N
MONROE
MEDINA
W ARREN
H istory of O hio Tornadoes1950-99
12/0
12/15
1/0
13/3
9/1
9/1
15/14/3
3/1
22/95
12/19
9/017/2
14/0
8/0
2/03/1
5/0
9/03/0
5/1
15/1
2/04/1
0/0
5/1
2/0
1/2
5/0
5/0
11/12
17/7
21/011/0
6/2
4/1
15/2
11/010/0
14/5
4/18Lucas12/1
8/0
12/2
8/8
6/4
7/2
9/5
13/0
11/186/0
13/0
9/0
13/412/2
4/2
15/6
5/4
7/05/04/3
15/813/0
23/2
13/1
8/1
4/0
14//0
10/07/0
8/1 7/212/38
6/1
13/1
11/12
13/0
10/3
10/1
13/015/2
10/1
7/0
3/0
3/0
13/7
4/0
0/0
Source: N W S
Emerging DiseasesEmerging diseases, such as plague, smallpox, anthrax, West Nile Virus, foot and mouth disease, SARS,pandemic influenza BSE (mad cow disease) are becoming increasingly prevalent on the world stage. Thistype of event would likely be regional if not global in nature. Pandemic Influenza has become a planningpriority for the state of Ohio through actions such as former Governor Taft’s Cabinet Advisory #05-235as well as at the federal level. Likewise, certain health conditions such as the MRSA staph infection arecoming to prevalence in the media.
Unlike many other hazards, this would not directly impact and cause failure to our infrastructure butstrike the personnel needed to respond and recover. Large numbers of people would likely expire fromthis type of event. Examples such as the 1918 Influenza Pandemics show the multitudes of people thatcould die from an event of this type.
Earthquakes
Earthquakes (Total Risk = 24.25) are defined as a rapid motion of the ground accompanied by shaking,faulting (surface and subsurface) and ground failure. Earthquakes from two points affect Ohio: eventshaving epicenters within the state, and those occurring along the New Madrid, Missouri Fault.

Page 21 of 39
Over 120 earthquakes with Ohio epicenters have occurred since 1776. Fifteen of these events have causedminor to moderate damage with the largest earthquake registering 5.4 magnitude in 1937. Fortunately,these events have not resulted in fatalities, only minor injuries, over the course of time.
Seismic activity is concentrated in, but not confined to, three areas of the state, the most active area, withat least 40 earthquake events since 1875, is the Anna Seismogenic Zone centered in Shelby County,(western Ohio). Many other events occurring around Lake County, or in the southeast, can cause major tomoderate damage. These areas rank as the second and third most active earthquake zones within the state.
Other counties with documented earthquake epicenters include Adams, Allen, Ashland, Ashtabula,Athens, Auglaize, Brown, Butler, Champaign, Clermont, Cuyahoga, Geauga, Greene, Hamilton,Hancock, Hardin, Highland, Hocking, Jackson, Lake, Lucas, Marion, Meigs, Mercer, Montgomery,Muskingum, Perry, Pike, Portage, Preble, Putnam, Richland, Ross, Sandusky, Scioto, Seneca, Shelby,Summit, Washington, Williams, Wood, and Wyandot.
The state would also be affected by events generated by the New Madrid Fault, extending from Arkansasto Indiana along the Mississippi and Ohio River Valleys. This fault generated the most powerfulearthquakes ever documented in the Continental US in a four-month period during 1811 and 1812. Ifearthquakes of this intensity occur again, devastating damages in our southwestern counties could beexpected.
Figure 6: Earthquake Epicenters in Ohio and Adjacent Areas

Page 22 of 39
Figure 7: Effects of a Major New Madrid Earthquake in Ohio
MercalliIntensity
Effects Counties Potentially Affected
VI Felt by all, indoors & outdoors. Manypeople frightened and excited. Liquids setin strong motion. With slight damage inpoorly built structures. Fallen & crackedplaster with a considerable quantity ofbroken dishes & glassware.
Allen, Ashland, Auglaize, Crawford,Cuyahoga, Defiance, Erie, Geauga,Hancock, Hardin, Henry, Huron, Lake,Logan, Lorain, Mahoning, Marion, Medina,Mercer, Morrow, Ottawa, Paulding, Portage,Putnam, Richland, Sandusky, Seneca,Shelby, Stark, Summit, Trumbull, VanWert,Wayne, Wood, & Wyandot.(Approx. 4 million people in 36 counties)
VII Many people find it difficult to stand.Slight damage in ordinary buildings.,Considerable amounts of fallen plaster &numerous broken windows & fallencornices
Athens, Belmont, Carroll, Champaign,Clark, Columbiana, Coshocton, Darke,Delaware, Franklin, Fulton, Gallia,Guernsey, Harrison, Holmes, Jackson,Jefferson, Knox, Lawrence, Licking, Lucas,

Page 23 of 39
Madison, Meigs, Miami, Monroe, Morgan,Noble, Tuscarawas, Union, Washington, andWilliams(Approx. 3 million people in 31 counties)
VIII Alarm approaches panic. Branches oftrees broken. Changes in the flow of well& spring water. Considerable damage inordinary substantial buildings. Fallenwalls, factory stacks, towers, &monuments. Heavy furniture overturned.
Adams, Brown, Butler, Clermont, Clinton,Fairfield, Fayette, Greene, Hamilton,Highland, Hocking, Montgomery,Muskingum, Pickaway, Perry, Pike, Preble,Ross, Scioto, Vinton, & Warren(Approx. 3 million people in 21 counties)
Source: U. S. Geological Survey, Maximum Seismic Interactions Map for New Madrid Seismic Zone;Algermission & Hopper
Collateral effects from an earthquake could be extensive and may include hazardous material spills,landslides, subsidence, dam failures, fires, groundwater contamination, pipeline breaks, infrastructuredisruptions, epidemics, floods, along with theft/looting.
Snow, Ice, Hail and Sleet
Snow, Ice Hail and Sleet (Hazard Rating = 22.25) are the third leading weather-related threat to the state.These include heavy snowfall with extreme cold and ice, or a combination of the three.
A total of 304 Winter Storms from 1950 to present are reported by the National Weather Service. Thestorms of 1913, 1940, 1950, 1977, 1978, 1994, 1996, and 2004/2005 were especially damaging. Somewinter storms have occurred in specific sectors of the state; south/southeast (1984); east/northeast (1993);or south/southeast (1994). However, the storms of 1950 and 1978 were statewide in nature and of aseverity that required massive state/federal response and recovery efforts.
In addition to structural and power line damages, these storms have a potential for collateral effects;isolation and economic disruption (from roadway and business closings) along with ice dams and floodscaused by the melting process.
Landslide, Mudslide, Subsidence
Landslide, Mudslide and Subsidence (Total Risk = 19.25) are the next major natural threat. Subsidence isdefined as a drop in the earth’s surface due to a collapse in bedrock or other underlying material (coalpillars, rock, etc) into underground mines or other open space.
Land or Mudslides are defined as downward and outward movements of slopes due to rains or meltingsnow with accompanying damage and debris deposition. They may also include sudden collapses ofmines, tunnel walls, or supports with resulting damage to surface structures or features (buildings andhighways).
Landslides include three types. A Rotational Slump occurs when weak rock or sediment moves as a massin a slow or imperceptible movement. A more common event, Earthflow, involves rock, sediment, orweathered surface materials moving down slope in a mass. Rock fall is seen as the most common anddangerous form of movement. Rock from a cliff or cut will fall onto roadways or structures. This action iscommon during periods of late winter or early spring thawing. Traffic vibration, undercut slopes,increased weight on slopes, or the removal of vegetation and ensuing erosion may also contribute to theseevents. Events have been traced back to 1923 at various sites. They occur mainly through the Ohio or

Page 24 of 39
Scioto River Valleys, or elsewhere in the eastern portion of the state with some occurring along theeastern Lake Erie Shoreline (Figure 7).
During and after WWII, when the demand for mineral resources was high, the state had over 700 activecoalmines. As the supply of coal in many mines was exhausted, the mines were abandoned with little, orno, preparation. Supporting pillars of coal in shaft mines were mined away prior to closings. In the mid-1990s, over 6,000 closed underground mines were estimated to exist in 37 counties with over 61,000acres of land affected by closings or site abandonment. Abandoned mines have also occasionallycollapsed with damage to surface structures (e.g. Interstate 70 in Guernsey County) or costlyinfrastructure damage. Subsidence and landslides, particularly during the l997 - 98 floods, have also led tothe temporary relocation of farmsteads, housing units, or businesses.
Landslides and mudslides affecting roadways have also led to costly repair actions by state and localgovernments. It is estimated that repair or replacement costs could reach $9 million or more if a majorhighway is involved.
Figure 8: Ohio Landslides
ODOT District No. District Counties Average AnnualSlides
8 Butler, Clermont, Clinton, Greene, Hamilton,Preble, & Warren
15
9 Adams, Brown, Highland, Jackson, Lawrence,Pike, Ross, & Scioto
12
10 Athens, Gallia, Hocking, Meigs, Monroe,Morgan, Noble, Vinton & Washington
180-200
11 Belmont, Carroll, Columbiana, Harrison,Holmes, Jefferson & Tuscarawas
20
Source: ODOT (Div. of Engineering Policy)
Figure 9: Ohio Subsidence and Landslides

Page 25 of 39
Subsidence and landslide zones shown in red
Human Caused Hazards
Building/Structure Collapse
Building/Structure Collapse (Total Risk = 24.75) is the primary human caused and fourth ranked hazardin the state. The most common type of collapse in Ohio is bridges. Several bridge collapses have occurredin recent years requiring a Gubernatorial Declaration. In 1996, a bridge collapsed in Belmont County.Ohio has over 42,000 bridges on its highways. Our state has the second largest number of bridges in thecountry.
One notable bridge collapse occurred in Ohio. On December 15, 1967, the 1000 ft. span Silver Bridgeover the Ohio River collapsed killing 46 people. The bridge connected the towns of Point Pleasant, WestVirginia and Managua, Ohio.
Water Control Structure (Dam/Levee Failure)
Water Control Structure (Dam/Levee Failure) (Total Risk = 22) is the second human caused and seventhranked hazard in the state. It is defined as a gradual or immediate collapse or failure of water impoundingsystems or structures, resulting in downstream damages.
Dams in Ohio have been divided into four classes; I, II III IV, based upon a downstream threat potential.The failure of a Class I dam would result in the probable loss of life or pose a serious hazard to health,

Page 26 of 39
property and high-value industrial or commercial properties or public utilities in the below-daminundation plain. A Class I dam is one with a volume capacity of over 5,000 acre-feet or a height greaterthan 60 feet. Although damages to Class I dams pose the greatest threat to human life, Class II and IIIunits could also pose a similar threat if affected.
Figure 10: Class I Dams in Ohio
ADAM S
LAW RENCE
PIKEJA CKSON
GALLIA
MEIGS
VINTON
ATHEN S
W ASHINGTON
BROWN
HIGHLANDHAMILTON
PREBLEGREENE
MONTGOMER Y
FAYETTE
MADISON
CLARK
MIAMIDARKE
ROSS
HOCKING
FRANKLIN
DELAW ARE
UNION
LICKING
MERCERAUGLAIZE
`
ALLEN
VAN WERT
PAULDING
M ORGANNOBLE
MUSKIN GUMGUERNSEY
MARION
MORROW
KNOX
HENRY
PUT NAM HANCOCK
W YANDOT CRAW FORD
SENECA
SANDUSKY
W OOD
OTTAWA
SHELBYLOGAN
CHAM PAIGN
HARDIN
COSHOC TO N
HOLMES
RICHLAND
ASHLAND WAYNESTARK
TUSCARAW ASH ARRISON
BELMONT
JEFFERSON
COLUMBIANA
MAHONING
HUR ON
ERIELORAIN
CUYAHOGA
SUM MIT
PORTA GE
TRUMBU LLGEAU GA
ASHTABULA
LAKE
W ILLIAM SLUCAS
DEFIANCE
BUTLER
CLERMO NT
SCIOTO
CLINTON
PERRY
PICKAW AY
C A
R
ROLL
FAIRFIELD
FULTON
MONROE
MEDINA
W ARR EN
C LA SS I D A M S IN O H IO
18
20
4
0
0
10
02
5
9
58
4
822
16
511
61
2
110
1
4
0
3
8
85
4
0
1
3
12
11
6
3
4 113
3
3
3
0
1
40
3
31
1 57
8
14
314
1585
2
1
11
7
53
1013
7
12
1212
4
63
4 13
8
6
5
10
6
4
2
8
SO U R C E :O H IO D E PT . O F N A T U R A L R E SO U R C E S
The state does not currently have a means of determining downstream populations and/or potentialmonetary losses in case of failure. A review of similar events in other states illustrates the possibleconsequences: Buffalo Creek, W.Va. suffered 125 casualties and $400 million in property damages. LawnLake, Colorado incurred three casualties and $21 million in property damages. The town of Tococca,Georgia suffered 39 casualties and $30 million in property damages.
Product Defect or Contamination
Product Defect or Contamination Incident (Total Risk = 21.75) can occur as a manufacturing orproduction error; design of; or the materials used in the products content; construction, finish, packaging,warning, and/or instructions or product. In 1982 and 1986, a person contaminated Tylenol with cyanide.Several people died because of product tampering.
Terrorism (CBRNE and Cyber)

Page 27 of 39
Terrorism Incidents (Total Risk = 20) are defined by the Federal Bureau of Investigation (FBI) as the“…unlawful use of force or violence against persons or property to intimidate, or coerce a government,civilian population, or any segment thereof in the furtherance of political and social objectives”. Thevictims of terrorism may not always, however, be the intended, or most concerned, elements of society.
Although events such as the World Trade Center Bombing/Destruction (1993 & 2001) and OklahomaCity bombing (1995) did not occur in Ohio, the threat, real or implied, to employ terrorism in this state,remains. Threats often involved the employment of Weapons of Mass Destruction (WMD), to includebombs and pathogens, and can be directed at targets in both rural and urban-industrial settings. In 1995,an Ohio resident with ties to unorganized militias was able to order, via mail, samples of Plague bacilli.Although that attempt was thwarted, the events of 2001 show that the bio-terrorist threat remains viable.
Explosion/Fire
Explosion/Fire (Total Risk = 19.75) can occur at any time. Cleveland is noted by fire historians for theCollinwood School Fire that killed 17 as well as the Cleveland Clinic Fire that killed 123. Because of thespeed of onset of fire as well as the potential human toll, this hazard scored higher than many other hazardevents.

Page 28 of 39
ATTACHMENT 1: DETAILED HAZARD ANALYSIS

Reference to Hazard + Hazard Profile + Vulnerability to Hazard
Notes: 27 Hazards categories are currently identified for the Ohio EMA HIRA* = Slight variation to NFPA 1600
Hazards from NFPA 1600 NOT included for analysis in the HIRA:Ancillary Support Equipment Failure (support and lab-based equipment), Avalanche, Discrimination, Disinformation (deliberate), Dust Storm,
Electromagnetic Pulse (intensely fluctuating magnetic field), Enemy Attack/War, Famine, Financial Issues (Economic Depression, Inflation, Financial SystemCollapse), Geomagnetic Storm (temporary disturbance of atmosphere causing communications disruption among other things), Glacier, Harrassment,Hurricane, Iceberg, Insurrection (revolt), Misinformation (non-deliberate), Sabotage, Sand Storm, Strike or Labor Dispute, Tidal Surge, Tropical Cyclone,Tsunami, Water Spout, Workplace Violence, and Volcano
X = Designated for future Catastrophic planning purposes
Hazard Profile Information: (Adjusted Maximum Score: 21.5 [Maximum Score: 18])Frequency (Based on Past Gub. Dec. on 1991 through 2007 data): 1 = None; 2 = 1-2; 3 = 3-5; 4 = 6-8; 5 = 9 or moreAjusted Frequency: Same scoring as above, however score is weighted for importance by factor of 1.5;Average Response Duration: 1 = Less than one-half day; 2 = Less than one day; 3 = Less than one week; 4 = Less than
one month; 5 = Less than one yearAverage Speed of Onset: 1 = more than 24 hrs warning; 2 = 12 to 24 hrs warning; 3 = 6 to 12 hrs; 4 = minimal or no warningAverage Magnitude (Average number of counties impacted): 1 = Negligible (Less than 10); 2 = Limited (10 to 25); 3=Critical
(25 to 50); 4 = Catastrophic (More than 50)Adjusted Average Magnitude: Same scoring as above, however score is weighted for importance by factor of 1.25Adjusted Total Score: Total of the Adjusted Frequency, Average Response Duration, Average Speed of Onset, and
Adjusted Average Average Magnitude
Note: Please see the Ohio EMA Hazard Identification and Risk Assessment for more information on the profile.
Vulnerability Information:Total Potential Damage: (Maximum Score of 12)Business: 1 = Low (Shutdown of critical facilities for less than 24 hours); 2 = Medium (complete shutdown of critical facilitiesfor one week); 3 = High (complete shutdown of critical facilities for at least two weeks); 4 = Excessive (complete shutdownof critical facilities for 30 days or more)Human: 1 = Low (Minor injuries); 2 = Medium (Some injuries); 3 = High (Multiple severe injuries; 4 = Excessive (Multiple deaths)Property: 1 = Low (Less than 10% of property severly damaged); 2 = Medium (More than 10% of property severely damaged); 3 = High
(More than 25% of property damaged); 4 = Excessive (More than 50% of property severely damaged)
Note: Please see the Ohio EMA Hazard Identification and Risk Assessment for more information on the vulnerability.
Total Risk: (Maximum Score: 33.5)Combination of adjusted Total Score and Total Vulnerability
Human Caused
Accidental
Air/Water Pollution, Contamination
CatastrophicPrevious OEMA
HIRANational Planning
Scenarios
National PlanReview
URS HIRAProvided for EMP
EnhancedMitigation Plan NFPA 1600
X
Avg ResposeDuration
Avg Speed ofOnset
5 1
Total RiskAvg PropertyAvg HumanAvg BusinessTotal Potential
Damage13111 3
Reference(s) ofHazard:
HazardProfile:
Vulnerability toHazard:
Hazard Type:
Adj. Frequency:
1.5
Adj. AvgMagnitude:
2.5
Adjusted Total:
10
FrequencyMagnitude
(Impact)Not scored foradjusted profile
Not scored foradjusted profile
Monday, December 03, 2007

Building/Structure Collapse
CatastrophicPrevious OEMA
HIRANational Planning
Scenarios
National PlanReview
URS HIRAProvided for EMP
EnhancedMitigation Plan NFPA 1600
X
Avg ResposeDuration
Avg Speed ofOnset
4 4
Total RiskAvg PropertyAvg HumanAvg BusinessTotal Potential
Damage24.75344 11
Reference(s) ofHazard:
HazardProfile:
Vulnerability toHazard:
Hazard Type:
Adj. Frequency:
4.5
Adj. AvgMagnitude:
1.25
Adjusted Total:
13.75
FrequencyMagnitude
(Impact)Not scored foradjusted profile
Not scored foradjusted profile
Communications Systems Interruptions
CatastrophicPrevious OEMA
HIRANational Planning
Scenarios
National PlanReview
URS HIRAProvided for EMP
EnhancedMitigation Plan NFPA 1600
X
Avg ResposeDuration
Avg Speed ofOnset
2 4
Total RiskAvg PropertyAvg HumanAvg BusinessTotal Potential
Damage17.75112 4
Reference(s) ofHazard:
HazardProfile:
Vulnerability toHazard:
Hazard Type:
Adj. Frequency:
1.5
Adj. AvgMagnitude:
6.25
Adjusted Total:
12.75
FrequencyMagnitude
(Impact)Not scored foradjusted profile
Not scored foradjusted profile
Energy/Power/Utility failure
CatastrophicPrevious OEMA
HIRANational Planning
Scenarios
National PlanReview
URS HIRAProvided for EMP
EnhancedMitigation Plan NFPA 1600
X X
Avg ResposeDuration
Avg Speed ofOnset
2 4
Total RiskAvg PropertyAvg HumanAvg BusinessTotal Potential
Damage17112 4
Reference(s) ofHazard:
HazardProfile:
Vulnerability toHazard:
Hazard Type:
Adj. Frequency:
4.5
Adj. AvgMagnitude:
2.5
Adjusted Total:
11.25
FrequencyMagnitude
(Impact)Not scored foradjusted profile
Not scored foradjusted profile
Explosion/Fire
CatastrophicPrevious OEMA
HIRANational Planning
Scenarios
National PlanReview
URS HIRAProvided for EMP
EnhancedMitigation Plan NFPA 1600
X
Avg ResposeDuration
Avg Speed ofOnset
2 4
Total RiskAvg PropertyAvg HumanAvg BusinessTotal Potential
Damage19.75242 8
Reference(s) ofHazard:
HazardProfile:
Vulnerability toHazard:
Hazard Type:
Adj. Frequency:
4.5
Adj. AvgMagnitude:
1.25
Adjusted Total:
11.75
FrequencyMagnitude
(Impact)Not scored foradjusted profile
Not scored foradjusted profile
Monday, December 03, 2007

Fuel/Resource Shortage
CatastrophicPrevious OEMA
HIRANational Planning
Scenarios
National PlanReview
URS HIRAProvided for EMP
EnhancedMitigation Plan NFPA 1600
X
Avg ResposeDuration
Avg Speed ofOnset
4 2
Total RiskAvg PropertyAvg HumanAvg BusinessTotal Potential
Damage17.25111 3
Reference(s) ofHazard:
HazardProfile:
Vulnerability toHazard:
Hazard Type:
Adj. Frequency:
4.5
Adj. AvgMagnitude:
3.75
Adjusted Total:
14.25
FrequencyMagnitude
(Impact)Not scored foradjusted profile
Not scored foradjusted profile
Hazardous Material (explosive, flammable liquid, flammable gas, flammable solid, oxidizer, poison,radiological, corrosive) spill or release
CatastrophicPrevious OEMA
HIRANational Planning
Scenarios
National PlanReview
URS HIRAProvided for EMP
EnhancedMitigation Plan NFPA 1600
X X XX
Avg ResposeDuration
Avg Speed ofOnset
2 4
Total RiskAvg PropertyAvg HumanAvg BusinessTotal Potential
Damage16.25222 6
Reference(s) ofHazard:
HazardProfile:
Vulnerability toHazard:
Hazard Type:
Adj. Frequency:
3
Adj. AvgMagnitude:
1.25
Adjusted Total:
10.25
FrequencyMagnitude
(Impact)Not scored foradjusted profile
Not scored foradjusted profile
Transportation Accident
CatastrophicPrevious OEMA
HIRANational Planning
Scenarios
National PlanReview
URS HIRAProvided for EMP
EnhancedMitigation Plan NFPA 1600
X X
Avg ResposeDuration
Avg Speed ofOnset
1 4
Total RiskAvg PropertyAvg HumanAvg BusinessTotal Potential
Damage11.75121 4
Reference(s) ofHazard:
HazardProfile:
Vulnerability toHazard:
Hazard Type:
Adj. Frequency:
1.5
Adj. AvgMagnitude:
1.25
Adjusted Total:
7.75
FrequencyMagnitude
(Impact)Not scored foradjusted profile
Not scored foradjusted profile
Water Control Structure (dam/levee failure)
CatastrophicPrevious OEMA
HIRANational Planning
Scenarios
National PlanReview
URS HIRAProvided for EMP
EnhancedMitigation Plan NFPA 1600
X X X XX
Avg ResposeDuration
Avg Speed ofOnset
3 3
Total RiskAvg PropertyAvg HumanAvg BusinessTotal Potential
Damage22444 12
Reference(s) ofHazard:
HazardProfile:
Vulnerability toHazard:
Hazard Type:
Adj. Frequency:
1.5
Adj. AvgMagnitude:
2.5
Adjusted Total:
10
FrequencyMagnitude
(Impact)Not scored foradjusted profile
Not scored foradjusted profile
Intentional
Monday, December 03, 2007
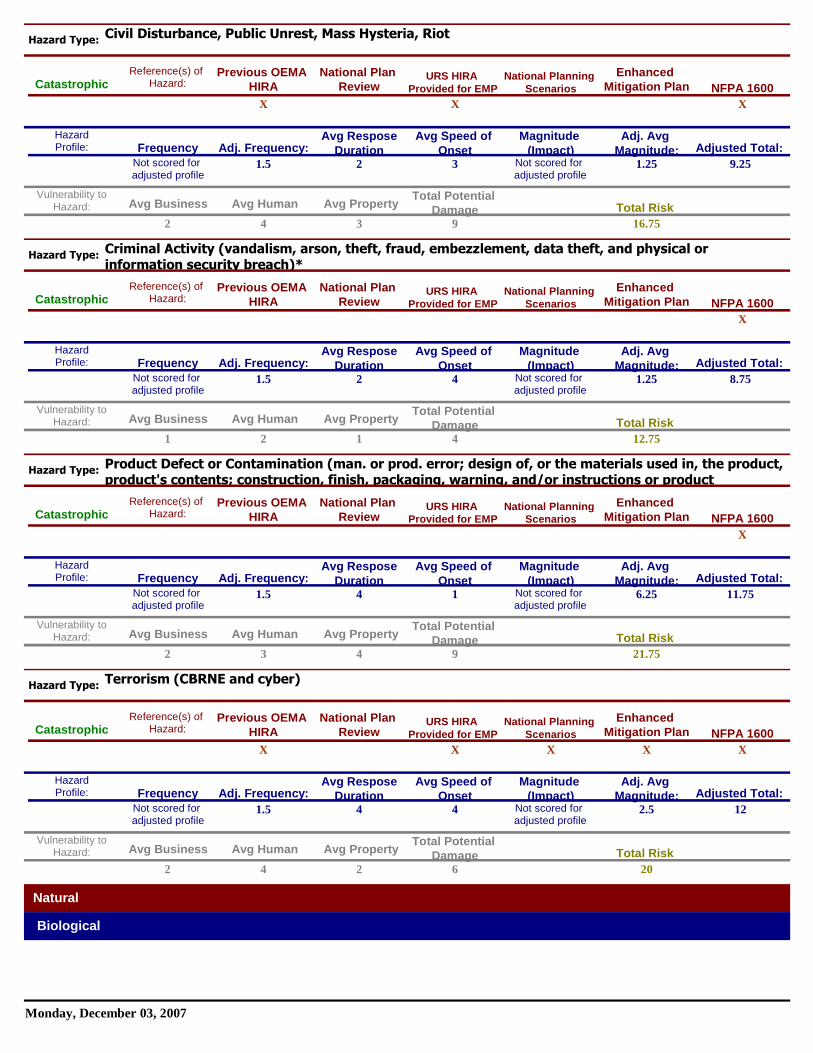
Civil Disturbance, Public Unrest, Mass Hysteria, Riot
CatastrophicPrevious OEMA
HIRANational Planning
Scenarios
National PlanReview
URS HIRAProvided for EMP
EnhancedMitigation Plan NFPA 1600
X X X
Avg ResposeDuration
Avg Speed ofOnset
2 3
Total RiskAvg PropertyAvg HumanAvg BusinessTotal Potential
Damage16.75342 9
Reference(s) ofHazard:
HazardProfile:
Vulnerability toHazard:
Hazard Type:
Adj. Frequency:
1.5
Adj. AvgMagnitude:
1.25
Adjusted Total:
9.25
FrequencyMagnitude
(Impact)Not scored foradjusted profile
Not scored foradjusted profile
Criminal Activity (vandalism, arson, theft, fraud, embezzlement, data theft, and physical orinformation security breach)*
CatastrophicPrevious OEMA
HIRANational Planning
Scenarios
National PlanReview
URS HIRAProvided for EMP
EnhancedMitigation Plan NFPA 1600
X
Avg ResposeDuration
Avg Speed ofOnset
2 4
Total RiskAvg PropertyAvg HumanAvg BusinessTotal Potential
Damage12.75121 4
Reference(s) ofHazard:
HazardProfile:
Vulnerability toHazard:
Hazard Type:
Adj. Frequency:
1.5
Adj. AvgMagnitude:
1.25
Adjusted Total:
8.75
FrequencyMagnitude
(Impact)Not scored foradjusted profile
Not scored foradjusted profile
Product Defect or Contamination (man. or prod. error; design of, or the materials used in, the product,product's contents; construction, finish, packaging, warning, and/or instructions or product
CatastrophicPrevious OEMA
HIRANational Planning
Scenarios
National PlanReview
URS HIRAProvided for EMP
EnhancedMitigation Plan NFPA 1600
X
Avg ResposeDuration
Avg Speed ofOnset
4 1
Total RiskAvg PropertyAvg HumanAvg BusinessTotal Potential
Damage21.75432 9
Reference(s) ofHazard:
HazardProfile:
Vulnerability toHazard:
Hazard Type:
Adj. Frequency:
1.5
Adj. AvgMagnitude:
6.25
Adjusted Total:
11.75
FrequencyMagnitude
(Impact)Not scored foradjusted profile
Not scored foradjusted profile
Terrorism (CBRNE and cyber)
CatastrophicPrevious OEMA
HIRANational Planning
Scenarios
National PlanReview
URS HIRAProvided for EMP
EnhancedMitigation Plan NFPA 1600
X XX XX
Avg ResposeDuration
Avg Speed ofOnset
4 4
Total RiskAvg PropertyAvg HumanAvg BusinessTotal Potential
Damage20242 6
Reference(s) ofHazard:
HazardProfile:
Vulnerability toHazard:
Hazard Type:
Adj. Frequency:
1.5
Adj. AvgMagnitude:
2.5
Adjusted Total:
12
FrequencyMagnitude
(Impact)Not scored foradjusted profile
Not scored foradjusted profile
Natural
Biological
Monday, December 03, 2007

Animal or Insect Infestation or Damage
CatastrophicPrevious OEMA
HIRANational Planning
Scenarios
National PlanReview
URS HIRAProvided for EMP
EnhancedMitigation Plan NFPA 1600
X
Avg ResposeDuration
Avg Speed ofOnset
5 1
Total RiskAvg PropertyAvg HumanAvg BusinessTotal Potential
Damage15.25121 4
Reference(s) ofHazard:
HazardProfile:
Vulnerability toHazard:
Hazard Type:
Adj. Frequency:
1.5
Adj. AvgMagnitude:
3.75
Adjusted Total:
11.25
FrequencyMagnitude
(Impact)Not scored foradjusted profile
Not scored foradjusted profile
Emerging Diseases [plague, smallpox, anthrax, West Nile virus, foot and mouth disease, SARS,pandemic influenza, BSE (Mad Cow Disease)]
CatastrophicPrevious OEMA
HIRANational Planning
Scenarios
National PlanReview
URS HIRAProvided for EMP
EnhancedMitigation Plan NFPA 1600
XX XX
Avg ResposeDuration
Avg Speed ofOnset
5 2
Total RiskAvg PropertyAvg HumanAvg BusinessTotal Potential
Damage24.75442 10
Reference(s) ofHazard:
HazardProfile:
Vulnerability toHazard:
Hazard Type:
Adj. Frequency:
1.5
Adj. AvgMagnitude:
6.25
Adjusted Total:
13.75
FrequencyMagnitude
(Impact)Not scored foradjusted profile
Not scored foradjusted profile
Geological
Earthquake (7.9 magnitude)
CatastrophicPrevious OEMA
HIRANational Planning
Scenarios
National PlanReview
URS HIRAProvided for EMP
EnhancedMitigation Plan NFPA 1600
X XX XX
Avg ResposeDuration
Avg Speed ofOnset
4 4
Total RiskAvg PropertyAvg HumanAvg BusinessTotal Potential
Damage24.25344 11
Reference(s) ofHazard:
HazardProfile:
Vulnerability toHazard:
Hazard Type:
Adj. Frequency:
1.5
Adj. AvgMagnitude:
3.75
Adjusted Total:
13.25
FrequencyMagnitude
(Impact)Not scored foradjusted profile
Not scored foradjusted profile
Landslide, Mudslide, Subsidence
CatastrophicPrevious OEMA
HIRANational Planning
Scenarios
National PlanReview
URS HIRAProvided for EMP
EnhancedMitigation Plan NFPA 1600
X X XX
Avg ResposeDuration
Avg Speed ofOnset
3 4
Total RiskAvg PropertyAvg HumanAvg BusinessTotal Potential
Damage19.25122 5
Reference(s) ofHazard:
HazardProfile:
Vulnerability toHazard:
Hazard Type:
Adj. Frequency:
6
Adj. AvgMagnitude:
1.25
Adjusted Total:
14.25
FrequencyMagnitude
(Impact)Not scored foradjusted profile
Not scored foradjusted profile
Meteorological
Monday, December 03, 2007

Drought
CatastrophicPrevious OEMA
HIRANational Planning
Scenarios
National PlanReview
URS HIRAProvided for EMP
EnhancedMitigation Plan NFPA 1600
X X XX
Avg ResposeDuration
Avg Speed ofOnset
5 1
Total RiskAvg PropertyAvg HumanAvg BusinessTotal Potential
Damage15.25211 4
Reference(s) ofHazard:
HazardProfile:
Vulnerability toHazard:
Hazard Type:
Adj. Frequency:
1.5
Adj. AvgMagnitude:
3.75
Adjusted Total:
11.25
FrequencyMagnitude
(Impact)Not scored foradjusted profile
Not scored foradjusted profile
Extreme Temperatures (heat, cold)
CatastrophicPrevious OEMA
HIRANational Planning
Scenarios
National PlanReview
URS HIRAProvided for EMP
EnhancedMitigation Plan NFPA 1600
X XX
Avg ResposeDuration
Avg Speed ofOnset
4 2
Total RiskAvg PropertyAvg HumanAvg BusinessTotal Potential
Damage19.5142 7
Reference(s) ofHazard:
HazardProfile:
Vulnerability toHazard:
Hazard Type:
Adj. Frequency:
1.5
Adj. AvgMagnitude:
5
Adjusted Total:
12.5
FrequencyMagnitude
(Impact)Not scored foradjusted profile
Not scored foradjusted profile
Fire (forest, range, urban, wildland, urban interface)
CatastrophicPrevious OEMA
HIRANational Planning
Scenarios
National PlanReview
URS HIRAProvided for EMP
EnhancedMitigation Plan NFPA 1600
X X XX
Avg ResposeDuration
Avg Speed ofOnset
2 4
Total RiskAvg PropertyAvg HumanAvg BusinessTotal Potential
Damage15.75232 7
Reference(s) ofHazard:
HazardProfile:
Vulnerability toHazard:
Hazard Type:
Adj. Frequency:
1.5
Adj. AvgMagnitude:
1.25
Adjusted Total:
8.75
FrequencyMagnitude
(Impact)Not scored foradjusted profile
Not scored foradjusted profile
Flood, Flash Flood, Seiche
CatastrophicPrevious OEMA
HIRANational Planning
Scenarios
National PlanReview
URS HIRAProvided for EMP
EnhancedMitigation Plan NFPA 1600
X X X XX
Avg ResposeDuration
Avg Speed ofOnset
3 2
Total RiskAvg PropertyAvg HumanAvg BusinessTotal Potential
Damage28.25444 12
Reference(s) ofHazard:
HazardProfile:
Vulnerability toHazard:
Hazard Type:
Adj. Frequency:
7.5
Adj. AvgMagnitude:
3.75
Adjusted Total:
16.25
FrequencyMagnitude
(Impact)Not scored foradjusted profile
Not scored foradjusted profile
Monday, December 03, 2007

Lightning Strikes
CatastrophicPrevious OEMA
HIRANational Planning
Scenarios
National PlanReview
URS HIRAProvided for EMP
EnhancedMitigation Plan NFPA 1600
X X
Avg ResposeDuration
Avg Speed ofOnset
1 4
Total RiskAvg PropertyAvg HumanAvg BusinessTotal Potential
Damage111 3
Reference(s) ofHazard:
HazardProfile:
Vulnerability toHazard:
Hazard Type:
Adj. Frequency:
1.5
Adj. AvgMagnitude:
1.25
Adjusted Total:
7.75
FrequencyMagnitude
(Impact)Not scored foradjusted profile
Not scored foradjusted profile
Snow, Ice, Hail Sleet
CatastrophicPrevious OEMA
HIRANational Planning
Scenarios
National PlanReview
URS HIRAProvided for EMP
EnhancedMitigation Plan NFPA 1600
X XX
Avg ResposeDuration
Avg Speed ofOnset
3 1
Total RiskAvg PropertyAvg HumanAvg BusinessTotal Potential
Damage22.25142 7
Reference(s) ofHazard:
HazardProfile:
Vulnerability toHazard:
Hazard Type:
Adj. Frequency:
7.5
Adj. AvgMagnitude:
3.75
Adjusted Total:
15.25
FrequencyMagnitude
(Impact)Not scored foradjusted profile
Not scored foradjusted profile
Windstorm, Tornado
CatastrophicPrevious OEMA
HIRANational Planning
Scenarios
National PlanReview
URS HIRAProvided for EMP
EnhancedMitigation Plan NFPA 1600
X XX
Avg ResposeDuration
Avg Speed ofOnset
2 4
Total RiskAvg PropertyAvg HumanAvg BusinessTotal Potential
Damage25.25242 8
Reference(s) ofHazard:
HazardProfile:
Vulnerability toHazard:
Hazard Type:
Adj. Frequency:
7.5
Adj. AvgMagnitude:
3.75
Adjusted Total:
17.25
FrequencyMagnitude
(Impact)Not scored foradjusted profile
Not scored foradjusted profile
Technological
None
Central Computer, Mainframe, Software, or Application Failure
CatastrophicPrevious OEMA
HIRANational Planning
Scenarios
National PlanReview
URS HIRAProvided for EMP
EnhancedMitigation Plan NFPA 1600
X
Avg ResposeDuration
Avg Speed ofOnset
2 4
Total RiskAvg PropertyAvg HumanAvg BusinessTotal Potential
Damage14112 4
Reference(s) ofHazard:
HazardProfile:
Vulnerability toHazard:
Hazard Type:
Adj. Frequency:
1.5
Adj. AvgMagnitude:
2.5
Adjusted Total:
10
FrequencyMagnitude
(Impact)Not scored foradjusted profile
Not scored foradjusted profile
Monday, December 03, 2007

Energy/Power/Utility
CatastrophicPrevious OEMA
HIRANational Planning
Scenarios
National PlanReview
URS HIRAProvided for EMP
EnhancedMitigation Plan NFPA 1600
X
Avg ResposeDuration
Avg Speed ofOnset
2 4
Total RiskAvg PropertyAvg HumanAvg BusinessTotal Potential
Damage15.25112 4
Reference(s) ofHazard:
HazardProfile:
Vulnerability toHazard:
Hazard Type:
Adj. Frequency:
1.5
Adj. AvgMagnitude:
3.75
Adjusted Total:
13
FrequencyMagnitude
(Impact)Not scored foradjusted profile
Not scored foradjusted profile
Telecommunications
CatastrophicPrevious OEMA
HIRANational Planning
Scenarios
National PlanReview
URS HIRAProvided for EMP
EnhancedMitigation Plan NFPA 1600
X X
Avg ResposeDuration
Avg Speed ofOnset
2 4
Total RiskAvg PropertyAvg HumanAvg BusinessTotal Potential
Damage17.75112 4
Reference(s) ofHazard:
HazardProfile:
Vulnerability toHazard:
Hazard Type:
Adj. Frequency:
1.5
Adj. AvgMagnitude:
6.25
Adjusted Total:
12.75
FrequencyMagnitude
(Impact)Not scored foradjusted profile
Not scored foradjusted profile
Monday, December 03, 2007

Page 37 of 39
ATTACHMENT 2: HAZARD RANKING SUMMARY SHEET
The purpose of this sheet is offer a starting direction for planning. It details the hazard rank by hazardprofile and hazard vulnerability as well as shows a theoretical ‘worst’ hazard to least.

Ran
kH
azar
dA
dju
sted
Fre
qu
ency
Du
rati
on
Sp
eed
of
On
set
Ad
just
ed
Mag
nit
ud
e
Haz
ard
To
tal
Bu
sin
ess
Hu
man
Pro
per
tyT
ota
l
Vu
lner
abil
ity
Ov
eral
l
Ris
k
1W
ind
sto
rm,T
orn
ado
7.5
24
3.7
51
7.2
52
32
72
4.2
5
2F
loo
d,F
lash
Flo
od
,Sei
che
7.5
32
3.7
51
6.2
52
22
62
2.2
5
3E
mer
gin
gD
isea
ses
[pla
gu
e,sm
allp
ox
,an
thra
x,W
est
Nil
ev
iru
s,fo
ot
and
mo
uth
dis
ease
,SA
RS
,pan
dem
ic
1.5
52
6.2
51
4.7
52
41
72
1.7
5
4E
arth
qu
ake
(7.9
mag
nit
ud
e)1
.54
43
.75
13
.25
32
38
21
.25
5B
uil
din
g/S
tru
ctu
reC
oll
apse
4.5
44
1.2
51
3.7
54
21
72
0.7
5
6L
and
slid
e,M
ud
slid
e,S
ub
sid
ence
63
41
.25
14
.25
22
15
19
.25
~S
no
w,I
ce,H
ail
Sle
et7
.53
13
.75
15
.25
12
14
19
.25
8T
erro
rism
(CB
RN
Ean
dcy
ber
)1
.54
42
.51
23
22
71
9
9P
rod
uct
Def
ect
or
Co
nta
min
atio
n(m
an.o
rp
rod
.err
or;
des
ign
of,
or
the
mat
eria
lsu
sed
in,t
he
pro
du
ct,p
rod
uct
's
1.5
41
6.2
51
2.7
52
22
61
8.7
5
10
Ex
trem
eT
emp
erat
ure
s(h
eat,
cold
)1
.54
25
12
.51
41
61
8.5
11
Wat
erC
on
tro
lS
tru
ctu
re(d
am/l
evee
fail
ure
)1
.53
32
.51
02
33
81
8
12
Ex
plo
sio
n/F
ire
4.5
24
1.2
51
1.7
52
22
61
7.7
5
~T
elec
om
mu
nic
atio
ns
1.5
24
6.2
51
3.7
52
11
41
7.7
5
14
Fu
el/R
eso
urc
eS
ho
rtag
e4
.54
23
.75
14
.25
11
13
17
.25
15
En
erg
y/P
ow
er/U
tili
tyfa
ilu
re4
.52
42
.51
32
11
41
7
16
Co
mm
un
icat
ion
sS
yste
ms
Inte
rru
pti
on
s1
.52
46
.25
13
.75
11
13
16
.75
17
Haz
ard
ou
sM
ater
ial
(ex
plo
siv
e,fl
amm
able
liq
uid
,
flam
mab
leg
as,f
lam
mab
leso
lid
,ox
idiz
er,p
ois
on
,
32
41
.25
10
.25
22
26
16
.25
18
En
erg
y/P
ow
er/U
tili
ty1
.52
43
.75
11
.25
21
14
15
.25
~A
nim
alo
rIn
sect
Infe
stat
ion
or
Dam
age
1.5
51
3.7
51
1.2
51
21
41
5.2
5
~D
rou
gh
t1
.55
13
.75
11
.25
11
24
15
.25
21
Cri
min
alA
ctiv
ity
(van
dal
ism
,ars
on
,th
eft,
frau
d,
emb
ezzl
emen
t,d
ata
thef
t,an
dp
hys
ical
or
info
rmat
ion
1.5
24
1.2
58
.75
22
26
14
.75
22
Cen
tral
Co
mp
ute
r,M
ain
fram
e,S
oft
war
e,o
rA
pp
lica
tio
n
Fai
lure
1.5
24
2.5
10
21
14
14
23
Fir
e(f
ore
st,r
ang
e,u
rban
,wil
dla
nd
,urb
anin
terf
ace)
1.5
24
1.2
58
.75
21
25
13
.75
~C
ivil
Dis
turb
ance
,Pu
bli
cU
nre
st,M
ass
Hys
teri
a,R
iot
1.5
23
1.2
57
.75
22
26
13
.75
25
Air
/Wat
erP
oll
uti
on
,Co
nta
min
atio
n1
.55
12
.51
01
11
31
3
26
Tra
nsp
ort
atio
nA
ccid
ent
1.5
14
1.2
57
.75
12
14
11
.75
27
Lig
htn
ing
Str
ikes
1.5
14
1.2
57
.75
11
13
10
.75

Page 39 of 39
i This HIRA is an update and slight variation of the document produced by John Spoff by Rich Weber. In manyareas, his work is current and remains unchanged.ii See Ohio Revised Code 5502.22 accessed athttp://onlinedocs.andersonpublishing.com/oh/lpExt.dll/PORC/245eb/24748/2478c/24792?fn=document-iii See Ohio Revised Code 5502.21 (I) accessed athttp://onlinedocs.andersonpublishing.com/oh/lpExt.dll/PORC/245eb/24748/2478c/2478d?iv See Ohio Revised Code 5502.21 (J) accessed athttp://onlinedocs.andersonpublishing.com/oh/lpExt.dll/PORC/245eb/24748/2478c/2478d?v See National Fire Protection Association. NFPA 1600: Standard on Disaster/Emergency Management andBusiness Continuity Programs, 2007 Edition, Pp. 1600-5vi Taken from the US Census Bureau information on April 10, 2007vii As reported by the Ohio EMA Disaster Recovery Branch, information accurate as of April 6, 2007viii Sourced by Ohio EMA Disaster Recovery Branch materials


![The Ohio State University Hazard Communication Program Program J… · Program (PERRP) [Ohio House Bill 308 an Act] and the Occupational Safety and Health Administration (OSHA) Hazard](https://img.dokumen.tips/doc/110x75/5fdc86d577cab37b281faabc/the-ohio-state-university-hazard-communication-program-program-j-program-perrp.jpg)