Embed Size (px)
Citation preview

HAZARA UNIVERSITY MANSEHRA
Department of Genetics
MOLECULAR AND PHYTOCHEMICAL
ELABORATION OF TEA GENOTYPES GROWN IN PAKISTAN
BY
Mr. Sahib Gul Afridi
This research study has been conducted and reported as partial
fulfillment of the requirements of PhD degree in Genetics awarded by
Hazara University Mansehra, Pakistan
Mansehra,
The Monday 31, January 2011


MOLECULAR AND PHYTOCHEMICAL ELABORATION
OF TEA GENOTYPES GROWN IN PAKISTAN
A thesis submitted to fullfill the partial requirement for the degree of PhD in Genetics
Submitted by Sahib Gul Afridi
Research Supervisor Prof. Dr. Habib Ahmad
Chairman Department of Genetics Hazara University Mansehra
Co Supervisor Dr. Mukhtar Alam
Director Research & Planning
Visiting faculty Department of Genetics Hazara University Mansehra
DEPARTMENT OF GENETICS HAZARA UNIVERSITY MANSEHRA
2011

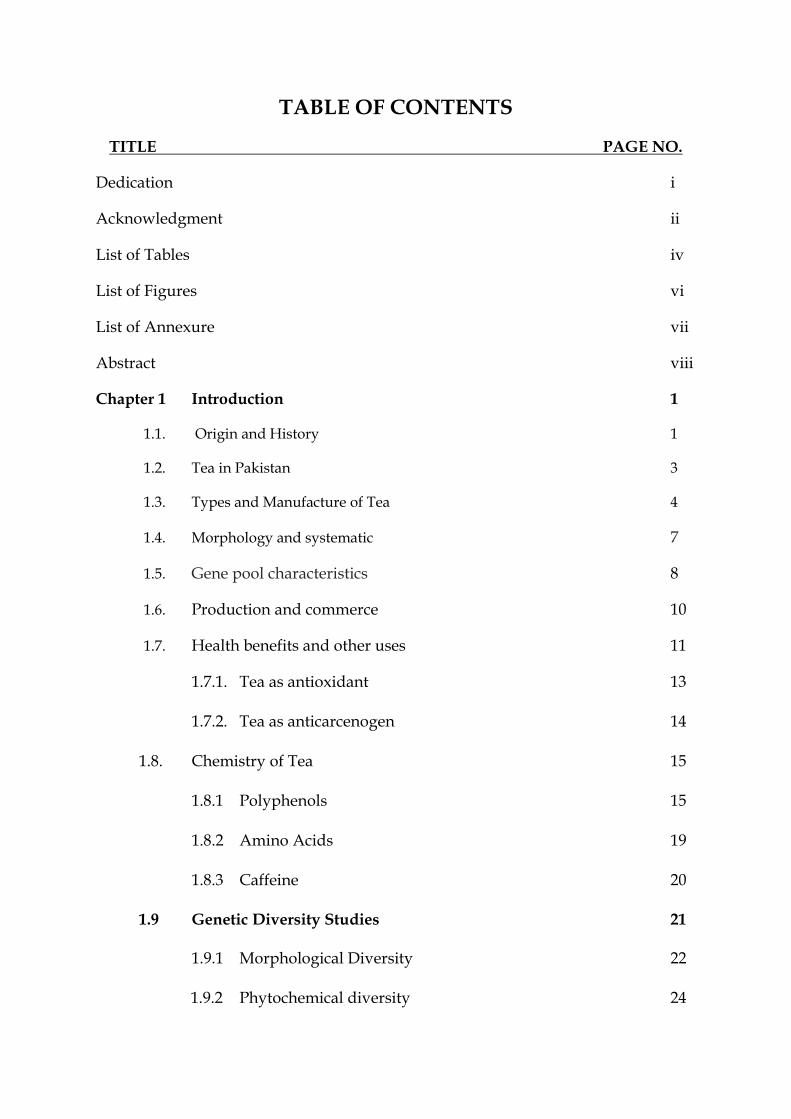
TABLE OF CONTENTS
TITLE PAGE NO.
Dedication i
Acknowledgment ii
List of Tables iv
List of Figures vi
List of Annexure vii
Abstract viii
Chapter 1 Introduction 1
1.1. Origin and History 1
1.2. Tea in Pakistan 3
1.3. Types and Manufacture of Tea 4
1.4. Morphology and systematic 7
1.5. Gene pool characteristics 8
1.6. Production and commerce 10
1.7. Health benefits and other uses 11
1.7.1. Tea as antioxidant 13
1.7.2. Tea as anticarcenogen 14
1.8. Chemistry of Tea 15
1.8.1 Polyphenols 15
1.8.2 Amino Acids 19
1.8.3 Caffeine 20
1.9 Genetic Diversity Studies 21
1.9.1 Morphological Diversity 22
1.9.2 Phytochemical diversity 24

1.9.3 DNA based diversity 27
1.9.3.1 Randomly Amplified Polymorphic DNA Markers 30
1.9.3.2 Simple Sequence Repeats Markers 31
1.9.3.3 Restriction Fragment Length Polymorphism Markers 34
1.9.3.4 Amplified Fragment Length Polymorphism Markers 35
1.9.3.5 Inter Simple Sequence Repeat Markers 36
1.9.3.6 Cleaved Amplified Polymorphic Sequences Markers 37
1.10 Scope and objective of the Study 37
Chapter 2 Materials and Methods 40
2.1 Plant material 40
2.2 Sampling procedures for morphological studies 40
2.2.1 Quantitative trait analysis 46
2.2.2 Qualitative trait analysis 42
2.2.3. Statistical analysis 43
2.3 Phytochemical Elaboration of Tea Genotypes 43
2.3.1 Plant Material 43
2.3.2 Tea infusion/ stock solutions 44
2.3.3 Extraction of water soluble compounds 44
2.3.4 Polyphenols analysis 45
2.3.5 Amino Acids analysis 46
2.3.5.1 Standard curve preparation 46
2.3.5.2 Amino acids determination 46
2.3.6 Caffeine contents analysis 47
2.3.7 Statistical Analysis 47

2.4 Molecular characterization 48
2.4.1 RAPD Primers 48
2.4.2 PCR Analysis 49
2.4.3 SSR’s Analysis 51
2.4.4 Data analysis 51
Chapter 3 Results and Discussion 54
3.1 Phenotypic trait analyses 54 3.1.1 Quantitative trait analysis 54 3.1.1.1 Leaf characteristics 55 3.1.1.2 Shoot and Seed characteristics 59
3.1.1.3 Cluster Analysis 60
3.1.2 Qualitative trait analysis 61 3.1.2.1 Cluster Analysis 61
3.1.3 Discussion 69
3.2 Phytochemical Elaboration of Tea Genotypes 71 3.2.1 Total Polyphenols Content 72 3.2.2 Caffeine Content 73 3.2.3 Amino acids content 73 3.2.4 Water Extracted Substances 75
3.2.5 Multivariate Analysis of Tea Genotypes 78
based on Phytochemical Contents
3.2.5.1 Cluster Analysis 78
3.2.5.2 Principal Coordinate Analysis 78
3.2.6 Discussion 85

3.3.1 Molecular Characterization of Tea Genotypes Using 88 RAPD Markers
3.3.1.1 Genomic DNA Extraction 88
3.3.1.2 RAPD Amplification 90
3.3.1.3 Discussion 100
3.3.2 Molecular Characterization of Tea Genotypes using 102 SSR Markers
3.3.2.1 Results 102
3.3.2.2 Discussion 110
Conclusion and Recommendations 113
Acknowledgment 115
REFRENCES 116
Annexures 150

i
I DEDICATE THIS HUMBLE EFFORT
TO MY
HONOURABLE & AFFECTIONATE
TEACHER
PROF. DR. HABIB AHMAD

ii
ACKNOWLEDGMENT
All praises to my Almighty Allah (Jalla-Jalalaho), the most merciful, the most
compassionate, the only creator of the universe and the source of all knowledge and wisdom
who enabled me to accomplish this study successfully. After Almighty Allah, all praises are
to the Holy Prophet Hazrat Muhammad (may peace be upon him), who is a beacon of
guidance and knowledge for all the humanity.
I am short for words to express my gratitude and appreciation to extremely co-operative,
loving and profound supervisor Prof. Dr. Habib Ahmad, Chairman, Department of
Genetics, Hazara University, Mansehra Pakistan, for his intent concern and guidance
throughout this research endeavor. His gentle and tender disposition always provided me a
source of inspiration during the course of study.
I express deep sense of sincere gratitude to my co-supervisor Dr. Mukhtar Alam, Director R
& P and visiting faculty Department of Genetics, Hazara University for his help, kind co-
operation, valuable suggestions and critical evaluation of this thesis.
I would like to extend my cordial gratitude to Prof. Dr. Imtiaz Ahmad Khan, presently
Foreign Faculty Professor Department of Genetics Karachi University for his personal
interest, very sincere and friendly behavior and valuable suggestions throughout my research
work and reviewing the thesis.
I am cordially thankful to Higher Education Commission (HEC) Government of Pakistan
for awarding me the scholarship under the “Indigenous PhD Scholarship 5000”program.
I am very grateful to Bakht Mand khan director NTRI, Abdul Waheed Senior Scientific
Officer (SSO) NTRI and Muhammad Pervaiz general manager UTSI for providing me tea
samples and facilitating me in samples collection. I am also very thankful to Dr. Ihsan Ali

iii
Director Food Chemistry Division NIFA and Dr. Fatima Khanzadi Khatak Senior
Scientific Officer (SSO) Phytochemistry Lab NIFA for providing me with lab facilities and
their invaluable suggestions during phytochemical investigations.
I would like to extend special thanks to faculty members of Genetics, Botany and Zoology
specially Dr. Inamullah, Mr. Sajidul Ghafoor and Mr. Muhammad Islam for their kind
help and co-operation in one or other way during the course of this task.
I also wish to express my appreciation to my colleagues and friends Ikram Muhammad,
Muhammad Tariq, Amjad Ali, Inamullah, Muhammad Jawad and Imad ud din for
their help and good wishes during the course of this research. My special thanks go to Amjad
Shehzad lab attendant for his sincere help during collection of samples and lab work. I am
also thankful to all other staff members of the Department of Genetics for their help and good
wishes towards my success.
Last but not the least, I am highly indebted to all my family members especially my parents
and brother Miraj Gul Afridi for their patience and support during the course of my study.
I appreciate all of those who remembered me in their prayers and encouraged me throughout
the deals of life.
SAHIB GUL AFRIDI

iv
List of Tables
TABLE No. TITLE PAGE No.
Table 1.1 Cost and quantity of black tea imported to Pakistan in during past five
years.
05
Table 1.2 Cost and quantity of green tea imported to Pakistan in during past five
years.
05
Table 1.3 Typical Chemical composition of young tea shoots (dry weight base) 17
Table 1.4 Distribution of the polyphenols content in the tea bush. 19
Table 2.1 Basic information regarding the tea genotypes used for morphological
characterization.
41
Table 2.2 Details of RAPD primers used for primer assisted characterization of tea. 50
Table 2.3 Characteristics of SSR primer pairs used for SSR-assisted
characterization.
53
Table 3.1 Range of Morphological Characters of Tea Genotypes. 63
Table 3.2 Means and LSD values for Leaf parameters. 64
Table 3.3 Means for Quantitative Characters of Plucking Shoots and Seeds. 65
Table 3.4
Genotypic Correlation among the quantitative characters of Tea
genotypes
66
Table 3.5 Means, LSD and CV (%) values for Phytochemical Characters of
Investigated Tea Genotypes.
76
Table 3.6 Basic statistics for four main phytochemical components of tea
genotypes.
77
Table 3.7 Polyphenols content variation among tea genotypes. 77

v
Table 3.8 Caffeine content variation among tea genotypes. 77
Table 3.9 Amino acids content variation among tea genotypes. 77
Table 3.10 Variation of water extracts content among tea genotypes. 77
Table 3.11 Loading of four phytochemical characters on the first three components
from PCoA.
82
Table 3.12 Dissimilarity matrix of Euclidean distances coefficient of tea genotypes
based on phytochemical characteristics.
83
Table 3.13 Samples Samples of tea genotypes used in present study using RAPD primers 89
Table 3.14 Genetic Distances (GD) estimated among 75 tea genotypes used during
present study (Nei & Li, 1979).
96
Table 3.15 Samples of tea genotypes used in SSR analysis. 107

vi
List of Figures
FIGURE No. TITLE PAGE No.
Figure 1.1 Import Composition of Black Tea of Pakistan in 2007. 06
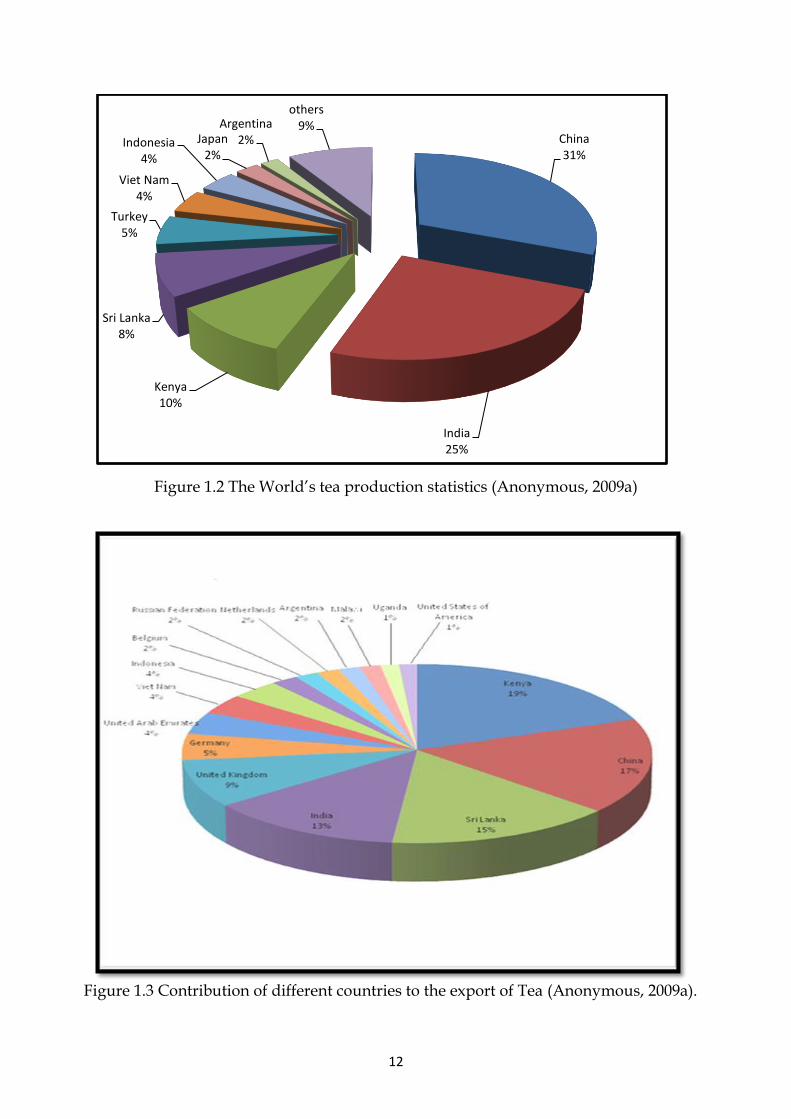
Figure 1.2 The World’s tea production statistics. 12
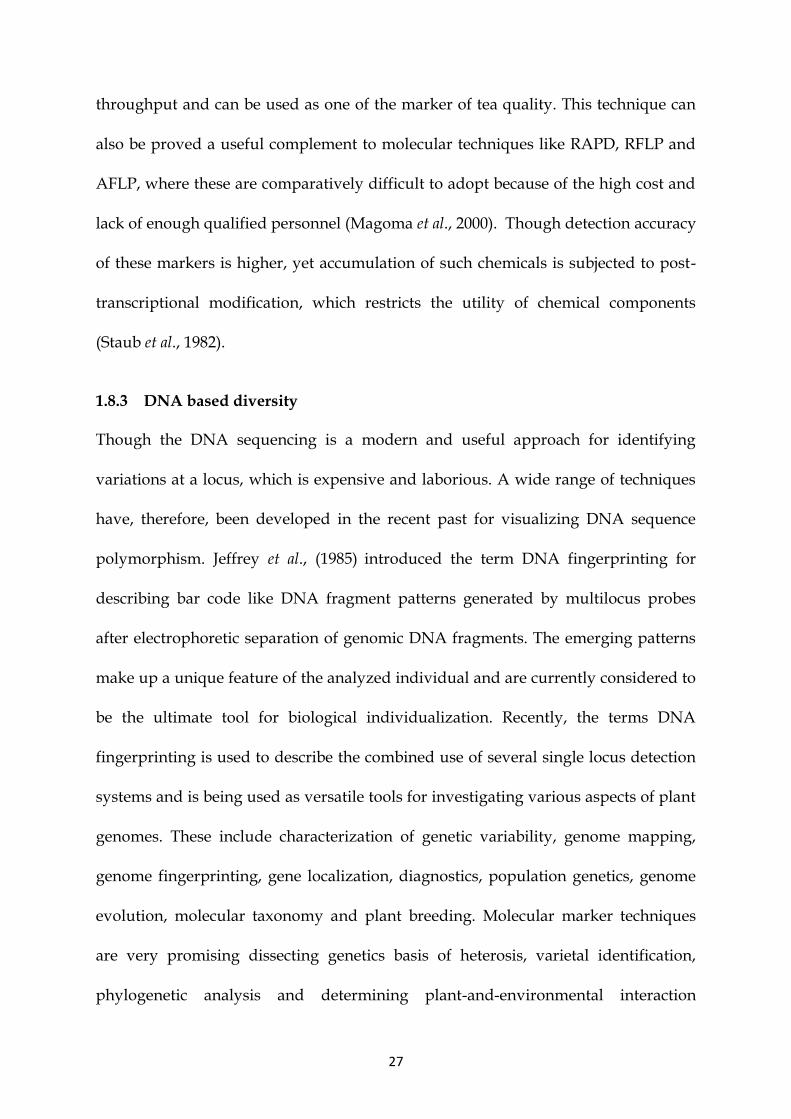
Figure 1.3 Contribution of different countries to the export of tea. 12
Figure 1.4 Structures of Common Polyphenols in Green and Black tea. 18
Figure 3.1 UPGMA cluster analysis showing phenotypic diversity among tea
genotypes, on the basis of Average linkage Euclidean distances.
67
Figure 3.2 Cluster analysis of tea genotypes based on qualitative traits. 68
Figure 3.3 Standard curve for Amino acids (as Glutamic acid equivalent). 74
Figure 3.4 UPGMA-derived dendrogram illustrating the relationship among
39 observed teas based on phytochemical characteristics.
80
Figure 3.5 Principal Co-ordinates analysis of phytochemical characteristics for
39 tea samples based on Euclidean distances coefficient.
81
Figure 3.6 Genomic DNA isolated from tea accessions. 90
Figure 3.7 Genomic DNA isolated from the studied tea genotypes. 90
Figure 3.8a PCR amplification of 12 accessions of tea using RAPD primer GLA-7. 92
Figure 3.8b RAPD amplification using GL A-10 Primer 92
Figure 3.8c RAPD amplification using primer GLA-18. 93
Figure 3.8d RAPD amplification using primer GLB17. 93
Figure 3.8e RAPD amplification using primer GLB-18. 94

vii
Figure 3.8f RAPD amplification using primer GLB-16. 94
Figure 3.9 Dendrogram constructed for 75 tea genotypes using data obtained
from PCR with 20 RAPD primers.
95
Figure 3.10 Polymorphism detected using SSR primer Ca10. 104
Figure 3.11 Polymorphism detected using SSR primer Ca14. 105
Figure 3.12 Polymorphism detected using SSR primer Ca08. 105
Figure 3.13 Polymorphism detected using SSR primer Ca14. 105
Figure 3.14 Polymorphism detected using SSR primer Ca05. 105
Figure 3.15 Dendrogram constructed for 103 tea genotypes using data obtained
from PCR with 12 SSR primers.
106
List of Annexure
Annexure Title Page No.
Annexure A Criteria for data collection on various leaf parameters. 150
Annexure B Sampling criteria for data collection on shoot and seed quantitative
characters.
151
Annexure C Qualitative Characters of leaf and flower and their analysis method. 152
Annexure D Leaf base shape and leaf pose types considered for phenotypic
analyses.
153
Annexure E Types and shapes of leaf margins and leaf apices found in various
genotypes.
154
viii
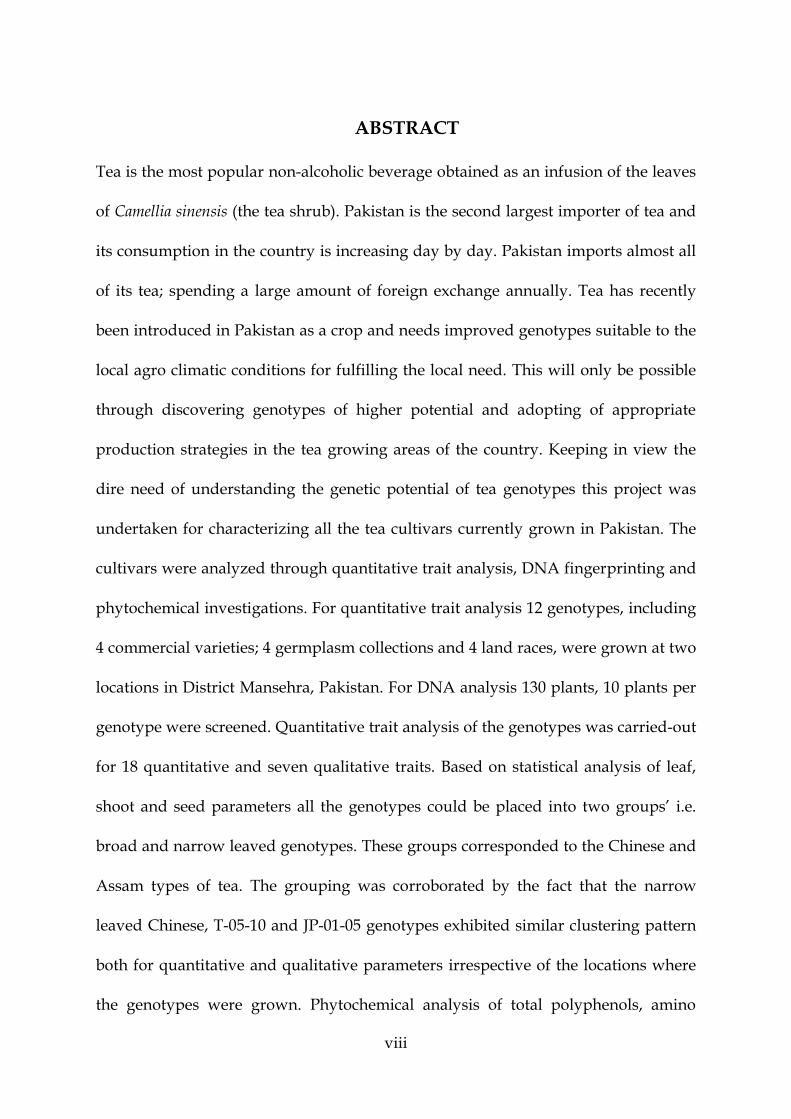
ABSTRACT
Tea is the most popular non-alcoholic beverage obtained as an infusion of the leaves
of Camellia sinensis (the tea shrub). Pakistan is the second largest importer of tea and
its consumption in the country is increasing day by day. Pakistan imports almost all
of its tea; spending a large amount of foreign exchange annually. Tea has recently
been introduced in Pakistan as a crop and needs improved genotypes suitable to the
local agro climatic conditions for fulfilling the local need. This will only be possible
through discovering genotypes of higher potential and adopting of appropriate
production strategies in the tea growing areas of the country. Keeping in view the
dire need of understanding the genetic potential of tea genotypes this project was
undertaken for characterizing all the tea cultivars currently grown in Pakistan. The
cultivars were analyzed through quantitative trait analysis, DNA fingerprinting and
phytochemical investigations. For quantitative trait analysis 12 genotypes, including
4 commercial varieties; 4 germplasm collections and 4 land races, were grown at two
locations in District Mansehra, Pakistan. For DNA analysis 130 plants, 10 plants per
genotype were screened. Quantitative trait analysis of the genotypes was carried-out
for 18 quantitative and seven qualitative traits. Based on statistical analysis of leaf,
shoot and seed parameters all the genotypes could be placed into two groups’ i.e.
broad and narrow leaved genotypes. These groups corresponded to the Chinese and
Assam types of tea. The grouping was corroborated by the fact that the narrow
leaved Chinese, T-05-10 and JP-01-05 genotypes exhibited similar clustering pattern
both for quantitative and qualitative parameters irrespective of the locations where
the genotypes were grown. Phytochemical analysis of total polyphenols, amino

ix
acids, caffeine contents and water extracted substances from fresh tea leaves of the
genotypes showed significant differences among genotypes having CV-percentage
values of 18.13, 14.96, 11.0 and 5.0 respectively. Cluster analysis based on Euclidean
Distance Coefficient, revealed four groups and separated the broad leaved
genotypes from others. Similar results were observed using Principle Co-ordinate
Analysis (PCoA). The plot of the first two components based on all characters
showed a clear separation of broad leaved genotypes (C. assamica), namely IN-01-07
and SL-01-05 genotypes from the narrow leaved (C. sinensis) genotypes. For DNA
analysis 75 genotypes were screened with 20 RAPD primers and 103 genotypes were
screened with 12 SSR primers. Genetic diversity among the genotypes was
calculated according to Nei and Li’s (1979) UPGMA and bivariate data matrix which
were used for making dendrogram and deciding genetic affinity or diversity among
the genotypes. RAPD primers detected 115 different alleles whereas the number of
alleles analyzed through SSR primers was 87. Genetic distance estimates ranged
from 0-100% showing high level of diversity among screened genotypes. UPGMA
cluster analysis of RAPD data showed mixed grouping profile of the samples,
however, samples from different plants of particular genotypes segregated into
independent sub-clusters. Average number of alleles amplified per SSR marker
varied from 4 to 10. Pair wise genetic diversity among all samples ranged from 0%
to 100%. Dendrogram based cluster analysis revealed five main clusters showing
mixed pattern but most of the genotypes were separated in sub groups according to
the genetic affinity. The findings of molecular analyses were generally cocurred with
the results obtained from quantitative trait analysis which revealed a close genetic

x
affinity among the tea genotypes based on the leaf size. The variations between and
within genotypes; collected from different sites; were very high; confirming
differences in origin of the tested samples. Failure of placing some broad leaf
genotypes into clearly defined separate clusters may be due to introgressions as a
result of cross pollination in tea cultivars. Results obtained from quantitative and
qualitative trait analysis superimposed on phytochemical data clearly differentiated
all the tea genotypes into two discrete groups viz. broad and narrow leaved
genotypes. Molecular results also coincided with that of morphological and
phytochemical analysis except that molecular analyses separated the two taxa in
individual sub-clusters instead of main clusters. Ich-08 genotype was found to be
best in flush production, however it has poor adoptability. On the other hand Ich-05
was found best in adaptability at the same time having flush production comparable
to Ich-08. Hence Ich-08 is recommended for further evaluation and for registration as
a new variety for general cultivation.

1
Chapter 1
INTRODUCTION
Historical and archeological evidence shows that tea (an infusion of Camellia sinensis
L.) originated as a commercial beverage in Yunnan Province of Southwest China
(Hasimoto & Takasi, 1978; Yu, 1986). Its cultivation as a cash crop spread soon all
over the world as far as Georgia to Argentina (420 N to 270 S, respectively),
occupying the altitudinal limits of almost 300 to 2500 m.a.s.l in Japan and Kenya,
respectively (Banerjee, 1993; Carr, 1972). At present tea is the most popular, healthy
beverage of the world (Butt & Suleman, 2009), standing just second to water with
respect to its consumption (Chen, 1994). Pakistan has a great potential to emerge as a
major tea producer. However, for that to happen a lot of research, starting from
biology to production and commerce is required. A comprehensive review of
existence knowledge and previous research work is given below as a context for the
current project; its importance, scope, methodologies and objectives.
1.1 Origin and history
The Chinese certainly knew of the value of tea plant long ago, and had discovered
that the infusion of its leaves, if carefully processed, produce a valuable drink.
Regarding the discovery of tea as a drink it is said, that a legendry Chinese Emperor
Shen Nung, discovered tea in 28th Century BC (Bonheur, 1991). Other sources relate
the discovery of tea to an ancient Chinese scholar who, it is believed, was boiling
water for his evening meal using the shoots of tea plants as fire wood. Some of the
leaves fell into the water vessel and upon tasting, he found the drink to be so
exciting in its effect that he continued to use it. It is known that Chinese were
drinking tea in the 5th century AD as a medicinal drink but at the end of the sixth
2
century, it was no longer used as a medicinal drink, it rather emerged as a refreshing
beverage in China. During Tang Dynasty (618-907 AD), a famous book titled “Tea
Sutra Cha Kyou” was written for documenting the preparation and manufacture of
tea. According to Weatherstone (1992) tea has been cultivated on countless small
plots in China for more than 2000 years. Though its export was first made to Tibet,
its regular trade across the borders was permitted during Sung dynasty (960-1127
AD). The Western World did not enjoy tea until 17th Century, when the Dutch East
India Company first began transporting the tea leaves to Holland. Russia also started
to import tea on the Silk Route during 17th Century (Gezgin et al., 2006).
The culture of tea spread over almost all of Europe by the mid-17th century,
becoming a popular beverage of the Royals in England during 1680’s. The British
started cultivating tea in India during 1834 after getting tea plants and skilled labor
from China but the venture failed due to China’s interests of not losing tea
monopoly. However, in 1853 R. Fortune, an English Botanist was able to transfer the
tea cultivation technology along with 20,000 plants and six Chinese experts for
establishment of tea gardens in India (Nathaniel, 1986; Caffin et al., 2004). From an
evolutionary point of view, the center of origin of tea is most probably the South-
East Asia. It probably originated in the high valleys of the Brahmagutra, the
Irrawaddy, the Salween and the Mekong rivers at the border separating India, China
and Burma (Bonheur, 1991).
To conclude, it can be said that tea is a popular beverage and its cultivation has been
in practice for centuries in different parts of the world (Gardner et al., 2007; Moreda-

3
Pineiro et al., 2003; Liang et al., 2005). It is a labour intensive crop and provides job
opportunities to 100s of millions of people all around the world.
1.2 Tea in Pakistan
Pakistan is the second largest importer of tea in the World (Nathaniel, 1992) where
tea is consumed at the rate of 1.00 kg/capita/year. Its use is increasing with the
passage of time (tables 1.1 and 1.2). During the year 2009-2010, its share in the gross
national import and share in the commodity import was 1.5 and 7.0 percent,
respectively. Its import bill for the year 2009-2010 alone was 22.6093 billion Pak Rs.
(Anonymous, 2010a & 2010b).
In order to save the valuable foreign exchange tea cultivation was started for the first
time on experimental basis in 1958 at village Buffa, District Mansehra Pakistan under
the auspices of Pakistan Tea Board. Another attempt of tea cultivation was made in
1964 at Misrial Dam area near Rawalpindi but those efforts could not succeed for
want of proper government attention. This was probably due to self-sufficiency in
domestic tea production in the than Eastern Pakistan (now Bangladesh). After
separation of East Pakistan in 1971, a cell was created by the Government of Pakistan
in 1973, which initiated a project called “Research and introduction of tea in Pakistan”.
Soil survey was undertaken in different prospective tea growing areas of KP
Province in 1982 and then in 1989 by Chinese tea experts who developed a report on
feasibility of tea cultivation in Pakistan in 1958 (Anonymous, 1982). In another
report, “Estimation of Economic Feasibility of Tea Cultivation in Pakistan” the Chinese
experts provided their recommendations regarding cultivation of tea as major crop
of the area (Anonymous, 1989). Based on suitability of topography and climatic data
4
some 60,000 ha of land was identified suitable for tea cultivation in the districts of
Mansehra and Swat (Nathaniel, 1992), whereas the cost-benefit ratio of tea
cultivation in District Mansehra was also worked out (Ruhul, 1998). Under the
auspices of Pakistan Agricultural Research Council (PARC), National Tea Research
Station was founded at Shinkiari, District Mansehra with the technical assistance of
Chinese tea experts in 1992. In 1996 the Station was upgraded to the level of Institute
and a processing plant for black tea was also established in 2001. Presently more or
less, about 600 ha area is under tea cultivation producing nearly 6000 kg tea
annually.
Currently cultivation has gone to the farmer fields. Multinationals like Unilivers pvt
(Ltd) and National groups like Qarshi Industries (Ltd) and Khawaja pvt (Ltd) have
recently invested in commercial tea production in Pakistan. However, the area of
cultivation and production is far less than the potential and requirement of tea in
Pakistan.
1.3 Types and Manufacture of Tea
Tea is mainly used as fermented black tea, non fermented green tea and semi
fermented oolong tea. Black tea constitutes approximately 78% of total consumed tea
in the world, whereas green tea accounts for approximately 20% (Anonymous,
2006a). The use of oolong tea is limited and popular only in to some parts of Japan
and China (Caffin et al., 2004). All the three types of tea are prepared by plucking
and processing young leaves of tea plant (Camellia sinensis).
All the teas are manufactured from young shoots, generally consisting of the apical
bud and the two youngest leaves (two and a bud). In practice, however, upto four

5
leaves along with the bud are plucked. In many countries, less selective processes of
mechanical and hand shear plucking are used, resulting in the manufacture of
widely varying shoot size and ages.
Table 1.1 Cost and quantity of black tea imported to Pakistan during the past five years.
Source: Anonymous (2010b).
Table 1.2 Cost and quantity of green tea imported to Pakistan during past five years
2005-06 1480.961 55.63 0.8169 1.416
2006-07 1213.280 69.41 0.8278 1.378
2007-08 1245.150 71.40 0.8975 1.428
2008-09
2009-10
1057.856
1048.839
93.08
95.72333
0.9846
1.0183
1.234
1.261
Source: Anonymous (2010b).
YEAR Quantity(000 kg) Market rate (Rs/kg) Cost (Rs. billion) Cost USD (million)
2005-06 114082.325 102.90 11.52 193.28
2006-07 105014.128 108.37 10.26 171.00
2007-08 174003.281 119.19 11.92 189.48
2008-09 89819.203 165.80 14.89 186.61
2009-10 97795.070 222.03 21.69 258.59
Year Quantity (000 kg) Rate (Rs/kg) Cost (Rs. billions) Cost USD (millions)

6
Figure 1.1 Import Composition and share of Black Tea of Pakistan in 2007 (Anonymous, 2009a).
Studies have shown that catechins composition changes significantly with leaf age
and not only does total polyphenols concentration decline and so do the proportions
of the individual catechins (Nakagava & Torii, 1964; Bhatia & Ullah, 1968; Forrest &
Bendall, 1969; Wickremasinghe & Perera, 1973).
During the manufacture of black and Oolong tea, the tea leaves pass through
fermentation. The fermentation process involves enzymatic oxidation of
polyphenols, leading to the formation of chemical compounds that generate both the
aroma and color of black tea (Costa et al., 2002). The oolong tea is known as semi

7
fermented tea, which is manufactured by letting the tea leaves to undergo
incomplete fermentation. The oolong tea, with a large twisted leaf, brownish in color
with white tips, produces a light green, slightly coppery infusion. Its chemical
composition is in between the green tea and the black tea (Bonheur, 1991). Oolong
tea contains monomeric catechins, theaflavins and thearubigins. Some characteristic
principles such as Epigallocatechin esters, thea sinensis, dimeric catechins and
dimeric proanthocyanidins are also found in Oolong tea (Yang & Wang, 2006).
For manufacturing black tea, the tea leaves are completely fermented. The fresh tea
leaves are rich in polyphenolic compounds known as catechins. During processing
the tea leaves are broken or rolled, which allows catechins to be oxidized through
the action of polyphenol oxidase enzymes, present in tea leaves. The oxidation of
catechins is known as fermentation in tea industry. Tea fermentation causes
polymerization of catechins into larger, more complex polyphenols known as
theaflavins and thearubigins. Thus, the process of fermentation brings about
differences in the color, aroma and chemical composition of the tea leaves as
compared to green tea and Oolong tea (Yang & Wang, 2006). The difference in tea
quality may also be due to differences in variety, processing, geographical and
traditional distributions (Caffin, et al., 2004).
1.4 Morphology and systematic
Tea [Camellia sinensis L., Theaceae (Ming, 2000)] is a woody perennial evergreen plant.
The species Camellia sinensis mainly consists of two varieties viz, Camellia sinensis var.
sinensis (the Chinese type tea) and Camellia sinensis var. assamica (the Assam type
tea). Camellia sinensis is dwarf, slow growing, shrubby tree with small, erect, narrow,

8
serrate and dark green electrophile leaves. The Chinese tea plants are cold resistant
and suitable for making green and oolong teas. The Assam tea is a tall and quick
growing tree with large, horizontal, broad, mostly non-serrated and light green
planophile leaves (Kitamora, 1950; Sealy, 1958). Leaf color of the Assamica tea is
green but usually lighter than that of Chinese type and is sometimes even very light,
looking yellow. Assam tea is relatively less resistant to cold and is suitable for
processing into black tea.
Other forms of tea with distinct semi-erect oligophile leaves were described as the
Southern form of tea (Roberts et al., 1958) as Cambod race (Kingdon-Ward, 1950).
The Cambod race was considered by White (1962) to be a sub-species of C. assamica
and named C. assamica spp. lasiocalyx (Planchon ex Watt). There are also other types
of tea varieties in addition to the above three types. These varieties can be
differentiated in the height of the tea bush, the number of stems and characteristics
of their leaves (Bonheur, 1991). All the tea varieties over the world have been placed
under the name C. sinensis (L.) O. Kuntze irrespective of taxonomic variation (Sealy,
1937, 1958; Barua, 1965; Visser, 1969). Naturally, tea trees can attain a height of 20-30
m but usually the plant is kept as a shrub by pruning, up to about 1.5 meters. Tea
has got a very long age and some old tea plants with the age of 1500 years can also
be found in natural forests of Yunnan Province of China (Caffin et al., 2004).
1.5 Gene pool characteristics
A number of plant scientists describe the genetic diversity within the genus Camellia
in different ways. Sealy (1958) recognized 82 species in the genus Camellia which are
mostly indigenous to highlands of south east India whereas more than 325 species of

9
the genus are reported by Mondal et al., (2002), all with overlapping traits, indicating
the highly outbreeding nature of the species. Tea is mostly manufactured from
Camellia, the non-tea producing Camellia species are however used as ornamental
plants. Because of extensive internal hybridization between different Camellia taxa,
several intergrades, introgressants and putative hybrids have broadened the range
of recombinations within gene pool of tea and more than 600 cultivated varieties are
available for cultivation worldwide. All these intermediates can be arranged within
the range of Chinese types to Assam types on the basis of morphological similarities.
The size of tea genome in terms of 4C DNA is 15.61 ± 1.06. Tea is generally diploid
(2n = 30, x = 15) and its karyotype range is 1.28 to 3.44 μ. The ratio of long to short
arm for all 15 pairs of chromosomes varies from 1.00 to 1.91. This suggests a
monophyletic origin of tea plant. However, triploid (2n = 45) tea such as cvs. TV-29,
HS-10 A and UPASI-3, tetraploids (2n = 60), pentaploids (2n = 75) and aneuploids
(2n ± 1 to 29), have also been identified in natural tea populations (Zhan et al., 1987).
Owing to the extreme homogenization, existence of the pure archetypes of tea is
doubtful (Visser, 1969). Different types of hybrids are available which are still
referred to as China, Assam or Cambod tea depending on morphological proximity
to the main taxon (Banerjee, 1992). Gene flow across the genomic barriers of different
tea species has also been postulated e.g. some desirable traits such as anthocyanin
pigmentation or special quality characters of Darjeeling tea might have been
introduced from wild species (Wood & Barua, 1958). Other Camellia species, which
could have contributed to the tea genetic pool by hybridization, include C. petelotii,
C. flava and possibly C. lutescens (Sharma & Venkataramani, 1974). Another

10
important species C. taliensis is considered hybrid between C. sinensis and C.
irrawadiensis (Visser, 1969; Wood & Barua, 1958). That is why, the three taxa i.e. C.
assamica, C. sinensis, and C. assamica sub sp. lasiocalyx and to an extent C. irrawadiensis
are considered to have mainly contributed to the genetic pool of tea. The term ’tea’
should therefore, cover progenies of these taxa and the hybrids thereof or between
them (Islam et al., 2005)
1.6 Production and commerce
Chinese literature shows that people in Southwest of China were using tea for
paying tributes to the Chinese emperors as early as 1066 BC, its processing for
market circulation, however, was witnessed in China during 59 BC (Costa et al.,
2002; Caffin et al., 2004).
The area under tea cultivation around the World is about 2.81million ha. It is
cultivated in more than 35 countries all across the world yielding 4.73 million tons of
tea (figure 1.2). The need for more tea production can be judged from the fact that its
global production has increased by 51% over the last 20 years (Anonymous, 2009b).
More than half of the global tea is produced in China and India alone. Tea
contributes about four percent to the GDP and about 26 percent to Kenya’s export
earnings annually (Wachira & Ronno, 2004). Similarly Sri Lanka exports 95 percent
of its tea produce and earns 14 percent of the total foreign exchange of the country
(Wijeratne, 2004). Pakistan lying within the same ecological proximity is importing
almost all the tea for local consumption.
The production and consumption of tea differs from country to country; it is mostly
used locally as in India (81%) and China (73%) (Ahmad & Mukhtar, 1999). In

11
countries like Indonesia, Kenya, Malawi, Sri Lanka, Uganda and Vietnam more than
90% of the tea produce is exported and only a limited quantity is used locally. Sri
Lanka and Kenya are the world’s leading exporters of tea. They together contribute
34% (Figure 1.3) to the international trade of tea (Anonymous, 2009b).
1.7 Health benefits and other uses
Besides other benefits, recently tea has also attracted attention for its health benefits,
intensively studied through a large number of scientific investigations particularly
with respect to its potential for promotion of health, preventing and treating cancer,
cardiovascular diseases, and low-density lipoprotein oxidation (Zhang et al., 2009;
Blumberg, 2003). Apart from its use as beverage, green leaves of tea plants are also
used as vegetables e.g. leppet tea and meting tea in Burma and Thailand, respectively.
Tea infusion not only has a refreshing taste and flavor, it causes many physiological
effects due to active constituents like Polyphenols, Caffeine, Amino acids, etc (Zhao
et al., 2009; Bordoni et al., 2002). It can improve the growth of beneficial micro flora in
the intestine thus improving immunity against intestinal disorders, prevents dental
caries due to fluorine, regulates blood pressure, prevents heart diseases, reduces the
blood glucose activity and normalizes diabetes. Antibiotic activity against some
pathogenic bacteria like Salmonella, Vibrio cholera, Clostridium etc. is also known
(Chen, 1999). Tea catechins especially EGCG in the green tea, may exert
antiatherogenic effect (Ludwig et al., 2004). The use of higher quercetin and
myricetin containing tea reduces the risk of type 2 diabetes (Knekt et al., 2002).
Trevisanato & Kim (2000) reported that tea users were better in cardiovascular
health than non-tea users (Kuriyama et al., 2006).
12
Figure 1.2 The World’s tea production statistics (Anonymous, 2009a)
Figure 1.3 Contribution of different countries to the export of Tea (Anonymous, 2009a).
China31%
India25%
Kenya10%
Sri Lanka8%
Turkey5%
Viet Nam4%
Indonesia4%
Japan2%
Argentina2%
others9%

13
Oil obtained from the tea seed can be used as lubricant. The seed cake of tea contains
saponins and can successfully be used for manufacturing of nematocide. As a
matter of fact several books have been published which have described the beneficial
properties to health of tea (Kuroda & Hara 2004). Due to these effects tea has gained
popularity as a beverage all over the world.
1.7.1 Tea as antioxidant It is an established fact that rheumatoid arthritis, cancer, ischaemic reoxygenation
injury of the liver and other organs, are set off by oxidation processes (Rohdewald,
1998; Cross et al., 1987). Tea has beneficial effects on human health because it
contains the polyphenols as the antioxidant constituents (Kuroda & Hara, 1999;
Mukhtar & Ahmad, 2000; Riemersma et al., 2001). The catechins help in reducing free
radicals, which contribute to numerous disorders including cancer, arthritis,
arthrosclerosis, Central Nervous System (CNS) injury, renal disorders, dementia,
gastritis, ischemia and Acquired Immuno Deficiency Syndrome (AIDS) (Pourmorad
et al., 2006; Rao et al., 2006). The antioxidant, anticarcinogenic, antimutagenic and
anti-microbial functions of tea have been repeatedly confirmed in a number of
experiments conducted as in vitro, ex vivo and in animal models and are principally
attributed to the rich contents of catechins or their oxidation derivatives theaflavins
and thearubigins (Higdon & Frei, 2003; Lambert & Yang, 2003; McKay & Blumberg,
2002; Yang & Landau, 2000).
Tea has powerful antioxidant properties which are generally attributed to its
flavonoid components; theaflavins, theaflavic acid and bisflavanols (Rice-Evans,
1999). When consumed, these compounds may act as the free radical scavengers

14
which remove endogenously generated superoxide radicals. As antioxidant tea is
also associated with some other mechanisms like rearrangement of the molecular
structure depolarization of electrons and formation of intramolecular hydrogen
bonds. These compounds by chelating free copper and iron may also prevent
oxidative reactions which may catalyze the formation of reactive oxygen species in
vitro (Graham, 1992). Chen et al., (1998) have demonstrated that beverage tea, rich in
antioxidant polyphenols, affects host biochemistry and carcinogenesis at important
target organs such as colon or mammary glands in rats.
1.7.2 Tea as anticarcenogen
Several epidemiological studies have proved that tea plays protective role against
cancer in human (Anonymous, 2005, 2006b; Ioannides & Yoxall, 2003; Buschman,
1998; Kohlmeier et al., 1997; Liao & Hiipakka, 1995; Yang & Wang, 1993). Tea acts as
antioxidants through its major chemical constituents Polyphenols, which help in
stopping the growth of cancerous cells (Ho-Osawa & Rosen, 1994). It exerts
anticarcinogenic effects by either modifying enzymes or binding carcinogens to
DNA. Quercetin is one of the most extensively studied flavanoids that possesses the
anticancer activities (Skibola & Smith, 2000). Reports on the negative correlation of
the incidence of cancer with green tea consumption are available from Japan (Imai et
al., 1997), similarly its use has also shown protective effect on stomach related
cancers (Kono, 1992; Yu & Hsieh, 1991; Memik et al., 1992; Hartman et al., 1992). In
other reports a decreased number of the incidents of colon cancer are indicated in
case of increased green tea consumption (Hartman et al., 1992).

15
1.8 Chemistry of Tea
Though most of the basic chemicals of the tea plants remain the same as it is under
the control of a very strong genetic system, the chemistry of tea with respect to its
desired principles vary with the change in genotypes, variation in leaf size, field
environment, application of inputs, manufacturing process, particle size of ground
tea, blending materials and preparation of tea infusion. The most frequently
commercially important phytochemicals available in tea are given in table 1.3. Fresh
young shoots of tea plants can be processed into different types of tea depending
upon the genotypes, physical/chemical parameters and biological characteristics of
the shoots and the genotype concerned (Lu, 1987; Von, 2005). A review on some of
the most important chemical constituents of tea is provided bellow:
1.8.1 Polyphenols
Polyphenols are a well known structurally diverse group of phytochemicals that
occur widely throughout the plant kingdom (Robbins et al., 2006). Polyphenolic
compounds are an integral part of the human diet. These molecules are secondary
metabolites of plants which generally provide defense against ultraviolet radiation
or aggression by pathogens (Manach et al., 2004). Some properties of foods and
beverages like astringency and bitterness can be due to their content of polyphenolic
compounds (Bravo, 1998; Cheynier, 2005). Structures of common polyphenols found
in tea leaves are illustrated in figure 1.4.
The chemical composition of green tea is similar to that of the fresh leaves of the
plant. Its polyphenolic compounds account for up to 30% of the dry weight of green
tea leaves. Most of the polyphenols in green tea are flavanols, commonly known as

16
catechins. The primary catechins in green tea are (-) epicatechin (EC), (-) epicatechin-
3- gallate (ECG), (-) epigallocatechin (EGC) and (-) epigallocatechin- 3-gallate
(EGCG). In addition, caffeine, theobromine, theophylline and gallic acid, are also
present as minor constituents of green tea (Ahmad & Mukhtar, 1999). A small
amount of fluoride and other micronutrients are also provided by tea (Weisburger,
1999; Cai & Chow, 2004). Green tea is made without enzymatic oxidation of
polyphenols, as polyphenol oxidase is inactivated by heat at initial stages of green
tea processing (Hara et al., 1995). Thus the polyphenols in green tea remains the
same as in fresh leaves.
Black tea is made through enzymatic oxidation of fresh leaves. During this process
most flavanols are oxidized and converted to theaflavins (TF) and thearubigins (TR).
The total flavanol level is reduced from 35 to 50% in green tea and to 10% in black
tea. Theaflavins and thearubigins present in black tea account for 3 to 6% and 12 to
18 % of the total dry matter, respectively. All other components of fresh tea leaves
during oxidation process are not changed. The chemical constituents in tea that
cause variations in color and bitterness are predominantly the theaflavins and
thearubigins. The quantities of TFs and TRs and the ratio of their quantities are
believed to determine both the color characteristics of the tea beverage (tea infusion).
An optimum concentration of these chemicals may give a tea infusion with a rosy
color and appropriate briskness (Chang & Gudnason, 1982).
Thearubigins accounts for about 10-20% of the dry weight of black tea, which is
more extensively oxidized and polymerized and has a wide range of molecular
weights, and are less well characterized (Yang & Wang, 2006).

17
Table 1.3 Typical chemical composition of young tea shoots (dry weight base)
S. No. Compounds Concentration in young
shoots (%)
1. Polyphenols 20-40
2. Flavan-3-ols (catechins) 10-30
3. Flavonols and glycosides ~1
4. Flavones 1-2
5. Anthocyanins ~1
6. Phenolic acids 2-3
7. Free amino acids 1-5
8. Theanine 0.5-2.5
9. Caffeine 2-5
10. Theobromine ~0.2
11. Theophylline ~0.05
12. Carbohydrates 20-30
13. Soluble reduced sugars 0.8-4
14. Polysaccharide 20-26
15. Protein 14-17
16. Lipids 4-9
17. Pigments (chlorophyll, carotenoids,
xanthophyll)
~1
18. Minerals (P, K, Ca, Mg, Al, Mn, …) ~6
19. Volatile compounds 0.01-0.02

18
The concentration of total polyphenols varies in different parts of tea bush being
higher in apical bud and first three descending leaves, respectively, as shown in
table in 1.4.
(-) - Epicatechin (EC) (-) - Epigallocatechin (EGC)
(-) - Epigallocatechin_gallate (EGCG) (+) - Catechin (C)
Theafalvin (TF)
Figure 1.4 Structures of common polyphenols in green and black tea

19
Table 1.4 Distribution of the polyphenols content in the tea bush
S. No. Structure % dry weight
1. Bud 35.8
2. 1st leaf 35.0
3. 2nd leaf 27.9
4. 3rd leaf 23.1
5. Stem 15.0
Source: Sant (1972)
1.8.2 Amino Acids
Concentrations of total free amino acids (including amides) in tea range from 1 to
5%. The most abundant amino acid components in tea are theanine (Thea), arginine
(Arg), glutamine (Gln) and glutamic acid (Glu). L-theanine (N5-ethyl-glutamine), the
most important predominant free amino acid in tea, is found only in a few other
species of Camellia at lower concentrations (Casimir et al., 1960; Tsushida & Takeo,
1984). Theanine is not incorporated into protein and exists in free State. Its
concentration accounts for up to 70% of total free amino acids in tea and 1% of the
dry weight of tea. Theanine was reported in tea for the first time in 1950. It is
particularly abundant in the roots of tea and occurs in all parts of the tea plant except
seeds. Amino acid fraction, especially the unique L-theanine is responsible for the
brothy taste of the tea brew (Takeo, 1992). According to Nakagawa et al., (1977) the
best quality of tea is made from the shoots of the first and third crops plucked in
summer, which have greater contents of amino acids. Theanine is a constituent of the
color of tea brews and is abundant in high quality green tea and is a basic factor in

20
the taste of green tea. According to some papers L-theanine might be
neuroprotective and cognitive enhancing agent (Dimpfel et al., 2007; Nathan et al.,
2006) and also reduce psychological and physiological stress (Kimura et al., 2007).
Besides L-theanine, there is D-theanine (up to 3% of the total concentration of
theanine) in tea (Ekborg-Ott et al., 1997). Each free amino acid (or amide) has its own
taste as one of or in combination of sweet, bitter, salty, sour, etc. Free amino acids in
a green tea brew have been recognized as the principal contributor to the taste of
mellowness (Chen et al., 1985; Mukai et al., 1992; Wang et. al., 1988; Nakagawa et al.,
1977 & 1981).
Few volatile compounds in made tea are derived from free amino acids.
Decarboxylation and deamination of amino acids may result in products of
aldehydes (Sanderson & Graham, 1973). During manufacturing process, free amino
acids especially L-arginine and L-theanine may be converted into furan, pyrazine
and pyrrole by reaction with sugars, which contribute to the roast aroma of green tea
(Hara, 1981; Kosuge et al., 1981; Hara & Kubota, 1974; 1982a; b; 1983; Kawakami &
Yamanishi, 1983).
1.8.3 Caffeine
Caffeine (1, 3, 7-trimethylxanthine) is a major and important purine alkaloid in tea
plant and is known for its bitter taste and stimulatory effect. (Hindmarch et al., 1998;
Guanqun et al., 2003). Besides tea, at least 60 plant species are known for caffeine
contents. Some of them contain a high level of caffeine, for example, 1–2% of caffeine
was found in Coffea arabica, 1.5% in Cola acuminate, 0.03% in Theabroma cacao, > 4% in
Paullinia capana and 0.7% in Ilex paraguariensis. In tea plants most caffeine exists in tea

21
leaves, while in other plants most caffeine accumulates in their fruits (Kihlman,
1977). In tea plant, its content being 2–5%, 99% of caffeine is present in leaves
(Takeda, 1994; Ashihara, et al., 1995). Caffeine has pharmacological effects on central
nervous system, heart, peripheral and central vasculature, renal, gastrointestinal and
respiratory system (Komes et al., 2009). It is usually not accumulated in the body
over the course of time and is normally excreted within several hours of
consumption (Barone et al., 1996). Its concentration levels vary among the black and
green tea depending upon the brewing conditions like temperature, time, leaf size
and the amount of tea used. A typical cup of made tea provides 40-60 mg of
Caffeine.
Other important alkaloids in tea are theobromine (3, 7-dimethylxanthine) and
theophylline (1, 3-dimethyl-xanthine; Ashihara & Crozier, 2001). The taste of pure
caffeine is unpleasantly bitter but becomes pleasant and less bitter in combination
with catechins and theaflavins (Millin et al., 1969). Caffeine may form complex with
catechins, theaflavins and thearubigins, and alleviates astringency of these
compounds in tea brew. Caffeine contributes to briskness of black tea infusion and
hence it is positively correlated with the quality of tea (Lu et al., 1994; Arnaud, 1987).
1.8 Genetic Diversity
Genetic diversity, the measurement of variation in genes and genotypes between
and within species or populations (Cromwell et al., 1999), enables species to adapt to
changing environments and provides an insurance against unknown future needs or
conditions, thereby contributing to stability of farming systems at the local, national
and global level. According to Browning (1988) the diversity is the only defense

22
against the unknown and according to Clay (1991), genetic diversity provides a
mechanism for populations to adapt to their ever-changing environments.
Tea taxa freely interbreed giving rise to many overlapping morphological,
biochemical and physiological attributes (Banerjee, 1992). Due to the extreme
hybridization, existence of the pure archetypes of tea is doubtful (Willson & Clifford,
1992). The progress in tea breeding has been slowed down due to lack of reliable
selection criteria (Kulasegaram, 1980). Indeed a number of morpho-biochemical
markers has been utilized in past (Wachira, 1990; Singh, 1999; Ghosh-Hazra, 2001),
but they have marginally improved the efficacy of selection for desired agronomic
traits. This is mainly due to the fact that most of the morphological markers
reviewed so far, are influenced greatly by the environmental factors and hence show
a continuous variation with a high degree of plasticity. Hence, these markers cannot
be separated into discrete groups for identification (Wickremaratne, 1981). Over the
last two decades, development of the molecular biology has resulted into a handy
tool for improvement of crop plants. These markers have the ability to assist the
process of traditional breeding with several efficacies. The greatest advantages of
molecular markers are that they are free from the environmental influence and are
able to detect polymorphism at an early stage of plant life. Varieties of markers,
which have been employed for genetic improvement of tea, are reviewed below.
1.9.1 Morphological Diversity
Morphological characterization is the first step in the classification and
characterization of any crop germplasm. Quantification and classification of
diversity in germplasm collections is important both for germplasm curators and

23
plant breeders. Based on extensive collection and exploration Vavilov, (1951)
observed that some areas of the world contained much greater phenotypic
variability than others. These areas of greater variability were termed as centers of
origin and diversity.
Tea plant has been classified into different taxa by morphological characters. Barua
(1963) provided morpho-anatomical descriptions, which later were elaborated by
Bezbaruah (1971) in details. Morphological characters such as leaf architect, growth
habits and floral biology are important criteria used by tea taxonomists (Banerjee,
1992). While bush vigor, pruning weight, period of recovery from pruning time,
plant height, root mass, root-shoot ratio, dry matter production, plucking point
density and partitioning are considered as yield indicator of tea (Banerjee, 1992),
caffeine, volatile compounds (Seurei, 1996), leaf pubescence (Wight & Barua, 1954),
green leaf pigmentation (Banerjee, 1992), total catechine contents and total tannin
contents etc. (Takeda, 1994) have been used as potential determinants for tea quality.
Despite the several disadvantages, even today morphological markers are the most
adopted markers used by tea breeders globally. Quantitative morphological traits
appeared to provide a good source of knowledge for measuring phenotypic
variation when the germplasm include a large number of accessions or cultivars
(Van-Beuningen & Bush, 1997).
For evaluation of tea germplasm, the morphological characteristics of tree shape,
branchlets, shoot, leaf, corolla, stamen, pistil, capsules, seed and leaf anatomy were
measured and reported (Yu & Xu, 1999; Chen & Yu, 2001). Thirty one tea types
belonging to Chinese tea, Indian tea, Shan tea and hybrid tea, which are either

24
commercially planted or new promising in tea germplasm, were morphologically
described at four locations in 2004 at Lam Dong province by Thai Dan Vo, Heiko C.
Becker and assessed for their morphological diversity. Chen et al. (2005a) has
provided a morphological characterization of 87 accessions of the genus Camellia
from Yunnan province of China, where all the leaf and most flower characters
revealed significant differences while all fruit quantitative and most of qualitative
characteristics measured showed no significant difference. In another study for the
taxonomic position of the wild tea plant and explore relationship with two closely
related taxa, C. sinensis var. sinensis and C. sinensis var. assamica, 16 vegetative and 11
floral characters were examined by Mong-Huai et al., (2006). Cluster analysis and
nonlinear principal components analysis were used to analyze the data which
consistently separated the native wild tea plant from two other related taxa.
Conversely, pronounced admixture between C. sinensis var. sinensis and C. sinensis
var. assamica was present. The nonlinear principal components analysis showed that
the surface features of buds and ovaries are two diagnostic characters. Twenty one
tea accessions, using 13 morphological descriptors were characterized in Sri Lanka
(Piyasundara et al., 2006). This study suggested the categorization of tea accessions
into major groups based on the identification of traits contributes a lot for recording
variations.
1.9.2 Phytochemical diversity
Biochemical markers such as isozymes or storage protein provide more accurate
assessment about genetic diversity in germplasm collection (Nei, 1973). A large
number of lines can be characterized in a shorter period of time through this

25
approach. In addition the data reflect the genetic variability more precisely, as
biochemical markers are direct gene products not influenced by the environment
(Morgunov et al., 1990). Graner et al., (2003) concluded that the use of marker data
together with phenotypic evaluation is instrumental in the identification of useful
genetic resources.
Biochemical composition has been widely used for characterization of different plant
germplasm (Das et al., 2002). The accumulation of calcium oxalate crystals and it’s
quantity in paranchymatous tissue of leaf petioles (phloem index), have been
suggested to be a suitable criterion for classifying tea hybrids (Wight, 1962).
Similarly the variation in quantity and morphology of the scleroids in the leaf lamina
has also been utilized for differentiating tea taxa (Barua, 1958; Barua & Dutta, 1959).
The selection of high quality tea requires precise information about the diversity
available and also a careful study of the biochemicals which contribute towards the
quality of tea. The important biochemicals in determining tea quality include the
green leaf tea catechins, their oxidation products, Amino acids and caffeine. The
major catechins in green leaf consist of (-) epicatechin (EC), (-) epigallocatechin
(EGC), (-) epigallocatechin gallate (EGCG) and epicatechin gallate (ECG). The
oxidation products of these catechins, the theaflavins and thearubigins are
responsible for most of the plain black tea quality attributes (Roberts & Smith, 1963;
Takino et al., 1964; Brown et al., 1966; Robertson, 1992). Total catechin content could
be used to indicate the quality potential of tea, with high content being related to
high quality (Obanda & Owuor, 1997). Other studies have also shown that tannins
content, which is a measure of total catechins content, can be successfully used in the

26
determination of genetic diversity in tea (Takeda, 1994). The individual proportions
of the catechins could be important in the determination of tea quality and genetic
diversity (Owuor & McDowell, 1994). The study of the relative expression of the
individual tea catechins can also be very helpful.
In fact not fully exploited, the polyphenol oxidase activity, individual polyphenols,
amino acids and chlorophyll content are considered to be potential parameters in tea
taxonomy (Sanderson, 1964). Various taxa have also been characterized by the
presence or absence of certain phenolic substances in tea shoots (Roberts et al., 1958).
Quantitative changes in chlorophyll-a, chlorophyll-b and four carotenoids (β-
carotene, Violaxanthine, neoxanthine and lutein) have been used for characterization
of Assam, China and Cambod tea (Hazarika & Mahanta, 1984).
The dihydroxylated and trihydroxylated catechin ratios could be used to detect
genetic variation in tea with the aim to elucidate questions of diversity. Magoma et
al., (2000) has reported for the first time the utilization of dihydroxylated and
trihydroxylated catechins ratios and total catechins in the determination of the
genetic differentiation of the Kenyan tea germplasm. During this investigations the
tea clones on the basis of various catechins accumulation, were separated into 3
major and 5 minor groups according to their phylogenetic origins. It was also
suggested that the technique of identification based on the utilization of the
catechins ratio could be proved a novel and handy technique in the future in
establishing affinity of hybrids to the major taxonomic categories and identification
of genotypes for future utilization in tea breeding programs. This method of
diversity detection has major advantages like it is robust, cheap, has high
27
throughput and can be used as one of the marker of tea quality. This technique can
also be proved a useful complement to molecular techniques like RAPD, RFLP and
AFLP, where these are comparatively difficult to adopt because of the high cost and
lack of enough qualified personnel (Magoma et al., 2000). Though detection accuracy
of these markers is higher, yet accumulation of such chemicals is subjected to post-
transcriptional modification, which restricts the utility of chemical components
(Staub et al., 1982).
1.8.3 DNA based diversity
Though the DNA sequencing is a modern and useful approach for identifying
variations at a locus, which is expensive and laborious. A wide range of techniques
have, therefore, been developed in the recent past for visualizing DNA sequence
polymorphism. Jeffrey et al., (1985) introduced the term DNA fingerprinting for
describing bar code like DNA fragment patterns generated by multilocus probes
after electrophoretic separation of genomic DNA fragments. The emerging patterns
make up a unique feature of the analyzed individual and are currently considered to
be the ultimate tool for biological individualization. Recently, the terms DNA
fingerprinting is used to describe the combined use of several single locus detection
systems and is being used as versatile tools for investigating various aspects of plant
genomes. These include characterization of genetic variability, genome mapping,
genome fingerprinting, gene localization, diagnostics, population genetics, genome
evolution, molecular taxonomy and plant breeding. Molecular marker techniques
are very promising dissecting genetics basis of heterosis, varietal identification,
phylogenetic analysis and determining plant-and-environmental interaction

28
(Gostimsky et al., 2005; Dongre & Kharbikar, 2004; Rana & Bhat 2004; Lu & Myres
2002; Li & Nelson, 2001; Iqbal et al., 2001; Nelson, 1992). These markers can also be
utilized for the confirmation of true to type plants regenerated through tissue culture
techniques (Malabadi et al., 2006; Sun et al., 2005). According to DNA-marker
techniques is also useful in environmental toxicology (Liu et al., 2005). The DNA
markers are polymorphic nucleotide sequences which are dispersed over the
genome produced as a result of mutation, can be detected by the following
techniques
1. Hybridization based techniques, wherein DNA profiles are visualized by
hybridizing the restriction enzyme digested DNA to a labeled probe, a DNA
fragment of known origin or sequence. Restriction Fragment Length
Polymorphism (RFLP) of Sambrook et al., (1989) and Variable Number
Tandem Repeats (VNTR) of Rogstad (1996) and Weising et al., (1998) are the
examples of hybridization based techniques.
2. Polymerase Chain Reaction (PCR) involving in vitro amplification of
particular DNA sequences or loci, with the help of specifically or arbitrarily
chosen oligonucleotide sequences (primers) and a thermostable DNA
polymerase enzyme. The amplified fragments are separated
electrophoretically and banding patterns are detected by different methods
like staining and autoradiography. PCR is a versatile technique invented
during the mid-1980s (Saiki, et al., 1985).
The primer sequences are chosen to allow base-specific binding to the
template in reverse orientation. Techniques like RAPD (Randomly Amplified

29
Polymorphic DNA of Williams et al., 1990), AP-PCR (Arbitrarily Primed PCR
of Welsh & McClelland, 1991), DAF (DNA Amplification Fingerprinting of
Caetano-Anolles et al., 1991) and SSR (Simple Sequence Repeat of Jacob et al.,
1991) are used in PCR based characterization (Saiki et al., 1985).
3. AFLP (Amplified Fragment Length Polymorphism) (Zabeau & Vos, 1993; Vos
et al., 1995), which is based on hybridization following selective PCR (i.e. uses
both techniques).
PCR based polymorphism may be random or specific which depends upon the
primer used, the method of fragment separation and detection and the stringency of
the PCR conditions. RAPD, AP-PCR, DAF and Multiple arbitrary amplicon profiling
(MAAP) technique generate random PCR markers and use one or more synthetic
oligonucleotides as primers to target specific but unknown sites in the genome, but
they differ in primer length, amplification stringency and the procedure used to
resolve and detect the DNA patterns. AP-PCR uses primers of lengths, usually 18-24
bp long while RAPD uses primers of nucleotides long and amplification products of
both are separated on agarose gels after using ethidium bromide. In DAF usually
very short primers of 8 bp or as short as 5 bp can also be used and amplification
products are separated on polyacrylamide gel and are detected by silver staining
resulting in a 2 to 3-fold increase in the number of polymorphic and monomorphic
fragments (Bassam et al., 1991; Bassam & Bentley, 1995). In MAAP one primer allows
the amplification of several bands which correspond to several loci. Hence, using a
large number of primers these markers can potentially cover the entire genome.
Ideal DNA markers must have the following desirable properties

30
Highly polymorphic in nature
Have Co dominant inheritance (determination of homozygous and
heterozygous states of diploid organisms)
Occur frequently in genome
Have Selective neutral behavior
Easily available
Easy and fast assay
High reproducibility
Easy exchange of data between laboratories.
It is not possible to find a molecular marker which would meet all the above criteria.
But depending on the type of study to be undertaken, a marker system can be
identified that would fulfill at least a few of the above attributes (Weising, et al.,
1995). One disadvantage of the above techniques is that they are by and large;
dominant (i.e. presence against absence of the band) and heterozygous individual
cannot be differentiated from homozygous dominant individuals.
1.9.3.1 Randomly Amplified Polymorphic DNA (RAPD) Markers
The knowledge and understanding of the genetic background, diversity,
relationship and identification has positively affected the success of tea genetic
resource collection, preservation, exploitation, utilization, present and long-term tea
breeding programs. RAPD (Williams et al. 1990), which combined the advantages of
low technical input with almost unlimited marker numbers, has proven very useful
in woody plant DNA diversity, genetic relationships and identification studies, such
as those in apple (Malus) (Landry et al. 1994), spruce (Picea) (Khasa & Dancik 1996),

31
coffee (Coffea) (Orozco-Castillo et al., 1996), date palm (Phoenix dactylifera) (Sedra et
al., 1998), olive (Olea europaea) (Belaj et al., 2001), pecan (Carya illinoensis) (Conner &
Wood, 2001), and India cashew (Anacarditum occidentale) (Dhanaraj et al., 2002).
Recently, RAPD has also been used with tea plant for the investigation of genetic
relationships (Wachira et al., 1995; Lee et al., 1995), identification of parentage
(Tanaka & Yamaguchi, 1996; Tanaka et al., 2001), detection of genetic stability (Chen
et al., 1999) and integrity (Mondal & Chand, 2002), evaluation of DNA
polymorphism (Kaundun et al., 2000; Park et al., 2002), genetic linkage mapping
(Hackett et al., 2000), as well as reconstruction and assessment of the phylogeny of
tea plant and its allied species in section Thea (Chen & Yamaguchi, 2002) and genus
Camellia (Wachira, et al., 1997). These investigations are of critical importance for
various tea genetic resources and breeding programs, both for Pakistan and other tea
growing countries.
1.9.3.2 Simple Sequence Repeats (SSR) Markers
Among the recently available types of molecular markers, SSR markers are suitable
for many applications in plant genetics and breeding because of their
reproducibility, multi-allelic nature, co-dominant inheritance, relative abundance
and good genome coverage (Powell et al., 1996). SSR markers have been used for
genetic mapping (Holton et al., 2002; Yu et al., 2004a), to analyze functional diversity
(Senior et al., 1998; Leigh et al., 2003; Dreisigacker et al., 2004), and for comparative
mapping (Yu et al., 2004b; Varshney et al., 2005).
SSRs also known as microsatellites; short tandem repeats (STRs) or sequence-tagged
microsatellite sites (STMS) are tandem repeats of short nucleotide sequence motifs
32
(mono-, di-, tri-, tetra- or penta-nucleotide unites). Two different forward and
reverse primers are used to amplify the target sequences which may vary from
genotype to genotype.
SSRs are abundantly available and are relatively evenly spaced throughout
eukaryotic genomes (Tautz & Renz, 1984). The high level of polymorphism, relative
to other markers, combined with a high interspersion rate make SSRs an abundant
source of genetic markers (Gupta et al., 1999). Microsatellite markers are easy to use
and less expensive for assay studies because this procedure for analysis involves
only amplification and electrophoresis. These markers show a high degree of
polymorphism, relative to RAPDs and RFLPs, and are frequent in the genome.
Hence, microsatellite markers are therefore, excellent for studies in population
genetics (Jarne & Lagoda, 1996). Though initial cost for SSR development is high,
however, once they are established, SSR markers are not only a permanent, highly
informative resource for germplsm fingerprinting and management, but they are
also useful for mapping as has been described in many plant species (Nguyen et al.,
2004; Frelichowski Jr. et al., 2006; Zhang et al., 2005). Overall these markers have been
found most informative. They are about 6 times more informative than RAPD
markers while the latter has been proved more informative on per primer basis
(Rajora & Rahman, 2003). SSR markers are classified under co-dominant type of
marker because they can differentiate heterozygote from homozygotes. Condit &
Hubbel (1991) have first time reported microsatellites in plants, also suggesting their
abundance. The polymorphism of these repeats can be detected simply by
measuring the size of the PCR-amplified fragments (Navajas & Fenton, 2000).

33
Morgante and Olivieri have carried out identification of SSRs in gene sequences of
plants species in 1993 (Varshney et al., 2005) but at that time the amount of sequence
data available for SSR analysis was limited and hence only a few genomic SSRs were
reported. Recently, due to the increase in the amount of sequence data generated
from expressed sequence tag (EST) projects in several plant species, large numbers of
genomic SSRs have been identified (Varshney et al., 2005).
Despite the obvious advantages of microsatellite markers in terms of inferring allelic
variation, estimating gene flow and development of genetic linkage maps (Gupta &
Vershney, 2000), only a few microsatellite makers have been reported in tea
(Freeman et al., 2004; Hung et al., 2007; Zhao et al., 2007).
In tea, Ueno et al., (1999) developed and characterized 4 microsatellite markers in
Camellia japonica. Later Freeman et al., (2004) successfully isolated and characterized
13 highly polymorphic microsatellites in Camellia sinensis. Based on these results, in
this study, genetic diversity at molecular level of tea grown in Vietnam was revealed
by using SSR markers. Hung et al., (2007) also reported 11 microsatellites primer
pairs for the characterization of wild tea, cultivars and C. japonica in Taiwan and
suggested that the application of these microsatellite loci in C. sinensis may provide a
tool for understanding its demography and population structure.
In a recent research work six SSR makers were used to identify commercial Japanese
mono varietal green tea and imported green tea samples (Ujihara, et al., 2009). Two
imported well-authenticated Chinese mono varietal green tea samples were also
characterized by these markers. Among these markers only three markers identified
16 leading Japanese cultivars and one the imported cultivar (Fuyun) from China.
34
From the results the use of SSR for the identification of Japanese monovarietal green
tea and also of imported green tea made from foreign cultivars.
1.9.3.3 Restriction Fragment Length Polymorphism (RFLP) Markers
RFLPs, among the various DNA markers, were developed first and were initially
used for human genetics (Botstein et al., 1980). RFLP is based upon hybridization of a
probe to fragments of genomic DNA following digestion with restriction enzymes
(Henry, 1997). Restriction enzymes cleave the target DNA at specific sites with
sequences (four or more base pairs) recognized by the enzyme (Henry, 1997).
RFLPs have been used to investigate genetic diversity in several cultivated plants
and some wild relatives (Tanksley et al., 1989). In tea, RFLP analysis has been
successfully used for distinguishing Assam hybrids and Japanese green tea cultivars
with high and low catechin content, respectively, and in grouping Japanese green tea
at the cultivar level by using tea phenylalanine ammonia-lyase (PAL) cDNA as
probe (Matsumoto et al., 1994). Similarly polymorphism in PAL/RFLP pattern has
been used to reveal close relationship of Chinese and Korean sinensis teas apart from
Japanese sinensis tea. It was determined that Assamica teas greatly differed in PAL-
variation from Korean and Japanese sinensis teas, but resembled Chinese sinensis
tea. The present green tea cultivars in Japan were originated by crossing and
selection from a narrow genetic background. In another study Japanese green tea
cultivars and over 400 local tea trees including mountainous tea were analyzed to
determine the process of differentiation of Japanese tea trees (Matsumoto et al.,
2002), which indicated that the allelic frequencies in mountainous and local tea trees
were the same, it is thought that all these teas have the same origin.

35
Devarumath et al., (2002) proved that RFLP fragments are useful markers to evaluate
genetic integrity of micropropagated tea trees. Similarly Kaundun & Matsumoto,
(2003) have used RFLP markers for analysis of PAL, CHS2 and DFR, three key genes
involved in catechin and tannin synthesis and directly responsible for tea taste and
quality, to reveal genetic diversity in tea which separated tea genotypes into two
distinct groups according to their varietal status. Great genetic diversity was also
revealed between Korean and Japanese teas by using RFLP with PAL cDNA as a
probe (Matsumoto et al., 2004). As RFLP involves radioactivity, is laborious, time
consuming and costly, hence not preferred.
1.9.3.4 Amplified Fragment Length Polymorphism (AFLP) Markers
AFLP is useful in finding DNA markers (Zabeau & Vos, 1993; Vos et al., 1995). AFLP
analysis is based on selective PCR amplification of DNA fragments generated by
restriction enzymes, and is a combination of RFLP analysis and PCR technique.
AFLP markers are applicable to all organisms without previous sequence
information, and generally give highly informative fingerprints (Weising et al., 2005).
The relative efficiency of AFLP in detecting polymorphism is the highest as
compared to RAPD and RFLP.
The high frequency and high reproducibility of AFLPs makes this technology an
attractive tool for detecting polymorphism (Gupta et al., 1999). During AFLPs
analysis adapters are ligated to the ends of restricted fragments fallowed by
amplification with adaptor homologous primers. Primers selectivity can be increased
for reduction the number of amplification products. Polyacrylamide sequencing gels

36
are used for the amplicons separation which can detect length differences as small as
one base pair.
AFLP analysis has the capacity to detect thousands of independent loci with
minimal cost and time. AFLP markers were first used in tea by Paul et al., (1997) to
detect genetic diversity and differentiation of different Indian and Kenyan tea
clones. Most of the diversity was detected within populations, with 79% of variation
being within and 21% between Indian and Kenyan populations by using Shanon’s
index of diversity. Furthermore, a dendrogram was constructed which separated the
tea samples into China, Assam and Cambod types. Later, AFLP markers were also
employed to investigate genetic variation amongst 49 different south Indian
(Balasaravanan et al., 2003) and 27 Darjeeling tea cultivars (Misra & Sen-Mandi,
2001), and the phylogenetic relationship among tea cvs. from China (Chen et al.,
1997), South Korea (Lee et al., 2003) and Japan (Wachira et al., 2001). Hackett et al.,
(2000) constructed the first genetic linkage map for tea, from a mapping population
using AFLP and RAPD markers. This map consists of 15 linkage groups of three or
more markers, agreeing with the haploid chromosome number of tea.
1.9.3.5 Inter Simple Sequence Repeat (ISSR) Markers
ISSR, a PCR based marker technique, is yet another powerful tool of modern
molecular biology for genome analysis (Zietkiewicz et al., 1994). In these markers a
terminally anchored primer specific to a particular SSR is used to amplify the DNA
between two opposed SSRs of the same type. ISSR have also been employed for
analysis of tea genotypes from different regions of the world. They were used for
genetic diversity analysis of Twenty-five diverse Indian tea cvs. From the

37
amplification results a dendrogram was constructed using the unweighted pair
group method analysis (UPGMA) method which revealed three distinct clusters of
Cambod, Assam and China type, which concur with the known taxonomical
classification of tea (Mondal, 2002). Lai et al., (2001) have also used ISSR markers to
analyze the genetic diversity of 27 Taiwanese tea cultivars. These results suggest that
the ISSR-PCR method can be used successfully for genetic fingerprinting and
taxonomic classification of tea genotypes.
1.9.3.6 Cleaved Amplified Polymorphic Sequences (CAPS) Markers
These polymorphic sequences are generated by restriction enzyme digestion of PCR
products. Such digested fragments are compared for their differential migration
during electrophoresis (Koniecyzn & Ausubel, 1993; Jarvis et al., 1994). PCR primer
used in this process can be synthesized based on the sequence information available
in databank of genomic or cDNA sequences or cloned RAPD bands. CAPS markers
are co-dominant in nature. CAPS markers for the analysis of 52 tea samples of
diverse origin, based on the sequence information of previously characterized tea
genes, such as phenylalanine ammonia-lyase (PAL), chalcone synthase and
dihydroflavonol 4-reductase, were reported by Kaundun & Matsumoto, (2003). They
observed large differences amongst various types of tea and confirmed that the
inheritance of these markers is co-dominant in nature.
1.10 Scope and objectives of the study
The per capita consumption of tea in Pakistan is one kg/person/year. Pakistan, the
second largest importer of tea in the world, imports all of its tea from tea producing

38
countries and spends a very large amount of its national earning. The import bill in
2009-2010 was PKR 22.7 billions. The demand for tea is growing year by year in the
wake of high population growth and increasing per capita consumption. A team of
Chinese tea experts identified a prospective area of 64000 ha in
KhyberPakhtunkhwa, Pakistan for tea cultivation in 1982. Regular tea cultivation
was started in 1980s. Presently Tea plantation area is about 525 acres which produces
about 5000-6000 kg per year but the area of cultivation and production both are
much more less than its requirement and potential in Pakistan. National Tea
Research Institute (NTRI) has been established by Pakistan Agriculture Research
Council (PARC) to promote tea cultivation in the prospective areas. Tea plants of
different varieties from different countries have been imported and planted here.
Much of the research work has been done on agronomic aspects and the genotypes
have been evaluated for a limited number of morphological traits. However no
attempt has been made, to screen/evaluate the genotypes and prepare a data base
on the basis of phytochemistry and molecular markers. Little work on Genetics and
Molecular Biology of tea has been done in Pakistan so far. The present study was
undertaken with the following objectives.
1- To characterize and compare the existing tea genotypes in Pakistan for
morphological characters.
2- To assess and investigate the genetic diversity among of tea genotypes of
Pakistan for Phytochemical contents.
3- To study the Genetic diversity of tea genotypes through molecular markers
(RAPD and SSR).

39
4- To study the phylogenetic relationship among the genotypes
5- To develop molecular marker assisted tea breeding (selection) techniques.
6- To identify genotypes of high yield potential for utilization in breeding
programs.
40
Chapter 2
MATERIALS AND METHODS
The research work for this project was carried out at the Department of Genetics
Hazara University from 2006-2010. Lab facilities of Nuclear Institute for Food and
Agriculture Tarnab, Peshawar were used for phytochemical analyses. Plant
materials were obtained from National Tea Research Institute Shinkiari (NTRI) and
Uniliver Tea Station Icherian (UTSI). Both the stations are located in Pakkhal Plateau
of District Mansehra, Pakistan.
2.1 Plant material
The plant materials used in different experiments included 13 genotypes (table 2.1)
used for commercial cultivation; out of which 6 genotypes were Promising Lines, 4
were introduced Chinese varieties, 2 unidentified land races and a single Advance Line.
All these collections are available under the same tag at NTRI and UTSI. In addition
to these 13 genotypes 130 Selections (variants selected for different traits) were also
analyzed for DNA based elaboration. In broad terms the tea genotypes were studied
in three ways i.e.
a) phenotypic analyses through quantitative and qualitative traits
b) phytochemical analysis of selected genotypes and
c) molecular characterization of the genotypes with RAPD and SSR primers.
2.2. Sampling procedures for morphological studies
Five mature plants of each genotype within the range of 10 and 15 years of age were
randomly selected for sampling of quantitative and qualitative traits. All the traits

41
were chosen with respect to variation among taxa and verified from the literature,
mostly by Anonymous (1997) and Banerjee (1987).
Table 2.1 Basic information regarding the tea genotypes used for morphological
characterization
S. No Identity/
acc. No.
Introduced
through
Collect-
ed from
Botanical origin Present status
1. Qimen Seed NTRI C. sinensis var. sinensis Chinese variety
2. Roupi Seed NTRI C. sinensis var. sinensis Chinese variety
3. Chauy Seed NTRI C. sinensis var. sinensis Chinese variety
4. CL-01-05 Cutting NTRI C. sinensis var. sinensis Chinese variety
5. JP-01-05 Seed/cutting NTRI Unknown Promising Lines
6. T-05-10 Seed/cutting NTRI Unknown Promising Lines
7. SL-01-05 Seed NTRI C. sinensis var. assamica Promising Lines
8. IN-01-07 Seed NTRI C. sinensis var. assamica Promising Lines
9. ICH-04 Seed UTSI Unknown Advance Line
10. ICH-05 Seed UTSI Unknown Land race
11. ICH-07 Seed UTSI Unknown Promising Lines
12. ICH-08 Cutting UTSI Unknown Land race
13. ICH-09 Cutting UTSI Unknown Promising Lines

42
2.2.1. Quantitative trait analysis
As explained earlier 5 plants of each cultivar were randomly selected for sampling of
quantitative and qualitative traits. The sampling was done with 5 replicates from
each trait e. g, for recording leaves 5 leaves per plant and five plants per genotype
were considered. A total sum of 18 traits, including 10 leaf traits, 7 shoot traits and a
single seed parameter were analyzed.
The leaf parameters included leaf length, leaf breadth, length/breadth ratio, leaf
area, petiole length, number of vein pairs per leaf, fresh leaf weight, dry leaf weight,
fresh/dry leaf weight ratio and leaf angle. For leaf parameters the 3rd and 4th leaf of
fresh plucking shoots were analyzed. Summary of the criteria for data collection on
leaf traits and their way of sampling is provided in Annex A.
For quantitative analysis of shoot parameters, five fresh and healthy plucking shoots,
from bud to the base of 4th leaf, 5 shoots of each plant were collected from five plants
per genotype during the months of March and April 2008. Seven parameters of
plucking shoots i.e. shoot length, internodes length between 3rd and 4th leaf, fresh
shoot weight, dry shoot weight, fresh-to-dry shoot weight ratio and bud length were
analyzed. The seed parameter taken for quantitative trait analysis was 10 seed
weight per plant. Details regarding selection criteria and sampling are provided as
Annex B.
2.2.2. Qualitative trait analysis
The same plants selected for sampling of quantitative traits were also analyzed for
qualitative characters of leaf and flowers. The qualitative characters taken into
consideration were; leaf shape, leaf pose, leaf color, leaf serrulation, leaf base shape,

43
flower color and number of petals per flower. The 4th leaf in descending order from
the top was taken for sampling. Data was recorded five plants per genotype. The
parameters selected for sampling and the methods of data collection are summarized
as Annex D.
2.2.3. Statistical analysis Data recorded for various traits were subjected to means of observed values and
standard deviation using MstateC Software and the genotypic correlation was
analyzed through quantitative trait analysis by using SPSS Ver-16. Based upon the
dissimilarity matrix of Euclidean distances coefficient of the quantitative
morphological data (table 2.2 and 2.3), different accessions were grouped by
hierarchical cluster analysis using UPGMA (Unweighted Pair Group Method with
Arithmetic Average). The data were thus standardized to construct dendrogram for
elaborating phylogenetic affinity of the genotypes. Computational analysis of the
data and generation of dendrogram were done with the help of MVSP-Ver. 3.13r.
2.3 Phytochemical Elaboration of Tea Genotypes 2.3.1 Plant Material Total polyphenols (TP), amino acids (AA), Caffeine (C) and water extract (WE) were
determined for revealing the phytochemical profile of the genotypes available for
cultivation/improvement of tea crop, in Pakistan (List of the genotypes is available
in table 2.1) For phytochemical analysis 500g of fresh plucking shoots of tea (the tea
flush, typically consisting of a terminal bud and adjacent 3 young leaves), were
excised from the first harvest of 3 bushes of each genotype. After plucking the shoots
were immediately dried in oven at 100 0C for 30 minutes. The dried tea flush were

44
individually sealed in polythene bags and kept at 4 0C till further analysis, after a
week in the Phytochemistry Labs of Nuclear Institute for Food and Agriculture
Peshawar. The samples were then ground to powder and kept in desiccators for
moisture removal.
2.3.2 Tea infusion/ stock solutions
For phytochemical analysis stock solutions of each sample were prepared by
pouring 1.5g of powdered tea sample into 200-ml freshly boiled distilled water in a
boiling water bath for 40 minute with repeatedly shaking after every 10min interval.
The tea infusion was filtrated using double-layered filter paper. The stock solution
was cooled down and the volume of the filtrate was adjusted to 250 ml with distilled
water. The stock solutions were kept at 4 0C, throughout the experiments, for
avoiding the chemical changes. Each experiment was repeated three times for
avoiding errors. Means of the results for each sample were computed for precision
and understanding the findings.
2.3.3 Extraction of water soluble compounds
Sterilized clean evaporating dishes (China dish of 60 ml) were used for the extraction
of water soluble compounds. Each dish was weighed separately and 50 ml of the
stock solution (tea infusion) was added to it. The tea infusion was evaporated
completely by heating the dish on a boiling water bath leaving water soluble
substances of tea. The dish was then kept in oven at 100 0C for three to four hours till
getting the constant weight of the dish. The dish was kept in desiccators for an hour

45
and weighed again for calculating the quantity of the dry matter. The water extract
was calculated according to the following formula:
Water extract (on the basis of %dry weight) = 𝑀1 ×100
50 ×
100
Mm
Where M1 was the water extract M was the total dry weight of tea sample and m was the dry ratio of the tea sample.
2.3.4 Polyphenol analysis
For determining the polyphenol contents in tea the following two solutions were
freshly prepared for total polyphenol determination
1. Reaction Solution [0.1% FeSO4 and 0.5% Potassium Sodium tartrate
[C14H4O6KNa.4H2O]
2. Phosphate buffer (0.07 M Na2HPO4, 0.07 M KH2PO4, pH 7.5)
For polyphenol determination 1.00ml of the tea infusion, 4 ml distilled water and 5
ml reaction solution [0.1% FeSO4 and 0.5% Potassium Sodium tartrate
[C14H4O6KNa.4H2O] of each sample were taken in a 25 ml volumetric flask. Final volume
of the reaction was made up to 25ml by adding phosphate buffer of pH 7.5. The
Optical Density of each sample was taken at 540 nm (OD540) using a 10-mm color
comparison cell with blank reagents in a UV-2250PC Spectrophotometer (Shimadzu
Corporation, Tokyo). The polyphenol content were calculated on the dry weight
basis according to the following formula.
Polyphenol percentage = OD540 × 3.91 × L1 × 100 1000 L2 Mm Where L1 was the total volume of the tea infusion (ml), L2 was the volume of tea infusion used in
reaction (ml), M was the dry weight of tea sample (g), m was the dry ratio of polyphenol in tea sample
and 3.91 corresponded that 1 OD540 using the 10 mm color comparison cell was equal to 3.914 mg tea
polyphenols in the tea infusion.

46
2.3.5 Amino Acids analysis 2.3.5.1 Standard curve preparation
For the determination of amino acids 2.0% ninhydrin and phosphate buffer (0.07 M
Na2HPO4, 0.07 M KH2PO4, pH 8.0) were freshly prepared. Solution for determination
of standard curve of amino acid was prepared by dissolving 10 mg glutamic acid in
50 ml (0.2 mg/ml) distilled water. The amino acid solutions of different
concentrations were prepared by a serial dilution from the above standard solution
(20 mg/1ml). 1 ml standard solution, 0.5 ml phosphate buffer and 0.5 ml 2%
ninhydrin solutions were taken in a 25 ml volumetric flask and boiled for 15 min.
The volume was fixed to 25 ml with water after cooling down. Using a 5 mm color
comparison cell the optical density of all standards was measured at 570 nm
wavelength with blank reagents as control in a UV-2250PC Spectrophotometer. A
curve was obtained between Amino acids concentration vs. absorbance.
2.3.5.2 Amino acids determination
1 ml of tea infusion was taken together with 0.5 ml phosphate buffer and 0.5 ml 2%
ninhydrin solution in a 25 ml flask and boiled for 15 min on a boiling water bath.
After cooling at room temperature distilled water was added to make the volume to
25 ml. Optical density was measured at wavelength of 570 nm using a 5mm cell in a
UV-2250PC Spectrophotometer. Amino acid content, on dry weight basis, of each
sample was calculated from standard curve using the following formula.
Amino acid percentage = CL1/1000L2 × 100 Mm
Where C is the amino acid concentration in tea samples derived from the standard curve of Glutamic acid as mg/OD570.

47
2.3.6 Caffeine contents analysis
The working solutions 50% lead acetate basic [Pb (CH3COO)2·Pb(OH)2], 0.1 N HC1
and 9N H2SO4 were prepared for Caffeine analysis in tea. For analyzing caffeine
contents 20 ml of the stock solution was taken in a 250 ml flask. The 2.00 ml of lead
acetate solution and 10 ml of 0.1 N HCl were added to the flask. Volume of the flask
was made 250 ml with distilled water. The reaction was mixed, kept for 20 min at
room temperature and then filtered. From the reaction solution 50 ml was taken in a
100 ml flask to which 0.2 ml of 9N H2SO4 was added and its volume was made 100
ml with distilled water. This solution was put still on table for 20 min and filtered
again. The optical density of each sample was measured at 274 nm with the help of
10mm cell with blank reagents as control in a UV-2250PC Spectrophotometer.
Calculations of the caffeine content were made on dry weight basis with the help of
the following formula.
Caffeine percentage = (CL1 × 250 × 100)/(1000 × 20 × 50) × 100 Mm
Where C volume (Caf. mg/ml) compared with Caffeine standard curve obtained by the same
method as mentioned above using pure caffeine (Purchased from Merck Germany) as
standard component.
2.3.7 Statistical Analysis The basic data were computed for means and standard deviation with the help of
SPSS Version 16. The data were standardized to construct dendrogram for
elaborating affinity among tea genotypes. Different tea accessions were grouped by
hierarchical cluster analysis with the help of UPGMA, based on the dissimilarity
matrix of Euclidean distances coefficient. Matrix data was used for Principal

48
Coordinate Analysis (PCoA) and for construction of dendrogram of tea genotypes
with the help of MVSP (Ver. 3.13r).
2.4 Molecular characterization
130 variants of 13 genotypes of tea (table 2.1), available in NTRI Shinkiari and UTRI
Icherian, were subjected to DNA analysis. Two marker assisted analyses viz. RAPD
and SSR markers were used for molecular characterization of all the genotypes.
For RAPD analysis the fresh young shoots with two leaves and a bud were
randomly excised from each plant in 1.5 ml Eppendorf tubes and immediately
frozen in liquid nitrogen till DNA extraction. Initially a DNA isolation protocol with
SDS (Chen et al., 1997) was applied. This method gave good enough results for DNA
isolation but a gel like material consistently observed with the extracted DNA made
the DNA unfit for PCR analysis. Another attempt was made with CTAB protocol
(Doyle & Doyle, 1987) with little modifications. The DNA was obtained without jell
like material but the color of the DNA appeared green which may have been due to
the presence of chlorophyll or other leaf material. The DNA samples obtained from
CTAB method were then further treated for the color and impurities removal
successfully. The DNA extracted in this way was of high purity and gave good
quality bands after running on 1% agarose gel.
2.4.1 RAPD Primers
Forty two RAPD Primers obtained from Gene link, USA, were tested for molecular
characterization. Among the tested primers 20 showed polymorphism upon testing
and were selected for PCR analysis. Details of the primers are given in table 2.2. The

49
general procedures used in our research group were those described by Begum et al.,
2010; Gul et al., 2007; Khan et al., 2010; Muhammad et al., 2010; Ullah et al., 2010.
2.4.2 PCR Analysis
PCR reactions were carried out in a 25 microlitre reaction mix containing
approximately 20 ng template DNA, 2.5 picomoles each of dATP, dCTP, dGTP and
dTTP (Promega, Madison, Wis.), 5 picomoles of a RAPD primer, 0.5 units of Taq
polymerase enzyme (Farmentas) and buffer (10mMTris-HCl, pH 8.8 at 25 0C, 1.5mM
MgCl2, 50 mM KCl). The PCR amplifications using 20 decamer primers (obtained
from Gene Link, Inc, NY 1052, USA) were carried out using Creacon Thermal Cycler
(model 00005.400) programmed for an initial denaturation step at 94 0C of 4 min
followed by 40 cycles of 60 s denaturation at 94 0C, 60 s primer annealing at 32 0C
and for 120 s extension at 72 0C. Final extension step was added at 72 0C for 7
minutes followed by holding at 4 0C. A 100 bp DNA ladder was used to estimate the
size of DNA fragments amplified. During PCR formulation for RAPD analysis
annealing temperatures from 280C to 360C were tried and finally 32 0C was selected
on the basis of best amplification results. The amplification products were separated
on 2% (w/v) Agarose gel run in 1X TBE buffer and stained with ethidium bromide.
The gels were visualized and documented with UV light using “Uvitech” gel
documentation system. All the PCR reactions were run in duplicate, and only
reproducible and clear bands were scored.
For analyzing PCR generated data binary (1-0) data matrices were worked out by
scoring the presence (1) or absence (0) of each polymorphic DNA fragments
amplified and assembled in a data matrix. UPGMA of Nei & Li (1979) was used for

50
the estimation of genetic distances among the variants and dendrogram was
constructed using with the help of POPGENE 3.2 (Yeh et al., 1999).
Table 2.2. Details of RAPD primers used for primer assisted characterization of tea
S. No Oligo name Sequence (5’-3’) Mol. Wt (nmols) %GC
1 GLA-07 GAAACGGGTG 3,117 60
2 GLA-10 GTGATCGCAG 3,068 60
3 GLA-11 CAATCGCCGT 2,988 60
4 GLA-14 TCTGTGCTGG 3,050 60
5 GLA-18 AGGTGACCGT 3,068 60
6 GLA-20 GTTGCGATCC 3,040 60
7 GLB-06 TGCTCTGCCC 2,955 70
8 GLB-07 GGTGACGCAG 3,093 70
9 GLB-09 TGGGGGACTC 3,084 70
10 GLB-14 TCCGCTCTGG 2,995 70
11 GLB-15 GGAGGGTGTT 2,998 60
12 GLB-17 AGGGAACGAG 3,126 60
13 GLA-13 CAGCACCCAC 2,942 70
14 GLA-17 GACCGCTTGT 3,019 60
15 GLB-12 CCGGTACGCA 2,988 60
16 GLB-06 TGCTCTGCCC 2,955 70
17 GLB-20 GGACCCTTAC 2,988 60
18 GLC-11 AAAGCTGCGG 3,013 60
19 GLC-15 GACGGATCAG 3,077 70
20 GLC-05 GATGACCGCC 3,013 70

51
2.4.3 SSR’s Analysis
For the SSR analysis 15 SSR primers, isolated and characterized for tea
polymorphism study by Freeman et al., (2004) were selected and were designed by e-
oligos (Gene Link, NY 10532-1530 USA) for revealing polymorphism in our material.
Details of these SSRs are presented in Appendix II. For SSR analysis, the DNA of 103
tea genotypes/variants, already analyzed through RAPD, was isolated. PCR
analyses were carried out with 25.0 μl PCR mixture; containing 1 X buffer, 2.5 mM
MgCl2, 0.2 mM dNTPs, 0.05 μM fPrimer, 0.05 μM rPrimer, 20 ng templates DNA and
1 U Taq polymerase. SSR amplification reactions were carried out using Creacon
Thermal Cycler (model 00005.400) programmed for an initial pre-denaturation step
at 94 0C of 4 min followed by 35 cycles of 60 s denaturation at 94 0C, 60 s primer
annealing at 55 0C and for 120 s extension at 72 0C. Final extension step was added at
72 0C for 10 minutes followed by holding at 4 0C. A 100 bp DNA ladder was used to
estimate the size of DNA fragments amplified.
The SSR amplification products were separated on 2.5% (w/v) Agarose gel run in 1X
TBE buffer and stained with ethidium bromide. The gels were visualized and
documented with UV light using “Uvitech” gel documentation system. All PCR
reactions were run in duplicate, and only reproducible and clear bands were scored.
2.4.4 Data analysis
For data analysis, binary data matrices were generated from gel photographs by
scoring presence (1) or absence (0) of each polymorphic DNA fragments amplified
and assembled in a bi-variat data matrix. Unweighted Pair Group method using

52
Arithmetic Means (UPGMA) was used for the estimation of genetic distances (GD)
among all the possible combinations (Nei & Li, 1979) using the following formula
GD = 1 – dxy /dx + dy – dxy
Where dx represents the total number of bands in x, dy denotes the number of total bands in y and dxy shows the number of common bands both in x and y
The bi-variat data matrix was employed for computing dendrogram through
POPGENE 3.2 of Yeh et al. (1999) in accordance with our previous findings
appeared as Akbar et al., 2010; Bibi et al., 2010; Gul et al., 2007; Khan et al., 2010.

53
Table 2.3 Characteristics of SSR primer pairs used for SSR-assisted characterization
S. No. Primer Name Sequence (5` – 3`) Length
(bp)
MW
(amu)
Tm
(0C)
Qtty
(nmols)
GC %
1. Ca01-F
Ca01-R
CCCAGCAAAACCCCAGCATG
CTTCCGAACTGCAGGTTGTGG
20
21
6,025
6,453
59.5
59.8
48.9
50.7
60
60
2. Ca02-F
Ca02-R
TCCAGTCCCATGGACAGGAG
CATAGCACACACCTCCACAGC
20
21
6,127
6,289
59.5
59.8
50.7
49.3
60
60
3. Ca03-F
Ca03-R
CAAAGCTGCACTTAATTGCGC
CTCGGCAAAGGTTCACCAGG
21
20
6,390
6,127
55.9
59.5
48.2
49.9
50
60
4. Ca04-F
Ca04-R
CTCATCACTCTTCTCCCTAGC
CAGCAAAAAGAGATGAACAA
21
20
6,228
6,185
57.8
49.3
55.7
41.7
55
35
5. Ca05-F
Ca05-R
TGTTCATCTCTTTTTGCTG
GACAGTAAAAAGAGATGAAC
19
20
5,742
6,216
48.4
49.3
62.2
40.8
37
35
6. Ca06-F
Ca06-R
CATCTCTTTTTACTGTCTTTC
GTTTCAACGACAATGGGCTC
21
20
6,297
6,117
50.0
55.4
55.5
50.2
33
50
7. Ca07-F
Ca07-R
TTCAATTACCCGCCAATCTC
CCAATCTGGGAATTGAAGAAG
20
21
5,972
6,503
53.4
53.9
54.9
40.7
45
43
8. Ca08-F
Ca08-R
GCACCCCCCATGCTTGGCAG
GCCTGTCCGATCGACCTGCG
20
20
6,039
6,070
63.6
63.6
51.9
52.2
70
70
9. Ca09-F
Ca09-R
CATGTAGAATGCTCAAATGC
ACCTGAAAACGATCCTGACAT
20
21
6,125
6,383
51.3
53.9
46.3
46.1
40
43
10. Ca10-F
Ca10-R
CAACAGCTCAGATAGAGCCA
CGCGACGGCCCGGGCTGGTAT
22
19
6,722
5,846
60.0
63.5
41.0
54.8
54.5
74
11. Ca11-F
Ca11-R
GAAGGTGGGAAAGGACAACG
AGATCCCAGTGAACCCTCCG
20
20
6,289
6,047
57.5
59.5
43.8
48.5
55
60
12. Ca12-F
Ca12-R
GAATCAGGACATTATAGGAAT
TAAGGCCGAATGTTGTCTTTTT
24
20
7,433
6,145
51.9
53.4
41.5
52.4
29
45
13. Ca13-F
Ca13-R
CCTCTGGTGGTCCTACACCT
AAAGCCTTGATGCCTTTCG
20
19
6,020
5,779
59.5
52.7
57.9
51.7
60
47
14. Ca14-F
Ca14-R
GGTGTGGTGTTTTGAAGAAA
TGTTAAGCCGCTTCAATGC
20
19
6,267
5,779
51.3
52.7
44.4
55.4
40
47
15. Ca15-F
Ca15-R
GCATCATTCCACCACTCACC
GTCATCAAACCAGTGGCTCA
20
20
5,942
6,086
57.5
55.4
54.9
47.0
45
50
54
Chapter 3
RESULTS AND DISCUSSION
In the recent past commercial tea plantation has been started on vast areas included
in Lesser Himalaya and eastern Hindu Kush regions falling in Azad Kashmir,
Hazara and Malakand Divisions of Pakistan. The tea cultivation areas can broadly be
traced across 35 0N and 72-750 E on the globe. Annual rainfall ranges from 1000-1200
mm in the areas lying at an altitude upto 1400m and 1200-1400mm at high lying
areas (Nathanial, 1992). Tea cultivation is generally practiced below 1500m (Ahmad,
2009; Rashid et al., 1993) where the annual rainfall is more than 1000mm and means
average temperature ≥ 10 °C during 8 months of the year. The studies were
conducted on tea collections cultivated in the Pakkhal Plateau of District Mansehra.
Pakkhal is located at an altitude of 1000m between 34° 20 -- 34° 30 N and 73° 5 -- 73°
20 E. Findings of the research endeavor are sorted out in three sections i.e.
Phenotypic elaboration, Phytochemical elaboration and Molecular characterization
which are presented below:
3.1 Phenotypic trait analysis
Both quantitative and qualitative traits were analyzed for phenotypic elaboration.
The results obtained for quantitative and qualitative trait analyses are separately
presented as:
3.1.1 Quantitative trait analysis
The quantitative trait analyses of tea genotypes cultivated in Pakistan were based
upon the quantitative data collected for 10 leaf, 7 plucking shoot and 1 seed

55
parameter. Summary of the data collected for quantitative trait analyses are
presented in tables 3.1 and 3.2, which are described in the following headings.
3.1.1.1 Leaf characteristics
Leaf length
Mean values for leaf length varied from 6.2 to 11.6cm. The genotypes had a tendency
to segregate into two leaf types i.e. long and short leaved. The long leaved genotypes
were two in number viz. Sl-01-05 and In-01-05, with the mean values of 11.6 and
11.5cm, respectively. LSD values provided in table 3.2 shows that leaf length in these
two genotypes had no significant differences. The short leaved genotypes were 11 in
number, among which, the relatively longer leaves were recorded for the genotypes
Cl-01-05, JP-01-05 and Roupi which had the mean values of 8.5, 8.1 and 7.9,
respectively. In this group the smaller leaves were recorded for the genotypes Ich-8,
Ich-9 and Ich-7, which had mean values of 6.2, 6.5 and 7.0 cm, respectively, with no
significant differences. Highly significant positive genotypic correlation (p<0.05) was
recorded for leaf length with leaf breadth (rG = 0.94) as it is clear from data in Table
3.4.
Leaf Breadth
The Leaf breadth ranged from 2.21 to 5.18cm. Means and LSD values showed
significant differences among the genotypes studied. As expected the broad leaved
genotypes had significantly higher values of Leaf breadth as compared to narrow
leaved genotypes. IN-01-07 and SL-01-05 genotypes had maximum leaf breadth of
5.1 and 4.4cm, respectively, followed by Roupi, CL-01-05 and Qimen with leaf

56
breadth of 3.1, 3.04 and 2.9cm, respectively. Genotypic correlation was highly
significant (p<0.05) for leaf breadth with leaf area, fresh leaf weight and fresh shoot
weight rG = 0.9, rG = 0.8 and rG = 0.8, respectively (table3.4).
Leaf length to Breadth ratio
The data recorded for leaf length to breadth ratio ranged from 2.25 to 3.04cm.
Differences were found significant at 5% probability level. The maximum value was
observed for Ich-05 (3.04 cm) followed by Chuye (2.93 cm), T-05-10 (2.88 cm) and
Japanese (2.80 cm). Minimum values were recorded for IN-01-07 (2.25) and Roupi
(2.43). Highly significant positive genotypic correlation (p<0.05) was observed for
length to breadth ratio with fresh to dry leaf weight (F/D) as rG = 0.26.
Leaf Area
Data obtained regarding the leaf area which ranged from 9.16 cm2 to 65.50 cm2
revealed a wide genetic variation among genotypes. The highest value for leaf area
was observed for IN-01-07 genotypes (58.58 cm2) followed by SL-01-05 genotypes
(47.84 cm2) while minimum leaf area was observed for Ich-08 (14.02 cm2) followed by
Chuye (14.77 cm2). The genotypic correlation for Leaf area was recorded as 0.90 with
fresh shoot weight, which was significantly high, followed by 0.77, 0.59, 0.58, 0.54
and 0.49 genotypic correlation, respectively, with fresh leaf weight, dry shoot
weight, dry leaf weight, ten seed weight and petiole length.
Petiole Length
Petiole Length ranged from 0.53 and 0.34 cm with a difference of 0.19 cm. Maximum
petiole length was observed for SL-01-05genotypes (0.536 cm) following Ich-08 (0.47
57
cm) and JP-01-05 (0.47 cm). The lowest value of petiole length was observed for Ich-
05 (0.35) and Ich-07 (0.34). Petiole Length was positively correlated with dry leaf
weight with a correlation value of 0.51. It was also significantly correlated with fresh
shoot weight and fresh leaf weight with rG = 0.49 and rG = 0.45, respectively. Petiole
length had negative correlation with bud length (rG = - 0.01), branch angle (rG = -
0.05), shoot length (rG = - 0.19) and F/D leaf weight (rG = - 0.37).
Fresh and Dry Leaf Weight
The tea genotypes used during present study showed significant differences for
fresh and dry leaf weight (mean values ranging from 0.23 to 1.0 g and from 0.07 to
0.43 g for fresh and dry leaf weight, respectively). Maximum values were observed
in SL-01-05 and IN-01-07 (characterized by broad leaves) genotypes for both fresh
and dry leaf weight. Both these genotypes were significantly different from all other
genotypes while differences among other genotypes were significant at lower level
of probability. A very strong negative genotypic correlation (rG = - 0.73) was
observed between fresh and dry leaf weight.
Fresh and dry leaf weight ratio
Significant differences (p<0.05) were exhibited among the tea genotypes for weight
ratio of fresh and dry leaf, which ranged from 2.77 to 3.59 g (Table 3.1). Maximum
mean values of 3.59, 3.54, 3.53 and 3.53 were observed for Roupi, Chuye, Ich-09 and
CL-01-05 genotypes respectively. Differences within this set of genotypes were not
significant while showing significant differences as a group in comparison to other
genotypes. Broad leaved SL-01-05 and IN-01-07 genotypes exhibited the lowest fresh

58
to dry leaf weight ratio as 2.31 and 2.48, respectively, making them significant
among all the available genotypes. F/D leaf weight ratio had significant positive
correlation with F/D shoot weight (rG = 0.60, p<0.05). However, F/D leaf weight
ratio had negative correlation with ten seed weight (rG = 0.40, p<0.05), fresh shoot
weight (rG = 0.38, p<0.05), leaf angle (rG = 0.37, p<0.05), dry shoot weight (rG = 0.34,
p<0.05), leaf vein pair (rG = 0.29, p<0.05), branch angle (rG = 0.25, p<0.05), and
internodes distance (rG = 0.11, p<0.05).
Leaf Vein Pairs
The tea genotypes differed significantly (p<0.05) for leaf vein pair number which
ranged from 10.24 to 15.32 (Table 3.1). Maximum number of vein pairs was recorded
in broad leaved genotypes i.e. SL-01-05 and IN-01-07 with vein pair number of 15.32
and 14.16, respectively. A promising narrow leaved genotype “CL-01-05” was very
closely related to the above mentioned genotypes having 13.64 number of leaf vein
pairs. Minimum values were observed for narrow leaved genotypes especially
collected from same station of UTSI (Table 3.1). The data obtained during study
showed significant positive genetic correlation (p<0.05) for number of leaf vein pairs
with fresh shoot weight (rG = 0.59) and dry shoot weight (rG = 0.60). A negative
significant genetic correlation was also observed for number of leaf vein pairs with
branch angle (rG = -0.03), fresh to dry shoot weight ratio (rG = -0.35) and bud length
(rG = -0.47) at 0.05 probability level (table 3.4).

59
Leaf Angle
Data pertaining to leaf angle of tea genotypes under study showed significant
differences and ranged from 26.20 to 38.80 (table 3.1). As expected, the broad leaved
SL-01-05 and IN-01-07 genotypes showed the highest leaf angle values as compared
to small leaved genotypes. Significant positive genetic correlation of medium level
(p<0.05) was observed for leaf angle with branch angle (rG = 0.33), dry shoot weight
(rG = 0.29), fresh shoot weight (rG = 0.27) and ten seed weight (rG = 0.26) (table 3.4).
Leaf angle also showed significant negative genotypic correlation with bud length
(rG = -0.002), internodes length (rG = -0.06), shoot length (rG = -0.12) and f/d shoot
weight (rG = -0.261).
3.1.1.2 Shoot and Seed characteristics
Flush shoot is the economically important part of tea plant which is harvested for
manufacturing tea. Hence the characteristics of flush shoot could affect the
productivity and quality of tea. Large variation was observed (table 3.1 and table 3.3)
for shoot characters studied during present work. The quantitative traits such as the
shoot angle to stem, shoot length, shoot weight (both fresh and dry), bud length and
internodes distance of observed tea showed that maximum branch angle was
observed for SL-01-05 tea accessions (440) followed by Ich-08 (420), Ich-09 (41.60) and
Ich-07 (41.40) while the minimum values were observed for CL-01-05 (30.20), IN-01-
07 (33.20) and Roupi tea accessions (33.40). Similarly data obtained for all other
characters also revealed significant differences among all the tea genotypes. Ten seed
weight was measured for investigated tea accessions which showed average values
for most of the genotypes except SL-01-05, and Qi-Men genotypes which had
60
maximum seed weights 18.96 and 15.88g, respectively. Lowest values were observed
for Chuye and JP-01-05 genotypes as 9.88 and 11.58 g respectively. This parameter
analysis was not performed for IN-01-07 genotypes due to non availability of seeds.
Genotypic correlation was also studied for all characters which showed significant
differentiation (table 3.4).
Quantitative data for plucking shoots together with leaf quantitative data were
analyzed by hierarchical cluster analysis using Average Linkage Euclidean Distances
and a dendrogram (fig. 3.1) was constructed based on dissimilarity coefficient.
3.1.1.3 Cluster Analysis
The quantitative morphological characters were standardized for dendrogram
analysis. On the basis of quantitative morphological diversity all the investigated tea
genotypes segregated into two main clusters (A and B) in the dendrogram (fig. 3.1).
Cluster A included 10 genotypes viz; Qimen, Roupi, CL-01-05, Chuye, JP-01-05 and
T-05-10 genotypes (collected from NTRI Shinkiari) while Ich-05, Ich-07, Ich-08 and
Ich-09 (collected from UTSI Icherian Mansehra). The genotypes in cluster A could be
further subdivided into three sub clusters A1, A2 and A3. Sub cluster A1 comprised
Qimen, Roupi and CL-01-05 genotypes. Sub cluster A2 included six genotypes
(Chuye, T-05-10, Ich-05, Ich-07, Ich-08 and Ich-09). JP-01-05 genotype was an out-
lying type from the rest of the genotypes in cluster A. Similarly the totally different
genotypes known as IN-01-07 and SL-01-05 genotypes (having long and broad
leaves) were grouped together in Cluster B, which were significantly different from
all other genotypes, however genetic diversity between the two genotypes was
found to be very low.

61
3.1.2 Qualitative trait analysis
Leaf morphology is a traditionally important criterion for identification of tea taxa.
For qualitative trait analysis of investigated tea genotypes, ten characters i.e. plant
type, shoot color, seed shape, leaf shape, leaf pose, leaf color, leaf serrulation, leaf
base shape, flower color and number of petals in flower was initially selected. Due to
non significant variation, analyses of some characters (i.e. plant type, shoot color,
seed shape and flower color) were not considered and were discarded from final
analysis. Data on the leaf shape divided the 12 tea genotypes into 4 groups: ovate
leaf (T-05-10 and JP-01-05 genotypes); oblong leaf (IN-01-07 genotypes); elliptic leaf
(most of the china types collected both from NTRI and UTSI plantations) and
lanceolate leaf (SL-01-05 genotype). Purplish leaves were found only in some Qi-
Men and Roupi genotypes while rest of the China genotypes had green leaves, SL-
01-05 had light green and IN-01-07 genotypes had dark green leaves. Eight of the
genotypes had semi-erect while Ind-01-Ind-08 (IN-01-07 genotype) had horizontal
and SL-01-05, CL-01-05 and Ich-08 had semi horizontal leaf pose.
3.1.2.1 Cluster Analysis
Qualitative characters including leaf shape, leaf pose, leaf color, leaf serrulation, leaf
base shape and number of petals in flower (table 2.4) were subjected to cluster
analysis on the basis of average linkage Euclidean distances. The data were first
standardized for cluster analysis using statistical software MVSP ver. 3.13. The
phenogram constructed (fig. 3.2), divided the investigated tea genotypes into three
main clusters (A, B and C). Cluster A comprised of 7 samples including Qi-Men,
Roupi, T-05-10, Ich-08, Ich-09, Ich-05 and Ich-07; all belonging to narrow leaved

62
genotypes. Cluster A was subdivided into two subgroups A1 and A2. Subgroup A1
included Qi-Men and Roupi genotypes which were predominantly china type teas
collected from same location in NTRI Shinkiari Mansehra. Subgroup A2 comprised
three genotypes (Ich-09, Ich-05 and Ich-07) collected from UTSI Icherian Mansehra.
Cluster B included JP-01-05 and Chuye genotypes collected from NTRI Shinkiari,
Mansehra. Cluster C comprised of two genotypes i.e. SL-01-05 and IN-01-07
(belonging to broad leaved type teas), and separated them from all other tea
genotypes related to narrow leaved teas (Camellia sinensis).
The clustering pattern showing relationship among the tea genotypes investigated,
largely agrees with the conventional globally reputed classification system of tea
(sealy, 1958) and clustering pattern revealed by quantitative trait analysis in
previous section.

63
Table 3.1 Range of morphological characters of tea genotypes
S. No. Characteristics Range of variation (Standard Deviation)
1. Leaf length 6.27 ―― 11.69 (1.88)
2. Leaf breadth 2.21 ―― 5.18 (0.91)
3. Leaf length/Leaf breadth 2.25 ―― 3.04 (0.26)
4. Leaf area 14.02 ―― 58.58 (14.46)
5. Petiole length 0.34 ―― 0.53 (0.07)
6. Fresh leaf Weight 0.23 ―― 1.0 (0.30)
7. Dry leaf weight 0.074 ―― 0.44 (0.13)
8. Leaf F/D W 2.31 ―― 3.59 (0.54)
9. No. of Vein pairs 10.24 ―― 15.32 (1.63)
10. Leaf angle 26.20 ―― 38.80 (5.65)
11. Branch angle 30.0 ―― 44.40 (5.47)
12. Length of plucking shoot 8.14 ―― 11.53 (1.37)
13. Weight of fresh plucking shoot 0.67 ―― 3.78 (0.93)
14. Weight of Dry Plucking shoot 0.28 ―― 1.39 (0.44)
15. F/D Weight Plucking shoot 2.33 ―― 3.54 (0.463)
16. Bud length 1.85 ―― 3.36 (0.523)
17. Internodes distance
1.96 ―― 3.32 (0.542)
18
Ten seeds weight 9.88 ―― 18.96 (2.406)

64
Table 3.2 Means and LSD values for Leaf parameters.
1. LL=Leaf Length, LB=Leaf Breadth, LL/LB= Leaf Length to Leaf Breadth ratio, LA= Leaf
Area, PL= Petiole Length, FLW= Fresh Leaf Weight, DLW= Dry Leaf Weight, LF/D= Fresh to
dry leaf ratio, LVP= L. Vein pairs and L Ang = L. Angle
2. Means with same letters are not significantly different at 0.05 probability level.
S.No
Genotypes L L (cm) LB (cm) L L/LB L A (cm2 ) P L (cm) FLW (g) DLW (g) Leaf F/D W LVP L Ang
1 Qimen 7.77 bcd 2.99 cde 2.66 cd 19.94 def 0.39 bcde 0.42 bcde 0.27 abc 2.76 bcd 11.16 efg 31.40 cde
2 Roupi 7.95 bc 3.14 c 2.43 de 21.63 de 0.44 bc 0.48 bcd 0.28 abc 3.59 a 12.96 cd 30.20 de
3 IN-01-07 11.57 a 5.18 a 2.25 e 58.58 a 0.53 a 0.99 a 0.43 a 2.48 cd 14.16 b 32.80 bcd
4 SL-01-05 11.69 a 4.45 b 2.50 d 47.84 b 0.42 bcde 1.00 a 0.37 ab 2.31 d 15.32 a 38.80 a
5 JP-01-05 8.18 bc 2.89 cde 2.80 abc 24.93 cd 0.47 ab 0.61 b 0.17 bc 2.77 bcd 12.68 cd 37.40 ab
6 Chuye 6.588 de 2.26 f 2.93 ab 14.77 ef 0.37 cde 0.25 de 0.07 c 3.54 a 11.52 ef 28.60 de
7 T-05-10 7.28 bcde 2.6 cdef 2.83 abc 18.99 def 0.43 bcd 0.55 bc 0.11 c 2.87 bcd 11.92 de 31.60 cde
8 Cl-01-05 8.53 b 3.0 cd 2.81 abc 29.61 c 0.41 bcde 0.40 bcde 0.12 c 3.53 a 13.64 bc 26.20 e
9 Ich-08 6.27 e 2.20 f 2.78 bc 14.02 f 0.47 ab 0.23 de 0.07 c 3.26 ab 10.24 g 36.20 abc
10 Ich-09 6.57 de 2.67 cdef 2.50 d 17.73 def 0.42 bcde 0.23 e 0.16 bc 3.53 a 12.64 cd 30.60 cde
11 Ich-05 7.36 bcde 2.40 ef 3.04 a 17.85 def 0.34 e 0.33 cde 0.11 c 3.05 abc 10.56 fg 29.80 de
12 Ich-07 7.00 cde 2.5 def 2.79 bc 16.97 ef 0.35 de 0.23 de 0.07 c 2.99 abc 12.84 cd 30.00 de
LSD (0.05) 1.035 0.58 0.24 7.33 0.081 0.25 0.23 0.61 1.11 5.77
% CV 9.03 9.03 6.38 21.85 14.18 35.69 51.86 12.04 6.98 14.59

65
Table 3.3 Means for quantitative traits of Plucking Shoots and Seeds.
Means with same letters are not significantly different at 0.05 probability level
S.No.
Genotypes Branch angle
Shoot Length
F. Sh. Wt D. Shoot Wt
F/D Shoot
Bud Length
Internod Dist
Ten Seed Weight
1 Qimen 35.20 cde 10.66 abc 1.22 de 0.36 cd 3.2 bcd 2.28 bcd 2.82 abcd 15.88 bc
2 Roupi 33.40 de 10.44 bc 1.43 cd 0.41 cd 3.6 a 2.18 cde 3.07 abc 15.09 bcd
3 IN-01-07 33.20 de 8.98 de 3.78 a 1.08 ab 3.17 cd 2.21 cde 2.85 abcd 16.40 b
4 SL-01-05 44.40 a 10.96 ab 2.94 b 1.39 a 2.33 e 1.94 de 3.20 ab 18.96 a
5 JP-01-05 39.00 bc 8.38 e 1.38 cd 0.37 cd 3.32 abc 2.15 cde 2.52 cde 15.16 bcd
6 Chuye 36.00 cd 8.14 e 0.99 def 0.29 d 3.54 a 1.85 e 2.38 de 9.88 f
7 T-01-05 36.00 cd 8.69 de 1.38 cd 0.44 cd 2.88 d 2.37 bc 1.96 e 11.52 e
8 Cl-01-05 30.20 e 10.59 abc 1.68 c 0.48 cd 3.54 ab 2.25 bcd 2.90 abcd 14.76 cd
9 Ich-08 42.00 ab 10.30 bc 1.35 cd o.42 cd 3.29 abc 3.29 a 2.64 bcd 13.97 d
10 Ich-09 41.80 ab 11.30 ab 0.87 ef 0.28 d 3.31 abc 2.61 b 3.32 a 14.46 d
11 Ich-05 39.80 abc 11.53 a 1.06 def 0.32 cd 3.34 abc 3.36 a 2.92 abcd 13.95 d
12 Ich-07 41.60 ab 9.77 cd 0.67 f 0.72 bc 2.44 e 2.44 bc 2.64 bcd 14.44 d
LSD (0.05) 5.051 1.089 0.45 0.41 0.33 0.38 0.572 1.39
% CV 10.41 8.56 22.72 58.56 8.17 12.22 16.18 7.51

66
Table 3.4 Genotypic Correlation among the quantitative characters of tea genotypes
Traits L B L L/LB L A P L F LW D LW F/D LW L V P L Ang Sh. Ang
Sh. L F Sh. W D Sh. W
F/D Sh.W
B L Int. D 10 S W
L L 0.941
(0.00)*
-0.499 (0.00)
0.914 (0.00)
0.517 (0.00)
0.838 (0.00)
0.741 (0.00)
-0.616 (0.00)
0.723 (0.00)
0.291 (0.02)
-0.054 (0.68)
0.034 (0.79)
0.827 (0.00)
0.616 (0.00)
-0.288 (0.03)
-0.243 (0.06)
0.324 (0.01)
0.610 (0.00)
L B -0.695 (0.00)
0.926 (0.00)
0.536 (0.00)
0.844 (0.00)
0.775 (0.00)
-0.593 (0.00)
0.674 (0.00)
0.275 (0.03)
-0.093 (0.48)
-0.026 (0.84)
0.841 (0.00)
0.575 (0.00)
-0.240 (0.07)
-0.268 (0.04)
0.329 (0.01)
0.603 (0.00)
L L/B -0.519 (0.00)
-0.344 (0.007)
-0.570 (0.00)
-0.613 (0.00)
0.262 (0.043)
-0.392 (0.002)
-0.280 (0.030)
0.075 (0.57)
0.009 (0.95)
-0.484 (0.00)
-0.328 (0.01)
0.023 (0.86)
0.232 (0.08)
-0.243 (0.06)
-0.517 (0.00)
L A 0.499 (0.00)
0.778 (0.00)
0.581 (0.00)
-0.493 (0.00)
0.731 (0.00)
0.246 (0.06)
-0.096 (0.47)
-0.034 (0.798)
0.902 (0.00)
0.597 (0.00)
-0.246 (0.06)
-0.313 (0.015)
0.302 (0.019)
0.549 (0.00)
P L 0.454 (0.00)
0.511 (0.00)
-0.371 (0.003)
0.255 (0.049)
0.256 (0.048)
-0.056 (0.67)
-0.198 (0.13)
0.491 (0.00)
0.161 (0.22)
0.077 (0.56)
-0.015 (0.91)
0.214 (0.10)
0.181 (0.17)
F L W 0.732 (0.00)
-0.546 (0.00)
0.543 (0.00)
0.342 (0.008)
-0.035 (0.79)
-0.159 (0.23)
0.768 (0.00)
0.559 (0.00)
-0.216 (0.098)
-0.291 (0.024)
0.143 (0.28)
0.529 (0.00)
D L W -0.523 (0.00)
0.399 (0.002)
0.288 (0.026)
-0.045 (0.73)
0.030 (0.82)
0.527 (0.00)
0.335 (0.009)
-0.048 (0.71)
-0.033 (0.80)
0.291 (0.024)
0.470 (0.00)
F/D LW -0.297 (0.02)
-0.378 (0.003)
-0.254 (0.05)
0.059 (0.65)
-0.385 (0.002)
-0.343 (0.007)
0.600 (0.00)
0.064 (0.626)
-0.110 (0.403)
-0.404 (0.001)
L V P 0.077 (0.56)
-0.034 (0.79)
0.028 (0.83)
0.597 (0.00)
0.602 (0.00)
-0.354 (0.005)
-0.471 (0.00)
0.296 (0.02)
0.484 (0.00)
L Ang 0.330 (0.01)
-0.122 (0.35)
0.278 (0.03)
0.293 (0.02)
-0.261 (0.04)
-0.002 (0.99)
-0.063 (0.63)
0.269 (0.038)
Sh. Ang 0.068 (0.606)
-0.102 (0.44)
0.113 (0.39)
-0.440 (0.00)
0.183 (0.16)
-0.051 (0.70)
0.148 (0.26)
Sh. L -0.062 (0.64)
-0.027 (0.84)
-0.072 (0.58)
0.462 (0.00)
0.614 (0.00)
0.332 (0.01)
F Sh. W 0.626 (0.00)
-0.137 (0.295)
-0.202 (0.12)
0.205 (0.12)
0.519 (0.00)
D Sh. W -0.445 (0.00)
-0.244 (0.06)
0.115 (0.38)
0.506 (0.00)
F/D Sh.W
0.154 (0.24)
-0.048 (0.72)
-0.301 (0.019)
B L 0.093 (0.48)
-0.083 (0.53)
Int. D 0.465 (0.00)
* = Probability level at 5% is shown in parenthesis.
LL=Leaf length, LB=Leaf breadth, LL/B= Leaf length to breadth ratio, LA= Leaf area, PL= Petiole length, FLW= Fresh leaf
weight, DLW= Dry leaf weight, F/D LW= Fry to dry leaf weight ratio, LVP= Leaf vein pairs, L Ang= Leaf angle, Sh. Ang= Shoot
angle to stem, Sh. L= Shoot length, F Sh. W = Fresh Shoot weight, D Sh. W= Dry shoot weight, F/D Sh. W= Fresh to dry shoot
weight ratio, B L= Bud length and Int. D= Internodes Distance.

67
435911121076821
45.18
30.12
15.06
0.00
Tea Genotypes
Co
eff
icie
nt
of
Dis
sim
ila
rit
y
A
A1A2 A3
B
Fig.3.1. UPGMA cluster analysis showing phenotypic diversity among tea genotypes, on
the basis of Average linkage Euclidean distances. The numbers 1 to 12 represent the
genotypes; Qi-Men, Roupi, IN-01-07, SL-01-05, JP-01-05, Chuye, T-01-05, Cl-01-05, Ich-08,
Ich-09, Ich-05 and Ich-07, respectively.

68
Fig. 3.2. Cluster analysis of tea genotypes based on qualitative traits. The digits
1,2,3,4,5,6,7,8,9,10,11 and 12 designate Qi-Men, Roupi, IN-01-07, SL-01-05, JP-01-05, Chuye,
T-05-10, CL-01-05, Ich-08, Ich-09, Ich-05 and Ich-07, respectively.

69
3.2 Discussion
Morphological characterization is the first step in the classification and
characterization of any crop germplasm. Quantitative traits analysis provides handy
tools for measuring phenotypic variation (Van-Beuningen & Bush, 997). Despite
some disadvantages, these analyses are widely used for characterizing tea
genotypes. Numerous studies to evaluate tea diversity have been conducted by
using morphological characteristics (Guohua et al., 1995; Chen et al., 2005a). Tea plant
has been classified into different taxa on the basis of morphological characters.
Morphological characters such as leaf architecture, growth habit and floral biology
are important criteria used by tea taxonomists (Banerjee, 1992). During present study
wide diversity was observed within and between the available tea taxa for
quantitative as well as qualitative morphological characters. Wide diversity for the
traits studied has also been previously reported by Karthigeyan et al., (2008) and
Rahman et al., (2010).
The results on the basis of leaf length revealed that all the genotypes segregated into
the longer and shorter type of leaves coinciding with the morphological features of
the two species Camellia assamica and C. sinensis. Mean values for quantitative trait
analysis of studied parameters clearly differentiated IN-01-07 and SL-01-05
genotypes (belonging to C. assamica) from all other genotypes belonging to taxa C.
sinensis. Very close relationship was observed between these two genotypes. These
results were coroborated by cluster analysis of both quantitative and qualitative trait
analysis. Leaf parameters such as Leaf length, leaf breadth, leaf area, leaf angle, fresh
and dry leaf wieghts and internodes’ length were used as the principal criteria to

70
differentiate the cultivar types. Previously morphological characteristics of tree
shape, leaf, shoot, seed and leaf anatomy were measured and reported by Yu & Xu,
(1999) and Chen & Yu, (2001) to describe and evaluate tea germplasm. High level
diversity of morphological characteristics was revealed among 87 accessions in
genus Camellia in Yunnan province of China (Chen et al., 2005a). All leaf and most
flower quantitative characteristics showed significant differences while all fruit
quantitative and most of qualitative characteristics measured did not differ
significantly. The characteristics of leaf and floral morphology, used by Sealy (1958),
are the more important criteria in assigning taxonomic categories within Camellia
species (Banerjee, 1992).
Various tea cultivars used in present investigation showed significant differences for
fresh and dry leaf weight. Cultivars of narrow leaved group i.e. C. sinensis or “China
type”, had less fresh and dry leaf weight as compared to cultivars of broad leaved
group i.e. C. assamica or “India type”. These observations are in close agreement with
those previously reported by Rahman et al., (2010). Similar results have also been
reported by Waheed et al., (2000) who observed that narrow leaved group had high
number of leaves but less fresh and dry leaf weight. This was also proposed by the
study of Kumar et al., (1993) who reported that clones with high yield of green leaf
do not always necessarily project the high content of dry matter since clonal
differences exists in partitioning of dry matter. Our results were in close agreement
with the results of Karthigeyan et al., (2008), who differentiated the narrow and
broad leaved tea accessions significantly on the basis of vegetative morphological
characters like leaf length, leaf width, petiole length and internodes’ distance. He

71
also suggested that these are the principal characters to differentiate the different tea
cultivars. Fifteen leaf characters were also used by Hu, (2004) to evaluate inter-taxa
variation among 132 tea germplasms, the results of which are congruent with
present study.
The results of cluster analyses based on the qualitative and quantitative
morphological characters showed an almost similar clustering pattern. In both
phenograms all tea samples grouped into different clusters which clearly separated
tea genotypes of C. sinensis var. sinensis from C. sinensis var. assamica.
In a nutshell the quantitative and qualitative trait analysis regarding leaf and shoot
characteristics, significantly differentiated all the genotypes of the two taxa i.e. C.
sinensis and C. assamica. Moreover, these analyses also differentiated the tea
genotypes collected from NTRI and UTSI. This might be due to different origins of
these genotypes. Though our results showed significant differences regarding
morphological markers however, it is also abvious that economic tea species are
naturally heterogeneous with many overlapping morphological attributes. A
continuous variation and a high degree of plasticity are shown in most vegetative
characters, and hence, cannot be separated into discrete groups to identify various
taxa (Banerjee, 1992).
3.2 Phytochemical Analysis of Tea Genotypes
The tea leaves contain important phytochemical components responsible for
qualitative characters such as taste, aroma, color, astringency etc. All the tea
genotypes under observations were analyzed for total Polyphenols, Amino acids,
Caffeine and Water extracts (table 3.5). All these chemicals are considered as the

72
main principle chemicals which affect the quality of tea. These components of tea
shoots form the basis of made tea quality and nutrition. Data related to these
components were subjected to statistics analyses including multivariate analysis.
Results of these analyses have been presented in table 3.5 – 3.12 and figure 3.3, 3.4
and 3.5.
3.2.1 Total Polyphenols Content
The total polyphenols content (TPC) of the fresh tea leaves ranged from 13.19% for
SL-01-05 to 27.18% for CL-01-05 tea genotypes. The average polyphenols contents of
all the genotypes were 18.57 (Table 3.6). The highest average polyphenols contents
were observed for CL-01-05, T-05-10, Ich-08 and Ich-09 as 21.83%, 21.70%, 21.57%
and 21.57%, respectively. These genotypes are either extreme china type or china like
(C. sinensis var. sinensis). However the differences for TPC the above genotypes were
not found to be statistically significant. The lowest TPC mean values were observed
for Ich-04, IN-01-07 and SL-01-05 genotypes (the latter two genotypes belonged to C.
sinensis var. assmica i.e. assami tea) as 14.07%, 14.57% and 14.67%, respectively.
Variation observed was not statistically significant from each other. The tea
polyphenols content was largely above 18% (for 59% tested tea samples) while it was
below 16% (for 25% tea samples) (Table 3.7). A mixed pattern of variation in
polyphenol content which was not significantly significant, existed in all other
genotypes (Table 3.5). High variance (10.39) was observed for polyphenol content
which showed its importance for evaluation of diversity in present study. Overall,
the TPC percentage differentiated the studied tea genotypes significantly.

73
3.2.2 Caffeine Content
The data about Caffeine content is presented in table 3.5 and 3.6. The data revealed
that Caffeine content in the investigated tea genotypes varied from 1.1% to 4.9% (on
dry weight bases), averaging 2.5%. More than 61% of tea samples showed the
caffeine content below 3% while very few tea samples (15%) had Caffeine content
above 4% (Table 3.9). The highest caffeine content was observed for CL-01-05
genotypes collected from NTRI Shinkiari. The next higher value of Caffeine contents
observed was 4.0% both for Qi-Men and JP-01-05 genotypes. Minimum values of
Caffeine contents were observed for SL-01-05, IN-01-07, T-05-10 and Roupi
genotypes as 1.17%, 1.23%, 1.33% and 1.37%, respectively. The data about Caffeine
contents separated the different taxa of tea (i.e. C. sinensis and C. assamica)
significantly. Genotypes of C. sinensis showed the highest Caffeine content while
genotypes from C. assamica had the lowest caffeine contents. Variance observed for
Caffeine contents was 1.50, which is reasonable for diversity analysis of investigated
tea genotypes.
3.2.3 Amino acids content
A standard curve for amino acids (glutamic acid mg/OD570) (fig. 3.3) was used for
calculation of amino acids (on dry weight basis) in tea during present study. The
data obtained for amino acid content in the observed tea genotypes ranged from
1.86% to 4.20%. The average value observed was 2.62% (table 3.6). Most of the tea
samples were between 2% and 3% (Table 3.9). A maximum value of Amino acids
was observed for IN-01-07 genotype (4.20%), followed by Ich-08, JP-01-05, Roupi,
CL-01-05 and Qi-Men with amino acids content as 3.03, 2.93, 2.83, 2.83, 2.76%,

74
respectively (table 3.5). All the above genotypes with higher amino acid contents
were small leaved (except IN-01-07) and were collected from same location (except
Ich-08). On the other hand Ich-07, Ich-04 and SL-01-05 genotypes showed the lowest
caffeine contents among the studied genotypes, as 1.86%, 2.0% and 2.03%,
respectively (table 3.5).
Although the Amino acids content varied among genotypes however, the differences
were not statistically significant. A low variance value (0.509) was observed for
Amino acids content in tea genotypes indicated low genetic variability and hence a
restricted scope of selection for this trait.
Figure 3.3 Standard curve for Amino acids (as Glutamic acid equivalent)
y = 1.6895xR² = 0.9742
0
0.1
0.2
0.3
0.4
0.5
0.6
0.7
0.8
0.9
1
0 0.1 0.2 0.3 0.4 0.5 0.6
Op
tica
l D
en
sity
(O
D5
70
)
Amino Acids Concentration (mg/ml)

75
3.2.4 Water Extracted Substances
Data presented in table 3.6 reveals that the percentage of water extracted substances
of tea leaves (on dry weight basis) varied from 33.5% to 49.4% in different genotypes.
The average value for all samples was 40.19%. Water extracts content was observed
between 35% and 45% for 80% of the tea samples (Table 3.10). The highest
percentage of water extracted substances was recorded for Ich-05, T-05-10 and Qi-
Men genotypes as 44.63%, 43.37% and 43.10%, respectively. The difference among
these genotypes was statistically non significant. The lowest values were recorded
for IN-01-07, Chuye and CL-01-05 tea genotypes as 34.17%, 35.17% and 35.30%,
respectively. In general the broad leaved genotypes (IN-01-07 and SL-01-05) showed
lower while the narrow leaved genotypes showed a mixed pattern of water extracted
substances in their leaves. The genotypes collected from UTSI showed the level
above 40% while the level of water extracts for genotypes collected from NTRI
ranged from the lowest to the highest level. Variance for water extracted substances
was observed as 14.4 which was high enough for this trait to be used for
phytochemical diversity.
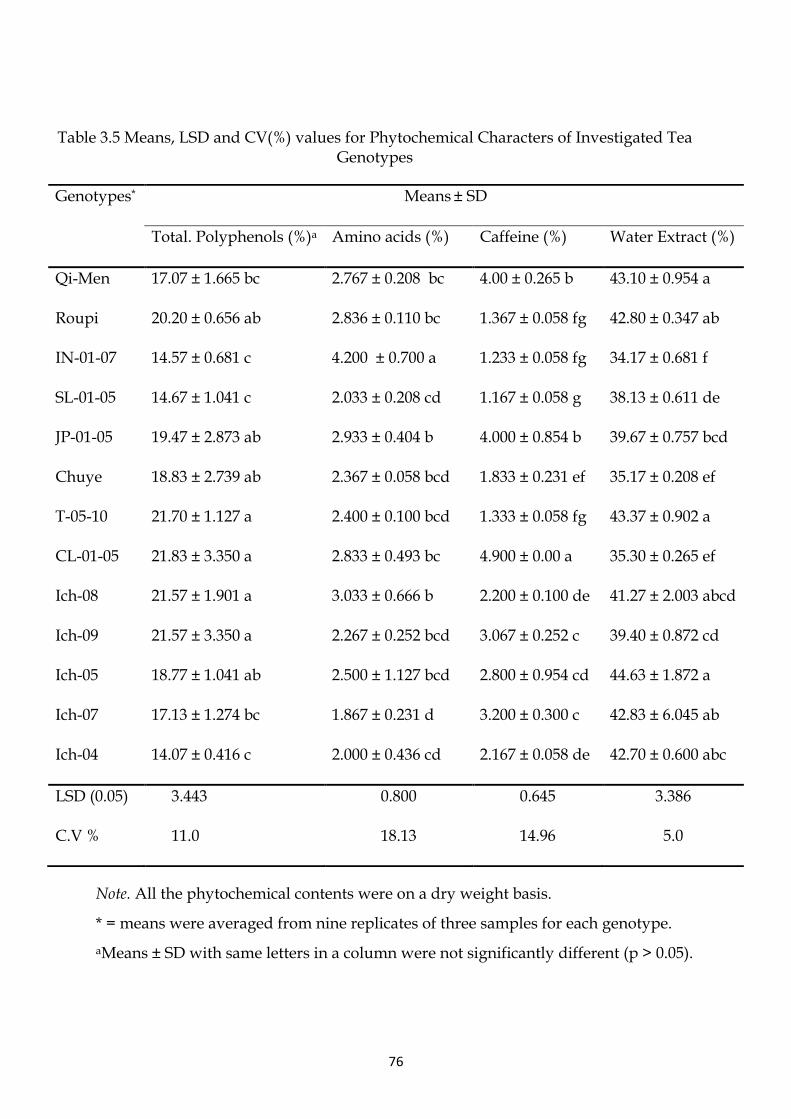
76
Table 3.5 Means, LSD and CV(%) values for Phytochemical Characters of Investigated Tea Genotypes
Note. All the phytochemical contents were on a dry weight basis.
* = means were averaged from nine replicates of three samples for each genotype.
aMeans ± SD with same letters in a column were not significantly different (p > 0.05).
Genotypes* Means ± SD
Total. Polyphenols (%)a Amino acids (%) Caffeine (%) Water Extract (%)
Qi-Men 17.07 ± 1.665 bc 2.767 ± 0.208 bc 4.00 ± 0.265 b 43.10 ± 0.954 a
Roupi 20.20 ± 0.656 ab 2.836 ± 0.110 bc 1.367 ± 0.058 fg 42.80 ± 0.347 ab
IN-01-07 14.57 ± 0.681 c 4.200 ± 0.700 a 1.233 ± 0.058 fg 34.17 ± 0.681 f
SL-01-05 14.67 ± 1.041 c 2.033 ± 0.208 cd 1.167 ± 0.058 g 38.13 ± 0.611 de
JP-01-05 19.47 ± 2.873 ab 2.933 ± 0.404 b 4.000 ± 0.854 b 39.67 ± 0.757 bcd
Chuye 18.83 ± 2.739 ab 2.367 ± 0.058 bcd 1.833 ± 0.231 ef 35.17 ± 0.208 ef
T-05-10 21.70 ± 1.127 a 2.400 ± 0.100 bcd 1.333 ± 0.058 fg 43.37 ± 0.902 a
CL-01-05 21.83 ± 3.350 a 2.833 ± 0.493 bc 4.900 ± 0.00 a 35.30 ± 0.265 ef
Ich-08 21.57 ± 1.901 a 3.033 ± 0.666 b 2.200 ± 0.100 de 41.27 ± 2.003 abcd
Ich-09 21.57 ± 3.350 a 2.267 ± 0.252 bcd 3.067 ± 0.252 c 39.40 ± 0.872 cd
Ich-05 18.77 ± 1.041 ab 2.500 ± 1.127 bcd 2.800 ± 0.954 cd 44.63 ± 1.872 a
Ich-07 17.13 ± 1.274 bc 1.867 ± 0.231 d 3.200 ± 0.300 c 42.83 ± 6.045 ab
Ich-04 14.07 ± 0.416 c 2.000 ± 0.436 cd 2.167 ± 0.058 de 42.70 ± 0.600 abc
LSD (0.05) 3.443 0.800 0.645 3.386
C.V % 11.0 18.13 14.96 5.0

77
Table 3.6 Basic statistics for four main phytochemical components of tea genotypes.
Traits Range (%) Min (%) Max (%) Mean (%) ± SE Standard deviation
Variance
Total Polyphenols 13.99 13.19 27.18 18.57 ± 0.516 3.223 10.39
Caffeine 3.80 1.16 4.90 2.55 ± 0.196 1.227 1.50
Amino acids 3.50 1.86 4.20 2.61 ± 0.114 0.713 0.50
Water extract 16.0 33.50 49.40 40.19 ± 0.607 3.795 14.40
Table 3.7. Polyphenols content variation among tea genotypes
Polyphenols % Genotypes Percent (%)
<16 10 25.64
16-18 6 15.38
18-20 9 23.07
>20 14 35.89
total 39 100
Table 3.8. Caffeine content variation among tea genotypes
Caffeine % Genotypes Percent (%)
<2 13 33.33
2-3 11 28.20
3-4 9 23.07
>4 6 15.38
total 39 100
Table 3.9. Amino acids content variation among tea genotypes
Amino acids % Genotypes Percent (%)
<2 7 17.94
2-3 25 64.10
3-4 6 15.38
>4 1 2.56
total 39 100
Table 3.10. Variation of water extracts content among tea genotypes
Water extract % Genotypes Percent (%)
<35 5 12.82
35-40 12 30.76
40-45 19 48.71
>45 3 7.69
total 39 100
78
3.2.5 Multivariate Analysis of Tea Genotypes based on Phytochemical Contents
3.2.5.1 Cluster Analysis
The UPGMA dendrogram analysis of main phytochemical contents of 39 tea samples
from 13 tea genotypes based on the dissimilarity matrix of Euclidean distances
coefficient (Table 3.12), showed four discrete clusters (Fig. 3.4), namely group A, B, C
and D. Cluster A comprised 11 tea samples from four tea genotypes (3 each from Qi-
Men and Ich-04, 2 each from Ich-05 and Ich-07 and 1 from JP-01-05). Within this
group all samples of Ich-04 genotype were grouped in an isolated sub cluster.
Cluster B was composed of 15 samples among which 3 each were from T-05-10,
Roupi, Ich-08 and Ich-09; 2 from JP-01-05 and 1 from Ich-05 genotype. All the tea
samples in cluster A and B were either small leaved China type (C. sinensis) or China
like genotypes collected from two different locations which overlapped extensively.
Cluster C was entirely distinct from other clusters because it included most of the tea
samples from broad leaved Indian type (C. assamica). It included 9 samples, 3 each
from IN-01-07 and SL-01-05 genotypes while 2 from Chuye and 1 from Ich-07
genotypes. Samples of each genotype in cluster C were further grouped in mini sub
clusters. Cluster D was the smallest cluster which comprised four samples including
3 from CL-01-05 and 1 from Chuye. The tea samples in cluster C and D showed the
highest Euclidean distance from the tea samples of cluster A and B.
3.2.5.2 Principal Coordinate Analysis (PCoA)
The Principal Coordinates Analysis (PCoA) was done on the basis of the Euclidean
distances coefficient to reveal the relationships among tested samples of tea
genotypes. The results of PCoA based on the phytochemical characters are presented

79
in table 3.11. The first three components accounted for 98.31% of the total variance in
the dataset. The first two components alone accounted for 55.41% and 37.56%,
respectively, of the total variance and thus were far more important than other
components. The PCoA depicted relationship that largely agrees with the
conventional classification system and the clustering patterns presented in the
dendrogram (Fig. 3.4). The component loadings correspond to the correlation
coefficients between characters and the derived components. Characters with high
loading values in table 3.11 were Water extracted substances (152.14), followed by
Caffeine and Amino acids (over 83%), while Polyphenols had the lowest loading
value. The plot by the first two components (Fig. 3.5) showed a similar grouping
pattern with the cluster analysis. The plot of the first two components based on all
characters (Fig. 3.4) showed a clearer separation of broad leaved genotypes (C.
assamica), namely IN-01-07 and SL-01-05 genotypes from the other related taxa. It
suggests that phytochemical characters mentioned, should be taken into
consideration for distinguishing tea taxa.

80
Fig. 3.4 UPGMA-derived dendrogram illustrating the relationship among 39 observed teas based on phytochemical characteristics.
Coefficient of Euclidean Distances
D
C
B
A
Qi-01 Ich-04A Ich-04C Ich-04B Q-02 Q-03 Ich-07A JP-05 Ich-05A Ich-05B Ich-07C Rp-01 Ich-05C Rp-02 Rp-03 T-02 Ich-08B T-01 T-03 Ich-08A JP-01 JP-13 Ich-09A Ich-08C Ich-09C Ich-09B Ind-01 Ind-02 Ind-03 Ch-02 Ch-03 SL-01 SL-03 SL-02 Ich-07B Ch-01 CL-0102 CL-09 CL-03
9.6 8 6.4 4.8 3.2 1.6 0
Coefficient of Euclidean
Distances

81
Figure 3.5 Principal Co-ordinates analysis of phytochemical characteristics for 39 tea samples based on Euclidean distances coefficient.
Component 2
Component 1
Qi-
Q-
Q-
Rp-01
Rp-02
Rp-03
Ind-
Ind-02
Ind-03 SL-01
SL-
SL-03
JP-
JP-
JP-
Ch-
Ch-
Ch-
T-
T-
T- CL-0102
CL-
CL-09
Ich-08A
Ich-
Ich-08C
Ich-
Ich-09B
Ich-09C
Ich-05A
Ich-05B
Ich-05C
Ich-07A
Ich-07B
Ich-07C
Ich-04A Ich-04B
Ich-04C
-
-
-
-
-10
0
2
4
6
-----10 0 2 4 6 8

82
Table 3.11. Loading of four phytochemical characters on the first three components
from PCoA.
Characters Component
1 2 3
Amino Acids -83.82 -4.45 4.58
Caffeine -84.10 -4.46 -4.56
Total Polyphenols 15.77 15.42 0.00
Water Extract 152.14 -6.51 0.00
Eigen value 564.59 382.73 54.46
Variance explained (%) 55.41 37.56 5.34
Variance cumulative (%) 55.41 92.97 98.31
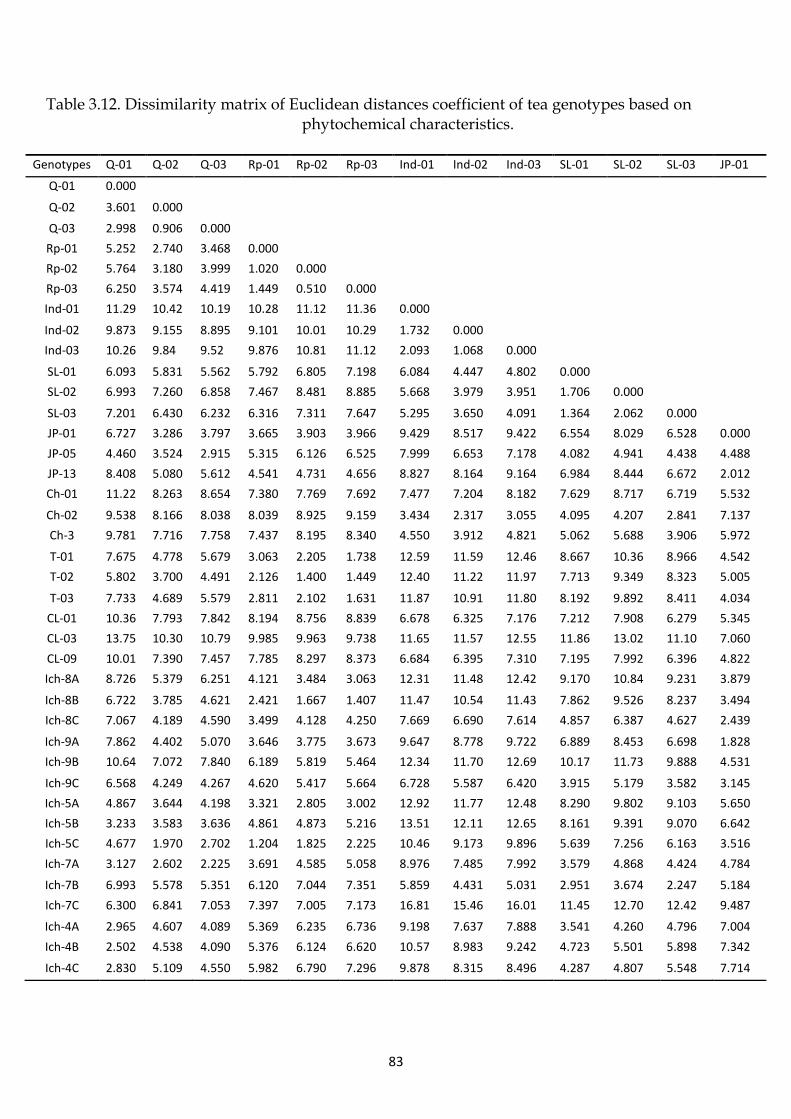
83
Table 3.12. Dissimilarity matrix of Euclidean distances coefficient of tea genotypes based on phytochemical characteristics.
Genotypes Q-01 Q-02 Q-03 Rp-01 Rp-02 Rp-03 Ind-01 Ind-02 Ind-03 SL-01 SL-02 SL-03 JP-01
Q-01 0.000
Q-02 3.601 0.000
Q-03 2.998 0.906 0.000
Rp-01 5.252 2.740 3.468 0.000
Rp-02 5.764 3.180 3.999 1.020 0.000
Rp-03 6.250 3.574 4.419 1.449 0.510 0.000
Ind-01 11.29 10.42 10.19 10.28 11.12 11.36 0.000
Ind-02 9.873 9.155 8.895 9.101 10.01 10.29 1.732 0.000
Ind-03 10.26 9.84 9.52 9.876 10.81 11.12 2.093 1.068 0.000
SL-01 6.093 5.831 5.562 5.792 6.805 7.198 6.084 4.447 4.802 0.000
SL-02 6.993 7.260 6.858 7.467 8.481 8.885 5.668 3.979 3.951 1.706 0.000
SL-03 7.201 6.430 6.232 6.316 7.311 7.647 5.295 3.650 4.091 1.364 2.062 0.000
JP-01 6.727 3.286 3.797 3.665 3.903 3.966 9.429 8.517 9.422 6.554 8.029 6.528 0.000
JP-05 4.460 3.524 2.915 5.315 6.126 6.525 7.999 6.653 7.178 4.082 4.941 4.438 4.488
JP-13 8.408 5.080 5.612 4.541 4.731 4.656 8.827 8.164 9.164 6.984 8.444 6.672 2.012
Ch-01 11.22 8.263 8.654 7.380 7.769 7.692 7.477 7.204 8.182 7.629 8.717 6.719 5.532
Ch-02 9.538 8.166 8.038 8.039 8.925 9.159 3.434 2.317 3.055 4.095 4.207 2.841 7.137
Ch-3 9.781 7.716 7.758 7.437 8.195 8.340 4.550 3.912 4.821 5.062 5.688 3.906 5.972
T-01 7.675 4.778 5.679 3.063 2.205 1.738 12.59 11.59 12.46 8.667 10.36 8.966 4.542
T-02 5.802 3.700 4.491 2.126 1.400 1.449 12.40 11.22 11.97 7.713 9.349 8.323 5.005
T-03 7.733 4.689 5.579 2.811 2.102 1.631 11.87 10.91 11.80 8.192 9.892 8.411 4.034
CL-01 10.36 7.793 7.842 8.194 8.756 8.839 6.678 6.325 7.176 7.212 7.908 6.279 5.345
CL-03 13.75 10.30 10.79 9.985 9.963 9.738 11.65 11.57 12.55 11.86 13.02 11.10 7.060
CL-09 10.01 7.390 7.457 7.785 8.297 8.373 6.684 6.395 7.310 7.195 7.992 6.396 4.822
Ich-8A 8.726 5.379 6.251 4.121 3.484 3.063 12.31 11.48 12.42 9.170 10.84 9.231 3.879
Ich-8B 6.722 3.785 4.621 2.421 1.667 1.407 11.47 10.54 11.43 7.862 9.526 8.237 3.494
Ich-8C 7.067 4.189 4.590 3.499 4.128 4.250 7.669 6.690 7.614 4.857 6.387 4.627 2.439
Ich-9A 7.862 4.402 5.070 3.646 3.775 3.673 9.647 8.778 9.722 6.889 8.453 6.698 1.828
Ich-9B 10.64 7.072 7.840 6.189 5.819 5.464 12.34 11.70 12.69 10.17 11.73 9.888 4.531
Ich-9C 6.568 4.249 4.267 4.620 5.417 5.664 6.728 5.587 6.420 3.915 5.179 3.582 3.145
Ich-5A 4.867 3.644 4.198 3.321 2.805 3.002 12.92 11.77 12.48 8.290 9.802 9.103 5.650
Ich-5B 3.233 3.583 3.636 4.861 4.873 5.216 13.51 12.11 12.65 8.161 9.391 9.070 6.642
Ich-5C 4.677 1.970 2.702 1.204 1.825 2.225 10.46 9.173 9.896 5.639 7.256 6.163 3.516
Ich-7A 3.127 2.602 2.225 3.691 4.585 5.058 8.976 7.485 7.992 3.579 4.868 4.424 4.784
Ich-7B 6.993 5.578 5.351 6.120 7.044 7.351 5.859 4.431 5.031 2.951 3.674 2.247 5.184
Ich-7C 6.300 6.841 7.053 7.397 7.005 7.173 16.81 15.46 16.01 11.45 12.70 12.42 9.487
Ich-4A 2.965 4.607 4.089 5.369 6.235 6.736 9.198 7.637 7.888 3.541 4.260 4.796 7.004
Ich-4B 2.502 4.538 4.090 5.376 6.124 6.620 10.57 8.983 9.242 4.723 5.501 5.898 7.342
Ich-4C 2.830 5.109 4.550 5.982 6.790 7.296 9.878 8.315 8.496 4.287 4.807 5.548 7.714
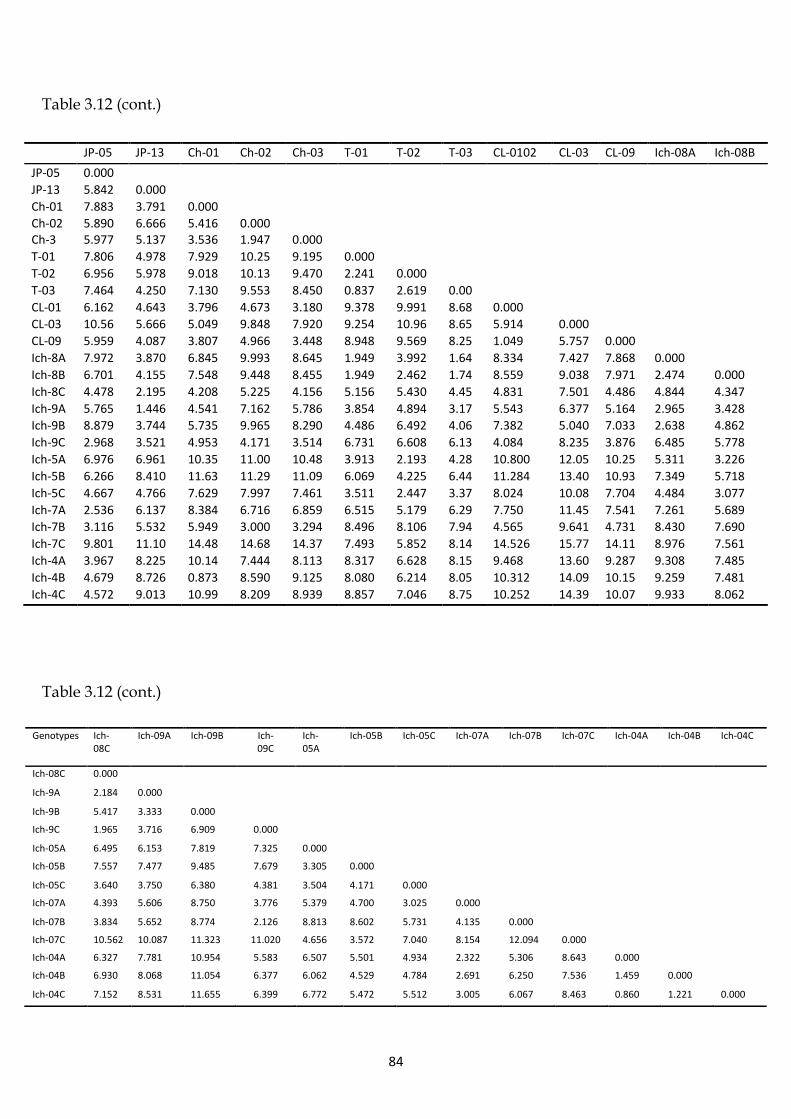
84
Table 3.12 (cont.)
Table 3.12 (cont.)
JP-05 JP-13 Ch-01 Ch-02 Ch-03 T-01 T-02 T-03 CL-0102 CL-03 CL-09 Ich-08A Ich-08B
JP-05 0.000
JP-13 5.842 0.000
Ch-01 7.883 3.791 0.000
Ch-02 5.890 6.666 5.416 0.000 Ch-3 5.977 5.137 3.536 1.947 0.000
T-01 7.806 4.978 7.929 10.25 9.195 0.000
T-02 6.956 5.978 9.018 10.13 9.470 2.241 0.000
T-03 7.464 4.250 7.130 9.553 8.450 0.837 2.619 0.00
CL-01 6.162 4.643 3.796 4.673 3.180 9.378 9.991 8.68 0.000
CL-03 10.56 5.666 5.049 9.848 7.920 9.254 10.96 8.65 5.914 0.000
CL-09 5.959 4.087 3.807 4.966 3.448 8.948 9.569 8.25 1.049 5.757 0.000
Ich-8A 7.972 3.870 6.845 9.993 8.645 1.949 3.992 1.64 8.334 7.427 7.868 0.000
Ich-8B 6.701 4.155 7.548 9.448 8.455 1.949 2.462 1.74 8.559 9.038 7.971 2.474 0.000
Ich-8C 4.478 2.195 4.208 5.225 4.156 5.156 5.430 4.45 4.831 7.501 4.486 4.844 4.347
Ich-9A 5.765 1.446 4.541 7.162 5.786 3.854 4.894 3.17 5.543 6.377 5.164 2.965 3.428
Ich-9B 8.879 3.744 5.735 9.965 8.290 4.486 6.492 4.06 7.382 5.040 7.033 2.638 4.862
Ich-9C 2.968 3.521 4.953 4.171 3.514 6.731 6.608 6.13 4.084 8.235 3.876 6.485 5.778
Ich-5A 6.976 6.961 10.35 11.00 10.48 3.913 2.193 4.28 10.800 12.05 10.25 5.311 3.226
Ich-5B 6.266 8.410 11.63 11.29 11.09 6.069 4.225 6.44 11.284 13.40 10.93 7.349 5.718
Ich-5C 4.667 4.766 7.629 7.997 7.461 3.511 2.447 3.37 8.024 10.08 7.704 4.484 3.077
Ich-7A 2.536 6.137 8.384 6.716 6.859 6.515 5.179 6.29 7.750 11.45 7.541 7.261 5.689
Ich-7B 3.116 5.532 5.949 3.000 3.294 8.496 8.106 7.94 4.565 9.641 4.731 8.430 7.690
Ich-7C 9.801 11.10 14.48 14.68 14.37 7.493 5.852 8.14 14.526 15.77 14.11 8.976 7.561
Ich-4A 3.967 8.225 10.14 7.444 8.113 8.317 6.628 8.15 9.468 13.60 9.287 9.308 7.485
Ich-4B 4.679 8.726 0.873 8.590 9.125 8.080 6.214 8.05 10.312 14.09 10.15 9.259 7.481
Ich-4C 4.572 9.013 10.99 8.209 8.939 8.857 7.046 8.75 10.252 14.39 10.07 9.933 8.062
Genotypes Ich-08C
Ich-09A Ich-09B Ich- 09C
Ich-05A
Ich-05B Ich-05C Ich-07A Ich-07B Ich-07C Ich-04A Ich-04B Ich-04C
Ich-08C 0.000
Ich-9A 2.184 0.000
Ich-9B 5.417 3.333 0.000
Ich-9C 1.965 3.716 6.909 0.000
Ich-05A 6.495 6.153 7.819 7.325 0.000
Ich-05B 7.557 7.477 9.485 7.679 3.305 0.000
Ich-05C 3.640 3.750 6.380 4.381 3.504 4.171 0.000
Ich-07A 4.393 5.606 8.750 3.776 5.379 4.700 3.025 0.000
Ich-07B 3.834 5.652 8.774 2.126 8.813 8.602 5.731 4.135 0.000
Ich-07C 10.562 10.087 11.323 11.020 4.656 3.572 7.040 8.154 12.094 0.000
Ich-04A 6.327 7.781 10.954 5.583 6.507 5.501 4.934 2.322 5.306 8.643 0.000
Ich-04B 6.930 8.068 11.054 6.377 6.062 4.529 4.784 2.691 6.250 7.536 1.459 0.000
Ich-04C 7.152 8.531 11.655 6.399 6.772 5.472 5.512 3.005 6.067 8.463 0.860 1.221 0.000

85
3.2.6 Discussion
Tea is one of the most consumed beverages all over the world and is used not only
as fresh drink but also as a traditional herb having many benefits for human health.
The main chemical components of tea shoots like Polyphenols, Amino acids,
Caffeine and Water extracted substances are of critical importance, not only for
made tea quality but also for pharmacy, food and cosmetic industries. Among these,
Polyphenols constitute the most interesting group that is the main bioactive
molecules in tea (Cabrera et al., 2003). Tea Polyphenols show many important
functions, such as antioxidant, ant-mutagenic, anti-viral, anti-neoplastic, anti-
thrombotic, anti-microbial and anti-cancer activities as well as suppressive effect of
chromosome aberration, depressor effect on renal hypertension, inhibitory effect on
arteriosclerosis and inhibitory effect on lipid peroxidation (Yamamoto et al., 1998;
Chen, 1989; Hirasawa et al., 2002).
During present study TPC showed high diversity within and between the
investigated tea taxa. The range of TPC among tea genotypes ranged from 13.19% to
27.18% which was in agreement with the observation of Cheruiyot et al., (2007), who
measured 12 to 25% TPC in shoots of six tea clones from C. sinensis. Our results
were also supported by the observations of Chen & Zhou, (2005), who obtained a
Polyphenols content range between 13.6% and 47.8% among tea genetic resources
but the range was very broad because more than five hundreds tea samples were
used. The range of TPC varied in different investigations by different investigators
due to the fact that the TPC is affected by many factors, e.g. tea varieties and origins,

86
plantation area, tea types and infusion conditions (Khan & Mukhtar, 2007; Kilmartin
& Hsu, 2007; Yao et al., 2006).
The results indicated that among the studied genotypes, narrow leaved tea
genotypes (C. sinensis var. sinensis) contained higher Polyphenols than the broad
leaved SL-01-05 and IN-01-07 tea genotypes (C. sinensis var. assamica). However, this
trend was contradictory to literature reporting that the variety assamica had higher
Polyphenols than the variety sinensis (Khan & Mukhtar, 2007; Saravanan, et al., 2005;
Peterson et al., 2004). This is may be due to extreme hybridization in tea plants or
overwhelming effect of environmental factors. It might be due to the fact that broad
leaved tea plants are not adapted well to the local environment like narrow leaved
genotypes and consequently these genotypes are not cared well. This bdisagreement
in results also reinstates further studies on the origin of tea genotypes under
observations.
Besides Polyphenols, Amino acids, Caffeine and water extracts also differentiated
the studied tea genotypes which is supported by the fact that different types of tea
(for example, C. sinensis var. assamica versus C. sinensis var. sinensis) may have
different chemical contents and those are important factors that contribute to tea
quality (Ukers, 1935; Wright & Gilchrist, 1961; Takeda, 1994). The caffeine and water
extracts content revealed a pattern similar to Polyphenols i.e. the broad leaved plants
contained the lower caffeine and water extracts content than narrow leaved
genotypes during present study. Earlier studies revealed that caffeine content is
associated to origin, genetic and environmental variability, harvest time and
processing manner of plant material (Athayde et al., 2000). Caffeine makes a

87
significant contribution to the briskness and creaming properties of tea brew. The
popularity of tea is considered to be due to its mild stimulation and astringent effects
(Teranishi & Hornstein, 1995). Our results regarding Caffeine were in close
agreement with the results of Chen & Zhou, (2005) who measured the caffeine
content ranged between 1.2% and 5.9% among the genetic resources in China.
Similarly findings of Takeda, (2000) also supported our results, who reported the
range from 1.6% to 5.5% among Chinese and Japanese tea genetic resources. Similar
results were also obtained by Nesumi & Takeda, (2006), who observed Caffeine
contents range from 2.39 to 5.46% in var. assamica, from 1.64 to 4.60% in var. sinensis
(China group) and from 0.82 to 3.87% in var. sinensis (Japan group).
Concentrations of total free amino acids (including amides) in tea ranged from 1 to
5% (on dry weight basis). The most abundant components among free amino acids
in tea are theanine, glutamine, glutamic acid and arginine. Many volatile compounds
found in made tea are derived from free amino acids. Free amino acids have been
recognized as the principal contributor to the taste of freshness and mellowness in
green tea (Chen et al., 1985; Mukai et al., 1992; Wang et al., 1988; Nakagawa et al.,
1977; 1981).
Comparing the four phytochemical characteristics based on coefficient of variation
(CV%), amino acids content had the highest variation with a coefficient of variation
(CV) of 18.13%, followed by caffeine content with CV of 14.96% and water extracted
substances showed the least variation with a coefficient of variation (CV) of 5.0%.
The content of polyphenols showed intermediate variations with CV of 11.0% (Table
3.5).

88
Both the UPGMA based cluster analysis and PCoA analysis revealed the same
pattern in separating the tea genotypes into the groups of their corresponding taxa
and samples from a particular genotype into individual sub groups within a taxon.
3.3.1 Molecular Characterization of Tea Genotypes Using RAPD Markers
3.3.1.1 Genomic DNA Extraction
The genomic DNA of 130 tea samples was extracted and quantified as described in
chapter 2. Due to plucking the tea samples in several attempts in different seasons
over a period of two years (having different phenolics content), the concentrations of
extracted DNA (ng/μl) were different and ranged approximately from 8.5 to 235.0
ng/μl, with a mean value of 87 ng/μl. The concentration and quality of genomic
DNA extracted from the young plucking shoots with a bud plus first two leaves was
higher than with a bud plus the 3rd and 4th leaves. Besides being affected by the
content of polyphenols and tannin, the quality of extracted genomic DNA was also
strongly influenced by the quality of samples. Some leaf samples from SL-01-05, T-
05-10 and JP-01-05 genotypes having comparatively less fresh leaves, could not
generate high concentration genomic DNA samples. Many attempts were made
using different protocols and modifications for obtaining clear and good quality
DNA extraction. Finally DNA of high quality was extracted from fresh leaf tissue
using modified CTAB method (Doyle & Doyle, 1987) with minor modifications.
After testing the DNA quality by RAPD markers and to meet the convention in lab
work, only 75 templates DNA samples (Table 3.13) were chosen for further study.
These DNA samples produced high quality band upon running on 1% agarose/ TBE
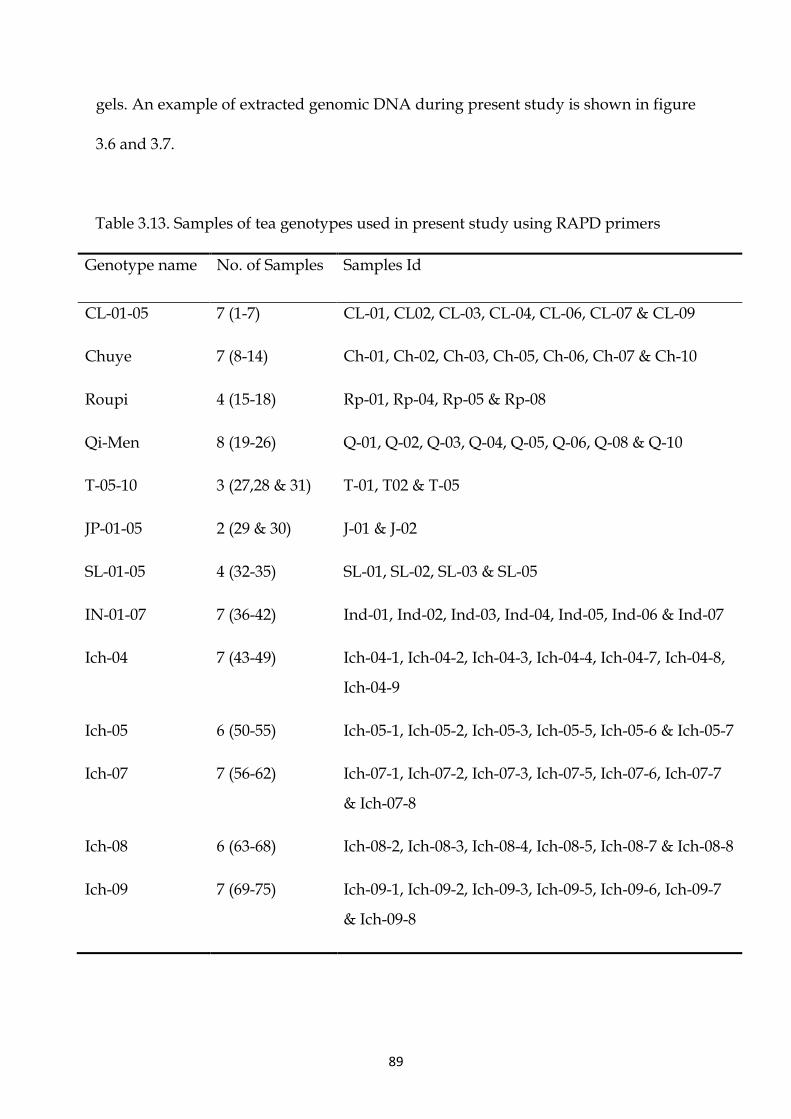
89
gels. An example of extracted genomic DNA during present study is shown in figure
3.6 and 3.7.
Table 3.13. Samples of tea genotypes used in present study using RAPD primers
Genotype name No. of Samples Samples Id
CL-01-05 7 (1-7) CL-01, CL02, CL-03, CL-04, CL-06, CL-07 & CL-09
Chuye 7 (8-14) Ch-01, Ch-02, Ch-03, Ch-05, Ch-06, Ch-07 & Ch-10
Roupi 4 (15-18) Rp-01, Rp-04, Rp-05 & Rp-08
Qi-Men 8 (19-26) Q-01, Q-02, Q-03, Q-04, Q-05, Q-06, Q-08 & Q-10
T-05-10 3 (27,28 & 31) T-01, T02 & T-05
JP-01-05 2 (29 & 30) J-01 & J-02
SL-01-05 4 (32-35) SL-01, SL-02, SL-03 & SL-05
IN-01-07 7 (36-42) Ind-01, Ind-02, Ind-03, Ind-04, Ind-05, Ind-06 & Ind-07
Ich-04 7 (43-49) Ich-04-1, Ich-04-2, Ich-04-3, Ich-04-4, Ich-04-7, Ich-04-8,
Ich-04-9
Ich-05 6 (50-55) Ich-05-1, Ich-05-2, Ich-05-3, Ich-05-5, Ich-05-6 & Ich-05-7
Ich-07 7 (56-62) Ich-07-1, Ich-07-2, Ich-07-3, Ich-07-5, Ich-07-6, Ich-07-7
& Ich-07-8
Ich-08 6 (63-68) Ich-08-2, Ich-08-3, Ich-08-4, Ich-08-5, Ich-08-7 & Ich-08-8
Ich-09 7 (69-75) Ich-09-1, Ich-09-2, Ich-09-3, Ich-09-5, Ich-09-6, Ich-09-7
& Ich-09-8

90
Figure 3.6 Genomic DNA isolated from tea accessions.
.
Figure 3.7 Genomic DNA isolated from the studied tea genotypes
3.3.1.2 RAPD Amplification
Giving due consideration to the concern regarding poor reproducibility of RAPDs,
all the amplifications were repeated twice. Only reliably scoreable and reproducible
bands were included in the analyses. Examples of PCR amplification profiles of
present investigated tea samples using RAPD primer GLA-07, GLA-10, GLA-18,
GLB-17, GLB-18 and GLB-16 are presented in Fig. 3.8a, b, c, d, e and f, respectively.
A total of 6300 DNA fragments were amplified in 75 accessions using 20 RAPD
primers giving an average of 4.0 bands per accession per primer. Amplified DNA
fragments ranged in size from 100 bp to 1400 bp. Average genetic diversity (GD)
estimates (based on all the RAPD primers used during present study) ranged from 0
to 100 % (Table 3.14). In total, more than 80% comparisons showed high level of
genetic diversity (GD = 51-100%). The 75 accessions were clustered in five main

91
groups viz; A, B, C, D and E comprising 12, 43, 4, 6 and 7 accessions, respectively.
Group A was further subdivided into subgroups A1 and A2 each comprising 6
accessions (Fig. 3.9). Subgroup A1 predominantly comprised accessions belonging
to genotype “CL-01-05” with leaves of medium size, collected from NTRI. Subgroup
A2 comprised accessions obtained from IN-01-07 genotype which is predominantly
broad leaved (C. sinensis var. assamica) and is under experimental trial. Cluster B
contained the largest number of samples (43) and was further divided into
subgroups B1, B2, B3 and few small groups of 2-3 samples from a particular
genotype. Sub cluster B1 predominantly comprised 16 samples of different small
leaved genotypes collected from NTRI Shinkiari. Sub-cluster B2 comprised 7
accessions among which 4 were from broad leaved SL-01-05genotypes (Indian type)
and 3 from small leaved Qi-Men genotype which is predominantly china type. Four
tea samples of mixed genotypes from same location (UTSI, Icherian Mansehra),
characterized by small leaves were grouped together in sub-cluster B3. Rest of the 16
genotypes in main cluster B were scattered in a mixed pattern in groups of 2 or 3.
Cluster C comprised 4 accessions, 2 from Ich-05 and 1 each from Ich-04 and Ich-07
characterized as small leaved genotypes collected from UTSI Icherian. Cluster D had
6 samples out of which 5 were from Ich-08 genotype collected from UTSI Icherian
and is characterized as a high yielding promising among the genotypes under trial
in UTSI Icherian Mansehra. Cluster E comprised all the tea samples belonged to
narrow leaved China genotype “Chuye” collected from NTRI Shinkiari.

92
Fig. 3.8a. PCR amplification of 12 accessions of tea using RAPD primer GLA-
07. M = Molecular weight marker (100 bp DNA ladder). ). Size of the
amplified fragments (in bp) is presented on right. 1= CL-01, 2=CL-02, 3=Ch-
02, 4=Rp-01, 5= Rp-03, 6=Q-02, 7=Q-03, 8=Q-04, 9=T-01, 10=T-02, 11=SL-02
and 12=Sl-04.
Fig. 3.8b RAPD amplification using GL A-10 Primer; M= Molecular
weight marker (100 bp DNA ladder). Size of the amplified
fragments (in bp) is presented on right. 1-7= Ch-01-Ch-07.
1000 bp
500 bp

93
Fig. 3.8c RAPD amplification using primer GLA-18 M= 100 bp DNA
ladder. Size of the amplified fragments (in bp) is presented on right.
1-6= Ind-01 - Ind-06.
Fig.3.8d. RAPD amplification using primer GLB-17 M=Molecular
size marker. Size of the amplified fragments (in bp) is presented on
right. 1= CL-09, 2= Q-06, 3= Ind-07, 4=Ind-06, 5=SL-05, 6= Q- 08,
7=Q-10.
1000 bp
500 bp

94
Fig.3.8e. RAPD amplification using primer GLB-18 M= Molecular
size marker. Size of the amplified fragments (in bp) is presented
on right. 1-3=T-01, T-02 and T-05, 4= JP-01 and 5= JP-02.
Fig.3.8f. RAPD amplification using primer GLB-16 M=Molecular
size marker. Size of the amplified fragments (in bp) is presented on
right. 1- 4= Ich-08-02, 03, 04 and 05, 5-7= Ich-05-01, 02 and 03.
1000 bp
500 bp
1000 bp
500 bp

95
Figure 3.9 Dendrogram constructed for 75 tea genotypes using data obtained from
PCR with 20 RAPD primers.
A
A1
A2
B
B3
B2
B1
E
D
C

96
Table 3.14: Genetic Distances (GD) estimated among 75 tea genotypes used during present study (Nei & Li, 1979).
na= data not available. Accession numbers are identified in Table 3.13.
Genotypes 1 2 3 4 5 6 7 8 9 10 11 12 13 14 15 16 17 18 19 20 21 22 23
2 0.46
3 0.53 0.30
4 0.58 0.72 0.81
5 na na na 0.5
6 0.5 0.40 0.40 na na
7 0.58 0.5 0.5 0.5 0.4 0.5
8 0.64 0.8 0.85 0.64 0.75 0.8 0.71
9 0.54 0.54 0.77 0.62 0.75 0.88 0.88 0.62
10 0.77 0.85 0.83 0.75 na 1.0 1.0 0.59 0.70
11 0.88 0.92 1.0 0.79 0.66 1.0 0.83 0.69 0.74 0.60
12 0.68 0.70 0.77 0.68 0.66 0.83 0.66 0.58 0.62 0.62 0.75
13 0.90 0.94 0.93 0.60 0.83 1.0 0.91 0.66 0.71 0.65 0.71 0.59
14 1.0 1.0 1.0 0.91 0.77 1.0 0.88 0.67 0.82 0.73 0.58 0.76 0.75
15 na na na na na na na 0.5 0.71 0.8 na na na na
16 na na na na na na na 0.66 0.62 0.66 na na na na 0.85
17 na na na na na na na 0.66 0.62 0.66 na na na na 0.85 0.0
18 0.82 na 0 na na na na 0.75 0.85 0.75 na na na na 1.0 0.83 0.83
19 na na na na na na na 0.25 0.57 0.60 na na na na 0.6 0.50 0.50 0.80
20 0.85 na 0.80 na na na na 0.50 0.5 0.71 na na na na 0.71 0.62 0.62 0.66 0.33
21 na na na 0.60 na 0.42 na 0.60 0.57 0.6 0.65 na 0.60 na 0.83 0.20 0.20 0.80 0.40 0.57
22 0.82 0.80 na na na na na 1.0 0.87 1.0 na na na na 1.0 0.85 0.85 0.75 0.83 0.71 0.83
23 0.85 0.80 na na na na na 1.0 0.83 1.0 na na na na 1.0 1.0 1.0 1.0 1.0 1.0 1.0 0.66
24 0.80 0.81 na na na na na na na na 0.60 na 0.65 na na Na na na na na na na na
25 na na 0.78 na na na na 1.0 1.0 1.0 na na na na 0.8 1.0 1.0 0.75 0.83 0.87 1.0 0.80 1.0
26 na 0.78 na 0.55 na na na 0.80 0.5 0.8 na na na na 0.66 0.60 0.6 0.90 0.70 0.50 0.70 0.66 0.88
27 0.80 0.75 na na 0.40 na 0.75 na na na na na 0.70 na na Na na na na na na na na
28 na na 0.75 na na na 0.80 0.85 0.62 0.85 na na na na 0.85 0.57 0.57 1.0 0.71 0.77 0.50 0.66 0.80
29 0.72 0.75 na na 0.35 0.38 na 0.75 0.85 0.75 na na 0.72 na 1.0 0.83 0.83 0.66 0.80 0.85 0.80 1.0 1.0
30 na 0.80 0.82 na 0.42 0.36 0.81 1.0 1.0 1.0 na na na na 1.0 1.0 1.0 1.0 1.0 1.0 1.0 1.0 1.0
31 0.70 na 0.78 na 0.40 0.35 na na na na na na 0.75 na na Na na na na na na na na
32 na 0.85 na na 0.38 0.40 0.80 na na na na na na na na Na na na na na na na na
33 0.72 0.90 0.88 0.69 0.40 0.41 0.78 0.77 0.65 0.60 0.62 0.70 0.70 0.66 0.71 0.42 0.42 0.85 0.57 0.66 0.33 0.87 1.0
34 0.72 0.77 0.88 0.45 0.35 0.36 0.75 0.62 0.60 0.61 0.62 0.55 0.37 0.75 0.88 0.50 0.5 0.87 0.62 0.55 0.62 0.88 1.0

97
Table 3.14: (cont.)
Genotypes 1 2 3 4 5 6 7 8 9 10 11 12 13 14 15 16 17 18 19 20 21 22 23
35 0.80 0.71 0.66 0.84 0.50 0.90 na 0.65 0.68 0.50 0.71 0.62 0.62 0.66 0.66 0.33 0.33 0.83 0.20 0.42 0.50 0.85 1.0
36 0.87 1.0 1.0 na na 1.0 0.83 0.82 0.91 0.75 0.79 1.0 0.87 0.64 na Na na na na na na na na
37 1.0 1.0 1.0 na na 1.0 1.0 0.82 0.86 0.9 0.83 0.71 0.95 0.79 na Na na na 0.25 na 0.40 na 0.42
38 0.63 0.66 0.66 na na 0.66 0.73 0.74 0.84 0.71 0.73 0.71 0.71 0.78 na Na na na na na na na na
39 0.81 0.87 0.87 na na 0.87 0.70 0.57 0.67 0.63 0.73 0.67 0.82 0.68 na Na na na 0.35 na 0.45 na 0.60
40 na Na na na na na na na na 0.55 na 0.5 0.9 0.54 na Na na na na na na na na
41 0.91 1.0 1.0 na na 1.0 0.85 0.83 0.79 0.90 0.88 0.84 0.94 0.75 na Na na na 0.70 na na na 0.65
42 1.0 1.0 1.0 na na 1.0 0.91 0.77 0.84 0.73 0.90 1.0 1.0 0.91 na Na na na na na na na na
43 na Na na na na na na 0.82 0.51 0.76 0.57 0.73 0.91 0.69 0.75 0.90 0.90 0.87 0.77 0.55 0.90 0.57 0.85
44 0.85 0.90 0.88 0.69 na na 0.66 0.73 0.71 0.88 0.80 0.78 0.72 0.67 0.87 0.77 0.77 0.85 0.75 0.50 0.75 0.50 0.83
45 0.75 0.90 0.90 0.63 0.75 na 0.88 0.77 0.75 0.68 0.75 0.84 0.82 0.63 0.88 0.80 0.80 0.71 0.77 0.81 0.77 0.57 0.85
46 0.69 0.83 0.81 0.66 na na na 0.66 0.60 0.69 0.65 0.65 0.68 0.71 0.87 0.77 0.77 0.85 0.75 0.50 0.88 0.71 1.0
47 0.85 1.0 1.0 0.5 0.77 1.0 0.82 0.67 0.75 0.66 0.81 0.83 0.94 0.81 na Na na na na na na na na
48 0.80 1.0 1.0 0.62 0.57 1.0 0.67 0.66 0.60 0.61 0.77 0.72 0.85 0.67 0.87 0.77 0.77 0.85 0.88 0.66 0.75 0.50 0.83
49 0.78 0.82 0.81 0.55 0.62 0.85 0.70 0.70 0.77 0.72 0.70 0.79 0.90 0.63 0.5 0.85 0.85 o.75 0.83 0.71 1.0 0.80 1.0
50 0.92 1.0 0.91 0.73 na 1.0 0.83 0.71 0.77 0.73 0.61 0.64 0.83 0.60 na Na na na na na na na na
51 0.83 0.95 0.94 0.57 0.75 1.0 76 0.71 0.79 0.78 0.65 0.75 0.83 0.64 1.0 0.77 0.77 0.85 0.83 0.66 0.75 0.50 0.83
52 0.78 0.90 0.89 0.48 na 0.88 0.65 0.67 0.65 0.68 0.64 0.69 0.81 0.73 na Na na na na na na na na
53 0.83 0.85 0.95 0.50 na 1.0 0.85 0.71 0.70 0.75 0.65 0.76 0.83 0.62 0.88 0.66 0.66 0.87 0.90 0.70 0.77 0.75 1.0
54 1.0 1.0 1.0 0.37 na 1.0 0.75 0.78 0.74 0.76 0.43 0.80 0.92 0.63 1.0 0.62 0.62 0.66 0.75 0.50 0.75 0.71 1.0
55 na Na na 0.51 0.8 na 0.61 0.72 0.75 0.78 0.43 0.92 0.85 0.68 0.7 0.5 0.50 0.80 0.60 0.54 0.60 0.70 0.90
56 0.88 1.0 1.0 0.62 0.72 1.0 0.76 0.75 0.59 0.67 0.64 0.72 0.80 0.71 0.71 0.9 0.90 0.85 0.88 0.80 0.88 0.71 0.83
57 0.89 0.88 0.88 na na 0.88 0.80 0.67 0.65 0.66 0.69 0.66 0.78 0.62 0.66 0.75 0.75 0.83 0.50 0.42 0.71 0.85 1.0
58 0.91 0.90 0.88 0.61 na 1.0 0.95 0.72 0.60 0.73 0.70 0.74 0.84 0.72 0.87 0.62 0.62 0.85 0.57 0.50 0.57 0.71 0.83
59 0.83 0.62 0.88 0.65 na na 0.60 0.59 0.51 0.71 0.80 0.66 0.77 0.69 na Na na na na na na na na
60 0.53 0.76 0.75 0.52 0.72 na 0.83 0.67 0.71 0.70 0.69 0.74 0.87 0.62 0.75 0.66 0.66 0.71 0.42 0.14 0.62 0.75 1.0
61 na Na na 0.66 0.77 na 0.77 0.81 0.85 0.82 0.55 0.79 0.81 0.67 0.66 0.75 0.75 1.0 0.71 0.62 0.71 0.85 1.0
62 0.87 Na na 0.75 na na 0.75 0.69 0.65 0.81 0.71 0.66 0.72 0.74 0.85 0.57 0.57 0.83 0.71 0.42 0.50 0.66 1.0
63 0.78 0.85 0.85 0.64 0.75 0.90 0.77 0.80 0.66 0.75 0.79 0.69 0.80 0.66 0.85 0.57 0.57 1.0 0.71 0.62 0.50 0.85 1.0
64 0.82 0.85 0.83 0.52 0.81 0.90 79 0.70 0.59 0.73 0.75 0.62 0.73 0.69 0.83 0.50 0.50 0.80 0.66 0.57 0.40 0.60 1.0
65 0.66 0.78 0.82 0.54 0.70 0.90 0.73 0.60 0.53 0.71 0.66 0.63 0.73 0.61 0.62 0.70 0.70 0.88 0.66 0.44 0.66 0.62 0.87
66 0.82 0.87 0.87 0.44 0.57 0.87 0.85 0.73 0.68 0.76 0.82 0.71 0.79 0.70 1.0 0.85 0.85 0.75 1.0 0.87 1.0 0.50 0.66
67 na Na na na na na na 0.40 0.62 0.66 na na na na 0.66 0.57 0.57 0.60 0.20 0.16 0.50 0.66 1.0
68 0.77 0.83 0.82 0.59 0.75 0.87 0.76 0.64 0.67 0.81 0.72 0.63 0.84 0.67 0.87 0.62 0.62 0.85 0.75 0.50 0.50 0.71 1.0
69 0.77 0.83 0.80 0.55 na 1.0 0.72 0.73 0.61 0.73 0.71 0.63 0.86 0.68 1.0 0.66 0.66 0.71 0.77 0.55 0.57 0.57 0.85
70 0.44 0.62 0.75 0.41 na na 0.5 0.79 0.73 0.74 0.80 0.72 0.72 0.65 0.88 0.80 0.80 0.87 0.77 0.55 0.42 0.57 0.85
71 0.84 0.80 0.90 0.41 na na 0.33 0.76 0.59 0.72 0.55 0.61 0.80 0.64 0.87 0.77 0.77 0.85 0.88 0.66 0.90 0.50 0.83
72 na Na na 0.37 na na 0.71 0.45 0.49 0.70 0.55 0.66 0.78 0.58 0.85 0.57 0.57 0.60 0.50 0.16 0.75 0.66 1.0
73 0.95 0.88 0.88 0.63 na 0.88 0.79 0.77 0.66 0.89 0.80 0.89 0.92 0.6 0.66 0.57 0.57 0.83 0.50 0.62 0.50 0.85 1.0
74 0.87 0.87 0.91 0.46 na 0.91 0.86 0.73 0.64 0.75 0.72 0.68 0.77 0.68 0.75 0.80 0.80 0.87 0.77 0.55 0.50 0.75 1.0
75 0.77 0.66 0.83 0.42 na na na 0.78 0.56 0.64 0.54 0.64 0.83 0.67 na Na na na na na 0.77 na na

98
Table 3.14: (cont.)
Genotype 24 25 26 27 28 29 30 31 32 33 34 35 36 37 38 39 40 41 42 43 44 45 46 47 48 49
25 0.25
26 0.30 0.80
27 0.28 na na
28 0.30 0.85 0.60 0.45
29 0.35 0.75 1.0 0.55 0.83
30 0.30 0.66 0.35 na 0.80 0.5
31 0.35 0.30 na 0.26 na 0.25 0.20
32 0.50 na na 0.60 na na na 0.55
33 0.52 0.87 0.5 na 0.62 0.85 1.0 0.50 0.50
34 0.51 0.88 0.54 na 0.66 0.71 0.85 na 0.45 0.57
35 0.52 1.0 0.60 na 0.75 0.83 1.0 na na 0.56 0.58
36 0.82 na 0.90 0.85 na na na na na na na 0.80
37 0.80 na na 0.84 na 0.66 na 0.58 0.60 na na 0.82 1.0
38 0.78 na 0.85 0.80 na na na na na na na 0.80 0.90 0.93
39 0.85 0.85 na 0.85 na 0.65 na na 0.55 na 0.70 na 0.85 0.77 0.73
40 na 0.50 na na na na na 0.62 na na na na na 0.58 0.54 0.4
41 0.82 na 0.85 0.80 na 0.80 na na na na na na 0.68 0.70 0.83 0.81 0.44
42 na na na na na na na na 0.61 na na na 0.75 1.0 1.0 1.0 na 1.0
43 na 0.57 0.40 na 0.66 0.87 0.85 na na 0.7 0.60 0.8 0.71 0.5 0.73 0.68 0.70 0.85 0.8
44 na 0.71 0.50 0.86 0.42 0.85 0.83 na na 0.81 0.71 0.78 0.75 0.66 0.82 0.72 0.81 0.73 0.87 0.47
45 na 0.57 0.54 na 0.66 0.71 0.85 na na 0.59 0.67 0.80 0.77 na 0.50 0.8 na 1.0 0.85 0.26 0.55
46 0.80 0.71 0.50 0.80 0.77 0.85 0.83 na na 0.69 0.47 0.62 0.77 na 0.66 0.66 na 1.0 0.85 0.43 0.52 0.54
47 Na na na na na na na na na na na na 0.86 0.92 0.80 0.44 na 0.82 1.0 na 0.14 0.55 na
48 Na 0.71 0.50 na 0.62 1.0 1.0 na na 0.5 0.70 0.90 0.85 0.81 0.84 0.62 0.72 0.77 0.88 0.43 0.38 0.55 0.64 0.60
49 Na 0.50 0.66 na 1.0 1.0 1.0 na na 0.81 0.75 0.77 0.89 0.75 0.78 0.60 0.60 0.72 1.0 0.38 0.50 0.64 0.64 0.47 0.56
50 Na na na na na na na na na 0.80 0.80 0.75 1.0 0.69 0.85 0.66 0.72 0.61 1.0 0.50 0.49 0.54 0.70 0.50 0.58 0.60
51 Na 0.71 0.50 na 0.42 0.85 0.83 na na 0.74 0.63 0.90 0.83 0.79 0.86 0.63 0.70 0.77 0.92 0.68 0.55 0.49 0.52 0.65 0.55 0.61
52 Na na na na na na na na na 0.45 0.45 0.63 0.89 0.84 0.72 0.56 0.70 0.80 0.86 0.61 0.52 0.55 0.53 0.72 0.48 0.70
53 Na 0.57 0.40 na 0.66 0.87 0.85 na na 0.60 0.60 0.76 0.87 0.88 0.78 0.65 na 0.71 0.91 0.68 0.61 0.63 0.52 0.60 0.63 0.57
54 Na 0.71 0.63 na 0.77 0.66 0.83 na na 0.66 0.37 0.62 0.83 0.83 0.63 0.63 na 0.88 0.93 0.62 0.65 0.35 0.5 0.77 0.69 0.84
55 Na 0.70 0.27 na 0.50 0.80 0.90 na na 0.54 0.45 0.50 na 0.62 0.88 0.75 0.90 0.85 na 0.52 0.32 0.62 0.63 0.63 0.64 0.57
56 Na 0.50 0.50 na 0.62 0.85 0.83 na na 0.80 0.70 0.90 0.88 0.83 0.71 0.70 0.54 0.90 0.85 0.47 0.64 0.54 0.55 0.43 0.55 0.55
57 Na 0.66 0.60 na 0.75 0.6 0.80 na na 0.42 0.28 0.57 0.82 0.81 0.66 0.61 0.50 0.77 0.86 0.40 0.59 0.44 0.56 0.72 0.60 0.48
58 Na 0.87 0.63 na 0.42 0.66 0.83 na na 0.71 0.65 0.71 0.9 0.70 0.73 0.59 0.30 0.73 0.85 0.45 0.55 0.45 0.53 0.72 0.60 0.69
59 Na na na na na na na na na 0.92 0.72 0.80 0.80 0.25 0.62 0.55 0.63 0.81 0.87 0.44 0.57 0.62 0.51 na na 0.50
60 Na 0.75 0.54 na 0.66 0.71 0.85 na na 0.54 0.48 0.59 na 0.5 0.83 0.44 0.40 0.50 na 0.43 0.63 0.58 0.56 0.58 0.70 0.55
61 Na 0.66 0.60 na 0.57 0.83 0.80 na na 0.42 0.66 0.75 na 0.33 0.6 0.60 0.54 0.66 na 0.46 0.42 0.57 0.76 0.72 0.68 0.65
62 Na 0.85 0.44 na 0.57 1.0 1.0 na na 0.62 0.66 0.75 0.92 0.68 0.80 0.64 0.83 0.87 0.91 0.68 0.59 0.64 0.55 na 0.51 0.50
63 Na 0.85 0.60 na 0.33 0.83 0.80 na na 0.48 0.58 0.73 0.84 0.83 0.76 0.61 0.54 0.78 0.91 0.72 0.62 0.66 0.61 0.77 0.57 0.66
64 Na 0.83 0.55 na 0.50 1.0 1.0 na na 0.55 0.63 0.76 0.89 0.84 0.76 0.68 0.54 0.79 0.86 0.68 0.63 0.64 0.55 0.64 0.64 0.69
65 Na 0.77 0.11 na 0.55 1.0 1.0 na na 0.58 0.63 0.74 0.85 0.77 0.69 0.49 0.45 0.81 0.95 0.60 0.59 0.63 0.52 0.69 0.42 0.56
66 Na 0.80 0.66 na 0.85 1.0 1.0 na na 1.0 0.88 0.85 0.91 0.80 0.73 0.63 0.45 0.75 0.91 0.67 0.74 0.65 0.56 0.75 0.59 0.65
67 Na 0.85 0.60 na 0.75 0.83 1.0 na na 0.62 0.66 0.33 na na na na na na na 0.66 0.57 0.66 0.62 na 0.77 0.66
68 Na 0.71 0.50 na 0.42 0.85 0.83 na na 0.52 0.60 0.79 0.88 0.83 0.83 0.73 0.54 0.69 0.87 0.58 0.57 0.64 0.54 0.80 0.51 0.68
69 Na 0.75 0.54 na 0.50 0.71 0.85 na na 0.72 0.60 0.75 0.70 0.84 0.82 0.62 0.60 0.77 0.94 0.36 0.61 0.46 0.69 0.62 0.58 0.66
70 Na 0.75 0.40 na 0.66 0.87 0.85 na na 0.79 0.58 0.66 na 0.75 0.83 0.44 0.54 0.66 na 0.43 0.61 0.60 0.55 na 0.61 0.68
71 Na 0.71 0.33 na 0.62 1.0 1.0 na na 0.50 0.66 0.72 0.85 na 0.71 0.71 na 1.0 0.75 0.43 0.59 0.48 0.63 na 0.35 0.69
72 Na 0.85 0.60 na 0.75 0.83 1.0 na na 0.42 0.66 0.57 0.80 0.36 0.56 0.50 0.27 0.75 0.87 0.60 0.56 0.50 0.47 na 0.62 0.85
73 Na 0.66 0.72 na 0.57 0.60 0.80 na na 0.42 0.66 0.57 0.83 0.92 0.90 0.78 na 0.74 1.0 0.66 0.66 0.50 0.58 0.72 0.64 0.63
74 Na 0.57 0.40 na 0.66 0.87 0.85 na na 0.62 0.51 0.77 0.81 0.95 0.86 0.55 na 0.84 0.92 0.37 0.60 0.49 0.52 0.86 0.62 0.60
75 Na na na na na na na na na 0.77 0.77 0.50 0.88 0.54 0.68 0.55 0.45 0.85 0.83
0.46 0.66 0.38 0.69 na na 0.66

99
Table 3.14: (cont.)
Genotypes 50 51 52 53 54 55 56 57 58 59 60 61 62 63 64 65 66 67 68 69 70 71 72 73 74
51 0.52
52 0.70 0.56
53 0.52 0.48 0.58
54 0.38 0.56 0.43 0.54
55 0.57 0.48 0.58 0.46 0.35
56 0.58 0.56 0.34 0.45 0.51 0.46
57 0.52 0.48 0.50 0.59 0.52 0.59 0.49
58 0.58 0.56 0.56 0.58 0.40 0.65 0.54 0.46
59 0.55 0.39 0.53 0.41 0.47 0.58 0.37 0.45 0.39
60 0.59 0.47 0.46 0.53 0.55 0.52 0.53 0.43 0.44 0.45
61 0.54 0.50 0.62 0.54 0.62 0.43 0.48 0.51 0.46 0.14 0.39
62 0.59 0.53 0.62 0.61 0.71 0.59 0.63 0.64 0.69 0.56 0.55 0.48
63 0.62 0.54 0.50 0.52 0.68 0.62 0.53 0.51 0.59 0.60 0.48 0.49 0.40
64 0.65 0.56 0.64 0.58 0.68 0.57 0.52 0.65 0.53 0.61 0.52 0.56 0.42 0.46
65 0.67 0.48 0.70 0.54 0.67 0.53 0.52 0.55 0.54 0.50 0.52 0.58 0.51 0.47 0.40
66 0.51 0.51 0.58 0.51 0.63 0.60 0.55 0.63 0.69 0.53 0.58 0.66 0.56 0.47 0.52 0.48
67 na 0.77 na 0.80 0.62 0.50 0.62 0.33 0.62 na 0.28 0.57 0.57 0.75 0.50 0.55 0.85
68 0.56 0.49 0.59 0.51 0.70 0.64 0.52 0.54 0.64 0.68 0.45 0.54 0.38 0.26 0.41 0.48 0.42 0.62
69 0.67 0.58 0.65 0.65 0.52 0.56 0.64 0.54 0.64 0.52 0.62 0.72 0.68 0.70 0.69 0.59 0.63 0.66 0.64
70 0.64 0.62 0.65 0.66 0.47 0.59 0.63 0.62 0.60 0.56 0.63 0.75 0.75 0.66 0.62 0.56 0.51 0.66 0.60 0.34
71 0.49 0.48 0.44 0.51 0.48 0.43 0.44 0.55 0.64 0.60 0.66 0.56 0.58 0.62 0.61 0.48 0.59 0.77 0.58 0.50 0.55
72 0.51 0.59 0.62 0.47 0.43 0.58 0.61 0.55 0.39 0.34 0.29 0.43 0.62 0.62 0.54 0.47 0.55 0.33 0.43 0.41 0.48 0.54
73 0.69 0.71 0.64 0.66 0.59 0.61 0.67 0.47 0.56 0.50 0.55 0.59 0.70 0.53 0.74 0.62 0.65 0.57 0.57 0.42 0.34 0.69 0.57
74 0.66 0.55 0.37 0.45 0.61 0.45 0.44 0.43 0.56 0.51 0.48 0.5 0.59 0.76 0.57 0.45 0.67 0.66 0.50 0.60 0.56 0.46 0.46 0.6
75 0.63 0.70 0.6 0.68 0.44 0.77 0.45 0.58 0.57 0.55 0.59 0.5 0.58 0.78 0.59 0.63 0.51 na 0.62 0.35 0.37 0.49 0.45 na 0.48

100
3.3.1.3 Discussion
Previously morphological, cytological and biochemical markers were used for
estimation of genetic diversity in commercially important crop species. However,
with the recent developments in DNA technology, molecular markers based on the
variation in DNA base sequences have been widely used in cop improvement
(Paterson et al., 1991; Raflaski et al., 1996; Sumikova & Kernlova, 2010; Todorovska et
al., 2009; Wang et al., 2007). Various DNA based markers commonly used to estimate
genetic diversity in crops of agronomic importance include Restriction Fragment
Length Polymorphism (RLFP), Simple Sequence Repeat (SSR), Amplified Fragment
Length Polymorphism (AFLP) and Single Nucleotide Polymorphism (SNP) (Chen et
al., 2006). These procedures though highly reliable, are expensive, time consuming
and some time require working with hazardous chemicals (e.g. use of radioactive
P32). In contrast, RAPD analysis is not only easier, quicker, cheaper and more user’s
friendly assay procedure but has an added advantage that RAPD primers do not
require any prior sequence information on the target genome (Williams et al., 1990).
Hence RAPD analysis is more suitable for handling larger germplasm
accessions/segregating populations of commercially important crops like tea in the
developing countries where technical expertise and financial support for scientific
research are limiting factors.
Genetic diversity in tea has been studied by various workers using DNA based
markers (Kaundun & Park, 2002; Chen et al., 1998, 2005b; Chen & Yamaguchi, 2002;
Paul et al., 1997; Luo et al., 2002; Shao et al., 2003; Kaundun & Matsumoto, 2003;
Duan et al., 2004; Huang et al., 2004; Huang et al., 2006; Yao et al., 2007; Hou et al.,

101
2007; Chen et al., 2007; Gul et al., 2007). The average number of amplified fragments
during present study were 4.0 per primer per genotype which was a little higher
than reported in some earlier studies (Chen et al., 2005a) who reported
approximately 3.5 alleles per primer per genotype. It may be because in earlier
study (Chen et al., 2005a) selected elite genotypes were used where most favored
alleles are retained as compared to the rare ones. Relatively higher genetic distances
estimated during present study could result from the fact that material used
belonged to various geographical regions in contrast to previous study e.g. Chen et
al., (2005b) who used Chinese genotypes which were established from a limited
gene stock. Results of cluster analyses revealed that the cultivars belonging to the
type of C. assamica and type of C. sinensis were grouped in same cluster like cluster
A comprised IN-01-07 (C. assamica) and CL-01-05 (C. sinensis) genotypes together,
but both were clearly separated by sub-groups A1 and A2. Similarly Cluster B also
included SL-01-05(C. assamica) genotypes and small leaved tea (C. sinensis)
genotypes but surprisingly in separated subgroups. This indicated that gene
introgression occurred between these two types because of the crosspollination
during long-term cultivation and improvement. High frequency of missing data
(Table 3.14) might have a certain influence on the result of cluster analysis. This
pattern of our results was in agreement with previous reports (Chen et al., 2005b;
Ariyarathna & Gunasekare, 2006) where various taxa tend to cluster in one group.
The data shown by dendrogram were in accord with the conventional classification
of tea taxa except that the two broad leaved genotypes (IN-01-07 and SL-01-05)
belonging to type of C. assamica were distantly separated from each other with

102
diversity of more than 80% while in previous sections of morphological and
phytochemical dendrogram analysis, the two genotypes were clustered together.
The higher genetic diversity within assamica was in contradiction to previously
observed diversity with dominant RAPD (Wachira et al., 1995) and AFLP assays
(Paul et al., 1997), but also with co-dominant CAPS markers (Kaundun &
Matsumoto, 2003). The conflicting results between RAPD and other markers could
be due to the small sample size studied during present analyses. Another reason
might be less number of RAPD primers used during present study and missing data,
hence it is suggested that more RAPD primers may be utilized for genetic diversity
analysis in future. Range of diversity shows the potential for selecton. The data
presented here will help in establishing maximization strategies for tea in Pakistan.
The range of diversity exhibited by the genotypes studied shows potential for
selection. In this respect priority should be given to the marginal genotypes
(belonging to group A and group D, Fig. 3.14) which appeared most distantly
related.
3.3.2 Molecular Characterization of Tea using SSR Markers
3.3.2.1 Results
To estimate the genetic diversity among 130 accessions of tea, 15 SSR primer pairs
developed by Freeman et al., (2004) (Table 2.5) were tested initially. Twelve of the 15
primer pairs, were chosen for detailed studies. Those 12 SSR pairs were chosen
which generated the clearest polymorphic bands. The preliminary results showed
that only 103 accessions produced polymorphic bands with 12 SSR primer pairs. The
103
number of alleles per SSR marker varied from 3 to 10 with an average of 6.25. A total
of 75 different alleles were detected. The PCR fragments ranged in size from 100 to
750 bp while most of the fragments were below 500 bp in size. Few examples of PCR
amplifications using SSR primer sets are presented in figure 3.10, 3.11, 3.12, 3.13 and
3.14 using Ca10, Ca14, Ca08, Ca12 and Ca05 primers pairs, respectively. Only
reliably scoreable bands were included in analysis; unstable and weak bands were
not scored for data analysis. For genetic diversity estimates, every scorable band was
considered as single allele/locus and was scored as 1 (presence) or 0 (absence) and a
bivariate data matrix was generated for each SSR primer pair. The bivariate 1-0 data
were used for estimation of Genetic Distance (GD) following Unweighted Pair
Group of Arithmetic mean (UPGMA) procedures proposed by Nei & Li, (1979).
Estimates of average Genetic Distances (GD) using 12 SSR primers ranged from 0 –
100% (Table 3.16). Moderate to high genetic distance estimates (GD = >50%) were
observed for most of the comparisons. While a number of comparisons showed
complete homozygosity (GD = 0%) for the loci detected using the 12 SSR primers.
For the study of phylogenetic relationships among the tea genotypes used during present
study, bivariate (1-0) data was also used for construction of dendrogram using computer
package “Popgene ver. 32” (Yeh et al., 1999).

104
Figure 3.10 Polymorphism detected using SSR primer Ca10. M= Molecular size marker. Size of the amplified fragments (in bp) is presented on right. 1=CL-02, 2= CL-01, 3= Ch-12, 4= Ch-10, 5= Ch-07, 6= CL-06, 7= Ch-05.
1000 bp
500 bp

105
Figure 3.11 Polymorphism detected using SSR primer Ca14. R=Roupi CL= CL-01-05 tea. M=Molecular size marker. Size of the
amplified fragments (in bp) is presented on right.
Figure 3.13 Polymorphism detected using SSR
primer Ca12. Q= Qi-men, Ch= Chuye. M=
Molecular size marker. Size of the amplified
fragments (in bp) is presented on right.
Figure 3.12 Polymorphism detected using SSR primer Ca08. Rp= Roupi. M=Molecular size marker. Size of the
amplified fragments (in bp) is presented on right.
Figure 3.14 Polymorphism detected using SSR primer Ca05. M=Molecular size marker. Size
of the amplified fragments (in bp) is
presented on right.
1000 bp
1000 bp
1000 bp
1000 bp
500 bp
500 bp
500 bp
500 bp

106
Figure 3.15. Dendrogram constructed for 103 tea genotypes using PCR with 12 SSR primers
100
Coefficient (%)
C
0 25 50 75
A2
B
B1
B2
A1
A
E
D
C1
C2

107
Table 3.15. Samples of tea genotypes used in SSR analysis
Genotype name No. of Samples Samples Id
CL-01-05 7 (1-9) CL-01, CL02, CL-03, CL-05, CL-06, CL-08, CL-09, CL-10,
CL-11
Chuye 7 (9-16) Ch-01, Ch-02, Ch-05, Ch-07, Ch-10, Ch-12 & Ch-15
Roupi 8 (17-24) Rp-01, Rp-02, Rp-04, Rp-06, Rp-07, Rp-08, Rp-10, & Rp-20
Qi-Men 8 (25-32) Q-01, Q-02, Q-03, Q-04, Q-05, Q-07, Q-08 & Q-10
T-05-10 9 (33-41) T-01, T-04, T-05, T-05, T-07, T-08, T-09, T-10, T14 & T-15
JP-01-05 7 (42-48) JP-02, JP-03, JP-04, JP-06, JP-08, JP-13, & JP-18
SL-01-05 7 (49-55) SL-01, SL-02, SL-03 SL-04, SL-05, SL-06 & SL-07
IN-01-07 5 (56-60) Ind-01, Ind-04, Ind-05, Ind-07, & Ind-08
Ich-08 7 (61-67) Ich-08-1, Ich-08-2, Ich-08-04, Ich-08-05, Ich-08-07, Ich-08-09
& Ich-08-10
Ich-05 10 (68-78) Ich-05-1, Ich-05-4, Ich-05-5, Ich-05-6, Ich-05-7, Ich-05-8,
Ich-05-9, Ich-05-10, Ich-05-11 & Ich-05-12
Ich-09 9 (81-89) Ich-09-2, Ich-09-3, Ich-09-1, Ich-09-4, Ich-09-5, Ich-09-7,
Ich-09-8, Ich-09-9 & Ich-09-10
Ich-04 8 (79-80 & 90-95) Ich-04-3, Ich-04-5, Ich-04-1, Ich-04-2, Ich-04-4, Ich-04-6,
Ich-04-8 & Ich-04-9
Ich-07 8 (96-103) Ich-07-2, Ich-07-4, Ich-07-5, Ich-07-6, Ich-07-7, Ich-07-8,
Ich-07-9 & Ich-07-10

108
A dendrogram obtained from individual pair wise comparisons of the 87 bands
among 103 genotypes based on Unweighted Pair Group of Arithmetic means
(UPGMA) is shown in Figure 3.12. The dendrogram generated main five clusters viz;
A, B, C, D and E comprising 29, 20, 22, 14 and 18 genotypes, respectively.
Numbering of samples in dendrogram is same as mentioned in table 3.15.
Cluster A was the largest group comprising of 29 genotypes. This cluster
predominantly contained narrow leaved pure china type tea genotypes (viz. CL-01-
05, Roupi, Chuye and Qi-Men) collected from the same location (NTRI). Cluster A
was further divided into two sub-clusters A1 and A2 comprising 13 and 16
genotypes, respectively. Sub-cluster A1 consisted all of the samples from CL-01-05
genotype together with four samples of Roupi genotype. Sub-cluster A2 containing
16 genotypes contained 6, 5, 4 and 1 sample belonged to Chuye, Qi-Men, Roupi and
CL-01-05 genotypes, respectively. Chuye, Roupi and Qi-Men genotypes were
cultivated as mother bushes at the time of starting tea cultivation in Pakistan and
almost all of the present cultivation in the area is propagated from these genotypes.
Cluster B consisted of 20 tea samples and divided into two sub-clusters B1 and B2.
B1 showed a mixed pattern of clustering genotypes and comprised 10 samples, 3
samples each from Qi-Men and JP-01-05 genotypes while 1 each from T-05-10, Ich-
05, Chuye and SL-01-05 genotypes. Sub-cluster B2 which comprised 10 samples, was
interesting with respect to clustering most of the broad leaved Indian type genotypes
(SL-01-05and IN-01-07) together with small leaved china like type genotypes of
unknown taxa i.e. JP-01-05 and T-05-10 genotypes. Genotypes clustered in this group
109
were collected from same location (NTRI) and did not include any pure China type
teas.
Cluster C containing 22 samples was also subdivided into two sub-clusters as C1
and C2 containing 8 and 14 samples, respectively. C1 showed a mixed pattern of
samples as was shown in sub-cluster B2. It consisted of 3, 2, 2 and 1 samples from
SL-01-05, IN-01-07, JP-01-05 and T-05-10 genotypes, respectively, being non pure
China type genotypes collected from NTRI. Sub-cluster C2 comprised 4, 4, 3 and 2
samples from T-05-10, Ich-07, Ich-05 and Ich-09 genotypes, respectively. The latter
three genotypes were grouped together in this cluster which is characterized as
narrow leaved china like teas collected from the same site in Uniliver Tea Research
Station (UTSI) Icherian Mansehra. The Genetic distance between sub-clusters C1 and
C2 was more than 60% as shown in dendrogram.
Cluster D included 14 genotypes collected from UTSI showing mixed pattern among
which 5 samples belonged to Ich-08, 5 to Ich-09 and 3 to Ich-07 genotype. All these
samples being collected from same location may have same origin. Samples in
cluster D were morphologically different from other genotypes in cluster A, B and C.
Cluster E comprised 18 samples having same mixed pattern of genotypes as shown
in cluster D. This cluster did not include any of the assami and china type teas from
NTRI collection. All of the samples were from UTSI collection with unknown origin.
Almost all of the samples of Ich-05 genotype, 4 samples of Ich-09, 5 samples of Ich-04
and 2 samples of Ich-07 genotype were grouped together in cluster E.
Overall, Cluster A predominantly included all C. sinensis (pure china tea) genotypes
from NTRI, cluster B comprised C. assamica (India type) genotypes collected from
110
NTRI Shinkiari, cluster C included mixed genotypes both from NTRI and UTSI
collections, cluster D and Cluster E predominantly comprised all of the China like
narrow leaved genotypes collected from UTSI Icherian.
3.3.2.2 Discussion
To evaluate genetic variability within and among tea genotypes cultivated in
Pakistan, 15 microsatellite markers were tested during present study. During past
few years, tea germplasm has routinely been characterized by using a number of
descriptors, such as morphological characteristics, phytochemicals and terpenoid
indices etc. Although, these descriptors are valuable for tea group identification at
the varietal level, it has been argued that these descriptors are limited at the levels of
inter- and intra-varietal polymorphism and may not account for all the diversity in
the species because most of them are largely affected by environmental and
developmental factors. Being a heterogeneous plant with many overlapping
morphological, biochemical and physiological attributes, the tea plant shows a
continuous variation and a high degree of plasticity. That is why; it has been proven
difficult to identify the discrete taxonomic groups in tea. As an efficient, auxiliary
means to distinguish intra- or inter-specific variation of tea germplasms, recently
attention has been focused on the use of different molecular markers which are
useful and sufficient to characterize and differentiate the tea varieties and
cultivars(Mondal, 2002; Chen & Yamaguchi, 2005; Chen et al., 2005b).
Previously, genetic variability of tea plants has also been studied with different
molecular techniques like restriction fragment length polymorphism (RFLP)
(Matsumoto et al., 1994, 2004), amplified fragment length polymorph (AFLP) (Paul et

111
al., 1997), and randomly amplified polymorphic DNA (RAPD) (Kaundun et al., 2000;
Kaundun & Park 2002; Park et al., 2002; Chen et al., 1998, 2005b) markers. RFLP is co-
dominant and highly reliable, however, the use of RFLP assays is limited by their
slowness, the need for clone bank, use of hazardous chemicals and requirement for
large amounts of DNA. RAPD is a dominant marker and may over come many of
the technical limitations of RFLP but has proved sensitive to experimental conditions
and as a result questions have been raised about their reproducibility. ALFP is also
dominant marker but the requirement of radioactive labeling and relatively better
quantitative and qualitative DNA requirement also limits the utilization of AFLP in
every laboratory. Microsatellite (SSR) markers overcome these problems. Therefore,
identification of highly reliable molecular tools such as microsatellite or SSR markers
is extremely important to reveal the unexplored genetic variation in tea.
Despite the obvious advantages of microsatellite markers in terms of inferring allelic
variation, estimating genetic diversity and development of genetic linkage maps
(Gupta & Varshney, 2000), only a few microsatellite makers have been developed for
tea plants (Kaundun & Matsumoto, 2002; Freeman et al., 2004; Hung et al., 2007; Zhao
et al., 2007; Sharma, et al., 2009).
The present study employed markers of Freeman et al., (2004) and successfully
detected polymorphisms within and among tea genotypes that have been
maintained for a couple of decades. Variation among tea accessions observed at
molecular level using SRR primers, resolved 103 tea genotypes into five main
clusters. Both the analyses (using RAPDs and SSRs) showed similar clustering with
few minor differences. In both analyses, sub-cluster A2 predominantly comprised

112
samples from CL-01-05 genotype collected from NTRI Shinkiari plantations.
Although in SSR analysis the broad leaved (i.e. IN-01-07 and SL-01-05) genotypes
were not clearly separated from narrow leaved China genotypes by main clusters
but were clustered in a mixed pattern in two nearest sub-clusters (B2 & C1) together.
However, these genotypes were clustered in sub-group B2 and C1 with T-05-10 and
JP-01-05 genotypes which appeared to be China type morphologically but still
unknown taxonomically because they were brought from Turkey and Japan,
respectively. It was stated by some authors (Nesumi & Takeda, 2006; Caffin et al.,
2004) in literature that the origin of most of the cultivars and accession in these
countries was from China besides local wild and some hybrid clones. Though the
status of these narrow leaved tea is not known, still their clustering with SL-01-05
and IN-01-07 genotypes inferred that they may be hybrid of Assam (C. assamica) and
china (C. sinensis)/or other teas. Genetic distances within samples of these groups
were lower than 50% while among the genotypes it was about or more than 50%. It
was also obvious from dendrogram analysis that major cluster A predominantly
comprised all pure China genotypes collected from NTRI, while major cluster D and
E comprised all the China like genotypes collected from UTSI Icherian. These results
were in agreement to some extent with that of the reputed classification of tea taxa
accepted worldwide.
SSR primers used in present study were developed for the tea plant (Freeman et al.,
2004) and have been evaluated for polymorphism in a set of tea clones to determine
their usefulness for authentication purposes. Most of the SSRs were proven to be
highly polymorphic both between and within different geographical origins of tea

113
and offered a potential value to investigate the population genetics and genetic
origins of tea plant.
Our results have also been supported by Mondal, (2002), who analyzed Twenty-five
diverse tea cultivars using the simple sequence repeat anchored polymerase chain
reaction (SSR-anchored PCR). Three distinct clusters of Cambod, Assam and China
type were revealed, which concurs with the known taxonomical classification of tea.
These results also suggested that this method can be used for genetic fingerprinting
and taxonomic classification of tea genotypes.
During present study genetic diversity revealed was higher among main groups
than within group diversity. These results contradict the findings of Lai et al. (2001),
who reported larger genetic diversity within populations than among populations.
The reason might be a broader range of geographical origins of plant material in
present analysis.
Conclusion and Recommendations
Results obtained from the present study concluded that what so ever the criteria for
evaluation is i. e. quantitative, qualitative, phytochemical, SSRs or RAPD; the results
revealed that all the genotypes studied are significantly different from one another
with respect to genetic polymorphism.
Further more all the genotypes cultivated or available in the genebank in Pakistan,
segregated into two morphologically distinct taxons i. e. the braod leaved Camellia
assamica and narrow leaved Camellia sinensis. It was also observed that within these
groups the genotypes were further separated into a number of sub groups which
shows different levels of introgression and gene mixing due to geographical origin.
114
Phytochemical characterization also showed similar results to phenotypic trait
analysis dividing the genotypes into two categories. RAPD and SSR based
techniques differentiated all the genotypes into main and sub-clusters individually.
Both RAPD and SSR analyses provided almost similar clustering patterns in tea.
In conclusion, our results indicate that there is high diversity in the populations of
tea genotypes. This high level of genetic diversity and variation provides basis for
the breeding programs and breeding strategies. The level of diversity exhibited by
the limited number of genotypes studied is indicative of that genetic diversity that
may existed in nature. Hence, the need for studying, documenting, preserving and
utilizing genetic variation.
Among the tea genotypes cultivated in Pakistan viz. Qimen, Roupi, Chuye, CL-01-
05, JP-01-05, T-05-10, SL-01-05, IN-01-07, Ich-04, Ich-05, Ich-07, Ich-08 and Ich-09 are
low in polyphenols, Caffeine and amino acid contents; hence, the lower quality of
tea. The genotypes CL-01-05 and Ich-08 apparantly seem vigorous and have the
highest tea quality components. As the polyphenols contents were high in CL-01-05,
T-05-10 and Ich-08, clones of these genotypes need to be improved for better quality
of tea.
Tea production has been successfully demonstrated in Pakistan. It is labor intensive
crop and large scale plantation on the identified areas and identifying new areas for
tea plantation is imperative for self sufficiency of tea production in Pakistan. It was
noted that thirteen tea genotypes are available as tea germoplasm in Pakistan, hence,
only seven of them are used for large scale cultivation based on adaptability to local

115
agroclimate. Introduction and testing of the remaining accessions germplasm need
to be started for improvment of tea. At the same time new germplasm needs to be
imported from centres of diversity for broadening the gene pool and thus increasing
the probability of increasing high yielding, high quality and well adjusted varieties.
The quality of tea infusion is largly determined by its polyphenols and caffeine
which are higher on higher altitude. Most of the tea plantation is in the plain area on
farmer’s field, hence, it is suggested that tea plantation should be undertaken on
higher altitudes to get rather better quality tea.
Tea takes long time for harvestable yield of tea, confined to terminal top leaves and a
bud. Yield and quality of tea are the traits which require several years to develop.
Molecular markers linked to one of this Quantitative Trait Loci (QTL) should be
made available for selection which could potentially shorten the tea breeding cycle.
Further research needs to undertaken to identify markers for early selection at the
nursery stage for various biotic and abiotic stresses.
Breeding programs needs to be started for evolving improved varieties through
crossing of selected genotypes and using micropropagation techniques.Tea industry
needs to be involved in maximization of tea cultivation in Pakistan.
Acknowledgment
We feel previliged to acknowledge the generous financial support of Higher Education
Commission (HEC), Government of Pakistan, Islamabad, for completion of this research
endeavor, extending over five long years. The financial support was provided under
“Indigenous PhD Scholarship-5000 Program of HEC.

116
REFRENCES
Ahmad, H. 2009. Ecology and biodiversity of the Siren River catchment. In: I. Ali and
H. Ahmad (edts). Proceeding of the National Conference held at Baragali,
August 22-26, 2006.
Ahmad, N and H. Mukhtar. 1999. Green tea polyphenol and cancer: biologic
mechanisms and practical implications. Nutr. Rev. 57: 78– 83.
Akbar, N., H. Ahmad, S. Ghafoor, K. Begum, S. G. Afridi, I. Muhammad and I. A.
Khan. 2010. Estimation of Genetic Diversity in Capsicum Germplasm using
Randomly Amplified Polymorphic DNA. Asian J. Agri. Sci. 2: 53-56.
Anonymous. 1982. A report on the feasibility of tea cultivation in Pakistan. Chinese
team of tea experts. PARC, Islamabad.
Anonymous. 1989. Estimation of economic feasibility of tea cultivation in Pakistan.
Pak China team of tea experts. PARC, Islamabad.
Anonymous. 1997. Descriptors for tea (Camellia sinensis). International Plant Genetic
Resources Institute (IPGRI), Rome, Italy. 50 pp.
Anonymous. 2005. Letter Responding to Health Claim Petition: Green Tea and
Reduced Risk of Cancer Health Claim. U.S. Food and Drug Administration.
Docket number 2004Q-0083.
Anonymous. 2006a. Black and Green Tea: How do they differ? UK Tea Council
Report. www.tea.co.uk.
Anonymous. 2006b. Qualified Health Claims: Letter of Denial – Green Tea and
Reduced Risk of Cardiovascular Disease. U.S. Food and Drug Administration.
Docket number 2005. Q-0297.

117
Anonymous. 2009a. FAO (Food and Agriculture Organization of the United
Nations). FAOSTAT Agriculture.
http://faostat.fao.org/faostat/collections?subset=agriculture.
Anonymous. 2009b. International tea committee. Annual bulletin of statistics.
http://www.inttea.com/services.asp.
Anonymous. 2010a. Economic Survey 2008-2009. Federal Bureau of Statistics,
Government of Pakistan, Islamabad.
Anonymous. 2010b. Pakistan Tea Association, Karachi.
http://www.pakistanteaassociation.com/statistics.html.
Arnaud, M. J. 1987. The Pharmacology of Caffeine. Prog. Drug. Res. 31: 273-313.
Ashihara, H., H. Shimizu and Y. Takeda. 1995. Caffeine metabolism in high and low
caffeine containing cultivars of Camellia sinensis. Z. Naturforsch. 50: 602–607.
Athayde, M. L., G. C. Coelho and E. P. Schenkel. 2000. Caffeine and theobromine in
epicuticular wax of Ilex paraguariensis A. St. Hil. Phytochemistry 55: 853–857.
Balasaravanan, T., P. K. Pius, R. R. Kumar, N. Muraleedharan and K. Shasany. 2003.
Genetic diversity among south Indian tea germplasm (Camellia sinensis, C.
assamica and C. assamica spp. lasiocalyx) using AFLP markers. Plant Sci. 165:
365–372.
Banerjee, B. 1987. Can leaf aspect affect herbivory? A case study with tea. Ecology 68:
839-843.
Banerjee, B. 1992. Botanical classification of tea. In K. C Wilson and M. N. Clifford
(Eds) Tea cultivation to consumption. Chapman and Hall, London. 25–51 pp.

118
Banerjee, B. 1993. History of tea, Tea production and processing. Oxford and IBH
publishing CO. Pvt Ltd. New Delhi. 1-8 pp.
Barone, J. J and H. R. Roberts. 1996. Caffeine Consumption, Food Chem. Toxicol. 34:
119-129.
Barua, D. N., 1958. Leaf scleroids in the taxonomy of the Thea camellias. I. Wilson’s
and related camellias. Phytomorphology 8: 257 – 264.
Barua, D. N. 1963. Classification of tea plant. Two and a Bud 10: 3–11.
Barua, D. N. 1965. Classification of tea plant: species hybrids. Two and a Bud 12: 13-
27.
Barua, D. N and A. C. Dutta. 1959. Leaf scleroids in taxonomy of Thea camellias II.
Camellia sinensis L. Phytomorphology 9: 372 – 382.
Bassam, B. J and S. Bentley. 1995. Electrophoresis of polyester backed
polyacrylamide gels. Biotech. 19: 568-573.
Bassam, B. J., C. G. Anolles and P. M. Grehoff. 1991. Fast and sensitive silver staining
of DNA in polyacrylamide gels. Anal. Biochem. 196: 80-83.
Baumann, G and V. Stangl. 2004. The tea flavonoid epigallocatechin-3-gallate
reduces cytokine-induced VCAM-1 expression and monocyte adhesion to
endothelial cells. Biochem. Biophys. Res. Commun. 316: 659– 665.
Begum, K., H. Ahmad, S. U. Ghafoor, S. G. Afridi, I. Muhammad and I. A. Khan.
2010. Identification of Rapd Primers Linked to Leaf Rust Resistant Gene Lr51
Introgressed from Triticum speltoides to Common Wheat (Triticum aestivum L.).
Curr. Res. J. Biologic. Sci. 2: 226-228.

119
Belaj, A., I. Trujilo, R. Rosa, L. Rallo and M. J. Gimenez. 2001. Polymorphism and
discrimination capacity of randomly amplified polymorphic markers in an
olive germplasm bank. J. Am. Soc. Hort. Sci. 126: 64–71.
Bezbaruah, H. P. 1971. Cytological investigation in the family thecae-I. Chromosome
numbers in some Camellia species and allied genera. Carylogia 24: 421–426.
Bhatia, I. S and M. R. Ullah. 1968. Polyphenols of tea-studies with different organs
and some cultivated varieties of tea. J. Sc. Food Agr. 19: 535-542.
Bibi, S., H. Ahmad, S. Ghafoor, K. Begum, S. G. Afridi and I. A. Khan. 2010. Genetic
analysis of some commonly grown genotypes of maize in Pakistan using
maize specific Simple Sequence Repeat (SSR) primers. Curr. Res. J. Biol. Sci. 2:
259-261.
Blumberg, J. 2003. Introduction to the Proceedings of the third international scientific
symposium on tea and human health: role of flavonoids in the diet. J. Nutr.
133: 3244-3246.
Bonheur, D. 1991. The Tropical Agriculturalist: Tea, Macmillan Education LTD,
London. 51 pp.
Bordoni, A., S. Hrelia, C. Angeloni, E. Giordano, C. Guarnieri, C. M. Caldarera and
P. L. Biagi. 2002. Green tea protection of hypoxia/reoxygenation injury in
cultured cardiac cells. J. Nutr. Biochem. 13: 103–111.
Botstein, D., White, R. L, Skolnick, M and R. W. Davis. 1980. Construction of a
genetic linkage map in man using restriction fragment length polymorphisms.
Am. J. Human Genet. 32: 314–331.

120
Bravo, L. 1998. Polyphenols: chemistry, dietary source, metabolism and nutritional
significance. Nutr. Rev. 56: 317–333.
Brown, A. G., C. P. Falsaw, E. Halsam, A. Holmes and W. D. Ollis. 1966. The
constitution of theaflavins. Tetrahedron Lett. 11: 1193–1204.
Browning, J. A. 1988. Current thinking on the use of diversity to buffer small grains
against highly epidemic and variable foliar pathogens: Problems and future
prospects. IN CIMMYT, Breeding strategies for resistance to the rusts of
wheat. Mexico. D.F. CIMMYT. 76-90 pp.
Buschman, J. L. 1998. Green Tea and Cancer in Humans: A Review of the Literature.
Nutr. Cancer 31: 151–159.
Butt, M. S and M. T. Suleman. 2009. Green Tea: Nature’s Defence against
Malignancies. Crit. Rev. Food Sci. Nut. 49: 463-473.
Cabrera, C., R. Gimenez and C. M. Lopez. 2003. Determination of Tea Components
with Antioxidant Activity. J. Agric. Food Chem. 51: 4427-4435.
Caetano-Anolles, G., B. J. Bassam and P. M. Gresshoff. 1991. DNA amplification
fingerprinting using very short arbitrary oligonucleotide primers. Biotech. 553-
556.
Caffin, N., B. Dayarcy, L. Yao and G. Rintoul (Eds) 2004. Developing an index of
quality for Australian tea. Australian Government Rural Industries Research
and Development Corporation. pp. 16.
Cai, Y and H. H. S. Chow. 2004. Pharmacokinetics and bioavailability of green tea
catechins. In: Meskin, M. S., W. R. Bidlack, A. J. Davies, D. S. Lewis and R. K.

121
Randolph (eds.) Phytochemicals- Mechanisms of Action. New York: CRC
Press. 35– 49 pp.
Carr, M. K. V. 1972. The climatic requirement of the tea plant. A review. Exp. Agr. 8:
1-14.
Casimir, J., J. Jadot and M. Renard. 1960. Séparation et characterization de la N-
ethyl-γ-glutamine à partir de Xerocomus badius. Biochim. Biophys. Acta. 39: 462-
468.
Chang, S. S and G. V. Gudnason. 1982. Effect of addition of aluminum salts on the
quality of black tea. J. Agric. Food Chem. 30: 940-943.
Chen, J., P. Wang, Y. Xia, M. Xu and S. Pei. 2005a. Genetic diversity and differentiation
of Camellia sinensis L. (cultivated tea) and its wild relatives in Yunnan province of
China, revealed by morphology, biochemistry and allozyme studies. Genet.
Resour. Crop Evol. 52: 41-52.
Chen, L and F. Yu. 2001. Distribution, diversity, utilization and conservation of
indigenous wild tea camellias (Camellia sp.) in China. Unpublished article.
Chen, L and S. Yamaguchi. 2002. Genetic diversity and phylogeny of tea plant (Camellia
sinensis) and its related species and varieties in the section Thea genus Camellia
determined by randomly amplified polymorphic DNA analysis. J. Hort. Sci.
Biotech. 77: 729–732.
Chen, L and Z. X. Zhou. 2005. Variations of main quality components of tea genetic
resources [Camellia sinensis (L.) O. Kuntze] preserved in the China National
Germplasm Tea Repository. Plant Foods Hum. Nutr. 60: 31—35.

122
Chen, L., D. Chen, Q. Gao, Y. Yang and F. Yu. 1997. Isolation and appraisal of
genomic DNA from tea plant (Camellia sinensis (L.) O. Kuntze. J. Tea Sci. 17:
177–181.
Chen, L., F. L. Yu, Y. J. Yang, D. M. Chen, C. J. Xu and Q. K. Gao. 1999. A study on
genetic stability of excellent tea germless [Camellia sinensis (L.) O. Kuntze]
using RAPD markers. J. Tea Sci. 19: 11–13.
Chen L., M. Z .Yao, L. P. Zhao and X. C. Wang. 2006. Recent research progresses on
molecular biology of tea plant (Camellia sinensis). In: da Silva JT (eds)
Floriculture, ornamental and plant biotechnology, advances and topic issues,
vol 4. Global Science Books, London, pp 425–436.
Chen, L., Q. K. Gao, D. M. Chen and G. J. Xu. 2005b. The use of RAPD markers for
detecting genetic diversity, relationship and molecular identification of
Chinese elite tea genetic resources (Camellia sinensis L. O. Kuntze) preserved
in tea germplasm repository. Biodiv. Conserv. 14: 1433-1444. DOI
10.1007/s10531-004-9787-y.
Chen, L., Z. X. Zhou and Y. J. Yang. 2007. Genetic improvement and breeding of tea
plant (Camellia sinensis) in China: from individual selection to hybridization
and molecular breeding. Euphytica 154: 239—248.
Chen, W., S. H. Sohn, E. S. Fiala and J. H. Weisburger. 1998. Effect of tea on the
formation of DNA adducts by azoxymethane. Xenobiot. 28: 213-217.
Chen, Z. M. 1989. Tea production in China and therapeutic effect of tea. In:
Proceedings of International Seminar on Green Tea. Seoul, South Korea.
Korean Society of Food Science and Technology, pp 12–27.

123
Chen, Z. M. 1994. Prospect on tea industry in the year of 2000. J. Tea Sci. 14: 81–88.
Chen. Q., Y. Ruan, Y. Wang, W. Liu and H. Zhu. 1985. Chemical evaluation of green
tea taste. J. Tea Sci. 5: 7-17.
Cheruiyot, E. K., L. M Mumera, W. K. Ng’etich, A. Hassanali and F. Wachira. 2007.
Polyphenols as potential indicators for drought tolerance in tea (Camellia
sinensis L.). Biosci. Biotechnol. Biochem. 71: 2190–2197.
Cheynier, V. 2005. Polyphenols in foods are more complex than often thought. Am.
J. Clin. Nutr. 81: 223-229.
Clay, J. 1991. Cultural survival and conservation: Lessons from the past twenty
years. In: Common Wealth of Australia (1993): Biodiversity series paper No.1.
Department of Environment, and Sports Territories, Canberra.
Condit, R and S. Hubbel. 1991. Abundance and DNA sequence of two-base repeat
regions in tropical tree genomes. Genome 34: 66–71.
Conner, P. J and B. W. Wood. 2001. Identification of pecan cultivars and their genetic
relatedness as determined by randomly amplified polymorphic DNA
analysis. J. Am. Society Hort. Sci. 126: 474–480.
Costa, L. M., S. T. Gouveia and J. A. Nobrega. 2002. Comparison of heating
extraction procedures for Al, Ca, Mg and Mn in tea samples. Anal. Sci. 18:
313–318.
Cromwell, E., D. Cooper and P. Mulvany. 1999. Agricultural Biodiversity and
Livelihood: issues and entry points: Paper for DFID Linking policy and
practice in Biodiversity project (LPPB), ODI, FAO, ITDG.

124
Das, A., S. S. Gosal, J. S. Sidhu and H. S. Dhaliwal. 2002. Biochemical characterization
of induced variants of potato (Solanum tuberosum L.). Indian J. Genet. 62: 146–
148.
Devarumath, R. M., S. Nandy, V. Rani, S. Marimuthu, N. Muraleedharan and S. N.
Raina. 2002. RAPD, ISSR and RFLP fingerprints as useful markers to evaluate
genetic integrity of micropropagated plants of three diploid and triploid elite
tea clones representing Camellia sinensis (china type) and C. assamica ssp.
assamica (Assam-India type). Plant Cell Reports. 21: 166-173.
Dhanaraj, A. L., E. V. V. B. Rao, K. R. M. Swamy, M. G. Bhat, D. T. Parsad and S. N.
Sondur. 2002. Using RAPDs to assess the diversity in India cashew
(Anacarditum occidentale L.) germplasm. J. Hort. Sci. Biotech. 77: 41–47.
Dimpfel, W., A. Kler, E. Kriesl and R. Lehnfeld. 2007. Theogallin and L-theanine as
active ingredients in decaffeinated green tea extract: I. electrophysiological
characterization in the rat hippocampus in-vitro. J. Pharm. Pharmacol. 59: 1131–
1136.
Dongre, A and L. L. Kharbikar. 2004. RAPD based assessment of genetic diversity in
cotton (Gossypium hirsutum L.) race stock accessions. Indian J. Genet. Pl.
Breed. 64: 94-96.
Doyle, J. J and J. L. Doyle. 1987. A rapid DNA isolation procedure for small
quantities of fresh leaf tissue. Phytochem. Bull. 19: 11-15.
Dreisigacker, S., P. Zhang, M. L. Warburton, M. Van Ginkel, D. Hoisington, M.
Bohn, and A. E. Melchinger. 2004. SSR and pedigree analyses of genetic

125
diversity among CIMMYT wheat lines targeted to different mega-
environments.
Duan, H. X., W. F. Shao, P. S. Wang, M. Xu, R. H. Pang, Y. P. Zhang and W. R. Cui.
2004. Study on the genetic diversity of peculiar tea germplasm resource in
Yunnan by RAPD. J. Yunnan Agri. University 19: 246–254.
Ekborg-Ott, K. H., A. Taylor and D. W. Armstrong. 1997. Varietal difference in the
total and enantiomeric composition of theanine in tea. J. Agric. Food Chem. 45:
353-363.
Forrest, G. I. and D. S. Bendal. 1969. Distribution of polyphenols in tea plant.
Biochem. J. 113: 74-755.
Freeman, S., J. West, C. James, V. Lea and S. Mayes. 2004. Isolation and
characterization of highly polymorphic microsatellites in tea (Camellia
sinensis). Molec. Ecol. Notes 4: 324–326.
Frelichowski, J. E. Jr. M. B. Palmer, D. Main, J. P. Tomkins. 2006. Cotton genome
mapping with new microsatellites from Acala ‘Maxxa’ BAC-ends. Mol. Genet.
Genomics 275: 479-491.
Gardner, E. J., C. H. Ruxton and A. R. Leeds. 2007. Black tea – helpful or harmful? A
review of the evidence. Eur. J. Clin. Nutr. 61: 3–18.
Gezgin, S., M. Özcan and E. Atalay. 2006. Determination of minerals extracted from
several commercial teas (Camellia sinensis) to hot water (infusion). J. Med. Food.
9: 123–127.
Ghosh-Hazra, N. 2001. Advances in selection and breeding of tea- A review. J. Plant
Crop. 29: 1–17.

126
Gostimsky, S. A., Z. G. Kokaeva and F. A. Konovalov. 2005. Studying plant genome
variation using molecular markers. Russ. J. Genet. 41: 378-388.
Graham, H. N. 1992. Green tea composition, consumption and polyphenols
chemistry. Preventive Med. 21: 334-350.
Graner, A., A. Bjornsto, T. Koishi and F. Ordon. 2003. Molecular diversity of the
barley genome. In: R. Von Bothmer, T.J.L. Vann Hintum, H. Knupffer and K.
Sato (Eds), Diversity in Barley (Hordeum vulgare). Elsevier Science. pp. 121-141.
Guanqun, S., L. Jinming, Q. Feng and C. W. Huie. 2003. Extraction of catechins and
caffeine from different tea leaves and comparison with micellar electrokinetic
chromatography. Chinese Sci. Bull. 48: 2438-2443.
Gul, S., H. Ahmad, I. A. Khan and M. Alam. 2007. Assessment of genetic diversity in
tea genotypes through RAPD primers. Pak. J. Biologic. Sci. 10: 2609-2611.
Guohua, Z., L. Zhu, T. Ren, L. Zhang and J. Gu. 1995. Geochemical characteristics
affecting the cultivation and quality of Longjing Tea. J. Geochem. Explor. 55:
183 - 191.
Gupta, P. K and R. K. Varshney. 2000. The development and use of microsatellite
markers for genetic analysis and plant breeding with emphasis on bread
wheat. Euphytica 113:163-185.
Gupta, P. K., R. K. Varshney, P. C. Sharma and B. Ramesh. 1999. Molecular markers
and their applications in wheat breeding. Plant Breed. 118: 369–390.
Hackett, C. A, F. N. Wachira, S. Paul, W. Powell and R. Waugh. 2000. Construction
of a genetic linkage map for Camellia sinensis (tea). Heredity 85: 346–355.
127
Hara, T. 1981. Volatile compounds formed on roasting L-theanine with D-glucose.
Nippon Nogei Kagaku Kaishi. 55: 1069-1072.
Hara, T and E. Kubota. 1974. Changes in aroma compounds during heating of green
tea. Nippon Nogei Kagaku Kaishi 55: 1069-1072.
Hara, T and E. Kubota. 1982a. Aroma compounds formed on heating L-theanine
with D-xylose. Study Tea 62: 55-56.
Hara, T and E. Kubota. 1982b. Aroma compounds formed on heating amino
compounds and sugars found in green tea. Study Tea 63: 39-44.
Hara, T and E. Kubota. 1983. Oxazoles and pyrazines identified in roasted green tea
aroma. Study Tea 65: 59-61.
Hara, Y., S. Luo, R. L. Wickremasinghe and Yamanishi. 1995. Flavor of tea. Food Rev.
Int. 11: 477-525.
Hartman, T. J., J. A. Tangrea, P. Pietinen, N. Malila, M. Virtanen, P. R. Taylor and D.
Albanes. 1992. Tea and Coffee Consumption and Risk of Colon and Rectal
Cancer in Middle-aged Finnish men. Nutr. Cancer 31: 41–48.
Hasimoto, M and S. Takasi. 1978. Morphological studies on the origin of the tea
plant. V. A proposal of one place of origin by cluster analysis. JPn. J. Trop.
Agric. 21: 93–101.
Hazarika, M and P. K. Mahanta. 1984. Composition changes in chlorophylls and
carotenoids during the four flushes of tea in north-east India. J. Sci. Food Agri.
35: 298 – 303.
Henry, R. J. 1997. Practical applications of Plant molecular biology. Chapman and
Hall.

128
Higdon, J. V and B. Frei. 2003. Tea Catechins and Polyphenols: health effects,
metabolism, and antioxidant functions. Crit. Rev. Food Sci. Nutr. 43: 89-143.
Hindmarch, I., P. T. Quinlan, K. L. Moore and C. Parkin. 1998. The effects of black
tea and other beverages on aspects of cognition and Psychomotor
performance. Psychopharmacology 139: 230-283.
Hirasawa, M., K. Takada, M. Makimura and S. Otake. 2002. Improvement of
periodontal status by green tea catechin using a local deliver system: A
clinical study. J. Periodontal. Res. 37: 433-438.
Holton, T. A., J. T. Christopher, L. McClure, N. Harker and R. J. Henry. 2002.
Identification and mapping of polymorphic SSR markers from expressed gene
sequences of barley and wheat. Mol.. Breed. 9: 63–71.
Hu, C. Y. 2004. Studies on the variations in leaf characters and DNA sequences of tea
germplasm in Taiwan. M. S. Thesis. National Taiwan University, Taipei,
Taiwan. pp. 146.
Huang, F. P., Y. R. Liang, J. L. Lu, R. B. Chen and G. Mamati. 2004. Evaluation of
genetic diversity in Oolong tea germplasms by AFLP fingerprinting. J. Tea
Science 24: 183–189.
Huang, J. A., J. X. Li, Y. H. Huang, J. W. Luo, Z. H. Gong and Z. H. Liu. 2006. Genetic
diversity of tea (Camellia sinensis (L.) O. Kuntze) cultivars revealed by AFLP
analysis. Acta Hort. Sinica 33: 317–322.
Hung, C. Y., K. H. Wang, C. C. Huang, X. Gong, X. J. Ge and T. Y. Chiang. 2007.
Isolation and characterization of 11 microsatellite loci from Camellia sinensis in

129
Taiwan using PCR-based isolation of microsatellite arrays (PIMA). Conserv.
Genet. DOI 10.1007/s10592-007-9391-9392.
Imai, K., K. Suga and K. Nakachi. 1997. Lead Article: Cancer preventive effects of
drinking green tea among a Japanese population. Prev. Med. 26: 769–775.
Ioannides, C and V. Yoxall. 2003. Antimutagenic activity of tea: role of polyphenols.
Curr. Opin. Clin. Nutr. Metab. Care 6: 649– 656.
Iqbal, M. J., O. U. K. Reddy, K. M. El-Zak and A. E. Pepper. 2001. A genetic
bottleneck in the evolution under domestication of upland cotton Gossypium
hirsutum L. examined using fingerprinting. Theor. Appl. Genet. 103: 547-554.
Islam, G. M. R., M. Iqbal, K. G. Quddus and M. Y. Ali. 2005. Present status and
future needs of tea industry in Bangladesh. Proc. Pakistan Acad. Sci. 42: 305-
314.
Jacob, H. J., K. Lindpainter, S. E. Lincoln, K. Kusumi, R. K. Bunker, Y. P. Mao, D.
Ganten, V. J. Dzau and E. S. Lander. 1991. Genetic mapping of a gene causing
hypertensive rat. Cell 67: 213-224.
Jarne, P and P. J. L. Lagoda. 1996. Microsatellites, form molecules to populations and
back. Trends Evol. Ecol. 11: 424-429.
Jarvis, P., C. Lister, V. Szabo and C. Dean. 1994. Integration of CAPS markers into the
RFLP map generated using recombinant inbred lines of Arabidopsis thaliana.
Plant Mol. Biol. 24: 685–687.
Jeffrey, A. J., V. Wilson and S. L. Thein. 1985. Hypervariable 'minisatellite' regions in
human DNA. Nature 314: 67–73.
130
Karthigeyan, S., S. Rajkumar, R. K. Sharma, A. Gulati, R. K. Sud and P. S. Ahuja.
2008. High level of genetic diversity between the selected accessions of Tea
(Camellia sinensis L.) O. Kuntze ) from abandoned Tea gardens in western
Himalaya. Biochem. Genet. 41: 810-819
Kaundun, S. S and S. Matsumoto, 2002: Heterologous nuclear and chloroplast
microsatellite amplification and variation in tea, Camellia sinensis. Genome 45:
1041—1048.
Kaundun, S. S and S. Matsumoto. 2003. Development of CAPS markers based on
three key genes of the phenylpropanoid pathway in Tea (Camellia sinensis L.
O. Kuntze) and differentiation between assamica and sinensis varieties. Theor.
Appl. Genet. 106: 375-383.
Kaundun S. S and Y. G. Park. 2002. Genetic structure of six Korean tea populations
revealed by RAPDPCR markers. Crop Sci. 42:594–601
Kaundun, S. S., A. Zhyvoloup and Y. G. Park. 2000. Evaluation of the genetic
polymorphism among elite tea (Camellia sinensis var. sinensis) accessions using
RAPD markers. Euphytica 115: 7–16.
Kawakami, M and T. Yamanishi. 1983. Flavour constituents of Longjing tea. Agric.
Biol. Chem. 47: 2077-2083.
Khan, N and H. Mukhtar. 2007. Tea Polyphenols for health promotion. Life Sci. 81:
519-533.
Khan, M. W., I. A. Khan, H. Ahmad, H. Ali, S. Ghafoor, M. Afzal, F. A. Khan, M.
Shah and S. G. Afridi. 2010. Estimation of genetic diversity in Walnut. Pak. J.
Bot. 42: 1791-1796.

131
Khasa, P. D and B. P. Dancik. 1996. Rapid identification of white-Engelmann spruce
species by RAPD markers. Theor. Appl. Genet. 92: 46–52.
Kihlman, B. A. 1977. Caffeine and Chromosomes, Amsterdam: Elsevier.
Kilmartin, P. A and C. F. Hsu. 2003. Characterisation of polyphenols in green, oolong,
and black teas, and in coffee, using cyclic voltammetry. Food Chem. 82: 501-512.
Kimura, K., M. Ozeki, L. R. Juneja and H. Ohira. 2007. L-Theanine reduces
psychological and physiological stress responses. Biol. Psychol. 74: 39– 45.
Knekt, P., J. Kumpulainem, R. Järvinen, H. Rissanen, M. Heliövaara, A. Reunanen, T.
Hakulinen and A. Aromaa. 2002. Flavonoid intake and risk of chronic
diseases. Am. J. Clin. Nutr. 76: 560– 568.
Kohlmeier, L., K. G. Weterings, S. Steck and F. J. Kok. 1997. Tea and Cancer
Prevention: An Evaluation of the Epidemiologic Literature. Nutr. Cancer 27: 1–
13.
Komes, D., D. Horzic, A. Belscak, K. K. Ganic and A. Baljak. 2009. Determination of
Caffeine in tea and Mate tea by using different methods. Czech. J. Food Sci. 27:
213-216.
Koniecyzn, A. and F. M. Ausubel. 1993. A procedure for mapping Arabidopsis
mutations using co-dominant ecotype specific PCR based markers. Plant J. 4:
403–410.
Kono, S. 1992. Green Tea and Colon Cancer (letter to the editor). JPn. J. Cancer Res.
83: 669.
Kosuge, M., H. Isaka and T. Yamanishi. 1981. Flavour constituents of Chinese and
Japanese pan-fired green tea. Eiyo to Shokuryou. 34: 545-549.
132
Kulasegaram. S. 1980. Technical developments in tea production. Tea Q. 49: 157–183.
Kumar, N., R. Rai, N. G. Hajra and T. C. Chaudhuri. 1993. Dry matter content of
certain clones under agroclimate conditions of Darjeeling. J. Plantation Crops
21: 30-37.
Kuriyama, S., T. Shimazu, K. Ohmori, N. Kikuchi, N. Nakaya, Y. Nishino, Y.
Tsubono and I. Tsuji. 2006. Green tea consumption and mortality due
cardiovascular disease, cancer, and all causes in Japan – The Ohsaki Study.
JAMA. 296: 1255 – 1265.
Kuroda, Y and Y. Hara. 1999. Antimutagenic and anticarcinogenic activity of tea
polyphenols. Mutat. Res. 436: 69–97.
Kuroda, Y and Y. Hara. 2004. Health effects of tea and its catechins. Kluwer,
Dordrecht.
Lai, J. A., W. C. Yang and J. Y. Hsiao. 2001. An assessment of genetic relationships in
cultivated tea clones and native wild tea in Taiwan using RAPD and ISSR
markers. Bot. Bull. Acad. Sin. 42: 93–100.
Lambert, J. D and C. S. Yang. 2003. Mechanisms of cancer prevention by tea
constituents. J. Nutr. 133: 3262-3267.
Landry, B. S., R. Q. Li, W. Y. Cheung and R. L. Granger. 1994. Phylogeny analysis of
25 apple rootstocks using RAPD markers and tactical gene tagging. Theor.
Appl. Genet. 89: 847–852.
Lee, S. H., H. S. Choi, R. H. Kim, H. Y. Lee and I. S. Nou. 1995. Identification of
Korean wild tea plants and Japanese green tea cultivars using RAPD markers.
J. Korean Tea Society 1: 129–148.

133
Lee, S., J. Kim, J. Sano, Y. Ozaki and H. Okubo. 2003. Phylogenic relationships
among tea cultivars based on AFLP analysis. J. Fac. Agric. 47: 289–299.
Leigh, F., V. Lea, J. Law, P. Wolters, W. Powell and P. Donini. 2003. Assessment of
EST- and genomic microsatellite markers for variety discrimination and
genetic diversity studies in wheat. Euphytica. 133: 359 – 366.
Li, Z and R. L. Nelson. 2001. Genetic diversity among soybean accessions from three
countries measured by RAPDs. Crop Sci. 41: 1337-1347.
Liang, Y., J. Lu, L. Zhang, S. Wu and Y. Wu. 2005. Estimation of tea quality by
infusion color difference analysis. J. Agric. Food Chem. 85: 286-293.
Liao, S and R. A. Hiipakka. 1995. Selective Inhibition of Steroid 5 Alpha-reductase
Isozymes by Tea Epicatechin-3-gallate and Epigallocatechin-3-gallate.
Biochem. Biophys. Res. Commun. 214: 833–838.
Liu, W., P. J. Li, X. M. Qi, Q. X. Zhou, L. Zheng, T. H. Sun and Y. S. Yang. 2005. DNA
L-theanine (N-ethyl-L-glutamine): a possible neuroprotective and cognitive
enhancing agent. J. Herb. Pharmacother. 6: 21–30.
Lu, H and G. Myers. 2002. Genetic relationship and discrimination of ten influential
Upland cotton varieties using RAPD markers. Theor. Appl. Genet. 105: 325- 331.
Lu, J., H. F. Wei and C. H. Li. 1994. Comparison of major free amino acids in young
shoots and effects on quality of tea. J. Southwestern Agric. 7: 13-16.
Ludwig, A., M. Lorenz, N. Grimbo, F. Steinle, S. Meiners, C. Bartsch, K. Stangl, G.
Baumann and V. Stangl. 2004. The tea flavonoid epigallocatechin-3-gallate
reduces cytokine-induced VCAM-1 expression and monocyte adhesion to
endothelial cells. Biochem. Biophys. Res. Commun. 316: 659-665.

134
Luo, J. W., Z. P. Shi, C. W. Shen, C. L. Liu, Z. H. Gong and Y. H. Huang. 2002.
Studies on genetic relationships of tea cultivars [Camellia sinensis (L.) O
Kuntze] by RAPD analysis. J. Tea Sci. 22: 140–146
Magoma, G. N., F. N. Wachira, M. Obanda, M. Imbuga and S. G. Agong. 2000. The
use of catechins as biochemical markers in diversity studies of tea (Camellia
sinensis). Genet. Resour. Crop Evol. 47: 107–114.
Malabadi, R. B., P. N. Hills and J. van Staden. 2006. RAPD assessment of clonal
identity of somatic seedlings derived from vegetative shoot apices of mature
Pinus patula trees. South Afr. J. Bot. 2: 181-183.
Manach, C., A. Scalbert, C. Morand, C. Rémésy and L. Jiménez. 2004. Polyphenols:
food sources and bioavailability. Am. J. Clin. Nutr. 79: 727 – 747.
Matsumoto, S. 2001. Analysis of the differentiation of Japanese green tea cultivars
using DNA markers. In: Proceedings of 2001 International Conference on O-
Cha (tea) Culture and Science (Session II). October 5–8, Shizuoka, Japan, J13–
J16.
Matsumoto, S., A. Takeuchi, M. Hayatsu and S. Kondo. 1994. Molecular cloning of
phenylalanine ammonia-lyase cDNA and classification of varieties of tea
plants (Camellia sinensis) using tea Pal cDNA probe. Theor. Appl. Genet. 89:
671–675.
Matsumoto, S., Y. Kiriiwa and S. Yamaguchi. 2004. The Korean tea plant (Camellia
sinensis): RFLP analysis of genetic diversity and relationship to Japanese tea.
Breed. Sci. 54: 231–237.
135
Matsumoto, S., Y. Kiriiwa and Y. Takeda. 2002. Differentiation of Japanese green tea
cultivars as revealed by RFLP analysis of phenylalanine ammonia-lyase DNA.
Theor. Appl. Genet. 104: 998-1002.
McKay, D. L and J. B. Blumberg. 2002. The role of tea in human health: an update.
J. Am. Coll. Nutr. 21: 1-13.
Memik, F., S. G. Nak, M. Gulten and M. Ozturk. 1992. Gastric Carcinoma in
Northwestern Turkey: Epidemiologic Characteristics. J. Environ. Pathol.
Toxicol. Oncol. 11:335–338.
Millin, D. J., D. J. Crispin and D. Swaine. 1969. Nonvolatile components of black tea
and their contribution to the character of the beverage. J. Agric. Food Chem. 17:
717-722.
Ming, T. L. 2000. Monograph of the Genus Camellia. Yunnan Science and Technology
Press, Kunming, China. 128-134 pp.
Mondal, T. K., A. Bhattacharya and P. S. Ahuja. 2002. Induction of synchronous
secondary embryogenesis of tea (Camellia sinensis). J. Plant Physiol. 158:945–
951.
Mondal, T. K and P. K. Chand. 2002. Detection of genetic variation among
micropropagated tea [Camellia sinensis (L.) O. Kuntze] by RAPD analysis. In
Vitro Cellular and Development Biology-Plant 38: 296–299.
Mondal, T. K. 2002. Detection of genetic diversity among the Indian tea (Camellia
sinensis) germplasm by inter-simple sequence repeats (ISSR). Euphytica 128:
307–315.

136
Moreda-Pineiro, A., A. Fisher and S. J. Hill. 2003. The classification of tea according to
region of origin using pattern recognition techniques and trace metal data. J. Food
Comp. Anal. 16: 195–211.
Morgunov, A. I., W. J. Rogers, E. J. Sayers and E. V. Metakovsky. 1990. The high
molecular weight glutenin sub unit composition of Soviet wheat varieties.
Euphytica 51: 41-52.
Muhammad, I., H. Ahmad, S. Ghafoor, S. G. Afridi, K. Begum and I. A. Khan. 2010.
Identification of RAPD primers specific for wheat homoeologous group 1 and
3 chromosomes. Asian. J. Agri. Sci. 2: 117-119.
Mukai, T., H. Horie and T. Goto. 1992. Differences in free amino acids and total
nitrogen contents among various prices of green teas. Tea Res. J. 76: 45-50.
Mukhtar, H and N. Ahmad. 2000. Tea Polyphenols: prevention of cancer and
optimizing health. Am. J. Clin. Nutr. 71: 1698–1704.
Nakagava, M and H. Torii. 1964. Studies on flavanols in tea. Agric. Biologic. Chemistry
28: 497-504.
Nakagawa, M., T. Anan and K. Lawasa. 1977. The difference of flavor and chemical
composition between spring harvested and summer harvested green teas.
Study tea 53: 74-81.
Nakagawa, M., T. Anan and N. Ishima. 1981. The relation of green tea taste with its
chemical make-up. Bull. Natl. Res. Inst. Tea. 17: 69-123.
Nathan, P. J., K. Lu, M. Gray and C. Oliver. 2006. The neuropharmacology of L-
theanine (N-ethyl-L-glutamine): a possible neuroprotective and cognitive
enhancing agent. J. Herb. Pharmacother. 6: 21–30.
137
Nathaniel, R. K. 1986. Introduction, Handbook on Tea research Institute of Sri Lanka
Talawakele. 1-2 pp.
Nathaniel, R. K. 1992. Tea Development in Pakistan. FAO Mission Report Rome,
Italy.
Navajas, M and B. Fenton. 2000. The application of molecular markers in the study
of diversity in acarology: a review. Exp. Appl. Acaro. 24: 751 – 774.
Nei, M. 1973. Analysis of gene diversity of subdivided populations. Proc. Nat. Acad.
Sci., U.S.A. 70: 3321-3323.
Nei, N and W. Li. 1979. Mathematical model for studying genetic variation in terms
of restriction endonucleases. Proc. Natl. Acad. Sci., U.S.A. 76: 5269-5273.
Nelson, R. J. 1992. Analyzing pathogen populations using molecular markers. In:
Mongkolsuk, S., P. S. Lovett, J. E. Trempy, Editors. Biotechnol. Environ. Sci.
(proc Int Conf). Plenum Press, New York. 89-8 pp.
Nesumi, A and Y. Takeda. 2006. New Tea Parental Line, ‘MAKURA No. 1’, for
Breeding Cultivars with High Tannin and Caffeine Contents and a Flowery
Flavor. JARQ 40: 143–148.
Nguyen, T. B., M. Giband, P. Brottier, A. M. Risterucci and J. M. Lacape. 2004. Wide
coverage of the tetraploid cotton genome using newly developed
Microsatellite markers. Theor. Appl. Genet. 109: 167-175.
Obanda, M and P. Owuor. 1997. Flavanols composition and caffeine content of green
leaf as quality potential indicators of Kenyan black teas. J. Sci. Food Agric. 74:
209–215.

138
Orozco-Castillo, C., K. J. Chalmers, W. Powell and R. Waugh. 1996. RAPD and
organelle specific PCR re-affirms taxonomic relationships within the genus
Coffea. Plant Cell Reports. 15: 337–341.
Owuor, P. O and I. J. McDowell. 1994. Changes in the theaflavins composition and
astringency during black tea fermentation. Food Chem. 51: 251–254.
Park, Y. G., S. S. Kaundun and A. Zhyvoloup. 2002. Use of the bulked genomic
DNA-based RAPD methodology to access the genetic diversity among
abandoned Korean tea plantations. Genet. Resour. Crop Evol. 49: 159–165.
Paterson, A. H., S. D. Tanksley and M. E. Sorrells. 1991. DNA markers in plant
improvement. Adv. Agron. 46: 39-90.
Peterson, J., J. Dwyer, P. Jacques, W. Rand, R. Prior and K. Chui. 2004. Tea variety
and brewing techniques influence flavonoid content of black tea. J. Food
Compos. Anal. 17: 397-405.
Piyasundara, J. H. N., M. T. K. Gunasekare, T. U. S. Peiris and I. P. Wickramasinghe.
2006. Phenotypic Diversity of SL-01-05Tea (Camellia sinensis L.) Germplasm
Based on Morphological Descriptors. Eighteenth Annual Congress of the
PGIA. 16-17.
Pourmorad, F., S. J. Husseinimehr and N. Shahabimajd. 2006. Antioxidant, Phenol
and Flavonoid Contents of Some Selected Iranian Medicinal Plants. Afr. J.
Biotech. 5: 1142-1145.
Powell, W., G. C. Machray and J. Provan. 1996. Polymorphism revealed by simple
sequence repeats. Trends Pl. Sci. 1: 215–222.
139
Paul, S., F. N. Wachira, W. Powell and R. Waugh. 1997. Diversity and genetic
differentiation among populations of Indian and Kenyan tea (Camellia sinensis
(L.) O. Kuntze) revealed by AFLP markers. Theor. Appl. Genet. 94: 255–263.
Rahman, H., I. H. Khalil, F. M. Abbasi, Z. T. Khanzada, S. M. A. Shah, Z. Shah and H.
Ahmad. 2010. Cytomorphological characterization of tea cultivars. Pak. J. Bot.
42: 485-495.
Rajora, O and M. Rahman. 2003. Microsatellite DNA and RAPD fingerprinting,
identification and genetic relationships of hybrid poplar (Populus X
Canadensis) cultivars. Theor. Appl. Genet. 106: 470-477.
Rana, M. K and K. V. Bhat. 2004. Analysis of molecular variance in cotton
(Gossypium spp.) using RAPD markers. Ind. J. Genet. Pl. breed. 64: 85-86.
Rao, T. P., R. J. Lekh and Y. Takado. 2006. Green Tea Catechins against Oxidative
Stress of Renal Diseases: In, Protective Effects of Tea on Human Health.
Edited by Navendev, K. Jain, Maqsood Siddiqi and John Weis Burger Vol. 2:
pp. 109-119. London: CAB.
Rice-Evans, C. 1999. Implications of the mechanisms of action of tea polyphenol as
antioxidants in vitro for chemoprevention in humans. Proc. Soc. Exp. Biol. Med.
220: 262–266.
Riemersma, R. A. 2001. Rice-Evans CA, Tyrrell RM, Clifford MN, Lean ME. Tea
flavonoids and cardiovascular health. Q. J. Med. 94: 277–282.
Robbins, R. J., C. Kwilk-Uribe, J. F. Hammerstone and H. H. Schmitz. 2006. Analysis
of flavanols in foods: what methods are required to enable meaningful health
recommendations? J. Cardiovasc. Pharmacol. 47: 110-118.

140
Roberts, E. A. H and R. F. Smith. 1963. Phenolic substances of manufactured tea
spectrophotometric evaluation of tea liquors. J. Sci. Food Agri. 14: 489–700.
Roberts, E. A. H., W. Wight and D. J. Wood. 1958. Paper chromatography as an aid
to the identification of thea Camellias. New Phytologist 57: 211-225.
Robertson, A. 1992. The Chemistry and Biochemistry of Black Tea Production, the
Non-Volatiles. In: K. C. Willson and M. N. Clifford (Eds) pp. 603–647.
Chapman and Hall, London.
Rogstad, S. H. 1996. Assessing genetic diversity in plants with synthetic tandem
repetitive DNA probes. Stadler Genet. Symp. Ser. 21: 1-14.
Rohdewald, P. 1998. Pycnogenol. In. Rice-Evans CA, Packer L (eds.). Flavonoids in
Health and Disease, New York; Marcel Dekker, Inc. pp. 405-419.
Ruhul, A. 1998. Economics of tea cultivation in district Mansehra. Report of
National Tea Research Institute, Mansehra.
Saiki, R. K., S. Scharf, F. Faloona, K. B. Mullis, G. T. Horn, H. A. Erlich and N.
Arnheim. 1985. Enzymatic amplification of beta-globin genomic sequences
and restriction site analysis for diagnosis of sickle cell anemia. Science 230:
1350–1354.
Sambrook, J., E. F. Fritsch and T. Miniatis. 1989. Molecular cloning. A Laboratory
Manual, 2nd Edition. Cold Harbor, NY: Cold Spring Harbor Laboratory Press.
Sanderson, G. W. 1964. The chemical composition of fresh tea flush as affected by
clone and climate. Tea Quarterly 35: 101–109.
Sanderson, G. W and H. N. Graham. 1973. On the formation of black tea aroma. J.
Agric. Food Chem. 21: 576-585.

141
Sant, D. 1972. Black tea extractives, MSc Thesis, University of Sheffield.
Saravanan, M., K. M. Maria John, R. Raj Kumar, P. K. Pius and R. Sasikumar. 2005.
Genetic diversity of UPASI tea clones (Camellia sinensis (L.) O. Kuntze) on the
basis of total catechins and their fractions. Phytochemistry 66: 561-565.
Sealy, J. R. 1937. Camellia taliensis Curtis. Curtis’ Botanical magazine, 164: 9684.
Sealy, J. R. 1958. A revision of the genus Camellia. R. Hortic. Soc. London 19: 519-524.
Sedra, M. H., P. Lasherms, P. Trouslot, M. Combes and S. Hamon. 1998.
Identification and genetic diversity analysis of date palm (Phoenix dactylifera
L.) varieties from Morocco using RAPD markers. Euphytica 103: 75–82.
Senior, M. L., J. P. Murphy, M. M. Goodman and C. W. Stuber. 1998. Utility of SSRs
for determining genetic similarities and relationships in maize using agarose
gel system. Crop Science 38: 1088–1098.
Seurei, P. 1996. Tea improvement in Kenya: A review. Tea 17: 76–81.
Shao, W. F., R. H. Pang, P. S. Wang, M. Xu, H. X. Duan, Y. P. Zhang and J. H. Li.
2003. RAPD analysis of tea trees in Yunnan. Scientia Agri. Sin. 36: 1582–1587.
Sharma, R. K., P. Bhardwaj, R. Negi, T. Mohapatra and P. S. Ahuja. 2009.
Identification, characterization and utilization of unigene derived
microsatellite markers in tea (Camellia sinensis L.). BMC Plant Biology 9: 53.
Sharma, V. S and K. S. Venkataramani. 1974. The tea complex I. Taxonomy of tea
clones. Proc. Ind. Acad. Sci. 53:178–187.
Singh, I. D. 1999. Plant Improvement, In: Jain NK (ed) Global Advances in Tea (pp.
427–448). Aravali Book International (P) Ltd., India.
142
Staub, J. E., L. J. Kuhns, B. May and P. Grun. 1982. Stability of potato tuber isozymes
under different storage regimes. J. Am. Soc. Hort. Sci. 107: 405–408
Sumikova, T and H.A. Kernlova. 2010. Multiplex PCR assay to detect rust resistance
genes Lr26 and Lr37 in wheat. Czech J. Genet. Pl. Breed. 46: 85-89.
Sun, Y. Q., X. L. Zhang, C. Huang, Y. C. Nie and X. P. Guo. 2005. Changes in barley
(Hordeum vulgare) seedlings induced by Cadmium pollution using RAPD
analysis. Chemosphere 61: 158-167.
Takeda, Y. 1994. Differences in caffeine and tannin contents between tea cultivars
and application to tea breeding. Jap. Agric. Res. Quart. 28: 117–123.
Takeda, Y. 2000. History and development in Japanese tea breeding. In: Y. G. Park,
and D. I. Shin (eds), Tea Culture, Tea Food Industry and Tea Tree Breeding in
Korea, China and Japan, 139—158. The Korean Tea Society, Taegu, Korea.
Takeo, T. 1992. Changes in the catechins contents during the development of tea
leaves. Study tea 61: 28-30.
Takino, Y., H. Imagawa, H. Harikawa and A. Tanaka. 1964. Studies of the
mechanism of the oxidation of tea catechins part III. Formation of a reddish
orange pigment and its spectral relationship to some benzotropolone
derivatives. Agric. Biol. Chem. 28: 64–71.
Tanaka, J., N. Yamaguchi and Y. Nakamura. 2001. Pollen parent of tea cultivar
Sayamakaori with insect and cold resistance may not exist. Breed. Res. 3: 43–
48.

143
Tanaka, J and S. Yamaguchi. 1996. Use of RAPD markers for the identification of
parentage of tea cultivars. Bull. Nation. Inst. Vegetab. Ornam. Pl. Tea Japan. 9:
31–36.
Tanksley, S. D., N. D. Yong, A. H. Paterson and M. W. Bonierbals. 1989. RFLP
mapping in plant breeding: new tools for an old science. Biotechnology 7: 257–
264.
Tautz, D and M. Renz. 1984. Simple sequences are ubiquitous repetitive components
of eukaryotic genomes. Nucl. Acid. Res. 12: 4127–4138.
Teranishi, R and I. Hornstein. 1995. Food review international, production,
processing, acceptance, nutrition and health. 11(3), 546 pp.
Todorovska, E., N. Christov, S. Slavov and P. Christova. 2009. Biotic stress
resistance in wheat breeding and genomic selection implications. Biotechnol.
Biotechnol. equipment 23:1410-1413.
Trevisanato, S. I and Y. I. Kim. 2000. Tea and health. Nutr. Rev. 58: 1–10.
Tsushida, T and T. Takeo. 1984. Occurrence of theanine in Camellia japonica and
Camellia sasanqua seedlings. Agric. Biol. Chem. 48: 2861-2861.
Ueno, S., H. Yoshimaru, N. Tomaru and S. Yamamoto. 1999. Development and
characterization of microsatellite markers in Camellia japonica L. Mol. Ecol. 9:
335-336.
Ujihara, T., R. Ohta, N. Hayashi, K. Kohata and J. Tanaka. 2009. Identification of
Japanese and Chinese green tea cultivars by using Simple Sequence Repeat
markers to encourage proper labeling. Biosci. Biotechnol. Biochem. 73: 15-20.
Ukers, W. H. 1935. All about tea. Tea and Coffee Trade Journals, New York.

144
Ullah, I., I. A. Khan, H. Ahmad, S. Ghafoor, S. Gul, I. Muhammad and M. Ilyas. 2010.
Seed storage protein profile of rice varieties commonly grown in Pakistan.
Asian J. Agri. Sci. 2: 120-123.
Varshney, R. K., R. Sigmund, A. Börner, V. Korzun, N. Stein, M. E Sorrells, P.
Langridge and A. Graner. 2005. Interspecific transferability and comparative
mapping of barley EST-SSR markers in wheat, rye and rice. Plant Science 168:
195–202.
Vavilov, N. I. 1951. Phytogeographic basis of plant breeding. The origin, variation
immunity and breeding of cultivated plants. Chron. Bot. 13: 1-366.
Visser, T. 1969. Tea (Camellia sinensis (L.) O. Kuntze). In: Outlines of perennial crop
breeding in the tropics. Eds. Ferwerdu, E.P. and Wit, F., pp. 459– 493.
Veenaran and Zonen, Wageningen, The Netherlands.
Von, V. 2005. Quality-related constituents in tea (Camellia sinensis (L.) O. Kuntze) as
affected by the form and concentration of nitrogen and the supply of chloride.
M.Sc Thesis.
Vos, P., R. Hogers, M. Bleeker, M. Reijians, T. Lee, M. Hornes, A. Frijiters, J. Pot, J.
Peleman, M. Kuiper and M. Zabeau. 1995. AFLP, a new technique for DNA
fingerprinting. Nucl. Acid. Res. 23: 4407-4414.
Wachira, F. N., W. Powell and R. Waugh. 1997. An assessment of genetic diversity
among Camellia sinensis L. (cultivated tea) and its wild relatives based on
randomly amplified polymorphic DNA and organelle-specific STS. Heredity.
78: 603–611.

145
Wachira, F. N. 1990. Desirable tea plants: an overview of a search for markers. Tea
11: 42–48.
Wachira, F. N., J. Tanaka and Y. Takeda. 2001. Genetic variation and differentiation
in tea (Camellia sinensis) germplasm revealed by RAPD and AFLP variation. J.
Hortic. Sci. Biotechnol. 76: 557–563.
Wachira, F. N., R. Waugh, C. A. Hackett and W. Powell. 1995. Detection of genetic
diversity in tea (Camellia sinensis) using RAPD markers. Genome 38: 201–210.
Wachira, F. N and W. Ronno. 2004. Current research on tea in Kenya. In:
Proceedings of 2004 International Conference on O-Cha (Tea) Science,
Shizuoka, Japan, 59–65.
Waheed, A., F. S. Hamid, N. Ahmad and A. R. Khan. 2000. Tripping practice on
nursery plants of camellia sinensis during their growth period. Pak. J. Bio. Sci. 3:
1868-1869.
Wang, W., B. Vinocur and A. Altman. 2007. Plant responses to drought, salinity and
extreme temperatures towards genetic engineering for stress tolerance. Planta
218: 1-14.
Wang, Y., Q. Chen, Y. Ruan, W. Liu and H. Zhu. 1988. Discussion on the chemical
standards on quality of Chinese roasted green tea. J. Tea Sci. 8: 13-20.
Weatherstone, J. 1992. Historical introduction. Tea cultivation to consumption
Chapman and Hall London. 1023.
Weisburger, J. H. 1999. Tea and health: the underlying mechanisms. Proc. Soc. Exp.
Biol. Med. 220: 271–275.
146
Weising, K., H. Nybom, K. Wolff, and G. Kahl. 2005. Detecting DNA variation by
molecular markers. In: DNA fingerprinting in Plants: Principles, methods,
and applications. pp. 21–73. Taylor and Francis groups.
Weising, K., H. Nybom, K. Wolff and W. Meyer. 1995. DNA Fingerprinting in Plants
and Fungi (ed. Arbor, A.) CRC Press, Boca Raton. pp. 1–3.
Weising, K., P. Winter, B. Huttel and G. Kahl. 1998. Microsatellite markers for
molecular breeding. J. Crop Prod. 11: 113-143.
Welsh, J and M. McClelland. 1991. Fingerprinting genomes using PCR with arbitrary
primers. Nucl. Acids Res. 18: 7213-8.
Wickremaratne, M. R. 1981. Variation in some leaf in tea (Camellia sinensis L.) and
their use in the identification of clones. Tea. Q. 50: 183–189.
Wickremasinghe, R. I and K. P. W. C. Perera. 1973. Factors affecting quality, strength
and color of black tea liquors. J. Nation. Sci. Counc. Sri Lanka. 1: 111-121.
Wight, W and D. N. Barua. 1954. Morphological basis of quality in tea. Nature 173:
630–631.
Wight, W. 1962. Tea classification revised. Curr. Sci. 31: 298–299.
Wijeratne, M. A. 2004. Tea industry in Sri Lanka. In Proceedings of 2004
International Conference on O-Cha (Tea) Science. pp: 51–54 Shizuoka, Japan
Williams, J. G. K., A. R. Kubelik, K. J. Livak, J. A. Raflaski and S. V. Tingey. 1990.
DNA polymorphism amplified by arbitrary primers are useful as genetic
markers. Nucl. Acids Res. 18: 6531-6535.
Willson, K. C and M. N. Clifford. 1992. Tea: Cultivation to Consumption. Chapman
and Hall, London.

147
Wood, D. J and D. N. Barua. 1958. Species hybrids of tea. Nature 181: 1674–1675.
Wright, W and R. C. J. H. Gilchrist. 1961. The concept of kind of tea. Nature 191: 14-
16.
Yamamoto T., L. J. Juneja, D. C. Chu and M. Kim. 1998. Chemistry and application of
green tea. New York: CRC, 1–158 pp.
Yang, C. S and J. Landau. 2000. Effects of tea consumption on nutrition and health. J.
Nutr. 130: 2409-2412.
Yang, C. S and Z. Y. Wang. 1993. Tea and Cancer: A Review. J. Natl. Cancer Inst. 58:
1038–1049.
Yang, C. S and Z. Y. Wang. 2006. The Chemistry of tea.
http://www.teatalk.com/science/chemistry.htm
Yao, M. Z., L. Chen, X. C. Wang, L. P. Zhao and Y. J. Yang. 2007. Genetic diversity
and relationship of clonal tea cultivars in China revealed by ISSR markers.
Acta Agrono. Sinica 33: 598–604.
Yao, L., X. Liu, Y. Jiang, N. Caffin, B. D’Arcy, R. Singanusong, N. Datta and Y. Xu.
2006. Compositional analysis of teas from Australian supermarkets. Food
Chem. 94: 115-122.
Yeh, F. C., R. C. Yang, T. B. J. Boyle, Z. H. Ye and J. X. Mao. 1999. POPGENE 3.2, the
User-Friendly Shareware for Population Genetic Analysis. Molecular Biology
and Biotechnology Centre, University of Alberta, Edmonton, Alberta, Canada.
Yu, F and N. Xu. 1999. Tea germplasm resources of China. In: Jain, N. K. (ed). Global
advances in tea science: 393 – 412. Aravali Books International (P) Ltd. New
Delhi, India.

148
Yu, F. L. 1986. Discussion on the originating place and the originating center of tea
plant. J. of Tea Science 6: 1-8.
Yu, G. P., C. C. Hsieh, L. Y. Wang, S. Z. Yu, X. L. Li and T. H. Jin. 1995. Green-Tea
Consumption and Risk of Stomach Cancer: A Population-based Case-control
Study in Shanghai, China. Cancer Causes Contrl. 6: 532–538.
Yu, G. P and C. C. Hsieh. 1991. Risk Factors for Stomach Cancer: A Population-based
Case control Study in Shanghai. Cancer Causes Contrl. 2: 169–174.
Yu, J. K., T. M. Dake, S. Singh, D. Benscher, W. Li, B. Gill and M. E. Sorrells. 2004a.
Development and mapping of EST-derived simple sequence repeat (SSR)
markers for hexaploid wheat. Genome 47: 805–818.
Yu, J. K., M. La Rota, R. V. Kantety and M. E. Sorrells. 2004b. EST-derived SSR
markers for comparative mapping in wheat and rice. Molecul. Genet. Genomics
271: 742–751.
Zabeau, M and P. Vos. 1993. Selective restriction fragment amplification, a general
method for DNA fingerprinting. European Patent Application, publication
no: EP 0534858.
Zhan, Z., N. Ke and B. Chen. 1987. The cytology of tea clonal cultivars Fujian
shuixian and their infertile mechanism. In: Proc Int Tea Quality – Human
Health Symp, Tea Research Institute, Chinese Academy of Agricultural
Science, Beijing
Zhang, M., J. Huang, X. Xie and C. Holman. 2009. Dietary intakes of mushrooms
and green tea combine to reduce the risk of breast cancer in Chinese women.
Int. J. Cancer 124: 1404-1408.
149
Zhang, Z. S., Y. H. Xiao, M. Luo and X. B. Li. 2005. Construction of a genetic linkage
map and QTL analysis of fiber-related traits in upland cotton (Gossypium
hirsutum L.). Euphytica 144: 91-99.
Zhao, L. P., Z. Liu, E. L. Chen, E. M. Z. Yao and E. X. C. Wang. 2007. Generation
and characterization of 24 novel EST derived microsatellites from tea plant
(Camellia sinensis) and cross-species amplification in its closely related species
and varieties. Conserv Genet. 9: 1327-1331.
Zhao, W., R. Yang, M. Wang and R. Lu. 2009. Effects of pulsed electric fields on
bioactive components, color and flavor of green tea infusions. Int. J. Food Sci.
Technol. 44: 312-21.
Zietkiewicz, E., A. Rafalski and D. Labuda. 1994. Genome fingerprinting by simple-
sequence repeat (SSR) anchored polymerase chain reaction amplification.
Genomics 20: 176–183.

150
Annexure A
Criteria for data collection on various leaf parameters
S. No. Parameters with Code Method of data Analysis
1 Petiole Length (PL)
Petiole length was measured in millimeter with the
help of ruler from stem to base of lamina (cm).
2 Leaf length (LL) LL was measured from petiole base to the edge of leaf
(cm)
3 Leaf Breadth (LB) LB was measure at the widest position of the lamina
(cm)
4 Leaf Length/Breadth
(L/B)
Length of leaf was divided by its Breadth
5 Leaf Area (LA) Leaf length was multiplied with leaf Breadth (cm2)
6 Number of vein pairs
(NVP)
Parallel veins on both side of the leaf midrib were
counted in pairs
7 Leaf Angle (LAng) Angle between shoot stem and 4th leaf midrib was
measured
8 Fresh Leaf Weight
(FLW)
FLW of 3rd and 4th leaf was taken immediately after
plucking in milligram (g)
9 Dry Leaf Weight
(DLW)
Fresh leaves were dried in oven at 65 0C for 24 hours
before taking dry weight in (g)
10 Fresh to Dry leaf ratio
(FDL)
Fresh leaf weight was divided by dry leaf weight

151
Annexure B Sampling criteria for data collection on shoot and seed quantitative characters
S. No. Parameters and their Codes Method of Analysis
1 Shoot Length (SL) From the base of fourth leaf to the tip of bud (cm)
2 Interned Distance (ID) ID was measured between 3rd and 4th leaf (cm)
3 Bud Length (BL) From base to the tip of Bud (cm)
4 Fresh Shoot Weight (FSW) Fresh Shoots with a bud and four leaves was
weighed (g)
5 Dry Shoot Weight (DSW) Fresh Shoots dried at 65 0C for 24 hours were
weighed (g)
6 Fresh to Dry Shoot ratio (FDS) Fresh Shoot weight was divided by dry Shoot
weight
7 Shoot Angle to Stem (SAS) Angle between Shoot and Stem was measured
8 Seed Weight (SW) 10 fresh seeds from five plants genotype-1 of same
age were weighed (g)

152
Annexure C
Qualitative Characters of leaf and flower and their analysis method
S. No. Parameter Method of Data Analysis
1 Leaf Shape (LS) Coded as 1-ovate, 2-oblong, 3- elliptic and 4-
lanceolate (figure 2.4)
2 Leaf Pose (LP) Coded as 1- erect, 2- semi-erect, and 3- horizontal
(figure 2.2).
3 Leaf Color (LF) Coded as 1- light green, 2- green, and 3- dark green
4 Leaf Serrulation (LSr) Coded as 1- regularly acute, 2-regularly blunt, 3-
irreglurly acute and 4- irregularly blunt (figure 2.3)
5 Leaf Base Shape (LBS) Coded as 1-Attenuate, 2- rounded and 3-blunt
(figure 2.1).
6 Flower Color (FC) Coded as 1- white and 2- purple
7 Number of Petals Coded as 1- 4, 2- 5 and 3- 6

153
Annexure D
Leaf base shape and leaf pose types considered for phenotypic analyses.
Source: reproduced from Anonymous (1997) and Banerjee (1987).
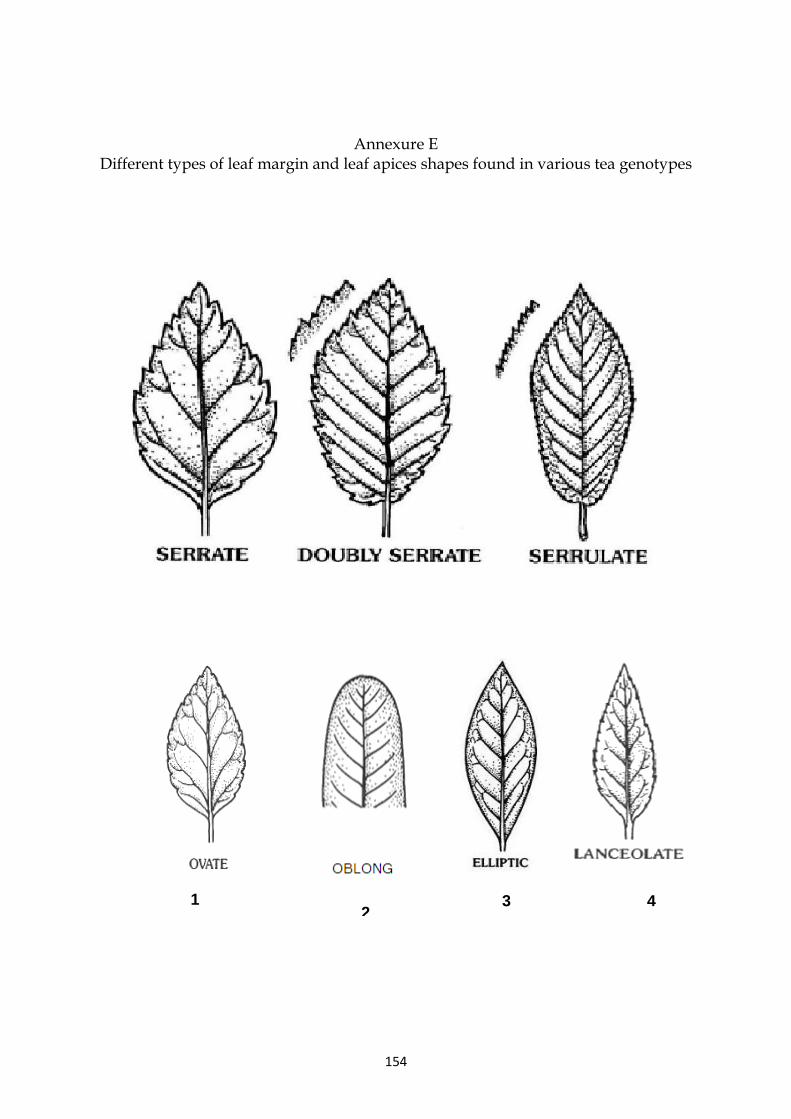
154
Annexure E Different types of leaf margin and leaf apices shapes found in various tea genotypes
1 1
2 3 4


![Mansehra Structure Plan[1]](https://img.dokumen.tips/doc/110x75/543ebc0eb1af9f880b8b47c8/mansehra-structure-plan1.jpg)