Embed Size (px)
Citation preview

SECOND QUARTERSix months ended 30th September, 2021
HAYLEYS PLCInterim Report

STATEMENT OF PROFIT OR LOSS
Consolidated
Audited Unaudited Unaudited Unaudited Unaudited
year ended 6 months to 6 months to 3 months to 3 months to
31.03.21 30.09.21 30.09.20 Change 30.09.21 30.09.20 Change
Rs.'000 Notes Rs.'000 Rs.'000 % Rs.'000 Rs.'000 %
241,275,661 Revenue 4 150,048,922 106,895,565 40 79,438,158 58,663,902 35
(178,244,709) Cost of sales (115,200,642) (79,201,739) 45 (61,330,333) (43,436,280) 41
(1,872,405) Direct interest cost (909,159) (960,208) (5) (473,647) (473,336) 0
61,158,547 Gross profit 33,939,121 26,733,618 27 17,634,178 14,754,286 20
1,467,771 Other income 918,669 539,157 70 485,254 305,465 59
(10,949,210) Distribution expenses (5,918,128) (5,723,152) 3 (3,181,998) (2,913,086) 9
(25,561,250) Administrative expenses (14,950,779) (11,642,595) 28 (7,516,901) (5,925,432) 27
(162,060) Other expenses (75,377) (76,270) (1) (43,422) (44,064) (1)
25,953,798 Results from operating activities 13,913,506 9,830,758 42 7,377,111 6,177,169 19
3,175,954 Finance income 2,195,464 1,242,479 77 1,526,651 705,314 116
(10,051,725) Finance cost (5,445,501) (5,636,134) (3) (3,070,351) (2,603,486) 18
(6,875,771) Net finance cost (3,250,037) (4,393,655) (26) (1,543,700) (1,898,172) (19)
195,638 Change in fair value of investment properties - - - - - -
252,611 Share of profit of equity accounted investees (net of tax) 218,833 202,949 8 138,835 140,261 (1)
(292,487) Value added tax on financial services (152,634) (116,578) 31 (82,996) (70,218) 18
19,233,789 Profit before tax for the period 5 10,729,668 5,523,474 94 5,889,250 4,349,040 35
(5,187,582) Tax expense (2,711,076) (1,700,251) 59 (1,461,068) (1,087,578) 34
14,046,207 Profit for the period 8,018,592 3,823,223 110 4,428,182 3,261,462 36
Profit for the period attributable to:
7,637,231 Owners of the parent 4,959,193 1,366,291 263 2,787,704 1,651,471 69
6,408,976 Non-controlling interest 3,059,399 2,456,932 25 1,640,478 1,609,991 2
14,046,207 Profit for the period 8,018,592 3,823,223 110 4,428,182 3,261,462 36
Earnings / per share
10.18 Basic (Rs.) 6.61 1.82 3.72 2.20
10.18 Diluted (Rs.) 6.61 1.82 3.72 2.20
The Notes on pages 12 to 14 form an integral part of these Financial Statements.
Figures in brackets indicate deductions.
Consolidated Consolidated
HAYLEYS PLC | Page 2
STATEMENT OF PROFIT OR LOSS
Company
Audited Unaudited Unaudited Unaudited Unaudited
year ended 6 months to 6 months to 3 months to 3 months to
31.03.21 30.09.21 30.09.20 Change 30.09.21 30.09.20 Change
Rs.'000 Notes Rs.'000 Rs.'000 % Rs.'000 Rs.'000 %
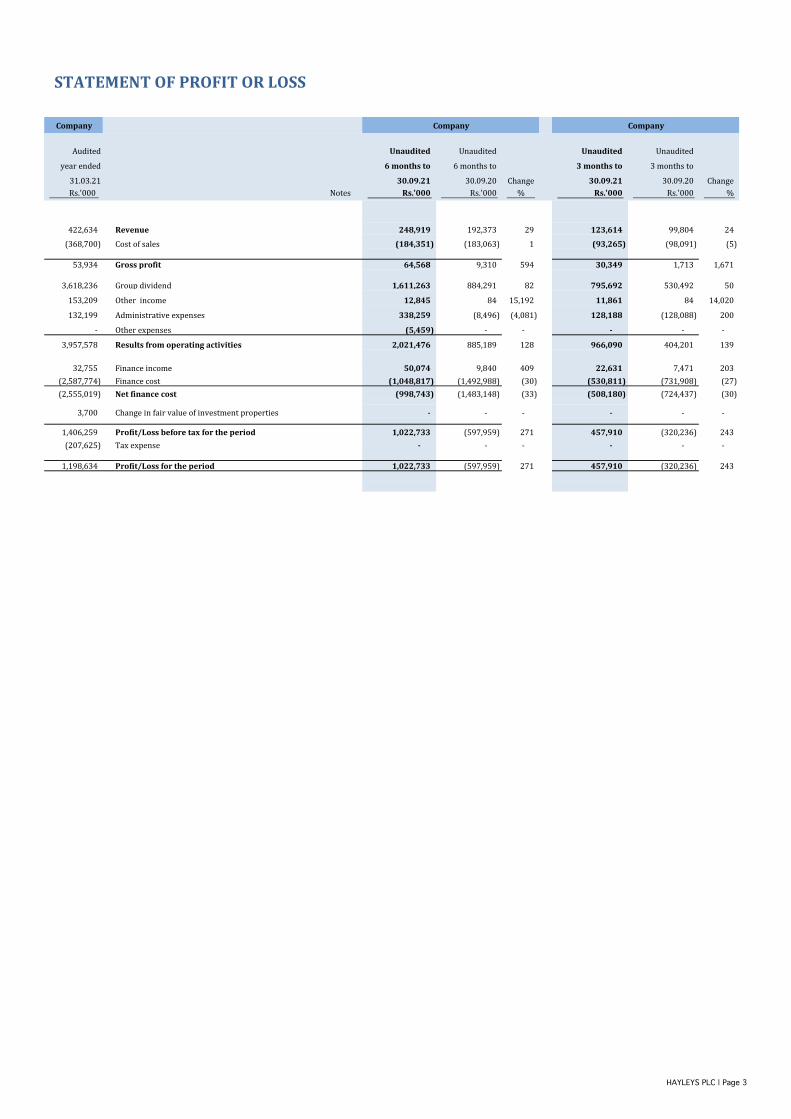
422,634 Revenue 5 248,919 192,373 29 123,614 99,804 24
(368,700) Cost of sales (184,351) (183,063) 1 (93,265) (98,091) (5)
53,934 Gross profit 64,568 9,310 594 30,349 1,713 1,671
3,618,236 Group dividend 1,611,263 884,291 82 795,692 530,492 50
153,209 Other income 12,845 84 15,192 11,861 84 14,020
132,199 Administrative expenses 338,259 (8,496) (4,081) 128,188 (128,088) 200
- Other expenses (5,459) - - - - -
3,957,578 Results from operating activities 2,021,476 885,189 128 966,090 404,201 139
32,755 Finance income 50,074 9,840 409 22,631 7,471 203
(2,587,774) Finance cost (1,048,817) (1,492,988) (30) (530,811) (731,908) (27)
(2,555,019) Net finance cost (998,743) (1,483,148) (33) (508,180) (724,437) (30)
3,700 Change in fair value of investment properties - - - - - -
1,406,259 Profit/Loss before tax for the period 5 1,022,733 (597,959) 271 457,910 (320,236) 243
(207,625) Tax expense - - - - - -
1,198,634 Profit/Loss for the period 1,022,733 (597,959) 271 457,910 (320,236) 243
Company Company
HAYLEYS PLC | Page 3
STATEMENT OF COMPREHENSIVE INCOME
Consolidated
Audited Unaudited Unaudited Unaudited Unaudited
year ended 6 months to 6 months to 3 months to 3 months to
31.03.21 30.09.21 30.09.20 Change 30.09.21 30.09.20 Change
Rs.'000 Rs.'000 Rs.'000 % Rs.'000 Rs.'000 %
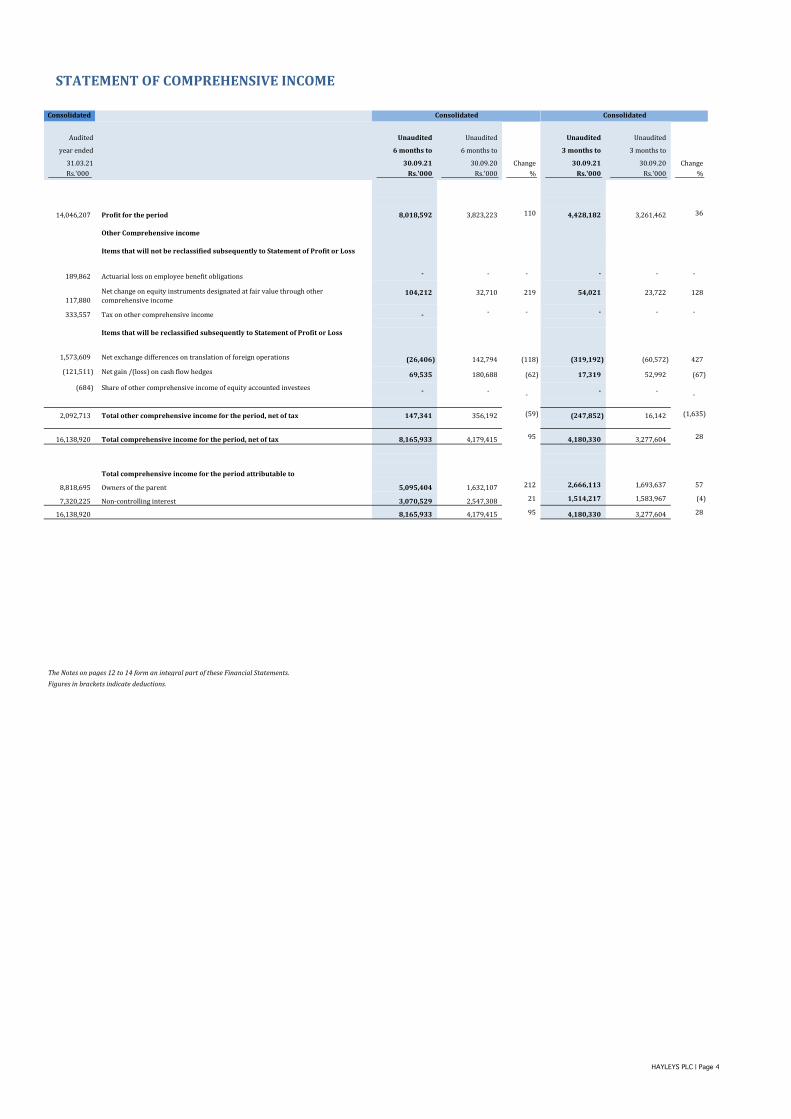
14,046,207 Profit for the period 8,018,592 3,823,223 110 4,428,182 3,261,462 36
Other Comprehensive income
Items that will not be reclassified subsequently to Statement of Profit or Loss
189,862 Actuarial loss on employee benefit obligations - - - - - -
117,880
Net change on equity instruments designated at fair value through other
comprehensive income104,212 32,710 219 54,021 23,722 128
333,557 Tax on other comprehensive income - - - - - -
Items that will be reclassified subsequently to Statement of Profit or Loss
1,573,609 Net exchange differences on translation of foreign operations (26,406) 142,794 (118) (319,192) (60,572) 427
(121,511) Net gain /(loss) on cash flow hedges 69,535 180,688 (62) 17,319 52,992 (67)
(684) Share of other comprehensive income of equity accounted investees - - -
- - -
2,092,713 Total other comprehensive income for the period, net of tax 147,341 356,192 (59) (247,852) 16,142 (1,635)
16,138,920 Total comprehensive income for the period, net of tax 8,165,933 4,179,415 95 4,180,330 3,277,604 28
Total comprehensive income for the period attributable to
8,818,695 Owners of the parent 5,095,404 1,632,107 212 2,666,113 1,693,637 57
7,320,225 Non-controlling interest 3,070,529 2,547,308 21 1,514,217 1,583,967 (4)
16,138,920 8,165,933 4,179,415 95 4,180,330 3,277,604 28
The Notes on pages 12 to 14 form an integral part of these Financial Statements.
Figures in brackets indicate deductions.
Consolidated Consolidated
HAYLEYS PLC | Page 4

STATEMENT OF COMPREHENSIVE INCOME
Company
Audited Unaudited Unaudited Unaudited Unaudited
year ended 6 months to 6 months to 3 months to 3 months to
31.03.21 30.09.21 30.09.20 Change 30.09.21 30.09.20 Change
Rs.'000 Rs.'000 Rs.'000 % Rs.'000 Rs.'000 %
1,198,634 Profit/(Loss) for the period 1,022,733 (597,959) 271 457,910 (320,236) 243
Other Comprehensive income
Items that will not be reclassified subsequently to Statement of Profit or Loss
(12,818) Actuarial loss on employee benefit obligations - - - - - -
-
Net change on equity instruments designated at fair value through other
comprehensive income- - - - - -
(1,571) Tax on other comprehensive income - - - - - -
Items that will be reclassified subsequently to Statement of Profit or Loss
- Net exchange differences on translation of foreign operations - - - - - -
- Net gain /(loss) on cash flow hedges - - - - - -
- Share of other comprehensive income of equity accounted investees - - - - - -
-
(14,389) Total other comprehensive income for the period, net of tax - - - - - -
1,184,245 Total comprehensive income for the period, net of tax 1,022,733 (597,959) 271 457,910 (320,236) 243
Company Company
HAYLEYS PLC | Page 5

STATEMENT OF FINANCIAL POSITION
Consolidated Company
Audited Audited Unaudited Unaudited Unaudited Unauditedas at as at as at as at as at as at
31.03.21 31.03.21 30.09.21 30.09.20 30.09.21 30.09.20Rs.'000 Rs.'000 Rs.'000 Rs.'000 Rs.'000 Rs.'000
ASSETSNon - current assets
89,685,742 137,225 Property, plant & equipment 93,704,536 87,495,460 127,408 155,115
9,934,309 255,329 Right-of- use assets 10,238,364 8,982,662 223,413 287,245
2,824,180 79,600 Investment Properties 2,431,558 2,719,663 79,600 75,900
530,543 - Biological assets 541,829 513,382 - -
13,272,669 58,698 Intangible assets 15,974,077 13,209,487 57,134 53,648
- 39,070,361 Investments in subsidiaries - - 38,898,188 39,147,957
2,097,766 1,504,863 Investments in equity accounted investees 2,270,399 2,317,050 1,504,863 1,504,863
248,805 64,687 Other non-current financial assets 350,450 259,407 60,906 73,148
11,912,418 - Non - current trade and other receivables 11,941,985 11,933,317 - -
1,007,322 - Other non-current assets 935,552 1,005,857 - -
2,311,501 24,525 Deferred tax assets 2,431,453 2,248,355 24,524 71,215
- 610,000 Amounts due from subsidiaries - - 610,000 -
133,825,255 41,805,288 Total non-current assets 140,820,203 130,684,640 41,586,036 41,369,091
Current assets
53,100,096 1,739 Inventories 68,238,452 37,732,322 1,812 1,944
- 2,509,908 Amounts due from subsidiaries - - 2,955,645 2,817,805
318,905 90,985 Amounts due from equity accounted investees 153,894 227,911 36,764 79,508
67,226,195 39,391 Trade and other receivables 78,955,321 59,731,822 60,050 50,105
2,893,143 19,716 Other current assets 4,473,085 2,547,461 180,111 110,505
764,443 - Income tax recoverable 711,420 1,285,140 - 64,002
463,524 8,002 Other current financial assets 943,388 234,790 9,441 7,097
7,876,500 241,719 Short-term deposits 13,358,415 4,729,144 248,350 118,250
12,912,378 85,613 Cash in hand and at bank 21,886,229 11,520,439 392,074 90,313
3,021 - Assets classified as held for sale 3,021 3,022 - -
145,558,205 2,997,073 Total current assets 188,723,225 118,012,051 3,884,247 3,339,529
279,383,460 44,802,361 Total assets 329,543,428 248,696,691 45,470,283 44,708,620
EQUITY AND LIABILITIES
1,575,000 1,575,000 Stated capital 1,575,000 1,575,000 1,575,000 1,575,000
688,411 13,226 Capital reserves 688,416 675,819 13,226 13,226
24,734,483 - Other components of equity 24,723,536 23,911,816 - -
20,620,432 14,518,971 Revenue reserves 25,057,763 14,966,941 15,541,705 13,486,767
47,618,326 16,107,197 Total equity attributable to equity holders of the company 52,044,715 41,129,576 17,129,931 15,074,993
27,580,255 - Non- controlling interest 29,836,778 24,776,972 - - 75,198,581 16,107,197 Total Equity 81,881,493 65,906,548 17,129,931 15,074,993
Non - current liabilities
51,503,754 19,205,466 Interest bearing borrowings 60,934,208 52,249,765 20,206,375 17,075,139
836,618 - Grants 840,835 831,336 - -
5,357,821 - Deferred tax liabilities 5,612,553 5,948,363 - -
1,366,565 - Security deposits 1,367,478 1,386,854 - -
1,666,017 - Other Non-current Liabilities 1,690,553 1,773,099 - -
2,091,132 - Other non-current financial liabilities 2,489,870 1,324,668 - -
9,777,004 1,055,971 Employee benefit obligations 10,602,983 9,609,138 1,141,965 1,019,208
72,598,911 20,261,437 Total non-current liabilities 83,538,480 73,123,223 21,348,340 18,094,347
Current liabilities
52,983,547 1,147,119 Trade and other payables 63,516,776 37,642,902 412,529 338,590
3,897,687 17,185 Other current liabilities 4,236,605 4,071,576 20,744 10,339
8,374,066 - Other current financial liabilities 9,662,982 6,819,227 - -
- 224,881 Amounts due to subsidiaries - 275,872 329,626
8,036 3,152 Amounts due to equity accounted investees 3,353 21,701 3,152 3,152
492,080 - Deferred Revenue 569,265 391,577 - -
2,871,625 84,485 Income tax payable 1,736,992 1,130,866 83,818 -
24,677,856 4,945,176 Current portion of long term interest bearing borrowings 21,429,845 22,325,188 5,185,885 4,125,342
38,280,739 2,011,729 Short-term interest bearing borrowings 62,967,305 37,263,551 1,010,012 6,732,231
332 - Liabilities directly associated with assets classified as held for sale 332 332 - -
131,585,968 8,433,727 Total current liabilities 164,123,455 109,666,920 6,992,012 11,539,280
204,184,879 28,695,164 Total liabilities 247,661,935 182,790,143 28,340,352 29,633,627
279,383,460 44,802,361 Total equity and liabilities 329,543,428 248,696,691 45,470,283 44,708,620
The Financial Statements have been prepared in compliance with the requirements of the Companies Act no 7 of 2007 .
sgd.
Choliya De SilvaGroup Chief Financial Officer
The Directors are responsible for the preparation and presentation of these Financial Statements.Signed for and on behalf of the Board
sgd. sgd.
Mohan Pandithage Sarath GanegodaChairman & Chief Executive Director
11th November 2021
The Notes on pages 12 to 14 form an integral part of these Financial Statements. Figures in brackets indicate deductions.
HAYLEYS PLC | Page 6
Consolidated Company

STATEMENT OF CHANGES IN EQUITY
For the period ended 30th September
Consolidated Stated Reserve Other Revaluation Fair value reserve Cashflow Foreign currency General Timber Bearer Biological Retained Shareholders' Non-controlling Total
capital on scrip capital reserve of financial assets hedge translation reserve reserve reserve earnings Funds interest Equity
issue reserve at FVOCI reserve reserve
Rs. '000 Rs.'000 Rs.'000 Rs.'000 Rs.'000 Rs.'000 Rs.'000 Rs.'000 Rs.'000 Rs.'000 Rs.'000 Rs.'000 Rs.'000 Rs.'000
Balance as at 31st March 2021 1,575,000 175,432 512,979 21,708,907 76,471 (849,098) 3,798,203 2,279,714 114,574 10,015 18,216,129 47,618,326 27,580,255 75,198,581
Profit for the period - - - - - - - - - - 4,959,193 4,959,193 3,059,399 8,018,592
Other Comprehensive income
Net exchange differences on translation of foreign operations - - - - - - 2,440 - - - - 2,440 (28,846) (26,406)
Net gain on cash flow hedges - - - - - 65,237 - - - - - 65,237 4,298 69,535 Net change on equity instruments designated at fair value through
other comprehensive income - - - - 68,534 - - - - - - 68,534 35,678 104,212
Total other comprehensive income - - - - 68,534 65,237 2,440 - - - - 136,211 11,130 147,341
Total Comprehensive income for the period - - - - 68,534 65,237 2,440 - - - 4,959,193 5,095,404 3,070,529 8,165,933
Transactions with owners, recorded directly in equity
Dividends to equity holders - - - - - - - - - - - - (1,407,000) (1,407,000)
Transfers - - - (20,405) - - - 1,624 - - 18,781 - - -
Total contributions by and distributions to owners - - - (20,405) - - - 1,624 - - 18,781 - (1,407,000) (1,407,000)
Changes in ownership interests in subsidiaries
Adjustment on changes to non-controlling interest in subsidiaries - 5 - (228,245) 1,445 - 100,047 (1,222) - - (541,045) (669,015) 581,108 (87,907)
Disposal of Subsidiaries - - - - - - - - - - - - (6,000) (6,000)
Acquisition of Subsidiaries - - - - - - - - - - - 17,886 17,886
Total changes in ownership interests in subsidiaries - 5 - (228,245) 1,445 - 100,047 (1,222) - - (541,045) (669,015) 592,994 (76,021)
Total transactions with owners - 5 - (248,650) 1,445 - 100,047 402 - - (522,264) (669,015) (814,006) (1,483,021)
Balance as at 30th September 2021 1,575,000 175,437 512,979 21,460,257 146,450 (783,861) 3,900,690 2,280,116 114,574 10,015 22,653,058 52,044,715 29,836,778 81,881,493
The Notes on pages 12 to 14 form an integral part of these Financial Statements. (8,572) 10,456,969 2,864 1,784,802 11,880 29,329 6,646
Figures in brackets indicate deductions.
Attributable to owners of the Company
Capital Reserves Other Components of Equity Revenue Reserves
HAYLEYS PLC | Page 7
STATEMENT OF CHANGES IN EQUITY
For the period ended 30th September
Consolidated Stated Reserve Other Revaluation Fair value reserve Cashflow Foreign currency General Timber Bearer Retained Shareholders' Non-controlling Total
capital on scrip capital reserve of financial assets hedge translation reserve reserve Biological earnings Funds interest Equity
issue reserve at FVOCI reserve reserve reserve
Rs. '000 Rs.'000 Rs.'000 Rs.'000 Rs.'000 Rs.'000 Rs.'000 Rs.'000 Rs.'000 Rs.'000 Rs.'000 Rs.'000 Rs.'000 Rs.'000
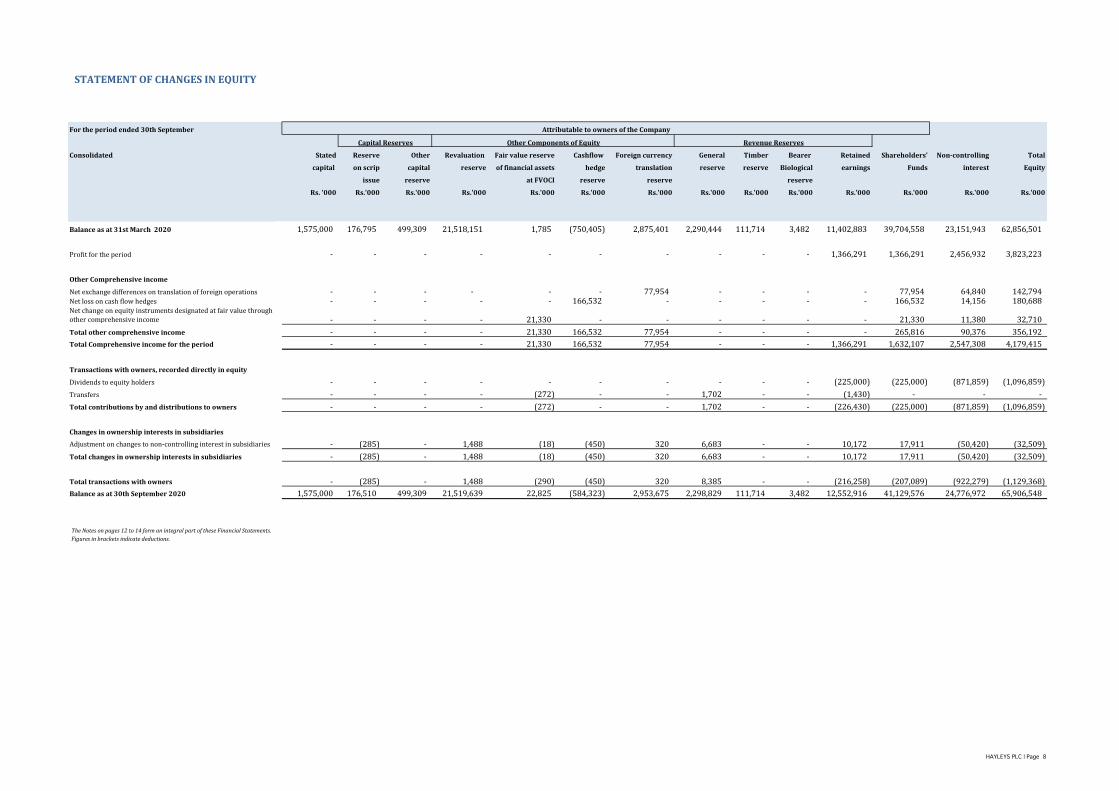
Balance as at 31st March 2020 1,575,000 176,795 499,309 21,518,151 1,785 (750,405) 2,875,401 2,290,444 111,714 3,482 11,402,883 39,704,558 23,151,943 62,856,501
Profit for the period - - - - - - - - - - 1,366,291 1,366,291 2,456,932 3,823,223
Other Comprehensive income
Net exchange differences on translation of foreign operations - - - - - - 77,954 - - - - 77,954 64,840 142,794 Net loss on cash flow hedges - - - - - 166,532 - - - - - 166,532 14,156 180,688 Net change on equity instruments designated at fair value through other comprehensive income - - - - 21,330 - - - - - - 21,330 11,380 32,710
Total other comprehensive income - - - - 21,330 166,532 77,954 - - - - 265,816 90,376 356,192
Total Comprehensive income for the period - - - - 21,330 166,532 77,954 - - - 1,366,291 1,632,107 2,547,308 4,179,415
- -
Transactions with owners, recorded directly in equity
Dividends to equity holders - - - - - - - - - - (225,000) (225,000) (871,859) (1,096,859)
Transfers - - - - (272) - - 1,702 - - (1,430) - - -
Total contributions by and distributions to owners - - - - (272) - - 1,702 - - (226,430) (225,000) (871,859) (1,096,859)
Changes in ownership interests in subsidiaries
Adjustment on changes to non-controlling interest in subsidiaries - (285) - 1,488 (18) (450) 320 6,683 - - 10,172 17,911 (50,420) (32,509)
Total changes in ownership interests in subsidiaries - (285) - 1,488 (18) (450) 320 6,683 - - 10,172 17,911 (50,420) (32,509)
Total transactions with owners - (285) - 1,488 (290) (450) 320 8,385 - - (216,258) (207,089) (922,279) (1,129,368)
Balance as at 30th September 2020 1,575,000 176,510 499,309 21,519,639 22,825 (584,323) 2,953,675 2,298,829 111,714 3,482 12,552,916 41,129,576 24,776,972 65,906,548
1,575,000 577,326 490,492 10,636,028 1,819 939,050 2,233,358 72,860 2,346 14,567,260 15,817,529 46,913,069
The Notes on pages 12 to 14 form an integral part of these Financial Statements. 8,817 10,883,611 21,006 2,014,625 65,471 38,854 1,136
Figures in brackets indicate deductions.
Attributable to owners of the Company
Capital Reserves Other Components of Equity Revenue Reserves
HAYLEYS PLC | Page 8

STATEMENT OF CHANGES IN EQUITY
For the period ended 30th September
Capital
Reserve
CompanyStated Other General Retained Total
capital capital reserve earnings Equity
reserve
Rs. '000 Rs.'000 Rs.'000 Rs.'000 Rs.'000
Balance as at 31st March 2021 1,575,000 13,226 382,087 14,136,885 16,107,198
Profit for the period - - - 1,022,733 1,022,733
Transactions with owners, recorded directly in equity
Dividends to equity holders - - - - -
Total contributions by and distributions to owners - - - - -
Total transactions with owners - - - - -
Balance as at 30th September 2021 1,575,000 13,226 382,087 15,159,618 17,129,931
Balance as at 31st March 2020 1,575,000 13,226 382,087 13,927,639 15,897,952
Loss for the period - - - (597,959) (597,959)
Total Comprehensive income for the period - - - (597,959) (597,959)
Transactions with owners, recorded directly in equity
Dividends to equity holders - - - (225,000) (225,000)
Total contributions by and distributions to owners - - - (225,000) (225,000)
Total transactions with owners - - - (225,000) (225,000)
Balance as at 30th September 2020 1,575,000 13,226 382,087 13,104,680 15,074,993
The Notes on pages 12 to 14 form an integral part of these Financial Statements.
Figures in brackets indicate deductions.
Revenue Reserves
HAYLEYS PLC | Page 9

STATEMENT OF CASH FLOWS
Consolidated Company
Audited Audited Unaudited Unaudited Unaudited Unaudited
year ended year ended 6 months to 6 months to 6 months to 6 months to
31.03.21 31.03.21 30.09.21 30.09.20 30.09.21 30.09.20
Rs.'000 Rs.'000 Rs.'000 Rs.'000 Rs.'000 Rs.'000
Cash flows from operating activities
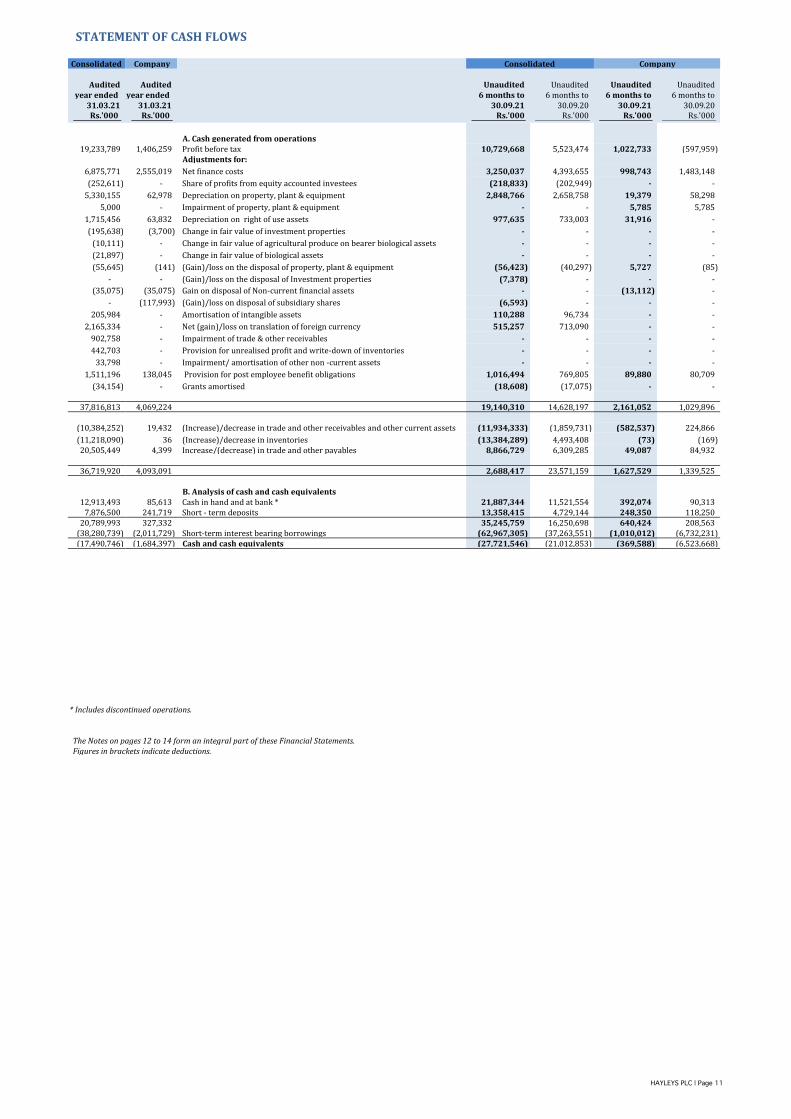
36,719,920 4,093,091 Cash generated from operations (Note A) 2,688,417 23,571,159 1,627,529 1,339,525
(851,217) (47,443) Employee benefit paid (359,328) (424,429) (3,885) (14,134)
(2,940,271) (15,104) Income tax paid (3,764,354) (1,290,733) - (1,085)
32,928,432 4,030,544 Net cash inflow from operating activities (1,435,265) 21,855,997 1,623,644 1,324,306
Cash flows from investing activities
(5,768,264) (44,957) Purchase and construction of property, plant & equipment (4,680,788) (1,827,455) (21,541) (26,797)
- - Purchase of intangible assets (299,859) - (10,707) -
(79,263) (227) Investments in other non- current assets (23,407) - - -
(2,569,859) - Investments in other current financial assets (1,095,023) (875,596) - -
- Investments in other non -current financial assets (1,200) - - -
(15,192) - Development of biological assets (11,286) (8,142) - -
Decrease due to harvest - - - -
82,779 - Grants received - capital 22,825 60,418 - -
(2,282) - Improvements to investment property - (403) - -
280,672 356 Proceeds from disposal of property, plant & equipment/ Intangible assets 106,873 91,154 - 110
93,984 - Proceeds from disposal of intangible assets - 92,027 - -
2,567,831 - Proceeds from disposal of current financial assets 615,161 1,088,287 -
93,000 Proceeds from sale of investment property 400,000 - -
- - Proceeds from disposal of subsidiaries 30,592 (105,276) 249,921 -
(270,932) - On acquisition of right to generate hydro power/ ERP system - - - -
170,056 39,420 Proceeds from buy back of shares of non current financial assets - - - -
- (23,667) Long term investments in group companies and others (4,348,753) - (64,638) (3,084)
94,678 - Cash inflow from transfer of equity accounted investee to subsidiary - - - -
- 215,989 Disposal of subsidiary shares - - - -
Net of gurantee income & fees - - 26
579,391 19,086 Interest received 541,073 299,810 48,219 7,378
108,864 - Net movement in deferred revenue 77,185 8,359 - -
137,500 - Dividends received from equity accounted investees 46,200 - - -
4,417 319 Dividends received from non-group companies 16,586 2,853 134 165
(4,492,620) 206,319 Net cash used in investing activities (8,603,821) (1,173,964) 201,415 (22,228)
28,435,812 4,236,863 Net cash inflow before financing (10,039,086) 20,682,033 1,825,060 1,302,078
Cash flows from financing activities
(2,121,159) - Payment on lease (792,885) (464,390) - -
(7,664,020) (2,525,448) Interest paid (including interest capitalized) (4,228,095) (4,774,451) (1,025,251) (1,457,934)
(3,103,476) - Dividend paid to non-controlling interest (1,407,000) (871,859) - -
- - Proceeds from debenture issue 2,000,000 -
- - Debenture Redemption (662,011) - - -
37,333,408 11,200,000 Proceeds from interest-bearing borrowings 17,411,990 22,512,364 3,900,000 6,000,000
(41,086,784) (9,150,000) Repayment of interest-bearing borrowings (11,164,293) (26,360,016) (2,635,000) (6,925,000)
- - Transfers to short-term interest bearing borrowings (2,200,080) - - -
- (3,000) Long term loan facility fee - 1,128,851 - -
3,450,153 - Net movement in financial liabilities 1,687,654 (7,757) - -
(28,046) - Net movement in security deposits 913 - - -
150,995 - Acquisition of non-controlling interest (87,907) - - -
(225,000) (225,000) Dividends paid to equity holders of parent (750,000) (225,000) (750,000) (225,000)
(13,293,929) (703,448) Net cash inflow / (outflow) from financing activities (191,714) (9,062,258) (510,251) (2,607,934)
15,141,883 3,533,415 Net increase / (decrease) in cash and cash equivalents (10,230,800) 11,619,776 1,314,809 (1,305,856)
(32,632,629) (5,217,812) Cash and cash equivalents at beginning of the year/period (17,490,746) (32,632,629) (1,684,397) (5,217,812)
(17,490,746) (1,684,397) Cash and cash equivalents at end of the year/period (Note B) (27,721,546) (21,012,853) (369,588) (6,523,668)
0.40 0.04 - (0.42) 0.45 -
Net cash flows related to discontinued operation, shown in Note 7, discontinued operation
The Notes on pages 12 to 14 form an integral part of these Financial Statements.
Figures in brackets indicate deductions.
Consolidated Company
HAYLEYS PLC | Page 10
STATEMENT OF CASH FLOWS
Consolidated Company
Audited Audited Unaudited Unaudited Unaudited Unauditedyear ended year ended 6 months to 6 months to 6 months to 6 months to
31.03.21 31.03.21 30.09.21 30.09.20 30.09.21 30.09.20Rs.'000 Rs.'000 Rs.'000 Rs.'000 Rs.'000 Rs.'000
A. Cash generated from operations19,233,789 1,406,259 Profit before tax 10,729,668 5,523,474 1,022,733 (597,959)
Adjustments for:
6,875,771 2,555,019 Net finance costs 3,250,037 4,393,655 998,743 1,483,148
(252,611) - Share of profits from equity accounted investees (218,833) (202,949) - -
5,330,155 62,978 Depreciation on property, plant & equipment 2,848,766 2,658,758 19,379 58,298
5,000 - Impairment of property, plant & equipment - - 5,785 5,785
1,715,456 63,832 Depreciation on right of use assets 977,635 733,003 31,916 -
(195,638) (3,700) Change in fair value of investment properties - - - -
(10,111) - Change in fair value of agricultural produce on bearer biological assets - - - -
(21,897) - Change in fair value of biological assets - - - -
(55,645) (141) (Gain)/loss on the disposal of property, plant & equipment (56,423) (40,297) 5,727 (85)
- - (Gain)/loss on the disposal of Investment properties (7,378) - - -
(35,075) (35,075) Gain on disposal of Non-current financial assets - - (13,112) -
- (117,993) (Gain)/loss on disposal of subsidiary shares (6,593) - - -
205,984 - Amortisation of intangible assets 110,288 96,734 - -
2,165,334 - Net (gain)/loss on translation of foreign currency 515,257 713,090 - -
902,758 - Impairment of trade & other receivables - - - -
442,703 - Provision for unrealised profit and write-down of inventories - - - -
33,798 - Impairment/ amortisation of other non -current assets - - - -
1,511,196 138,045 Provision for post employee benefit obligations 1,016,494 769,805 89,880 80,709
(34,154) - Grants amortised (18,608) (17,075) - -
37,816,813 4,069,224 19,140,310 14,628,197 2,161,052 1,029,896
(10,384,252) 19,432 (Increase)/decrease in trade and other receivables and other current assets (11,934,333) (1,859,731) (582,537) 224,866
(11,218,090) 36 (Increase)/decrease in inventories (13,384,289) 4,493,408 (73) (169) 20,505,449 4,399 Increase/(decrease) in trade and other payables 8,866,729 6,309,285 49,087 84,932
36,719,920 4,093,091 2,688,417 23,571,159 1,627,529 1,339,525
B. Analysis of cash and cash equivalents12,913,493 85,613 Cash in hand and at bank * 21,887,344 11,521,554 392,074 90,313
7,876,500 241,719 Short - term deposits 13,358,415 4,729,144 248,350 118,250 20,789,993 327,332 35,245,759 16,250,698 640,424 208,563
(38,280,739) (2,011,729) Short-term interest bearing borrowings (62,967,305) (37,263,551) (1,010,012) (6,732,231) (17,490,746) (1,684,397) Cash and cash equivalents (27,721,546) (21,012,853) (369,588) (6,523,668)
* Includes discontinued operations.
The Notes on pages 12 to 14 form an integral part of these Financial Statements. Figures in brackets indicate deductions.
Consolidated Company
HAYLEYS PLC | Page 11

NOTES TO THE FINANCIAL STATEMENTS
1
The Interim Condensed Financial Statements have been prepared on a historical cost basis, except for, land ,biological assets and financial instruments.
These Statements also provide information required by the Colombo Stock Exchange.
2
3
4 INDUSTRY SEGMENT REVENUE
Consolidated
Total Intra-group
Audited Unaudited Unaudited
year ended 6 months to 6 months to
31.03.21 30.09.21 30.09.20
Rs.'000 Rs.'000 Rs.'000 Rs.'000 Rs.'000
7,827,005 Eco Solutions 6,495,016 1,237,482 5,257,534 3,537,626
30,396,579 Hand Protection 21,502,459 20,253 21,482,206 12,786,490
25,484,567 Purification Products 14,849,539 - 14,849,539 11,879,232
14,575,488 Textiles 14,586,479 462,683 14,123,796 7,104,315
5,892,089 Construction Materials 3,927,181 89,933 3,837,248 2,293,802
19,232,968 Agriculture 11,558,877 265,452 11,293,425 7,253,832
15,930,341 Plantations 8,860,638 354,653 8,505,985 7,466,352
37,240,564 Transportation & Logistics 28,017,024 38,421 27,978,603 16,337,448
73,022,659 Consumer & Retail 34,394,253 - 34,394,253 33,339,366
3,694,900 Industry Inputs 2,514,706 207,287 2,307,419 1,839,654
1,310,590 Power & Energy 748,927 12,484 736,443 779,423
1,345,876 Leisure 707,744 17,080 690,664 556,285
5,322,035 Others 5,605,486 1,013,679 4,591,807 1,721,740
241,275,661 153,768,329 3,719,407 150,048,922 106,895,565
241,275,661 150,048,922 106,895,565
External
Consolidated
The Interim Condensed Financial Statements have been prepared in compliance with Sri Lanka Accounting Standard LKAS 34- Interim Financial
Reporting. These Interim Condensed Financial Statements should be read in conjunction with the Annual Financial Statements for the year ended 31st
March 2021.
There has not been a significant change in the nature of the contingent liabilities, which were disclosed in the Annual Report for the year ended 31st
March 2021.
No circumstances have arisen since the reporting date, which would require adjustments to or disclosure in the Financial Statements. The
presentation and classification of the Financial Statements of the previous year have been amended, where relevant, for better presentation and to be
comparable with those of the current year.
HAYLEYS PLC | Page 12
NOTES TO THE FINANCIAL STATEMENTS
-43,153,357 -1,520,022
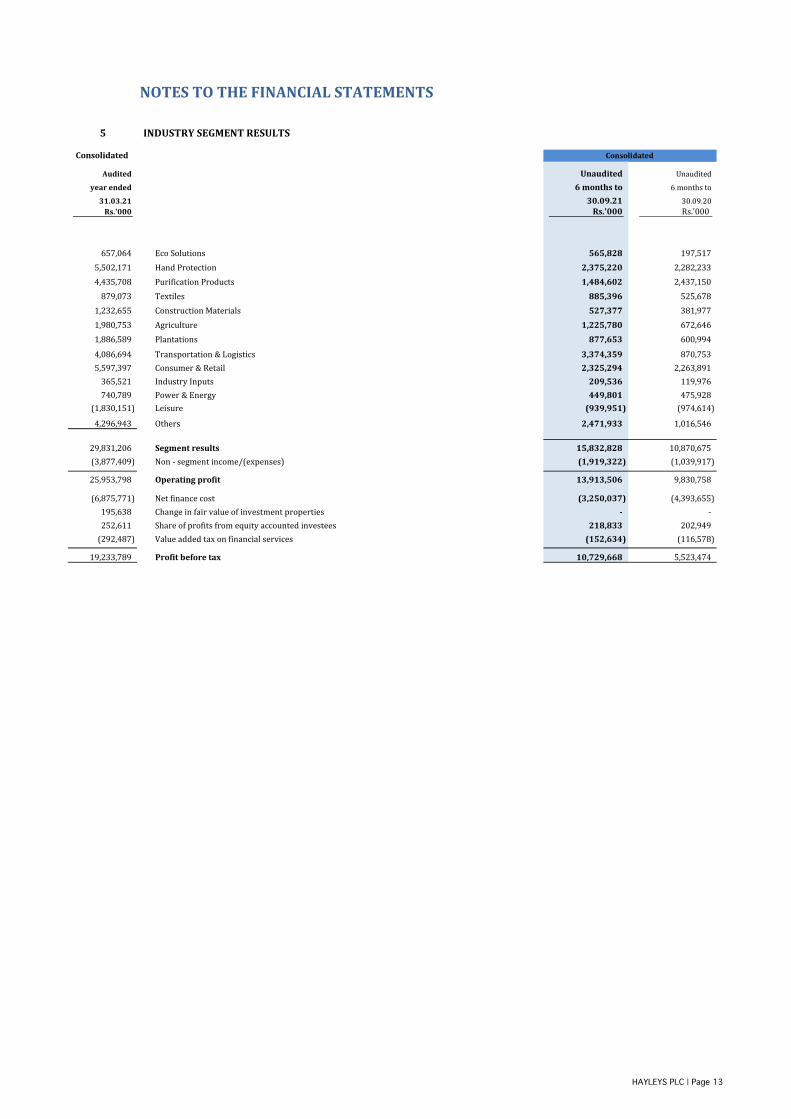
5 INDUSTRY SEGMENT RESULTS
Consolidated
Audited Unaudited Unaudited
year ended 6 months to 6 months to
31.03.21 30.09.21 30.09.20
Rs.'000 Rs.'000 Rs.'000
657,064 Eco Solutions 565,828 197,517
5,502,171 Hand Protection 2,375,220 2,282,233
4,435,708 Purification Products 1,484,602 2,437,150
879,073 Textiles 885,396 525,678
1,232,655 Construction Materials 527,377 381,977
1,980,753 Agriculture 1,225,780 672,646
1,886,589 Plantations 877,653 600,994
4,086,694 Transportation & Logistics 3,374,359 870,753
5,597,397 Consumer & Retail 2,325,294 2,263,891
365,521 Industry Inputs 209,536 119,976
740,789 Power & Energy 449,801 475,928
(1,830,151) Leisure (939,951) (974,614)
4,296,943 Others 2,471,933 1,016,546
29,831,206 Segment results 15,832,828 10,870,675
(3,877,409) Non - segment income/(expenses) (1,919,322) (1,039,917)
25,953,798 Operating profit 13,913,506 9,830,758
(6,875,771) Net finance cost (3,250,037) (4,393,655)
195,638 Change in fair value of investment properties - -
252,611 Share of profits from equity accounted investees 218,833 202,949
(292,487) Value added tax on financial services (152,634) (116,578)
19,233,789 Profit before tax 10,729,668 5,523,474 10,729,668 5,523,474
Consolidated
HAYLEYS PLC | Page 13

NOTES TO THE FINANCIAL STATEMENTSNOTES TO THE FINANCIAL STATEMENTS
6 STATED CAPITAL
Company
Audited Unaudited Unaudited
as at as at as at
31.03.21 30.09.21 30.09.20
Rs.'000 Rs.'000 Rs.'000
Issued and fully paid
1,575,000 750,000,000 (75,000,000 - 30.09.2020) Ordinary Shares 1,575,000 1,575,000
7 ASSETS AND LIABILITIES OF DISCONTINUED OPERATIONS
Consolidated
Audited Unaudited Unaudited
as at as at as at
31.03.21 30.09.21 30.09.20Rs.'000 Rs.'000 Rs.'000
Assets classified as held for sale
1,906 Trade and Other Receivables 1,906 1,906
1,115 Cash in Hand and at Bank 1,115 1,115
3,021 Total assets 3,021 3,021
Liabilities directly associated with assets classified as held for sale
332 Trade and other payables 332 332
332 Total equity and liabilities 332 332
8 AQUSITION OF SUBSIDAIRY
UnauditedRs.'000
Net identifiable assets and liabilities aquired excluding cash and cash equivalents 2,284,749 Cash in hand and bank aquired 50,701 Short term borrowings (806,712) Total net assets acquired including cash & cash Equivalent 1,528,738
Less : Non-controlling' interests (17,886) 1,510,852
Goodwill aquired 2,442,510 Value of investment 3,953,362
Subsequent to the acquisition of a 98.83% equity stake in South Asia Textiles Limited on 22nd April 2021, the balance 1.17% equity stake
was acquired on 15th July 2021 for Rs. 46.6 Mn. A provisional amount of Rs. 2.4 Bn has been recognized as Goodwill in the Interim
Condensed Financial Statements owing to the business combination. Further considerations are presently being made in the determination
of fair values for assets acquired and liabilities assumed through the business combination.
Consolidated
Company
HAYLEYS PLC | Page 14
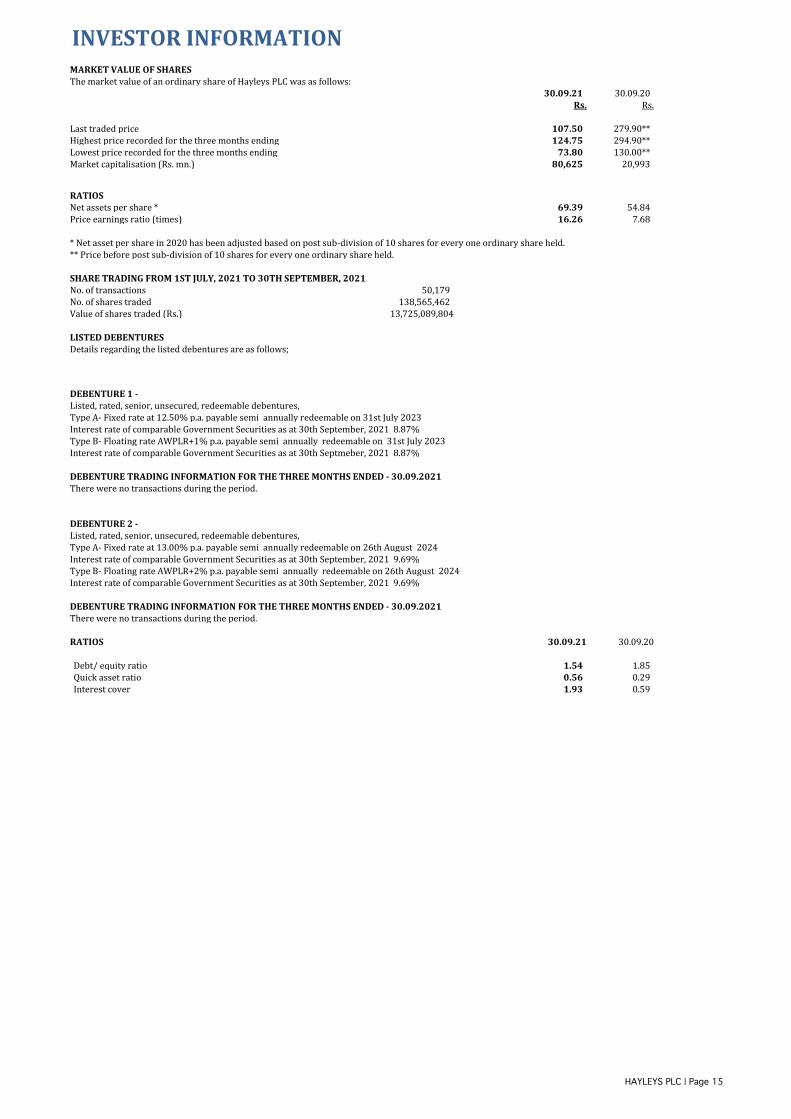
INVESTOR INFORMATIONMARKET VALUE OF SHARESThe market value of an ordinary share of Hayleys PLC was as follows:
30.09.21 30.09.20Rs. Rs.
Last traded price 107.50 279.90**Highest price recorded for the three months ending 124.75 294.90**Lowest price recorded for the three months ending 73.80 130.00**Market capitalisation (Rs. mn.) 80,625 20,993
RATIOSNet assets per share * 69.39 54.84 Price earnings ratio (times) 16.26 7.68
* Net asset per share in 2020 has been adjusted based on post sub-division of 10 shares for every one ordinary share held.** Price before post sub-division of 10 shares for every one ordinary share held.
SHARE TRADING FROM 1ST JULY, 2021 TO 30TH SEPTEMBER, 2021No. of transactions 50,179 No. of shares traded 138,565,462 Value of shares traded (Rs.) 13,725,089,804
LISTED DEBENTURESDetails regarding the listed debentures are as follows;
DEBENTURE 1 -Listed, rated, senior, unsecured, redeemable debentures, Type A- Fixed rate at 12.50% p.a. payable semi annually redeemable on 31st July 2023 Interest rate of comparable Government Securities as at 30th September, 2021 8.87%Type B- Floating rate AWPLR+1% p.a. payable semi annually redeemable on 31st July 2023Interest rate of comparable Government Securities as at 30th Septmeber, 2021 8.87%
DEBENTURE TRADING INFORMATION FOR THE THREE MONTHS ENDED - 30.09.2021There were no transactions during the period.
DEBENTURE 2 -Listed, rated, senior, unsecured, redeemable debentures, Type A- Fixed rate at 13.00% p.a. payable semi annually redeemable on 26th August 2024Interest rate of comparable Government Securities as at 30th September, 2021 9.69%Type B- Floating rate AWPLR+2% p.a. payable semi annually redeemable on 26th August 2024Interest rate of comparable Government Securities as at 30th September, 2021 9.69%
DEBENTURE TRADING INFORMATION FOR THE THREE MONTHS ENDED - 30.09.2021There were no transactions during the period.
RATIOS 30.09.21 30.09.20
Debt/ equity ratio 1.54 1.85 Quick asset ratio 0.56 0.29 Interest cover 1.93 0.59
HAYLEYS PLC | Page 15

INVESTOR INFORMATION
FIRST TWENTY SHAREHOLDERS AS AT 30TH SEPTEMBER, 2021
No.of Shares %
1 Mr.K.D.D.Perera 382,596,970 51.01
2 Trustees of the D.S.Jayasundera Trust 86,980,170 11.60
3 Finco Holdings (Private) Ltd 23,408,300 3.12
4 Hayleys Group Services(Private) Ltd No.02 A/C 11,170,900 1.49
5 Sri Lanka Insurance Corporation Ltd-Life Fund 7,433,159 0.99
6 McLarens Holdings Ltd 6,546,250 0.87
7 Mrs.R.N.Ponnambalam 6,266,880 0.84
8 Mr.N.K.A.D.De Silva 5,701,660 0.76
9 Amana Bank PLC/Mr.M.N.Deen 5,650,343 0.75
10 Mrs.R.M.Spittel 5,646,970 0.75
11 Mrs.A.M.L.Johnpulle & Mr.B.J.M.Johnpulle 4,765,213 0.64
12 Mrs.Y.M.Spittel (Deceased) 4,655,610 0.62
13 Mrs.S.D. Wickremasinghe 4,492,980 0.60
14 Mrs.P.M Godamunne 4,434,470 0.59
15 Mrs.A.K Wikramanayake 4,384,490 0.58
16 Seylan Bank PLC / Janashakthi Capital Limited 3,350,000 0.45
17 Mr.A.C.Wikramanayake & Mrs.S.R.D.Wikramanayake 3,194,320 0.43
18 Mr.S.Rameshan 3,169,820 0.42
19 Miss.N.K.R.H.De Silva 2,834,010 0.38
20 Dr.D.Jayanntha 2,580,000 0.34
Total 579,262,515 77.24
There were no non voting shares as at 30th Septebmer, 2021.
PUBLIC HOLDING
Percentage of public holding as at 30th September, 2021 37.09%
Total number of Shareholders representing the Public Holding 10,656
Float- adjusted market capitalization (Rs.) 29,903,812,500
The Company complies with option 1 of the Listing Rules 7.13.1 (a) which no minimum Public Holding.
DIRECTORS’ SHAREHOLDINGS AS AT 30TH SEPTEMBER, 2021
Name of the Director No.of Shares
Mr.K.D.D.Perera 382,613,630 *
Mr. A M Pandithage 1,253,570
Mr S C Ganegoda 250,000
Mr H S R Kariyawasan 94,270
Mr L R V Waidyaratne 379,300
Ms. J. Dharmasena 210,950
* Inclusive of indirect holding through other companies in which he owns controlling interest.
Name of the Shareholder
Directors' holdings of ordinary shares in the Company were as follows
HAYLEYS PLC | Page 16
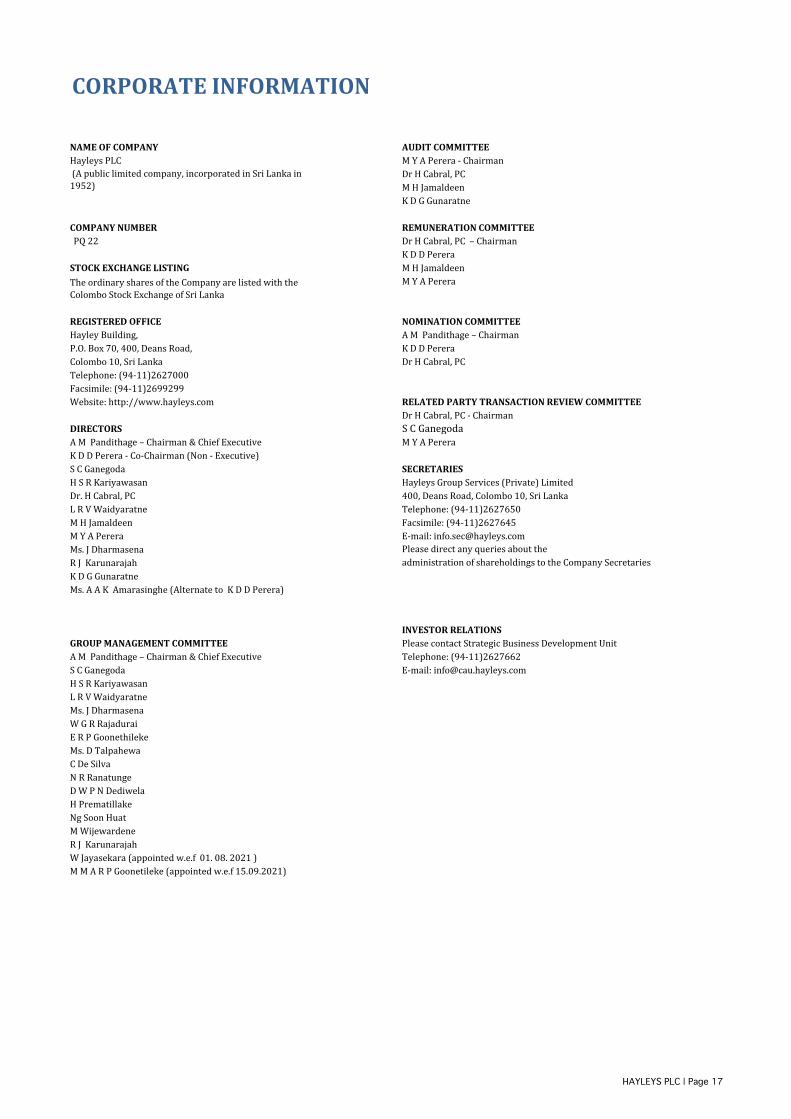
CORPORATE INFORMATION
NAME OF COMPANY AUDIT COMMITTEE
Hayleys PLC M Y A Perera - Chairman
Dr H Cabral, PC
M H Jamaldeen
K D G Gunaratne
COMPANY NUMBER REMUNERATION COMMITTEE
PQ 22 Dr H Cabral, PC – Chairman
K D D Perera
STOCK EXCHANGE LISTING M H Jamaldeen
M Y A Perera
REGISTERED OFFICE NOMINATION COMMITTEE
Hayley Building, A M Pandithage – Chairman
P.O. Box 70, 400, Deans Road, K D D Perera
Colombo 10, Sri Lanka Dr H Cabral, PC
Telephone: (94-11)2627000
Facsimile: (94-11)2699299
Website: http://www.hayleys.com RELATED PARTY TRANSACTION REVIEW COMMITTEE
Dr H Cabral, PC - Chairman
DIRECTORS S C Ganegoda
A M Pandithage – Chairman & Chief Executive M Y A Perera
K D D Perera - Co-Chairman (Non - Executive)
S C Ganegoda SECRETARIES
H S R Kariyawasan Hayleys Group Services (Private) Limited
Dr. H Cabral, PC 400, Deans Road, Colombo 10, Sri Lanka
L R V Waidyaratne Telephone: (94-11)2627650
M H Jamaldeen Facsimile: (94-11)2627645
M Y A Perera E-mail: [email protected]
Ms. J Dharmasena Please direct any queries about the
R J Karunarajah administration of shareholdings to the Company Secretaries
K D G Gunaratne
Ms. A A K Amarasinghe (Alternate to K D D Perera)
INVESTOR RELATIONS
GROUP MANAGEMENT COMMITTEE Please contact Strategic Business Development Unit
A M Pandithage – Chairman & Chief Executive Telephone: (94-11)2627662
S C Ganegoda E-mail: [email protected]
H S R Kariyawasan
L R V Waidyaratne
Ms. J Dharmasena
W G R Rajadurai
E R P Goonethileke
Ms. D Talpahewa
C De Silva
N R Ranatunge
D W P N Dediwela
H Prematillake
Ng Soon Huat
M Wijewardene
R J Karunarajah
W Jayasekara (appointed w.e.f 01. 08. 2021 )
M M A R P Goonetileke (appointed w.e.f 15.09.2021)
(A public limited company, incorporated in Sri Lanka in
1952)
The ordinary shares of the Company are listed with the
Colombo Stock Exchange of Sri Lanka
HAYLEYS PLC | Page 17


![Hayleys PLC - Annual Report 2018/19...Hayleys PLC | Annual Report 2018/19 Welcome to Our Integrated Annual Report Timing is Everything - t; v =v bm|;]u-|;7 u;rou m] ruo1;vv](https://img.dokumen.tips/doc/110x75/5e96611a20469c528022f76b/hayleys-plc-annual-report-201819-hayleys-plc-annual-report-201819-welcome.jpg)


![SMD MPI30-JUL-2019 · blue diamonds [x] blue diamonds singhe hospitals paragon hayleys fabric people's merch c.w.mackie john keells renuka holdings [x] hayleys company vwa prev. close](https://img.dokumen.tips/doc/110x75/5e6d958b1c33f44c1d5a5a99/smd-mpi30-jul-2019-blue-diamonds-x-blue-diamonds-singhe-hospitals-paragon-hayleys.jpg)