Embed Size (px)
Citation preview

Effect of Dispersant on Asphaltene Suspension
Dynamics: Aggregation and Sedimentation
Sara M. Hashmi, and Abbas Firoozabadi∗
Department of Chemical Engineering, Yale University, New Haven, CT 06510
E-mail: [email protected]
Abstract
When oil is mixed with light alkanes, asphaltenes can precipitate out of oil solutions in a
multistep process that involves the formation of nano- and colloidal scale particles, the aggre-
gation of asphaltene colloids, and their eventual sedimentation. Amphiphilic dispersants can
greatly effect this process. The mechanism of the dispersant action in colloidal asphaltene sus-
pensions in heptane has been shown through previous work to be due in part to a reduction in
the size of the colloidal asphaltene particles with the addition of dispersant. However, previous
studies of the sedimentation behavior has also revealed evidence of aggregation processes in
the colloidal asphaltenes in heptane that has yet to be investigated fully. We investigate the
effect of dispersants on this aggregation behavior through the use of dynamic light scattering,
showing that both the amount of dispersant as well as the amount of heptane dilution can effect
the onset and extent of aggregation in colloidal asphaltene suspensions. The light scattering
results match well with those obtained through the macroscopic sedimentation experiments.
1

Sara M. Hashmi et al. Effect of Dispersant on Asphaltene . . .
Introduction
Understanding and controlling the process of asphaltene precipitation has proven to be a chal-
lenging task, due to the diverse nature of asphaltenes and the variety of conditions under which
they can separate from solution. Not only do asphaltenes vary from one oil field to another, but
also asphaltenes in a single sample of oil are polydisperse in many physical properties, includ-
ing molecular weight and aromaticity. Asphaltenes constitute a solubility class only; they are not
defined by a precise chemical class or definition. They are soluble in aromatic solvents, such as
toluene, benzene, and xylene, and insoluble in light alkanes, most notably hexane, heptane, and
octane. Asphaltene precipitation results when oil is mixed with an anti-solvent for asphaltenes. It
can also occur as a result of changing temperature and pressure conditions.
The structure of asphaltenes in crude oil can be described by a hierarchical scheme: asphaltene
molecules can easily associate and aggregate from the molecular to the nanometer scale even in fa-
vorable solvent conditions.1,2 Asphaltenes are the most polar component of petroleum fuels, with
an affinity for aromatic stacking, and as such have a propensity to associate in the petroleum fluid
itself.3,4 The molecular-scale association of asphaltenes has recently been described through the
implementation of a cubic equation of state with association.5 In unfavorable solvent conditions,
this molecular scale association and aggregation is followed by a secondary aggregation process
at the colloidal scale.2 The completion of asphaltene precipitation might include steps such as
adhesion to surfaces or sedimentation in the bulk.6,7 The details of the steps involved in the precip-
itation process may depend on sample geometry, composition, flow conditions and thermodynamic
properties of the sample under consideration. In this study we focus on asphaltene precipitation
processes which involve colloidal scale aggregation and sedimentation.
Several methods exist to measure the dynamics of aggregation processes, most involving scat-
tering, either dynamic light scattering, static light scattering, or neutron scattering. Each of these
methods provides a means by which to measure particle sizes on the colloidal or nano-scale, and
can be conducted continuously to follow the dynamics of the growth process. The use of these tools
in investigating colloidal aggregation has yielded a much greater understanding of both diffusion
2
Sara M. Hashmi et al. Effect of Dispersant on Asphaltene . . .
and reaction limited aggregation processes.8 Diffusion limited aggregation leads to the formation
of open structures with a low fractal dimension, whereas reaction limited aggregation leads to the
formation of more tightly arranged structures with much higher fractal dimensions.9 In the spe-
cial case of asphaltene aggregation, neutron scattering has been used to investigate the aggregation
of sub-micron sized asphaltene clusters from mixtures of incompatible oils.10 Depending on the
composition of the oil mixtures, the onset of aggregation can occur within a day or can take up
to nearly a week to appear.11 The use of solvent-anti solvent mixtures also leads to the aggrega-
tion of asphaltenes, albeit on a larger size scale. The use of a specialized back scattering dynamic
light scattering technique has allowed for the measurement of this process in dark, heavy oils with
asphaltene contents up to 7 % by weight in mixtures of toluene and heptane.12,13 As the amount
of toluene in the suspensions is increased from 75 to 95 % by volume, the increase in asphaltene
particle size from the sub-micron range to nearly 10 microns can take from roughly 70 to 7000
minutes to occur.14 Changing the composition of solvents can thus control the speed of the ag-
gregation process, and has revealed a crossover in aggregation dynamics from diffusion limited
aggregation to a reaction limited aggregation.13
One class of solutions to the problem of asphaltene precipitation is by thermodynamic inhibi-
tion: by changing the temperature, pressure or solvent composition in order to move the system
to a region of the phase diagram where asphaltene precipitation will not occur. The use of sol-
vents for this method often requires bulk volumes which may impact downstream operations. The
use of mixtures of solvents and anti-solvents, such as mixtures of toluene and heptane, falls un-
der the thermodynamic inhibition category. Amphiphilic dispersants may also aid in addressing
the problem of asphaltene precipitation. In some cases, native resins or amphiphilic additives are
added to mixtures of solvents and anti-solvents to provide stability to asphaltene system.15,16 Var-
ious types of amphiphiles in the absence of solvents have also been shown to interact favorably
with asphaltenes to provide a degree of stability.17,18 For instance, UV-Vis has been used to assess
the adsorption of amphiphiles to asphaltenes, revealing asphaltene stabilization at approximately
1% by weight amphiphiles with respect to the asphaltenes.19 Spectrophotometry and light intensity
3

Sara M. Hashmi et al. Effect of Dispersant on Asphaltene . . .
measurements have also revealed the increased stability provided by dispersants at weight percents
down to 0.1 with respect to the asphaltene content.16,20
In the current study we investigate the mechanism by which dispersants provide stability to
asphaltenes in suspension. To generate the asphaltenes, we combine oil with an anti-solvent, hep-
tane. Given the addition of heptane, without any solvent addition, the asphaltenes are completely
unstable and precipitate out of solution through a sedimentation process. In our previous work,21
we demonstrated that the use of dispersants can delay sedimentation and the completion of asphal-
tene precipitation in suspensions prepared with oil and heptane at a ratio of 40 mL heptane per g
oil. While dispersants do not prevent the initial association of asphaltene molecules to the nano- or
colloidal scale, they do induce a delay in the eventual sedimentation process of the asphaltenes.21
Dynamic light scattering results on dilute asphaltene suspensions showed that this lengthening of
the sedimentation time is due in part to a decrease in the colloidal asphaltene particle size with
the addition of dispersant. In addition, our previous results indicated that the dynamics of the as-
phaltene sedimentation process exhibits features similar to those seen in colloidal systems which
aggregate and form gels.22 However, the dynamic light scattering did not reveal aggregation in the
diluted suspensions.21 In this study we investigate two petroleum fluids and present dynamic light
scattering results which do show the dynamics of colloidal aggregation as a function of composi-
tion, both in terms of the amount of dispersant as well as the amount of heptane. We use dynamic
light scattering and sedimentation measurements to measure suspensions of the same composition
for each type of measurement, and are therefore able to provide a more direct connection between
the microscopic dynamics and the macroscopic behavior in the asphaltene suspensions in heptane.
Materials and Methods
We obtain two petroleum fluids from the Middle East, named BAB and SB. We define the heptane
ratio χ , with units mL/g, indicating the number of mL of heptane (Fischer) combined with 1 g
of oil. The asphaltene content of the oils is measured as reported previously, by mixing the oils
4

Sara M. Hashmi et al. Effect of Dispersant on Asphaltene . . .
with heptane at χ = 40 mL/g.21 The mixtures are soniccated for 1 minute, and filtered through 0.2
µm pore-size cellulose nitrate membrane filters (Whatman). Using 25 samples of 1 g oil each, for
BAB we measure f = 0.31± 0.08 % by weight asphaltenes, while for SB f = 0.69± 0.08 % by
weight. The filtrate is collected, dried and weighed to give f , the weight percent of asphaltenes
in the oil. The density ρa of the asphaltenes is measured by combining a known quantity of
asphaltenes with toluene and measuring the density of the mixture using a densitometer (Anton
Paar), with an accuracy to within five decimal places. For BAB, ρa = 1.0±0.08 g/mL, and for SB,
ρa = 1.1± 0.09 g/mL, based on 10-12 measurements each. These values are within error bars of
typical values presented in the literature.1,23 We measure the density of the oils to be ρo = 0.841
g/mL for the BAB and ρo = 0.844 g/mL for the SB oil. We use a refractometer (Atago RX-5000α)
to measure the index of refraction of the petroleum fluids, no = 1.473 and 1.475 for BAB and SB,
respectively, with an accuracy to within four decimal places. A summary of the oil properties is
provided in Table 1. We also measure the density of the pure heptane, ρh = 0.684 g/mL, and index
of refraction n = 1.386. We obtain a proprietary dispersant from Lubrizol, labeled BA, a polyolefin
alkeneamine with molecular weight of approximately 2000. All physical property measurements
are obtained at room temperature.
Macroscopic sedimentation measurements are obtained on asphaltene suspensions in heptane.
We vary both the amount of heptane and the amount of dispersant in the samples. For the samples
without dispersant, asphaltene suspensions are generated by combining oil with heptane at various
values of χ , fixing the volume of heptane at 12 mL and varying the amount of oil as necessary. Due
to the varying χ , the initial height of the samples h0 ranges from approximately 90 to 100 mm.
Samples are prepared in solvent-resistant 15 mL volume conical centrifuge tubes (BD Falcon).
For BAB, χ ranges from 5 to 30 mL/g, while for SB, 15 < χ < 40 mL/g. The range of values for
χ used for each oil is experimentally determined by the ease of observation of the sedimentation
level h in ambient lighting conditions. At even lower values of χ , the equilibrium sediment may
be clearly observable, but the contrast in the sample is too low to allow for h to be tracked by
eye during the entire duration of the sedimentation process. For samples with dispersant, stock
5
Sara M. Hashmi et al. Effect of Dispersant on Asphaltene . . .
solutions of dispersant dissolved in heptane are first prepared at 10 ppm by weight in heptane, and
added to the oil and heptane samples in the appropriate amounts to obtain the desired dispersant
concentrations. The dispersant concentration c ranges from 0 to 2 ppm for each value of χ . For all
compositions, we combine the oil, pure heptane and dispersant stock solution, then sonniccate the
samples for 1 minute and allow them to sediment in room conditions. The level of the sediment h is
measured with the aid of a cathetometer and a micrometer as previously described.21 We track the
progress of h(t) for up to a week, approximately 10000 minutes, and then take final measurements
of the equilibrium level h∞ at 100000 minutes, approximately 2 months after the original sample
preparation.
Dynamic light scattering (DLS) measurements are performed on a Zeta PALS (Brookhaven
Instruments) with a scattering angle α = 90, at a wavelength λ = 658 nm. For DLS measurements,
samples are prepared in centrifuge tubes as for the sedimentation measurements, with the volume
of heptane fixed at 3 mL, and the amount of oil varied as needed given the desired value of χ
for each sample. After the soniccation step the samples are immediately transferred to 4.5 mL
volume square polystyrene cuvettes (Brookhaven Instruments) for measurement in the Zeta PALS.
The sample height is approximately 3 cm, and measurements are conducted approximately 1 cm
from the top of the sample. For the sample compositions, we use the same range of χ as in the
sedimentation measurements: 5 < χ < 30 mL/g for BAB and 15 < χ < 40 mL/g for SB. Given
the asphaltene content f and asphaltene density ρa, none of the samples used for DLS exceeds a
volume fraction of asphaltenes φ ∼ f /(ρaχ)∼ 0.0005. To investigate the effect of dispersant, we
use samples with concentrations of BA up to c = 2 ppm.
We vary the duration of the DLS experiments based on sample composition. Because the
asphaltene suspensions exhibit sedimentation, we monitor the scattered light intensity I, which
reflects the number of scatterers in the light path.24 We continue recording measurements until
I drops to about 2/3 its initial value. At this point, due to the simultaneous sedimentation in the
samples, the quality of the raw data begins to degrade and we conclude the experiment. Results are
collected every 30 seconds for the duration of the experiment. The raw data is exported from the
6

Sara M. Hashmi et al. Effect of Dispersant on Asphaltene . . .
Zeta PALS software for further analysis in Matlab and fortran, using the CONTIN algorithm.25,26
Analysis of the DLS data requires the scattering angle q = 4nsin(α/2)/λ , which in turn de-
pends on the index of refraction n of the background solvent. The index of refraction of heptane is
n = 1.386. We use a refractometer (Atago RX-5000α) to confirm that the refractive indices of the
supernatants of the asphaltene suspensions are close to that of pure heptane. After the sedimenta-
tion process is complete, the refractive index of the supernatants are measured at the appropriate
heptane ratios in the absence of dispersant. For the BAB samples, in the range of χ = 5 to 30 mL/g,
n varies from 1.404 to 1.389. For the SB samples in the range χ = 15 to 40 mL/g, n varies from
1.392 to 1.388. For all samples then, the refractive index of the background solvent is within 1%
of the index of heptane. The presence of dispersant on the order of 1 ppm changes the refractive
index of the supernatant by less than 0.0001%. Therefore we use the refractive index for heptane
in our calculations, and q = 0.0187 nm−1.
Results
Dynamic Light Scattering
As seen in our previous work, the dynamic behavior of the sedimentation front in asphaltene sus-
pensions suggests that aggregation or gelation may play a role in the separation of asphaltenes out
of solution.21 To investigate the details of the colloidal aggregation, we perform dynamic light
scattering measurements to follow the dynamics of particle growth. DLS measurements provide a
measure of g(∆t), the autocorrelation of the scattered light intensity, over time after sample prepa-
ration. As the colloidal particles in suspension diffuse in and out of the light path, the scattered
light intensity hitting the detector fluctuates. Due to this fluctuation in the scattered light intensity,
g(∆t) decays, in the general form g(∆t) = exp(−∆t/τ). The decay in g(∆t) indicates that the inten-
sity of the scattered light changes on a time-scale given by τ , which in turn indicates the diffusive
time-scale for the motion of particles in the suspension.
We investigate scattering in asphaltene suspensions, looking first at the effect of heptane content
7

Sara M. Hashmi et al. Effect of Dispersant on Asphaltene . . .
in the absence of dispersant, fixing c = 0 ppm. Immediately after sample preparation, g(∆t) exhibits
a single decay. As the samples evolve over time, g(∆t) begins to exhibit a second decay at long
decay times ∆t. This second decay indicates the presence of an additional, much longer diffusive
time-scale in the system. In suspensions made from BAB with χ = 5 mL/g and χ = 10 mL/g, at
c = 0 ppm, the onset of the second decay in g(∆t) occurs within approximately 10 minutes after
sample preparation. However, as χ is increased, this second decay takes a longer time to develop.
For instance, as χ is increased to 30 mL/g, the long-time decay in g(∆t) appears approximately
30 minutes after sample preparation. This behavior is shown in Figure 1a, b and c, which present
g(∆t) at various times for χ = 10, 20, and 30 mL/g, respectively, in the asphaltene suspensions
made with BAB.
As dispersant is introduced to the system, the onset of a second decay in g(∆t) also takes longer
to appear. For instance, c = 0.5 ppm of BA in a BAB suspension at χ = 5 mL/g, the development of
the long-time decay still occurs within about the first 10 minutes of sample preparation. However,
once c = 1 ppm, the second, long-time decay does not develop at all over the duration of the
experiment. The SB suspensions exhibit the same qualitative behavior. For instance, at χ = 30
mL/g and c = 0.5 ppm, an appreciable long-time decay appears at approximately 12 minutes after
sample preparation. However, with even c = 1 ppm, the appearance of the second decay is delayed
by more than 30 minutes. These representative examples of the raw data are shown in Figure 2.
The exponential decays in g(∆t) correspond to the diffusive time scales which are present in
the system. Given an assumption of spherical particles, the diffusive time scales can be used to
estimate particle size. Various methods of fitting g(∆t) can extract the diffusive time scales and
thus the particle sizes. Suspensions of particles with a monomodal population of sizes distributed
about a single average will have a monomodal distribution of diffusive time scales and thus exhibit
a single decay in g(∆t). For suspensions of monodisperse particles, it is sufficient to use a single
decay time to fit g(∆t): g(∆t) = exp(−∆t/τ). The decay time τ is proportional to the diffusive time
scale in the system, hence τ = 1/2q2D, where D is the diffusivity of the particles in suspension.
For polydisperse suspensions of asphaltenes, we use a CONTIN analysis to fit g(∆t) to a Laplace
8

Sara M. Hashmi et al. Effect of Dispersant on Asphaltene . . .
transform:
g(∆t) =∫
p(τ)exp(−∆t/τ)dτ (1)
From this expression we obtain a distribution of decay times p(τ).
The signatures of the second, long-time decay in g(∆t) are also evident through the results of
the CONTIN analysis. At short times after sample preparation, p(τ) is monomodal. For instance,
in a suspension made with SB at χ = 30 mL/g and c = 0 ppm, g(∆t) exhibits a single decay within
about the first 5 minutes after sample preparation. Within the first 5 minutes, the CONTIN analysis
therefore yields a distribution of decay time τ that is monomodal, centered around τ ∼ 2000 µs.
After about 5 minutes, g(∆t) begins to exhibit a second decay at a much longer time scale, at
approximately τ ∼ 300000 µs. This also is reflected in the fit to Eq. 1, with p(τ) exhibiting a
second, smaller peak at τ ∼ 300000 µs. At the same time, the first peak in p(τ) remains present,
although its magnitude becomes smaller and the distribution itself becomes slightly broader. This
typical example, for suspensions made with SB at χ = 30 mL/g and c = 0 ppm, is shown in Figure
3. Figure 3a shows g(∆t) at four different times after sample preparation, with the resultant fits to
Eq. 1 shown by the solid lines. Figure 3b shows p(τ), the result of the CONTIN analysis, for each
of the data sets shown in Figure 3a. The inset in Figure 3b shows the presence of a second, smaller
peak at τ ∼ 300000 µs at both 6 and 9 minutes after sample preparation.
Since peaks in p(τ) indicate the diffusive time scales in the system, the presence of peaks at
large τ indicate the presence of much larger particles, or particle aggregates, in the suspension. At
the same time, the initial peak in p(τ) that is present immediately after sample preparation contin-
ues to persist even after the onset of aggregation. This indicates that pre-aggregated particles re-
main present in suspension. To quantify the increase in average particle size due to the aggregates,
we assume spherical particles with diffusivity D = (kBT )/(6πµa), where T is the temperature,
kB the Boltzmann constant, µ the viscosity, and a the particle radius. We can therefore convert
the distribution of decay times to a distribution of asphaltene particle sizes using τ = 1/2q2D and
solving for a. We can obtain the first moment of the distribution to calculate the average particle
9

Sara M. Hashmi et al. Effect of Dispersant on Asphaltene . . .
size:
〈a〉=∫
ap(a)da∫p(a)da
(2)
As seen through investigating g(∆t), sample composition greatly effects the onset of aggrega-
tion. For all samples, during the first few minutes of the measurement, 〈a〉 is roughly constant,
sometimes exhibiting a slight increase of 10-20 %. The appearance of the second, long-time decay
seen in g(∆t) appears as an abrupt rise in the average particle size 〈a〉. In the absence of disper-
sant, 〈a〉 can grow by an order of magnitude, indicating colloidal aggregation similar to that seen
in asphaltene suspensions in heptane-toluene mixtures.14 As the amount of heptane is increased
in the suspensions, this increase takes a somewhat longer time to develop. However, with the
introduction of dispersant, the increase in 〈a〉 can be suppressed at even long times after sample
preparation, up to the duration of the experiments. Typical results are shown in Figure 4a and b, for
SB asphaltene suspensions with χ = 30 and 40 mL/g respectively, with different amounts of disper-
sant c. The data in Figure 4 exhibit thats two important features of the asphaltene suspensions are
dependent on sample composition: 1, the average 〈a〉 over time before the onset of aggregation;
and 2, the time until the onset of aggregation. We will further investigate both of these features in
the asphaltene suspensions of both BAB and SB.
Investigating the plots in Figure 4 more closely, we notice that the value of 〈a〉 at times before
the onset of the fast aggregation seems to vary as a function of composition. In order to quantify
this change of particle size, we take the average value of 〈a〉 for data collected at times before the
onset of aggregation, and refer to this quantity as a0, the pre-aggregate "unit" particle size. The
results of this measurement do indeed show that dispersant has an effect on a0, for suspensions
made with both BAB and SB. At each value of χ , a0 decreases by a factor of 2 or more as c
is increased from 0 to 2 ppm. These results are shown in Figure 5a and b for BAB and SB,
respectively. For instance, in the BAB suspensions at χ = 5 mL/g, a0 decreases from 1742 nm
to 562 nm over the range c = 0 to 2 ppm, a factor of 3 decrease. At χ = 20 mL/g, however, a0
decreases by approximately a factor of 5, from 978 nm to 206 nm over the range c = 0 to 2 ppm.
At χ = 30 mL/g, a0 decreases by approximately a factor of 7, from 1094 nm to 149 nm over the
10

Sara M. Hashmi et al. Effect of Dispersant on Asphaltene . . .
range c = 0 to 2 ppm. In the SB asphaltene suspensions, a0 also decreases with dispersant: at χ
= 15 mL/g, a0 decreases from 1311 nm to 658 nm over the range c = 0 to 2 ppm, a factor of 2
decrease. At χ = 30 mL/g, however, a0 decreases by a factor of 4.5, from 899 nm to 200 nm over
the range c = 0 to 2. Furthermore, an increase in the amount of heptane enhances this effect. With
the exception of c = 0 ppm, at each value of c for both BAB and SB, an increase in χ leads to a
decrease in a0. At each concentration c = 1, 1.5, and 2 ppm in the BAB asphaltene suspensions,
a0 decreases by a factor of about 4 as χ ranges from 5 to 30 mL/g. In the SB suspensions, for the
same concentrations, a0 decreases by a factor of about 3 as χ ranges from 15 to 40 mL/g.
The data in Figure 4 indicate another salient feature of the samples which exhibit colloidal
scale aggregation: the pre-aggregate size of the particles can exhibit a slight increase, perhaps up
to about 20 %, in advance of the abrupt increase in size that is characteristic of the aggregation
of colloids. This slight increase might be indicative of the growth of individual particles, but
more importantly, the change in the rate of increase of 〈a〉 indicates a qualitative change in the
aggregation dynamics which may elucidate some of the mechanisms involved. The dynamics of
colloidal aggregation falls into two main categories: diffusion-limited cluster aggregation (DLCA)
and reaction limited cluster aggregation (RLCA). DLCA is a process in which 〈a〉 increases with
power-law dynamics as a function of time. RLCA, on the other hand, leads to exponential growth,
the speed of which is determined by the energy of interaction between the particles.9,27 Many
aggregating systems have been shown to exhibit a crossover between the two different types of
aggregation. When we investigate the behavior of 〈a〉 in an aggregating asphaltene suspension on
a log-log plot, as shown in Figure 6, we also see a crossover from a power-law behavior to an
exponential growth. The amount of growth in the DLCA regime is slight, much less than even
a factor of two increase, suggesting perhaps the growth of individual particles rather than their
aggregation into larger clusters. The growth in the RLCA regime, however, can cause an increase
in particle size by an order of magnitude, indicating the sticking of particles to one another. An
example of the crossover behavior is shown in Figure 6, for a suspension of BAB at χ = 30 mL/g
and c = 0 ppm. The solid line in Figure 6 is a power-law with an exponent of 1/3, while the
11

Sara M. Hashmi et al. Effect of Dispersant on Asphaltene . . .
dotted line is an exponential function. The dynamics indicate a crossover from DLCA to RLCA.
Interestingly, asphaltenes suspended in heptane-toluene mixtures also exhibit this same crossover
from DLCA with a power law of 1/3 to RLCA, which becomes delayed as the amount of toluene
in the mixture is increased.14 In the asphaltene suspensions, it is the RLCA regime that we refer to
as aggregation, as it reveals the growth of multiple-particle clusters.
Several samples exhibit aggregation during the duration of the DLS experiments, with the
onset of the fast rise in 〈a〉 depending on sample composition, as seen in Figure 4. In suspensions
without dispersant, c = 0 ppm, the addition of heptane can delay the onset of aggregation up to
about 30 minutes, but does not suppress it within the time scale of the experiment. However, at
every value of χ used in both the BAB and the SB suspensions, the addition of dispersant not only
delays the onset of aggregation, but can also suppress it entirely during the duration of the DLS
measurements. In suspensions with BAB, c = 0.5 ppm is enough to suppress aggregation at all
values of χ except χ = 5 mL/g, in which case c = 1 ppm is sufficient. The SB suspensions behave
in a qualitatively similar fashion, but with different threshholds: at χ = 30 and 40 mL/g, c = 1 ppm
is enough dispersant to suppress aggregation. However, at χ = 20 mL/g, c = 1.5 ppm is required,
and at χ = 15 mL/g, c = 2 ppm is required to suppress aggregation over the duration of the DLS
experiment. The aggregation onset times as a function of composition are summarized in Tables 2
and 3, for suspensions of BAB and SB, respectively. For samples not exhibiting aggregation, the
entries in the Tables indicate the duration of the experiment, which varies with composition. We
use the total scattered light intensity as an indication of the amount of sedimentation in the samples.
Once the intensity drops below approximately 2/3 its original value, sufficient sedimentation has
occurred and we stop the experiment. Continuing the experiment much beyond this point leads to a
degradation of the signal quality. The aggregation onset times, as measured by DLS, are therefore
indications of the time scales of aggregation and sedimentation: in samples exhibiting aggregation,
aggregation occurs before significant sedimentation has occurred. The absence of aggregation in
the remaining samples indicates that sedimentation is instead the dominant process. Measurements
of sedimentation in bulk suspensions are required in order to more fully investigate the interplay
12

Sara M. Hashmi et al. Effect of Dispersant on Asphaltene . . .
between aggregation and sedimentation in these asphaltene suspensions.
Bulk Sedimentation
The effect of sample composition on the onset of colloidal aggregation as observed through the
DLS measurements suggests that composition will also have an effect on the overall processes
of asphaltene precipitation and sedimentation out of a bulk suspension. The ultimate operational
concern is not only the aggregation of colloidal scale asphaltenes but also its effect on asphaltene
separation from the bulk. In order to assess the effect of sample composition on the overall sedi-
mentation behavior and the time to full separation, we measure the sedimentation front in samples
of the same compositions as those measured by DLS. Soon after sample preparation, asphaltenes
begin to sediment out of solution, as observed through measurements of h(t). In some samples,
the sedimentation front is observed to form at or near the top of the sample and then move rapidly
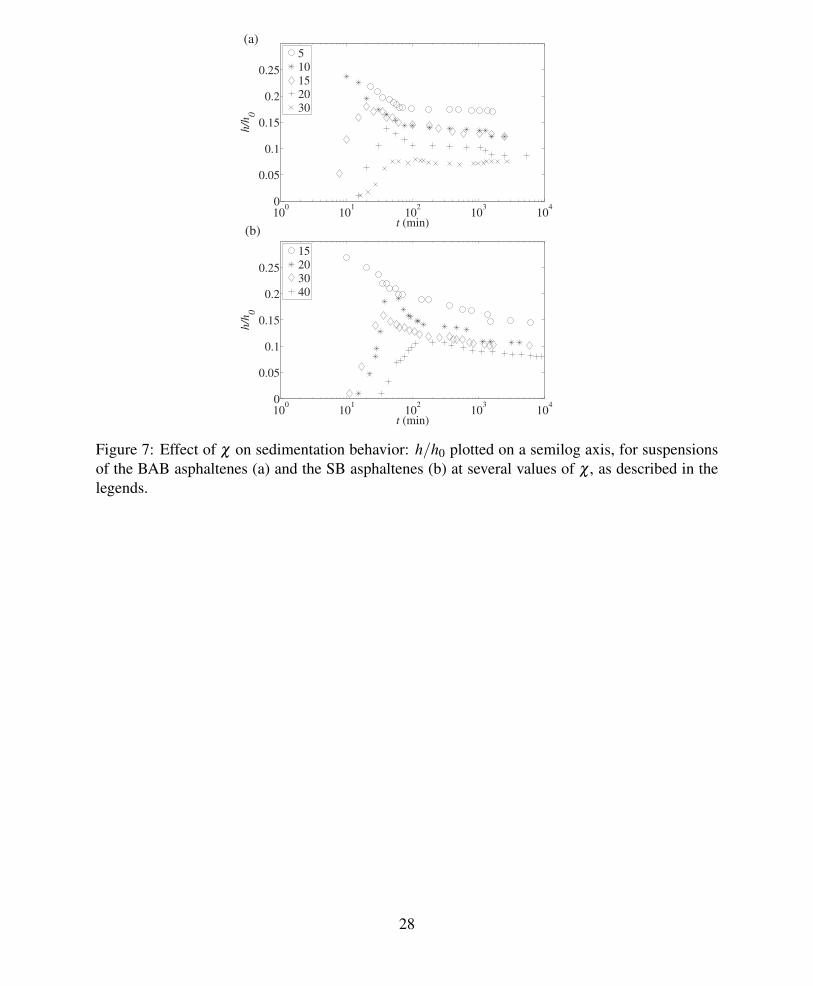
downward. Furthermore, the amount of heptane χ determines the nature of the sedimentation. For
instance, for χ = 5 mL/g in asphaltene suspensions made with BAB, the level of the front h begins
at the top of the sample container and falls in a nonlinear fashion to reach its equilibrium level h∞,
as seen in Figure 7a. As the amount of heptane is increased from χ = 5 to 30 mL/g, the behavior
of the sedimentation front changes in character. At χ = 15 mL/g, no movement is seen in the bulk
until the asphaltenes begin piling up in the bottom of the sample chamber. The level of h begins at
the bottom of the sample and rises to a level above h∞, then falls back down at long times. Above
χ = 30 mL/g, the level of h begins at the bottom of the sample and monotonically rises to h∞. The
behavior in samples made with SB is similar, with the transition from the falling to rising behavior
occurring at a slightly different value of χ . In the SB suspensions at χ = 15 mL/g, h falls to its
equilibrium level h∞. At χ = 20 mL/g and above, h rises first and then falls to h∞. This behavior
is seen in Figure 7(a) and (b) for samples with BAB and SB, respectively. All data sets are shown
normalized by the total height of the sample, h0.
The addition of dispersant can also facilitate the transition from a falling front to a rising front,
as also seen previously in asphaltene suspensions made from an oil with f ∼ 3.5 %.21 The value
13

Sara M. Hashmi et al. Effect of Dispersant on Asphaltene . . .
of χ determines the threshold value of c required to facilitate the transition from a monotonically
falling front in h to a monotonically rising front. At low χ , higher amounts of dispersant c are
required to facilitate the transition from a falling to a rising front. As χ is increased, the dispersant
can effect the transition to a rising front at lower c. Figure 8a and b demonstrates these trends
in suspensions of BAB at χ = 5 and 15 mL/g respectively, with the addition of dispersant BA.
Samples made with SB show the same qualitative trends with the addition of dispersant. Typical
examples of χ = 15 and 30 mL/g are shown in Figure 9a and b.
When c is high enough, and the sediment level h grows slowly from the bottom of the container,
h still appears to be growing after 10000 minutes. This behavior is seen for instance in suspensions
at c = 1.5 and 2 ppm, as shown in Figure 8b and Figure 9b. However, measurements of the
equilibrium level h∞ at long time, after 100000 minutes, reveal no strong dependence of h∞ on
c. For each χ , h∞ may have a variation of about 20% about an average value. Measurements of
h∞ after long time do reveal a dependence on χ . This is expected given that the suspensions are
prepared at a fixed sample volume: h∞ decreases with an increase in χ , as can be seen in Figure 7a
and b.
The sedimentation behavior in the asphaltene suspensions is somewhat similar to colloidal sed-
imentation: both systems will exhibit fronts which rise from the bottom of a container as particles
pile up there. However, in colloidal systems at high enough volume fraction φ , in which the shock
at the top of the sample is easily seen, h moves in a linear fashion from the top of the container
to its equilibrium value. In the asphaltene samples, however, the falling front in h begins moving
quickly and then slows down over time before reaching equilibrium. This nonlinear behavior is
not seen in suspensions of isolated colloids. When colloids are allowed to aggregate, however, the
level of h may be observed to collapse dramatically and then slow down as it approaches equilib-
rium. Therefore, the transition in the asphaltene sedimentation from a nonlinear falling front to a
rising front may indicate a transition from a system in which aggregation largely determines sed-
imentation to a system in which aggregation is much less important or perhaps even nonexistent
over the time scale of sedimentation.
14

Sara M. Hashmi et al. Effect of Dispersant on Asphaltene . . .
Discussion
In order to further connect the results of the DLS measurements with those of the bulk sedimenta-
tion, we first investigate which of the sample compositions reveal signatures of aggregation. The
signature of aggregation in the DLS measurements is clear: the particle size begins to grow rapidly
with time at the onset of aggregation. In bulk sedimentation of the asphaltene suspensions, aggre-
gation leads to nonlinear behavior in the falling front h, beginning with a very fast decrease in h. In
colloidal suspensions, aggregation is known to speed up the sedimentation process.28 In fact, the
overall sedimentation behavior of colloids undergoing gelation or aggregation is often character-
ized by a nonlinear falling front, with a fast regime followed by a slower tail of sedimentation.29,30
Several of the asphaltene suspensions exhibit this nonlinear falling behavior from the onset of sed-
imentation, for instance the suspension of SB at χ = 15 g/mL and c = 0 ppm, seen in Figure 7b.
Others exhibit a front which grows above the level of h∞ and then also falls back down to reach
h∞, for instance the suspension of BAB at χ = 15 g/mL and c = 0 ppm, seen in Figure 8a. Similar
to the situation in colloidal gels, the falling portion of this non-monotonic behavior may be due to
the collapse of networks formed through asphaltene aggregation.22 Both a nonlinear falling front
and a non-monotonically moving front each indicate the presence of aggregation.
In general, the nonlinear falling behavior of h is seen more often in samples at smaller val-
ues of both χ and c. Nearly the same range of sample compositions leads to aggregation as seen
by a growing particle size in the DLS measurements. The correspondence in the compositional
aggregation phase diagrams is shown in Figure 10a and b, for samples made of BAB and SB
respectively. The ×’s indicate compositions which exhibit signatures of aggregation in bulk sed-
imentation, while the ◦’s indicate compositions which do not exhibit aggregation signatures in
sedimentation. The dashed lines in Figure 10a and b indicate the boundaries of aggregation as
seen through DLS measurements; the region between the origin and the dashed line contains sam-
ples in which the particles aggregate within approximately the first 30 minutes of measurement,
while the regions outside the dashed lines indicate compositions which do not exhibit aggregation
within about an hour after sample preparation. The correspondence between the aggregation re-
15

Sara M. Hashmi et al. Effect of Dispersant on Asphaltene . . .
gions is quite close for both suspensions made with BAB and SB. The only exception is the BAB
suspension composed of χ = 30 mL/g and c = 0 ppm. However, this composition is also the one
exhibiting the longest time to the onset of aggregation: 30 minutes, as observed through DLS and
indicated in Table 2.
Now that we have a more complete picture of the effect of composition on the aggregation
and sedimentation of the asphaltenes, we can look toward an explanation of this behavior. In the
absence of dispersants, additional heptane can cause a delay in the onset of aggregation and also a
qualitative change in bulk sedimentation which indicates a decrease in the importance of aggrega-
tion. This can be explained simply by appealing to the volume fraction of particles in suspension:
with more heptane in a sample of fixed volume, there are fewer particles available to interact with
each other, and the importance of aggregation is diminished. The effect of dispersant requires a dif-
ferent explanation, as it does not change the amount of asphaltenes. The fact that adding dispersant
can delay or even suppress the RLCA regime suggests that it increases the energetic barrier in the
interaction potential between two colloidal asphaltene particles. A similar tuning of the onset of
RLCA has been seen in the aggregation of gold nanocolloids as a function of adding an adsorbant
to their surfaces.27
Conclusions
In this study we see that the full separation of asphaltenes out of colloidal asphaltene suspensions
is determined by the colloidal aggregation behavior in these systems. Sample composition greatly
effects the colloidal aggregation of the asphaltenes and therefore also the separation behavior.
Additional heptane in the system can delay the onset of aggregation, but not before the onset of
sedimentation. The addition of an effective dispersant, however, can suppress aggregation to a
much greater degree. While asphaltene particles are still present in the system, the suppression of
further aggregation to the micron scale allows the asphaltenes to remain stably in suspension for a
longer time.
16

Sara M. Hashmi et al. Effect of Dispersant on Asphaltene . . .
Overall, our results show that adding heptane to a colloidal asphaltene suspension in heptane
can delay both the onset of aggregation and the sedimentation behavior up to approximately 30
minutes. The addition of dispersant has a much greater effect; it can delay the onset of aggre-
gation and even completely suppress it within the time of the DLS measurement. Sedimentation
measurements show evidence of the suppression of aggregation: the addition of dispersant at a
concentration of even 1 ppm can delay the sedimentation of the samples up to 100 minutes or
more. The regions of the composition phase diagram showing the effect of aggregation match
from both the DLS and sedimentation measurements. Furthermore, the addition of dispersant ef-
fects a0 the pre-aggregate size of the particles in suspension, and can decrease a0 by a factor of 3 or
4. Furthermore, the effective concentration of dispersant is on the order of c∼ 1 ppm, with respect
to heptane, for the suspensions studied. This amount of dispersant corresponds to concentrations
on the order of 10 ppm with respect to the oil and approximately 0.005% by weight with respect to
the asphaltenes, indicating that this dispersant may be more effective than others in the literature.
In short, the colloidal aggregation behavior determines the properties of the bulk sedimen-
tation and separation: when aggregation is present, the asphaltenes quickly sediment and fully
separate from the suspension. When aggregation is suppressed with respect to the time-scale of
sedimentation, the onset of the separation process can become delayed up to 1000 minutes or more.
Dispersants in small doses can suppress the colloidal aggregation of asphaltenes with respect to
the time scale of sedimentation, indicating the mechanism by which dispersants inhibit asphaltene
precipitation. Furthermore, while testing is needed at field conditions, the present results indicate
the promise of dispersants as low-dosage inhibitors of asphaltene precipitation.
List of Symbols
a Particle radius
〈a〉 Average particle radius
a0 Pre-aggregation "unit" particle radius
17

Sara M. Hashmi et al. Effect of Dispersant on Asphaltene . . .
c Dispersant concentration (ppm)
f Weight fraction of asphaltenes
g(∆t) Autocorrelation function of scattered light intensity
h Sedimentation front height, subscripts 0=initial, ∞=equilibrium
n Index of refraction, subscripts o=oil, h=heptane
q Wave vector, for light scattering (nm−1)
vs Stokes sedimentation velocity
Greek Letters
µ Viscosity
φ Volume fraction
ρ Density, subscripts o=oil, h=heptane, a=asphaltenes
τagg Time until the onset of aggregation in DLS measurements
τsed Characteristic sedimentation time, measured as h(τsed) ∼ 0.1× h∞ and predicted as vs×τsed = 1 cm
References
(1) Yen, T. F.; Erdman, G.; Hanson, W. E. Journal of Chemical Engineering Data 1961, 6, 443.
(2) Mullins, O. C. Energy and Fuels 2010, 24, 2179.
(3) Fenistein, D.; Barre, L.; Broseta, D.; Espinat, D.; Livet, A.; Roux, J.-N.; Scarsella, M. Lang-
muir 1998, 14, 1013–1020.
(4) Acevedo, S.; Escobar, O.; Echevarria, L.; Gutierrez, L. B.; Mendez, B. Energy and Fuels
2004, 18, 305–311.
(5) Li, Z.; Firoozabadi, A. Energy and Fuels 2009, 24, 1106.
18

Sara M. Hashmi et al. Effect of Dispersant on Asphaltene . . .
(6) da Silva Ramos, A. C.; Haraguchi, L.; Notrispe, F. R.; Loh, W.; Mohamed, R. S. Journal of
Petroleum Science and Engineering 2001, 32, 201–216.
(7) Kraiwattanawong, K.; Fogler, H. S.; Gharfeh, S. G.; Singh, P.; Thomason, W. H.; Chavadej, S.
Energy and Fuels 2009, 23, 1575–1582.
(8) Weitz, D. A.; Huang, J. S.; Lin, M. Y.; Sung, J. Physical Review Letters 1984, 53, 1657.
(9) Kolb, M. Physical Review Letters 1984, 53, 1653.
(10) Mason, T. G.; Lin, M. Y. Journal of Chemical Physics 2003, 119, 565.
(11) Mason, T. G.; Lin, M. Y. Physical Review E 2003, 67, 050401.
(12) Anisimov, M. A.; Yudin, I. K.; Nikitin, V.; Nikolaenko, G.; Chernoutsan, A.; Toulhoat, H.;
Frot, D.; Briolant, Y. Journal of Physical Chemistry 1995, 99, 9576–9580.
(13) Burya, Y. G.; Yudin, I. K.; Dechabo, V. A.; Kosov, V. I.; Anisimov, M. A. Applied Optics
2001, 40, 4028.
(14) Burya, Y. G.; Yudin, I. K.; Dechabo, V. A.; Anisimov, M. A. International Journal of Ther-
mophysics 2001, 22, 1397.
(15) Carnahan, N. F. Energy and Fuels 1999, 13, 309–314.
(16) Laux, H.; Rahimian, I.; Butz, T. Fuel Processing Technology 2000, 67, 79–89.
(17) Chang, C.-L.; Fogler, H. S. Langmuir 1994, 10, 1758–1766.
(18) Leon, O.; Rogel, E.; Urbina, A.; Andujar, A.; Lucas, A. Langmuir 1999, 15, 7653–7657.
(19) Chang, C.-L.; Fogler, H. S. Langmuir 1994, 10, 1749–1757.
(20) Leon, O.; Contreras, E.; Rogel, E.; Dambakli, G.; Espidel, J.; Acevedo, S. Energy and Fuels
2001, 15, 1028–1032.
19

Sara M. Hashmi et al. Effect of Dispersant on Asphaltene . . .
(21) Hashmi, S. M.; Quintiliano, L. A.; Firoozabadi, A. Langmuir 2010, 26, 8021.
(22) Poon, W. C. K.; Starrs, L.; Meeker, S. P.; Moussaid, A.; Evans, R. M. L.; Pusey, P. N.;
Robins, M. M. Faraday Discussions 1999, 112, 143–154.
(23) Diallo, M. S.; Cagin, T.; Faulon, J. L.; III, W. A. G. In Thermodynamic properties of as-
phatlenes: a predictive approach based on computer assisted structure elucidation and atom-
istic simulations; Yen, T. F., Chilingarian, G. V., Eds.; pp 103–127.
(24) Berne, B. J.; Pecora, R. Dynamic Light Scattering; John Wiley and Sons, 1976.
(25) Provencher, S. W. Computer Physics Communications 1982, 27, 213–227.
(26) Provencher, S. W. Computer Physics Communications 1982, 27, 229–242.
(27) Weitz, D. A.; Huang, J. S.; Lin, M. Y.; Sung, J. Physical Review Letters 1985, 54, 1416.
(28) Allain, C.; Cloitre, M.; Wafra, M. Physical Review Letters 1995, 74, 1478–1481.
(29) Starrs, L.; Poon, W. C. K.; Hibberd, D. J.; Robins, M. M. Journal of Physics: Condensed
Matter 2002, 14, 2485–2505.
(30) Manley, S.; Skotheim, J. M.; Mahadevan, L.; Weitz, D. A. Physical Review Letters 2005, 94,
218302.
20

Sara M. Hashmi et al. Effect of Dispersant on Asphaltene . . .
Table 1: The density ρo and index of refraction no for the two petroleum fluids BAB and SB, alongwith their asphaltene content f (by weight fraction) and asphaltene density ρa.
Petroleum fluid ρo (g/mL) no f ρa (g/mL)BAB 0.841 1.473 0.0031 ±0.0008 1.0 ±0.08SB 0.844 1.475 0.0069 ±0.0008 1.1 ±0.08
Table 2: Delay in aggregation onset for suspensions made with BAB. Entries give the time inminutes until the onset of aggregation. The column headings refer to c (ppm) and the row headingsrefer to χ (mL/g).
HHHHHHχc
0 0.5 1 1.5 2
5 9 10 > 40 > 45 > 5010 13 > 55 > 65 > 70 > 7515 20 > 80 > 90 > 100 > 11020 25 > 90 > 100 > 110 > 12030 30 > 100 > 110 > 120 > 130
Table 3: Delay in aggregation onset for suspensions made with SB. Entries give the time in minutesuntil the onset of aggregation. The column headings refer to c (ppm) and the row headings refer toχ (mL/g).
HHHHHHχc
0 0.5 1 1.5 2
15 4 5 18 25 > 3520 5 5 18 > 30 > 4030 5 13 > 50 > 50 > 6040 8 21 > 60 > 60 > 75
21

Sara M. Hashmi et al. Effect of Dispersant on Asphaltene . . .
100
102
104
106
0
0.2
0.4
0.6
0.8
1
∆ t (µs)
g(∆
t)
1
8
14
22
33
100
102
104
106
0
0.2
0.4
0.6
0.8
1
∆ t (µs)
g(∆
t)
2
7
9
11
12
100
102
104
106
0
0.2
0.4
0.6
0.8
1
∆ t (µs)
g(∆
t)
1
2
4
6
8
(b)
(a)
(c)
Figure 1: Effect of χ on g(∆t): g(∆t) for suspensions of the BAB asphaltenes at χ = 10 mL/g in (a),χ = 20 mL/g in (b) and χ = 30 mL/g (c) at different times after sample preparation, as describedin the legends. The legend entries refer to the time in minutes after sample preparation.
22

Sara M. Hashmi et al. Effect of Dispersant on Asphaltene . . .
100
102
104
106
0
0.2
0.4
0.6
0.8
1
∆ t (µs)
g(∆
t)
1
9
17
25
33
100
102
104
106
0
0.2
0.4
0.6
0.8
1
∆ t (µs)
g(∆
t)
2
5
9
11
14
100
102
104
106
0
0.2
0.4
0.6
0.8
1
∆ t (µs)g(∆
t)
1
7
13
17
28
100
102
104
106
0
0.2
0.4
0.6
0.8
1
∆ t (µs)
g(∆
t)
1
5
10
13
14
(b)(a)
Figure 2: Effect of c on g(∆t): g(∆t) for suspensions of the BAB asphaltenes at χ = 5 mL/g (a) andsuspensions of the SB asphaltenes at χ = 30 mL/g (b). In both (a) and (b), the upper plot showsresults for suspensions with c = 0.5 ppm, while the lower plot shows results for suspensions with c= 1 ppm. In each plot the legend gives the time in minutes after sample preparation.
23

Sara M. Hashmi et al. Effect of Dispersant on Asphaltene . . .
103
104
0
1
2
3
4
5
6x 10
-3
τ (µs)
p(τ
)
2
4
6
9
100
102
104
106
0
0.2
0.4
0.6
0.8
1
∆ t (µs)
g(∆
t)
2
4
6
9
(b)
(a)
105
106
0
0.5
1
1.5x 10
-5
τ (µs)
p(τ)
Figure 3: CONTIN analysis and results. (a) shows g(∆t) for a suspension of SB oil at χ = 30 mL/g,without dispersant. The solid black lines represent the fits using CONTIN. (b) shows the resultsof the CONTIN analysis, p(τ), for each of the data sets shown in (a). The inset in (b) shows thesmaller peaks at τ ∼ 300000 µs for the data sets at 6 and 9 minutes. In each plot the legend givesthe time in minutes after sample preparation.
24

Sara M. Hashmi et al. Effect of Dispersant on Asphaltene . . .
0 5 10 15 20 25 300
2000
4000
6000
8000
t (min)
0
0.5
1
1.5
2
0 5 10 15 20 25 300
2000
4000
6000
8000
t (min)
0
0.5
1
1.5
2
(b)
(a)
⟨ a ⟩
(nm
)⟨ a
⟩ (n
m)
Figure 4: Average particle size with time, for suspensions of SB oil at χ = 30 (a) and 40 mL/g (b).The data sets in each plot represent samples with different amounts of dispersant c (ppm), as listedin the legends.
25

Sara M. Hashmi et al. Effect of Dispersant on Asphaltene . . .
0 0.5 1 1.5 20
500
1000
1500
2000
c (ppm)
a0 (
nm
)
15
20
30
40
0 0.5 1 1.5 20
500
1000
1500
2000
c (ppm)
a0 (
nm
)
5
10
15
20
30
(b)
(a)
Figure 5: Pre-aggregate particle size a0. (a) and (b) show results for suspensions of the BAB andSB oils, respectively. In each plot the legend gives the values of χ (mL/g) for each data set.
26

Sara M. Hashmi et al. Effect of Dispersant on Asphaltene . . .
100
101
102
103
104
t (min)
⟨ a ⟩
(nm
)Figure 6: Average particle size with time, for a suspension of BAB oil at χ = 20 mL/g and c = 0ppm. The data is shown on a log-log plot, and the lines are to guide the eye: the solid line indicatesa power law, while the dotted line indicates exponential growth.
27
Sara M. Hashmi et al. Effect of Dispersant on Asphaltene . . .
100
101
102
103
104
0
0.05
0.1
0.15
0.2
0.25
t (min)
h/h
0
15
20
30
40
100
101
102
103
104
0
0.05
0.1
0.15
0.2
0.25
t (min)
h/h
0
5
10
15
20
30
(b)
(a)
Figure 7: Effect of χ on sedimentation behavior: h/h0 plotted on a semilog axis, for suspensionsof the BAB asphaltenes (a) and the SB asphaltenes (b) at several values of χ , as described in thelegends.
28

Sara M. Hashmi et al. Effect of Dispersant on Asphaltene . . .
100
101
102
103
104
0
0.05
0.1
0.15
0.2
0.25
t (min)
h/h
0
0
0.5
1
1.5
2
100
101
102
103
104
0
0.05
0.1
0.15
0.2
0.25
t (min)
h/h
0
0
0.5
1
1.5
2
(b)
(a)
Figure 8: Effect of c on sedimentation behavior: h/h0 plotted on a semilog axis, for suspensionsof the BAB asphaltenes at χ = 5 mL/g in (a) and χ = 15 mL/g in (b), and at various concentrationsof dispersant BA, as described in the legends.
29

Sara M. Hashmi et al. Effect of Dispersant on Asphaltene . . .
100
101
102
103
104
0
0.05
0.1
0.15
0.2
0.25
t (min)
h/h
0
0
0.5
1
1.5
2
100
101
102
103
104
0
0.05
0.1
0.15
0.2
0.25
t (min)
h/h
0
0
0.5
1
1.5
2
(b)
(a)
Figure 9: Effect of c on sedimentation behavior: h/h0 plotted on a semilog axis, for suspensionsof the SB asphaltenes at χ = 15 mL/g in (a) and χ = 30 mL/g in (b), and at various concentrationsof dispersant BA, as described in the legends.
30

Sara M. Hashmi et al. Effect of Dispersant on Asphaltene . . .
0 0.5 1 1.5 2
15
20
25
30
35
40
c (ppm)
χ (m
L/g
)
0 0.5 1 1.5 2
5
10
15
20
25
30
c (ppm)
χ (m
L/g
)
(b)
(a)
Figure 10: Aggregation diagrams for BAB (a) and SB (b). The ×’s indicate sample compositionswith evidence of aggregation in their sedimentation behavior; ◦’s indicate compositions withoutevidence of aggregation in their sedimentation behavior. The dashed lines indicate the boundariesof aggregation behavior seen in the DLS: the regions to the left of the dashed line reveal evidenceof aggregation through DLS measurements.
31


![Use of Oil Spill Dispersant[1]](https://img.dokumen.tips/doc/110x75/546a41c3af795958298b45b6/use-of-oil-spill-dispersant1.jpg)