Embed Size (px)
Citation preview

g
123106 COV 1STATE STREET GLOBAL HLS SEMI-ANNUAL REPO
17-Jun-2021 18:16 ESTCLN PSLNF
Donnelley Financial LSWyadaa1apSTART PAGE
3*PMT 1C
VDI-W7-PF3-020514.4.13.0
g09o65-2.0g78u19-1.0
Hartford HLS FundsSemi-Annual Report
June 30, 2021 (Unaudited)
� Hartford Balanced HLS Fund
� Hartford Capital Appreciation HLS Fund
� Hartford Disciplined Equity HLS Fund
� Hartford Dividend and Growth HLS Fund
� Hartford Healthcare HLS Fund
� Hartford International Opportunities HLS Fund
� Hartford MidCap HLS Fund
� Hartford Small Cap Growth HLS Fund
� Hartford Small Company HLS Fund
� Hartford Stock HLS Fund
� Hartford Total Return Bond HLS Fund
� Hartford Ultrashort Bond HLS Fund
p
123106 IFC 1STATE STREET GLOBAL HLS SEMI-ANNUAL REPO
15-Jul-2021 19:02 ESTCLN PSLNF
Donnelley Financial LSWnaras0apSTART PAGE
5*PMT 1C
VDI-W7-PFL-251121.7.8.0
g86b03-1.0g93d10-1.0
A MESSAGE FROM THE PRESIDENT
Dear Shareholders:
Thank you for investing in Hartford HLS Funds. The following is the Funds’ Semi-AnnualReport covering the period from January 1, 2021 to June 30, 2021.
Market Review
During the six months ended June 30, 2021, U.S. stocks, as measured by the S&P 500Index,1 gained 15.25%. The strong returns for the period reflected growing conviction
among investors that a genuine economic recovery had taken hold and that the coronavirus (COVID-19)pandemic was finally loosening its grip on global economies.
As the period began, federal, state, and local health officials geared up for one of the largest mass-vaccination programs in history. But a fierce early-winter resurgence of viral infections touched off a wave ofnew hospitalizations and deaths before the COVID-19 vaccines could be implemented on a widespread basis.
In the late winter of 2021, new viral variants took root in the U.S., threatening to prolong the pandemic. But bythe end of the period, hospitalizations and deaths plummeted as nearly 155 million individuals in the U.S. werefully vaccinated (more than 47% of the entire U.S. population).2
Meanwhile, in March 2021, the U.S. Congress fast-tracked approval of the Biden administration’s $1.9 trillioneconomic stimulus package. The new law provided, among other things, stimulus checks, additionalunemployment aid, funding for school re-openings, new child-tax credits, and improved financial support forsmall businesses. By the end of the period, a new legislative proposal for an infrastructure package wasgaining fresh momentum.
On the monetary front, the U.S. Federal Reserve (Fed) continued to maintain its ongoing policy of near-zerointerest rates in support of the recovery. In March 2021, rates on 10-year Treasuries briefly rose to nearly1.75%, triggering a new round of market volatility and a fierce debate over the possible return of inflation.
A surprise 5% rise in the Consumer Price Index in May 2021 added more fuel to the debate over whetherhigher prices for gasoline, used cars, housing, travel, and consumer staples reflected the temporary supplydislocations of a suddenly re-opened economy, or the start of something more persistent. As the periodended, Fed policymakers continued to argue that inflation would likely be transitory. However, a volatilestock market seemed to reflect continued uncertainty.
More than ever, it’s important to maintain a strong relationship with a financial professional.
Thank you again for investing in Hartford HLS Funds. For the most up-to-date information on our funds,please take advantage of all the resources available at hartfordfunds.com.
James DaveyPresidentHartford HLS Funds
1 S&P 500 Index is a market capitalization-weighted price index composed of 500 widely held common stocks.
The index is unmanaged and not available for direct investment. Past performance is not indicative of future results.
2 USAFacts.org, “What’s the nation’s progress on vaccinations?”

123106 TOC 1STATE STREET GLOBAL HLS SEMI-ANNUAL REPO
27-Jul-2021 19:07 ESTCLN PSLNF
Donnelley Financial LSWpf_rendSTART PAGE
12*PMT 1C
LSWP64RS2921.6.2.0
Hartford HLS Funds
Table of ContentsFund Overview 2
Benchmark Glossary 14
Expense Examples 15
Financial Statements:
Schedules of Investments:
Hartford Balanced HLS Fund 17
Hartford Capital Appreciation HLS Fund 26
Hartford Disciplined Equity HLS Fund 31
Hartford Dividend and Growth HLS Fund 34
Hartford Healthcare HLS Fund 36
Hartford International Opportunities HLS Fund 38
Hartford MidCap HLS Fund 41
Hartford Small Cap Growth HLS Fund 44
Hartford Small Company HLS Fund 47
Hartford Stock HLS Fund 50
Hartford Total Return Bond HLS Fund 52
Hartford Ultrashort Bond HLS Fund 77
Glossary 84
Statements of Assets and Liabilities 85
Statements of Operations 88
Statements of Changes in Net Assets 91
Financial Highlights 97
Notes to Financial Statements 103
How to Obtain a Copy of each Fund’s Proxy Voting Policies and Voting Records 126
Quarterly Portfolio Holdings Information 126
p
123106 TX 2STATE STREET GLOBAL HLS SEMI-ANNUAL REPO
27-Jul-2021 19:04 ESTCLN PSLNF
Donnelley Financial LSWekamb0dcSTART PAGE
16*PMT 1C
VDI-W7-PF3-032921.7.8.0
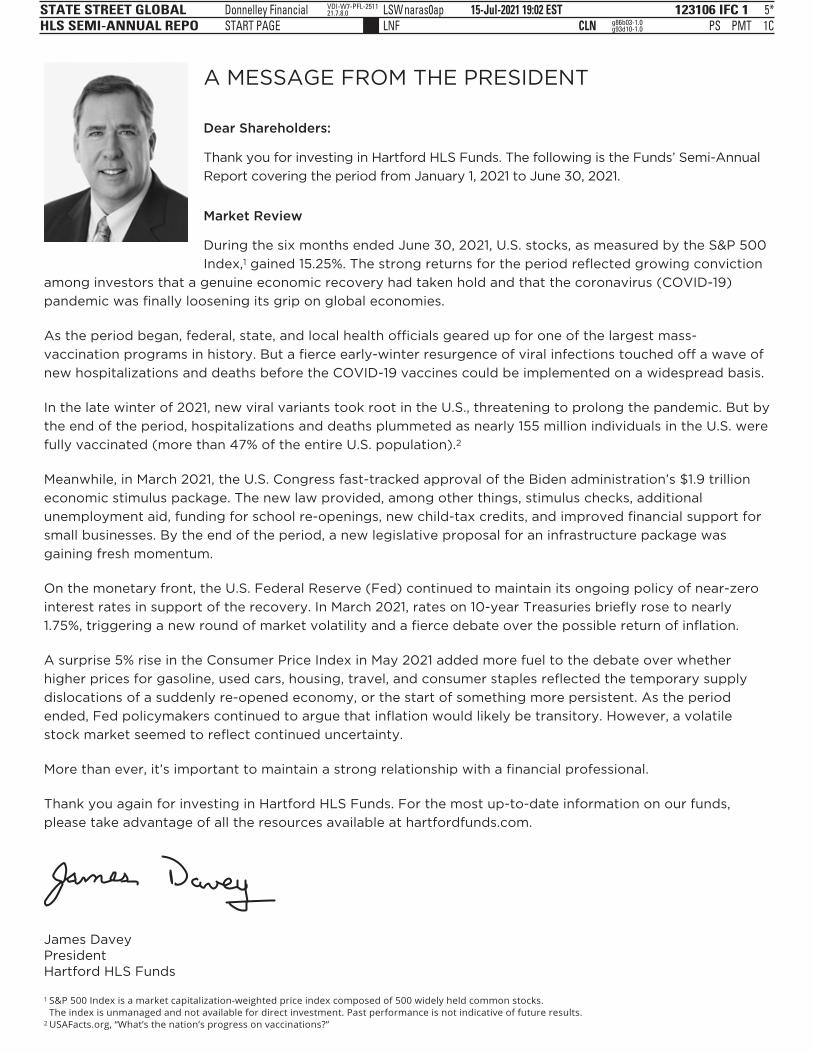
Hartford Balanced HLS FundFund OverviewJune 30, 2021 (Unaudited)
Inception 03/31/1983Sub-advised by Wellington Management Company LLP
Investment objective – The Fund seeks long-term total return.
Average Annual Total Returnsfor the Periods Ending 06/30/2021
Six Months1 1 Year 5 Years 10 Years
Class IA 11.91% 28.52% 11.44% 10.08%Class IB 11.79% 28.22% 11.16% 9.80%60% S&P 500 Index/ 35% Bloomberg
Barclays Government/Credit BondIndex/ 5% ICE BofA US 3-MonthTreasury Bill Index2 8.23% 23.02% 11.90% 10.36%
S&P 500 Index 15.25% 40.79% 17.65% 14.84%Bloomberg Barclays US Government/
Credit Bond Index -1.96% -0.39% 3.31% 3.71%ICE BofA US 3-Month Treasury Bill
Index 0.02% 0.09% 1.17% 0.63%
1 Not Annualized2 Calculated by Hartford Funds Management Company, LLC
PERFORMANCE DATA QUOTED REPRESENTS PAST PERFORMANCE AND DOESNOT GUARANTEE FUTURE RESULTS. The investment return and principal value ofthe investment will fluctuate so that investors’ shares, when redeemed, may beworth more or less than their original cost. The table does not reflect the deductionsof taxes, sales charges or other fees which may be applied at the variable contractlevel or by a qualified pension or retirement plan. Any such additional sales chargesor other fees or expenses would lower the contract’s or plan’s performance. Currentperformance may be lower or higher than the performance data quoted. To obtainperformance data current to the most recent month-end, please visit our websitehartfordfunds.com.
Total returns presented above were calculated using the Fund’s net asset value available toshareholders for sale or redemption of Fund shares on 06/30/2021, which may excludeinvestment transactions as of this date. All share class returns assume the reinvestment ofall distributions at net asset value and the deduction of all fund expenses. The total returnspresented in the Financial Highlights section of the report are calculated in the samemanner, but also take into account certain adjustment that are necessary under generallyaccepted accounting principles. As a result, the total returns in the Financial Highlightssection may differ from the total returns presented above.
You cannot invest directly in an index.
See “Benchmark Glossary” for benchmark descriptions.
Performance information may reflect waivers/reimbursements without which performancewould have been lower.
As shown in the Fund’s current prospectus, the total annual fund operating expense ratiosfor Class IA and Class IB were 0.67% and 0.92%, respectively. Gross and net expensesare the same. Actual expenses may be higher or lower. Please see the accompanyingFinancial Highlights for expense ratios for the period ended 06/30/2021.
The Fund is closed to certain qualified pension and retirement plans. For more information,please see the Fund’s statutory prospectus.
Important RisksInvesting involves risk, including the possible loss of principal. The Fundseeks to achieve its investment objective by allocating assets amongdifferent asset classes. Security prices fluctuate in value depending ongeneral market and economic conditions and the prospects of individualcompanies. • Fixed income security risks include credit, liquidity, call,duration, event, and interest-rate risk. As interest rates rise, bond pricesgenerally fall. • Foreign investments may be more volatile and less liquidthan U.S. investments and are subject to the risk of currency fluctuationsand adverse political, economic and regulatory developments.• Obligations of U.S. Government agencies are supported by varying
degrees of credit but are generally not backed by the full faith and credit ofthe U.S. Government. • Mortgage-related and asset-backed securities’risks include credit, interest-rate, prepayment, and extension risk.
Composition by Security Type(1)
as of 06/30/2021
CategoryPercentage of
Net Assets
Equity SecuritiesCommon Stocks 67.9%
Total 67.9%
Fixed Income SecuritiesAsset & Commercial Mortgage-Backed Securities 2.4%Corporate Bonds 13.6Foreign Government Obligations 0.3Municipal Bonds 0.6U.S. Government Agencies(2) 0.4U.S. Government Securities 12.6
Total 29.9%
Short-Term Investments 3.8Other Assets & Liabilities (1.6)
Total 100.0%
(1) For Fund compliance purposes, the Fund may not use the same classificationsystem. These classifications are used for financial reporting purposes.
(2) All or a portion of the securities categorized as U.S. Government Agencies wereagency mortgage-backed securities as of June 30, 2021.
2

123106 TX 3STATE STREET GLOBAL HLS SEMI-ANNUAL REPO
27-Jul-2021 10:06 ESTCLN PSLNF
Donnelley Financial LSWdevap0dcSTART PAGE
14*PMT 1C
VDI-W7-PFL-211221.7.8.0
Hartford Capital Appreciation HLS FundFund OverviewJune 30, 2021 (Unaudited)
Inception 04/02/1984Sub-advised by Wellington Management Company LLP
Investment objective – The Fund seeks growth of capital.
Average Annual Total Returnsfor the Periods Ending 06/30/2021
Six Months1 1 Year 5 Years 10 Years
Class IA 10.07% 39.02% 16.45% 12.56%Class IB 9.91% 38.64% 16.16% 12.28%Class IC 9.79% 38.30% 15.87% 12.00%Russell 3000 Index 15.11% 44.16% 17.89% 14.70%S&P 500 Index 15.25% 40.79% 17.65% 14.84%
1 Not Annualized
PERFORMANCE DATA QUOTED REPRESENTS PAST PERFORMANCE AND DOESNOT GUARANTEE FUTURE RESULTS. The investment return and principal value ofthe investment will fluctuate so that investors’ shares, when redeemed, may beworth more or less than their original cost. The table does not reflect the deductionsof taxes, sales charges or other fees which may be applied at the variable contractlevel or by a qualified pension or retirement plan. Any such additional sales chargesor other fees or expenses would lower the contract’s or plan’s performance. Currentperformance may be lower or higher than the performance data quoted. To obtainperformance data current to the most recent month-end, please visit our websitehartfordfunds.com.
Total returns presented above were calculated using the Fund’s net asset value available toshareholders for sale or redemption of Fund shares on 06/30/2021, which may excludeinvestment transactions as of this date. All share class returns assume the reinvestment ofall distributions at net asset value and the deduction of all fund expenses. The total returnspresented in the Financial Highlights section of the report are calculated in the samemanner, but also take into account certain adjustment that are necessary under generallyaccepted accounting principles. As a result, the total returns in the Financial Highlightssection may differ from the total returns presented above.
Class IC shares commenced operations on 04/30/2014. Class IC shares performance priorto that date reflects Class IA shares performance adjusted to reflect the 12b-1 fee of 0.25%and the administrative services fee of 0.25% applicable to Class IC shares. Theperformance after such date reflects actual Class IC shares performance.
You cannot invest directly in an index.
See “Benchmark Glossary” for benchmark descriptions.
As shown in the Fund’s current prospectus, the total annual fund operating expense ratiosfor Class IA, Class IB and Class IC were 0.67%, 0.92% and 1.17%, respectively. Grossand net expenses are the same. Actual expenses may be higher or lower. Please see theaccompanying Financial Highlights for expense ratios for the period ended 06/30/2021.
Class IA and IB shares of the Fund are closed to certain qualified pension and retirementplans. For more information, please see the Fund’s statutory prospectus.
Important RisksInvesting involves risk, including the possible loss of principal. TheFund’s strategy for allocating assets among portfolio managementteams may not work as intended. Security prices fluctuate in valuedepending on general market and economic conditions and theprospects of individual companies. • Mid-cap securities can have greaterrisks and volatility than large-cap securities. • Foreign investments maybe more volatile and less liquid than U.S. investments and are subject tothe risk of currency fluctuations and adverse political, economic andregulatory developments. These risks are generally greater forinvestments in emerging markets. • To the extent the Fund focuses onone or more sectors, the Fund may be subject to increased volatility andrisk of loss if adverse developments occur.
Composition by Sector(1)
as of 06/30/2021
SectorPercentage of
Net Assets
Equity SecuritiesCommunication Services 8.1%Consumer Discretionary 16.8Consumer Staples 7.3Energy 1.5Financials 11.4Health Care 14.1Industrials 10.0Information Technology 19.7Materials 2.7Real Estate 4.1Utilities 1.9
Total 97.6%
Short-Term Investments 2.8Other Assets & Liabilities (0.4)
Total 100.0%
(1) A sector may be comprised of several industries. For Fund compliance purposes, theFund may not use the same classification system. These sector classifications areused for financial reporting purposes.
3

123106 TX 4STATE STREET GLOBAL HLS SEMI-ANNUAL REPO
27-Jul-2021 09:36 ESTCLN PSLNF
Donnelley Financial LSWdevap0dcSTART PAGE
17*PMT 1C
VDI-W7-PFL-211221.7.8.0
Hartford Disciplined Equity HLS FundFund OverviewJune 30, 2021 (Unaudited)
Inception 05/29/1998Sub-advised by Wellington Management Company LLP
Investment objective – The Fund seeks growth of capital.
Average Annual Total Returnsfor the Periods Ending 06/30/2021
Six Months1 1 Year 5 Years 10 Years
Class IA 14.25% 40.77% 17.43% 15.58%Class IB 14.07% 40.41% 17.13% 15.29%Class IC 13.97% 40.08% 16.84% 15.01%S&P 500 Index 15.25% 40.79% 17.65% 14.84%
1 Not Annualized
PERFORMANCE DATA QUOTED REPRESENTS PAST PERFORMANCE AND DOESNOT GUARANTEE FUTURE RESULTS. The investment return and principal value ofthe investment will fluctuate so that investors’ shares, when redeemed, may beworth more or less than their original cost. The table does not reflect the deductionsof taxes, sales charges or other fees which may be applied at the variable contractlevel or by a qualified pension or retirement plan. Any such additional sales chargesor other fees or expenses would lower the contract’s or plan’s performance. Currentperformance may be lower or higher than the performance data quoted. To obtainperformance data current to the most recent month-end, please visit our websitehartfordfunds.com.
Total returns presented above were calculated using the Fund’s net asset value available toshareholders for sale or redemption of Fund shares on 06/30/2021, which may excludeinvestment transactions as of this date. All share class returns assume the reinvestment ofall distributions at net asset value and the deduction of all fund expenses. The total returnspresented in the Financial Highlights section of the report are calculated in the samemanner, but also take into account certain adjustment that are necessary under generallyaccepted accounting principles. As a result, the total returns in the Financial Highlightssection may differ from the total returns presented above.
Class IC shares commenced operations on 09/18/2020. Class IC shares performance priorto that date reflects Class IA shares performance adjusted to reflect the 12b-1 fee of 0.25%and the administrative services fee of 0.25% applicable to Class IC shares. Theperformance after such date reflects actual Class IC shares performance.
You cannot invest directly in an index.
See “Benchmark Glossary” for benchmark descriptions.
As shown in the Fund’s current prospectus, the total annual fund operating expense ratiosfor Class IA, Class IB and Class IC were 0.64%, 0.89% and 1.14%, respectively. Grossand net expenses are the same. Actual expenses may be higher or lower. Please see theaccompanying Financial Highlights for expense ratios for the period ended 06/30/2021.
Class IA and Class IB of the Fund are closed to certain qualified pension and retirementplans. For more information, please see the Fund’s statutory prospectus.
Important RisksInvesting involves risk, including the possible loss of principal. Securityprices fluctuate in value depending on general market and economicconditions and the prospects of individual companies.
Composition by Sector(1)
as of 06/30/2021
SectorPercentage of
Net Assets
Equity SecuritiesCommunication Services 12.5%Consumer Discretionary 12.9Consumer Staples 6.5Energy 1.3Financials 12.0Health Care 13.7Industrials 9.7Information Technology 25.8Materials 1.1Real Estate 1.8Utilities 2.0
Total 99.3%
Short-Term Investments 0.6Other Assets & Liabilities 0.1
Total 100.0%
(1) A sector may be comprised of several industries. For Fund compliance purposes, theFund may not use the same classification system. These sector classifications areused for financial reporting purposes.
4

p
123106 TX 5STATE STREET GLOBAL HLS SEMI-ANNUAL REPO
27-Jul-2021 03:57 ESTCLN PSLNF
Donnelley Financial LSWsrink1dcSTART PAGE
14*PMT 1C
VDI-W7-PFL-209421.7.8.0
Hartford Dividend and Growth HLS FundFund OverviewJune 30, 2021 (Unaudited)
Inception 03/09/1994Sub-advised by Wellington Management Company LLP
Investment objective – The Fund seeks a high level of current income consistentwith growth of capital.
Average Annual Total Returnsfor the Periods Ending 06/30/2021
Six Months1 1 Year 5 Years 10 Years
Class IA 17.53% 42.69% 15.04% 12.90%Class IB 17.42% 42.38% 14.76% 12.62%S&P 500 Index 15.25% 40.79% 17.65% 14.84%Russell 1000 Value Index 17.05% 43.68% 11.87% 11.61%
1 Not Annualized
PERFORMANCE DATA QUOTED REPRESENTS PAST PERFORMANCE AND DOESNOT GUARANTEE FUTURE RESULTS. The investment return and principal value ofthe investment will fluctuate so that investors’ shares, when redeemed, may beworth more or less than their original cost. The table does not reflect the deductionsof taxes, sales charges or other fees which may be applied at the variable contractlevel or by a qualified pension or retirement plan. Any such additional sales chargesor other fees or expenses would lower the contract’s or plan’s performance. Currentperformance may be lower or higher than the performance data quoted. To obtainperformance data current to the most recent month-end, please visit our websitehartfordfunds.com.
Total returns presented above were calculated using the Fund’s net asset value available toshareholders for sale or redemption of Fund shares on 06/30/2021, which may excludeinvestment transactions as of this date. All share class returns assume the reinvestment ofall distributions at net asset value and the deduction of all fund expenses. The total returnspresented in the Financial Highlights section of the report are calculated in the samemanner, but also take into account certain adjustment that are necessary under generallyaccepted accounting principles. As a result, the total returns in the Financial Highlightssection may differ from the total returns presented above.
You cannot invest directly in an index.
See “Benchmark Glossary” for benchmark descriptions.
As shown in the Fund’s current prospectus, the total annual fund operating expense ratiosfor Class IA and Class IB were 0.66% and 0.91%, respectively. Gross and net expensesare the same. Actual expenses may be higher or lower. Please see the accompanyingFinancial Highlights for expense ratios for the period ended 06/30/2021.
The Fund is closed to certain qualified pension and retirement plans. For more information,please see the Fund’s statutory prospectus.
Important RisksInvesting involves risk, including the possible loss of principal. Securityprices fluctuate in value depending on general market and economicconditions and the prospects of individual companies. • For dividend-paying stocks, dividends are not guaranteed and may decrease withoutnotice. • Foreign investments may be more volatile and less liquid thanU.S. investments and are subject to the risk of currency fluctuations andadverse political, economic and regulatory developments. • To the extentthe Fund focuses on one or more sectors, the Fund may be subject toincreased volatility and risk of loss if adverse developments occur.• Integration of environmental, social, and/or governance (ESG) factorsinto the investment process may not work as intended.
Composition by Sector(1)
as of 06/30/2021
SectorPercentage of
Net Assets
Equity SecuritiesCommunication Services 8.8%Consumer Discretionary 6.1Consumer Staples 4.9Energy 4.5Financials 19.9Health Care 15.2Industrials 9.8Information Technology 19.2Materials 3.8Real Estate 3.2Utilities 3.1
Total 98.5%
Short-Term Investments 2.3Other Assets & Liabilities (0.8)
Total 100.0%
(1) A sector may be comprised of several industries. For Fund compliance purposes, theFund may not use the same classification system. These sector classifications areused for financial reporting purposes.
5

pp
123106 TX 6STATE STREET GLOBAL HLS SEMI-ANNUAL REPO
27-Jul-2021 09:37 ESTCLN PSLNF
Donnelley Financial LSWdevap0dcSTART PAGE
16*PMT 1C
VDI-W7-PFL-211221.7.8.0
Hartford Healthcare HLS FundFund OverviewJune 30, 2021 (Unaudited)
Inception 05/01/2000Sub-advised by Wellington Management Company LLP
Investment objective – The Fund seeks long-term capital appreciation.
Average Annual Total Returnsfor the Periods Ending 06/30/2021
Six Months1 1 Year 5 Years 10 Years
Class IA 8.12% 27.09% 15.74% 16.75%Class IB 8.01% 26.78% 15.46% 16.46%S&P Composite 1500 Health
Care Index 11.81% 28.88% 14.52% 15.91%S&P 500 Index 15.25% 40.79% 17.65% 14.84%
1 Not Annualized
PERFORMANCE DATA QUOTED REPRESENTS PAST PERFORMANCE AND DOESNOT GUARANTEE FUTURE RESULTS. The investment return and principal value ofthe investment will fluctuate so that investors’ shares, when redeemed, may beworth more or less than their original cost. The table does not reflect the deductionsof taxes, sales charges or other fees which may be applied at the variable contractlevel or by a qualified pension or retirement plan. Any such additional sales chargesor other fees or expenses would lower the contract’s or plan’s performance. Currentperformance may be lower or higher than the performance data quoted. To obtainperformance data current to the most recent month-end, please visit our websitehartfordfunds.com.
Total returns presented above were calculated using the Fund’s net asset value available toshareholders for sale or redemption of Fund shares on 06/30/2021, which may excludeinvestment transactions as of this date. All share class returns assume the reinvestment ofall distributions at net asset value and the deduction of all fund expenses. The total returnspresented in the Financial Highlights section of the report are calculated in the samemanner, but also take into account certain adjustment that are necessary under generallyaccepted accounting principles. As a result, the total returns in the Financial Highlightssection may differ from the total returns presented above.
You cannot invest directly in an index.
See “Benchmark Glossary” for benchmark descriptions.
As shown in the Fund’s current prospectus, the total annual fund operating expense ratiosfor Class IA and Class IB were 0.91% and 1.16%, respectively. Gross and net expensesare the same. Actual expenses may be higher or lower. Please see the accompanyingFinancial Highlights for expense ratios for the period ended 06/30/2021.
The Fund is closed to certain qualified pension and retirement plans. For more information,please see the Fund’s statutory prospectus.
Important RisksInvesting involves risk, including the possible loss of principal. Securityprices fluctuate in value depending on general market and economicconditions and the prospects of individual companies. • Risks of focusinginvestments on the healthcare related sector include regulatory and legaldevelopments, patent considerations, intense competitive pressures,rapid technological changes, potential product obsolescence, andliquidity risk. • Small- and mid-cap securities can have greater risks andvolatility than large-cap securities. • Foreign investments may be morevolatile and less liquid than U.S. investments and are subject to the riskof currency fluctuations and adverse political, economic and regulatorydevelopments. These risks may be greater, and include additional risks,for investments in emerging markets.
Composition by Subsector(1)
as of 06/30/2021
SubsectorPercentage of
Net Assets
Equity SecuritiesBiotechnology 19.8%Consumer Finance 0.1Diversified Telecommunication Services 0.3Health Care Equipment & Supplies 24.7Health Care Providers & Services 17.5Insurance 0.3Life Sciences Tools & Services 8.1Pharmaceuticals 26.2
Total 97.0%
Short-Term Investments 6.9Other Assets & Liabilities (3.9)
Total 100.0%
(1) For Fund compliance purposes, the Fund may not use the same classificationsystem. These Subsector classifications are used for financial reporting purposes.
6

123106 TX 7STATE STREET GLOBAL HLS SEMI-ANNUAL REPO
27-Jul-2021 02:46 ESTCLN PSLNF
Donnelley Financial LSWsrink1dcSTART PAGE
13*PMT 1C
VDI-W7-PFL-209421.7.8.0
Hartford International Opportunities HLS FundFund OverviewJune 30, 2021 (Unaudited)
Inception 07/02/1990Sub-advised by Wellington Management Company LLP
Investment objective – The Fund seeks long-term growth of capital.
Average Annual Total Returnsfor the Periods Ending 06/30/2021
Six Months1 1 Year 5 Years 10 Years
Class IA 5.87% 35.46% 11.34% 7.08%Class IB 5.79% 35.17% 11.07% 6.81%MSCI ACWI ex USA Index (Net) 9.16% 35.72% 11.08% 5.45%
1 Not Annualized
PERFORMANCE DATA QUOTED REPRESENTS PAST PERFORMANCE AND DOESNOT GUARANTEE FUTURE RESULTS. The investment return and principal value ofthe investment will fluctuate so that investors’ shares, when redeemed, may beworth more or less than their original cost. The table does not reflect the deductionsof taxes, sales charges or other fees which may be applied at the variable contractlevel or by a qualified pension or retirement plan. Any such additional sales chargesor other fees or expenses would lower the contract’s or plan’s performance. Currentperformance may be lower or higher than the performance data quoted. To obtainperformance data current to the most recent month-end, please visit our websitehartfordfunds.com.
Total returns presented above were calculated using the Fund’s net asset value available toshareholders for sale or redemption of Fund shares on 06/30/2021, which may excludeinvestment transactions as of this date. All share class returns assume the reinvestment ofall distributions at net asset value and the deduction of all fund expenses. The total returnspresented in the Financial Highlights section of the report are calculated in the samemanner, but also take into account certain adjustment that are necessary under generallyaccepted accounting principles. As a result, the total returns in the Financial Highlightssection may differ from the total returns presented above.
You cannot invest directly in an index.
See “Benchmark Glossary” for benchmark descriptions.
As shown in the Fund’s current prospectus, the total annual fund operating expense ratiosfor Class IA and Class IB were 0.75% and 1.00%, respectively. Gross and net expensesare the same. Actual expenses may be higher or lower. Please see the accompanyingFinancial Highlights for expense ratios for the period ended 06/30/2021.
The Fund is closed to certain qualified pension and retirement plans. For more information,please see the Fund’s statutory prospectus.
Important RisksInvesting involves risk, including the possible loss of principal. Securityprices fluctuate in value depending on general market and economicconditions and the prospects of individual companies. • Foreigninvestments may be more volatile and less liquid than U.S. investmentsand are subject to the risk of currency fluctuations and adverse political,economic and regulatory developments. These risks may be greater,and include additional risks, for investments in emerging markets.• Mid-cap securities can have greater risks and volatility than large-capsecurities. • To the extent the Fund focuses on one or more sectors,geographic regions or countries, the Fund may be subject to increasedvolatility and risk of loss if adverse developments occur. • Integration ofenvironmental, social, and/or governance (ESG) factors into theinvestment process may not work as intended. • The Fund may havehigh portfolio turnover, which could increase its transaction costs.
Composition by Sector(1)
as of 06/30/2021
SectorPercentage of
Net Assets
Equity SecuritiesCommunication Services 4.5%Consumer Discretionary 13.1Consumer Staples 6.3Energy 6.0Financials 17.0Health Care 9.5Industrials 14.0Information Technology 16.0Materials 5.5Real Estate 2.4Utilities 3.3
Total 97.6%
Short-Term Investments 1.5Other Assets & Liabilities 0.9
Total 100.0%
(1) A sector may be comprised of several industries. For Fund compliance purposes, theFund may not use the same classification system. These sector classifications areused for financial reporting purposes.
7
q
123106 TX 8STATE STREET GLOBAL HLS SEMI-ANNUAL REPO
27-Jul-2021 03:10 ESTCLN PSLNF
Donnelley Financial LSWsrink1dcSTART PAGE
12*PMT 1C
VDI-W7-PFL-209421.7.8.0
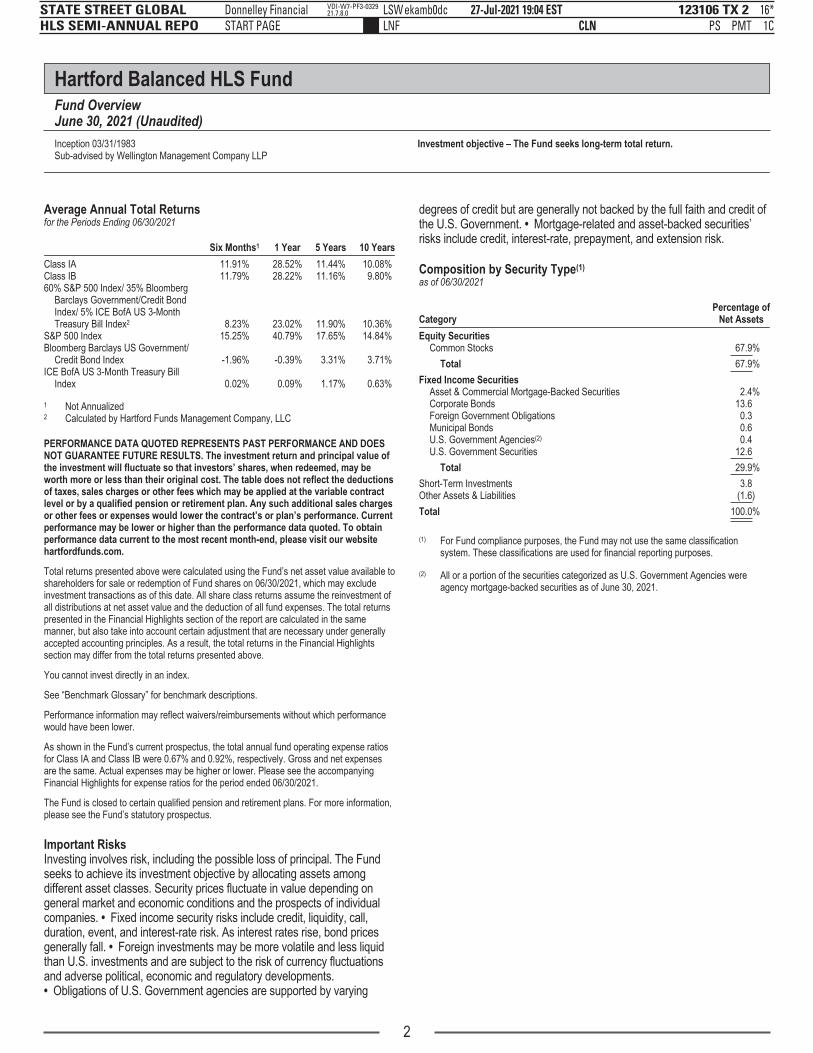
Hartford MidCap HLS FundFund OverviewJune 30, 2021 (Unaudited)
Inception 07/14/1997Sub-advised by Wellington Management Company LLP
Investment objective – The Fund seeks long-term growth of capital.
Average Annual Total Returnsfor the Periods Ending 06/30/2021
Six Months1 1 Year 5 Years 10 Years
Class IA 8.33% 42.75% 17.68% 14.22%Class IB 8.21% 42.42% 17.39% 13.93%S&P MidCap 400 Index 17.60% 53.24% 14.29% 12.40%
1 Not Annualized
PERFORMANCE DATA QUOTED REPRESENTS PAST PERFORMANCE AND DOESNOT GUARANTEE FUTURE RESULTS. The investment return and principal value ofthe investment will fluctuate so that investors’ shares, when redeemed, may beworth more or less than their original cost. The table does not reflect the deductionsof taxes, sales charges or other fees which may be applied at the variable contractlevel or by a qualified pension or retirement plan. Any such additional sales chargesor other fees or expenses would lower the contract’s or plan’s performance. Currentperformance may be lower or higher than the performance data quoted. To obtainperformance data current to the most recent month-end, please visit our websitehartfordfunds.com.
Total returns presented above were calculated using the Fund’s net asset value available toshareholders for sale or redemption of Fund shares on 06/30/2021, which may excludeinvestment transactions as of this date. All share class returns assume the reinvestment ofall distributions at net asset value and the deduction of all fund expenses. The total returnspresented in the Financial Highlights section of the report are calculated in the samemanner, but also take into account certain adjustment that are necessary under generallyaccepted accounting principles. As a result, the total returns in the Financial Highlightssection may differ from the total returns presented above.
You cannot invest directly in an index.
See “Benchmark Glossary” for benchmark descriptions.
As shown in the Fund’s current prospectus, the total annual fund operating expense ratiosfor Class IA and Class IB were 0.70% and 0.95%, respectively. Gross and net expensesare the same. Actual expenses may be higher or lower. Please see the accompanyingFinancial Highlights for expense ratios for the period ended 06/30/2021.
The Fund is closed to certain qualified pension and retirement plans. For more information,please see the Fund’s statutory prospectus.
Important RisksInvesting involves risk, including the possible loss of principal. Securityprices fluctuate in value depending on general market and economicconditions and the prospects of individual companies. • Mid-capsecurities can have greater risks and volatility than large-cap securities.• To the extent the Fund focuses on one or more sectors, the Fund maybe subject to increased volatility and risk of loss if adverse developmentsoccur. • Integration of environmental, social, and/or governance (ESG)factors into the investment process may not work as intended.
Composition by Sector(1)
as of 06/30/2021
SectorPercentage of
Net Assets
Equity SecuritiesCommunication Services 3.0%Consumer Discretionary 11.2Consumer Staples 2.1Energy 0.1Financials 11.4Health Care 19.8Industrials 14.8Information Technology 25.8Materials 2.5Real Estate 6.1Utilities 3.2
Total 100.0%
Short-Term Investments 1.4Other Assets & Liabilities (1.4)
Total 100.0%
(1) A sector may be comprised of several industries. For Fund compliance purposes, theFund may not use the same classification system. These sector classifications areused for financial reporting purposes.
8

p
123106 TX 9STATE STREET GLOBAL HLS SEMI-ANNUAL REPO
27-Jul-2021 10:07 ESTCLN PSLNF
Donnelley Financial LSWdevap0dcSTART PAGE
13*PMT 1C
VDI-W7-PFL-211221.7.8.0
Hartford Small Cap Growth HLS FundFund OverviewJune 30, 2021 (Unaudited)
Inception 05/02/1994Sub-advised by Wellington Management Company LLP
Investment objective – The Fund seeks long-term capital appreciation.
Average Annual Total Returnsfor the Periods Ending 06/30/2021
Six Months1 1 Year 5 Years 10 Years
Class IA 5.11% 47.03% 17.95% 13.68%Class IB 4.96% 46.69% 17.66% 13.40%Russell 2000 Growth Index 8.98% 51.36% 18.76% 13.52%
1 Not Annualized
PERFORMANCE DATA QUOTED REPRESENTS PAST PERFORMANCE AND DOESNOT GUARANTEE FUTURE RESULTS. The investment return and principal value ofthe investment will fluctuate so that investors’ shares, when redeemed, may beworth more or less than their original cost. The table does not reflect the deductionsof taxes, sales charges or other fees which may be applied at the variable contractlevel or by a qualified pension or retirement plan. Any such additional sales chargesor other fees or expenses would lower the contract’s or plan’s performance. Currentperformance may be lower or higher than the performance data quoted. To obtainperformance data current to the most recent month-end, please visit our websitehartfordfunds.com.
Total returns presented above were calculated using the Fund’s net asset value available toshareholders for sale or redemption of Fund shares on 06/30/2021, which may excludeinvestment transactions as of this date. All share class returns assume the reinvestment ofall distributions at net asset value and the deduction of all fund expenses. The total returnspresented in the Financial Highlights section of the report are calculated in the samemanner, but also take into account certain adjustment that are necessary under generallyaccepted accounting principles. As a result, the total returns in the Financial Highlightssection may differ from the total returns presented above.
You cannot invest directly in an index.
See “Benchmark Glossary” for benchmark descriptions.
As shown in the Fund’s current prospectus, the total annual fund operating expense ratiosfor Class IA and Class IB were 0.67% and 0.92%, respectively. Gross and net expensesare the same. Actual expenses may be higher or lower. Please see the accompanyingFinancial Highlights for expense ratios for the period ended 06/30/2021.
The Fund is closed to new investors, subject to certain exceptions. For more information,please see the Fund’s statutory prospectus.
Important RisksInvesting involves risk, including the possible loss of principal. Securityprices fluctuate in value depending on general market and economicconditions and the prospects of individual companies. • Small-capsecurities can have greater risks, including liquidity risk, and volatilitythan large-cap securities. • Different investment styles may go in and outfavor, which may cause the Fund to underperform the broader stockmarket. • To the extent the Fund focuses on one or more sectors, theFund may be subject to increased volatility and risk of loss if adversedevelopments occur.
Composition by Sector(1)
as of 06/30/2021
SectorPercentage of
Net Assets
Equity SecuritiesCommunication Services 1.9%Consumer Discretionary 14.5Consumer Staples 4.1Financials 4.7Health Care 29.4Industrials 15.4Information Technology 23.2Materials 1.8Real Estate 3.6
Total 98.6%
Short-Term Investments 1.5Other Assets & Liabilities (0.1)
Total 100.0%
(1) A sector may be comprised of several industries. For Fund compliance purposes, theFund may not use the same classification system. These sector classifications areused for financial reporting purposes.
9

jq gp
123106 TX 10STATE STREET GLOBAL HLS SEMI-ANNUAL REPO
27-Jul-2021 10:10 ESTCLN PSLNF
Donnelley Financial LSWdevap0dcSTART PAGE
13*PMT 1C
VDI-W7-PFL-211221.7.8.0
Hartford Small Company HLS FundFund OverviewJune 30, 2021 (Unaudited)
Inception 08/09/1996Sub-advised by Wellington Management Company LLP
Investment objective – The Fund seeks growth of capital.
Average Annual Total Returnsfor the Periods Ending 06/30/2021
Six Months1 1 Year 5 Years 10 Years
Class IA 4.70% 55.45% 24.08% 14.48%Class IB 4.58% 55.07% 23.77% 14.20%Russell 2000 Growth Index 8.98% 51.36% 18.76% 13.52%
1 Not Annualized
PERFORMANCE DATA QUOTED REPRESENTS PAST PERFORMANCE AND DOESNOT GUARANTEE FUTURE RESULTS. The investment return and principal value ofthe investment will fluctuate so that investors’ shares, when redeemed, may beworth more or less than their original cost. The table does not reflect the deductionsof taxes, sales charges or other fees which may be applied at the variable contractlevel or by a qualified pension or retirement plan. Any such additional sales chargesor other fees or expenses would lower the contract’s or plan’s performance. Currentperformance may be lower or higher than the performance data quoted. To obtainperformance data current to the most recent month-end, please visit our websitehartfordfunds.com.
Total returns presented above were calculated using the Fund’s net asset value available toshareholders for sale or redemption of Fund shares on 06/30/2021, which may excludeinvestment transactions as of this date. All share class returns assume the reinvestment ofall distributions at net asset value and the deduction of all fund expenses. The total returnspresented in the Financial Highlights section of the report are calculated in the samemanner, but also take into account certain adjustment that are necessary under generallyaccepted accounting principles. As a result, the total returns in the Financial Highlightssection may differ from the total returns presented above.
You cannot invest directly in an index.
See “Benchmark Glossary” for benchmark descriptions.
As shown in the Fund’s current prospectus, the total annual fund operating expense ratiosfor Class IA and Class IB were 0.81% and 1.06%, respectively. Gross and net expensesare the same. Actual expenses may be higher or lower. Please see the accompanyingFinancial Highlights for expense ratios for the period ended 06/30/2021.
The Fund is closed to new investors, subject to certain exceptions. For more information,please see the Fund’s statutory prospectus.
Important RisksInvesting involves risk, including the possible loss of principal. Securityprices fluctuate in value depending on general market and economicconditions and the prospects of individual companies. • Small-capsecurities can have greater risks, including liquidity risk, and volatilitythan large-cap securities. • Different investment styles may go in and outfavor, which may cause the Fund to underperform the broader stockmarket. • Foreign investments may be more volatile and less liquid thanU.S. investments and are subject to the risk of currency fluctuations andadverse political, economic and regulatory developments. • To the extentthe Fund focuses on one or more sectors, the Fund may be subject toincreased volatility and risk of loss if adverse developments occur. • TheFund may have high portfolio turnover, which could increase itstransaction costs.
Composition by Sector(1)
as of 06/30/2021
SectorPercentage of
Net Assets
Equity Securities0.1%
Communication Services 4.0Consumer Discretionary 20.5Consumer Staples 1.6Financials 3.5Health Care 27.7Industrials 10.8Information Technology 27.3Materials 0.6Real Estate 3.3
Total 99.4%
Short-Term Investments 2.9Other Assets & Liabilities (2.3)
Total 100.0%
(1) A sector may be comprised of several industries. For Fund compliance purposes, theFund may not use the same classification system. These sector classifications areused for financial reporting purposes.
10

g
123106 TX 11STATE STREET GLOBAL HLS SEMI-ANNUAL REPO
27-Jul-2021 10:07 ESTCLN PSLNF
Donnelley Financial LSWdevap0dcSTART PAGE
13*PMT 1C
VDI-W7-PFL-211221.7.8.0
Hartford Stock HLS FundFund OverviewJune 30, 2021 (Unaudited)
Inception 08/31/1977Sub-advised by Wellington Management Company LLP
Investment objective – The Fund seeks long-term growth of capital.
Average Annual Total Returnsfor the Periods Ending 06/30/2021
Six Months1 1 Year 5 Years 10 Years
Class IA 11.37% 34.20% 14.80% 13.20%Class IB 11.24% 33.87% 14.52% 12.92%Russell 1000 Index 14.95% 43.07% 17.99% 14.90%
1 Not Annualized
PERFORMANCE DATA QUOTED REPRESENTS PAST PERFORMANCE AND DOESNOT GUARANTEE FUTURE RESULTS. The investment return and principal value ofthe investment will fluctuate so that investors’ shares, when redeemed, may beworth more or less than their original cost. The table does not reflect the deductionsof taxes, sales charges or other fees which may be applied at the variable contractlevel or by a qualified pension or retirement plan. Any such additional sales chargesor other fees or expenses would lower the contract’s or plan’s performance. Currentperformance may be lower or higher than the performance data quoted. To obtainperformance data current to the most recent month-end, please visit our websitehartfordfunds.com.
Total returns presented above were calculated using the Fund’s net asset value available toshareholders for sale or redemption of Fund shares on 06/30/2021, which may excludeinvestment transactions as of this date. All share class returns assume the reinvestment ofall distributions at net asset value and the deduction of all fund expenses. The total returnspresented in the Financial Highlights section of the report are calculated in the samemanner, but also take into account certain adjustment that are necessary under generallyaccepted accounting principles. As a result, the total returns in the Financial Highlightssection may differ from the total returns presented above.
You cannot invest directly in an index.
See “Benchmark Glossary” for benchmark descriptions.
As shown in the Fund’s current prospectus, the total annual fund operating expense ratiosfor Class IA and Class IB were 0.52% and 0.77%, respectively. Gross and net expensesare the same. Actual expenses may be higher or lower. Please see the accompanyingFinancial Highlights for expense ratios for the period ended 06/30/2021.
The Fund is closed to certain qualified pension and retirement plans. For more information,please see the Fund’s statutory prospectus.
Important RisksInvesting involves risk, including the possible loss of principal. Securityprices fluctuate in value depending on general market and economicconditions and the prospects of individual companies. • For dividend-paying stocks, dividends are not guaranteed and may decrease withoutnotice. • Foreign investments may be more volatile and less liquid thanU.S. investments and are subject to the risk of currency fluctuations andadverse political, economic and regulatory developments.
Composition by Sector(1)
as of 06/30/2021
SectorPercentage of
Net Assets
Equity SecuritiesCommunication Services 1.9%Consumer Discretionary 12.1Consumer Staples 15.5Financials 9.9Health Care 20.3Industrials 21.5Information Technology 9.4Materials 4.8Real Estate 3.6
Total 99.0%
Short-Term Investments 0.8Other Assets & Liabilities 0.2
Total 100.0%
(1) A sector may be comprised of several industries. For Fund compliance purposes, theFund may not use the same classification system. These sector classifications areused for financial reporting purposes.
11

p
123106 TX 12STATE STREET GLOBAL HLS SEMI-ANNUAL REPO
27-Jul-2021 07:41 ESTCLN PSLNF
Donnelley Financial LSWsrink1dcSTART PAGE
14*PMT 1C
VDI-W7-PFL-179421.7.8.0
Hartford Total Return Bond HLS FundFund OverviewJune 30, 2021 (Unaudited)
Inception 08/31/1977Sub-advised by Wellington Management Company LLP
Investment objective – The Fund seeks a competitive total return, with income as asecondary objective.
Average Annual Total Returnsfor the Periods Ending 06/30/2021
Six Months1 1 Year 5 Years 10 Years
Class IA -1.09% 2.30% 4.28% 4.22%Class IB -1.18% 2.05% 4.02% 3.96%Bloomberg Barclays U.S.
Aggregate Bond Index -1.60% -0.33% 3.03% 3.39%
1 Not Annualized
PERFORMANCE DATA QUOTED REPRESENTS PAST PERFORMANCE AND DOESNOT GUARANTEE FUTURE RESULTS. The investment return and principal value ofthe investment will fluctuate so that investors’ shares, when redeemed, may beworth more or less than their original cost. The table does not reflect the deductionsof taxes, sales charges or other fees which may be applied at the variable contractlevel or by a qualified pension or retirement plan. Any such additional sales chargesor other fees or expenses would lower the contract’s or plan’s performance. Currentperformance may be lower or higher than the performance data quoted. To obtainperformance data current to the most recent month-end, please visit our websitehartfordfunds.com.
Total returns presented above were calculated using the Fund’s net asset value available toshareholders for sale or redemption of Fund shares on 06/30/2021, which may excludeinvestment transactions as of this date. All share class returns assume the reinvestment ofall distributions at net asset value and the deduction of all fund expenses. The total returnspresented in the Financial Highlights section of the report are calculated in the samemanner, but also take into account certain adjustment that are necessary under generallyaccepted accounting principles. As a result, the total returns in the Financial Highlightssection may differ from the total returns presented above.
Performance information prior to 03/05/2012 represents performance of the Fund’sprevious sub-adviser, Hartford Investment Management Company (“HIMCO”). As of03/05/2012, HIMCO no longer served as the sub-adviser to the Fund.
You cannot invest directly in an index.
See “Benchmark Glossary” for benchmark descriptions.
As shown in the Fund’s current prospectus, the total annual fund operating expense ratiosfor Class IA and Class IB were 0.51% and 0.76%, respectively. Gross and net expensesare the same. Actual expenses may be higher or lower. Please see the accompanyingFinancial Highlights for expense ratios for the period ended 06/30/2021.
The Fund is closed to certain qualified pension and retirement plans. For more information,please see the Fund’s statutory prospectus.
Important RisksInvesting involves risk, including the possible loss of principal. Securityprices fluctuate in value depending on general market and economicconditions and the prospects of individual companies. The Fund mayallocate a portion of its assets to specialist portfolio managers, whichmay not work as intended. • Fixed income security risks include credit,liquidity, call, duration, event, and interest-rate risk. As interest rates rise,bond prices generally fall. • The risks associated with mortgage-relatedand asset-backed securities as well as collateralized loan obligations(CLOs) include credit, interest-rate, prepayment, liquidity, default andextension risk. • The purchase of securities in the To-Be-Announced(TBA) market can result in higher portfolio turnover and relatedexpenses as well as price and counterparty risk. • Derivatives aregenerally more volatile and sensitive to changes in market or economicconditions than other securities; their risks include currency, leverage,liquidity, index, pricing, regulatory and counterparty risk. • Foreigninvestments may be more volatile and less liquid than U.S. investments
and are subject to the risk of currency fluctuations and adverse political,economic and regulatory developments. These risks may be greater,and include additional risks, for investments in emerging markets.• Investments in high-yield (“junk”) bonds involve greater risks of pricevolatility, illiquidity, and default than higher-rated debt securities.• Obligations of U.S. Government agencies are supported by varyingdegrees of credit but are generally not backed by the full faith and creditof the U.S. Government. • Restricted securities may be more difficult tosell and price than other securities. • The Fund may have high portfolioturnover, which could increase its transaction costs.
Composition by Security Type(1)
as of 06/30/2021
CategoryPercentage of
Net Assets
Equity SecuritiesCommon Stocks 0.0%*Preferred Stocks 0.1Warrants 0.0*
Total 0.1%
Fixed Income SecuritiesAsset & Commercial Mortgage-Backed Securities 22.9%Corporate Bonds 33.3Foreign Government Obligations 6.3Municipal Bonds 1.2Senior Floating Rate Interests 4.4U.S. Government Agencies(2) 40.6U.S. Government Securities 18.2
Total 126.9%
Short-Term Investments 1.5Purchased Options 0.0*Other Assets & Liabilities (28.5)
Total 100.0%
* Percentage rounds to zero.
(1) For Fund compliance purposes, the Fund may not use the same classificationsystem. These classifications are used for financial reporting purposes.
(2) All or a portion of the securities categorized as U.S. Government Agencies wereagency mortgage-backed securities as of June 30, 2021.
12

123106 TX 13STATE STREET GLOBAL HLS SEMI-ANNUAL REPO
28-Jul-2021 08:51 ESTCLN PSLNF
Donnelley Financial LSWmadas0dcSTART PAGE
16*PMT 1C
VDI-W7-PFL-220621.7.8.0
Hartford Ultrashort Bond HLS FundFund OverviewJune 30, 2021 (Unaudited)
Inception 06/30/1980Sub-advised by Wellington Management Company LLP
Investment objective – The Fund seeks total return and income consistent withpreserving capital and maintaining liquidity.
Average Annual Total Returnsfor the Periods Ending 06/30/2021
Six Months1 1 Year 5 YearsSince
Inception2
Class IA 0.00% 0.16% 1.44% 1.04%Class IB -0.10% -0.01% 1.18% 0.80%Bloomberg Barclays Short
Treasury 9-12 Month Index 0.09% 0.21% 1.48% 1.09%
1 Not Annualized
2 On 10/21/2013, the Fund converted from a money market fund to an ultrashort bondfund. Since Inception returns are from conversion date (10/21/2013) to 06/30/2021.
PERFORMANCE DATA QUOTED REPRESENTS PAST PERFORMANCE AND DOESNOT GUARANTEE FUTURE RESULTS. The investment return and principal value ofthe investment will fluctuate so that investors’ shares, when redeemed, may beworth more or less than their original cost. The table does not reflect the deductionsof taxes, sales charges or other fees which may be applied at the variable contractlevel or by a qualified pension or retirement plan. Any such additional sales chargesor other fees or expenses would lower the contract’s or plan’s performance. Currentperformance may be lower or higher than the performance data quoted. To obtainperformance data current to the most recent month-end, please visit our websitehartfordfunds.com.
Total returns presented above were calculated using the Fund’s net asset value available toshareholders for sale or redemption of Fund shares on 06/30/2021, which may excludeinvestment transactions as of this date. All share class returns assume the reinvestment ofall distributions at net asset value and the deduction of all fund expenses. The total returnspresented in the Financial Highlights section of the report are calculated in the samemanner, but also take into account certain adjustment that are necessary under generallyaccepted accounting principles. As a result, the total returns in the Financial Highlightssection may differ from the total returns presented above.
Prior to 10/21/2013, the Fund was managed as a money market fund. Accordingly,performance of the Fund prior to 10/21/2013 is not shown. Past performance informationfor when the Fund was managed as a money market fund is available upon request bycalling 1-888-843-7824.
You cannot invest directly in an index.
See “Benchmark Glossary” for benchmark descriptions.
As shown in the Fund’s current prospectus, the total annual fund operating expense ratiosfor Class IA and Class IB were 0.46% and 0.71%, respectively. Gross and net expensesare the same. Actual expenses may be higher or lower. Please see the accompanyingFinancial Highlights for expense ratios for the period ended 06/30/2021.
The Fund is closed to certain qualified pension and retirement plans. For more information,please see the Fund’s statutory prospectus.
Important RisksInvesting involves risk, including the possible loss of principal. Securityprices fluctuate in value depending on general market and economicconditions and the prospects of individual companies. • The risksassociated with mortgage-related and asset-backed securities includecredit, interest-rate, prepayment, liquidity, default and extension risk.• Derivatives are generally more volatile and sensitive to changes inmarket or economic conditions than other securities; their risks includecurrency, leverage, liquidity, index, pricing, regulatory and counterpartyrisk. • Obligations of U.S. Government agencies are supported byvarying degrees of credit but are generally not backed by the full faithand credit of the U.S. Government. • Fixed income security risks include
credit, liquidity, call, duration, event, and interest-rate risk. As interestrates rise, bond prices generally fall. • Restricted securities may be moredifficult to sell and price than other securities. • Repurchase agreementsmay increase the Fund’s risk and volatility.
Composition by Security Type(1)
as of 06/30/2021
CategoryPercentage of
Net Assets
Fixed Income SecuritiesAsset & Commercial Mortgage-Backed Securities 32.4%Corporate Bonds 30.7U.S. Government Agencies(2) 1.4U.S. Government Securities 9.2
Total 73.7%
Short-Term Investments 29.1Other Assets & Liabilities (2.8)
Total 100.0%
(1) For Fund compliance purposes, the Fund may not use the same classificationsystem. These classifications are used for financial reporting purposes.
(2) All or a portion of the securities categorized as U.S. Government Agencies wereagency mortgage-backed securities as of June 30, 2021.
13

p
123106 TX 14STATE STREET GLOBAL HLS SEMI-ANNUAL REPO
27-Jul-2021 19:04 ESTCLN PSLNF
Donnelley Financial LSWekamb0dcSTART PAGE
8*PMT 1C
VDI-W7-PF3-032921.7.8.0
Hartford HLS FundsBenchmark Glossary (Unaudited)
Bloomberg Barclays Government/Credit Bond Index (reflects nodeduction for fees, expenses or taxes) is designed to measure thenon-securitized component of the U.S. Aggregate Index. It includesinvestment grade, U.S. dollar-denominated, fixed-rate Treasuries,government-related and corporate securities. Effective August 24, 2021,“Barclays” will be removed from the index’s name.
Bloomberg Barclays Short Treasury 9-12 Month Index (reflects nodeduction for fees, expenses or taxes) includes aged U.S. Treasury bills,notes and bonds with a remaining maturity from 1 up to (but notincluding) 12 months. It excludes zero coupon strips. EffectiveAugust 24, 2021, “Barclays” will be removed from the index’s name.
Bloomberg Barclays U.S. Aggregate Bond Index (reflects nodeduction for fees, expenses or taxes) is composed of securities that areSecurities and Exchange Commission registered, taxable, and dollardenominated. The index covers the U.S. investment grade fixed ratebond market, with index components for government and corporatesecurities, mortgage pass-through securities, and asset-backedsecurities. These major sectors are subdivided into more specific indicesthat are calculated and reported on a regular basis. Effective August 24,2021, “Barclays” will be removed from the index’s name.
ICE BofA US 3-Month Treasury Bill Index (reflects no deduction forfees, expenses or taxes) is comprised of a single issue purchased at thebeginning of the month and held for a full month. At the end of the monththat issue is sold and rolled into a newly selected issue. The issueselected at each month-end rebalancing is the outstanding Treasury Billthat matures closest to, but not beyond, three months from therebalancing date. To qualify for selection, an issue must have settled onor before the month-end rebalancing date.
MSCI All Country World (ACWI) ex USA Index (Net) (reflectsreinvested dividends net of withholding taxes but reflects no deductionfor fees, expenses or other taxes) is designed to capture large and midcap representation across developed markets (excluding the UnitedStates) and emerging market countries.
Russell 1000 Index (reflects no deduction for fees, expenses or taxes) isdesigned to measure the performance of the 1,000 largest companies inthe Russell 3000 Index which is designed to measure the performance ofthe 3,000 largest U.S. companies based on total market capitalizations.
Russell 3000 Index (reflects no deduction for fees, expenses or taxes)is designed to measure the performance of the 3,000 largest U.S.companies based on total market capitalization.
Russell 2000 Growth Index (reflects no deduction for fees, expenses ortaxes) is designed to measure the performance of those Russell 2000Index companies with higher price-to-book ratios and higher forecastedgrowth values. The Russell 2000 Index is an index comprised of 2,000 ofthe smallest U.S.-domiciled company common stocks based on acombination of their market capitalization and current index membership.
Russell 1000 Value Index (reflects no deduction for fees, expenses ortaxes) is designed to measure the performance of those Russell 1000Index companies with lower price-to-book ratios and lower forecastedgrowth values. The Russell 1000 Index is designed to measure theperformance of the 1,000 largest companies in the Russell 3000 Indexbased on their market capitalization and current index membership.
S&P Composite 1500 Health Care Index (reflects no deduction forfees, expenses or taxes) is a float-adjusted market capitalization-weighted index comprised of those companies included in the S&PComposite 1500 that are classified as members of the Global IndustryClassification Standard (GICS®) health care sector.
S&P MidCap 400 Index (reflects no deduction for fees, expenses ortaxes) is a float-adjusted market capitalization-weighted index designedto measure the performance of the mid-cap segment of the market. Theindex is composed of 400 constituent companies.
S&P 500 Index (reflects no deduction for fees, expenses or taxes) is afloat-adjusted market capitalization-weighted index composed of 500widely held common stocks.
BLOOMBERG® is a trademark and service mark of Bloomberg FinanceL.P. and its affiliates (collectively “Bloomberg”). BARCLAYS® is atrademark and service mark of Barclays Bank Plc (collectively with itsaffiliates, “Barclays”), used under license. Bloomberg or Bloomberg’slicensors, including Barclays, own all proprietary rights in the BloombergBarclays Indices. Neither Bloomberg nor Barclays approves or endorsesthis material, or guarantees the accuracy or completeness of anyinformation herein, or makes any warranty, express or implied, as to theresults to be obtained therefrom and, to the maximum extent allowed bylaw, neither shall have any liability or responsibility for injury or damagesarising in connection therewith.
Neither MSCI nor any other party involved in or related to compiling,computing or creating the MSCI data makes any express or impliedwarranties or representations with respect to such data (or the results tobe obtained by the use thereof), and all such parties hereby expresslydisclaim all warranties of originality, accuracy, completeness,merchantability or fitness for a particular purpose with respect to any ofsuch data. Without limiting any of the foregoing, in no event shall MSCI,any of its affiliates or any third party involved in or related to compiling,computing or creating the data have any liability for any direct, indirect,special, punitive, consequential or any other damages (including lostprofits) even if notified of the possibility of such damages. No furtherdistribution or dissemination of the MSCI data is permitted withoutMSCI’s express written consent.
14

p
123106 TX 15STATE STREET GLOBAL HLS SEMI-ANNUAL REPO
27-Jul-2021 19:04 ESTCLN PSLNF
Donnelley Financial LSWekamb0dcSTART PAGE
13*PMT 1C
VDI-W7-PF3-032921.7.8.0
Hartford HLS FundsExpense Examples (Unaudited)
Your Fund’s ExpensesAs a shareholder of a Fund, you incur two types of costs: (1) transaction costs and (2) ongoing costs, including investment management fees,distribution and/or service (12b-1) fees, if any, and other fund expenses. This example is intended to help you understand your ongoing costs (indollars) of investing in a Fund and to compare these costs with the ongoing costs of investing in other mutual funds. The example is based on aninvestment of $1,000 invested at the beginning of the period and held for the entire period of January 1, 2021 through June 30, 2021, except asindicated below. To the extent a Fund was subject to acquired fund fees and expenses during the period, acquired fund fees and expenses are notincluded in the annualized expense ratios below.
Actual ExpensesThe first set of columns of the table below provides information about actual account values and actual expenses. You may use this information,together with the amount you invested, to estimate the expenses that you paid over the period. Simply divide your account value by $1,000 (forexample, an $8,600 account value divided by $1,000 = 8.6), then multiply the result by the number in the line under the heading entitled “ExpensesPaid During The Period” to estimate the expenses you paid on your account during this period.
Hypothetical Example for Comparison PurposesThe second set of columns of the table below provides information about hypothetical account values and hypothetical expenses based on a Fund’sactual expense ratio and an assumed rate of return of 5% per year before expenses, which is not the Fund’s actual return. The hypothetical accountvalues and expenses may not be used to estimate the actual ending account balance or expenses you paid for the period. You may use thisinformation to compare the ongoing costs of investing in a Fund and other funds. To do so, compare this 5% hypothetical example with the 5%hypothetical examples that appear in the shareholder reports of the other funds.
Please note that the expenses shown in the table are meant to highlight your ongoing costs only and do not reflect any transactional costs, such assales charges (loads) or fees which may be applied at the variable life insurance, variable annuity, or qualified retirement plan product level. Therefore,the second set of columns of the table is useful in comparing ongoing costs only, and will not help you determine the relative total costs of owningdifferent funds. In addition, if these transactional costs were included, your costs would be higher. Expenses for a class of a Fund are equal to theclass’ annualized expense ratio multiplied by average account value over the period, multiplied by 181/365 (to reflect the one-half year period).
Actual Return Hypothetical (5% return before expenses)
BeginningAccount ValueJanuary 1, 2021
EndingAccount ValueJune 30, 2021
Expenses paidduring the periodJanuary 1, 2021
throughJune 30, 2021
BeginningAccount ValueJanuary 1, 2021
EndingAccount ValueJune 30, 2021
Expenses paidduring the periodJanuary 1, 2021
throughJune 30, 2021
Annualizedexpense
ratio
Hartford Balanced HLS FundClass IA $ 1,000.00 $ 1,119.10 $ 3.26 $ 1,000.00 $ 1,021.72 $ 3.11 0.62%Class IB $ 1,000.00 $ 1,117.90 $ 4.57 $ 1,000.00 $ 1,020.48 $ 4.36 0.87%
Hartford Capital Appreciation HLS FundClass IA $ 1,000.00 $ 1,100.70 $ 3.49 $ 1,000.00 $ 1,021.47 $ 3.36 0.67%Class IB $ 1,000.00 $ 1,099.10 $ 4.79 $ 1,000.00 $ 1,020.23 $ 4.61 0.92%Class IC $ 1,000.00 $ 1,097.90 $ 6.09 $ 1,000.00 $ 1,018.99 $ 5.86 1.17%
Hartford Disciplined Equity HLS FundClass IA $ 1,000.00 $ 1,142.50 $ 3.13 $ 1,000.00 $ 1,021.87 $ 2.96 0.59%Class IB $ 1,000.00 $ 1,140.70 $ 4.46 $ 1,000.00 $ 1,020.63 $ 4.21 0.84%Class IC $ 1,000.00 $ 1,139.70 $ 5.78 $ 1,000.00 $ 1,019.39 $ 5.46 1.09%
Hartford Dividend and Growth HLS FundClass IA $ 1,000.00 $ 1,175.30 $ 3.56 $ 1,000.00 $ 1,021.52 $ 3.31 0.66%Class IB $ 1,000.00 $ 1,174.20 $ 4.91 $ 1,000.00 $ 1,020.28 $ 4.56 0.91%
Hartford Healthcare HLS FundClass IA $ 1,000.00 $ 1,081.20 $ 4.70 $ 1,000.00 $ 1,020.28 $ 4.56 0.91%Class IB $ 1,000.00 $ 1,080.10 $ 5.98 $ 1,000.00 $ 1,019.04 $ 5.81 1.16%
Hartford International Opportunities HLS FundClass IA $ 1,000.00 $ 1,059.20 $ 3.73 $ 1,000.00 $ 1,021.18 $ 3.66 0.73%Class IB $ 1,000.00 $ 1,057.90 $ 5.00 $ 1,000.00 $ 1,019.94 $ 4.91 0.98%
Hartford MidCap HLS FundClass IA $ 1,000.00 $ 1,083.30 $ 3.56 $ 1,000.00 $ 1,021.37 $ 3.46 0.69%Class IB $ 1,000.00 $ 1,082.10 $ 4.85 $ 1,000.00 $ 1,020.13 $ 4.71 0.94%
Hartford Small Cap Growth HLS FundClass IA $ 1,000.00 $ 1,051.60 $ 3.20 $ 1,000.00 $ 1,021.67 $ 3.16 0.63%Class IB $ 1,000.00 $ 1,050.20 $ 4.47 $ 1,000.00 $ 1,020.43 $ 4.41 0.88%
15

p
123106 TX 16STATE STREET GLOBAL HLS SEMI-ANNUAL REPO
27-Jul-2021 00:45 ESTCLN PSLNF
Donnelley Financial LSWbalam0dcNone
9*PMT 1C
VDI-W7-PF3-070821.7.8.0
Hartford HLS FundsExpense Examples (Unaudited) – (continued)
Actual Return Hypothetical (5% return before expenses)
BeginningAccount ValueJanuary 1, 2021
EndingAccount ValueJune 30, 2021
Expenses paidduring the periodJanuary 1, 2021
throughJune 30, 2021
BeginningAccount ValueJanuary 1, 2021
EndingAccount ValueJune 30, 2021
Expenses paidduring the periodJanuary 1, 2021
throughJune 30, 2021
Annualizedexpense
ratio
Hartford Small Company HLS FundClass IA $ 1,000.00 $ 1,047.40 $ 3.96 $ 1,000.00 $ 1,020.93 $ 3.91 0.78%Class IB $ 1,000.00 $ 1,046.20 $ 5.23 $ 1,000.00 $ 1,019.69 $ 5.16 1.03%
Hartford Stock HLS FundClass IA $ 1,000.00 $ 1,113.70 $ 2.67 $ 1,000.00 $ 1,022.27 $ 2.56 0.51%Class IB $ 1,000.00 $ 1,112.40 $ 3.98 $ 1,000.00 $ 1,021.03 $ 3.81 0.76%
Hartford Total Return Bond HLS FundClass IA $ 1,000.00 $ 989.10 $ 2.47 $ 1,000.00 $ 1,022.32 $ 2.51 0.50%Class IB $ 1,000.00 $ 988.20 $ 3.70 $ 1,000.00 $ 1,021.08 $ 3.76 0.75%
Hartford Ultrashort Bond HLS FundClass IA $ 1,000.00 $ 1,000.00 $ 2.13 $ 1,000.00 $ 1,022.66 $ 2.16 0.43%Class IB $ 1,000.00 $ 999.00 $ 3.37 $ 1,000.00 $ 1,021.42 $ 3.41 0.68%
16
p
123106 TX 17STATE STREET GLOBAL HLS SEMI-ANNUAL REPO
27-Jul-2021 20:50 ESTCLN PSLNF
Donnelley Financial LSWpf_rendSTART PAGE
7*PMT 1C
LSWP64RS2921.6.2.0
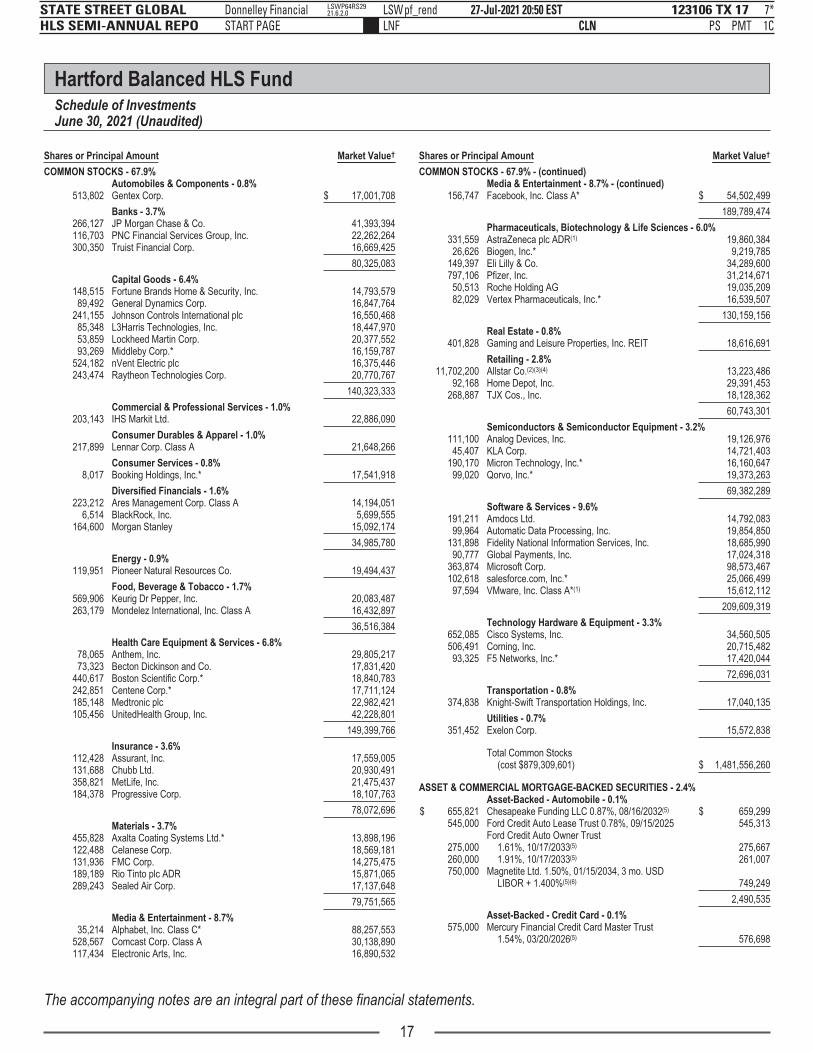
Hartford Balanced HLS FundSchedule of InvestmentsJune 30, 2021 (Unaudited)
Shares or Principal Amount Market Value†
COMMON STOCKS - 67.9%Automobiles & Components - 0.8%
513,802 Gentex Corp. $ 17,001,708
Banks - 3.7%266,127 JP Morgan Chase & Co. 41,393,394116,703 PNC Financial Services Group, Inc. 22,262,264300,350 Truist Financial Corp. 16,669,425
80,325,083
Capital Goods - 6.4%148,515 Fortune Brands Home & Security, Inc. 14,793,57989,492 General Dynamics Corp. 16,847,764
241,155 Johnson Controls International plc 16,550,46885,348 L3Harris Technologies, Inc. 18,447,97053,859 Lockheed Martin Corp. 20,377,55293,269 Middleby Corp.* 16,159,787
524,182 nVent Electric plc 16,375,446243,474 Raytheon Technologies Corp. 20,770,767
140,323,333
Commercial & Professional Services - 1.0%203,143 IHS Markit Ltd. 22,886,090
Consumer Durables & Apparel - 1.0%217,899 Lennar Corp. Class A 21,648,266
Consumer Services - 0.8%8,017 Booking Holdings, Inc.* 17,541,918
Diversified Financials - 1.6%223,212 Ares Management Corp. Class A 14,194,051
6,514 BlackRock, Inc. 5,699,555164,600 Morgan Stanley 15,092,174
34,985,780
Energy - 0.9%119,951 Pioneer Natural Resources Co. 19,494,437
Food, Beverage & Tobacco - 1.7%569,906 Keurig Dr Pepper, Inc. 20,083,487263,179 Mondelez International, Inc. Class A 16,432,897
36,516,384
Health Care Equipment & Services - 6.8%78,065 Anthem, Inc. 29,805,21773,323 Becton Dickinson and Co. 17,831,420
440,617 Boston Scientific Corp.* 18,840,783242,851 Centene Corp.* 17,711,124185,148 Medtronic plc 22,982,421105,456 UnitedHealth Group, Inc. 42,228,801
149,399,766
Insurance - 3.6%112,428 Assurant, Inc. 17,559,005131,688 Chubb Ltd. 20,930,491358,821 MetLife, Inc. 21,475,437184,378 Progressive Corp. 18,107,763
78,072,696
Materials - 3.7%455,828 Axalta Coating Systems Ltd.* 13,898,196122,488 Celanese Corp. 18,569,181131,936 FMC Corp. 14,275,475189,189 Rio Tinto plc ADR 15,871,065289,243 Sealed Air Corp. 17,137,648
79,751,565
Media & Entertainment - 8.7%35,214 Alphabet, Inc. Class C* 88,257,553
528,567 Comcast Corp. Class A 30,138,890117,434 Electronic Arts, Inc. 16,890,532
Shares or Principal Amount Market Value†
COMMON STOCKS - 67.9% - (continued)Media & Entertainment - 8.7% - (continued)
156,747 Facebook, Inc. Class A* $ 54,502,499
189,789,474
Pharmaceuticals, Biotechnology & Life Sciences - 6.0%331,559 AstraZeneca plc ADR(1) 19,860,38426,626 Biogen, Inc.* 9,219,785
149,397 Eli Lilly & Co. 34,289,600797,106 Pfizer, Inc. 31,214,67150,513 Roche Holding AG 19,035,20982,029 Vertex Pharmaceuticals, Inc.* 16,539,507
130,159,156
Real Estate - 0.8%401,828 Gaming and Leisure Properties, Inc. REIT 18,616,691
Retailing - 2.8%11,702,200 Allstar Co.(2)(3)(4) 13,223,486
92,168 Home Depot, Inc. 29,391,453268,887 TJX Cos., Inc. 18,128,362
60,743,301
Semiconductors & Semiconductor Equipment - 3.2%111,100 Analog Devices, Inc. 19,126,97645,407 KLA Corp. 14,721,403
190,170 Micron Technology, Inc.* 16,160,64799,020 Qorvo, Inc.* 19,373,263
69,382,289
Software & Services - 9.6%191,211 Amdocs Ltd. 14,792,08399,964 Automatic Data Processing, Inc. 19,854,850
131,898 Fidelity National Information Services, Inc. 18,685,99090,777 Global Payments, Inc. 17,024,318
363,874 Microsoft Corp. 98,573,467102,618 salesforce.com, Inc.* 25,066,49997,594 VMware, Inc. Class A*(1) 15,612,112
209,609,319
Technology Hardware & Equipment - 3.3%652,085 Cisco Systems, Inc. 34,560,505506,491 Corning, Inc. 20,715,48293,325 F5 Networks, Inc.* 17,420,044
72,696,031
Transportation - 0.8%374,838 Knight-Swift Transportation Holdings, Inc. 17,040,135
Utilities - 0.7%351,452 Exelon Corp. 15,572,838
Total Common Stocks(cost $879,309,601) $ 1,481,556,260
ASSET & COMMERCIAL MORTGAGE-BACKED SECURITIES - 2.4%Asset-Backed - Automobile - 0.1%
$ 655,821 Chesapeake Funding LLC 0.87%, 08/16/2032(5) $ 659,299545,000 Ford Credit Auto Lease Trust 0.78%, 09/15/2025 545,313
Ford Credit Auto Owner Trust275,000 1.61%, 10/17/2033(5) 275,667260,000 1.91%, 10/17/2033(5) 261,007750,000 Magnetite Ltd. 1.50%, 01/15/2034, 3 mo. USD
LIBOR + 1.400%(5)(6) 749,249
2,490,535
Asset-Backed - Credit Card - 0.1%575,000 Mercury Financial Credit Card Master Trust
1.54%, 03/20/2026(5) 576,698
The accompanying notes are an integral part of these financial statements.
17

123106 TX 18STATE STREET GLOBAL HLS SEMI-ANNUAL REPO
27-Jul-2021 20:50 ESTCLN PSLNF
Donnelley Financial LSWpf_rendNone
5*PMT 1C
LSWP64RS2921.6.2.0
Hartford Balanced HLS FundSchedule of Investments – (continued)June 30, 2021 (Unaudited)
Shares or Principal Amount Market Value†
ASSET & COMMERCIAL MORTGAGE-BACKED SECURITIES - 2.4% - (continued)Asset-Backed - Finance & Insurance - 1.0%
$ 530,000 Bain Capital Credit CLO Ltd. 1.35%, 07/24/2034,3 mo. USD LIBOR + 1.160%(5)(6) $ 530,652
310,000 Battalion CLO Ltd. 1.95%, 07/15/2034, 3 mo. USDLIBOR + 1.750%(5)(6) 310,122
Bayview Koitere Fund Trust603,922 3.50%, 07/28/2057(5)(7) 619,490302,866 4.00%, 11/28/2053(5)(7) 309,527
1,139,528 CF Hippolyta LLC 1.69%, 07/15/2060(5) 1,158,3271,810,000 Credit Acceptance Auto Loan Trust
1.24%, 10/15/2029(5) 1,828,255DB Master Finance LLC
309,488 3.79%, 05/20/2049(5) 313,501275,100 4.02%, 05/20/2049(5) 290,291860,000 Domino’s Pizza Master Issuer LLC
3.15%, 04/25/2051(5) 898,3131,720,000 FirstKey Homes Trust 1.54%, 08/17/2028 1,719,990
157,142 GreatAmerica Leasing Receivables Funding LLC2.83%, 06/17/2024(5) 158,100
284,620 Horizon Aircraft Finance Ltd. 3.43%, 11/15/2039(5) 279,7852,635,000 Madison Park Funding Ltd. 0.93%, 04/15/2029,
3 mo. USD LIBOR + 0.750%(5)(6) 2,635,053Magnetite Ltd.
2,670,800 0.98%, 01/15/2028, 3 mo. USD LIBOR +0.800%(5)(6) 2,672,865
1,615,000 1.66%, 11/15/2028, 3 mo. USD LIBOR +1.500%(5)(6) 1,607,831
1,000,000 MMAF Equipment Finance LLC2.21%, 12/15/2032(5) 1,020,043
1,255,000 Rockland Park CLO Ltd. 1.85%, 04/20/2034, 3 mo.USD LIBOR + 1.650%(5)(6) 1,255,442
940,000 RR Ltd. 1.73%, 07/15/2036(5)(6) 940,394107,259 Springleaf Funding Trust 3.48%, 05/15/2028(5) 107,385
1,970,510 Treman Park CLO Ltd. 1.26%, 10/20/2028, 3 mo.USD LIBOR + 1.070%(5)(6) 1,972,353
1,500,000 Wellfleet CLO Ltd. 1.92%, 07/20/2032, 3 mo. USDLIBOR + 1.750%(5)(6) 1,500,382
22,128,101
Commercial Mortgage-Backed Securities - 0.3%840,000 BAMLL Commercial Mortgage Securities Trust
4.23%, 08/10/2038(5)(7) 962,579255,000 BFLD Trust 2.12%, 11/15/2028, 1 mo. USD
LIBOR + 2.050%(5)(6) 258,206FREMF Mortgage Trust
160,000 3.63%, 11/25/2045(5)(7) 165,424790,000 3.66%, 02/25/2052(5)(7) 860,121810,000 3.77%, 10/25/2052(5)(7) 888,346285,000 3.81%, 01/25/2048(5)(7) 307,585160,000 3.82%, 04/25/2048(5)(7) 173,472200,000 3.91%, 10/25/2048(5)(7) 218,658160,000 4.02%, 02/25/2050(5)(7) 171,260
1,015,000 4.22%, 09/25/2025(5)(7) 1,120,873260,000 4.30%, 04/25/2049(5)(7) 289,685295,000 Life Mortgage Trust 0.77%, 03/15/2038, 1 mo. USD
LIBOR + 0.700%(5)(6) 295,6981,000,000 SFAVE Commercial Mortgage Securities Trust
4.14%, 01/05/2043(5)(7) 1,094,983
6,806,890
Other Asset-Backed Securities - 0.7%254,727 Aaset Trust 3.84%, 05/15/2039(5) 250,917
Affirm Asset Securitization Trust615,000 0.88%, 08/15/2025(5) 615,883813,321 1.07%, 08/15/2025(5) 814,553
Bayview Opportunity Master Fund Trust302,935 3.50%, 01/28/2055(5)(7) 310,622
Shares or Principal Amount Market Value†
ASSET & COMMERCIAL MORTGAGE-BACKED SECURITIES - 2.4% - (continued)Other Asset-Backed Securities - 0.7% - (continued)
$ 323,101 3.50%, 06/28/2057(5)(7) $ 330,429447,111 4.00%, 10/28/2064(5)(7) 456,525
1,225,000 BlueMountain CLO Ltd. 1.61%, 11/20/2028, 3 mo.USD LIBOR + 1.450%(5)(6) 1,226,515
Castlelake Aircraft Structured Trust267,150 3.47%, 01/15/2046(5) 271,727476,662 3.97%, 04/15/2039(5) 476,009
CF Hippolyta LLC345,000 1.53%, 03/15/2061(5) 347,215170,000 1.98%, 03/15/2061(5) 171,555
1,705,000 CIFC Funding Ltd. 1.23%, 04/24/2030, 3 mo. USDLIBOR + 1.050%(5)(6) 1,705,626
615,000 Domino’s Pizza Master Issuer LLC2.66%, 04/25/2051(5) 636,420
222,332 Horizon Aircraft Finance Ltd. 3.72%, 07/15/2039(5) 218,608200,501 Mach I 3.47%, 10/15/2039(5) 200,486209,225 MAPS Ltd. 4.46%, 03/15/2044(5) 209,790
Mill City Mortgage Loan Trust67,451 2.50%, 04/25/2057(5)(7) 67,806
372,137 2.75%, 01/25/2061(5)(7) 377,8411,580,000 Neuberger Berman Loan Advisers CLO Ltd.
1.54%, 10/18/2029, 3 mo. USD LIBOR +1.350%(5)(6) 1,576,312
500,000 Octagon Investment Partners Ltd.1.58%, 01/25/2031, 3 mo. USD LIBOR +1.400%(5)(6) 499,161
2,025,000 SCF Equipment Leasing 0.83%, 08/21/2028(5) 2,011,375START Ltd.
17,429 3.54%, 11/15/2044(5) 17,527184,406 4.09%, 03/15/2044(5) 186,283
Towd Point Mortgage Trust142,011 2.25%, 04/25/2056(5)(7) 142,529420,813 2.75%, 10/25/2056(5)(7) 427,253107,697 2.75%, 04/25/2057(5)(7) 109,197411,845 2.75%, 06/25/2057(5)(7) 423,449198,037 3.00%, 01/25/2058(5)(7) 203,257
Vantage Data Centers LLC1,150,000 1.65%, 09/15/2045(5) 1,153,530
333,767 3.19%, 07/15/2044(5) 345,429
15,783,829
Whole Loan Collateral CMO - 0.2%274,277 Angel Oak Mortgage Trust 2.62%, 11/25/2059(5)(7) 275,86292,681 Angel Oak Mortgage Trust LLC
3.63%, 03/25/2049(5)(7) 93,765Fannie Mae Connecticut Avenue Securities
564,659 2.29%, 01/25/2030, 1 mo. USD LIBOR +2.200%(6) 573,660
472,252 4.34%, 01/25/2029, 1 mo. USD LIBOR +4.250%(6) 492,929
294,765 4.99%, 11/25/2024, 1 mo. USD LIBOR +4.900%(6) 304,762
315,894 5.99%, 10/25/2028, 1 mo. USD LIBOR +5.900%(6) 333,703
372,076 MetLife Securitization Trust 3.00%, 04/25/2055(5)(7) 380,155556,728 New Residential Mortgage Loan Trust
4.00%, 04/25/2057(5)(7) 595,953746,173 Seasoned Credit Risk Transfer Trust
3.50%, 10/25/2058 785,319
3,836,108
Total Asset & Commercial Mortgage-BackedSecurities(cost $50,972,869) $ 51,622,161
The accompanying notes are an integral part of these financial statements.
18

123106 TX 19STATE STREET GLOBAL HLS SEMI-ANNUAL REPO
27-Jul-2021 20:50 ESTCLN PSLNF
Donnelley Financial LSWpf_rendNone
5*PMT 1C
LSWP64RS2921.6.2.0
Hartford Balanced HLS FundSchedule of Investments – (continued)June 30, 2021 (Unaudited)
Shares or Principal Amount Market Value†
CORPORATE BONDS - 13.6%Aerospace/Defense - 0.5%
$ 850,000 BAE Systems Holdings, Inc. 3.85%, 12/15/2025(5) $ 939,109220,000 BAE Systems plc 3.40%, 04/15/2030(5) 239,360
Boeing Co.1,155,000 1.43%, 02/04/2024(1) 1,158,8412,040,000 2.20%, 02/04/2026 2,061,316
911,000 3.25%, 03/01/2028 956,597375,000 3.45%, 11/01/2028 399,737560,000 Lockheed Martin Corp. 4.85%, 09/15/2041 725,393
Raytheon Technologies Corp.685,000 3.95%, 08/16/2025 762,093
1,500,000 4.13%, 11/16/2028 1,727,300Teledyne Technologies, Inc.
1,255,000 2.25%, 04/01/2028 1,278,9201,005,000 2.75%, 04/01/2031 1,033,448
11,282,114
Agriculture - 0.3%Altria Group, Inc.
560,000 4.50%, 05/02/2043 602,425280,000 5.80%, 02/14/2039 346,157
3,985,000 BAT Capital Corp. 3.56%, 08/15/2027 4,269,5251,065,000 Imperial Brands Finance plc 3.75%, 07/21/2022(5) 1,092,749
6,310,856
Airlines - 0.1%1,485,783 Continental Airlines, Inc. 5.98%, 10/19/2023 1,519,320
749,909 Southwest Airlines Co. 6.15%, 02/01/2024 774,749131,886 United Airlines Class B Pass-Through Trust
4.60%, 09/01/2027 136,184
2,430,253
Auto Manufacturers - 0.3%General Motors Financial Co., Inc.
3,185,000 3.70%, 05/09/2023 3,343,4131,245,000 3.95%, 04/13/2024 1,340,7871,625,000 Hyundai Capital America 0.80%, 04/03/2023(5) 1,624,680
920,000 Volkswagen Group of America Finance LLC3.35%, 05/13/2025(5) 993,127
7,302,007
Beverages - 0.2%Anheuser-Busch Cos. LLC / Anheuser-Busch InBev
Worldwide, Inc.310,000 4.70%, 02/01/2036 381,028280,000 4.90%, 02/01/2046 353,367
Anheuser-Busch InBev Worldwide, Inc.480,000 4.00%, 04/13/2028 547,341220,000 4.38%, 04/15/2038 263,233430,000 4.50%, 06/01/2050 524,584535,000 4.60%, 04/15/2048 654,345580,000 4.60%, 06/01/2060 714,585275,000 Constellation Brands, Inc. 2.88%, 05/01/2030 288,676
3,727,159
Biotechnology - 0.1%1,480,000 Gilead Sciences, Inc. 2.80%, 10/01/2050 1,418,2821,445,000 Royalty Pharma plc 3.55%, 09/02/2050(5) 1,438,398
2,856,680
Commercial Banks - 4.1%Banco Santander S.A.
1,200,000 3.13%, 02/23/2023 1,249,900600,000 3.85%, 04/12/2023 634,201
Bank of America Corp.1,570,000 1.73%, 07/22/2027, (1.73% fixed rate until
07/22/2026; 3 mo. USD SOFR +0.960% thereafter)(8) 1,582,774
Shares or Principal Amount Market Value†
CORPORATE BONDS - 13.6% - (continued)Commercial Banks - 4.1% - (continued)
$ 825,000 3.31%, 04/22/2042, (3.31% fixed rate until04/22/2041; 3 mo. USD SOFR +1.580% thereafter)(8) $ 876,171
1,799,000 3.42%, 12/20/2028, (3.42% fixed rate until12/20/2027; 3 mo. USD LIBOR +1.040% thereafter)(8) 1,960,013
1,610,000 3.59%, 07/21/2028, (3.59% fixed rate until07/21/2027; 3 mo. USD LIBOR +1.370% thereafter)(8) 1,773,456
4,225,000 4.20%, 08/26/2024 4,632,311Barclays plc
2,410,000 2.67%, 03/10/2032, (2.67% fixed rate until03/10/2031; 12 mo. USD CMT +1.200% thereafter)(6)(8) 2,425,903
2,740,000 3.20%, 08/10/2021 2,748,4881,000,000 3.93%, 05/07/2025, (3.93% fixed rate until
05/07/2024; 3 mo. USD LIBOR +1.610% thereafter)(8) 1,079,582
1,320,000 4.34%, 01/10/2028 1,476,632BNP Paribas S.A.
830,000 2.82%, 11/19/2025, (2.82% fixed rate until11/19/2024; 3 mo. USD LIBOR +1.111% thereafter)(5)(8) 873,353
1,000,000 3.38%, 01/09/2025(5) 1,072,906BPCE S.A.
2,225,000 5.15%, 07/21/2024(5) 2,479,8463,625,000 5.70%, 10/22/2023(5) 4,012,5961,875,000 Capital One Financial Corp. 3.75%, 04/24/2024 2,025,7812,155,000 Commonwealth Bank of Australia
2.69%, 03/11/2031(5) 2,150,0031,350,000 Cooperatieve Rabobank UA 1.11%, 02/24/2027,
(1.11% fixed rate until 02/24/2026; 12 mo. USDCMT + 0.550% thereafter)(5)(6)(8) 1,331,626
Credit Agricole S.A.1,025,000 3.25%, 10/04/2024(5) 1,098,712
535,000 3.75%, 04/24/2023(5) 566,041790,000 4.38%, 03/17/2025(5) 868,725250,000 Credit Suisse AG 3.63%, 09/09/2024 271,669
Credit Suisse Group AG1,900,000 3.09%, 05/14/2032, (3.09% fixed rate until
05/14/2031; 3 mo. USD SOFR +1.730% thereafter)(5)(8) 1,952,709
530,000 3.57%, 01/09/2023(5) 538,3761,425,000 3.75%, 03/26/2025 1,546,227
Danske Bank A/S1,865,000 1.62%, 09/11/2026, (1.62% fixed rate until
09/11/2025; 12 mo. USD CMT +1.350% thereafter)(5)(6)(8) 1,867,470
775,000 3.88%, 09/12/2023(5) 824,606440,000 5.00%, 01/12/2022(5) 450,201575,000 5.38%, 01/12/2024(5) 637,632
Goldman Sachs Group, Inc.1,300,000 1.43%, 03/09/2027, (1.43% fixed rate until
03/09/2026; 3 mo. USD SOFR +0.798% thereafter)(8) 1,296,898
630,000 2.62%, 04/22/2032, (2.62% fixed rate until04/22/2031; 3 mo. USD SOFR +1.281% thereafter)(8) 644,338
510,000 3.80%, 03/15/2030 573,7531,150,000 6.25%, 02/01/2041 1,709,212
HSBC Holdings plc2,085,000 1.59%, 05/24/2027, (1.59% fixed rate until
05/24/2026; 3 mo. USD SOFR +1.290% thereafter)(8) 2,089,961
The accompanying notes are an integral part of these financial statements.
19

g
123106 TX 20STATE STREET GLOBAL HLS SEMI-ANNUAL REPO
27-Jul-2021 20:50 ESTCLN PSLNF
Donnelley Financial LSWpf_rendNone
5*PMT 1C
LSWP64RS2921.6.2.0
Hartford Balanced HLS FundSchedule of Investments – (continued)June 30, 2021 (Unaudited)
Shares or Principal Amount Market Value†
CORPORATE BONDS - 13.6% - (continued)Commercial Banks - 4.1% - (continued)
$ 2,030,000 2.80%, 05/24/2032, (2.80% fixed rate until05/24/2031; 3 mo. USD SOFRRATE +1.187% thereafter)(8) $ 2,088,265
2,625,000 3.60%, 05/25/2023 2,779,142JP Morgan Chase & Co.
620,000 2.52%, 04/22/2031, (2.52% fixed rate until04/22/2030; 3 mo. USD SOFR +2.040% thereafter)(8) 638,432
545,000 2.58%, 04/22/2032, (2.58% fixed rate until04/22/2031; 3 mo. USD SOFR +1.250% thereafter)(8) 560,445
390,000 3.11%, 04/22/2041, (3.11% fixed rate until04/22/2040; 3 mo. USD SOFR +2.460% thereafter)(8) 404,981
2,240,000 3.25%, 09/23/2022 2,320,595705,000 3.70%, 05/06/2030, (3.70% fixed rate until
05/06/2029; 3 mo. USD LIBOR +1.160% thereafter)(8) 787,999
805,000 4.45%, 12/05/2029, (4.45% fixed rate until12/05/2028; 3 mo. USD LIBOR +1.330% thereafter)(8) 942,150
Morgan Stanley1,450,000 3.13%, 07/27/2026 1,571,7541,000,000 3.70%, 10/23/2024 1,091,091
National Australia Bank Ltd.3,750,000 2.33%, 08/21/2030(5) 3,643,618
930,000 2.99%, 05/21/2031(5) 945,3124,905,000 NBK SPC Ltd. 2.75%, 05/30/2022(5) 4,991,7501,755,000 Santander Holdings USA, Inc. 3.40%, 01/18/2023 1,827,031
Standard Chartered plc1,130,000 0.99%, 01/12/2025, (0.99% fixed rate until
01/12/2024; 12 mo. USD CMT +0.780% thereafter)(5)(6)(8) 1,126,445
3,215,000 1.21%, 03/23/2025, (1.21% fixed rate until03/23/2024; 12 mo. USD CMT +0.880% thereafter)(5)(6)(8) 3,226,472
1,660,000 Truist Financial Corp. 3.20%, 09/03/2021 1,664,382UniCredit S.p.A.
1,485,000 1.98%, 06/03/2027, (1.98% fixed rate until06/03/2026; 12 mo. USD CMT +1.200% thereafter)(5)(6)(8) 1,480,111
1,360,000 3.13%, 06/03/2032, (3.13% fixed rate until06/03/2031; 12 mo. USD CMT +1.550% thereafter)(5)(6)(8) 1,364,558
4,344,000 Wells Fargo & Co. 4.48%, 01/16/2024 4,750,032
89,526,637
Commercial Services - 0.0%245,000 CommonSpirit Health 4.35%, 11/01/2042 285,646
Construction Materials - 0.1%972,000 Carrier Global Corp. 2.72%, 02/15/2030 1,008,707996,000 Johnson Controls International plc
4.95%, 07/02/2064(6) 1,356,436
2,365,143
Diversified Financial Services - 0.5%3,160,000 AerCap Ireland Capital DAC / AerCap Global
Aviation Trust 3.88%, 01/23/2028(1) 3,384,922Avolon Holdings Funding Ltd.
1,169,000 2.13%, 02/21/2026(5) 1,164,7852,100,000 2.75%, 02/21/2028(5) 2,079,596
765,000 BOC Aviation USA Corp. 1.63%, 04/29/2024(5) 771,0742,125,000 Intercontinental Exchange, Inc. 1.85%, 09/15/2032 2,022,0701,965,835 Postal Square L.P. 8.95%, 06/15/2022 2,077,503
11,499,950
Shares or Principal Amount Market Value†
CORPORATE BONDS - 13.6% - (continued)Electric - 1.2%Cleco Corporate Holdings LLC
$ 650,000 3.38%, 09/15/2029 $ 671,7211,030,000 3.74%, 05/01/2026 1,124,093
555,000 4.97%, 05/01/2046 663,9471,960,000 Cleveland Electric Illuminating Co.
3.50%, 04/01/2028(5) 2,096,216360,000 Dominion Energy South Carolina, Inc.
6.63%, 02/01/2032 501,6011,200,000 Duke Energy Carolinas LLC 6.10%, 06/01/2037 1,674,288
Duke Energy Corp.1,025,000 2.55%, 06/15/2031 1,035,135
680,000 3.50%, 06/15/2051 703,843245,000 Georgia Power Co. 4.75%, 09/01/2040 302,766
1,275,000 Indianapolis Power and Light Co.(AMBAC Insured)6.60%, 06/01/2037(5) 1,802,122
1,445,000 ITC Holdings Corp. 2.95%, 05/14/2030(5) 1,522,379691,000 Mid-Atlantic Interstate Transmission LLC
4.10%, 05/15/2028(5) 778,2501,290,000 NextEra Energy Capital Holdings, Inc.
1.90%, 06/15/2028 1,301,584Niagara Mohawk Power Corp.
370,000 3.03%, 06/27/2050(5) 360,719645,000 4.28%, 12/15/2028(5) 735,941945,000 Oglethorpe Power Corp. 5.25%, 09/01/2050 1,191,553165,000 PacifiCorp 4.13%, 01/15/2049 197,467241,000 Pennsylvania Electric Co. 3.60%, 06/01/2029(5) 257,717
San Diego Gas & Electric Co.2,715,000 1.70%, 10/01/2030 2,622,028
90,000 3.75%, 06/01/2047 102,78725,000 4.15%, 05/15/2048 30,318
SCE Recovery Funding LLC520,000 0.86%, 11/15/2031 508,156220,000 1.94%, 05/15/2038 213,263125,000 2.51%, 11/15/2043 119,223
Southern Co.1,050,000 2.95%, 07/01/2023 1,095,4233,300,000 3.75%, 09/15/2051, (3.75% fixed rate until
06/15/2026; 5 year USD CMT +2.915% thereafter)(6)(8) 3,325,740
350,000 Tucson Electric Power Co. 4.00%, 06/15/2050 408,884
25,347,164
Environmental Control - 0.1%1,480,000 Republic Services, Inc. 2.30%, 03/01/2030 1,504,345
Food - 0.1%Conagra Brands, Inc.
900,000 1.38%, 11/01/2027 878,774455,000 4.60%, 11/01/2025 518,878285,000 McCormick & Co., Inc. 2.50%, 04/15/2030 293,807480,000 Sigma Alimentos S.A. de C.V. 4.13%, 05/02/2026(5) 523,200
2,214,659
Gas - 0.1%330,000 Boston Gas Co. 3.15%, 08/01/2027(5) 353,969
1,870,000 KeySpan Gas East Corp. 2.74%, 08/15/2026(5) 1,961,511
2,315,480
Healthcare - Products - 0.2%2,725,000 Alcon Finance Corp. 3.00%, 09/23/2029(5) 2,870,717
Boston Scientific Corp.1,530,000 2.65%, 06/01/2030 1,584,148
135,000 4.00%, 03/01/2029 153,674
4,608,539
The accompanying notes are an integral part of these financial statements.
20

g p
123106 TX 21STATE STREET GLOBAL HLS SEMI-ANNUAL REPO
27-Jul-2021 20:50 ESTCLN PSLNF
Donnelley Financial LSWpf_rendNone
5*PMT 1C
LSWP64RS2921.6.2.0
Hartford Balanced HLS FundSchedule of Investments – (continued)June 30, 2021 (Unaudited)
Shares or Principal Amount Market Value†
CORPORATE BONDS - 13.6% - (continued)Healthcare - Services - 0.7%Anthem, Inc.
$ 1,510,000 2.25%, 05/15/2030 $ 1,524,5311,710,000 4.10%, 03/01/2028 1,955,880
475,000 Children’s Hospital 2.93%, 07/15/2050 472,065CommonSpirit Health
55,000 4.19%, 10/01/2049 63,266590,000 4.20%, 08/01/2023 631,691125,000 Cottage Health Obligated Group 3.30%, 11/01/2049 135,020
Dignity Health714,000 3.81%, 11/01/2024 776,263
1,353,000 4.50%, 11/01/2042 1,622,081425,000 HCA, Inc. 5.25%, 06/15/2049 545,675420,000 Memorial Sloan-Kettering Cancer Center
2.96%, 01/01/2050 426,771Mercy Health
1,400,000 3.56%, 08/01/2027 1,525,8271,210,000 4.30%, 07/01/2028 1,400,051
615,000 Sutter Health 2.29%, 08/15/2030 620,862Toledo Hospital (AGM Insured)
900,000 5.33%, 11/15/2028 1,063,250330,000 5.75%, 11/15/2038 402,007
UnitedHealth Group, Inc.355,000 2.00%, 05/15/2030 357,865125,000 2.90%, 05/15/2050 126,055
1,440,000 3.75%, 07/15/2025 1,598,374
15,247,534
Insurance - 0.7%American International Group, Inc.
750,000 3.40%, 06/30/2030 823,2982,150,000 4.25%, 03/15/2029 2,477,661
375,000 4.38%, 06/30/2050 456,2022,815,000 Athene Global Funding 2.50%, 03/24/2028(5) 2,887,768
840,000 Chubb INA Holdings, Inc. 3.35%, 05/15/2024 906,5241,200,000 Equitable Financial Life Global Funding
1.40%, 08/27/2027(5) 1,179,672200,000 Five Corners Funding Trust 4.42%, 11/15/2023(5) 218,020
Liberty Mutual Group, Inc.122,000 4.25%, 06/15/2023(5) 130,290428,000 4.57%, 02/01/2029(5) 500,408705,000 Marsh & McLennan Cos., Inc. 4.38%, 03/15/2029 827,093
1,000,000 MetLife, Inc. 3.60%, 04/10/2024 1,081,7791,775,000 Nationwide Mutual Insurance Co.
4.35%, 04/30/2050(5) 1,990,613132,000 Northwestern Mutual Life Insurance Co.
3.63%, 09/30/2059(5) 144,885870,000 Prudential plc 3.13%, 04/14/2030 941,775875,000 Unum Group 4.13%, 06/15/2051 883,459
15,449,447
Investment Company Security - 0.1%1,120,000 JAB Holdings B.V. 3.75%, 05/28/2051(5) 1,197,314
IT Services - 0.1%546,000 Apple, Inc. 3.25%, 02/23/2026 599,467
1,675,000 International Business Machines Corp.3.30%, 05/15/2026 1,842,713
2,442,180
Lodging - 0.1%2,003,000 Genting New York LLC 3.30%, 02/15/2026(5) 2,022,759
Machinery - Diversified - 0.0%Otis Worldwide Corp.
140,000 2.57%, 02/15/2030 145,138295,000 3.11%, 02/15/2040 305,179525,000 3.36%, 02/15/2050 551,390
1,001,707
Shares or Principal Amount Market Value†
CORPORATE BONDS - 13.6% - (continued)Media - 0.7%Charter Communications Operating LLC / Charter
Communications Operating Capital$ 2,525,000 2.30%, 02/01/2032 $ 2,429,320
85,000 3.70%, 04/01/2051 84,137243,000 4.80%, 03/01/2050 279,296187,000 5.13%, 07/01/2049 222,852
Comcast Corp.1,500,000 4.40%, 08/15/2035 1,808,328
585,000 4.60%, 10/15/2038 725,6322,000,000 Cox Communications, Inc. 4.80%, 02/01/2035(5) 2,427,165
Discovery Communications LLC460,000 3.63%, 05/15/2030 502,356935,000 3.95%, 03/20/2028 1,040,727583,000 4.00%, 09/15/2055 617,561410,000 4.13%, 05/15/2029 459,820752,000 4.65%, 05/15/2050 886,382
2,386,000 Sky Ltd. 3.75%, 09/16/2024(5) 2,608,027Time Warner Cable LLC
395,000 6.55%, 05/01/2037 538,461250,000 7.30%, 07/01/2038 365,371130,000 Time Warner Entertainment Co., L.P.
8.38%, 03/15/2023 146,885385,000 Walt Disney Co. 4.00%, 10/01/2023 415,072
15,557,392
Oil & Gas - 0.5%1,545,000 Aker BP ASA 4.00%, 01/15/2031(5) 1,694,7351,200,000 BG Energy Capital plc 4.00%, 10/15/2021(5) 1,212,453
Equinor ASA160,000 2.45%, 01/17/2023 165,02385,000 2.88%, 04/06/2025 90,864
2,470,000 3.00%, 04/06/2027 2,684,525125,000 3.25%, 11/10/2024 135,319
2,425,000 Hess Corp. 7.30%, 08/15/2031 3,291,276935,000 Qatar Petroleum Industry 0.01%, 07/12/2031 925,061780,000 Qatar Petroleum 3.13%, 07/12/2041 777,122615,000 Saudi Arabian Oil Co. 3.50%, 04/16/2029(5) 665,737
11,642,115
Pharmaceuticals - 0.4%AbbVie, Inc.
645,000 3.45%, 03/15/2022 655,771975,000 3.80%, 03/15/2025 1,066,834800,000 5.00%, 12/15/2021 807,605955,000 Bayer U.S. Finance LLC 3.38%, 10/08/2024(5) 1,025,918955,000 Cigna Corp. 4.38%, 10/15/2028 1,111,620289,000 CVS Health Corp. 4.30%, 03/25/2028 332,292
2,015,000 EMD Finance LLC 2.95%, 03/19/2022(5) 2,044,353650,000 Takeda Pharmaceutical Co., Ltd. 3.18%, 07/09/2050 657,456
7,701,849
Pipelines - 0.4%Energy Transfer Operating L.P.
180,000 4.95%, 06/15/2028 208,131945,000 5.35%, 05/15/2045 1,093,820872,000 7.60%, 02/01/2024 991,459
Enterprise Products Operating LLC100,000 3.70%, 01/31/2051 107,327145,000 3.95%, 01/31/2060 161,775
3,085,000 Galaxy Pipeline Assets Bidco Ltd.2.16%, 03/31/2034(5) 3,027,307
Gray Oak Pipeline LLC606,000 2.60%, 10/15/2025(5) 622,651100,000 3.45%, 10/15/2027(5) 105,127425,000 TransCanada PipeLines Ltd. 4.10%, 04/15/2030 488,872
The accompanying notes are an integral part of these financial statements.
21

p
123106 TX 22STATE STREET GLOBAL HLS SEMI-ANNUAL REPO
27-Jul-2021 20:50 ESTCLN PSLNF
Donnelley Financial LSWpf_rendNone
6*PMT 1C
LSWP64RS2921.6.2.0
Hartford Balanced HLS FundSchedule of Investments – (continued)June 30, 2021 (Unaudited)
Shares or Principal Amount Market Value†
CORPORATE BONDS - 13.6% - (continued)Pipelines - 0.4% - (continued)
$ 2,470,000 Western Midstream Operating L.P.4.00%, 07/01/2022 $ 2,510,138
9,316,607
Real Estate Investment Trusts - 0.3%American Tower Corp.
375,000 4.40%, 02/15/2026 423,542400,000 5.00%, 02/15/2024 443,622
1,235,000 Brixmor Operating Partnership L.P.2.25%, 04/01/2028 1,234,600
985,000 Equinix, Inc. 3.00%, 07/15/2050 943,989SBA Tower Trust
545,000 1.63%, 11/15/2026(5) 545,220300,000 1.88%, 07/15/2050(5) 303,859470,000 2.84%, 01/15/2050(5) 493,192225,000 3.45%, 03/15/2048(5) 229,296
1,171,000 Scentre Group Trust 1 / Scentre Group Trust 23.63%, 01/28/2026(5) 1,280,442
5,897,762
Retail - 0.1%1,000,000 AutoZone, Inc. 3.25%, 04/15/2025 1,075,228
685,000 CVS Health Corp. 4.88%, 07/20/2035 835,382
1,910,610
Semiconductors - 0.2%375,000 Broadcom Corp. / Broadcom Cayman Finance Ltd.
3.88%, 01/15/2027 414,305Broadcom, Inc.
510,000 3.50%, 02/15/2041(5) 523,376160,000 4.15%, 11/15/2030 179,613
2,275,000 Microchip Technology, Inc. 0.97%, 02/15/2024(5) 2,273,327
3,390,621
Software - 0.2%Oracle Corp.
1,565,000 3.60%, 04/01/2050 1,610,575730,000 3.65%, 03/25/2041 774,669315,000 3.85%, 04/01/2060 334,745
1,030,000 3.95%, 03/25/2051 1,127,439
3,847,428
Telecommunications - 0.8%AT&T, Inc.
1,930,000 3.10%, 02/01/2043 1,893,039835,000 3.50%, 09/15/2053(5) 839,601
2,185,000 4.45%, 04/01/2024 2,386,053450,000 Deutsche Telekom International Finance B.V.
3.60%, 01/19/2027(5) 495,180576,000 Orange S.A. 9.00%, 03/01/2031 906,803
2,287,500 Sprint Spectrum Co. LLC / Sprint Spectrum Co. IILLC / Sprint Spectrum Co. III LLC4.74%, 03/20/2025(5) 2,454,167
T-Mobile USA, Inc.1,865,000 2.05%, 02/15/2028 1,891,576
765,000 3.30%, 02/15/2051 763,73875,000 3.60%, 11/15/2060 76,358
845,000 4.38%, 04/15/2040 987,475180,000 4.50%, 04/15/2050 214,332
Verizon Communications, Inc.950,000 2.99%, 10/30/2056 893,867781,000 4.52%, 09/15/2048 966,858222,000 4.67%, 03/15/2055 285,454715,000 4.75%, 11/01/2041 902,087283,000 4.81%, 03/15/2039 358,766
16,315,354
Shares or Principal Amount Market Value†
CORPORATE BONDS - 13.6% - (continued)Transportation - 0.2%Penske Truck Leasing Co. L.P. / PTL Finance Corp.
$ 155,000 2.70%, 11/01/2024(5) $ 163,0161,100,000 3.38%, 02/01/2022(5) 1,113,4422,850,000 3.95%, 03/10/2025(5) 3,116,885
465,000 Union Pacific Corp. 3.75%, 02/05/2070 513,078
4,906,421
Trucking & Leasing - 0.2%751,000 Avolon Holdings Funding Ltd. 4.38%, 05/01/2026(5) 816,784
2,185,000 DAE Funding LLC 1.55%, 08/01/2024(5) 2,180,5641,904,000 Park Aerospace Holdings Ltd. 5.50%, 02/15/2024(5) 2,093,208
5,090,556
Total Corporate Bonds(cost $281,755,651) $ 296,514,288
FOREIGN GOVERNMENT OBLIGATIONS - 0.3%Chile - 0.0%
$ 200,000 Chile Government International Bond3.50%, 04/15/2053 $ 209,888
Mexico - 0.1%1,945,000 Mexico Government International Bond
4.28%, 08/14/2041 2,042,464
Panama - 0.1%1,360,000 Panama Government International Bond
2.25%, 09/29/2032 1,304,933
Qatar - 0.1%1,680,000 Qatar Government International Bond
3.88%, 04/23/2023(5) 1,783,327
Saudi Arabia - 0.0%800,000 Saudi Government International Bond
2.88%, 03/04/2023(5) 829,760
Total Foreign Government Obligations(cost $5,976,357) $ 6,170,372
MUNICIPAL BONDS - 0.6%Airport - 0.0%
$ 190,000 Broward County, FL, Airport System Rev3.48%, 10/01/2043 $ 198,531
General - 0.3%Chicago, IL, Transit Auth
70,000 6.30%, 12/01/2021 71,6401,000,000 6.90%, 12/01/2040 1,422,214
365,000 City of Sacramento, CA (AGM Insured)6.42%, 08/01/2023 408,419
375,000 Metropolitan Transportation Auth, NY, Rev6.67%, 11/15/2039 545,772
750,000 New York State Urban Dev Corp. Rev2.10%, 03/15/2022 759,589
1,250,000 Philadelphia, PA, Auth Industrial Dev(NATL Insured) 6.55%, 10/15/2028 1,624,598
1,335,000 Sales Tax Securitization Corp., IL4.79%, 01/01/2048 1,700,715
6,532,947
General Obligation - 0.1%1,180,000 State of Illinois, GO 5.10%, 06/01/2033(1) 1,387,494
Higher Education - 0.0%225,000 University of California 1.32%, 05/15/2027 225,688
Power - 0.0%402,000 New York Utility Debt Securitization Auth
3.44%, 12/15/2025 416,609
The accompanying notes are an integral part of these financial statements.
22

123106 TX 23STATE STREET GLOBAL HLS SEMI-ANNUAL REPO
27-Jul-2021 20:50 ESTCLN PSLNF
Donnelley Financial LSWpf_rendNone
6*PMT 1C
LSWP64RS2921.6.2.0
Hartford Balanced HLS FundSchedule of Investments – (continued)June 30, 2021 (Unaudited)
Shares or Principal Amount Market Value†
MUNICIPAL BONDS - 0.6% - (continued)Transportation - 0.1%Foothill-Eastern Transportation Corridor Agency,
CA, (AGM Insured)$ 705,000 3.92%, 01/15/2053 $ 745,985
95,000 4.09%, 01/15/2049 100,570875,000 Illinois State Toll Highway Auth, Taxable Rev
6.18%, 01/01/2034 1,217,406Metropolitan Transportation Auth, NY, Rev
475,000 5.18%, 11/15/2049 641,23435,000 6.20%, 11/15/2026 40,405
710,000 New York and New Jersey Port Auth, Taxable Rev3.18%, 07/15/2060 713,209
3,458,809
Utility - Electric - 0.1%785,000 Illinois Municipal Electric Agency 6.83%, 02/01/2035 1,032,219732,000 Municipal Electric Auth, GA 6.64%, 04/01/2057 1,109,184
2,141,403
Total Municipal Bonds(cost $12,385,485) $ 14,361,481
U.S. GOVERNMENT AGENCIES - 0.4%Mortgage-Backed Agencies - 0.4%FHLMC - 0.2%
$ 607,908 0.67%, 01/25/2051, SOFR + 0.650%(5)(6) $ 607,908805,000 0.82%, 08/25/2033, SOFR + 0.800%(5)(6) 807,426
8,239 2.40%, 04/01/2029, 12 mo. USD CMT +2.246%(6) 8,315
1,280,000 2.59%, 03/25/2030, 1 mo. USD LIBOR +2.500%(6) 1,308,497
17,677 4.00%, 03/01/2041 19,448469,502 5.09%, 12/25/2028, 1 mo. USD LIBOR +
5.000%(6) 490,692
3,242,286
FNMA - 0.1%128,799 0.50%, 10/25/2024, 1 mo. USD LIBOR +
0.400%(6) 128,7751,106,277 3.00%, 03/25/2053 1,153,341
325,000 3.07%, 02/01/2025 349,34816,121 4.50%, 11/01/2023 17,30870,269 4.50%, 03/01/2038 77,85333,669 4.50%, 11/01/2039 37,17621,806 4.50%, 04/01/2040 24,34455,169 4.50%, 08/01/2040 61,35119,557 4.50%, 02/01/2041 21,586
302,540 4.50%, 04/01/2041 337,385179,193 4.50%, 06/01/2041 197,834272,679 4.50%, 07/01/2041 304,42074,513 4.50%, 09/01/2041 83,16256,988 4.50%, 07/01/2044 61,572
2,855,455
GNMA - 0.1%48,933 5.00%, 07/15/2037 56,3233,644 6.00%, 06/15/2024 4,0753,214 6.00%, 07/15/2026 3,5961,007 6.00%, 03/15/2028 1,129
24,095 6.00%, 04/15/2028 27,05548,449 6.00%, 05/15/2028 54,27414,839 6.00%, 06/15/2028 16,63126,240 6.00%, 07/15/2028 29,3945,439 6.00%, 08/15/2028 6,091
34,425 6.00%, 09/15/2028 38,57467,168 6.00%, 10/15/2028 75,24749,281 6.00%, 11/15/2028 55,21863,056 6.00%, 12/15/2028 70,6791,181 6.00%, 12/15/2031 1,350
Shares or Principal Amount Market Value†
U.S. GOVERNMENT AGENCIES - 0.4% - (continued)Mortgage-Backed Agencies - 0.4% - (continued)GNMA - 0.1% - (continued)
$ 16,095 6.00%, 09/15/2032 $ 19,0724,815 6.00%, 11/15/2032 5,5071,738 6.00%, 04/15/2033 1,948
61,362 6.00%, 06/15/2033 70,25020,789 6.00%, 10/15/2033 24,7422,355 6.00%, 11/15/2033 2,783
45,905 6.00%, 10/15/2034 52,43652,271 6.00%, 01/15/2035 58,7656,367 6.00%, 05/15/2035 7,1417,022 6.00%, 06/15/2035 7,885
169 6.50%, 03/15/2026 1882,496 6.50%, 01/15/2028 2,784
25,941 6.50%, 03/15/2028 28,93258,126 6.50%, 04/15/2028 64,82517,575 6.50%, 05/15/2028 19,59992,376 6.50%, 06/15/2028 103,0225,389 6.50%, 10/15/2028 6,0091,617 6.50%, 02/15/2035 1,8607,607 7.00%, 11/15/2031 8,4563,895 7.00%, 03/15/2032 4,334
706,110 7.00%, 11/15/2032 839,48185,662 7.00%, 01/15/2033 99,58897,495 7.00%, 05/15/2033 113,05215,431 7.00%, 07/15/2033 17,685
112,346 7.00%, 11/15/2033 130,64443,703 7.50%, 09/16/2035 49,720
85 8.00%, 09/15/2026 9233 8.00%, 11/15/2026 33
4,623 8.00%, 12/15/2026 5,17483 8.00%, 09/15/2027 85
3,130 8.00%, 07/15/2029 3,5857,629 8.00%, 12/15/2029 7,8953,459 8.00%, 01/15/2030 3,5692,529 8.00%, 02/15/2030 2,548
712 8.00%, 03/15/2030 7197,968 8.00%, 04/15/2030 8,0033,826 8.00%, 05/15/2030 3,989
29,333 8.00%, 06/15/2030 30,6341,697 8.00%, 07/15/2030 1,744
52,357 8.00%, 08/15/2030 53,82813,227 8.00%, 09/15/2030 13,6435,532 8.00%, 11/15/2030 5,557
82,149 8.00%, 12/15/2030 91,702
2,413,144
Total U.S. Government Agencies(cost $8,137,969) $ 8,510,885
U.S. GOVERNMENT SECURITIES - 12.6%U.S. Treasury Securities - 12.6%U.S. Treasury Bonds - 4.9%
$ 72,700 1.25%, 05/15/2050 $ 59,4011,765,000 1.38%, 08/15/2050 1,488,9434,545,000 1.63%, 11/15/2050 4,084,109
15,170,000 1.88%, 02/15/2051 14,492,0918,895,000 2.25%, 05/15/2041 9,264,6983,065,000 2.38%, 05/15/2051 3,275,240
19,250,000 2.50%, 02/15/2045(9) 20,841,8855,929,000 2.75%, 11/15/2047 6,752,3448,040,800 2.88%, 05/15/2043 9,253,516
200,000 3.00%, 08/15/2048 238,9147,895,000 3.13%, 08/15/2044 9,481,0934,630,000 3.38%, 05/15/2044 5,776,829
15,955,000 4.38%, 02/15/2038 21,978,012
106,987,075
The accompanying notes are an integral part of these financial statements.
23

pp
123106 TX 24STATE STREET GLOBAL HLS SEMI-ANNUAL REPO
27-Jul-2021 20:50 ESTCLN PSLNF
Donnelley Financial LSWpf_rendNone
8*PMT 1C
LSWP64RS2921.6.2.0
Hartford Balanced HLS FundSchedule of Investments – (continued)June 30, 2021 (Unaudited)
Shares or Principal Amount Market Value†
U.S. GOVERNMENT SECURITIES - 12.6% - (continued)U.S. Treasury Securities - 12.6% - (continued)U.S. Treasury Notes - 7.7%
$ 10,700,000 0.13%, 03/31/2023 $ 10,682,8632,855,000 0.13%, 05/15/2023 2,849,5354,000,000 0.13%, 05/31/2023 3,991,2507,700,000 0.13%, 06/30/2023 7,680,7502,385,000 0.13%, 02/15/2024 2,369,5353,415,000 0.25%, 05/15/2024 3,396,591
18,965,000 0.25%, 05/31/2025 18,652,37417,385,000 0.25%, 07/31/2025 17,062,4278,770,000 0.25%, 08/31/2025 8,596,313
14,815,000 0.25%, 09/30/2025 14,507,7048,325,000 0.38%, 11/30/2025 8,178,3376,815,000 0.38%, 12/31/2025 6,688,5509,055,000 0.38%, 01/31/2026 8,877,0834,300,000 0.50%, 02/28/2026 4,236,6766,355,000 0.75%, 03/31/2026 6,329,4319,565,000 0.75%, 04/30/2026 9,521,6588,590,000 0.75%, 05/31/2026 8,545,0375,300,000 0.88%, 06/30/2026 5,300,0002,450,000 1.13%, 02/28/2025 2,495,3632,490,000 1.13%, 02/15/2031 2,419,5803,425,000 1.25%, 03/31/2028 3,441,055
380,000 1.25%, 05/31/2028 381,2471,675,000 1.63%, 10/31/2026 1,735,6532,265,000 1.63%, 05/15/2031 2,302,5147,555,000 2.13%, 03/31/2024 7,909,436
168,150,962
Total U.S. Government Securities(cost $260,760,928) $ 275,138,037
Total Long-Term Investments(cost $1,499,298,860) $ 2,133,873,484
SHORT-TERM INVESTMENTS - 3.8%Repurchase Agreements - 2.1%
44,904,021 Fixed Income Clearing Corp. RepurchaseAgreement dated 06/30/2021 at 0.020%, due on07/01/2021 with a maturity value of $44,904,046;collateralized by U.S. Treasury GovernmentBond at 4.375%, maturing 11/15/2030, with amarket value of $45,802,187 $ 44,904,021
Securities Lending Collateral - 1.7%5,667,539 Fidelity Investments Money Market Funds,
Government Portfolio, Institutional Class,0.01%(10) 5,667,539
29,388,359 Goldman Sachs Financial Square Funds,Government Fund, Institutional Class, 0.03%(10) 29,388,359
1,492,232 Invesco Government & Agency Portfolio,Institutional Class, 0.03%(10) 1,492,232
36,548,130
Total Short-Term Investments(cost $81,452,151) $ 81,452,151
Total Investments(cost $1,580,751,011) 101.6% $ 2,215,325,635
Other Assets and Liabilities (1.6)% (33,873,462)
Total Net Assets 100.0% $ 2,181,452,173
Note: Percentage of investments as shown is the ratio of the total market value to totalnet assets.
Prices of foreign equities that are principally traded on certain foreign markets willgenerally be adjusted daily pursuant to a fair value pricing service approved bythe Board of Directors in order to reflect an adjustment for factors occurring afterthe close of certain foreign markets but before the close of the New YorkStock Exchange.
The Fund may refer to any one or more of the industry classifications used by oneor more widely recognized market indices, ratings group and/or as defined byFund management. Industry classifications may not be identical across allsecurity types.
Equity industry classifications used in this report are the Global IndustryClassification Standard, which was developed by and is the exclusive propertyand service mark of MSCI, Inc. and Standard & Poor’s.
For Fund compliance purposes, the Fund may not use the same classificationsystem. These classifications are used for financial reporting purposes.
See “Glossary” for abbreviation descriptions.
* Non-income producing.
(1) Represents entire or partial securities on loan. See Note 8 in the accompanying Notesto Financial Statements for securities lending information.
(2) This security is valued in good faith at fair value as determined under policies andprocedures established by and under the supervision of the Board of Directors. AtJune 30, 2021, the aggregate fair value of this security was $13,223,486, whichrepresented 0.6% of total net assets. This amount excludes securities that areprincipally traded in certain foreign markets and whose prices are adjusted pursuantto a third party pricing service methodology approved by the Board of Directors.
(3) Investment in securities not registered under the Securities Act of 1933 (excludingsecurities acquired pursuant to Rule 144A and Regulation S). At the end of theperiod, the value of such restricted securities amounted to $13,223,486 or 0.6% ofnet assets.
PeriodAcquired Security Name
Shares/Par Value Total Cost Market Value
08/2011 Allstar Co. 11,702,200 $ — $ 13,223,486
(4) Affiliated company – The Fund owns greater than 5% of the outstanding votingsecurities of this issuer.
(5) Security was purchased pursuant to Rule 144A under the Securities Act of 1933 andmay be sold in transactions that are exempt from registration (typically only toqualified institutional buyers) or in a public offering registered under the Securities Actof 1933. At June 30, 2021, the aggregate value of these securities was $156,630,354,representing 7.2% of net assets.
(6) Variable rate securities; the rate reported is the coupon rate in effect at June 30,2021. Base lending rates may be subject to a floor or cap.
(7) Variable or floating rate security, which interest rate adjusts periodically based onchanges in current interest rates and prepayments on the underlying pool of assets.Rate shown is the rate in effect as of period end.
(8) Fixed to variable rate investment. The rate shown reflects the fixed rate in effect atJune 30, 2021. Rate will reset at a future date. Base lending rates may be subject to afloor or cap.
(9) All, or a portion of the security, was pledged as collateral in connection with futurescontracts. As of June 30, 2021, the market value of securities pledged was $276,087.
(10) Current yield as of period end.
The accompanying notes are an integral part of these financial statements.
24

p
123106 TX 25STATE STREET GLOBAL HLS SEMI-ANNUAL REPO
27-Jul-2021 20:50 ESTCLN PSLNF
Donnelley Financial LSWpf_rendNone
6*PMT 1C
LSWP64RS2921.6.2.0
Hartford Balanced HLS FundSchedule of Investments – (continued)June 30, 2021 (Unaudited)
Futures Contracts Outstanding at June 30, 2021
DescriptionNumber ofContracts
ExpirationDate
CurrentNotionalAmount
Value andUnrealized
Appreciation/(Depreciation)
Short position contracts:U.S. Treasury 10-Year Ultra Future 63 09/21/2021 $ 9,273,797 $ (40,240)
Total futures contracts $ (40,240)
† See Significant Accounting Policies of accompanying Notes to Financial Statements regarding valuation of investments.
Fair Value SummaryThe following is a summary of the fair valuations according to the inputs used as of June 30, 2021 in valuing the Fund’s investments.
Description Total Level 1 Level 2 Level 3(1)
AssetsCommon Stocks
Automobiles & Components $ 17,001,708 $ 17,001,708 $ — $ —Banks 80,325,083 80,325,083 — —Capital Goods 140,323,333 140,323,333 — —Commercial & Professional Services 22,886,090 22,886,090 — —Consumer Durables & Apparel 21,648,266 21,648,266 — —Consumer Services 17,541,918 17,541,918 — —Diversified Financials 34,985,780 34,985,780 — —Energy 19,494,437 19,494,437 — —Food, Beverage & Tobacco 36,516,384 36,516,384 — —Health Care Equipment & Services 149,399,766 149,399,766 — —Insurance 78,072,696 78,072,696 — —Materials 79,751,565 79,751,565 — —Media & Entertainment 189,789,474 189,789,474 — —Pharmaceuticals, Biotechnology & Life Sciences 130,159,156 111,123,947 19,035,209 —Real Estate 18,616,691 18,616,691 — —Retailing 60,743,301 47,519,815 13,223,486 —Semiconductors & Semiconductor Equipment 69,382,289 69,382,289 — —Software & Services 209,609,319 209,609,319 — —Technology Hardware & Equipment 72,696,031 72,696,031 — —Transportation 17,040,135 17,040,135 — —Utilities 15,572,838 15,572,838 — —
Asset & Commercial Mortgage-Backed Securities 51,622,161 — 51,622,161 —Corporate Bonds 296,514,288 — 296,514,288 —Foreign Government Obligations 6,170,372 — 6,170,372 —Municipal Bonds 14,361,481 — 14,361,481 —U.S. Government Agencies 8,510,885 — 8,510,885 —U.S. Government Securities 275,138,037 — 275,138,037 —Short-Term Investments 81,452,151 36,548,130 44,904,021 —
Total $ 2,215,325,635 $ 1,485,845,695 $ 729,479,940 $ —
LiabilitiesFutures Contracts(2) $ (40,240) $ (40,240) $ — $ —
Total $ (40,240) $ (40,240) $ — $ —
(1) For the six-month period ended June 30, 2021, there were no transfers in and out of Level 3.
(2) Derivative instruments (excluding purchased and written options, if applicable) are valued at the unrealized appreciation/(depreciation) on the investments.
The accompanying notes are an integral part of these financial statements.
25

p
123106 TX 26STATE STREET GLOBAL HLS SEMI-ANNUAL REPO
27-Jul-2021 20:50 ESTCLN PSLNF
Donnelley Financial LSWpf_rendSTART PAGE
6*PMT 1C
LSWP64RS2921.6.2.0
Hartford Capital Appreciation HLS FundSchedule of InvestmentsJune 30, 2021 (Unaudited)
Shares or Principal Amount Market Value†
COMMON STOCKS - 96.9%Automobiles & Components - 0.6%
22,290 Ferrari N.V. $ 4,601,685181,556 General Motors Co.* 10,742,669110,384 Thor Industries, Inc. 12,473,392
27,817,746
Banks - 1.8%925,244 Bank of America Corp. 38,147,810700,784 Commerzbank AG* 4,976,741100,367 JP Morgan Chase & Co. 15,611,08324,759 M&T Bank Corp. 3,597,730
721,800 Mitsubishi UFJ Financial Group, Inc. 3,887,800329,552 Zions Bancorp NA 17,420,119
83,641,283
Capital Goods - 5.8%9,272 3M Co. 1,841,697
37,486 AerCap Holdings N.V.* 1,919,65875,377 Airbus SE* 9,712,53561,883 Carlisle Cos., Inc. 11,843,16918,567 Dover Corp. 2,796,190
236,114 Emerson Electric Co. 22,723,611151,626 General Dynamics Corp. 28,545,111350,600 HF Global, Inc.*(1)(2)(3) 7,099,650194,740 Johnson Controls International plc 13,365,00672,438 Lockheed Martin Corp. 27,406,91761,731 Middleby Corp.* 10,695,513
117,371 Northrop Grumman Corp. 42,656,143314,793 Raytheon Technologies Corp. 26,854,99110,315 Roper Technologies, Inc. 4,850,11323,097 Safran S.A. 3,205,469
349,930 Sanwa Holdings Corp. 4,303,72828,183 Siemens AG 4,474,860
513,081 Westinghouse Air Brake Technologies Corp. 42,226,566
266,520,927
Commercial & Professional Services - 1.9%44,372 Booz Allen Hamilton Holding Corp. 3,779,607
290,415 Copart, Inc.* 38,285,409181,450 CoStar Group, Inc.* 15,027,689287,062 Leidos Holdings, Inc. 29,021,96868,610 Recruit Holdings Co., Ltd. 3,364,550
89,479,223
Consumer Durables & Apparel - 3.6%221,335 Carter’s, Inc. 22,835,132149,440 Garmin Ltd. 21,615,002139,567 Lennar Corp. Class A 13,865,98182,792 Lululemon Athletica, Inc.* 30,216,596
249,191 NIKE, Inc. Class B 38,497,5184,164 NVR, Inc.* 20,708,821
74,493 Polaris, Inc. 10,202,56149,200 Sony Corp. 4,770,787
110,271 Steven Madden Ltd. 4,825,459
167,537,857
Consumer Services - 5.3%317,064 Airbnb, Inc. Class A*(4) 48,555,18111,377 Booking Holdings, Inc.* 24,893,900
134,698 Chegg, Inc.* 11,194,75113,227 Chipotle Mexican Grill, Inc.* 20,506,347
763,419 Compass Group plc* 16,083,643381,162 DraftKings, Inc. Class A* 19,885,222187,545 Las Vegas Sands Corp.* 9,881,746166,713 McDonald’s Corp. 38,509,036317,325 Penn National Gaming, Inc.* 24,272,189142,056 Starbucks Corp. 15,883,281
Shares or Principal Amount Market Value†
COMMON STOCKS - 96.9% - (continued)Consumer Services - 5.3% - (continued)
113,809 Yum! Brands, Inc. $ 13,091,449
242,756,745
Diversified Financials - 4.6%244,467 American Express Co. 40,393,282426,656 Bank of New York Mellon Corp. 21,857,58725,679 BlackRock, Inc. 22,468,355
380,945 Charles Schwab Corp. 27,736,60521,093 Coinbase Global, Inc. Class A* 5,342,857
256,757 Equitable Holdings, Inc. 7,818,251168,126 Intermediate Capital Group plc 4,945,114214,272 Raymond James Financial, Inc. 27,833,93353,472 S&P Global, Inc. 21,947,582
184,843 Tradeweb Markets, Inc. Class A 15,630,324159,716 Voya Financial, Inc. 9,822,53489,831 XP, Inc. Class A* 3,912,140
209,708,564
Energy - 1.5%342,519 Baker Hughes a GE Co. 7,833,409582,408 Canadian Natural Resources Ltd. 21,129,762105,212 ConocoPhillips 6,407,41176,353 Diamondback Energy, Inc. 7,168,783
136,406 Equinor ASA 2,887,511264,980 Halliburton Co. 6,126,338164,650 Occidental Petroleum Corp. 5,148,60545,690 Phillips 66 3,921,116
326,495 Schlumberger Ltd. 10,451,105
71,074,040
Food & Staples Retailing - 0.1%72,004 Sysco Corp. 5,598,311
Food, Beverage & Tobacco - 5.4%652,470 Altria Group, Inc. 31,109,770598,527 Coca-Cola Co. 32,386,29675,479 Constellation Brands, Inc. Class A 17,653,783
945,823 Diageo plc 45,331,862156,448 General Mills, Inc. 9,532,377614,510 Keurig Dr Pepper, Inc. 21,655,333120,071 Mondelez International, Inc. Class A 7,497,233268,967 PepsiCo., Inc. 39,852,840290,967 Philip Morris International, Inc. 28,837,739204,415 Tyson Foods, Inc. Class A 15,077,650
248,934,883
Health Care Equipment & Services - 8.5%39,481 ABIOMED, Inc.* 12,322,41545,001 Align Technology, Inc.* 27,495,611
301,323 Baxter International, Inc. 24,256,502327,127 Boston Scientific Corp.* 13,987,95124,948 Cardinal Health, Inc. 1,424,281
279,054 Centene Corp.* 20,351,408223,602 CVS Health Corp. 18,657,35194,771 Danaher Corp. 25,432,74659,252 DexCom, Inc.* 25,300,604
273,236 GoodRx Holdings, Inc. Class A*(5) 9,839,22893,958 Insulet Corp.* 25,792,4113,721 Intuitive Surgical, Inc.* 3,421,980
64,855 McKesson Corp. 12,402,870466,946 Medtronic plc 57,962,007
1,082,910 Multiplan Corp.*(5) 10,309,303180,188 Oak Street Health, Inc.* 10,553,61162,002 Quest Diagnostics, Inc. 8,182,40456,388 Teleflex, Inc. 22,656,135
115,493 UnitedHealth Group, Inc. 46,248,017
The accompanying notes are an integral part of these financial statements.
26

123106 TX 27STATE STREET GLOBAL HLS SEMI-ANNUAL REPO
27-Jul-2021 20:50 ESTCLN PSLNF
Donnelley Financial LSWpf_rendNone
5*PMT 1C
LSWP64RS2921.6.2.0
Hartford Capital Appreciation HLS FundSchedule of Investments – (continued)June 30, 2021 (Unaudited)
Shares or Principal Amount Market Value†
COMMON STOCKS - 96.9% - (continued)Health Care Equipment & Services - 8.5% - (continued)
48,615 Veeva Systems, Inc. Class A* $ 15,116,834
391,713,669
Household & Personal Products - 1.8%555,804 Colgate-Palmolive Co. 45,214,65585,750 Honest Co., Inc.*(2)(3) 1,341,47348,373 Kimberly-Clark Corp. 6,471,340
207,304 Procter & Gamble Co. 27,971,529
80,998,997
Insurance - 4.6%746,932 Aflac, Inc. 40,080,371281,029 Athene Holding Ltd. Class A* 18,969,457359,379 Chubb Ltd. 57,119,698457,746 CNO Financial Group, Inc. 10,811,961315,293 Marsh & McLennan Cos., Inc. 44,355,419397,128 MetLife, Inc. 23,768,11172,900 Travelers Cos., Inc. 10,913,859
194,927 Unum Group 5,535,927
211,554,803
Materials - 2.7%98,201 Celanese Corp. 14,887,272
140,423 CRH plc 7,129,148120,774 Ecolab, Inc. 24,875,821283,448 FMC Corp. 30,669,07394,589 Linde plc 27,345,680
102,629 Reliance Steel & Aluminum Co. 15,486,71646,299 Rio Tinto plc 3,823,716
124,217,426
Media & Entertainment - 7.3%184,469 Activision Blizzard, Inc. 17,605,72134,946 Alphabet, Inc. Class A* 85,330,7935,422 Cable One, Inc. 10,371,256
21,752 Charter Communications, Inc. Class A* 15,692,98059,669 Electronic Arts, Inc. 8,582,19287,195 Facebook, Inc. Class A* 30,318,574
116,643 Match Group, Inc.* 18,808,6843,400 Netflix, Inc.* 1,795,914
372,653 Omnicom Group, Inc. 29,808,514295,257 Pinterest, Inc. Class A* 23,310,54047,269 Roku, Inc.* 21,708,288
468,000 Snap, Inc. Class A* 31,889,52082,569 Spotify Technology S.A.* 22,755,191
182,999 Twitter, Inc.* 12,592,161403,144 Zynga, Inc. Class A* 4,285,421
334,855,749
Pharmaceuticals, Biotechnology & Life Sciences - 5.6%177,061 Allakos, Inc.* 15,115,698
8,938 Argenx SE ADR* 2,690,964220,650 AstraZeneca plc ADR(5) 13,216,93520,821 Biogen, Inc.* 7,209,688
276,889 Elanco Animal Health, Inc.* 9,605,27969,444 Eli Lilly & Co. 15,938,78768,449 Exact Sciences Corp.* 8,508,8953,404 Hutchmed China Ltd.* 26,436
41,595 Illumina, Inc.* 19,683,170258,166 Johnson & Johnson 42,530,267174,221 Kodiak Sciences, Inc.* 16,202,553304,856 Organon & Co.* 9,224,942496,353 Pfizer, Inc. 19,437,183345,349 PTC Therapeutics, Inc.* 14,597,90233,918 Regeneron Pharmaceuticals, Inc.* 18,944,560
108,252 Seagen, Inc.* 17,090,826
Shares or Principal Amount Market Value†
COMMON STOCKS - 96.9% - (continued)Pharmaceuticals, Biotechnology & Life Sciences - 5.6% -
(continued)145,106 Vertex Pharmaceuticals, Inc.* $ 29,257,723
259,281,808
Real Estate - 4.1%78,824 Alexandria Real Estate Equities, Inc. REIT 14,341,239
139,402 American Tower Corp. REIT 37,658,056430,652 Americold Realty Trust REIT 16,300,17872,478 Camden Property Trust REIT 9,615,65652,793 Crown Castle International Corp. REIT 10,299,91448,547 Digital Realty Trust, Inc. REIT 7,304,38214,232 Equinix, Inc. REIT 11,422,60337,119 Prologis, Inc. REIT 4,436,83461,195 Public Storage REIT 18,400,725
195,767 Redfin Corp.* 12,413,585654,972 STORE Capital Corp. REIT 22,603,084710,550 VICI Properties, Inc. REIT 22,041,261
186,837,517
Retailing - 7.3%62,388 Alibaba Group Holding Ltd. ADR* 14,148,351
8,451,700 Allstar Co.(2)(3)(6) 9,550,42128,440 Amazon.com, Inc.* 97,838,1507,828 AutoZone, Inc.* 11,681,098
137,590 CarMax, Inc.* 17,769,748198,549 Chewy, Inc. Class A* 15,826,34148,941 Dollar General Corp. 10,590,343
196,350 Dollar Tree, Inc.* 19,536,82593,105 Etsy, Inc.* 19,164,73357,752 Five Below, Inc.* 11,161,729
107,767 LKQ Corp.* 5,304,292178,291 Ross Stores, Inc. 22,108,08440,310 Target Corp. 9,744,539
882,959 TJX Cos., Inc. 59,529,096115,140 Tory Burch LLC*(1)(2)(3) 5,789,224
7,677 Wayfair, Inc. Class A* 2,423,70640,625 Zalando SE*(7) 4,913,185
337,079,865
Semiconductors & Semiconductor Equipment - 3.1%393,432 Advanced Micro Devices, Inc.* 36,955,068
2,984 ASML Holding N.V. 2,059,91335,053 Broadcom, Inc. 16,714,672
196,711 First Solar, Inc.* 17,804,31324,142 KLA Corp. 7,827,078
253,515 Marvell Technology, Inc. 14,787,53091,191 Micron Technology, Inc.* 7,749,41162,168 MKS Instruments, Inc. 11,062,79640,113 NXP Semiconductors N.V. 8,252,04632,688 SolarEdge Technologies, Inc.* 9,033,98245,787 Universal Display Corp. 10,179,824
142,426,633
Software & Services - 12.9%67,147 Accenture plc Class A 19,794,26410,302 Amdocs Ltd. 796,963
148,868 ANSYS, Inc.* 51,666,12820,027 Avalara, Inc.* 3,240,369
223,338 Cognizant Technology Solutions Corp. Class A 15,468,39038,955 Fair Isaac Corp.* 19,581,89929,521 Fidelity National Information Services, Inc. 4,182,240
138,243 FleetCor Technologies, Inc.* 35,398,503703,519 Genpact Ltd. 31,960,86829,125 Global Payments, Inc. 5,462,102
395,524 GoDaddy, Inc. Class A* 34,394,76793,627 Guidewire Software, Inc.* 10,553,635
367,982 International Business Machines Corp. 53,942,481
The accompanying notes are an integral part of these financial statements.
27

p
123106 TX 28STATE STREET GLOBAL HLS SEMI-ANNUAL REPO
28-Jul-2021 08:06 ESTCLN PSLNF
Donnelley Financial LSWmadas0dcNone
6*PMT 1C
VDI-W7-PFL-220621.7.8.0
Hartford Capital Appreciation HLS FundSchedule of Investments – (continued)June 30, 2021 (Unaudited)
Shares or Principal Amount Market Value†
COMMON STOCKS - 96.9% - (continued)Software & Services - 12.9% - (continued)
8,042 Intuit, Inc. $ 3,941,94793,444 Mastercard, Inc. Class A 34,115,470
103,385 Microsoft Corp. 28,006,99629,899 MongoDB, Inc.* 10,809,086
531,504 Oracle Corp. 41,372,27144,370 Paycom Software, Inc.* 16,127,16453,459 RingCentral, Inc. Class A* 15,534,116
135,515 salesforce.com, Inc.* 33,102,24944,333 StoneCo Ltd. Class A* 2,972,971
191,346 Varonis Systems, Inc.* 11,025,35774,963 Visa, Inc. Class A 17,527,849
100,415 VMware, Inc. Class A*(5) 16,063,3881,124,711 Western Union Co. 25,834,612
112,153 WEX, Inc.* 21,746,467101,338 Workday, Inc. Class A* 24,193,43455,233 Worldline S.A.*(7) 5,175,5854,617 Zoom Video Communications, Inc. Class A* 1,786,918
595,778,489
Technology Hardware & Equipment - 3.4%28,832 Apple, Inc. 3,948,83129,234 Arista Networks, Inc.* 10,591,771
133,473 CDW Corp. 23,311,059449,681 Cisco Systems, Inc. 23,833,09391,870 F5 Networks, Inc.* 17,148,454
1,279,219 Flex Ltd.* 22,859,644321,442 II-VI, Inc.* 23,333,475
8,970 Keyence Corp. 4,517,499148,190 Lumentum Holdings, Inc.* 12,156,02615,220 Motorola Solutions, Inc. 3,300,457
143,270 Samsung Electronics Co., Ltd. 10,256,14418,490 TE Connectivity Ltd. 2,500,033
157,756,486
Telecommunication Services - 0.8%87,249 Cellnex Telecom S.A.(7) 5,564,849
204,731 T-Mobile U.S., Inc.* 29,651,191
35,216,040
Transportation - 2.3%52,759 FedEx Corp. 15,739,593
123,619 J.B. Hunt Transport Services, Inc. 20,143,716294,200 Localiza Rent a Car S.A. 3,785,59789,278 Uber Technologies, Inc.* 4,474,613
132,694 Union Pacific Corp. 29,183,391156,156 United Parcel Service, Inc. Class B 32,475,763
105,802,673
Utilities - 1.9%139,949 Avangrid, Inc. 7,197,577465,511 CenterPoint Energy, Inc. 11,414,33081,593 Consolidated Edison, Inc. 5,851,850
147,750 Duke Energy Corp. 14,585,880436,684 Exelon Corp. 19,349,468
1,310,664 Iberdrola S.A. 15,983,096157,185 Pinnacle West Capital Corp. 12,884,454
87,266,655
Total Common Stocks(cost $3,260,666,986) $ 4,463,856,389
EXCHANGE-TRADED FUNDS - 0.4%Other Investment Pools & Funds - 0.4%
33,199 iShares MSCI ACWI ETF $ 3,359,407
Shares or Principal Amount Market Value†
EXCHANGE-TRADED FUNDS - 0.4% - (continued)Other Investment Pools & Funds - 0.4% - (continued)
46,388 iShares Russell 1000 Growth ETF $ 12,593,414
15,952,821
Total Exchange-Traded Funds(cost $14,667,043) $ 15,952,821
CONVERTIBLE PREFERRED STOCKS - 0.3%Software & Services - 0.3%
50,200 Nanigans, Inc. Series D*(1)(2)(3) $ —20,891 Sharecare, Inc. Series B2(2)(3) 12,359,76329,504 Magic Leap, Inc. Series C*(1)(2)(3) 271,732
12,631,495
Total Convertible Preferred Stocks(cost $6,447,709) $ 12,631,495
ESCROWS - 0.0%(8)
Consumer Durables & Apparel - 0.0%127,917 One Kings Lane, Inc.*(1)(2)(3) $ 20,467
Total Escrows(cost $—) $ 20,467
Total Long-Term Investments(cost $3,281,781,738) $ 4,492,461,172
SHORT-TERM INVESTMENTS - 2.8%Repurchase Agreements - 1.9%
89,105,327 Fixed Income Clearing Corp. RepurchaseAgreement dated 06/30/2021 at 0.020%, due on07/01/2021 with a maturity value of $89,105,377;collateralized by U.S. Treasury GovernmentBond at 4.375%, maturing 11/15/2039, with amarket value of $90,887,507 $ 89,105,327
Securities Lending Collateral - 0.9%6,427,961 Fidelity Investments Money Market Funds,
Government Portfolio, Institutional Class,0.01%(9) 6,427,961
33,331,440 Goldman Sachs Financial Square Funds,Government Fund, Institutional Class, 0.03%(9) 33,331,440
1,692,447 Invesco Government & Agency Portfolio,Institutional Class, 0.03%(9) 1,692,447
41,451,848
Total Short-Term Investments(cost $130,557,175) $ 130,557,175
Total Investments(cost $3,412,338,913) 100.4% $ 4,623,018,347
Other Assets and Liabilities (0.4)% (16,863,080)
Total Net Assets 100.0% $ 4,606,155,267
Note: Percentage of investments as shown is the ratio of the total market value to totalnet assets.
Prices of foreign equities that are principally traded on certain foreign marketswill generally be adjusted daily pursuant to a fair value pricing service approvedby the Board of Directors in order to reflect an adjustment for factors occurringafter the close of certain foreign markets but before the close of the New YorkStock Exchange.
Equity industry classifications used in this report are the Global IndustryClassification Standard, which was developed by and is the exclusive propertyand service mark of MSCI, Inc. and Standard & Poor’s.
The accompanying notes are an integral part of these financial statements.
28

j
123106 TX 29STATE STREET GLOBAL HLS SEMI-ANNUAL REPO
28-Jul-2021 08:07 ESTCLN PSLNF
Donnelley Financial LSWmadas0dcNone
6*PMT 1C
VDI-W7-PFL-220621.7.8.0
Hartford Capital Appreciation HLS FundSchedule of Investments – (continued)June 30, 2021 (Unaudited)
For Fund compliance purposes, the Fund may not use the same classificationsystem. These classifications are used for financial reporting purposes.
See “Glossary” for abbreviation descriptions.
* Non-income producing.
(1) Investment valued using significant unobservable inputs.
(2) These securities are valued in good faith at fair value as determined under policiesand procedures established by and under the supervision of the Board of Directors. AtJune 30, 2021, the aggregate fair value of these securities was $36,432,730, whichrepresented 0.8% of total net assets. This amount excludes securities that areprincipally traded in certain foreign markets and whose prices are adjusted pursuantto a third party pricing service methodology approved by the Board of Directors.
(3) Investment in securities not registered under the Securities Act of 1933 (excludingsecurities acquired pursuant to Rule 144A and Regulation S). At the end of theperiod, the value of such restricted securities amounted to $36,432,730 or 0.8% ofnet assets.
PeriodAcquired Security Name
Shares/Par Value Total Cost Market Value
08/2011 Allstar Co. 8,451,700 $ — $ 9,550,42106/2015 HF Global, Inc. 350,600 4,713,607 7,099,65008/2014 Honest Co., Inc. 85,750 1,097,606 1,341,47312/2015 Magic Leap, Inc.
Series C ConvertiblePreferred 29,504 679,566 271,732
03/2015 Nanigans, Inc.Series D ConvertiblePreferred 50,200 548,109 —
01/2014 One Kings Lane, Inc. 127,917 — 20,46703/2015 Sharecare, Inc.
Series B2ConvertiblePreferred 20,891 5,220,034 12,359,763
11/2013 Tory Burch LLC 115,140 9,024,247 5,789,224
$ 21,283,169 $ 36,432,730
(4) Investment is temporarily subject to certain trading restrictions. At June 30, 2021, thevalue of such restricted securities amounted to $ 48,555,181 or 1.1% of net assets.
PeriodAcquired Security Name
Shares/Par Value Total Cost Market Value
08/2015 Airbnb, Inc. 317,064 $ 40,489,856 $ 48,555,181
(5) Represents entire or partial securities on loan. See Note 8 in the accompanying Notesto Financial Statements for securities lending information.
(6) Affiliated company – The Fund owns greater than 5% of the outstanding votingsecurities of this issuer.
(7) Security was purchased pursuant to Rule 144A under the Securities Act of 1933 andmay be sold in transactions that are exempt from registration (typically only toqualified institutional buyers) or in a public offering registered under the Securities Actof 1933. At June 30, 2021, the aggregate value of these securities was $15,653,619,representing 0.3% of net assets.
(8) Share amount represents shares of the issuer previously held that resulted in receiptof the escrow.
(9) Current yield as of period end.
Futures Contracts Outstanding at June 30, 2021
DescriptionNumber ofContracts
ExpirationDate
CurrentNotionalAmount
Value andUnrealized
Appreciation/(Depreciation)
Long position contracts:NASDAQ 100 E-MINI 249 09/17/2021 $ 72,454,020 $ 3,194,106
Total futures contracts $ 3,194,106
† See Significant Accounting Policies of accompanying Notes to Financial Statements regarding valuation of investments.
The accompanying notes are an integral part of these financial statements.
29

p
123106 TX 30STATE STREET GLOBAL HLS SEMI-ANNUAL REPO
27-Jul-2021 20:50 ESTCLN PSLNF
Donnelley Financial LSWpf_rendNone
5*PMT 1C
LSWP64RS2921.6.2.0
Hartford Capital Appreciation HLS FundSchedule of Investments – (continued)June 30, 2021 (Unaudited)
Fair Value SummaryThe following is a summary of the fair valuations according to the inputs used as of June 30, 2021 in valuing the Fund’s investments.
Description Total Level 1 Level 2 Level 3(1)
AssetsCommon Stocks
Automobiles & Components $ 27,817,746 $ 23,216,061 $ 4,601,685 $ —Banks 83,641,283 74,776,742 8,864,541 —Capital Goods 266,520,927 237,724,685 21,696,592 7,099,650Commercial & Professional Services 89,479,223 86,114,673 3,364,550 —Consumer Durables & Apparel 167,537,857 162,767,070 4,770,787 —Consumer Services 242,756,745 226,673,102 16,083,643 —Diversified Financials 209,708,564 204,763,450 4,945,114 —Energy 71,074,040 68,186,529 2,887,511 —Food & Staples Retailing 5,598,311 5,598,311 — —Food, Beverage & Tobacco 248,934,883 203,603,021 45,331,862 —Health Care Equipment & Services 391,713,669 391,713,669 — —Household & Personal Products 80,998,997 79,657,524 1,341,473 —Insurance 211,554,803 211,554,803 — —Materials 124,217,426 113,264,562 10,952,864 —Media & Entertainment 334,855,749 334,855,749 — —Pharmaceuticals, Biotechnology & Life Sciences 259,281,808 259,281,808 — —Real Estate 186,837,517 186,837,517 — —Retailing 337,079,865 316,827,035 14,463,606 5,789,224Semiconductors & Semiconductor Equipment 142,426,633 140,366,720 2,059,913 —Software & Services 595,778,489 590,602,904 5,175,585 —Technology Hardware & Equipment 157,756,486 142,982,843 14,773,643 —Telecommunication Services 35,216,040 29,651,191 5,564,849 —Transportation 105,802,673 105,802,673 — —Utilities 87,266,655 71,283,559 15,983,096 —
Exchange-Traded Funds 15,952,821 15,952,821 — —Convertible Preferred Stocks 12,631,495 — 12,359,763 271,732Escrows 20,467 — — 20,467Short-Term Investments 130,557,175 41,451,848 89,105,327 —Futures Contracts(2) 3,194,106 3,194,106 — —
Total $ 4,626,212,453 $ 4,328,704,976 $ 284,326,404 $ 13,181,073
(1) For the six-month period ended June 30, 2021, there were no transfers in and out of Level 3.
(2) Derivative instruments (excluding purchased and written options, if applicable) are valued at the unrealized appreciation/(depreciation) on the investments.
Level 3 investments at the beginning and/or end of the period in relation to net assets were not significant and accordingly, a reconciliation of Level 3 assets for period ended June 30, 2021is not presented.
The accompanying notes are an integral part of these financial statements.
30

123106 TX 31STATE STREET GLOBAL HLS SEMI-ANNUAL REPO
27-Jul-2021 20:50 ESTCLN PSLNF
Donnelley Financial LSWpf_rendSTART PAGE
5*PMT 1C
LSWP64RS2921.6.2.0
Hartford Disciplined Equity HLS FundSchedule of InvestmentsJune 30, 2021 (Unaudited)
Shares or Principal Amount Market Value†
COMMON STOCKS - 97.0%Automobiles & Components - 0.4%
17,907 Tesla, Inc.* $ 12,171,388
Banks - 5.9%1,823,554 Bank of America Corp. 75,185,132
521,634 JP Morgan Chase & Co. 81,134,952220,203 PNC Financial Services Group, Inc. 42,005,924
198,326,008
Capital Goods - 5.8%258,681 AMETEK, Inc. 34,533,91378,193 Deere & Co. 27,579,453
357,916 Fortune Brands Home & Security, Inc. 35,652,013138,655 IDEX Corp. 30,511,033129,528 Illinois Tool Works, Inc. 28,957,280453,317 Raytheon Technologies Corp. 38,672,473
195,906,165
Commercial & Professional Services - 2.5%142,845 Equifax, Inc. 34,212,806340,389 Leidos Holdings, Inc. 34,413,328148,827 Republic Services, Inc. 16,372,458
84,998,592
Consumer Durables & Apparel - 2.3%282,726 NIKE, Inc. Class B 43,678,340388,114 VF Corp. 31,840,872
75,519,212
Consumer Services - 2.5%122,891 Airbnb, Inc. Class A* 18,819,52810,692 Booking Holdings, Inc.* 23,395,058
176,820 McDonald’s Corp. 40,843,652
83,058,238
Diversified Financials - 5.3%289,478 American Express Co. 47,830,45045,208 BlackRock, Inc. 39,555,644
433,099 Charles Schwab Corp. 31,533,938654,968 Morgan Stanley 60,054,016
178,974,048
Energy - 1.3%512,196 EOG Resources, Inc. 42,737,634
Food & Staples Retailing - 1.3%311,217 Walmart, Inc. 43,887,821
Food, Beverage & Tobacco - 2.2%185,277 Constellation Brands, Inc. Class A 43,334,437349,345 Monster Beverage Corp.* 31,912,666
75,247,103
Health Care Equipment & Services - 8.0%252,738 Abbott Laboratories 29,299,916404,816 Baxter International, Inc. 32,587,688134,090 Becton Dickinson and Co. 32,609,347155,354 Danaher Corp. 41,690,800409,978 Hologic, Inc.* 27,353,732103,186 Laboratory Corp. of America Holdings* 28,463,858188,231 UnitedHealth Group, Inc. 75,375,222
267,380,563
Household & Personal Products - 3.0%394,469 Colgate-Palmolive Co. 32,090,053215,697 Honest Co., Inc.*(1)(2) 3,374,364474,945 Procter & Gamble Co. 64,084,329
99,548,746
Insurance - 0.8%175,282 Chubb Ltd. 27,859,321
Shares or Principal Amount Market Value†
COMMON STOCKS - 97.0% - (continued)Materials - 1.1%
222,555 PPG Industries, Inc. $ 37,783,162
Media & Entertainment - 11.4%70,757 Alphabet, Inc. Class A* 172,773,735
276,526 Facebook, Inc. Class A* 96,150,85579,765 Netflix, Inc.* 42,132,671
403,515 Walt Disney Co.* 70,925,832
381,983,093
Pharmaceuticals, Biotechnology & Life Sciences - 5.7%269,890 Eli Lilly & Co. 61,945,153684,829 Merck & Co., Inc. 53,259,15251,958 Regeneron Pharmaceuticals, Inc.* 29,020,62192,000 Thermo Fisher Scientific, Inc. 46,411,240
190,636,166
Real Estate - 1.7%130,287 American Tower Corp. REIT 35,195,730465,531 Gaming and Leisure Properties, Inc. REIT 21,568,051
56,763,781
Retailing - 5.7%39,718 Amazon.com, Inc.* 136,636,275
761,207 TJX Cos., Inc. 51,320,57638,805 Tory Burch LLC*(1)(3)(4) 1,951,117
189,907,968
Semiconductors & Semiconductor Equipment - 4.9%330,663 Advanced Micro Devices, Inc.* 31,059,17685,162 KLA Corp. 27,610,372
225,384 QUALCOMM, Inc. 32,214,135155,238 Teradyne, Inc. 20,795,682278,299 Texas Instruments, Inc. 53,516,898
165,196,263
Software & Services - 11.7%213,828 Fidelity National Information Services, Inc. 30,293,013160,993 Global Payments, Inc. 30,192,627258,366 GoDaddy, Inc. Class A* 22,467,507145,986 Mastercard, Inc. Class A 53,298,029609,017 Microsoft Corp. 164,982,705198,934 salesforce.com, Inc.* 48,593,608210,699 SS&C Technologies Holdings, Inc. 15,182,970109,679 Workday, Inc. Class A* 26,184,765
391,195,224
Technology Hardware & Equipment - 9.0%1,156,997 Apple, Inc. 158,462,309
181,944 CDW Corp. 31,776,520958,398 Corning, Inc. 39,198,478199,068 Motorola Solutions, Inc. 43,167,896354,898 NetApp, Inc. 29,037,754
301,642,957
Telecommunication Services - 1.1%666,002 Verizon Communications, Inc. 37,316,092
Transportation - 1.4%156,352 FedEx Corp. 46,644,492
Utilities - 2.0%430,740 American Electric Power Co., Inc. 36,436,297316,779 Duke Energy Corp. 31,272,423
67,708,720
Total Common Stocks(cost $2,182,752,209) $ 3,252,392,757
The accompanying notes are an integral part of these financial statements.
31

123106 TX 32STATE STREET GLOBAL HLS SEMI-ANNUAL REPO
27-Jul-2021 20:50 ESTCLN PSLNF
Donnelley Financial LSWpf_rendNone
7*PMT 1C
LSWP64RS2921.6.2.0
Hartford Disciplined Equity HLS FundSchedule of Investments – (continued)June 30, 2021 (Unaudited)
Shares or Principal Amount Market Value†
CONVERTIBLE PREFERRED STOCKS - 2.3%Real Estate - 0.1%
81,049 We Co. Series D1*(1)(4) $ 696,292114,486 We Co. Series D2*(1)(4) 983,549
1,679,841
Retailing - 2.0%1,605,750 Coupang LLC*(1)(2) 65,901,586
Software & Services - 0.2%1,871,878 Essence Group Holdings Corp. Series 3*(1)(3)(4) 4,473,789
287,204 Lookout, Inc. Series F*(1)(3)(4) 2,673,869
7,147,658
Total Convertible Preferred Stocks(cost $14,495,539) $ 74,729,085
ESCROWS - 0.0%(5)
Software & Services - 0.0%366,944 Marklogic Corp.*(1)(3)(4) $ 4,770
Total Escrows(cost $—) $ 4,770
Total Long-Term Investments(cost $2,197,247,748) $ 3,327,126,612
SHORT-TERM INVESTMENTS - 0.6%Repurchase Agreements - 0.6%
21,020,072 Fixed Income Clearing Corp. RepurchaseAgreement dated 06/30/2021 at 0.020%, due on07/01/2021 with a maturity value of $21,020,084;collateralized by U.S. Treasury GovernmentBond at 4.375%, maturing 11/15/2030, with amarket value of $21,440,608 $ 21,020,072
Total Short-Term Investments(cost $21,020,072) $ 21,020,072
Total Investments(cost $2,218,267,820) 99.9% $ 3,348,146,684
Other Assets and Liabilities 0.1% 4,122,838
Total Net Assets 100.0% $ 3,352,269,522
Note: Percentage of investments as shown is the ratio of the total market value to totalnet assets.
Equity industry classifications used in this report are the Global IndustryClassification Standard, which was developed by and is the exclusive propertyand service mark of MSCI, Inc. and Standard & Poor’s.
For Fund compliance purposes, the Fund may not use the same classificationsystem. These classifications are used for financial reporting purposes.
See “Glossary” for abbreviation descriptions.
* Non-income producing.
(1) These securities are valued in good faith at fair value as determined under policiesand procedures established by and under the supervision of the Board of Directors. AtJune 30, 2021, the aggregate fair value of these securities was $80,059,336, whichrepresented 2.4% of total net assets. This amount excludes securities that areprincipally traded in certain foreign markets and whose prices are adjusted pursuantto a third party pricing service methodology approved by the Board of Directors.
(2) Investment is temporarily subject to certain trading restrictions. At June 30, 2021, thevalue of such restricted securities amounted to $69,275,950 or 2.1% of net assets.
PeriodAcquired Security Name
Shares/Par Value Total Cost Market Value
11/2014 Coupang LLCConvertible Preferred 1,605,750 $ 4,998,894 $ 65,901,586
08/2014 Honest Co., Inc. 215,697 2,760,927 3,374,364
$ 7,759,821 $ 69,275,950
(3) Investment valued using significant unobservable inputs.
(4) Investment in securities not registered under the Securities Act of 1933 (excludingsecurities acquired pursuant to Rule 144A and Regulation S). At the end of theperiod, the value of such restricted securities amounted to $10,783,386 or 0.3% ofnet assets.
PeriodAcquired Security Name
Shares/Par Value Total Cost Market Value
05/2014 Essence Group Holdings Corp.Series 3 Convertible Preferred 1,871,878 $ 2,960,001 $ 4,473,789
07/2014 Lookout, Inc.Series F Convertible Preferred 287,204 3,280,760 2,673,869
10/2020 Marklogic Corp. 366,944 — 4,77011/2013 Tory Burch LLC 38,805 3,041,403 1,951,11712/2014 We Co.
Series D1 Convertible Preferred 81,049 1,349,560 696,29212/2014 We Co.
Series D2 Convertible Preferred 114,486 1,906,324 983,549
$ 12,538,048 $ 10,783,386
(5) Share amount represents shares of the issuer previously held that resulted in receiptof the escrow.
† See Significant Accounting Policies of accompanying Notes to Financial Statementsregarding valuation of investments.
The accompanying notes are an integral part of these financial statements.
32
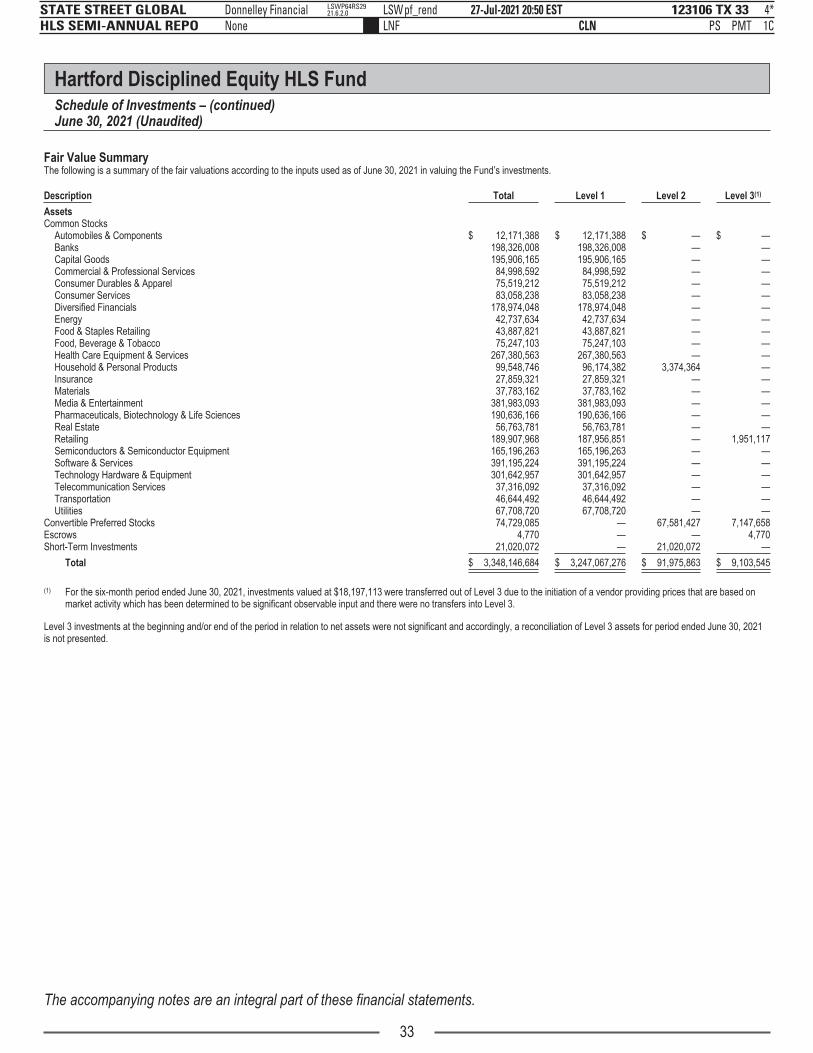
y
123106 TX 33STATE STREET GLOBAL HLS SEMI-ANNUAL REPO
27-Jul-2021 20:50 ESTCLN PSLNF
Donnelley Financial LSWpf_rendNone
4*PMT 1C
LSWP64RS2921.6.2.0
Hartford Disciplined Equity HLS FundSchedule of Investments – (continued)June 30, 2021 (Unaudited)
Fair Value SummaryThe following is a summary of the fair valuations according to the inputs used as of June 30, 2021 in valuing the Fund’s investments.
Description Total Level 1 Level 2 Level 3(1)
AssetsCommon Stocks
Automobiles & Components $ 12,171,388 $ 12,171,388 $ — $ —Banks 198,326,008 198,326,008 — —Capital Goods 195,906,165 195,906,165 — —Commercial & Professional Services 84,998,592 84,998,592 — —Consumer Durables & Apparel 75,519,212 75,519,212 — —Consumer Services 83,058,238 83,058,238 — —Diversified Financials 178,974,048 178,974,048 — —Energy 42,737,634 42,737,634 — —Food & Staples Retailing 43,887,821 43,887,821 — —Food, Beverage & Tobacco 75,247,103 75,247,103 — —Health Care Equipment & Services 267,380,563 267,380,563 — —Household & Personal Products 99,548,746 96,174,382 3,374,364 —Insurance 27,859,321 27,859,321 — —Materials 37,783,162 37,783,162 — —Media & Entertainment 381,983,093 381,983,093 — —Pharmaceuticals, Biotechnology & Life Sciences 190,636,166 190,636,166 — —Real Estate 56,763,781 56,763,781 — —Retailing 189,907,968 187,956,851 — 1,951,117Semiconductors & Semiconductor Equipment 165,196,263 165,196,263 — —Software & Services 391,195,224 391,195,224 — —Technology Hardware & Equipment 301,642,957 301,642,957 — —Telecommunication Services 37,316,092 37,316,092 — —Transportation 46,644,492 46,644,492 — —Utilities 67,708,720 67,708,720 — —
Convertible Preferred Stocks 74,729,085 — 67,581,427 7,147,658Escrows 4,770 — — 4,770Short-Term Investments 21,020,072 — 21,020,072 —
Total $ 3,348,146,684 $ 3,247,067,276 $ 91,975,863 $ 9,103,545
(1) For the six-month period ended June 30, 2021, investments valued at $18,197,113 were transferred out of Level 3 due to the initiation of a vendor providing prices that are based onmarket activity which has been determined to be significant observable input and there were no transfers into Level 3.
Level 3 investments at the beginning and/or end of the period in relation to net assets were not significant and accordingly, a reconciliation of Level 3 assets for period ended June 30, 2021is not presented.
The accompanying notes are an integral part of these financial statements.
33
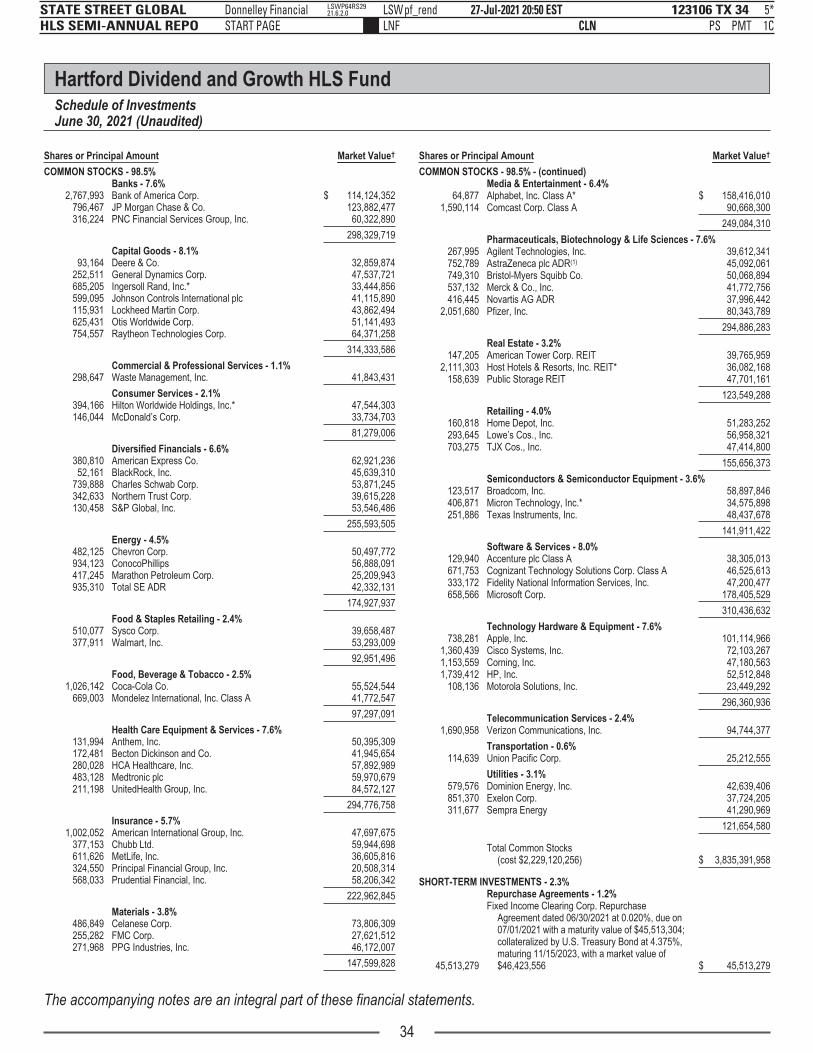
123106 TX 34STATE STREET GLOBAL HLS SEMI-ANNUAL REPO
27-Jul-2021 20:50 ESTCLN PSLNF
Donnelley Financial LSWpf_rendSTART PAGE
5*PMT 1C
LSWP64RS2921.6.2.0
Hartford Dividend and Growth HLS FundSchedule of InvestmentsJune 30, 2021 (Unaudited)
Shares or Principal Amount Market Value†
COMMON STOCKS - 98.5%Banks - 7.6%
2,767,993 Bank of America Corp. $ 114,124,352796,467 JP Morgan Chase & Co. 123,882,477316,224 PNC Financial Services Group, Inc. 60,322,890
298,329,719
Capital Goods - 8.1%93,164 Deere & Co. 32,859,874
252,511 General Dynamics Corp. 47,537,721685,205 Ingersoll Rand, Inc.* 33,444,856599,095 Johnson Controls International plc 41,115,890115,931 Lockheed Martin Corp. 43,862,494625,431 Otis Worldwide Corp. 51,141,493754,557 Raytheon Technologies Corp. 64,371,258
314,333,586
Commercial & Professional Services - 1.1%298,647 Waste Management, Inc. 41,843,431
Consumer Services - 2.1%394,166 Hilton Worldwide Holdings, Inc.* 47,544,303146,044 McDonald’s Corp. 33,734,703
81,279,006
Diversified Financials - 6.6%380,810 American Express Co. 62,921,23652,161 BlackRock, Inc. 45,639,310
739,888 Charles Schwab Corp. 53,871,245342,633 Northern Trust Corp. 39,615,228130,458 S&P Global, Inc. 53,546,486
255,593,505
Energy - 4.5%482,125 Chevron Corp. 50,497,772934,123 ConocoPhillips 56,888,091417,245 Marathon Petroleum Corp. 25,209,943935,310 Total SE ADR 42,332,131
174,927,937
Food & Staples Retailing - 2.4%510,077 Sysco Corp. 39,658,487377,911 Walmart, Inc. 53,293,009
92,951,496
Food, Beverage & Tobacco - 2.5%1,026,142 Coca-Cola Co. 55,524,544
669,003 Mondelez International, Inc. Class A 41,772,547
97,297,091
Health Care Equipment & Services - 7.6%131,994 Anthem, Inc. 50,395,309172,481 Becton Dickinson and Co. 41,945,654280,028 HCA Healthcare, Inc. 57,892,989483,128 Medtronic plc 59,970,679211,198 UnitedHealth Group, Inc. 84,572,127
294,776,758
Insurance - 5.7%1,002,052 American International Group, Inc. 47,697,675
377,153 Chubb Ltd. 59,944,698611,626 MetLife, Inc. 36,605,816324,550 Principal Financial Group, Inc. 20,508,314568,033 Prudential Financial, Inc. 58,206,342
222,962,845
Materials - 3.8%486,849 Celanese Corp. 73,806,309255,282 FMC Corp. 27,621,512271,968 PPG Industries, Inc. 46,172,007
147,599,828
Shares or Principal Amount Market Value†
COMMON STOCKS - 98.5% - (continued)Media & Entertainment - 6.4%
64,877 Alphabet, Inc. Class A* $ 158,416,0101,590,114 Comcast Corp. Class A 90,668,300
249,084,310
Pharmaceuticals, Biotechnology & Life Sciences - 7.6%267,995 Agilent Technologies, Inc. 39,612,341752,789 AstraZeneca plc ADR(1) 45,092,061749,310 Bristol-Myers Squibb Co. 50,068,894537,132 Merck & Co., Inc. 41,772,756416,445 Novartis AG ADR 37,996,442
2,051,680 Pfizer, Inc. 80,343,789
294,886,283
Real Estate - 3.2%147,205 American Tower Corp. REIT 39,765,959
2,111,303 Host Hotels & Resorts, Inc. REIT* 36,082,168158,639 Public Storage REIT 47,701,161
123,549,288
Retailing - 4.0%160,818 Home Depot, Inc. 51,283,252293,645 Lowe’s Cos., Inc. 56,958,321703,275 TJX Cos., Inc. 47,414,800
155,656,373
Semiconductors & Semiconductor Equipment - 3.6%123,517 Broadcom, Inc. 58,897,846406,871 Micron Technology, Inc.* 34,575,898251,886 Texas Instruments, Inc. 48,437,678
141,911,422
Software & Services - 8.0%129,940 Accenture plc Class A 38,305,013671,753 Cognizant Technology Solutions Corp. Class A 46,525,613333,172 Fidelity National Information Services, Inc. 47,200,477658,566 Microsoft Corp. 178,405,529
310,436,632
Technology Hardware & Equipment - 7.6%738,281 Apple, Inc. 101,114,966
1,360,439 Cisco Systems, Inc. 72,103,2671,153,559 Corning, Inc. 47,180,5631,739,412 HP, Inc. 52,512,848
108,136 Motorola Solutions, Inc. 23,449,292
296,360,936
Telecommunication Services - 2.4%1,690,958 Verizon Communications, Inc. 94,744,377
Transportation - 0.6%114,639 Union Pacific Corp. 25,212,555
Utilities - 3.1%579,576 Dominion Energy, Inc. 42,639,406851,370 Exelon Corp. 37,724,205311,677 Sempra Energy 41,290,969
121,654,580
Total Common Stocks(cost $2,229,120,256) $ 3,835,391,958
SHORT-TERM INVESTMENTS - 2.3%Repurchase Agreements - 1.2%
45,513,279
Fixed Income Clearing Corp. RepurchaseAgreement dated 06/30/2021 at 0.020%, due on07/01/2021 with a maturity value of $45,513,304;collateralized by U.S. Treasury Bond at 4.375%,maturing 11/15/2023, with a market value of$46,423,556 $ 45,513,279
The accompanying notes are an integral part of these financial statements.
34

p
123106 TX 35STATE STREET GLOBAL HLS SEMI-ANNUAL REPO
27-Jul-2021 20:50 ESTCLN PSLNF
Donnelley Financial LSWpf_rendNone
5*PMT 1C
LSWP64RS2921.6.2.0
Hartford Dividend and Growth HLS FundSchedule of Investments – (continued)June 30, 2021 (Unaudited)
Shares or Principal Amount Market Value†
SHORT-TERM INVESTMENTS - 2.3% - (continued)Securities Lending Collateral - 1.1%
6,732,040
Fidelity Investments Money Market Funds,Government Portfolio, Institutional Class,0.01%(2) $ 6,732,040
34,908,205Goldman Sachs Financial Square Funds,
Government Fund, Institutional Class, 0.02%(2) 34,908,205
1,772,509Invesco Government & Agency Portfolio,
Institutional Class, 0.02%(2) 1,772,509
43,412,754
Total Short-Term Investments(cost $88,926,034) $ 88,926,033
Total Investments(cost $2,318,046,290) 100.8% $ 3,924,317,991
Other Assets and Liabilities (0.8)% (30,499,496)
Total Net Assets 100.0% $ 3,893,818,495
Note: Percentage of investments as shown is the ratio of the total market value to totalnet assets.
Equity industry classifications used in this report are the Global IndustryClassification Standard, which was developed by and is the exclusive propertyand service mark of MSCI, Inc. and Standard & Poor’s.
For Fund compliance purposes, the Fund may not use the same classificationsystem. These classifications are used for financial reporting purposes.
See “Glossary” for abbreviation descriptions.
* Non-income producing.
(1) Represents entire or partial securities on loan. See Note 8 in the accompanying Notesto Financial Statements for securities lending information.
(2) Current yield as of period end.
† See Significant Accounting Policies of accompanying Notes to Financial Statementsregarding valuation of investments.
Fair Value SummaryThe following is a summary of the fair valuations according to the inputs used as of June 30, 2021 in valuing the Fund’s investments.
Description Total Level 1 Level 2 Level 3(1)
AssetsCommon Stocks
Banks $ 298,329,719 $ 298,329,719 $ — $ —Capital Goods 314,333,586 314,333,586 — —Commercial & Professional Services 41,843,431 41,843,431 — —Consumer Services 81,279,006 81,279,006 — —Diversified Financials 255,593,505 255,593,505 — —Energy 174,927,937 174,927,937 — —Food & Staples Retailing 92,951,496 92,951,496 — —Food, Beverage & Tobacco 97,297,091 97,297,091 — —Health Care Equipment & Services 294,776,758 294,776,758 — —Insurance 222,962,845 222,962,845 — —Materials 147,599,828 147,599,828 — —Media & Entertainment 249,084,310 249,084,310 — —Pharmaceuticals, Biotechnology & Life Sciences 294,886,283 294,886,283 — —Real Estate 123,549,288 123,549,288 — —Retailing 155,656,373 155,656,373 — —Semiconductors & Semiconductor Equipment 141,911,422 141,911,422 — —Software & Services 310,436,632 310,436,632 — —Technology Hardware & Equipment 296,360,936 296,360,936 — —Telecommunication Services 94,744,377 94,744,377 — —Transportation 25,212,555 25,212,555 — —Utilities 121,654,580 121,654,580 — —
Short-Term Investments 88,926,033 43,412,754 45,513,279 —
Total $ 3,924,317,991 $ 3,878,804,712 $ 45,513,279 $ —
(1) For the six-month period ended June 30, 2021, there were no transfers in and out of Level 3.
The accompanying notes are an integral part of these financial statements.
35

p
123106 TX 36STATE STREET GLOBAL HLS SEMI-ANNUAL REPO
27-Jul-2021 20:50 ESTCLN PSLNF
Donnelley Financial LSWpf_rendSTART PAGE
4*PMT 1C
LSWP64RS2921.6.2.0
Hartford Healthcare HLS FundSchedule of InvestmentsJune 30, 2021 (Unaudited)
Shares or Principal Amount Market Value†
COMMON STOCKS - 97.0%Biotechnology - 19.8%
24,544 89bio, Inc.* $ 458,97317,877 Akero Therapeutics, Inc.*(1) 443,52811,053 Alnylam Pharmaceuticals, Inc.* 1,873,70527,492 Apellis Pharmaceuticals, Inc.* 1,737,49424,308 Arena Pharmaceuticals, Inc.* 1,657,8061,489 Argenx SE ADR* 448,2933,386 Ascendis Pharma A/S ADR* 445,428
21,958 BioAtla, Inc.*(1) 930,5808,008 Biogen, Inc.* 2,772,9305,593 Biohaven Pharmaceutical Holding Co., Ltd.* 542,968
64,287 Connect Biopharma Holdings Ltd. ADR* 1,255,52537,053 Dyne Therapeutics, Inc.* 779,595
142,500 Everest Medicines Ltd.*(1)(2) 1,416,5508,410 Exact Sciences Corp.* 1,045,447
36,579 Freeline Therapeutics Holdings plc ADR* 298,11970,080 Gamida Cell Ltd.* 449,2132,284 Genmab A/S* 935,852
15,857 Genus plc 1,089,01350,199 Gracell Biotechnologies, Inc. ADR* 652,587
157,708 ImmunoGen, Inc.* 1,039,296414,000 InnoCare Pharma Ltd.*(2) 1,523,687109,743 Ironwood Pharmaceuticals, Inc.* 1,412,39213,951 Kodiak Sciences, Inc.* 1,297,44311,392 Kymera Therapeutics, Inc.* 552,51210,815 Madrigal Pharmaceuticals, Inc.* 1,053,48945,419 Merus N.V.* 956,9785,831 Mirati Therapeutics, Inc.* 941,881
24,846 Myovant Sciences Ltd.* 565,7433,005 Novavax, Inc.* 637,992
35,240 Nurix Therapeutics, Inc.* 934,91728,490 Oyster Point Pharma, Inc.*(1) 489,743
221,609 PhaseBio Pharmaceuticals, Inc.*(1) 824,38615,167 Radius Health, Inc.* 276,64616,465 Revolution Medicines, Inc.* 522,59911,295 Sage Therapeutics, Inc.* 641,66914,117 Seagen, Inc.* 2,228,79215,113 UroGen Pharma Ltd.*(1) 230,7769,333 Vertex Pharmaceuticals, Inc.* 1,881,813
18,649 Verve Therapeutics, Inc.* 1,123,60222,347 Zai Lab Ltd. ADR* 3,955,1967,349 Zealand Pharma A/S ADR*(1) 217,163
42,542,321
Consumer Finance - 0.1%14,177 Orion Acquisition Corp. UNIT* 140,636
Health Care Distributors - 0.9%25,463 AdaptHealth Corp.* 697,94128,261 Owens & Minor, Inc. 1,196,288
1,894,229
Health Care Equipment - 23.1%52,548 Abbott Laboratories 6,091,890
200 Angelalign Technology, Inc.*(2) 10,31934,375 Baxter International, Inc. 2,767,18718,503 Becton Dickinson and Co. 4,499,745
156,670 Boston Scientific Corp.* 6,699,20927,822 Danaher Corp. 7,466,31256,029 Edwards Lifesciences Corp.* 5,802,92325,332 Hologic, Inc.* 1,690,1515,967 Inari Medical, Inc.* 556,6025,698 Insulet Corp.* 1,564,158
14,309 Integra LifeSciences Holdings Corp.* 976,4464,216 Intuitive Surgical, Inc.* 3,877,202
16,614 iRhythm Technologies, Inc.* 1,102,3392,405 Masimo Corp.* 583,092
14,110 NuVasive, Inc.* 956,376
Shares or Principal Amount Market Value†
COMMON STOCKS - 97.0% - (continued)Health Care Equipment - 23.1% - (continued)
64,202 Smith & Nephew plc $ 1,392,3636,777 Teleflex, Inc. 2,722,931
86,000 Venus MedTech Hangzhou, Inc. Class H*(2) 716,455
49,475,700
Health Care Facilities - 2.9%25,328 Encompass Health Corp. 1,976,34420,917 HCA Healthcare, Inc. 4,324,381
6,300,725
Health Care Services - 2.0%6,802 agilon health, Inc.* 275,957
12,300 Alpha Teknova, Inc.* 291,87952,800 Aveanna Healthcare Holdings, Inc.* 653,1367,706 Laboratory Corp. of America Holdings* 2,125,7005,186 LHC Group, Inc.* 1,038,549
4,385,221
Health Care Supplies - 1.6%345,292 ConvaTec Group plc(2) 1,149,208
9,375 Haemonetics Corp.* 624,7507,476 Quidel Corp.* 957,825
312,000 Shandong Weigao Group Medical Polymer Co., Ltd.Class H 727,768
3,459,551
Integrated Telecommunication Services - 0.3%46,066 MedTech Acquisition Corp.* 461,58110,303 Therapeutics Acquisition Corp. Class A*(1) 105,915
567,496
Life & Health Insurance - 0.3%30,102 Oscar Health, Inc. Class A*(1) 647,193
Life Sciences Tools & Services - 8.1%2,543 Bio-Techne Corp. 1,145,011
10,673 Illumina, Inc.* 5,050,57014,519 NanoString Technologies, Inc.* 940,68621,518 NeoGenomics, Inc.* 971,96852,255 Syneos Health, Inc.* 4,676,3001,996 Tecan Group AG 989,0574,589 Thermo Fisher Scientific, Inc. 2,315,013
56,154 WuXi AppTec Co., Ltd. Class H(2) 1,310,722
17,399,327
Managed Health Care - 11.7%27,477 Centene Corp.* 2,003,8987,174 Humana, Inc. 3,176,0734,660 Molina Healthcare, Inc.* 1,179,260
58,500 Notre Dame Intermedica Participacoes S.A. 998,91544,417 UnitedHealth Group, Inc. 17,786,343
25,144,489
Pharmaceuticals - 26.2%50,154 Aclaris Therapeutics, Inc.*(1) 880,704
107,500 Astellas Pharma, Inc. 1,873,36697,475 AstraZeneca plc ADR(1) 5,838,753
108,942 Bristol-Myers Squibb Co. 7,279,504132,000 CSPC Pharmaceutical Group Ltd. 190,66898,935 Daiichi Sankyo Co., Ltd. 2,134,33325,409 Eisai Co., Ltd. 2,497,12624,358 Elanco Animal Health, Inc.* 844,97947,630 Eli Lilly & Co. 10,932,03812,627 Hikma Pharmaceuticals plc 427,32112,344 Hutchison China MediTech Ltd. ADR* 484,74916,524 Hutchmed China Ltd.* 128,331
177,100 Hypera S.A. 1,227,35916,900 Kyowa Kirin Co., Ltd. 601,057
The accompanying notes are an integral part of these financial statements.
36

yp
123106 TX 37STATE STREET GLOBAL HLS SEMI-ANNUAL REPO
27-Jul-2021 20:50 ESTCLN PSLNF
Donnelley Financial LSWpf_rendNone
5*PMT 1C
FWPLAN-PFRS4821.6.2.0
Hartford Healthcare HLS FundSchedule of Investments – (continued)June 30, 2021 (Unaudited)
Shares or Principal Amount Market Value†
COMMON STOCKS - 97.0% - (continued)Pharmaceuticals - 26.2% - (continued)
2,953 Laboratorios Farmaceuticos Rovi S.A. $ 204,4898,000 Nippon Shinyaku Co., Ltd. 636,461
12,066 Novartis AG 1,100,73951,976 Ono Pharmaceutical Co., Ltd. 1,159,074
274,109 Pfizer, Inc. 10,734,10829,458 Revance Therapeutics, Inc.* 873,13521,295 Theravance Biopharma, Inc.* 309,20313,217 UCB S.A. 1,384,23824,364 Zoetis, Inc. 4,540,475
56,282,210
Total Common Stocks(cost $139,768,611) $ 208,239,098
SHORT-TERM INVESTMENTS - 6.9%Repurchase Agreements - 2.3%
5,029,551 Fixed Income Clearing Corp. Repurchase Agreementdated 6/30/2021 at 0.020%, due on 07/01/2021 witha maturity value of $5,029,554; collateralized byU.S. Treasury Government Bond at 4.250%,maturing 05/15/2039, with a market value of$5,130,229 $ 5,029,551
Securities Lending Collateral - 4.6%1,514,830 Fidelity Investments Money Market Funds,
Government Portfolio, Institutional Class, 0.01%(3) 1,514,8307,854,975 Goldman Sachs Financial Square Funds, Government
Fund, Institutional Class, 0.03%(3) 7,854,975398,847 Invesco Government & Agency Portfolio, Institutional
Class, 0.03%(3) 398,847
9,768,652
Total Short-Term Investments(cost $14,798,203) $ 14,798,203
Total Investments(cost $154,566,814) 103.9% $ 223,037,301
Other Assets and Liabilities (3.9)% (8,440,993)
Total Net Assets 100.0% $ 214,596,308
Note: Percentage of investments as shown is the ratio of the total market value to totalnet assets.
Prices of foreign equities that are principally traded on certain foreign markets willgenerally be adjusted daily pursuant to a fair value pricing service approved bythe Board of Directors in order to reflect an adjustment for factors occurring afterthe close of certain foreign markets but before the close of the New YorkStock Exchange.
Equity industry classifications used in this report are the Global IndustryClassification Standard, which was developed by and is the exclusive propertyand service mark of MSCI, Inc. and Standard & Poor’s.
For Fund compliance purposes, the Fund may not use the same classificationsystem. These classifications are used for financial reporting purposes.
See “Glossary” for abbreviation descriptions.
* Non-income producing.
(1) Represents entire or partial securities on loan. See Note 8 in the accompanying Notesto Financial Statements for securities lending information.
(2) Security was purchased pursuant to Rule 144A under the Securities Act of 1933 andmay be sold in transactions that are exempt from registration (typically only toqualified institutional buyers) or in a public offering registered under the Securities Actof 1933. At June 30, 2021, the aggregate value of these securities was $6,126,941,representing 2.9% of net assets.
(3) Current yield as of period end.
† See Significant Accounting Policies of accompanying Notes to Financial Statementsregarding valuation of investments.
Fair Value SummaryThe following is a summary of the fair valuations according to the inputs used as of June 30, 2021 in valuing the Fund’s investments.
Description Total Level 1 Level 2 Level 3(1)
AssetsCommon Stocks
Biotechnology $ 42,542,321 $ 37,577,219 $ 4,965,102 $ —Consumer Finance 140,636 140,636 — —Health Care Distributors 1,894,229 1,894,229 — —Health Care Equipment 49,475,700 47,366,882 2,108,818 —Health Care Facilities 6,300,725 6,300,725 — —Health Care Services 4,385,221 4,385,221 — —Health Care Supplies 3,459,551 2,731,783 727,768 —Integrated Telecommunication Services 567,496 567,496 — —Life & Health Insurance 647,193 647,193 — —Life Sciences Tools & Services 17,399,327 15,099,548 2,299,779 —Managed Health Care 25,144,489 25,144,489 — —Pharmaceuticals 56,282,210 44,277,827 12,004,383 —
Short-Term Investments 14,798,203 9,768,652 5,029,551 —
Total $ 223,037,301 $ 195,901,900 $ 27,135,401 $ —
(1) For the six-month period ended June 30, 2021, there were no transfers in and out of Level 3.
The accompanying notes are an integral part of these financial statements.
37

123106 TX 38STATE STREET GLOBAL HLS SEMI-ANNUAL REPO
27-Jul-2021 20:50 ESTCLN PSLNF
Donnelley Financial LSWpf_rendSTART PAGE
4*PMT 1C
FWPLAN-PFRS4821.6.2.0
Hartford International Opportunities HLS FundSchedule of InvestmentsJune 30, 2021 (Unaudited)
Shares or Principal Amount Market Value†
COMMON STOCKS - 96.0%Australia - 2.5%
1,293,568 Goodman Group REIT $ 20,471,5822,424,866 Sydney Airport* 10,521,530
30,993,112
Belgium - 1.6%266,949 KBC Group N.V. 20,381,907
Brazil - 3.2%1,050,112 Localiza Rent a Car S.A. 13,512,238
191,216 StoneCo Ltd. Class A* 12,822,945318,727 XP, Inc. Class A* 13,880,561
40,215,744
Canada - 5.9%101,238 Barrick Gold Corp. 2,094,016
1,392 Brookfield Asset Management ReinsurancePartners Ltd. Class A* 73,553
201,938 Brookfield Asset Management, Inc. Class A 10,302,16114,840 Constellation Software, Inc. 22,475,609
113,768 Ritchie Bros Auctioneers, Inc. 6,744,7654,743 Shopify, Inc. Class A* 6,929,428
1,016,225 Suncor Energy, Inc. 24,339,884
72,959,416
Cayman Islands - 0.4%271,211 Wuxi Biologics Cayman, Inc.*(1) 4,965,950
China - 9.5%154,292 Alibaba Group Holding Ltd. ADR* 34,990,339
6,087,000 China Longyuan Power Group Corp. Ltd. Class H 10,480,05298,100 China Tourism Group Duty Free Corp. Ltd. Class A 4,550,209
595,740 ENN Energy Holdings Ltd. 11,322,473130,800 Hangzhou Tigermed Consulting Co., Ltd. Class H(1) 3,065,558120,148 Huazhu Group Ltd. ADR* 6,345,016395,000 Li Ning Co., Ltd. 4,818,32976,439 Meituan Class B*(1) 3,153,196
314,400 Proya Cosmetics Co., Ltd. Class A 9,564,347751,000 Shandong Sinocera Functional Material Co., Ltd.
Class A 5,657,713255,091 Tencent Holdings Ltd. 19,206,432528,060 Yifeng Pharmacy Chain Co., Ltd. Class A 4,582,040
117,735,704
Denmark - 1.4%38,620 Ascendis Pharma A/S ADR* 5,080,46125,103 DSV Panalpina A/S 5,859,99315,106 Genmab A/S* 6,189,570
17,130,024
France - 11.4%549,723 AXA S.A.(2) 13,958,751334,924 BNP Paribas S.A. 21,019,706403,026 Bureau Veritas S.A.* 12,761,21258,142 Cie de Saint-Gobain 3,837,131
226,797 Edenred 12,931,22010,652 Hermes International 15,544,58828,111 L’Oreal S.A. 12,554,195
128,588 Safran S.A. 17,845,81864,526 Schneider Electric SE 10,172,171
230,499 Worldline S.A.*(1) 21,598,812
142,223,604
Germany - 4.2%1,236,492 Commerzbank AG* 8,781,165
143,381 Siemens AG 22,765,846167,939 Zalando SE*(1) 20,310,531
51,857,542
Shares or Principal Amount Market Value†
COMMON STOCKS - 96.0% - (continued)Hong Kong - 0.7%
6,375 Hutchmed China Ltd.* $ 49,510529,799 Techtronic Industries Co., Ltd. 9,232,789
9,282,299
India - 2.6%308,549 HDFC Bank Ltd. 6,232,026
1,281,559 ICICI Bank Ltd.* 10,910,455523,449 Reliance Industries Ltd. 14,884,984
32,027,465
Ireland - 2.2%228,699 CRH plc 11,610,84098,105 Ryanair Holdings plc ADR* 10,615,94291,239 Smurfit Kappa Group plc 4,961,879
27,188,661
Italy - 1.7%104,805 Ferrari N.V. 21,636,591
Japan - 14.2%120,100 Bandai Namco Holdings, Inc. 8,312,045307,300 Dai-ichi Life Holdings, Inc. 5,654,07789,225 Daikin Industries Ltd. 16,627,050
183,200 East Japan Railway Co. 13,064,73079,572 Eisai Co., Ltd. 7,820,1143,400 Fast Retailing Co., Ltd. 2,555,738
62,900 Hoya Corp. 8,319,80544,922 Keyence Corp. 22,623,758
2,745,700 Mitsubishi UFJ Financial Group, Inc. 14,789,04366,400 Oriental Land Co., Ltd. 9,459,715
299,215 Recruit Holdings Co., Ltd. 14,673,133242,700 Sony Corp. 23,533,94332,987 Sysmex Corp. 3,913,404
571,640 T&D Holdings, Inc. 7,418,104135,846 Tokio Marine Holdings, Inc. 6,257,098
7,700 Tokyo Electron Ltd. 3,329,358223,300 Unicharm Corp. 8,994,581
177,345,696
Netherlands - 5.9%2,011 Adyen N.V.*(1) 4,931,634
136,598 AerCap Holdings N.V.* 6,995,18420,720 Argenx SE ADR* 6,238,17022,412 ASML Holding N.V. 15,471,436
361,974 Koninklijke Philips N.V. 17,966,2751,085,238 Royal Dutch Shell plc Class A 21,927,778
73,530,477
Norway - 1.0%584,311 Equinor ASA 12,368,989
Russia - 0.8%612,000 Sberbank of Russia PJSC ADR 10,169,597
Singapore - 0.7%32,523 Sea Ltd. ADR* 8,930,816
South Korea - 2.0%352,881 Samsung Electronics Co., Ltd. 25,261,384
Spain - 3.9%444,746 Cellnex Telecom S.A.(1) 28,366,452
1,634,853 Iberdrola S.A. 19,936,468
48,302,920
Switzerland - 5.3%13,127 Lonza Group AG 9,306,471
192,396 Nestle S.A. 23,981,595697 Partners Group Holding AG 1,056,615
54,716 Roche Holding AG 20,619,059
The accompanying notes are an integral part of these financial statements.
38

123106 TX 39STATE STREET GLOBAL HLS SEMI-ANNUAL REPO
27-Jul-2021 20:50 ESTCLN PSLNF
Donnelley Financial LSWpf_rendNone
4*PMT 1C
FWPLAN-PFRS4821.6.2.0
Hartford International Opportunities HLS FundSchedule of Investments – (continued)June 30, 2021 (Unaudited)
Shares or Principal Amount Market Value†
COMMON STOCKS - 96.0% - (continued)Switzerland - 5.3% - (continued)
79,756 TE Connectivity Ltd. $ 10,783,809
65,747,549
Taiwan - 3.2%207,623 MediaTek, Inc. 7,160,134
1,540,806 Taiwan Semiconductor Manufacturing Co., Ltd. 33,185,923
40,346,057
Thailand - 0.7%2,229,500 Kasikornbank PCL 8,260,070
United Kingdom - 11.0%549,711 Anglo American plc 21,875,276222,516 AstraZeneca plc 26,733,99082,853 Berkeley Group Holdings plc 5,268,182
378,825 Diageo plc 18,156,508570,242 Intermediate Capital Group plc 16,772,60835,983 London Stock Exchange Group plc 3,976,496
714,299 Prudential plc 13,590,087260,110 Rio Tinto plc 21,481,822616,798 Segro plc REIT 9,337,261
137,192,230
Total Common Stocks(cost $934,150,097) $ 1,196,053,804
EXCHANGE-TRADED FUNDS - 1.6%Other Investment Pools & Funds - 1.6%
337,631 iShares MSCI ACWI ex U.S. ETF $ 19,417,159
Total Exchange-Traded Funds(cost $19,480,562) $ 19,417,159
Total Long-Term Investments(cost $953,630,659) $ 1,215,470,963
SHORT-TERM INVESTMENTS - 1.5%Repurchase Agreements - 1.5%
18,212,041 Fixed Income Clearing Corp. RepurchaseAgreement dated 06/30/2021 at 0.020%, due on07/01/2021 with a maturity value of $18,212,051;collateralized by U.S. Treasury GovernmentBond at 4.375%, maturing 11/15/2030, with amarket value of $18,576,325 $ 18,212,041
Total Short-Term Investments(cost $18,212,041) $ 18,212,041
Total Investments(cost $971,842,700) 99.1% $ 1,233,683,004
Other Assets and Liabilities 0.9% 11,438,439
Total Net Assets 100.0% $ 1,245,121,443
Note: Percentage of investments as shown is the ratio of the total market value to totalnet assets.
Prices of foreign equities that are principally traded on certain foreign markets willgenerally be adjusted daily pursuant to a fair value pricing service approved bythe Board of Directors in order to reflect an adjustment for factors occurring afterthe close of certain foreign markets but before the close of the New YorkStock Exchange.
Equity industry classifications used in this report are the Global IndustryClassification Standard, which was developed by and is the exclusive propertyand service mark of MSCI, Inc. and Standard & Poor’s.
For Fund compliance purposes, the Fund may not use the same classificationsystem. These classifications are used for financial reporting purposes.
See “Glossary” for abbreviation descriptions.
* Non-income producing.
(1) Security was purchased pursuant to Rule 144A under the Securities Act of 1933 andmay be sold in transactions that are exempt from registration (typically only toqualified institutional buyers) or in a public offering registered under the Securities Actof 1933. At June 30, 2021, the aggregate value of these securities was $86,392,133,representing 6.9% of net assets.
(2) Represents entire or partial securities on loan. See Note 8 in the accompanying Notesto Financial Statements for securities lending information.
† See Significant Accounting Policies of accompanying Notes to Financial Statementsregarding valuation of investments.
The accompanying notes are an integral part of these financial statements.
39

p
123106 TX 40STATE STREET GLOBAL HLS SEMI-ANNUAL REPO
27-Jul-2021 20:50 ESTCLN PSLNF
Donnelley Financial LSWpf_rendNone
4*PMT 1C
FWPLAN-PFRS4821.6.2.0
Hartford International Opportunities HLS FundSchedule of Investments – (continued)June 30, 2021 (Unaudited)
Fair Value SummaryThe following is a summary of the fair valuations according to the inputs used as of June 30, 2021 in valuing the Fund’s investments.
Description Total Level 1 Level 2 Level 3(1)
AssetsCommon Stocks
Australia $ 30,993,112 $ — $ 30,993,112 $ —Belgium 20,381,907 — 20,381,907 —Brazil 40,215,744 40,215,744 — —Canada 72,959,416 72,959,416 — —Cayman Islands 4,965,950 — 4,965,950 —China 117,735,704 41,335,355 76,400,349 —Denmark 17,130,024 5,080,461 12,049,563 —France 142,223,604 — 142,223,604 —Germany 51,857,542 — 51,857,542 —Hong Kong 9,282,299 49,510 9,232,789 —India 32,027,465 — 32,027,465 —Ireland 27,188,661 10,615,942 16,572,719 —Italy 21,636,591 — 21,636,591 —Japan 177,345,696 — 177,345,696 —Netherlands 73,530,477 13,233,354 60,297,123 —Norway 12,368,989 — 12,368,989 —Russia 10,169,597 — 10,169,597 —Singapore 8,930,816 8,930,816 — —South Korea 25,261,384 — 25,261,384 —Spain 48,302,920 — 48,302,920 —Switzerland 65,747,549 10,783,809 54,963,740 —Taiwan 40,346,057 — 40,346,057 —Thailand 8,260,070 — 8,260,070 —United Kingdom 137,192,230 — 137,192,230 —
Exchange-Traded Funds 19,417,159 19,417,159 — —Short-Term Investments 18,212,041 — 18,212,041 —
Total $ 1,233,683,004 $ 222,621,566 $ 1,011,061,438 $ —
(1) For the six-month period ended June 30, 2021, there were no transfers in and out of Level 3.
The accompanying notes are an integral part of these financial statements.
40

123106 TX 41STATE STREET GLOBAL HLS SEMI-ANNUAL REPO
27-Jul-2021 20:50 ESTCLN PSLNF
Donnelley Financial LSWpf_rendSTART PAGE
4*PMT 1C
FWPLAN-PFRS4821.6.2.0
Hartford MidCap HLS FundSchedule of InvestmentsJune 30, 2021 (Unaudited)
Shares or Principal Amount Market Value†
COMMON STOCKS - 100.0%Banks - 5.4%
175,090 Cullen/Frost Bankers, Inc. $ 19,610,08032,888 First Citizens BancShares, Inc. Class A 27,387,153
140,164 First Republic Bank 26,234,496164,479 M&T Bank Corp. 23,900,444247,079 Prosperity Bancshares, Inc. 17,740,272136,046 South State Corp. 11,123,121
125,995,566
Capital Goods - 8.2%167,958 Graco, Inc. 12,714,421165,773 IDEX Corp. 36,478,349
1,014,703 Ingersoll Rand, Inc.* 49,527,653102,633 Lennox International, Inc. 36,003,656196,864 Lincoln Electric Holdings, Inc. 25,928,95774,560 Middleby Corp.* 12,918,26658,900 Watsco, Inc. 16,883,096
190,454,398
Commercial & Professional Services - 3.2%627,152 Dun & Bradstreet Holdings, Inc.* 13,402,238784,128 GFL Environmental, Inc. 25,029,366379,978 IAA, Inc.* 20,724,000831,440 KAR Auction Services, Inc.* 14,591,772
73,747,376
Consumer Durables & Apparel - 6.6%219,645 Carter’s, Inc. 22,660,775
7,950 NVR, Inc.* 39,537,735311,040 PVH Corp.* 33,464,794997,213 Under Armour, Inc. Class C* 18,518,245423,745 YETI Holdings, Inc.* 38,908,266
153,089,815
Consumer Services - 1.8%266,291 Choice Hotels International, Inc. 31,651,348138,831 Hyatt Hotels Corp. Class A* 10,778,839
42,430,187
Diversified Financials - 1.9%73,231 Credit Acceptance Corp.*(1) 33,254,929
120,289 Hamilton Lane, Inc. Class A 10,960,734
44,215,663
Energy - 0.1%137,067 Cabot Oil & Gas Corp. 2,393,190
Food & Staples Retailing - 0.9%419,275 Performance Food Group Co.* 20,330,645
Food, Beverage & Tobacco - 1.2%341,062 Lamb Weston Holdings, Inc. 27,510,061
Health Care Equipment & Services - 8.9%70,664 Amedisys, Inc.* 17,307,734
253,714 Encompass Health Corp. 19,797,304341,021 Hill-Rom Holdings, Inc. 38,736,575508,262 Integra LifeSciences Holdings Corp.* 34,683,799111,340 LHC Group, Inc.* 22,296,94893,488 Molina Healthcare, Inc.* 23,658,073
342,331 NuVasive, Inc.* 23,203,19565,850 Teleflex, Inc. 26,457,872
206,141,500
Insurance - 4.1%37,594 Erie Indemnity Co. Class A 7,268,800
368,862 Fidelity National Financial, Inc. 16,030,743142,817 Globe Life, Inc. 13,603,31924,305 Markel Corp.* 28,842,98714,877 White Mountains Insurance Group Ltd. 17,079,242
Shares or Principal Amount Market Value†
COMMON STOCKS - 100.0% - (continued)Insurance - 4.1% - (continued)
165,987 WR Berkley Corp. $ 12,354,412
95,179,503
Materials - 2.5%1,074,175 Element Solutions, Inc. 25,114,211
65,506 Packaging Corp. of America 8,870,823335,766 Silgan Holdings, Inc. 13,934,289190,165 Steel Dynamics, Inc. 11,333,834
59,253,157
Media & Entertainment - 3.0%15,908 Cable One, Inc. 30,428,982
532,167 Cargurus, Inc.* 13,958,7402,318,516 Zynga, Inc. Class A* 24,645,825
69,033,547
Pharmaceuticals, Biotechnology & Life Sciences - 10.9%173,696 Allakos, Inc.* 14,828,427431,652 Apellis Pharmaceuticals, Inc.* 27,280,406253,679 Arena Pharmaceuticals, Inc.* 17,300,90825,707 ICON plc* 5,313,894
658,800 Iovance Biotherapeutics, Inc.* 17,141,976145,559 Jazz Pharmaceuticals plc* 25,857,101159,336 Kodiak Sciences, Inc.* 14,818,24871,134 Mirati Therapeutics, Inc.* 11,490,275
207,472 PRA Health Sciences, Inc.* 34,276,449457,736 PTC Therapeutics, Inc.* 19,348,501190,884 Reata Pharmaceuticals, Inc. Class A* 27,015,812319,442 Sage Therapeutics, Inc.* 18,147,500224,697 Syneos Health, Inc.* 20,108,135
252,927,632
Real Estate - 6.1%316,363 Douglas Emmett, Inc. REIT 10,636,124327,093 Equity Commonwealth REIT 8,569,837359,693 Life Storage, Inc. REIT 38,613,04352,972 PS Business Parks, Inc. REIT 7,844,094
309,678 Redfin Corp.* 19,636,682463,694 Rexford Industrial Realty, Inc. REIT 26,407,373896,712 STORE Capital Corp. REIT 30,945,531
142,652,684
Retailing - 2.8%163,854 CarMax, Inc.* 21,161,744208,416 Etsy, Inc.* 42,900,349
64,062,093
Semiconductors & Semiconductor Equipment - 4.7%472,611 First Solar, Inc.* 42,776,022220,796 MKS Instruments, Inc. 39,290,648170,794 Silicon Laboratories, Inc.* 26,174,180
108,240,850
Software & Services - 10.7%123,660 Aspen Technology, Inc.* 17,008,196116,542 Black Knight, Inc.* 9,087,945
1,057,902 Genpact Ltd. 48,060,488205,031 Guidewire Software, Inc.* 23,111,094243,897 LiveRamp Holdings, Inc.* 11,426,575203,019 Q2 Holdings, Inc.* 20,825,689239,652 Science Applications International Corp. 21,024,670239,634 Shift4 Payments, Inc. Class A* 22,458,499563,289 Teradata Corp.* 28,147,551241,574 WEX, Inc.* 46,841,199
247,991,906
Technology Hardware & Equipment - 11.3%160,111 CDW Corp. 27,963,386
The accompanying notes are an integral part of these financial statements.
41
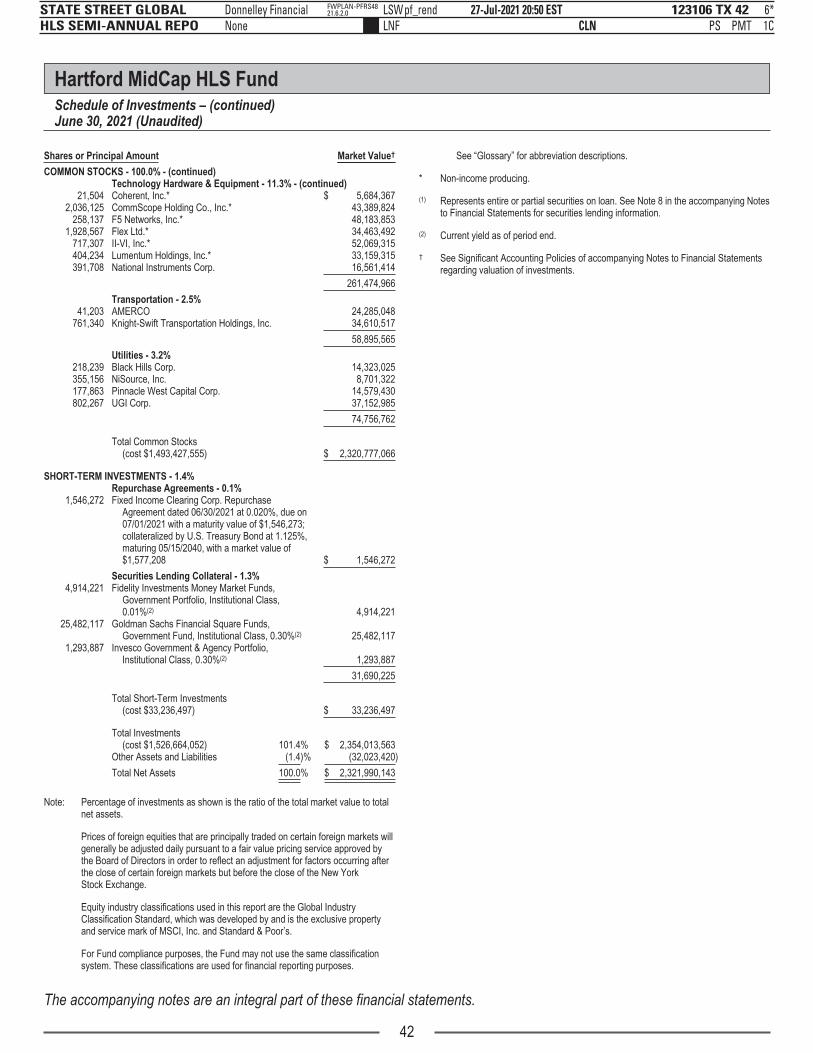
p
123106 TX 42STATE STREET GLOBAL HLS SEMI-ANNUAL REPO
27-Jul-2021 20:50 ESTCLN PSLNF
Donnelley Financial LSWpf_rendNone
6*PMT 1C
FWPLAN-PFRS4821.6.2.0
Hartford MidCap HLS FundSchedule of Investments – (continued)June 30, 2021 (Unaudited)
Shares or Principal Amount Market Value†
COMMON STOCKS - 100.0% - (continued)Technology Hardware & Equipment - 11.3% - (continued)
21,504 Coherent, Inc.* $ 5,684,3672,036,125 CommScope Holding Co., Inc.* 43,389,824
258,137 F5 Networks, Inc.* 48,183,8531,928,567 Flex Ltd.* 34,463,492
717,307 II-VI, Inc.* 52,069,315404,234 Lumentum Holdings, Inc.* 33,159,315391,708 National Instruments Corp. 16,561,414
261,474,966
Transportation - 2.5%41,203 AMERCO 24,285,048
761,340 Knight-Swift Transportation Holdings, Inc. 34,610,517
58,895,565
Utilities - 3.2%218,239 Black Hills Corp. 14,323,025355,156 NiSource, Inc. 8,701,322177,863 Pinnacle West Capital Corp. 14,579,430802,267 UGI Corp. 37,152,985
74,756,762
Total Common Stocks(cost $1,493,427,555) $ 2,320,777,066
SHORT-TERM INVESTMENTS - 1.4%Repurchase Agreements - 0.1%
1,546,272 Fixed Income Clearing Corp. RepurchaseAgreement dated 06/30/2021 at 0.020%, due on07/01/2021 with a maturity value of $1,546,273;collateralized by U.S. Treasury Bond at 1.125%,maturing 05/15/2040, with a market value of$1,577,208 $ 1,546,272
Securities Lending Collateral - 1.3%4,914,221 Fidelity Investments Money Market Funds,
Government Portfolio, Institutional Class,0.01%(2) 4,914,221
25,482,117 Goldman Sachs Financial Square Funds,Government Fund, Institutional Class, 0.30%(2) 25,482,117
1,293,887 Invesco Government & Agency Portfolio,Institutional Class, 0.30%(2) 1,293,887
31,690,225
Total Short-Term Investments(cost $33,236,497) $ 33,236,497
Total Investments(cost $1,526,664,052) 101.4% $ 2,354,013,563
Other Assets and Liabilities (1.4)% (32,023,420)
Total Net Assets 100.0% $ 2,321,990,143
Note: Percentage of investments as shown is the ratio of the total market value to totalnet assets.
Prices of foreign equities that are principally traded on certain foreign markets willgenerally be adjusted daily pursuant to a fair value pricing service approved bythe Board of Directors in order to reflect an adjustment for factors occurring afterthe close of certain foreign markets but before the close of the New YorkStock Exchange.
Equity industry classifications used in this report are the Global IndustryClassification Standard, which was developed by and is the exclusive propertyand service mark of MSCI, Inc. and Standard & Poor’s.
For Fund compliance purposes, the Fund may not use the same classificationsystem. These classifications are used for financial reporting purposes.
See “Glossary” for abbreviation descriptions.
* Non-income producing.
(1) Represents entire or partial securities on loan. See Note 8 in the accompanying Notesto Financial Statements for securities lending information.
(2) Current yield as of period end.
† See Significant Accounting Policies of accompanying Notes to Financial Statementsregarding valuation of investments.
The accompanying notes are an integral part of these financial statements.
42

yp
123106 TX 43STATE STREET GLOBAL HLS SEMI-ANNUAL REPO
27-Jul-2021 20:50 ESTCLN PSLNF
Donnelley Financial LSWpf_rendNone
3*PMT 1C
FWPLAN-PFRS4821.6.2.0
Hartford MidCap HLS FundSchedule of Investments – (continued)June 30, 2021 (Unaudited)
Fair Value SummaryThe following is a summary of the fair valuations according to the inputs used as of June 30, 2021 in valuing the Fund’s investments.
Description Total Level 1 Level 2 Level 3(1)
AssetsCommon Stocks
Banks $ 125,995,566 $ 125,995,566 $ — $ —Capital Goods 190,454,398 190,454,398 — —Commercial & Professional Services 73,747,376 73,747,376 — —Consumer Durables & Apparel 153,089,815 153,089,815 — —Consumer Services 42,430,187 42,430,187 — —Diversified Financials 44,215,663 44,215,663 — —Energy 2,393,190 2,393,190 — —Food & Staples Retailing 20,330,645 20,330,645 — —Food, Beverage & Tobacco 27,510,061 27,510,061 — —Health Care Equipment & Services 206,141,500 206,141,500 — —Insurance 95,179,503 95,179,503 — —Materials 59,253,157 59,253,157 — —Media & Entertainment 69,033,547 69,033,547 — —Pharmaceuticals, Biotechnology & Life Sciences 252,927,632 252,927,632 — —Real Estate 142,652,684 142,652,684 — —Retailing 64,062,093 64,062,093 — —Semiconductors & Semiconductor Equipment 108,240,850 108,240,850 — —Software & Services 247,991,906 247,991,906 — —Technology Hardware & Equipment 261,474,966 261,474,966 — —Transportation 58,895,565 58,895,565 — —Utilities 74,756,762 74,756,762 — —
Short-Term Investments 33,236,497 31,690,225 1,546,272 —
Total $ 2,354,013,563 $ 2,352,467,291 $ 1,546,272 $ —
(1) For the six-month period ended June 30, 2021, there were no transfers in and out of Level 3.
The accompanying notes are an integral part of these financial statements.
43

123106 TX 44STATE STREET GLOBAL HLS SEMI-ANNUAL REPO
27-Jul-2021 20:50 ESTCLN PSLNF
Donnelley Financial LSWpf_rendSTART PAGE
5*PMT 1C
FWPLAN-PFRS4821.6.2.0
Hartford Small Cap Growth HLS FundSchedule of InvestmentsJune 30, 2021 (Unaudited)
Shares or Principal Amount Market Value†
COMMON STOCKS - 98.6%Automobiles & Components - 2.8%
114,540 Fox Factory Holding Corp.* $ 17,829,296155,043 Patrick Industries, Inc. 11,318,139105,711 Thor Industries, Inc. 11,945,343
41,092,778
Banks - 2.3%690,448 MGIC Investment Corp. 9,390,093191,323 Synovus Financial Corp. 8,395,253125,186 Triumph Bancorp, Inc.* 9,295,06177,057 Western Alliance Bancorp 7,154,742
34,235,149
Capital Goods - 9.7%104,360 Altra Industrial Motion Corp. 6,785,487119,533 Applied Industrial Technologies, Inc. 10,884,67566,001 Armstrong World Industries, Inc. 7,079,26788,901 Boise Cascade Co. 5,187,373
232,973 Builders FirstSource, Inc.* 9,938,628139,006 BWX Technologies, Inc. 8,079,02966,133 Curtiss-Wright Corp. 7,853,95568,583 EnerSys 6,702,617
230,676 Hydrofarm Holdings Group, Inc.* 13,635,258112,957 ITT, Inc. 10,345,732107,368 John Bean Technologies Corp. 15,312,82480,403 Mercury Systems, Inc.* 5,329,111
220,770 Rexnord Corp. 11,047,331150,336 SPX Corp.* 9,182,523154,933 SPX FLOW, Inc. 10,107,82949,607 Trex Co., Inc.* 5,070,332
142,541,971
Commercial & Professional Services - 4.8%138,253 ASGN, Inc.* 13,400,86355,211 CACI International, Inc. Class A* 14,085,43156,129 Clean Harbors, Inc.* 5,227,855
102,758 Exponent, Inc. 9,167,041121,232 Insperity, Inc. 10,955,736100,874 Tetra Tech, Inc. 12,310,663116,134 Viad Corp.* 5,789,280
70,936,869
Consumer Durables & Apparel - 3.9%29,915 Deckers Outdoor Corp.* 11,489,45493,809 PVH Corp.* 10,092,91192,063 TopBuild Corp.* 18,208,220
334,874 Under Armour, Inc. Class C* 6,218,610121,468 YETI Holdings, Inc.* 11,153,192
57,162,387
Consumer Services - 4.0%175,175 BJ’s Restaurants, Inc.* 8,608,10059,467 Churchill Downs, Inc. 11,789,927
395,459 GAN Ltd.*(1) 6,501,346211,700 Mister Car Wash, Inc.* 4,557,901112,625 Penn National Gaming, Inc.* 8,614,686115,967 Wingstop, Inc. 18,279,878
58,351,838
Diversified Financials - 1.5%182,850 OneMain Holdings, Inc. 10,954,543161,673 Stifel Financial Corp. 10,486,111
21,440,654
Food & Staples Retailing - 1.1%331,900 Performance Food Group Co.* 16,093,831
Food, Beverage & Tobacco - 2.7%112,346 Celsius Holdings, Inc.* 8,548,407
Shares or Principal Amount Market Value†
COMMON STOCKS - 98.6% - (continued)Food, Beverage & Tobacco - 2.7% - (continued)
79,525 Freshpet, Inc.* $ 12,959,394356,572 Hostess Brands, Inc.* 5,772,90115,073 Lancaster Colony Corp. 2,916,776
242,622 Simply Good Foods Co.* 8,858,129
39,055,607
Health Care Equipment & Services - 12.7%339,604 AdaptHealth Corp.* 9,308,54627,045 Amedisys, Inc.* 6,624,132
135,275 AtriCure, Inc.* 10,731,366145,330 Cardiovascular Systems, Inc.* 6,198,324273,146 Covetrus, Inc.* 7,374,94290,715 Glaukos Corp.* 7,695,353
155,165 Globus Medical, Inc. Class A* 12,029,942183,848 Health Catalyst, Inc.* 10,205,402124,038 Integer Holdings Corp.* 11,684,380187,273 Integra LifeSciences Holdings Corp.* 12,779,51070,720 LHC Group, Inc.* 14,162,38783,893 ModivCare, Inc.* 14,267,68270,347 Nevro Corp.* 11,662,829
148,173 Omnicell, Inc.* 22,440,801286,812 OraSure Technologies, Inc.* 2,908,27443,400 Owens & Minor, Inc. 1,837,122
662,191 R1 RCM, Inc.* 14,727,12896,282 Tandem Diabetes Care, Inc.* 9,377,867
186,015,987
Household & Personal Products - 0.3%148,692 BellRing Brands, Inc. Class A* 4,660,007
Insurance - 0.9%176,650 James River Group Holdings Ltd. 6,627,90889,323 Kemper Corp. 6,600,970
13,228,878
Materials - 1.8%284,635 Axalta Coating Systems Ltd.* 8,678,52185,838 Ingevity Corp.* 6,983,780
150,092 Louisiana-Pacific Corp. 9,049,04795,240 Ranpak Holdings Corp.* 2,383,857
27,095,205
Media & Entertainment - 1.5%168,695 Cardlytics, Inc.* 21,412,456
Pharmaceuticals, Biotechnology & Life Sciences - 16.7%277,347 Aclaris Therapeutics, Inc.* 4,870,21371,202 Allakos, Inc.* 6,078,515
103,404 ALX Oncology Holdings, Inc.*(1) 5,654,131164,192 Apellis Pharmaceuticals, Inc.* 10,376,93484,456 Arena Pharmaceuticals, Inc.* 5,759,89995,671 Arrowhead Pharmaceuticals, Inc.* 7,923,47277,104 Arvinas, Inc.* 5,937,00886,081 BioAtla, Inc.* 3,648,11349,095 Biohaven Pharmaceutical Holding Co., Ltd.* 4,766,14377,951 Blueprint Medicines Corp.* 6,856,570
200,609 Celldex Therapeutics, Inc.* 6,708,365221,265 Dicerna Pharmaceuticals, Inc.* 8,257,610284,472 Dyne Therapeutics, Inc.* 5,985,29147,738 Fate Therapeutics, Inc.* 4,143,181
385,915 Heron Therapeutics, Inc.* 5,989,401433,450 Homology Medicines, Inc.* 3,151,182746,977 ImmunoGen, Inc.* 4,922,57834,600 Intellia Therapeutics, Inc.* 5,602,086
183,504 KalVista Pharmaceuticals, Inc.* 4,396,75647,722 Karuna Therapeutics, Inc.* 5,439,83168,715 Kodiak Sciences, Inc.* 6,390,495
245,172 Kura Oncology, Inc.* 5,111,836
The accompanying notes are an integral part of these financial statements.
44

q p
123106 TX 45STATE STREET GLOBAL HLS SEMI-ANNUAL REPO
27-Jul-2021 20:50 ESTCLN PSLNF
Donnelley Financial LSWpf_rendNone
5*PMT 1C
FWPLAN-PFRS4821.6.2.0
Hartford Small Cap Growth HLS FundSchedule of Investments – (continued)June 30, 2021 (Unaudited)
Shares or Principal Amount Market Value†
COMMON STOCKS - 98.6% - (continued)Pharmaceuticals, Biotechnology & Life Sciences - 16.7% - (continued)
119,671 Kymera Therapeutics, Inc.* $ 5,804,04360,120 Madrigal Pharmaceuticals, Inc.* 5,856,289
398,526 Mersana Therapeutics, Inc.* 5,411,98332,730 Mirati Therapeutics, Inc.* 5,286,877
132,796 NanoString Technologies, Inc.* 8,603,853214,923 NeoGenomics, Inc.* 9,708,072145,701 PTC Therapeutics, Inc.* 6,158,781274,758 Radius Health, Inc.* 5,011,586140,398 RAPT Therapeutics, Inc.*(1) 4,463,25241,082 Reata Pharmaceuticals, Inc. Class A* 5,814,335
238,150 Revance Therapeutics, Inc.* 7,058,766103,341 Revolution Medicines, Inc.* 3,280,043151,021 Rocket Pharmaceuticals, Inc.* 6,688,720254,365 Syndax Pharmaceuticals, Inc.* 4,367,447242,378 TCR2 Therapeutics, Inc.* 3,977,423193,025 TG Therapeutics, Inc.* 7,487,440310,661 Theravance Biopharma, Inc.* 4,510,79879,780 Turning Point Therapeutics, Inc.* 6,224,436
158,001 Veracyte, Inc.* 6,316,880178,654 Y-mAbs Therapeutics, Inc.* 6,038,505
246,039,139
Real Estate - 3.6%392,282 Essential Properties Realty Trust, Inc. REIT 10,607,306540,226 Independence Realty Trust, Inc. REIT 9,848,32079,390 PS Business Parks, Inc. REIT 11,756,071
185,983 Rexford Industrial Realty, Inc. REIT 10,591,732129,220 Ryman Hospitality Properties, Inc. REIT* 10,203,211
53,006,640
Retailing - 3.8%97,886 Floor & Decor Holdings, Inc. Class A* 10,346,550
207,522 Foot Locker, Inc. 12,789,58118,341 Lithia Motors, Inc. Class A 6,302,701
172,854 Ollie’s Bargain Outlet Holdings, Inc.* 14,542,207113,400 Shutterstock, Inc. 11,132,478
55,113,517
Semiconductors & Semiconductor Equipment - 4.2%186,701 Axcelis Technologies, Inc.* 7,546,454115,427 Cirrus Logic, Inc.* 9,825,146297,543 Lattice Semiconductor Corp.* 16,715,966169,230 Power Integrations, Inc. 13,887,01488,449 Synaptics, Inc.* 13,760,896
61,735,476
Software & Services - 17.2%125,173 Alarm.com Holdings, Inc.* 10,602,153112,791 Blackbaud, Inc.* 8,636,40787,478 Concentrix Corp.* 14,066,462
201,700 Digital Turbine, Inc.* 15,335,25161,391 Everbridge, Inc.* 8,354,087
145,961 ExlService Holdings, Inc.* 15,509,81639,813 Five9, Inc.* 7,301,306
113,409 j2 Global, Inc.* 15,599,408157,011 LiveRamp Holdings, Inc.* 7,355,96579,666 Manhattan Associates, Inc.* 11,538,823
253,021 Medallia, Inc.* 8,539,459153,302 Mimecast Ltd.* 8,132,671246,556 Momentive Global, Inc.* 5,194,93522,186 Paylocity Holding Corp.* 4,233,089
202,632 Perficient, Inc.* 16,295,66599,296 Q2 Holdings, Inc.* 10,185,784
157,370 Rapid7, Inc.* 14,891,923385,745 Repay Holdings Corp.* 9,273,31096,446 Science Applications International Corp. 8,461,208
Shares or Principal Amount Market Value†
COMMON STOCKS - 98.6% - (continued)Software & Services - 17.2% - (continued)
13,700 Sentinelone, Inc. Class A $ 582,250200,739 Sprinklr, Inc. Class A*(1) 4,133,216143,363 Sprout Social, Inc. Class A* 12,819,520279,726 Telos Corp.* 9,513,481230,377 Varonis Systems, Inc.* 13,274,323878,476 Verra Mobility Corp.* 13,502,176
253,332,688
Technology Hardware & Equipment - 2.4%221,991 II-VI, Inc.* 16,114,327111,107 Insight Enterprises, Inc.* 11,111,811107,037 Lumentum Holdings, Inc.* 8,780,245
36,006,383
Telecommunication Services - 0.4%46,997 Bandwidth, Inc. Class A* 6,481,826
Transportation - 0.3%257,326 Marten Transport Ltd. 4,243,306
Total Common Stocks(cost $971,494,474) $ 1,449,282,592
SHORT-TERM INVESTMENTS - 1.5%Repurchase Agreements - 1.2%
18,038,677 Fixed Income Clearing Corp. RepurchaseAgreement dated 06/30/2021 at 0.020%, due on07/01/2021 with a maturity value of $18,038,687;collateralized by U.S. Treasury GovernmentBond at 4.250%, maturing 05/15/2039, with amarket value of $16,403,916; collateralized byU.S. Treasury Government Bond at 4.375%,maturing 11/15/2030, with a market value of$1,995,642 $ 18,038,677
Securities Lending Collateral - 0.3%684,496 Fidelity Investments Money Market Funds,
Government Portfolio, Institutional Class,0.01%(2) 684,496
3,549,372 Goldman Sachs Financial Square Funds,Government Fund, Institutional Class, 0.03%(2) 3,549,372
180,224 Invesco Government & Agency Portfolio,Institutional Class, 0.03%(2) 180,224
4,414,092
Total Short-Term Investments(cost $22,452,769) $ 22,452,769
Total Investments(cost $993,947,243) 100.1% $ 1,471,735,361
Other Assets and Liabilities (0.1)% (2,186,626)
Total Net Assets 100.0% $ 1,469,548,735
Note: Percentage of investments as shown is the ratio of the total market value to totalnet assets.
Equity industry classifications used in this report are the Global IndustryClassification Standard, which was developed by and is the exclusive propertyand service mark of MSCI, Inc. and Standard & Poor’s.
For Fund compliance purposes, the Fund may not use the same classificationsystem. These classifications are used for financial reporting purposes.
See “Glossary” for abbreviation descriptions.
The accompanying notes are an integral part of these financial statements.
45
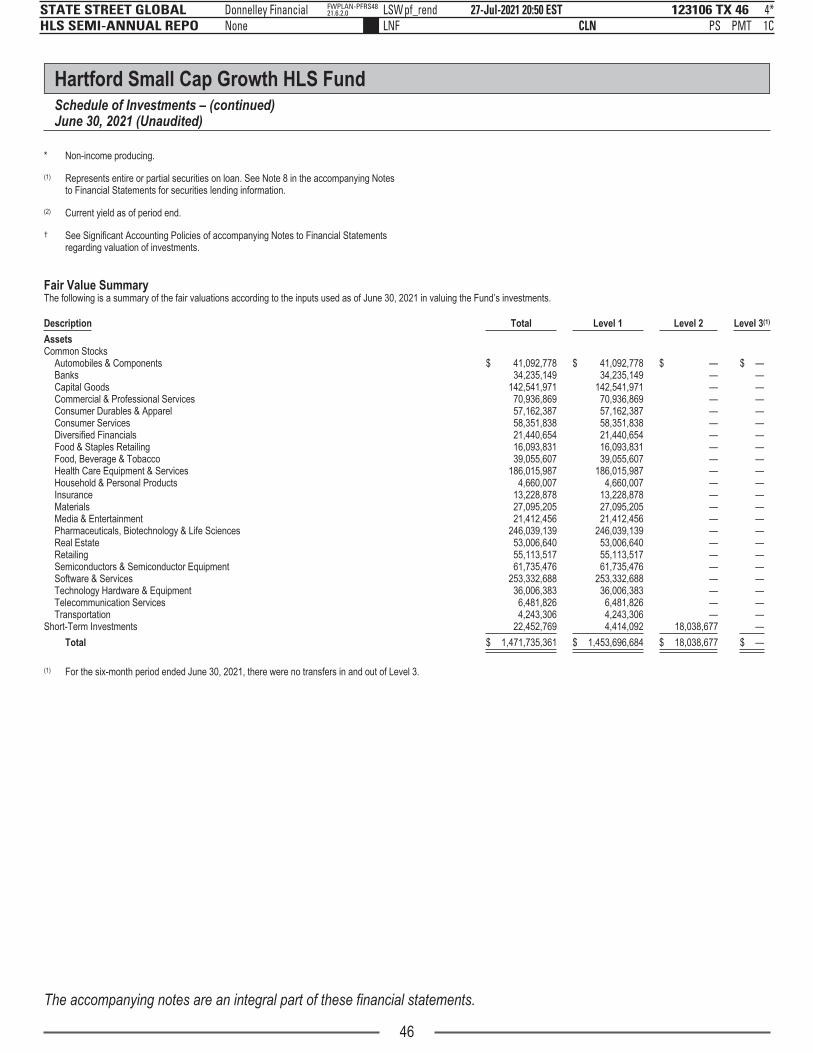
p
123106 TX 46STATE STREET GLOBAL HLS SEMI-ANNUAL REPO
27-Jul-2021 20:50 ESTCLN PSLNF
Donnelley Financial LSWpf_rendNone
4*PMT 1C
FWPLAN-PFRS4821.6.2.0
Hartford Small Cap Growth HLS FundSchedule of Investments – (continued)June 30, 2021 (Unaudited)
* Non-income producing.
(1) Represents entire or partial securities on loan. See Note 8 in the accompanying Notesto Financial Statements for securities lending information.
(2) Current yield as of period end.
† See Significant Accounting Policies of accompanying Notes to Financial Statementsregarding valuation of investments.
Fair Value SummaryThe following is a summary of the fair valuations according to the inputs used as of June 30, 2021 in valuing the Fund’s investments.
Description Total Level 1 Level 2 Level 3(1)
AssetsCommon Stocks
Automobiles & Components $ 41,092,778 $ 41,092,778 $ — $ —Banks 34,235,149 34,235,149 — —Capital Goods 142,541,971 142,541,971 — —Commercial & Professional Services 70,936,869 70,936,869 — —Consumer Durables & Apparel 57,162,387 57,162,387 — —Consumer Services 58,351,838 58,351,838 — —Diversified Financials 21,440,654 21,440,654 — —Food & Staples Retailing 16,093,831 16,093,831 — —Food, Beverage & Tobacco 39,055,607 39,055,607 — —Health Care Equipment & Services 186,015,987 186,015,987 — —Household & Personal Products 4,660,007 4,660,007 — —Insurance 13,228,878 13,228,878 — —Materials 27,095,205 27,095,205 — —Media & Entertainment 21,412,456 21,412,456 — —Pharmaceuticals, Biotechnology & Life Sciences 246,039,139 246,039,139 — —Real Estate 53,006,640 53,006,640 — —Retailing 55,113,517 55,113,517 — —Semiconductors & Semiconductor Equipment 61,735,476 61,735,476 — —Software & Services 253,332,688 253,332,688 — —Technology Hardware & Equipment 36,006,383 36,006,383 — —Telecommunication Services 6,481,826 6,481,826 — —Transportation 4,243,306 4,243,306 — —
Short-Term Investments 22,452,769 4,414,092 18,038,677 —
Total $ 1,471,735,361 $ 1,453,696,684 $ 18,038,677 $ —
(1) For the six-month period ended June 30, 2021, there were no transfers in and out of Level 3.
The accompanying notes are an integral part of these financial statements.
46

p
123106 TX 47STATE STREET GLOBAL HLS SEMI-ANNUAL REPO
27-Jul-2021 20:50 ESTCLN PSLNF
Donnelley Financial LSWpf_rendSTART PAGE
5*PMT 1C
FWPLAN-PFRS4821.6.2.0
Hartford Small Company HLS FundSchedule of InvestmentsJune 30, 2021 (Unaudited)
Shares or Principal Amount Market Value†
COMMON STOCKS - 99.4%Banks - 2.3%
91,666 Ameris Bancorp $ 4,641,049177,495 Sterling Bancorp 4,400,10149,568 Western Alliance Bancorp 4,602,389
13,643,539
Capital Goods - 9.6%126,106 Altra Industrial Motion Corp. 8,199,41287,894 Applied Industrial Technologies, Inc. 8,003,628
144,084 Builders FirstSource, Inc.* 6,146,623114,639 Colfax Corp.* 5,251,61247,663 Curtiss-Wright Corp. 5,660,458
233,191 Fluor Corp.* 4,127,48166,522 Gibraltar Industries, Inc.* 5,076,29467,400 Hydrofarm Holdings Group, Inc.* 3,984,01428,415 Kornit Digital Ltd.* 3,532,83739,936 Middleby Corp.* 6,919,311
56,901,670
Commercial & Professional Services - 0.7%8,400 Legalzoomcom, Inc. 317,940
54,253 TriNet Group, Inc.* 3,932,257
4,250,197
Consumer Durables & Apparel - 4.7%25,766 Cavco Industries, Inc.* 5,724,94834,166 Polaris, Inc. 4,679,375
151,063 Skyline Champion Corp.* 8,051,658104,365 YETI Holdings, Inc.* 9,582,794
28,038,775
Consumer Services - 7.4%179,235 2U, Inc.* 7,468,72273,916 Boyd Gaming Corp.* 4,545,095
132,381 Chegg, Inc.* 11,002,18585,900 Mister Car Wash, Inc.* 1,849,42738,492 Penn National Gaming, Inc.* 2,944,253
135,808 Planet Fitness, Inc. Class A* 10,219,55237,932 Wingstop, Inc. 5,979,221
44,008,455
Diversified Financials - 1.2%27,837 Hamilton Lane, Inc. Class A 2,536,50775,006 Hannon Armstrong Sustainable Infrastructure Capital,
Inc. REIT(1) 4,211,587
6,748,094
Food, Beverage & Tobacco - 1.2%7,041 Boston Beer Co., Inc. Class A* 7,187,453
Health Care Equipment & Services - 10.7%137,028 Accolade, Inc.* 7,441,991235,291 Cross Country Healthcare, Inc.* 3,884,65469,441 Globus Medical, Inc. Class A* 5,383,761
103,716 Health Catalyst, Inc.* 5,757,27528,610 HealthEquity, Inc.* 2,302,53351,705 Hill-Rom Holdings, Inc. 5,873,17192,592 Integra LifeSciences Holdings Corp.* 6,318,47840,745 LHC Group, Inc.* 8,159,594
710,420 Multiplan Corp.*(1) 6,763,198100,847 Oak Street Health, Inc.* 5,906,60937,736 Omnicell, Inc.* 5,715,117
63,506,381
Household & Personal Products - 0.4%156,433 Honest Co., Inc.*(2)(3) 2,447,238
Materials - 0.6%66,361 Cabot Corp. 3,777,932
Shares or Principal Amount Market Value†
COMMON STOCKS - 99.4% - (continued)Media & Entertainment - 2.9%
81,625 Cardlytics, Inc.* $ 10,360,661143,547 Criteo S.A. ADR* 6,492,631
16,853,292
Pharmaceuticals, Biotechnology & Life Sciences - 17.0%21,964 Acceleron Pharma, Inc.* 2,756,26232,544 Allakos, Inc.* 2,778,28171,815 ALX Oncology Holdings, Inc.* 3,926,844
278,650 Amicus Therapeutics, Inc.* 2,686,18660,842 Apellis Pharmaceuticals, Inc.* 3,845,21466,463 Arena Pharmaceuticals, Inc.* 4,532,77732,846 Arrowhead Pharmaceuticals, Inc.* 2,720,30624,379 Ascendis Pharma A/S ADR* 3,207,05749,432 BioAtla, Inc.*(1) 2,094,92841,483 Blueprint Medicines Corp.* 3,648,84561,222 Freeline Therapeutics Holdings plc ADR*(1) 498,959
238,455 Heron Therapeutics, Inc.* 3,700,822299,500 ImmunoGen, Inc.* 1,973,70518,567 Intellia Therapeutics, Inc.* 3,006,18399,027 KalVista Pharmaceuticals, Inc.* 2,372,68716,630 Karuna Therapeutics, Inc.* 1,895,65455,159 Kodiak Sciences, Inc.* 5,129,78781,153 Kura Oncology, Inc.* 1,692,04039,249 Medpace Holdings, Inc.* 6,932,551
164,186 Mersana Therapeutics, Inc.* 2,229,646110,789 Myovant Sciences Ltd.* 2,522,66647,092 NanoString Technologies, Inc.* 3,051,091
116,201 NeoGenomics, Inc.* 5,248,79962,658 PTC Therapeutics, Inc.* 2,648,55465,645 RAPT Therapeutics, Inc.* 2,086,85513,572 Reata Pharmaceuticals, Inc. Class A* 1,920,84585,118 Revolution Medicines, Inc.* 2,701,64556,740 Rocket Pharmaceuticals, Inc.* 2,513,015
154,122 TCR2 Therapeutics, Inc.* 2,529,142110,084 TG Therapeutics, Inc.* 4,270,15849,192 Turning Point Therapeutics, Inc.* 3,837,960
131,879 UroGen Pharma Ltd.*(1) 2,013,792115,579 Y-mAbs Therapeutics, Inc.* 3,906,570
100,879,826
Real Estate - 3.3%210,858 Essential Properties Realty Trust, Inc. REIT 5,701,60048,855 Redfin Corp.* 3,097,89671,280 Ryman Hospitality Properties, Inc. REIT* 5,628,269
286,421 Xenia Hotels & Resorts, Inc. REIT* 5,364,665
19,792,430
Retailing - 8.4%5,016,400 Allstar Co.(2)(4)(5) 5,668,532
52,509 Five Below, Inc.* 10,148,41464,869 Floor & Decor Holdings, Inc. Class A* 6,856,653
120,652 Ollie’s Bargain Outlet Holdings, Inc.* 10,150,453262,526 Porch Group, Inc.* 5,077,253245,643 RealReal, Inc.* 4,853,90649,775 Shutterstock, Inc. 4,886,41243,094 Tory Burch LLC*(2)(4)(6) 2,166,768
49,808,391
Semiconductors & Semiconductor Equipment - 5.3%49,858 ACM Research, Inc. Class A* 5,096,485
159,722 Maxeon Solar Technologies Ltd.*(1) 3,422,84333,833 MKS Instruments, Inc. 6,020,58257,936 SunPower Corp.* 1,692,89031,700 Synaptics, Inc.* 4,931,886
341,956 Tower Semiconductor Ltd.* 10,063,765
31,228,451
The accompanying notes are an integral part of these financial statements.
47

gp
123106 TX 48STATE STREET GLOBAL HLS SEMI-ANNUAL REPO
27-Jul-2021 20:50 ESTCLN PSLNF
Donnelley Financial LSWpf_rendNone
6*PMT 1C
FWPLAN-PFRS4821.6.2.0
Hartford Small Company HLS FundSchedule of Investments – (continued)June 30, 2021 (Unaudited)
Shares or Principal Amount Market Value†
COMMON STOCKS - 99.4% - (continued)Software & Services - 17.3%
5,400 Clear Secure, Inc. Class A $ 226,800143,318 Digital Turbine, Inc.* 10,896,46758,021 j2 Global, Inc.* 7,980,789
170,864 Jamf Holding Corp.* 5,735,904110,069 LiveRamp Holdings, Inc.* 5,156,73355,164 Manhattan Associates, Inc.* 7,989,954
115,202 Mimecast Ltd.* 6,111,466140,707 Perficient, Inc.* 11,315,657130,485 Rapid7, Inc.* 12,347,796250,982 Repay Holdings Corp.* 6,033,607
5,500 Sentinelone, Inc. Class A 233,75061,787 Squarespace, Inc. Class A* 3,670,766
174,351 Telos Corp.* 5,929,677209,384 Varonis Systems, Inc.* 12,064,706439,825 Verra Mobility Corp.* 6,760,110
102,454,182
Technology Hardware & Equipment - 4.7%118,578 Calix, Inc.* 5,632,455146,909 II-VI, Inc.* 10,664,12536,191 Novanta, Inc.* 4,877,09998,396 PAR Technology Corp.*(1) 6,881,816
28,055,495
Telecommunication Services - 1.1%47,117 Bandwidth, Inc. Class A* 6,498,377
Transportation - 0.6%15,680 Saia, Inc.* 3,284,803
Total Common Stocks(cost $469,004,369) $ 589,364,981
ESCROWS - 0.0%(7)
Software & Services - 0.0%410,300 Marklogic Corp.*(2)(4)(6) $ 5,334
Total Escrows(cost $—) $ 5,334
Total Long-Term Investments(cost $469,004,369) $ 589,370,315
SHORT-TERM INVESTMENTS - 2.9%Repurchase Agreements - 0.0%
209,901 Fixed Income Clearing Corp. Repurchase Agreementdated 06/30/2021 at 0.020%, due on 07/01/2021with a maturity value of $209,901; collateralized byU.S. Treasury Bond at 1.125%, maturing08/15/2040, with a market value of $214,118 $ 209,901
Securities Lending Collateral - 2.9%2,655,188 Fidelity Investments Money Market Funds,
Government Portfolio, Institutional Class, 0.01%(8) 2,655,18813,768,166 Goldman Sachs Financial Square Funds, Government
Fund, Institutional Class, 0.03%(8) 13,768,166699,096 Invesco Government & Agency Portfolio, Institutional
Class, 0.03%(8) 699,096
17,122,450
Total Short-Term Investments(cost $17,332,351) $ 17,332,350
Total Investments(cost $486,336,720) 102.3% $ 606,702,666
Other Assets and Liabilities (2.3)% (13,662,948)
Total Net Assets 100.0% $ 593,039,718
Note: Percentage of investments as shown is the ratio of the total market value to totalnet assets.
Equity industry classifications used in this report are the Global IndustryClassification Standard, which was developed by and is the exclusive propertyand service mark of MSCI, Inc. and Standard & Poor’s.
For Fund compliance purposes, the Fund may not use the same classificationsystem. These classifications are used for financial reporting purposes.
See “Glossary” for abbreviation descriptions.
* Non-income producing.
(1) Represents entire or partial securities on loan. See Note 8 in the accompanying Notesto Financial Statements for securities lending information.
(2) These securities are valued in good faith at fair value as determined under policiesand procedures established by and under the supervision of the Board of Directors. AtJune 30, 2021, the aggregate fair value of these securities was $10,287,872, whichrepresented 1.7% of total net assets. This amount excludes securities that areprincipally traded in certain foreign markets and whose prices are adjusted pursuantto a third party pricing service methodology approved by the Board of Directors.
(3) This security has been identified as illiquid. Illiquid securities are often purchased inprivate placement transactions, are often not registered under the Securities Act of1933, as amended, and may have contractual restrictions on resale. A security mayalso be considered illiquid if the security lacks a readily available market or if itsvaluation has not changed for a certain period of time. The identification of illiquidsecurities is unaudited. At June 30, 2021, the aggregate value of this security was$2,447,238, which represented 0.4% of total net assets.
(4) Investment in securities not registered under the Securities Act of 1933 (excludingsecurities acquired pursuant to Rule 144A and Regulation S). At the end of the period,the value of such restricted securities amounted to $7,840,634 or 1.3% of net assets.
PeriodAcquired Security Name
Shares/Par Value Total Cost Market Value
08/2011 Allstar Co. 5,016,400 $ — $ 5,668,53210/2020 Marklogic Corp. 410,300 — 5,33411/2013 Tory Burch LLC 43,094 3,377,559 2,166,768
$ 3,377,559 $ 7,840,634
(5) Affiliated company – The Fund owns greater than 5% of the outstanding votingsecurities of this issuer.
(6) Investment valued using significant unobservable inputs.
(7) Share amount represents shares of the issuer previously held that resulted in receiptof the escrow.
(8) Current yield as of period end.
The accompanying notes are an integral part of these financial statements.
48

123106 TX 49STATE STREET GLOBAL HLS SEMI-ANNUAL REPO
27-Jul-2021 20:50 ESTCLN PSLNF
Donnelley Financial LSWpf_rendNone
8*PMT 1C
FWPLAN-PFRS4821.6.2.0
Hartford Small Company HLS FundSchedule of Investments – (continued)June 30, 2021 (Unaudited)
Future PIPE Purchase Commitments Outstanding as of June 30, 2021
PeriodCommitted Security Name
CommittedShares
CommittedCost
CommittedMarket Value
UnrealizedAppreciation/(Deprecation)
2/1/2021 Aone 446,400 $ 4,464,000 $ 4,009,565 $ (454,435)2/1/2021 Decarbonization Plus Acquisition Corp 163,500 1,635,000 1,517,117 (117,883)2/1/2021 Latch, Inc. 369,464 3,694,640 4,338,246 643,606
12/1/2020 Payoneer Restricted 64,300 643,000 634,255 (8,745)1/1/2021 TPG Pace Beneficial Finance Corp. 316,800 3,168,000 3,669,494 501,494
$ 13,604,640 $ 14,168,677 $ 564,037
Special purpose acquisition companies (“SPACs”) are collective investment structures that allow for private investments in public equity investments (“PIPE”). The Hartford Small CompanyFund had contingent commitments outstanding of $13,604,640 to purchase restricted PIPE shares as of April 30, 2021.
The aggregate unrealized appreciation/depreciation of PIPE commitments represents 0.1% of net assets.
† See Significant Accounting Policies of accompanying Notes to Financial Statements regarding valuation of investments.
Fair Value SummaryThe following is a summary of the fair valuations according to the inputs used as of June 30, 2021 in valuing the Fund’s investments.
Description Total Level 1 Level 2 Level 3(1)
AssetsCommon Stocks
Banks $ 13,643,539 $ 13,643,539 $ — $ —Capital Goods 56,901,670 56,901,670 — —Commercial & Professional Services 4,250,197 4,250,197 — —Consumer Durables & Apparel 28,038,775 28,038,775 — —Consumer Services 44,008,455 44,008,455 — —Diversified Financials 6,748,094 6,748,094 — —Food, Beverage & Tobacco 7,187,453 7,187,453 — —Health Care Equipment & Services 63,506,381 63,506,381 — —Household & Personal Products 2,447,238 — 2,447,238 —Materials 3,777,932 3,777,932 — —Media & Entertainment 16,853,292 16,853,292 — —Pharmaceuticals, Biotechnology & Life Sciences 100,879,826 100,879,826 — —Real Estate 19,792,430 19,792,430 — —Retailing 49,808,391 41,973,091 5,668,532 2,166,768Semiconductors & Semiconductor Equipment 31,228,451 31,228,451 — —Software & Services 102,454,182 102,454,182 — —Technology Hardware & Equipment 28,055,495 28,055,495 — —Telecommunication Services 6,498,377 6,498,377 — —Transportation 3,284,803 3,284,803 — —
Future PIPE Purchase Commitment 1,145,100 — 1,145,100 —Escrows 5,334 — — 5,334Short-Term Investments 17,332,351 17,122,450 209,901 —
Total $ 607,847,766 $ 596,204,893 $ 9,470,771 $ 2,172,102
LiabilitiesFuture PIPE Purchase Commitment $ (581,063) $ — $ (581,063) $ —
(1) For the six-month period ended June 30, 2021, there were no transfers in and out of Level 3.
Level 3 investments at the beginning and/or end of the period in relation to net assets were not significant and accordingly, a reconciliation of Level 3 assets for period ended June 30, 2021is not presented.
The accompanying notes are an integral part of these financial statements.
49
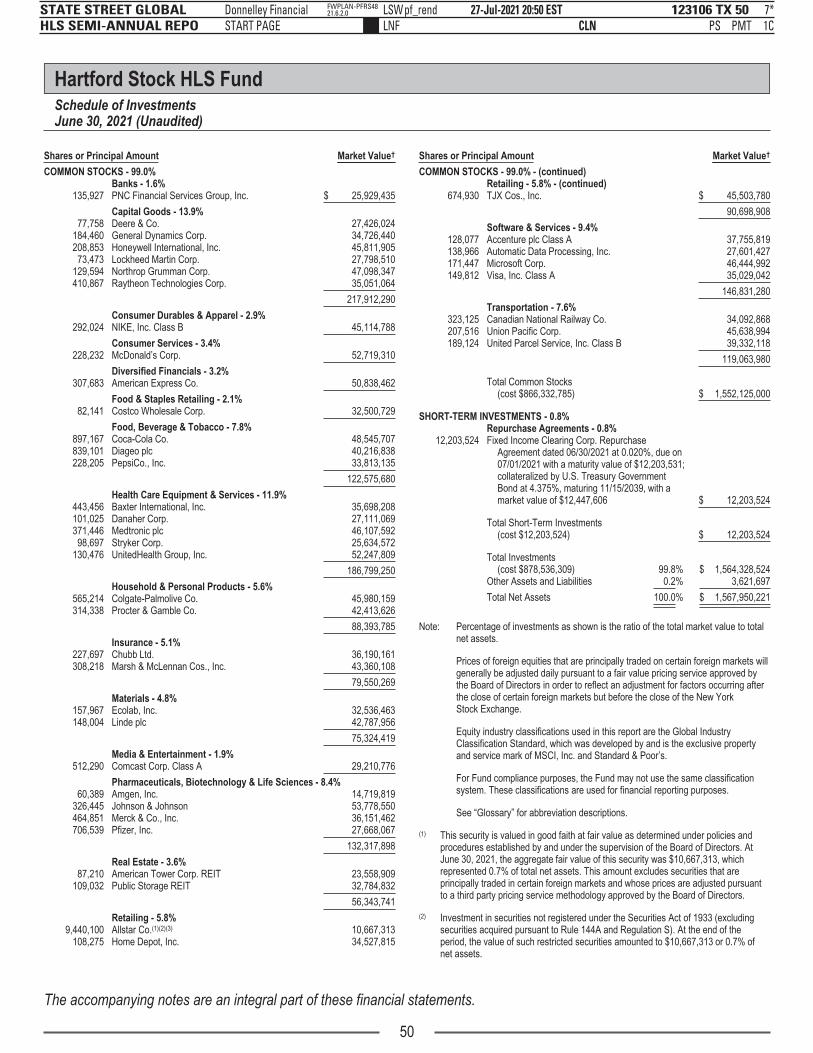
123106 TX 50STATE STREET GLOBAL HLS SEMI-ANNUAL REPO
27-Jul-2021 20:50 ESTCLN PSLNF
Donnelley Financial LSWpf_rendSTART PAGE
7*PMT 1C
FWPLAN-PFRS4821.6.2.0
Hartford Stock HLS FundSchedule of InvestmentsJune 30, 2021 (Unaudited)
Shares or Principal Amount Market Value†
COMMON STOCKS - 99.0%Banks - 1.6%
135,927 PNC Financial Services Group, Inc. $ 25,929,435
Capital Goods - 13.9%77,758 Deere & Co. 27,426,024
184,460 General Dynamics Corp. 34,726,440208,853 Honeywell International, Inc. 45,811,90573,473 Lockheed Martin Corp. 27,798,510
129,594 Northrop Grumman Corp. 47,098,347410,867 Raytheon Technologies Corp. 35,051,064
217,912,290
Consumer Durables & Apparel - 2.9%292,024 NIKE, Inc. Class B 45,114,788
Consumer Services - 3.4%228,232 McDonald’s Corp. 52,719,310
Diversified Financials - 3.2%307,683 American Express Co. 50,838,462
Food & Staples Retailing - 2.1%82,141 Costco Wholesale Corp. 32,500,729
Food, Beverage & Tobacco - 7.8%897,167 Coca-Cola Co. 48,545,707839,101 Diageo plc 40,216,838228,205 PepsiCo., Inc. 33,813,135
122,575,680
Health Care Equipment & Services - 11.9%443,456 Baxter International, Inc. 35,698,208101,025 Danaher Corp. 27,111,069371,446 Medtronic plc 46,107,59298,697 Stryker Corp. 25,634,572
130,476 UnitedHealth Group, Inc. 52,247,809
186,799,250
Household & Personal Products - 5.6%565,214 Colgate-Palmolive Co. 45,980,159314,338 Procter & Gamble Co. 42,413,626
88,393,785
Insurance - 5.1%227,697 Chubb Ltd. 36,190,161308,218 Marsh & McLennan Cos., Inc. 43,360,108
79,550,269
Materials - 4.8%157,967 Ecolab, Inc. 32,536,463148,004 Linde plc 42,787,956
75,324,419
Media & Entertainment - 1.9%512,290 Comcast Corp. Class A 29,210,776
Pharmaceuticals, Biotechnology & Life Sciences - 8.4%60,389 Amgen, Inc. 14,719,819
326,445 Johnson & Johnson 53,778,550464,851 Merck & Co., Inc. 36,151,462706,539 Pfizer, Inc. 27,668,067
132,317,898
Real Estate - 3.6%87,210 American Tower Corp. REIT 23,558,909
109,032 Public Storage REIT 32,784,832
56,343,741
Retailing - 5.8%9,440,100 Allstar Co.(1)(2)(3) 10,667,313
108,275 Home Depot, Inc. 34,527,815
Shares or Principal Amount Market Value†
COMMON STOCKS - 99.0% - (continued)Retailing - 5.8% - (continued)
674,930 TJX Cos., Inc. $ 45,503,780
90,698,908
Software & Services - 9.4%128,077 Accenture plc Class A 37,755,819138,966 Automatic Data Processing, Inc. 27,601,427171,447 Microsoft Corp. 46,444,992149,812 Visa, Inc. Class A 35,029,042
146,831,280
Transportation - 7.6%323,125 Canadian National Railway Co. 34,092,868207,516 Union Pacific Corp. 45,638,994189,124 United Parcel Service, Inc. Class B 39,332,118
119,063,980
Total Common Stocks(cost $866,332,785) $ 1,552,125,000
SHORT-TERM INVESTMENTS - 0.8%Repurchase Agreements - 0.8%
12,203,524 Fixed Income Clearing Corp. RepurchaseAgreement dated 06/30/2021 at 0.020%, due on07/01/2021 with a maturity value of $12,203,531;collateralized by U.S. Treasury GovernmentBond at 4.375%, maturing 11/15/2039, with amarket value of $12,447,606 $ 12,203,524
Total Short-Term Investments(cost $12,203,524) $ 12,203,524
Total Investments(cost $878,536,309) 99.8% $ 1,564,328,524
Other Assets and Liabilities 0.2% 3,621,697
Total Net Assets 100.0% $ 1,567,950,221
Note: Percentage of investments as shown is the ratio of the total market value to totalnet assets.
Prices of foreign equities that are principally traded on certain foreign markets willgenerally be adjusted daily pursuant to a fair value pricing service approved bythe Board of Directors in order to reflect an adjustment for factors occurring afterthe close of certain foreign markets but before the close of the New YorkStock Exchange.
Equity industry classifications used in this report are the Global IndustryClassification Standard, which was developed by and is the exclusive propertyand service mark of MSCI, Inc. and Standard & Poor’s.
For Fund compliance purposes, the Fund may not use the same classificationsystem. These classifications are used for financial reporting purposes.
See “Glossary” for abbreviation descriptions.
(1) This security is valued in good faith at fair value as determined under policies andprocedures established by and under the supervision of the Board of Directors. AtJune 30, 2021, the aggregate fair value of this security was $10,667,313, whichrepresented 0.7% of total net assets. This amount excludes securities that areprincipally traded in certain foreign markets and whose prices are adjusted pursuantto a third party pricing service methodology approved by the Board of Directors.
(2) Investment in securities not registered under the Securities Act of 1933 (excludingsecurities acquired pursuant to Rule 144A and Regulation S). At the end of theperiod, the value of such restricted securities amounted to $10,667,313 or 0.7% ofnet assets.
The accompanying notes are an integral part of these financial statements.
50

123106 TX 51STATE STREET GLOBAL HLS SEMI-ANNUAL REPO
27-Jul-2021 20:50 ESTCLN PSLNF
Donnelley Financial LSWpf_rendNone
4*PMT 1C
FWPLAN-PFRS4821.6.2.0
Hartford Stock HLS FundSchedule of Investments – (continued)June 30, 2021 (Unaudited)
PeriodAcquired Security Name
Shares/Par Value Total Cost Market Value
08/2011 Allstar Co. 9,440,100 $ — $ 10,667,313
(3) Affiliated company – The Fund owns greater than 5% of the outstanding votingsecurities of this issuer.
† See Significant Accounting Policies of accompanying Notes to Financial Statementsregarding valuation of investments.
Fair Value SummaryThe following is a summary of the fair valuations according to the inputs used as of June 30, 2021 in valuing the Fund’s investments.
Description Total Level 1 Level 2 Level 3(1)
AssetsCommon Stocks
Banks $ 25,929,435 $ 25,929,435 $ — $ —Capital Goods 217,912,290 217,912,290 — —Consumer Durables & Apparel 45,114,788 45,114,788 — —Consumer Services 52,719,310 52,719,310 — —Diversified Financials 50,838,462 50,838,462 — —Food & Staples Retailing 32,500,729 32,500,729 — —Food, Beverage & Tobacco 122,575,680 82,358,842 40,216,838 —Health Care Equipment & Services 186,799,250 186,799,250 — —Household & Personal Products 88,393,785 88,393,785 — —Insurance 79,550,269 79,550,269 — —Materials 75,324,419 75,324,419 — —Media & Entertainment 29,210,776 29,210,776 — —Pharmaceuticals, Biotechnology & Life Sciences 132,317,898 132,317,898 — —Real Estate 56,343,741 56,343,741 — —Retailing 90,698,908 80,031,595 10,667,313 —Software & Services 146,831,280 146,831,280 — —Transportation 119,063,980 119,063,980 — —
Short-Term Investments 12,203,524 — 12,203,524 —
Total $ 1,564,328,524 $ 1,501,240,849 $ 63,087,675 $ —
(1) For the six-month period ended June 30, 2021, there were no transfers in and out of Level 3.
The accompanying notes are an integral part of these financial statements.
51
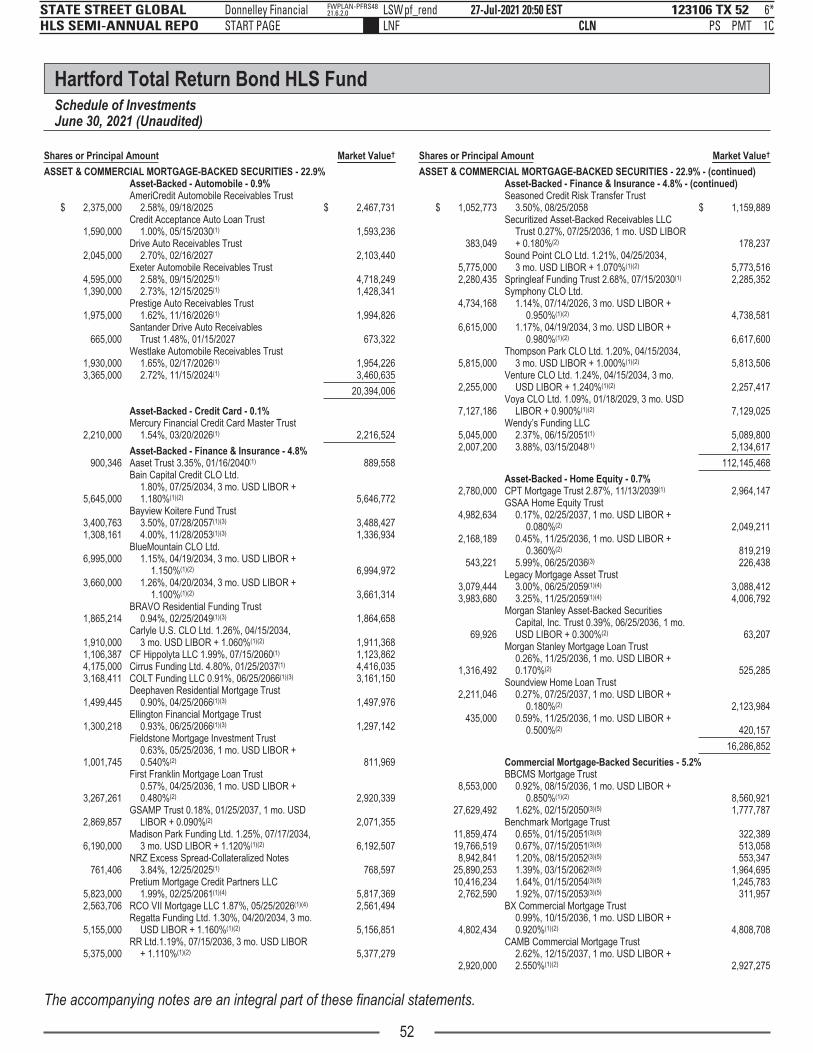
p
123106 TX 52STATE STREET GLOBAL HLS SEMI-ANNUAL REPO
27-Jul-2021 20:50 ESTCLN PSLNF
Donnelley Financial LSWpf_rendSTART PAGE
6*PMT 1C
FWPLAN-PFRS4821.6.2.0
Hartford Total Return Bond HLS FundSchedule of InvestmentsJune 30, 2021 (Unaudited)
Shares or Principal Amount Market Value†
ASSET & COMMERCIAL MORTGAGE-BACKED SECURITIES - 22.9%Asset-Backed - Automobile - 0.9%
$ 2,375,000AmeriCredit Automobile Receivables Trust
2.58%, 09/18/2025 $ 2,467,731
1,590,000Credit Acceptance Auto Loan Trust
1.00%, 05/15/2030(1) 1,593,236
2,045,000Drive Auto Receivables Trust
2.70%, 02/16/2027 2,103,440Exeter Automobile Receivables Trust
4,595,000 2.58%, 09/15/2025(1) 4,718,2491,390,000 2.73%, 12/15/2025(1) 1,428,341
1,975,000Prestige Auto Receivables Trust
1.62%, 11/16/2026(1) 1,994,826
665,000Santander Drive Auto Receivables
Trust 1.48%, 01/15/2027 673,322Westlake Automobile Receivables Trust
1,930,000 1.65%, 02/17/2026(1) 1,954,2263,365,000 2.72%, 11/15/2024(1) 3,460,635
20,394,006
Asset-Backed - Credit Card - 0.1%
2,210,000Mercury Financial Credit Card Master Trust
1.54%, 03/20/2026(1) 2,216,524
Asset-Backed - Finance & Insurance - 4.8%900,346 Aaset Trust 3.35%, 01/16/2040(1) 889,558
5,645,000
Bain Capital Credit CLO Ltd.1.80%, 07/25/2034, 3 mo. USD LIBOR +1.180%(1)(2) 5,646,772
Bayview Koitere Fund Trust3,400,763 3.50%, 07/28/2057(1)(3) 3,488,4271,308,161 4.00%, 11/28/2053(1)(3) 1,336,934
BlueMountain CLO Ltd.6,995,000 1.15%, 04/19/2034, 3 mo. USD LIBOR +
1.150%(1)(2) 6,994,9723,660,000 1.26%, 04/20/2034, 3 mo. USD LIBOR +
1.100%(1)(2) 3,661,314
1,865,214BRAVO Residential Funding Trust
0.94%, 02/25/2049(1)(3) 1,864,658
1,910,000Carlyle U.S. CLO Ltd. 1.26%, 04/15/2034,
3 mo. USD LIBOR + 1.060%(1)(2) 1,911,3681,106,387 CF Hippolyta LLC 1.99%, 07/15/2060(1) 1,123,8624,175,000 Cirrus Funding Ltd. 4.80%, 01/25/2037(1) 4,416,0353,168,411 COLT Funding LLC 0.91%, 06/25/2066(1)(3) 3,161,150
1,499,445Deephaven Residential Mortgage Trust
0.90%, 04/25/2066(1)(3) 1,497,976
1,300,218Ellington Financial Mortgage Trust
0.93%, 06/25/2066(1)(3) 1,297,142
1,001,745
Fieldstone Mortgage Investment Trust0.63%, 05/25/2036, 1 mo. USD LIBOR +0.540%(2) 811,969
3,267,261
First Franklin Mortgage Loan Trust0.57%, 04/25/2036, 1 mo. USD LIBOR +0.480%(2) 2,920,339
2,869,857GSAMP Trust 0.18%, 01/25/2037, 1 mo. USD
LIBOR + 0.090%(2) 2,071,355
6,190,000Madison Park Funding Ltd. 1.25%, 07/17/2034,
3 mo. USD LIBOR + 1.120%(1)(2) 6,192,507
761,406NRZ Excess Spread-Collateralized Notes
3.84%, 12/25/2025(1) 768,597
5,823,000Pretium Mortgage Credit Partners LLC
1.99%, 02/25/2061(1)(4) 5,817,3692,563,706 RCO VII Mortgage LLC 1.87%, 05/25/2026(1)(4) 2,561,494
5,155,000Regatta Funding Ltd. 1.30%, 04/20/2034, 3 mo.
USD LIBOR + 1.160%(1)(2) 5,156,851
5,375,000RR Ltd.1.19%, 07/15/2036, 3 mo. USD LIBOR
+ 1.110%(1)(2) 5,377,279
Shares or Principal Amount Market Value†
ASSET & COMMERCIAL MORTGAGE-BACKED SECURITIES - 22.9% - (continued)Asset-Backed - Finance & Insurance - 4.8% - (continued)
$ 1,052,773Seasoned Credit Risk Transfer Trust
3.50%, 08/25/2058 $ 1,159,889
383,049
Securitized Asset-Backed Receivables LLCTrust 0.27%, 07/25/2036, 1 mo. USD LIBOR+ 0.180%(2) 178,237
5,775,000Sound Point CLO Ltd. 1.21%, 04/25/2034,
3 mo. USD LIBOR + 1.070%(1)(2) 5,773,5162,280,435 Springleaf Funding Trust 2.68%, 07/15/2030(1) 2,285,352
Symphony CLO Ltd.4,734,168 1.14%, 07/14/2026, 3 mo. USD LIBOR +
0.950%(1)(2) 4,738,5816,615,000 1.17%, 04/19/2034, 3 mo. USD LIBOR +
0.980%(1)(2) 6,617,600
5,815,000Thompson Park CLO Ltd. 1.20%, 04/15/2034,
3 mo. USD LIBOR + 1.000%(1)(2) 5,813,506
2,255,000Venture CLO Ltd. 1.24%, 04/15/2034, 3 mo.
USD LIBOR + 1.240%(1)(2) 2,257,417
7,127,186Voya CLO Ltd. 1.09%, 01/18/2029, 3 mo. USD
LIBOR + 0.900%(1)(2) 7,129,025Wendy’s Funding LLC
5,045,000 2.37%, 06/15/2051(1) 5,089,8002,007,200 3.88%, 03/15/2048(1) 2,134,617
112,145,468
Asset-Backed - Home Equity - 0.7%2,780,000 CPT Mortgage Trust 2.87%, 11/13/2039(1) 2,964,147
GSAA Home Equity Trust4,982,634 0.17%, 02/25/2037, 1 mo. USD LIBOR +
0.080%(2) 2,049,2112,168,189 0.45%, 11/25/2036, 1 mo. USD LIBOR +
0.360%(2) 819,219543,221 5.99%, 06/25/2036(3) 226,438
Legacy Mortgage Asset Trust3,079,444 3.00%, 06/25/2059(1)(4) 3,088,4123,983,680 3.25%, 11/25/2059(1)(4) 4,006,792
69,926
Morgan Stanley Asset-Backed SecuritiesCapital, Inc. Trust 0.39%, 06/25/2036, 1 mo.USD LIBOR + 0.300%(2) 63,207
1,316,492
Morgan Stanley Mortgage Loan Trust0.26%, 11/25/2036, 1 mo. USD LIBOR +0.170%(2) 525,285
Soundview Home Loan Trust2,211,046 0.27%, 07/25/2037, 1 mo. USD LIBOR +
0.180%(2) 2,123,984435,000 0.59%, 11/25/2036, 1 mo. USD LIBOR +
0.500%(2) 420,157
16,286,852
Commercial Mortgage-Backed Securities - 5.2%BBCMS Mortgage Trust
8,553,000 0.92%, 08/15/2036, 1 mo. USD LIBOR +0.850%(1)(2) 8,560,921
27,629,492 1.62%, 02/15/2050(3)(5) 1,777,787Benchmark Mortgage Trust
11,859,474 0.65%, 01/15/2051(3)(5) 322,38919,766,519 0.67%, 07/15/2051(3)(5) 513,0588,942,841 1.20%, 08/15/2052(3)(5) 553,347
25,890,253 1.39%, 03/15/2062(3)(5) 1,964,69510,416,234 1.64%, 01/15/2054(3)(5) 1,245,7832,762,590 1.92%, 07/15/2053(3)(5) 311,957
4,802,434
BX Commercial Mortgage Trust0.99%, 10/15/2036, 1 mo. USD LIBOR +0.920%(1)(2) 4,808,708
2,920,000
CAMB Commercial Mortgage Trust2.62%, 12/15/2037, 1 mo. USD LIBOR +2.550%(1)(2) 2,927,275
The accompanying notes are an integral part of these financial statements.
52

g p
123106 TX 53STATE STREET GLOBAL HLS SEMI-ANNUAL REPO
27-Jul-2021 20:51 ESTCLN PSLNF
Donnelley Financial LSWpf_rendNone
4*PMT 1C
FWPLAN-PFRS4821.6.2.0
Hartford Total Return Bond HLS FundSchedule of Investments – (continued)June 30, 2021 (Unaudited)
Shares or Principal Amount Market Value†
ASSET & COMMERCIAL MORTGAGE-BACKED SECURITIES - 22.9% - (continued)Commercial Mortgage-Backed Securities - 5.2% - (continued)
$ 3,855,000CD Commercial Mortgage Trust
2.46%, 08/10/2049 $ 3,994,839Citigroup Commercial Mortgage Trust
17,723,292 1.07%, 07/10/2047(3)(5) 430,36621,269,984 1.17%, 04/10/2048(3)(5) 719,1592,357,000 4.26%, 11/15/2049(3) 2,461,323
1,541,530Citigroup Mortgage Loan Trust
3.23%, 11/25/2070(1)(4) 1,546,005Commercial Mortgage Trust
6,939,038 0.72%, 02/10/2047(3)(5) 88,8933,211,988 0.88%, 08/10/2046(3)(5) 43,9154,096,836 0.97%, 10/15/2034, 1 mo. USD LIBOR +
0.900%(1)(2) 4,099,283948,544 2.82%, 10/15/2045 963,915
1,659,863 2.85%, 10/15/2045 1,697,7071,145,000 3.10%, 03/10/2046 1,174,701
568,061 3.21%, 03/10/2046 589,3236,780,000 3.42%, 03/10/2031(1) 7,080,3741,260,000 3.61%, 06/10/2046(3) 1,324,166
291,086 4.02%, 07/10/2045 301,439630,000 4.07%, 02/10/2047(3) 678,809
1,045,000 4.21%, 08/10/2046(3) 1,115,288535,000 4.24%, 02/10/2047(3) 576,863615,085 4.39%, 07/10/2045(3) 653,708
1,920,000 4.75%, 10/15/2045(1)(3) 596,870
31,357Credit Suisse First Boston Mortgage Securities
Corp. 4.88%, 04/15/2037 31,938CSAIL Commercial Mortgage Trust
57,792,485 0.89%, 06/15/2057(3)(5) 1,368,4342,643,124 1.08%, 11/15/2048(3)(5) 87,7857,332,829 2.06%, 01/15/2049(3)(5) 542,7504,281,027 DBJPM Mortgage Trust 1.83%, 09/15/2053(3)(5) 438,391
4,340,000GS Mortgage Securities Corp.
2.95%, 11/05/2034(1) 4,427,600GS Mortgage Securities Trust
43,064,523 0.10%, 07/10/2046(3)(5) 66,0481,326,045 0.63%, 08/10/2044(1)(3)(5) 131,580,166 3.67%, 04/10/2047(1) 79,008
785,121 4.07%, 01/10/2047 840,3882,215,000 5.12%, 04/10/2047(1)(3) 1,322,846
JP Morgan Chase Commercial MortgageSecurities Trust
2,185,000 2.73%, 10/15/2045(1)(3) 1,508,2621,400,000 2.81%, 01/16/2037(1) 1,443,358
604,951 2.84%, 12/15/2047 618,1921,290,924 4.57%, 12/15/2047(1)(3) 966,004
JPMBB Commercial Mortgage Securities Trust17,897,980 0.76%, 09/15/2047(3)(5) 308,8305,146,845 0.79%, 05/15/2048(3)(5) 112,461
855,054 3.36%, 07/15/2045 884,317Morgan Stanley Bank of America Merrill Lynch
Trust10,341,202 1.13%, 12/15/2047(3)(5) 288,4601,470,018 1.16%, 10/15/2048(3)(5) 48,9431,530,000 3.13%, 12/15/2048 1,576,3771,320,000 3.18%, 08/15/2045 1,342,251
795,172 4.26%, 10/15/2046(3) 849,852Morgan Stanley Capital Trust
7,498,524 1.51%, 06/15/2050(3)(5) 431,1001,460,000 5.48%, 07/15/2049(1)(3) 541,635
82,680 5.77%, 10/12/2052(1)(3) 24,804
2,475,000
MTRO Commercial Mortgage Trust1.87%, 12/15/2033, 1 mo. USD LIBOR +1.800%(1)(2) 2,466,601
1,370,000Natixis Commercial Mortgage Securities Trust
2.91%, 10/15/2036(1) 1,374,275
Shares or Principal Amount Market Value†
ASSET & COMMERCIAL MORTGAGE-BACKED SECURITIES - 22.9% - (continued)Commercial Mortgage-Backed Securities - 5.2% - (continued)
$ 791,098Oaktown Re II Ltd. 1.64%, 07/25/2028, 1 mo.
USD LIBOR + 1.550%(1)(2) $ 791,285
2,880,000Preston Ridge Partners Mortgage Trust LLC
1.79%, 06/25/2026(1)(4) 2,876,293
790,000SFAVE Commercial Mortgage Securities Trust
3.87%, 01/05/2043(1)(3) 875,048
5,410,000SG Commercial Mortgage Securities Trust
2.63%, 03/15/2037(1) 5,614,898
4,737,301Stanwich Mortgage Loan Trust
3.48%, 11/16/2024(1)(4) 4,748,005
4,291,776UBS Commercial Mortgage Trust
1.21%, 08/15/2050(3)(5) 210,404UBS-Barclays Commercial Mortgage Trust
790,000 2.85%, 12/10/2045 809,3942,018,986 3.09%, 08/10/2049 2,064,5352,065,000 3.19%, 03/10/2046 2,128,552
775,000 3.24%, 04/10/2046 802,162Wells Fargo Commercial Mortgage Trust
16,081,066 1.23%, 05/15/2048(3)(5) 520,1081,036,612 2.92%, 10/15/2045 1,057,8693,085,000 2.94%, 10/15/2049 3,310,935
430,000 4.28%, 05/15/2048(3) 440,353Wells Fargo N.A.
20,053,795 0.72%, 11/15/2062(3)(5) 873,5299,777,969 0.76%, 11/15/2062(3)(5) 470,440
39,468,370 0.87%, 11/15/2050(3)(5) 1,535,9084,620,713 0.94%, 11/15/2054(3)(5) 192,457
19,742,193 0.96%, 09/15/2062(3)(5) 1,149,93335,450,978 1.00%, 01/15/2063(3)(5) 2,297,26612,758,426 1.05%, 05/15/2062(3)(5) 768,49221,145,934 1.90%, 03/15/2063(3)(5) 2,886,8512,545,000 2.04%, 02/15/2054 2,549,075
WF-RBS Commercial Mortgage Trust255,115 2.88%, 12/15/2045 261,684
1,215,000 3.00%, 08/15/2045 1,237,4441,137,886 3.07%, 03/15/2045 1,170,599
450,000 3.35%, 05/15/2045 467,241655,964 3.72%, 05/15/2047 678,436230,000 4.05%, 03/15/2047 247,495
1,095,000 4.15%, 08/15/2046(3) 1,162,563710,000 5.00%, 06/15/2044(1)(3) 282,494790,000 5.85%, 04/15/2045(1)(3) 802,217
122,397,754
Other Asset-Backed Securities - 3.2%Affirm Asset Securitization Trust
2,263,307 1.90%, 01/15/2025(1) 2,280,792884,079 3.46%, 10/15/2024(1) 895,480
885,000
Arbor Realty Collateralized Loan Obligation Ltd.1.20%, 05/15/2036, 1 mo. USD LIBOR +1.100%(1)(2) 885,556
1,945,000Avant Loans Funding Trust
1.21%, 07/15/2030(1) 1,941,616
2,227,463Bayview Mortgage Fund Trust
3.50%, 01/28/2058(1)(3) 2,250,592Bayview Opportunity Master Fund Trust
1,445,984 3.50%, 01/28/2055(1)(3) 1,482,6771,723,820 3.50%, 06/28/2057(1)(3) 1,762,9152,778,334 4.00%, 10/28/2064(1)(3) 2,836,836
Domino’s Pizza Master Issuer LLC2,320,000 2.66%, 04/25/2051(1) 2,400,8061,431,875 3.67%, 10/25/2049(1) 1,549,1893,193,125 4.12%, 07/25/2048(1) 3,329,823
3,598,264Galaxy CLO Ltd. 0.95%, 11/15/2026, 3 mo.
USD LIBOR + 0.790%(1)(2) 3,596,605
The accompanying notes are an integral part of these financial statements.
53

123106 TX 54STATE STREET GLOBAL HLS SEMI-ANNUAL REPO
27-Jul-2021 20:51 ESTCLN PSLNF
Donnelley Financial LSWpf_rendNone
6*PMT 1C
FWPLAN-PFRS4821.6.2.0
Hartford Total Return Bond HLS FundSchedule of Investments – (continued)June 30, 2021 (Unaudited)
Shares or Principal Amount Market Value†
ASSET & COMMERCIAL MORTGAGE-BACKED SECURITIES - 22.9% - (continued)Other Asset-Backed Securities - 3.2% - (continued)
$ 7,095,000KKR CLO Ltd. 1.40%, 10/15/2030, 3 mo. USD
LIBOR + 1.220%(1)(2) $ 7,127,573
5,322,859Preston Ridge Partners Mortgage Trust LLC
2.95%, 10/25/2025(1)(4) 5,345,234
5,870,000RR LLC 1.23%, 07/15/2035, 3 mo. USD LIBOR
+ 1.150%(1)(2) 5,873,827
511,032Sapphire Aviation Finance Ltd.
3.23%, 03/15/2040(1) 508,365
4,551,625Seasoned Credit Risk Transfer Trust
3.50%, 03/25/2058 4,969,1051,435,000 Summit Issuer LLC 2.29%, 12/20/2050(1) 1,431,443
Towd Point Mortgage Trust2,496,510 0.69%, 02/25/2057, 1 mo. USD LIBOR +
0.600%(1)(2) 2,496,633686,626 2.25%, 04/25/2056(1)(3) 689,12988,251 2.75%, 02/25/2055(1)(3) 88,396
843,424 2.75%, 08/25/2055(1)(3) 850,8353,248,983 2.75%, 10/25/2056(1)(3) 3,298,703
827,251 2.75%, 04/25/2057(1)(3) 838,7742,935,705 2.75%, 06/25/2057(1)(3) 3,018,4231,696,292 2.75%, 07/25/2057(1)(3) 1,729,060
5,775,000Venture CLO Ltd. 1.31%, 04/15/2034, 3 mo.
USD LIBOR + 1.130%(1)(2) 5,775,9761,961,500 VOLT XCI LLC 3.11%, 11/25/2050(1)(4) 1,969,214
4,560,000Wellfleet CLO Ltd. 1.34%, 07/20/2032, 3 mo.
USD LIBOR + 1.170%(1)(2) 4,558,828773,063 Wingstop Funding LLC 2.84%, 12/05/2050(1) 801,960
76,584,365
Whole Loan Collateral CMO - 8.0%Alternative Loan Trust
168,063 0.63%, 01/25/2036, 1 mo. USD LIBOR +0.540%(2) 167,290
787,746 0.73%, 11/25/2035, 1 mo. USD LIBOR +0.640%(2) 702,307
680,349 5.75%, 05/25/2036 429,885Angel Oak Mortgage Trust
3,724,903 0.91%, 01/25/2066(1)(3) 3,776,1432,622,095 0.99%, 04/25/2066(1)(3) 2,635,3393,341,785 0.99%, 04/25/2053(1)(3) 3,341,197
504,061Angel Oak Mortgage Trust LLC
3.63%, 03/25/2049(1)(3) 509,9553,557,379 Arroyo Mortgage Trust 3.35%, 04/25/2049(1)(3) 3,618,463
Bank of America Funding Trust823,042 0.69%, 05/20/2047, 1 mo. USD LIBOR +
0.600%(2) 828,8012,693,776 5.77%, 05/25/2037(3) 2,761,188
108,458 5.85%, 01/25/2037(4) 110,602
667,451BCAP LLC Trust 0.27%, 03/25/2037, 1 mo.
USD LIBOR + 0.180%(2) 654,457
180,352
Bear Stearns Adjustable Rate Mortgage Trust2.41%, 10/25/2035, 12 mo. USD CMT +2.300%(2) 183,802
680,514Bear Stearns Alt-A Trust 0.59%, 01/25/2036,
1 mo. USD LIBOR + 0.500%(2) 853,087
247,349
Bear Stearns Mortgage Funding Trust0.27%, 10/25/2036, 1 mo. USD LIBOR +0.180%(2) 235,056
Bellemeade Re Ltd.404,837 1.19%, 07/25/2029, 1 mo. USD LIBOR +
1.100%(1)(2) 405,349210,576 1.39%, 03/25/2029, 1 mo. USD LIBOR +
1.300%(1)(2) 210,5761,851,116 1.49%, 10/25/2029, 1 mo. USD LIBOR +
1.400%(1)(2) 1,851,116
Shares or Principal Amount Market Value†
ASSET & COMMERCIAL MORTGAGE-BACKED SECURITIES - 22.9% - (continued)Whole Loan Collateral CMO - 8.0% - (continued)CHL Mortgage Pass-Through Trust
$ 344,780 2.76%, 11/20/2035(3) $ 316,8631,476,846 3.04%, 09/25/2047(3) 1,415,7432,330,438 CIM Trust 3.00%, 04/25/2057(1)(3) 2,368,544
4,423,769Colombia Cent CLO Ltd. 1.33%, 10/25/2028,
3 mo. USD LIBOR + 1.150%(1)(2) 4,426,224Connecticut Avenue Securities Trust
678,214 2.09%, 07/25/2039, 1 mo. USD LIBOR +2.000%(1)(2) 680,940
856,732 2.19%, 06/25/2039, 1 mo. USD LIBOR +2.100%(1)(2) 860,171
681,339 2.24%, 09/25/2031, 1 mo. USD LIBOR +2.150%(1)(2) 686,193
1,130,528 2.24%, 11/25/2039, 1 mo. USD LIBOR +2.150%(1)(2) 1,126,116
736,781 2.39%, 08/25/2031, 1 mo. USD LIBOR +2.300%(1)(2) 741,862
1,394,262Credit Suisse First Boston Mortgage Securities
Corp. 5.50%, 06/25/2035 1,279,722CSMC Trust
1,622,744 1.80%, 12/27/2060(1)(3) 1,630,9991,799,021 3.25%, 04/25/2047(1)(3) 1,895,392
1,015,179Eagle RE Ltd. 1.79%, 11/25/2028, 1 mo. USD
LIBOR + 1.700%(1)(2) 1,015,862Fannie Mae Connecticut Avenue Securities
1,386,975 3.64%, 07/25/2029, 1 mo. USD LIBOR +3.550%(2) 1,439,909
2,218,956 4.44%, 05/25/2029, 1 mo. USD LIBOR +4.350%(2) 2,325,945
616,089 4.99%, 11/25/2024, 1 mo. USD LIBOR +4.900%(2) 636,984
412,336 5.79%, 04/25/2028, 1 mo. USD LIBOR +5.700%(2) 436,823
279,207 6.09%, 09/25/2028, 1 mo. USD LIBOR +6.000%(2) 294,662
2,911,087 GCAT Trust 1.04%, 05/25/2066(1)(3) 2,911,087
19,891GMACM Mortgage Loan Trust
3.05%, 04/19/2036(3) 17,381GSR Mortgage Loan Trust
892,345 0.39%, 01/25/2037, 1 mo. USD LIBOR +0.300%(2) 228,696
1,145,506 2.93%, 01/25/2036(3) 1,163,292HarborView Mortgage Loan Trust
780,650 0.28%, 01/19/2038, 1 mo. USD LIBOR +0.190%(2) 748,477
2,703,173 0.33%, 12/19/2036, 1 mo. USD LIBOR +0.240%(2) 2,651,779
905,561Home Re Ltd. 1.69%, 10/25/2028, 1 mo. USD
LIBOR + 1.600%(1)(2) 905,872
933,618IndyMac Index Mortgage Loan Trust
2.93%, 03/25/2036(3) 833,056
161,774JP Morgan Mortgage Trust
3.08%, 04/25/2037(3) 145,155
1,888,562LCM L.P. 1.23%, 10/20/2027, 3 mo. USD
LIBOR + 1.040%(1)(2) 1,888,809Legacy Mortgage Asset Trust
1,636,775 1.75%, 04/25/2061(1)(4) 1,656,3162,033,483 1.75%, 07/25/2061(1)(4) 2,034,148
817,429Lehman XS Trust 0.51%, 07/25/2046, 1 mo.
USD LIBOR + 0.420%(2) 833,385LSTAR Securities Investment Ltd.
4,731,576 1.79%, 03/02/2026, 1 mo. USD LIBOR +1.700%(1)(2) 4,729,570
3,672,956 1.90%, 02/01/2026, 1 mo. USD LIBOR +1.800%(1)(2) 3,672,196
The accompanying notes are an integral part of these financial statements.
54

q p
123106 TX 55STATE STREET GLOBAL HLS SEMI-ANNUAL REPO
27-Jul-2021 20:51 ESTCLN PSLNF
Donnelley Financial LSWpf_rendNone
6*PMT 1C
FWPLAN-PFRS4821.6.2.0
Hartford Total Return Bond HLS FundSchedule of Investments – (continued)June 30, 2021 (Unaudited)
Shares or Principal Amount Market Value†
ASSET & COMMERCIAL MORTGAGE-BACKED SECURITIES - 22.9% - (continued)Whole Loan Collateral CMO - 8.0% - (continued)
$ 1,450,509 2.59%, 04/01/2024, 1 mo. USD LIBOR +1.500%(1)(2) $ 1,443,268
3,379,987 2.59%, 05/01/2024, 1 mo. USD LIBOR +1.500%(1)(2) 3,364,533
257,991MASTR Adjustable Rate Mortgages Trust
2.88%, 11/21/2034(3) 260,5065,380,153 MFA LLC 2.36%, 03/25/2060(1)(4) 5,443,666
MFA Trust703,759 1.01%, 01/26/2065(1)(3) 704,260
2,906,450 1.15%, 04/25/2065(1)(3) 2,943,205
1,419,523
Mortgage Insurance-Linked Notes1.99%, 11/26/2029, 1 mo. USD LIBOR +1.900%(1)(2) 1,419,526
New Residential Mortgage Loan Trust3,069,500 0.84%, 01/25/2048, 1 mo. USD LIBOR +
0.750%(1)(2) 3,075,1942,235,038 0.94%, 09/25/2058(1)(3) 2,244,3272,457,671 1.59%, 06/25/2057, 1 mo. USD LIBOR +
1.500%(1)(2) 2,489,1771,029,988 2.49%, 09/25/2059(1)(3) 1,040,1242,288,102 3.50%, 08/25/2059(1)(3) 2,384,5382,507,720 3.75%, 11/26/2035(1)(3) 2,655,9112,402,877 3.75%, 11/25/2056(1)(3) 2,551,9674,243,302 4.00%, 02/25/2057(1)(3) 4,513,8634,236,658 4.00%, 03/25/2057(1)(3) 4,523,9943,386,567 4.00%, 04/25/2057(1)(3) 3,625,1772,486,120 4.00%, 05/25/2057(1)(3) 2,647,0613,791,178 4.00%, 08/27/2057(1)(3) 4,055,9621,647,273 4.00%, 12/25/2057(1)(3) 1,764,3654,872,362 NMLT Trust 1.19%, 05/25/2056(1)(3) 4,870,988
267,669Oaktown Re III Ltd. 1.49%, 07/25/2029, 1 mo.
USD LIBOR + 1.400%(1)(2) 267,745
3,251,256OZLM Ltd. 1.24%, 04/30/2027, 3 mo. USD
LIBOR + 1.050%(1)(2) 3,251,545
1,411,568
PMT Credit Risk Transfer Trust2.10%, 03/27/2024, 1 mo. USD LIBOR +2.000%(1)(2) 1,408,729
Preston Ridge Partners Mortgage Trust LLC5,689,226 1.87%, 04/25/2026(1)(4) 5,747,8621,029,993 2.36%, 11/25/2025(1)(4) 1,032,4251,345,764 3.50%, 10/25/2024(1)(3) 1,352,921
754,032RBSGC Mortgage Loan Trust
6.25%, 01/25/2037 755,520
564,025Residential Accredit Loans, Inc.
6.00%, 12/25/2035 569,541Seasoned Credit Risk Transfer Trust
2,761,473 2.50%, 08/25/2059 2,880,3721,993,995 3.50%, 11/25/2057 2,185,6385,307,203 3.50%, 07/25/2058 5,837,0384,867,336 3.50%, 10/25/2058 5,319,789
1,790,590Starwood Mortgage Residential Trust
0.94%, 05/25/2065(1)(3) 1,799,050
743,512
Structured Agency Credit Risk Trust1.74%, 04/25/2043, 1 mo. USD LIBOR +1.650%(1)(2) 744,497
2,840,000 Toorak Mortgage Corp. 2.24%, 06/25/2024(1)(4) 2,841,435
5,680,294Towd Point Mortgage Trust
2.92%, 11/30/2060(1)(3) 5,796,581
3,210,198VCAT Asset Securitization LLC
1.74%, 05/25/2051(1)(4) 3,210,9271,055,999 VCAT LLC 2.12%, 03/27/2051(1)(4) 1,056,316
Verus Securitization Trust2,798,475 0.92%, 02/25/2064(1)(3) 2,801,5672,068,695 1.03%, 02/25/2066(1)(3) 2,069,3772,986,384 VOLT XCIV LLC 2.24%, 02/27/2051(1)(4) 2,989,279
Shares or Principal Amount Market Value†
ASSET & COMMERCIAL MORTGAGE-BACKED SECURITIES - 22.9% - (continued)Whole Loan Collateral CMO - 8.0% - (continued)
$ 1,089,638 VOLT XCVIII LLC 2.12%, 04/25/2051(1)(4) $ 1,103,094WaMu Mortgage Pass-Through Certificates Trust
423,353 0.93%, 06/25/2044, 1 mo. USD LIBOR +0.840%(2) 417,569
2,055,355 0.95%, 12/25/2046, 12 mo. USD MTA +0.820%(2) 1,898,150
799,691 2.78%, 06/25/2037(3) 778,149
27,110,243Wells Fargo Commercial Mortgage Trust
1.05%, 09/15/2057(3)(5) 880,503
188,290,017
Total Asset & Commercial Mortgage-BackedSecurities(cost $538,367,651) $ 538,314,986
CORPORATE BONDS - 33.3%Advertising - 0.0%
$ 500,000 Lamar Media Corp. 3.75%, 02/15/2028 $ 508,750
Aerospace/Defense - 0.5%Boeing Co.
1,900,000 5.04%, 05/01/2027 2,193,3271,390,000 5.15%, 05/01/2030 1,647,554
815,000 General Dynamics Corp. 4.25%, 04/01/2040 997,6672,127,000 L3Harris Technologies, Inc. 3.85%, 06/15/2023 2,260,5691,560,000 Northrop Grumman Corp. 5.15%, 05/01/2040 2,048,816
Raytheon Technologies Corp.32,000 3.65%, 08/16/2023(6) 33,954
1,565,000 3.95%, 08/16/2025 1,741,1331,220,000 4.45%, 11/16/2038 1,477,409
155,000 4.63%, 11/16/2048 199,549
12,599,978
Agriculture - 0.5%Altria Group, Inc.
140,000 2.45%, 02/04/2032 135,460405,000 2.63%, 09/16/2026 426,484
1,110,000 3.70%, 02/04/2051 1,055,552BAT Capital Corp.
2,460,000 2.26%, 03/25/2028 2,443,6701,755,000 2.79%, 09/06/2024 1,843,711
3,265,000BAT International Finance plc
1.67%, 03/25/2026 3,264,5911,760,000 Kernel Holding S.A. 6.50%, 10/17/2024(7) 1,881,968
11,051,436
Airlines - 0.0%85,000 United Airlines, Inc. 4.63%, 04/15/2029(1) 87,975
Apparel - 0.0%550,000 Hanesbrands, Inc. 4.88%, 05/15/2026(1) 594,000
Auto Manufacturers - 0.3%General Motors Co.
1,260,000 5.20%, 04/01/2045 1,558,321740,000 6.13%, 10/01/2025 876,329145,000 6.80%, 10/01/2027 182,728
General Motors Financial Co., Inc.265,000 1.25%, 01/08/2026 263,362
4,780,000 1.50%, 06/10/2026 4,757,460
7,638,200
Beverages - 0.7%Anheuser-Busch InBev Worldwide, Inc.
1,607,000 3.75%, 07/15/2042 1,741,795205,000 4.60%, 04/15/2048 250,730710,000 4.75%, 04/15/2058 890,971
3,304,000 5.45%, 01/23/2039 4,360,956
The accompanying notes are an integral part of these financial statements.
55
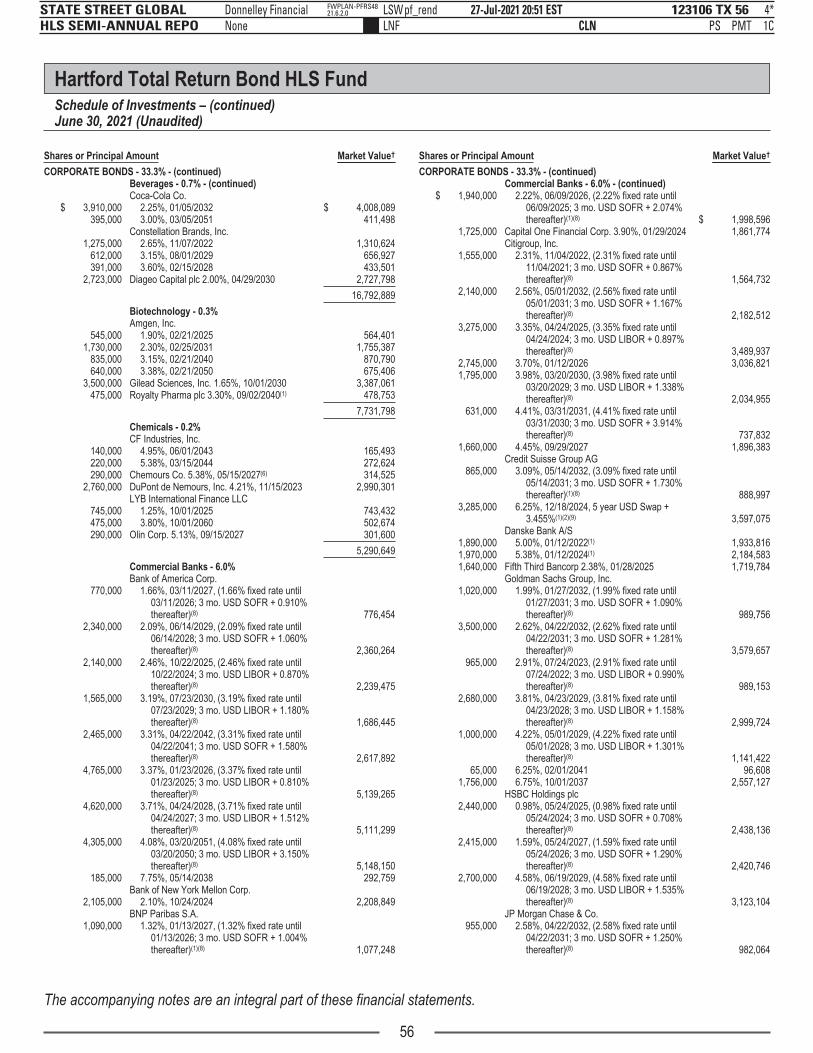
p
123106 TX 56STATE STREET GLOBAL HLS SEMI-ANNUAL REPO
27-Jul-2021 20:51 ESTCLN PSLNF
Donnelley Financial LSWpf_rendNone
4*PMT 1C
FWPLAN-PFRS4821.6.2.0
Hartford Total Return Bond HLS FundSchedule of Investments – (continued)June 30, 2021 (Unaudited)
Shares or Principal Amount Market Value†
CORPORATE BONDS - 33.3% - (continued)Beverages - 0.7% - (continued)Coca-Cola Co.
$ 3,910,000 2.25%, 01/05/2032 $ 4,008,089395,000 3.00%, 03/05/2051 411,498
Constellation Brands, Inc.1,275,000 2.65%, 11/07/2022 1,310,624
612,000 3.15%, 08/01/2029 656,927391,000 3.60%, 02/15/2028 433,501
2,723,000 Diageo Capital plc 2.00%, 04/29/2030 2,727,798
16,792,889
Biotechnology - 0.3%Amgen, Inc.
545,000 1.90%, 02/21/2025 564,4011,730,000 2.30%, 02/25/2031 1,755,387
835,000 3.15%, 02/21/2040 870,790640,000 3.38%, 02/21/2050 675,406
3,500,000 Gilead Sciences, Inc. 1.65%, 10/01/2030 3,387,061475,000 Royalty Pharma plc 3.30%, 09/02/2040(1) 478,753
7,731,798
Chemicals - 0.2%CF Industries, Inc.
140,000 4.95%, 06/01/2043 165,493220,000 5.38%, 03/15/2044 272,624290,000 Chemours Co. 5.38%, 05/15/2027(6) 314,525
2,760,000 DuPont de Nemours, Inc. 4.21%, 11/15/2023 2,990,301LYB International Finance LLC
745,000 1.25%, 10/01/2025 743,432475,000 3.80%, 10/01/2060 502,674290,000 Olin Corp. 5.13%, 09/15/2027 301,600
5,290,649
Commercial Banks - 6.0%Bank of America Corp.
770,000 1.66%, 03/11/2027, (1.66% fixed rate until03/11/2026; 3 mo. USD SOFR + 0.910%thereafter)(8) 776,454
2,340,000 2.09%, 06/14/2029, (2.09% fixed rate until06/14/2028; 3 mo. USD SOFR + 1.060%thereafter)(8) 2,360,264
2,140,000 2.46%, 10/22/2025, (2.46% fixed rate until10/22/2024; 3 mo. USD LIBOR + 0.870%thereafter)(8) 2,239,475
1,565,000 3.19%, 07/23/2030, (3.19% fixed rate until07/23/2029; 3 mo. USD LIBOR + 1.180%thereafter)(8) 1,686,445
2,465,000 3.31%, 04/22/2042, (3.31% fixed rate until04/22/2041; 3 mo. USD SOFR + 1.580%thereafter)(8) 2,617,892
4,765,000 3.37%, 01/23/2026, (3.37% fixed rate until01/23/2025; 3 mo. USD LIBOR + 0.810%thereafter)(8) 5,139,265
4,620,000 3.71%, 04/24/2028, (3.71% fixed rate until04/24/2027; 3 mo. USD LIBOR + 1.512%thereafter)(8) 5,111,299
4,305,000 4.08%, 03/20/2051, (4.08% fixed rate until03/20/2050; 3 mo. USD LIBOR + 3.150%thereafter)(8) 5,148,150
185,000 7.75%, 05/14/2038 292,759
2,105,000Bank of New York Mellon Corp.
2.10%, 10/24/2024 2,208,849BNP Paribas S.A.
1,090,000 1.32%, 01/13/2027, (1.32% fixed rate until01/13/2026; 3 mo. USD SOFR + 1.004%thereafter)(1)(8) 1,077,248
Shares or Principal Amount Market Value†
CORPORATE BONDS - 33.3% - (continued)Commercial Banks - 6.0% - (continued)
$ 1,940,000 2.22%, 06/09/2026, (2.22% fixed rate until06/09/2025; 3 mo. USD SOFR + 2.074%thereafter)(1)(8) $ 1,998,596
1,725,000 Capital One Financial Corp. 3.90%, 01/29/2024 1,861,774Citigroup, Inc.
1,555,000 2.31%, 11/04/2022, (2.31% fixed rate until11/04/2021; 3 mo. USD SOFR + 0.867%thereafter)(8) 1,564,732
2,140,000 2.56%, 05/01/2032, (2.56% fixed rate until05/01/2031; 3 mo. USD SOFR + 1.167%thereafter)(8) 2,182,512
3,275,000 3.35%, 04/24/2025, (3.35% fixed rate until04/24/2024; 3 mo. USD LIBOR + 0.897%thereafter)(8) 3,489,937
2,745,000 3.70%, 01/12/2026 3,036,8211,795,000 3.98%, 03/20/2030, (3.98% fixed rate until
03/20/2029; 3 mo. USD LIBOR + 1.338%thereafter)(8) 2,034,955
631,000 4.41%, 03/31/2031, (4.41% fixed rate until03/31/2030; 3 mo. USD SOFR + 3.914%thereafter)(8) 737,832
1,660,000 4.45%, 09/29/2027 1,896,383Credit Suisse Group AG
865,000 3.09%, 05/14/2032, (3.09% fixed rate until05/14/2031; 3 mo. USD SOFR + 1.730%thereafter)(1)(8) 888,997
3,285,000 6.25%, 12/18/2024, 5 year USD Swap +3.455%(1)(2)(9) 3,597,075
Danske Bank A/S1,890,000 5.00%, 01/12/2022(1) 1,933,8161,970,000 5.38%, 01/12/2024(1) 2,184,5831,640,000 Fifth Third Bancorp 2.38%, 01/28/2025 1,719,784
Goldman Sachs Group, Inc.1,020,000 1.99%, 01/27/2032, (1.99% fixed rate until
01/27/2031; 3 mo. USD SOFR + 1.090%thereafter)(8) 989,756
3,500,000 2.62%, 04/22/2032, (2.62% fixed rate until04/22/2031; 3 mo. USD SOFR + 1.281%thereafter)(8) 3,579,657
965,000 2.91%, 07/24/2023, (2.91% fixed rate until07/24/2022; 3 mo. USD LIBOR + 0.990%thereafter)(8) 989,153
2,680,000 3.81%, 04/23/2029, (3.81% fixed rate until04/23/2028; 3 mo. USD LIBOR + 1.158%thereafter)(8) 2,999,724
1,000,000 4.22%, 05/01/2029, (4.22% fixed rate until05/01/2028; 3 mo. USD LIBOR + 1.301%thereafter)(8) 1,141,422
65,000 6.25%, 02/01/2041 96,6081,756,000 6.75%, 10/01/2037 2,557,127
HSBC Holdings plc2,440,000 0.98%, 05/24/2025, (0.98% fixed rate until
05/24/2024; 3 mo. USD SOFR + 0.708%thereafter)(8) 2,438,136
2,415,000 1.59%, 05/24/2027, (1.59% fixed rate until05/24/2026; 3 mo. USD SOFR + 1.290%thereafter)(8) 2,420,746
2,700,000 4.58%, 06/19/2029, (4.58% fixed rate until06/19/2028; 3 mo. USD LIBOR + 1.535%thereafter)(8) 3,123,104
JP Morgan Chase & Co.955,000 2.58%, 04/22/2032, (2.58% fixed rate until
04/22/2031; 3 mo. USD SOFR + 1.250%thereafter)(8) 982,064
The accompanying notes are an integral part of these financial statements.
56

py
123106 TX 57STATE STREET GLOBAL HLS SEMI-ANNUAL REPO
27-Jul-2021 20:50 ESTCLN PSLNF
Donnelley Financial LSWpf_rendNone
8*PMT 1C
FWPLAN-PFRS6021.6.2.0
Hartford Total Return Bond HLS FundSchedule of Investments – (continued)June 30, 2021 (Unaudited)
Shares or Principal Amount Market Value†
CORPORATE BONDS - 33.3% - (continued)Commercial Banks - 6.0% - (continued)
$ 390,000 2.96%, 05/13/2031, (2.96% fixed rate until05/13/2030; 3 mo. USD SOFR + 2.515%thereafter)(8) $ 410,117
1,735,000 3.11%, 04/22/2041, (3.11% fixed rate until04/22/2040; 3 mo. USD SOFR + 2.460%thereafter)(8) 1,801,645
575,000 3.11%, 04/22/2051, (3.11% fixed rate until04/22/2050; 3 mo. USD SOFR + 2.440%thereafter)(8) 596,610
3,905,000 3.16%, 04/22/2042, (3.16% fixed rate until04/22/2041; 3 mo. USD SOFR + 1.460%thereafter)(8) 4,070,508
2,160,000 3.22%, 03/01/2025, (3.22% fixed rate until03/01/2024; 3 mo. USD LIBOR + 1.155%thereafter)(8) 2,294,943
1,025,000 3.51%, 01/23/2029, (3.51% fixed rate until01/23/2028; 3 mo. USD LIBOR + 0.945%thereafter)(8) 1,129,344
1,655,000 3.70%, 05/06/2030, (3.70% fixed rate until05/06/2029; 3 mo. USD LIBOR + 1.160%thereafter)(8) 1,849,842
1,990,000 3.80%, 07/23/2024, (3.80% fixed rate until07/23/2023; 3 mo. USD LIBOR + 0.890%thereafter)(8) 2,120,153
4,480,000 3.96%, 01/29/2027, (3.96% fixed rate until01/29/2026; 3 mo. USD LIBOR + 1.245%thereafter)(8) 4,990,976
2,230,000 4.01%, 04/23/2029, (4.01% fixed rate until04/23/2028; 3 mo. USD LIBOR + 1.120%thereafter)(8) 2,523,154
930,000 4.02%, 12/05/2024, (4.02% fixed rate until12/05/2023; 3 mo. USD LIBOR + 1.000%thereafter)(8) 1,003,636
Morgan Stanley2,700,000 1.59%, 05/04/2027, (1.59% fixed rate until
05/04/2026; 3 mo. USD SOFR + 0.879%thereafter)(8) 2,717,996
4,595,000 1.79%, 02/13/2032, (1.79% fixed rate until02/13/2031; 3 mo. USD SOFR + 1.034%thereafter)(8) 4,420,160
2,540,000 1.93%, 04/28/2032, (1.93% fixed rate until04/28/2031; 3 mo. USD SOFR + 1.020%thereafter)(8) 2,471,918
155,000 2.70%, 01/22/2031, (2.70% fixed rate until01/22/2030; 3 mo. USD SOFR + 1.143%thereafter)(8) 162,482
100,000 2.75%, 05/19/2022 102,2272,000,000 3.59%, 07/22/2028, (3.59% fixed rate until
07/22/2027; 3 mo. USD LIBOR + 1.340%thereafter)(8) 2,214,673
1,475,000 3.63%, 01/20/2027 1,635,6292,775,000 4.00%, 07/23/2025 3,090,885
600,000 PNC Bank NA 2.70%, 10/22/2029 635,985PNC Financial Services Group, Inc.
835,000 2.20%, 11/01/2024 876,10980,000 2.55%, 01/22/2030 84,238
1,435,000Santander Holdings USA, Inc.
3.70%, 03/28/2022 1,464,606State Street Corp.
150,000 2.35%, 11/01/2025, 3 mo. USD SOFR +0.940%(2) 157,714
1,065,000 2.90%, 03/30/2026, (2.90% fixed rate until03/30/2025; 3 mo. USD SOFR + 2.600%thereafter)(8) 1,137,488
4,725,000 Truist Bank 2.25%, 03/11/2030 4,795,760
Shares or Principal Amount Market Value†
CORPORATE BONDS - 33.3% - (continued)Commercial Banks - 6.0% - (continued)
$ 1,273,000 UBS Group AG 2.65%, 02/01/2022(1) $ 1,290,9562,685,000 UniCredit S.p.A. 6.57%, 01/14/2022(1) 2,767,815
Wells Fargo & Co.2,510,000 2.41%, 10/30/2025, (2.41% fixed rate until
10/30/2024; 3 mo. USD SOFR + 1.087%thereafter)(8) 2,626,891
2,795,000 3.00%, 04/22/2026 3,006,643665,000 3.00%, 10/23/2026 717,479
1,840,000 3.75%, 01/24/2024 1,978,953155,000 4.90%, 11/17/2045 198,719765,000 5.01%, 04/04/2051, (5.01% fixed rate until
04/04/2050; 3 mo. USD SOFR + 4.502%thereafter)(8) 1,048,240
214,000 5.61%, 01/15/2044 292,329
141,790,217
Commercial Services - 1.2%Ashtead Capital, Inc.
1,190,000 4.00%, 05/01/2028(1) 1,258,603200,000 4.13%, 08/15/2025(1) 204,750
5,190,000 4.38%, 08/15/2027(1) 5,436,5251,079,000 Equifax, Inc. 2.60%, 12/15/2025 1,136,014
Gartner, Inc.635,000 3.63%, 06/15/2029(1) 644,525
3,345,000 3.75%, 10/01/2030(1) 3,422,303Howard University (AGM Insured)
1,000,000 2.70%, 10/01/2029 1,018,3601,000,000 2.90%, 10/01/2031 1,035,048
720,000 3.48%, 10/01/2041 736,0894,150,000 IHS Markit Ltd. 4.13%, 08/01/2023 4,429,710
Service Corp. International2,500,000 3.38%, 08/15/2030 2,449,500
385,000 4.63%, 12/15/2027 407,1384,561,000 5.13%, 06/01/2029 4,948,685
315,000United Rentals North America, Inc.
4.00%, 07/15/2030 324,450
27,451,700
Construction Materials - 0.3%2,063,000 Builders FirstSource, Inc. 5.00%, 03/01/2030(1) 2,169,141
Standard Industries, Inc.805,000 3.38%, 01/15/2031(1) 770,554
3,370,000 4.38%, 07/15/2030(1) 3,475,313
6,415,008
Diversified Financial Services - 0.6%4,485,000 BOC Aviation USA Corp. 1.63%, 04/29/2024(1) 4,520,6111,875,000 GE Capital Funding LLC 4.40%, 05/15/2030 2,187,156
845,000GE Capital International Funding Co.
4.42%, 11/15/2035 1,014,2231,000,000 Mastercard, Inc. 2.95%, 03/15/2051 1,045,688
390,000 Navient Corp. 7.25%, 01/25/2022 404,5084,220,000 Power Finance Corp. Ltd. 3.95%, 04/23/2030(1) 4,341,344
13,513,530
Electric - 2.8%1,475,000 Alabama Power Co. 3.45%, 10/01/2049 1,601,973
Berkshire Hathaway Energy Co.705,000 1.65%, 05/15/2031 677,474875,000 3.25%, 04/15/2028 962,405
965,000Centrais Eletricas Brasileiras S.A.
3.63%, 02/04/2025(1) 992,744Cleco Corporate Holdings LLC
1,215,000 3.38%, 09/15/2029 1,255,60275,000 4.97%, 05/01/2046 89,723
1,155,000 Commonwealth Edison Co. 3.65%, 06/15/2046 1,313,990
The accompanying notes are an integral part of these financial statements.
57

gp
123106 TX 58STATE STREET GLOBAL HLS SEMI-ANNUAL REPO
27-Jul-2021 20:50 ESTCLN PSLNF
Donnelley Financial LSWpf_rendNone
6*PMT 1C
FWPLAN-PFRS6021.6.2.0
Hartford Total Return Bond HLS FundSchedule of Investments – (continued)June 30, 2021 (Unaudited)
Shares or Principal Amount Market Value†
CORPORATE BONDS - 33.3% - (continued)Electric - 2.8% - (continued)
$ 415,000Dominion Energy South Carolina, Inc.
5.10%, 06/01/2065 $ 597,257Duke Energy Carolinas LLC
900,000 2.55%, 04/15/2031 935,441575,000 3.45%, 04/15/2051 638,067
1,525,000 4.25%, 12/15/2041 1,851,5213,800,000 Duke Energy Corp. 2.55%, 06/15/2031 3,837,574
Duke Energy Indiana LLC1,675,000 2.75%, 04/01/2050 1,622,251
780,000 3.25%, 10/01/2049 824,480670,000 Duke Energy Progress LLC 4.38%, 03/30/2044 827,326
1,120,000Duquesne Light Holdings, Inc.
2.78%, 01/07/2032(1) 1,129,975Evergy, Inc.
730,000 2.45%, 09/15/2024 766,090715,000 2.90%, 09/15/2029 758,521
2,745,000 Exelon Corp. 3.95%, 06/15/2025 3,021,506FirstEnergy Corp.
285,000 1.60%, 01/15/2026(6) 278,5881,550,000 2.25%, 09/01/2030 1,488,0001,870,000 3.40%, 03/01/2050 1,813,900
820,000 5.35%, 07/15/2047 983,1761,835,000 Georgia Power Co. 4.30%, 03/15/2042 2,164,283
IPALCO Enterprises, Inc.1,465,000 3.70%, 09/01/2024 1,576,3024,275,000 4.25%, 05/01/2030 4,805,8012,030,000 ITC Holdings Corp. 2.95%, 05/14/2030(1) 2,138,705
1,075,000Jersey Central Power & Light Co.
2.75%, 03/01/2032(1) 1,089,797MidAmerican Energy Co.
330,000 3.15%, 04/15/2050 352,759380,000 3.65%, 08/01/2048 433,810
NRG Energy, Inc.1,705,000 2.00%, 12/02/2025(1) 1,730,8401,705,000 2.45%, 12/02/2027(1) 1,717,318
Oglethorpe Power Corp.360,000 3.75%, 08/01/2050 380,128
1,130,000 5.05%, 10/01/2048 1,421,632
565,000Oncor Electric Delivery Co. LLC
5.75%, 03/15/2029 710,4143,780,000 Pacific Gas and Electric Co. 2.50%, 02/01/2031 3,546,699
PacifiCorp306,000 4.13%, 01/15/2049 366,212360,000 4.15%, 02/15/2050 437,761
395,000Public Service Electric & Gas Co.
3.80%, 03/01/2046 464,966
1,820,000Public Service Enterprise Group, Inc.
2.88%, 06/15/2024 1,930,0022,070,000 Puget Energy, Inc. 3.65%, 05/15/2025 2,228,122
205,000 Sempra Energy 4.00%, 02/01/2048 230,115Southern California Edison Co.
675,000 2.25%, 06/01/2030 664,2741,950,000 2.85%, 08/01/2029 2,024,741
235,000 3.65%, 02/01/2050 235,206511,000 4.00%, 04/01/2047 537,900
Southern Co.625,000 2.95%, 07/01/2023 652,037
2,860,000 3.70%, 04/30/2030 3,157,317
2,385,000Zorlu Yenilenebilir Enerji AS
9.00%, 06/01/2026(1) 2,378,265
65,642,990
Energy - Alternate Sources - 0.1%1,085,000 FS Luxembourg S.a.r.l. 10.00%, 12/15/2025(1) 1,213,855
Shares or Principal Amount Market Value†
CORPORATE BONDS - 33.3% - (continued)Energy - Alternate Sources - 0.1% - (continued)
$ 845,000Investment Energy Resources Ltd.
6.25%, 04/26/2029(1) $ 913,656
2,127,511
Engineering & Construction - 0.1%
3,242,471International Airport Finance S.A.
12.00%, 03/15/2033(1)(6) 3,416,754
Entertainment - 0.2%
1,025,000GLP Capital L.P. / GLP Financing II, Inc.
5.30%, 01/15/2029 1,194,1254,525,000 WMG Acquisition Corp. 3.88%, 07/15/2030(1) 4,569,797
5,763,922
Environmental Control - 0.3%Clean Harbors, Inc.
5,434,000 4.88%, 07/15/2027(1) 5,692,115116,000 5.13%, 07/15/2029(1) 126,150660,000 Waste Management, Inc. 2.00%, 06/01/2029 667,445
6,485,710
Food - 0.3%Conagra Brands, Inc.
615,000 4.30%, 05/01/2024 674,594411,000 4.85%, 11/01/2028 489,696335,000 5.40%, 11/01/2048 450,015
1,325,000 Kellogg Co. 3.40%, 11/15/2027 1,456,60895,000 Kraft Heinz Foods Co. 4.25%, 03/01/2031 108,034
3,070,000 NBM U.S. Holdings, Inc. 7.00%, 05/14/2026(1) 3,309,491
6,488,438
Food Service - 0.0%160,000 Aramark Services, Inc. 5.00%, 02/01/2028(1) 167,200
Forest Products & Paper - 0.4%Suzano Austria GmbH
3,760,000 3.13%, 01/15/2032 3,719,2044,120,000 5.00%, 01/15/2030 4,667,960
8,387,164
Gas - 0.3%AmeriGas Partners L.P. / AmeriGas Finance Corp.
70,000 5.63%, 05/20/2024 76,475375,000 5.88%, 08/20/2026 419,659
NiSource, Inc.1,750,000 3.49%, 05/15/2027 1,925,7731,005,000 3.60%, 05/01/2030 1,113,863
Sempra Energy1,615,000 3.40%, 02/01/2028 1,775,967
720,000 3.80%, 02/01/2038 800,006
6,111,743
Healthcare - Products - 0.5%Alcon Finance Corp.
1,164,000 2.75%, 09/23/2026(1) 1,232,3891,145,000 3.00%, 09/23/2029(1) 1,206,228
940,000 Baxter International, Inc. 3.95%, 04/01/2030 1,083,032Boston Scientific Corp.
1,030,000 1.90%, 06/01/2025 1,062,4752,880,000 3.75%, 03/01/2026 3,194,579
690,000 Hill-Rom Holdings, Inc. 4.38%, 09/15/2027(1) 714,1503,790,000 Hologic, Inc. 4.63%, 02/01/2028(1) 3,979,500
250,000 Teleflex, Inc. 4.25%, 06/01/2028(1) 260,625
12,732,978
Healthcare - Services - 1.1%1,335,000 Anthem, Inc. 3.50%, 08/15/2024 1,438,037
The accompanying notes are an integral part of these financial statements.
58

p p
123106 TX 59STATE STREET GLOBAL HLS SEMI-ANNUAL REPO
27-Jul-2021 20:50 ESTCLN PSLNF
Donnelley Financial LSWpf_rendNone
9*PMT 1C
FWPLAN-PFRS6021.6.2.0
Hartford Total Return Bond HLS FundSchedule of Investments – (continued)June 30, 2021 (Unaudited)
Shares or Principal Amount Market Value†
CORPORATE BONDS - 33.3% - (continued)Healthcare-Services - 1.1% - (continued)Centene Corp.
$ 95,000 3.38%, 02/15/2030 $ 99,275435,000 4.25%, 12/15/2027 458,381
5,230,000 4.63%, 12/15/2029 5,751,797360,000 CommonSpirit Health 3.35%, 10/01/2029 390,251
HCA, Inc.3,550,000 2.38%, 07/15/2031 3,520,368
710,000 3.50%, 09/01/2030 756,413Kaiser Foundation Hospitals
865,000 2.81%, 06/01/2041 883,1131,430,000 3.00%, 06/01/2051 1,477,1125,265,000 Rede D’or Finance S.a.r.l. 4.50%, 01/22/2030(1) 5,396,625
990,000 Sutter Health 3.36%, 08/15/2050 1,051,501UnitedHealth Group, Inc.
1,420,000 2.38%, 08/15/2024 1,493,9221,600,000 2.75%, 05/15/2040 1,621,600
830,000 3.50%, 08/15/2039 928,961405,000 4.75%, 07/15/2045 530,892
25,798,248
Home Builders - 0.2%2,465,000 PulteGroup, Inc. 5.50%, 03/01/2026 2,877,887
575,000 Toll Brothers Finance Corp. 4.88%, 11/15/2025 645,360
3,523,247
Insurance - 1.1%
4,045,000American International Group, Inc.
2.50%, 06/30/2025 4,270,0201,515,000 Aon Corp. 2.20%, 11/15/2022 1,551,9975,440,000 Brighthouse Financial, Inc. 5.63%, 05/15/2030 6,625,347
3,390,000Equitable Financial Life Global Funding
1.80%, 03/08/2028(1) 3,375,350Genworth Holdings, Inc.
20,000 4.80%, 02/15/2024 20,000380,000 4.90%, 08/15/2023 380,950
Marsh & McLennan Cos., Inc.925,000 3.88%, 03/15/2024 1,003,363
1,300,000 4.75%, 03/15/2039 1,661,301
415,000Massachusetts Mutual Life Insurance Co.
3.73%, 10/15/2070(1) 440,620345,000 MGIC Investment Corp. 5.75%, 08/15/2023 371,860
2,600,000New York Life Global Funding
2.00%, 01/22/2025(1) 2,696,0191,250,000 Progressive Corp. 3.20%, 03/26/2030 1,373,858
Unum Group640,000 4.00%, 06/15/2029 719,056
1,215,000 4.50%, 12/15/2049 1,289,20635,000 Voya Financial, Inc. 4.80%, 06/15/2046 44,343
1,035,000 Willis North America, Inc. 3.60%, 05/15/2024 1,111,899
26,935,189
Internet - 0.8%2,175,000 Alibaba Group Holding Ltd. 3.40%, 12/06/2027 2,378,5111,795,000 Amazon.com, Inc. 3.88%, 08/22/2037 2,142,143
Go Daddy Operating Co. LLC240,000 3.50%, 03/01/2029(1) 238,440
3,190,000 5.25%, 12/01/2027(1) 3,349,5004,490,000 NortonLifeLock, Inc. 5.00%, 04/15/2025(1) 4,552,725
Tencent Holdings Ltd.800,000 2.39%, 06/03/2030(1) 797,881240,000 2.88%, 04/22/2031(1) 248,429
1,210,000 3.60%, 01/19/2028(1) 1,324,9421,140,000 3.84%, 04/22/2051(1) 1,228,3151,840,000 3.98%, 04/11/2029(1) 2,052,722
18,313,608
Shares or Principal Amount Market Value†
CORPORATE BONDS - 33.3% - (continued)Iron/Steel - 0.2%
$ 285,000 Commercial Metals Co. 5.38%, 07/15/2027 $ 301,388EUR 1,755,000 Metinvest B.V. 5.63%, 06/17/2025(1) 2,199,841
$ 1,115,000 Vale Overseas Ltd. 3.75%, 07/08/2030 1,187,140
3,688,369
IT Services - 0.7%3,215,000 Apple, Inc. 2.20%, 09/11/2029 3,349,996
Apple, Inc.490,000 2.65%, 05/11/2050 481,521885,000 3.45%, 02/09/2045 989,160125,000 3.85%, 05/04/2043 148,692
6,750,000 Booz Allen Hamilton, Inc. 3.88%, 09/01/2028(1) 6,885,000HP, Inc.
1,115,000 2.20%, 06/17/2025 1,157,7061,260,000 3.00%, 06/17/2027 1,350,017
International Business Machines Corp.895,000 1.95%, 05/15/2030 893,991560,000 3.50%, 05/15/2029 627,139470,000 4.25%, 05/15/2049 580,813
1,070,000 Leidos, Inc. 3.63%, 05/15/2025 1,162,769
17,626,804
Lodging - 0.0%975,000 Las Vegas Sands Corp. 3.50%, 08/18/2026 1,037,891
Machinery - Diversified - 0.1%65,000 BWX Technologies, Inc. 4.13%, 04/15/2029(1) 66,138
2,405,000 Otis Worldwide Corp. 2.57%, 02/15/2030 2,493,267
2,559,405
Media - 1.8%CCO Holdings LLC / CCO Holdings Capital
Corp.980,000 4.25%, 02/01/2031(1) 998,375502,000 4.50%, 08/15/2030(1) 523,335150,000 5.13%, 05/01/2027(1) 157,33572,000 5.75%, 02/15/2026(1) 74,416
Charter Communications Operating LLC /Charter Communications Operating Capital
300,000 2.30%, 02/01/2032 288,6321,245,000 5.13%, 07/01/2049 1,483,6964,055,000 6.48%, 10/23/2045 5,587,855
380,000 6.83%, 10/23/2055 559,454Comcast Corp.
490,000 3.20%, 07/15/2036 525,9901,765,000 3.25%, 11/01/2039 1,879,570
785,000 4.75%, 03/01/2044 1,001,457445,000 4.95%, 10/15/2058 615,884
Cox Communications, Inc.1,495,000 2.60%, 06/15/2031(1) 1,519,1691,361,000 3.15%, 08/15/2024(1) 1,451,987
CSC Holdings LLC4,740,000 3.38%, 02/15/2031(1) 4,478,873
400,000 4.13%, 12/01/2030(1) 397,500430,000 5.50%, 04/15/2027(1) 451,522
Discovery Communications LLC840,000 3.80%, 03/13/2024 900,91919,000 3.95%, 06/15/2025 20,847
1,970,000 4.00%, 09/15/2055 2,086,783826,000 5.30%, 05/15/2049 1,045,361555,000 DISH DBS Corp. 5.88%, 11/15/2024 595,931
1,500,000 NBCUniversal Media LLC 5.95%, 04/01/2041 2,162,687280,000 Sirius XM Radio, Inc. 4.13%, 07/01/2030(1) 283,500
1,495,000 Time Warner Cable LLC 6.55%, 05/01/2037 2,037,972
3,900,000Time Warner Entertainment Co., L.P.
8.38%, 07/15/2033 5,916,213
The accompanying notes are an integral part of these financial statements.
59

123106 TX 60STATE STREET GLOBAL HLS SEMI-ANNUAL REPO
27-Jul-2021 20:50 ESTCLN PSLNF
Donnelley Financial LSWpf_rendNone
6*PMT 1C
FWPLAN-PFRS6021.6.2.0
Hartford Total Return Bond HLS FundSchedule of Investments – (continued)June 30, 2021 (Unaudited)
Shares or Principal Amount Market Value†
CORPORATE BONDS - 33.3% - (continued)Media - 1.8% - (continued)ViacomCBS, Inc.
$ 685,000 4.20%, 05/19/2032 $ 791,4902,360,000 4.95%, 01/15/2031 2,847,621
55,000 5.88%, 02/28/2057, (5.88% fixed rate until02/28/2022; 3 mo. USD LIBOR + 3.895%thereafter)(8) 55,974
79,000 6.25%, 02/28/2057, (6.25% fixed rate until02/28/2027; 3 mo. USD LIBOR + 3.899%thereafter)(8) 90,461
550,000 Videotron Ltd. 5.38%, 06/15/2024(1) 602,250
41,433,059
Mining - 0.1%Anglo American Capital plc
475,000 4.88%, 05/14/2025(1) 537,843315,000 5.63%, 04/01/2030(1) 385,773280,000 Kaiser Aluminum Corp. 4.63%, 03/01/2028(1) 289,276
1,212,892
Miscellaneous Manufacturing - 0.0%
340,000Trane Technologies Luxembourg Finance S.A.
4.50%, 03/21/2049 427,294
Office/Business Equipment - 0.3%CDW LLC / CDW Finance Corp.
5,740,000 3.25%, 02/15/2029 5,811,750280,000 4.25%, 04/01/2028 294,000280,000 Xerox Holdings Corp. 5.50%, 08/15/2028(1) 290,917
6,396,667
Oil & Gas - 1.3%270,000 Apache Corp. 4.88%, 11/15/2027 292,407
BP Capital Markets America, Inc.720,000 2.94%, 06/04/2051 692,348490,000 3.06%, 06/17/2041 495,174910,000 3.38%, 02/08/2061 915,706
1,760,000 3.63%, 04/06/2030 1,975,363
220,000Continental Resources, Inc.
5.75%, 01/15/2031(1) 263,516Energean Israel Finance Ltd.
860,000 4.50%, 03/30/2024(1)(7) 878,275735,000 4.88%, 03/30/2026(1)(7) 752,471695,000 5.88%, 03/30/2031(1)(7) 713,765
Equinor ASA1,400,000 1.75%, 01/22/2026 1,442,263
675,000 3.63%, 04/06/2040 770,242850,000 3.70%, 04/06/2050 977,613
1,530,000 Exxon Mobil Corp. 4.23%, 03/19/2040 1,828,391Hess Corp.
942,000 7.13%, 03/15/2033 1,278,418860,000 7.30%, 08/15/2031 1,167,215
2,045,000 Leviathan Bond Ltd. 6.50%, 06/30/2027(1)(7) 2,269,950Lundin Energy Finance B.V.
775,000 2.00%, 07/15/2026(1) 776,9412,470,000 3.10%, 07/15/2031(1) 2,497,8702,245,000 Marathon Petroleum Corp. 4.70%, 05/01/2025 2,532,713
Occidental Petroleum Corp.5,000 3.20%, 08/15/2026 5,038
10,000 3.40%, 04/15/2026 10,2255,000 3.50%, 08/15/2029 5,000
26,000 6.13%, 01/01/2031 30,51810,000 Occidental Petroleum Corp. 6.38%, 09/01/2028 11,675
Ovintiv, Inc.51,000 6.50%, 08/15/2034 67,32650,000 6.50%, 02/01/2038 66,4807,000 7.20%, 11/01/2031 9,222
83,000 7.38%, 11/01/2031 110,342
Shares or Principal Amount Market Value†
CORPORATE BONDS - 33.3% - (continued)Oil & Gas - 1.3% - (continued)
$ 2,565,000 Qatar Petroleum Industry 2.25%, 07/12/2031 $ 2,537,734814,000 Saudi Arabian Oil Co. 2.88%, 04/16/2024(1) 857,012
720,000Shell International Finance B.V.
3.25%, 04/06/2050 767,040320,000 Suncor Energy, Inc. 3.75%, 03/04/2051 346,424
Sunoco L.P. / Sunoco Finance Corp.295,000 5.50%, 02/15/2026 303,997250,000 6.00%, 04/15/2027 260,812
2,320,000 Tullow Oil plc 7.00%, 03/01/2025(1) 2,056,680
29,966,166
Oil & Gas Services - 0.0%745,000 Halliburton Co. 4.85%, 11/15/2035 878,114
Packaging & Containers - 0.3%
400,000Ardagh Packaging Finance plc / Ardagh
Holdings USA, Inc. 4.13%, 08/15/2026(1) 413,0004,650,000 Ball Corp. 4.00%, 11/15/2023 4,943,415
890,000 Mondelez International, Inc. 1.50%, 05/04/2025 907,588
695,000Owens-Brockway Glass Container, Inc.
5.88%, 08/15/2023(1) 749,467
7,013,470
Pharmaceuticals - 1.4%AbbVie, Inc.
2,500,000 2.95%, 11/21/2026 2,689,2021,315,000 3.20%, 11/21/2029 1,429,539
465,000 4.25%, 11/21/2049 558,9101,115,000 4.63%, 10/01/2042 1,374,817
Astrazeneca Finance LLC4,660,000 1.75%, 05/28/2028 4,661,491
350,000 2.25%, 05/28/2031 355,972360,000 Bausch Health Cos., Inc. 5.75%, 08/15/2027(1) 382,09795,000 Baxalta, Inc. 3.60%, 06/23/2022 97,481
2,515,000 Bayer U.S. Finance LLC 4.25%, 12/15/2025(1) 2,802,766Bristol-Myers Squibb Co.
2,905,000 0.75%, 11/13/2025 2,879,518855,000 2.55%, 11/13/2050 820,428
3,760,000 Cigna Corp. 1.25%, 03/15/2026 3,772,632CVS Health Corp.
1,450,000 4.13%, 04/01/2040 1,683,5121,050,000 5.13%, 07/20/2045 1,367,111
1,760,000GlaxoSmithKline Capital, Inc.
3.63%, 05/15/2025 1,941,938200,000 Organon Finance LLC 4.13%, 04/30/2028(1) 203,960720,000 Pfizer, Inc. 2.63%, 04/01/2030 767,325
Teva Pharmaceutical Finance Netherlands B.V.3,825,000 3.15%, 10/01/2026 3,638,531
900,000 6.75%, 03/01/2028(6) 985,500
32,412,730
Pipelines - 1.0%
280,000Cheniere Corpus Christi Holdings LLC
5.88%, 03/31/2025 320,976
65,000Cheniere Energy Partners L.P.
4.50%, 10/01/2029 69,875
215,000DCP Midstream Operating L.P.
5.60%, 04/01/2044 236,500Energy Transfer Operating L.P.
495,000 4.00%, 10/01/2027 544,9271,095,000 4.95%, 06/15/2028 1,266,1301,390,000 5.25%, 04/15/2029 1,643,237
175,000 5.30%, 04/01/2044 202,914180,000 5.35%, 05/15/2045 208,347
2,385,000 6.13%, 12/15/2045 3,041,043315,000 6.25%, 04/15/2049 413,626
The accompanying notes are an integral part of these financial statements.
60
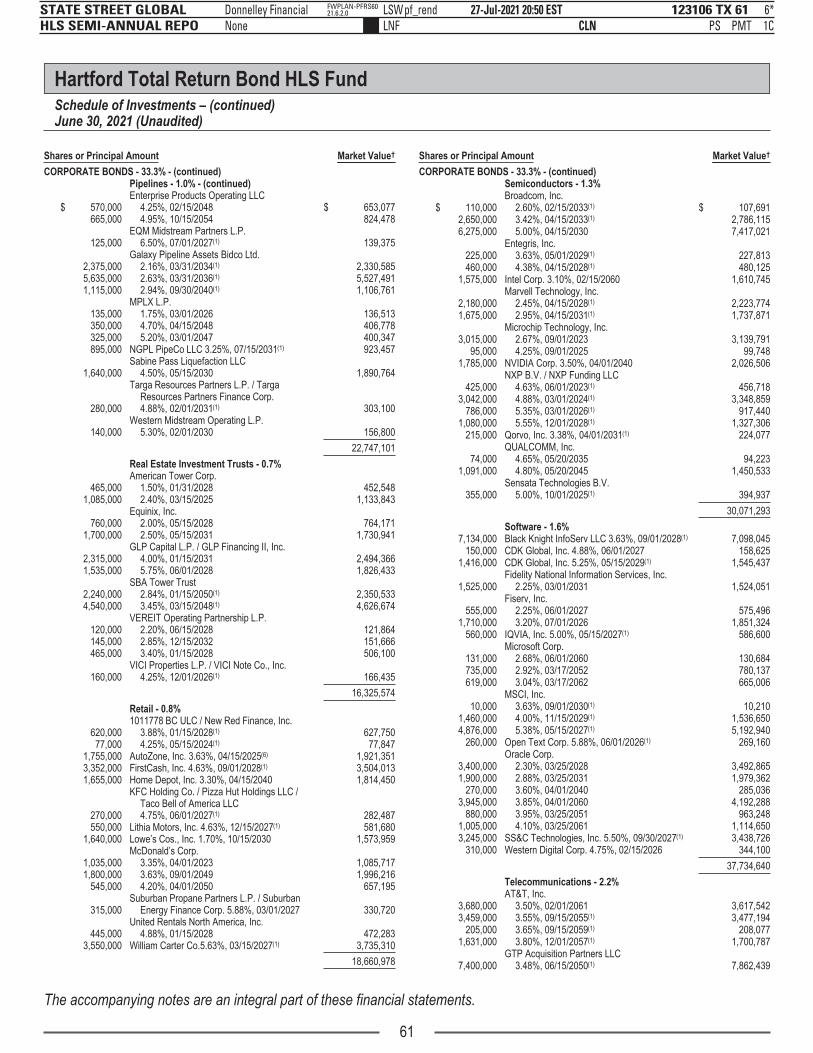
123106 TX 61STATE STREET GLOBAL HLS SEMI-ANNUAL REPO
27-Jul-2021 20:50 ESTCLN PSLNF
Donnelley Financial LSWpf_rendNone
6*PMT 1C
FWPLAN-PFRS6021.6.2.0
Hartford Total Return Bond HLS FundSchedule of Investments – (continued)June 30, 2021 (Unaudited)
Shares or Principal Amount Market Value†
CORPORATE BONDS - 33.3% - (continued)Pipelines - 1.0% - (continued)Enterprise Products Operating LLC
$ 570,000 4.25%, 02/15/2048 $ 653,077665,000 4.95%, 10/15/2054 824,478
125,000EQM Midstream Partners L.P.
6.50%, 07/01/2027(1) 139,375Galaxy Pipeline Assets Bidco Ltd.
2,375,000 2.16%, 03/31/2034(1) 2,330,5855,635,000 2.63%, 03/31/2036(1) 5,527,4911,115,000 2.94%, 09/30/2040(1) 1,106,761
MPLX L.P.135,000 1.75%, 03/01/2026 136,513350,000 4.70%, 04/15/2048 406,778325,000 5.20%, 03/01/2047 400,347895,000 NGPL PipeCo LLC 3.25%, 07/15/2031(1) 923,457
1,640,000Sabine Pass Liquefaction LLC
4.50%, 05/15/2030 1,890,764
280,000
Targa Resources Partners L.P. / TargaResources Partners Finance Corp.4.88%, 02/01/2031(1) 303,100
140,000Western Midstream Operating L.P.
5.30%, 02/01/2030 156,800
22,747,101
Real Estate Investment Trusts - 0.7%American Tower Corp.
465,000 1.50%, 01/31/2028 452,5481,085,000 2.40%, 03/15/2025 1,133,843
Equinix, Inc.760,000 2.00%, 05/15/2028 764,171
1,700,000 2.50%, 05/15/2031 1,730,941GLP Capital L.P. / GLP Financing II, Inc.
2,315,000 4.00%, 01/15/2031 2,494,3661,535,000 5.75%, 06/01/2028 1,826,433
SBA Tower Trust2,240,000 2.84%, 01/15/2050(1) 2,350,5334,540,000 3.45%, 03/15/2048(1) 4,626,674
VEREIT Operating Partnership L.P.120,000 2.20%, 06/15/2028 121,864145,000 2.85%, 12/15/2032 151,666465,000 3.40%, 01/15/2028 506,100
160,000VICI Properties L.P. / VICI Note Co., Inc.
4.25%, 12/01/2026(1) 166,435
16,325,574
Retail - 0.8%1011778 BC ULC / New Red Finance, Inc.
620,000 3.88%, 01/15/2028(1) 627,75077,000 4.25%, 05/15/2024(1) 77,847
1,755,000 AutoZone, Inc. 3.63%, 04/15/2025(6) 1,921,3513,352,000 FirstCash, Inc. 4.63%, 09/01/2028(1) 3,504,0131,655,000 Home Depot, Inc. 3.30%, 04/15/2040 1,814,450
270,000
KFC Holding Co. / Pizza Hut Holdings LLC /Taco Bell of America LLC4.75%, 06/01/2027(1) 282,487
550,000 Lithia Motors, Inc. 4.63%, 12/15/2027(1) 581,6801,640,000 Lowe’s Cos., Inc. 1.70%, 10/15/2030 1,573,959
McDonald’s Corp.1,035,000 3.35%, 04/01/2023 1,085,7171,800,000 3.63%, 09/01/2049 1,996,216
545,000 4.20%, 04/01/2050 657,195
315,000Suburban Propane Partners L.P. / Suburban
Energy Finance Corp. 5.88%, 03/01/2027 330,720
445,000United Rentals North America, Inc.
4.88%, 01/15/2028 472,2833,550,000 William Carter Co.5.63%, 03/15/2027(1) 3,735,310
18,660,978
Shares or Principal Amount Market Value†
CORPORATE BONDS - 33.3% - (continued)Semiconductors - 1.3%Broadcom, Inc.
$ 110,000 2.60%, 02/15/2033(1) $ 107,6912,650,000 3.42%, 04/15/2033(1) 2,786,1156,275,000 5.00%, 04/15/2030 7,417,021
Entegris, Inc.225,000 3.63%, 05/01/2029(1) 227,813460,000 4.38%, 04/15/2028(1) 480,125
1,575,000 Intel Corp. 3.10%, 02/15/2060 1,610,745Marvell Technology, Inc.
2,180,000 2.45%, 04/15/2028(1) 2,223,7741,675,000 2.95%, 04/15/2031(1) 1,737,871
Microchip Technology, Inc.3,015,000 2.67%, 09/01/2023 3,139,791
95,000 4.25%, 09/01/2025 99,7481,785,000 NVIDIA Corp. 3.50%, 04/01/2040 2,026,506
NXP B.V. / NXP Funding LLC425,000 4.63%, 06/01/2023(1) 456,718
3,042,000 4.88%, 03/01/2024(1) 3,348,859786,000 5.35%, 03/01/2026(1) 917,440
1,080,000 5.55%, 12/01/2028(1) 1,327,306215,000 Qorvo, Inc. 3.38%, 04/01/2031(1) 224,077
QUALCOMM, Inc.74,000 4.65%, 05/20/2035 94,223
1,091,000 4.80%, 05/20/2045 1,450,533
355,000Sensata Technologies B.V.
5.00%, 10/01/2025(1) 394,937
30,071,293
Software - 1.6%7,134,000 Black Knight InfoServ LLC 3.63%, 09/01/2028(1) 7,098,045
150,000 CDK Global, Inc. 4.88%, 06/01/2027 158,6251,416,000 CDK Global, Inc. 5.25%, 05/15/2029(1) 1,545,437
1,525,000Fidelity National Information Services, Inc.
2.25%, 03/01/2031 1,524,051Fiserv, Inc.
555,000 2.25%, 06/01/2027 575,4961,710,000 3.20%, 07/01/2026 1,851,324
560,000 IQVIA, Inc. 5.00%, 05/15/2027(1) 586,600Microsoft Corp.
131,000 2.68%, 06/01/2060 130,684735,000 2.92%, 03/17/2052 780,137619,000 3.04%, 03/17/2062 665,006
MSCI, Inc.10,000 3.63%, 09/01/2030(1) 10,210
1,460,000 4.00%, 11/15/2029(1) 1,536,6504,876,000 5.38%, 05/15/2027(1) 5,192,940
260,000 Open Text Corp. 5.88%, 06/01/2026(1) 269,160Oracle Corp.
3,400,000 2.30%, 03/25/2028 3,492,8651,900,000 2.88%, 03/25/2031 1,979,362
270,000 3.60%, 04/01/2040 285,0363,945,000 3.85%, 04/01/2060 4,192,288
880,000 3.95%, 03/25/2051 963,2481,005,000 4.10%, 03/25/2061 1,114,6503,245,000 SS&C Technologies, Inc. 5.50%, 09/30/2027(1) 3,438,726
310,000 Western Digital Corp. 4.75%, 02/15/2026 344,100
37,734,640
Telecommunications - 2.2%AT&T, Inc.
3,680,000 3.50%, 02/01/2061 3,617,5423,459,000 3.55%, 09/15/2055(1) 3,477,194
205,000 3.65%, 09/15/2059(1) 208,0771,631,000 3.80%, 12/01/2057(1) 1,700,787
7,400,000GTP Acquisition Partners LLC
3.48%, 06/15/2050(1) 7,862,439
The accompanying notes are an integral part of these financial statements.
61

q
123106 TX 62STATE STREET GLOBAL HLS SEMI-ANNUAL REPO
27-Jul-2021 20:50 ESTCLN PSLNF
Donnelley Financial LSWpf_rendNone
5*PMT 1C
FWPLAN-PFRS6021.6.2.0
Hartford Total Return Bond HLS FundSchedule of Investments – (continued)June 30, 2021 (Unaudited)
Shares or Principal Amount Market Value†
CORPORATE BONDS - 33.3% - (continued)Telecommunications - 2.2% - (continued)Nokia Oyj
$ 3,175,000 4.38%, 06/12/2027 $ 3,507,137575,000 6.63%, 05/15/2039 744,625425,000 Sprint Corp. 7.13%, 06/15/2024 490,344
T-Mobile USA, Inc.1,439,000 2.05%, 02/15/2028 1,459,506
100,000 3.38%, 04/15/2029(1) 103,1992,745,000 3.50%, 04/15/2025 2,975,155
100,000 3.50%, 04/15/2031(1) 103,4593,400,000 3.88%, 04/15/2030 3,796,2361,195,000 4.50%, 04/15/2050 1,422,926
Telecom Italia Capital S.A.265,000 6.00%, 09/30/2034 305,744160,000 7.72%, 06/04/2038 218,123
3,085,000Telefonica Celular del Paraguay S.A.
5.88%, 04/15/2027(1) 3,239,2502,050,000 VEON Holdings B.V. 3.38%, 11/25/2027(1) 2,062,300
Verizon Communications, Inc.1,275,000 2.65%, 11/20/2040 1,228,157
274,000 2.99%, 10/30/2056 257,8102,625,000 3.40%, 03/22/2041 2,779,4201,125,000 3.55%, 03/22/2051 1,202,8862,603,000 4.27%, 01/15/2036 3,109,189
Verizon Communications, Inc.3,185,000 4.40%, 11/01/2034 3,799,173
165,000 4.50%, 08/10/2033 197,379100,000 4.81%, 03/15/2039 126,772540,000 Vmed UK Financing plc 4.25%, 01/31/2031(1) 530,485
1,700,000 Vodafone Group plc 6.15%, 02/27/2037 2,354,437
52,879,751
Transportation - 0.4%Penske Truck Leasing Co. L.P. / PTL Finance
Corp.2,115,000 2.70%, 11/01/2024(1) 2,224,3761,890,000 4.00%, 07/15/2025(1) 2,081,577
Union Pacific Corp.2,600,000 2.38%, 05/20/2031 2,655,9502,010,000 2.97%, 09/16/2062 1,933,560
8,895,463
Trucking & Leasing - 0.3%3,775,000 DAE Funding LLC 1.55%, 08/01/2024(1) 3,767,3372,785,000 NTT Finance Corp. 1.16%, 04/03/2026(1) 2,779,827
6,547,164
Water - 0.0%
620,000American Water Capital Corp.
4.15%, 06/01/2049 753,241
Total Corporate Bonds(cost $741,706,304) $ 782,628,898
FOREIGN GOVERNMENT OBLIGATIONS - 6.3%Angola - 0.1%Angolan Government International Bond
$ 1,600,000 8.00%, 11/26/2029(7) $ 1,639,808910,000 8.25%, 05/09/2028(7) 948,966
2,588,774
Argentina - 0.0%Argentine Republic Government International Bond
2,046,884 0.13%, 07/09/2035(4) 647,85969,782 1.00%, 07/09/2029 26,427
674,286
Shares or Principal Amount Market Value†
FOREIGN GOVERNMENT OBLIGATIONS - 6.3% - (continued)Australia - 0.1%
AUD 4,095,000Australia Government Bond
1.75%, 06/21/2051(7) $ 2,711,934
Bermuda - 0.0%
$ 735,000Bermuda Government International Bond
2.38%, 08/20/2030(1) 733,162
Brazil - 0.4%
BRL 47,432,000Brazil Notas do Tesouro Nacional
10.00%, 01/01/2031 10,051,931
Chile - 0.3%Chile Government International Bond
EUR 4,930,000 1.25%, 01/22/2051 5,221,422$ 2,070,000 3.10%, 05/07/2041 2,073,085
7,294,507
Colombia - 0.3%
6,545,000Colombia Government International Bond
3.88%, 04/25/2027 6,953,801
Croatia - 0.2%
EUR 4,555,000Croatia Government International Bond
1.50%, 06/17/2031(7) 5,622,753
Dominican Republic - 0.2%
$ 4,890,000Dominican Republic International Bond
6.40%, 06/05/2049(1) 5,269,953
Egypt - 0.1%Egypt Government International Bond
840,000 7.63%, 05/29/2032(1) 890,484720,000 8.50%, 01/31/2047(7) 749,700595,000 8.88%, 05/29/2050(1) 640,316
2,280,500
Ghana - 0.1%
1,408,000Ghana Government International Bond
6.38%, 02/11/2027(1) 1,414,223
Hungary - 0.2%
EUR 2,665,000Hungary Government International Bond
1.63%, 04/28/2032(7) 3,361,318
Indonesia - 0.3%Indonesia Government International Bond
5,235,000 1.10%, 03/12/2033 6,063,340240,000 2.15%, 07/18/2024(7) 301,120470,000 2.63%, 06/14/2023(7) 584,587
6,949,047
Macedonia - 0.2%North Macedonia Government International
Bond1,825,000 2.75%, 01/18/2025(7) 2,268,9482,165,000 3.68%, 06/03/2026(1) 2,827,458
5,096,406
Mexico - 1.4%MXN 308,198,500 Mexican Bonos 7.75%, 05/29/2031 16,319,647
Mexico Government International BondEUR 885,000 1.13%, 01/17/2030 1,029,293
6,185,000 1.45%, 10/25/2033 6,994,380$ 865,000 3.75%, 04/19/2071 790,956
1,440,000 3.77%, 05/24/2061 1,339,7471,510,000 4.28%, 08/14/2041 1,585,6663,190,000 4.75%, 04/27/2032 3,652,550
31,712,239
Morocco - 0.2%
EUR 2,865,000Morocco Government International Bond
2.00%, 09/30/2030(7) 3,361,232
The accompanying notes are an integral part of these financial statements.
62

p
123106 TX 63STATE STREET GLOBAL HLS SEMI-ANNUAL REPO
27-Jul-2021 20:50 ESTCLN PSLNF
Donnelley Financial LSWpf_rendNone
7*PMT 1C
FWPLAN-PFRS6021.6.2.0
Hartford Total Return Bond HLS FundSchedule of Investments – (continued)June 30, 2021 (Unaudited)
Shares or Principal Amount Market Value†
FOREIGN GOVERNMENT OBLIGATIONS - 6.3% - (continued)Panama - 0.3%Panama Government International Bond
$ 200,000 2.25%, 09/29/2032 $ 191,9025,000,000 3.87%, 07/23/2060 5,104,150
815,000 4.30%, 04/29/2053 903,574530,000 4.50%, 04/16/2050 601,577
6,801,203
Peru - 0.1%Peruvian Government International Bond
540,000 2.39%, 01/23/2026 557,5931,395,000 2.78%, 01/23/2031 1,420,0681,160,000 3.30%, 03/11/2041 1,170,974
3,148,635
Philippines - 0.3%
EUR 4,855,000Philippine Government International Bond
1.20%, 04/28/2033 5,749,736
Romania - 0.5%Romanian Government International Bond
2,970,000 2.63%, 12/02/2040(1) 3,489,3351,315,000 2.75%, 04/14/2041(7) 1,547,6731,315,000 3.38%, 02/08/2038(7) 1,707,0903,241,000 4.63%, 04/03/2049(7) 4,863,568
11,607,666
Russia - 0.3%
RUB 636,260,000Russian Federal Bond - OFZ
5.90%, 03/12/2031 7,987,597
Saudi Arabia - 0.2%
$ 5,467,000Saudi Government International Bond
2.25%, 02/02/2033(1) 5,310,917
Senegal - 0.1%Senegal Government International Bond
EUR 785,000 4.75%, 03/13/2028(7) 969,452$ 2,115,000 6.25%, 05/23/2033(7) 2,228,745
3,198,197
Serbia - 0.2%EUR 3,030,000 Serbia International Bond 1.65%, 03/03/2033(1) 3,514,068
Tunisia - 0.1%
1,805,000Banque Centrale de Tunisie International Bond
6.75%, 10/31/2023(1) 2,065,540
United Arab Emirates - 0.1%
$ 2,455,000Finance Department Government of Sharjah
3.63%, 03/10/2033(1) 2,479,034
Total Foreign Government Obligations(cost $148,271,149) $ 147,938,659
MUNICIPAL BONDS - 1.2%Development - 0.3%
$ 6,455,000New York Transportation Dev Corp. Rev
4.25%, 09/01/2035 $ 7,151,090
Education - 0.2%Chicago, IL, Board of Education, GO
365,000 6.04%, 12/01/2029 428,8761,115,000 6.14%, 12/01/2039 1,361,5301,750,000 6.32%, 11/01/2029 2,146,103
3,936,509
General - 0.5%
4,130,000Florida State Board of Administration Finance
Co. 1.26%, 07/01/2025 4,169,682
Shares or Principal Amount Market Value†
MUNICIPAL BONDS - 1.2% - (continued)General - 0.5% - (continued)
$ 5,445,000Philadelphia, PA, Auth Industrial Dev (NATL
Insured) 6.55%, 10/15/2028 $ 7,076,750
11,246,432
General Obligation - 0.1%
110,000California State, GO Taxable
7.30%, 10/01/2039(6) 176,045170,000 State of Connecticut, GO 3.00%, 07/01/2021 170,000
State of Illinois, GO1,951,345 4.95%, 06/01/2023(6) 2,085,557
280,000 5.00%, 01/01/2023 293,924980,000 5.95%, 04/01/2022 1,017,049
3,742,575
Transportation - 0.0%720,000 Chicago, IL, Transit Auth 3.91%, 12/01/2040 811,355
Utility - Electric - 0.1%1,544,000 Municipal Electric Auth, GA 6.64%, 04/01/2057 2,339,591
Total Municipal Bonds(cost $26,451,349) $ 29,227,552
SENIOR FLOATING RATE INTERESTS - 4.4%(10)
Advertising - 0.0%
$ 304,575
Clear Channel Outdoor Holdings, Inc.3.69%, 08/21/2026, 1 mo. USD LIBOR +3.500% $ 297,089
Aerospace/Defense - 0.1%
373,125Great Outdoors Group LLC 5.00%, 03/05/2028,
1 mo. USD LIBOR + 4.250% 374,058
99,500Spirit Aerosystems, Inc. 6.00%, 01/15/2025,
1 mo. USD LIBOR + 5.250% 100,039
559,427TransDigm, Inc. 2.35%, 12/09/2025, 1 mo.
USD LIBOR + 2.250% 550,733
345,963Tronox Finance LLC 2.63%, 03/11/2028, 1 mo.
USD LIBOR + 2.250% 343,493
104,738
Watlow Electric Manufacturing Co.4.50%, 03/02/2028, 1 mo. USD LIBOR +4.000% 104,955
1,473,278
Airlines - 0.0%
245,000AAdvantage Loyalty IP Ltd. 5.50%, 04/20/2028,
1 mo. USD LIBOR + 4.750% 255,228
275,800Kestrel Bidco, Inc. 4.00%, 12/11/2026, 3 mo.
USD LIBOR + 3.000% 270,284
180,000Mileage Plus Holdings LLC 6.25%, 06/20/2027,
1 mo. USD LIBOR + 5.250% 192,089
210,000SkyMiles IP Ltd. 4.75%, 10/20/2027, 3 mo.
USD LIBOR + 3.750% 221,695
939,296
Apparel - 0.0%
245,000Birkenstock GmbH & Co. KG
0.00%, 04/27/2028(11) 244,89799,091 SRAM LLC 0.00%, 05/12/2028(11) 98,596
343,493
Asset-Backed - Finance & Insurance - 0.0%
136,843By Crown Parent LLC 4.00%, 01/30/2026,
1 mo. USD LIBOR + 3.000% 136,672
Auto Manufacturers - 0.0%
149,962Navistar International Corp. 3.60%, 11/06/2024,
3 mo. USD LIBOR + 3.500% 149,962
The accompanying notes are an integral part of these financial statements.
63
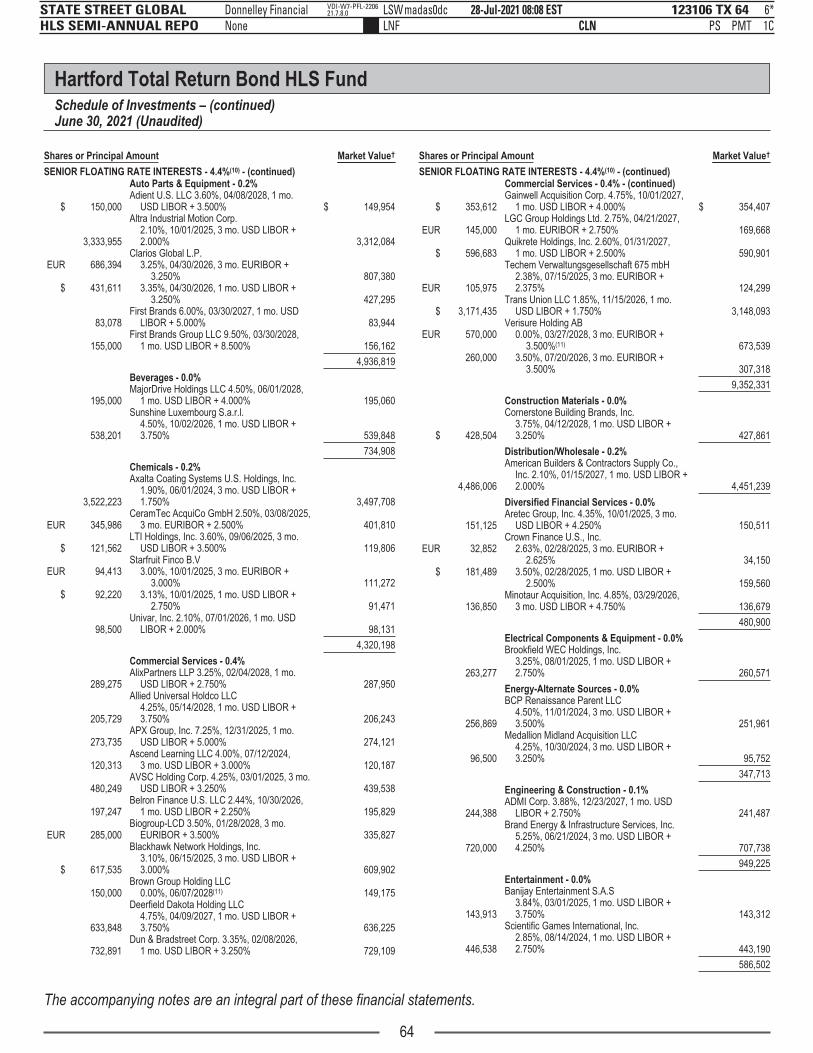
p
123106 TX 64STATE STREET GLOBAL HLS SEMI-ANNUAL REPO
28-Jul-2021 08:08 ESTCLN PSLNF
Donnelley Financial LSWmadas0dcNone
6*PMT 1C
VDI-W7-PFL-220621.7.8.0
Hartford Total Return Bond HLS FundSchedule of Investments – (continued)June 30, 2021 (Unaudited)
Shares or Principal Amount Market Value†
SENIOR FLOATING RATE INTERESTS - 4.4%(10) - (continued)Auto Parts & Equipment - 0.2%
$ 150,000Adient U.S. LLC 3.60%, 04/08/2028, 1 mo.
USD LIBOR + 3.500% $ 149,954
3,333,955
Altra Industrial Motion Corp.2.10%, 10/01/2025, 3 mo. USD LIBOR +2.000% 3,312,084
Clarios Global L.P.EUR 686,394 3.25%, 04/30/2026, 3 mo. EURIBOR +
3.250% 807,380$ 431,611 3.35%, 04/30/2026, 1 mo. USD LIBOR +
3.250% 427,295
83,078First Brands 6.00%, 03/30/2027, 1 mo. USD
LIBOR + 5.000% 83,944
155,000First Brands Group LLC 9.50%, 03/30/2028,
1 mo. USD LIBOR + 8.500% 156,162
4,936,819
Beverages - 0.0%
195,000MajorDrive Holdings LLC 4.50%, 06/01/2028,
1 mo. USD LIBOR + 4.000% 195,060
538,201
Sunshine Luxembourg S.a.r.l.4.50%, 10/02/2026, 1 mo. USD LIBOR +3.750% 539,848
734,908
Chemicals - 0.2%
3,522,223
Axalta Coating Systems U.S. Holdings, Inc.1.90%, 06/01/2024, 3 mo. USD LIBOR +1.750% 3,497,708
EUR 345,986CeramTec AcquiCo GmbH 2.50%, 03/08/2025,
3 mo. EURIBOR + 2.500% 401,810
$ 121,562LTI Holdings, Inc. 3.60%, 09/06/2025, 3 mo.
USD LIBOR + 3.500% 119,806Starfruit Finco B.V
EUR 94,413 3.00%, 10/01/2025, 3 mo. EURIBOR +3.000% 111,272
$ 92,220 3.13%, 10/01/2025, 1 mo. USD LIBOR +2.750% 91,471
98,500Univar, Inc. 2.10%, 07/01/2026, 1 mo. USD
LIBOR + 2.000% 98,131
4,320,198
Commercial Services - 0.4%
289,275AlixPartners LLP 3.25%, 02/04/2028, 1 mo.
USD LIBOR + 2.750% 287,950
205,729
Allied Universal Holdco LLC4.25%, 05/14/2028, 1 mo. USD LIBOR +3.750% 206,243
273,735APX Group, Inc. 7.25%, 12/31/2025, 1 mo.
USD LIBOR + 5.000% 274,121
120,313Ascend Learning LLC 4.00%, 07/12/2024,
3 mo. USD LIBOR + 3.000% 120,187
480,249AVSC Holding Corp. 4.25%, 03/01/2025, 3 mo.
USD LIBOR + 3.250% 439,538
197,247Belron Finance U.S. LLC 2.44%, 10/30/2026,
1 mo. USD LIBOR + 2.250% 195,829
EUR 285,000Biogroup-LCD 3.50%, 01/28/2028, 3 mo.
EURIBOR + 3.500% 335,827
$ 617,535
Blackhawk Network Holdings, Inc.3.10%, 06/15/2025, 3 mo. USD LIBOR +3.000% 609,902
150,000Brown Group Holding LLC
0.00%, 06/07/2028(11) 149,175
633,848
Deerfield Dakota Holding LLC4.75%, 04/09/2027, 1 mo. USD LIBOR +3.750% 636,225
732,891Dun & Bradstreet Corp. 3.35%, 02/08/2026,
1 mo. USD LIBOR + 3.250% 729,109
Shares or Principal Amount Market Value†
SENIOR FLOATING RATE INTERESTS - 4.4%(10) - (continued)Commercial Services - 0.4% - (continued)
$ 353,612Gainwell Acquisition Corp. 4.75%, 10/01/2027,
1 mo. USD LIBOR + 4.000% $ 354,407
EUR 145,000LGC Group Holdings Ltd. 2.75%, 04/21/2027,
1 mo. EURIBOR + 2.750% 169,668
$ 596,683Quikrete Holdings, Inc. 2.60%, 01/31/2027,
1 mo. USD LIBOR + 2.500% 590,901
EUR 105,975
Techem Verwaltungsgesellschaft 675 mbH2.38%, 07/15/2025, 3 mo. EURIBOR +2.375% 124,299
$ 3,171,435Trans Union LLC 1.85%, 11/15/2026, 1 mo.
USD LIBOR + 1.750% 3,148,093Verisure Holding AB
EUR 570,000 0.00%, 03/27/2028, 3 mo. EURIBOR +3.500%(11) 673,539
260,000 3.50%, 07/20/2026, 3 mo. EURIBOR +3.500% 307,318
9,352,331
Construction Materials - 0.0%
$ 428,504
Cornerstone Building Brands, Inc.3.75%, 04/12/2028, 1 mo. USD LIBOR +3.250% 427,861
Distribution/Wholesale - 0.2%
4,486,006
American Builders & Contractors Supply Co.,Inc. 2.10%, 01/15/2027, 1 mo. USD LIBOR +2.000% 4,451,239
Diversified Financial Services - 0.0%
151,125Aretec Group, Inc. 4.35%, 10/01/2025, 3 mo.
USD LIBOR + 4.250% 150,511Crown Finance U.S., Inc.
EUR 32,852 2.63%, 02/28/2025, 3 mo. EURIBOR +2.625% 34,150
$ 181,489 3.50%, 02/28/2025, 1 mo. USD LIBOR +2.500% 159,560
136,850Minotaur Acquisition, Inc. 4.85%, 03/29/2026,
3 mo. USD LIBOR + 4.750% 136,679
480,900
Electrical Components & Equipment - 0.0%
263,277
Brookfield WEC Holdings, Inc.3.25%, 08/01/2025, 1 mo. USD LIBOR +2.750% 260,571
Energy-Alternate Sources - 0.0%
256,869
BCP Renaissance Parent LLC4.50%, 11/01/2024, 3 mo. USD LIBOR +3.500% 251,961
96,500
Medallion Midland Acquisition LLC4.25%, 10/30/2024, 3 mo. USD LIBOR +3.250% 95,752
347,713
Engineering & Construction - 0.1%
244,388ADMI Corp. 3.88%, 12/23/2027, 1 mo. USD
LIBOR + 2.750% 241,487
720,000
Brand Energy & Infrastructure Services, Inc.5.25%, 06/21/2024, 3 mo. USD LIBOR +4.250% 707,738
949,225
Entertainment - 0.0%
143,913
Banijay Entertainment S.A.S3.84%, 03/01/2025, 1 mo. USD LIBOR +3.750% 143,312
446,538
Scientific Games International, Inc.2.85%, 08/14/2024, 1 mo. USD LIBOR +2.750% 443,190
586,502
The accompanying notes are an integral part of these financial statements.
64

qq p
123106 TX 65STATE STREET GLOBAL HLS SEMI-ANNUAL REPO
28-Jul-2021 08:09 ESTCLN PSLNF
Donnelley Financial LSWmadas0dcNone
10*PMT 1C
VDI-W7-PFL-220621.7.8.0
Hartford Total Return Bond HLS FundSchedule of Investments – (continued)June 30, 2021 (Unaudited)
Shares or Principal Amount Market Value†
SENIOR FLOATING RATE INTERESTS - 4.4%(10) - (continued)Food - 0.1%
$ 182,583B&G Foods, Inc. 2.60%, 10/10/2026, 1 mo.
USD LIBOR + 2.500% $ 182,454Froneri International Ltd.
163,350 2.35%, 01/31/2027, 1 mo. USD LIBOR +2.250% 160,777
EUR 170,000 2.38%, 01/31/2027, 3 mo. EURIBOR +2.375% 197,294
$ 483,551Hostess Brands LLC 3.00%, 08/03/2025, 1 mo.
USD LIBOR + 2.250% 481,134U.S. Foods, Inc.
441,291 1.85%, 06/27/2023, 1 mo. USD LIBOR +1.750% 436,693
245,625 2.10%, 09/13/2026, 3 mo. USD LIBOR +2.000% 241,744
1,700,096
Food Service - 0.0%Aramark Services, Inc.
111,920 1.85%, 03/11/2025, 1 mo. USD LIBOR +1.750% 110,613
108,625 1.85%, 01/15/2027, 1 mo. USD LIBOR +1.750% 107,222
217,835
Hand/Machine Tools - 0.0%
238,800Applecaramel Buyer LLC 4.50%, 10/19/2027, 1
mo. USD LIBOR + 4.000% 239,098
Healthcare - Products - 0.1%Avantor Funding, Inc.
EUR 175,000 0.00%, 06/12/2028(11) 207,792$ 497,500 3.25%, 11/06/2027, 1 mo. USD LIBOR +
2.250% 497,291
185,625Lifescan Global Corp. 6.20%, 10/01/2024,
3 mo. USD LIBOR + 6.000% 183,769360,000 Organon & Co 0.00%, 06/02/2028(11) 360,227
120,000WW International, Inc. 4.00%, 04/13/2028,
1 mo. USD LIBOR + 3.500% 120,300
1,369,379
Healthcare - Services - 0.1%180,000 ADMI Corp. 0.00%, 12/23/2027(11) 179,663
109,443Ensemble RCM LLC 3.94%, 08/01/2026, 3 mo.
USD LIBOR + 3.750% 109,466
268,125Envision Healthcare Corp. 3.85%, 10/10/2025,
3 mo. USD LIBOR + 3.750% 228,885
99,748eResearchTechnology, Inc. 5.50%, 02/04/2027,
1 mo. USD LIBOR + 4.500% 100,138
247,237EyeCare Partners LLC 3.85%, 02/20/2027,
1 mo. USD LIBOR + 3.750% 244,859135,000 Icon Luxembourg S.a.r.l 0.00%, 06/16/2028(11) 135,190
120,000Insulet Corp. 3.75%, 05/04/2028, 1 mo. USD
LIBOR + 3.250% 120,076
EUR 213,400IQVIA, Inc. 2.00%, 06/11/2025, 3 mo.
EURIBOR + 2.000% 251,301
$ 295,780MED ParentCo L.P. 4.35%, 08/31/2026, 1 mo.
USD LIBOR + 4.250% 295,579
393,198
MPH Acquisition Holdings LLC3.75%, 06/07/2023, 1 mo. USD LIBOR +2.750% 392,038
98,791Pathway Vet Alliance LLC 3.85%, 03/31/2027,
1 mo. USD LIBOR + 3.750% 98,489
418,950PPD, Inc. 2.75%, 01/13/2028, 1 mo. USD
LIBOR + 2.250% 418,229
Shares or Principal Amount Market Value†
SENIOR FLOATING RATE INTERESTS - 4.4%(10) - (continued)Healthcare - Services - 0.1% - (continued)
$ 284,288
Surgery Center Holdings, Inc.4.50%, 08/31/2026, 1 mo. USD LIBOR +3.750% $ 285,308
2,859,221
Household Products - 0.0%
284,675Diamond (BC) B.V. 3.19%, 09/06/2024, 3 mo.
USD LIBOR + 3.000% 282,956
285,750
Revlon Consumer Products Corp.4.25%, 09/07/2023, 1 mo. USD LIBOR +3.500% 157,163
86,629
Reynolds Consumer Products LLC1.85%, 02/04/2027, 1 mo. USD LIBOR +1.750% 85,892
526,011
Housewares - 0.0%225,000 Hayward Industries, Inc. 0.00%, 05/12/2028(11) 224,368
Insurance - 0.1%
322,057Acrisure LLC 3.60%, 02/15/2027, 1 mo. USD
LIBOR + 3.500% 318,299Asurion LLC
366,165 3.10%, 11/03/2023, 1 mo. USD LIBOR +3.000% 364,108
595,588 3.35%, 12/23/2026, 1 mo. USD LIBOR +3.250% 588,518
180,000 5.35%, 02/03/2028, 1 mo. USD LIBOR +5.250% 181,274
416,715Hub International Ltd. 2.93%, 04/25/2025,
1 mo. USD LIBOR + 2.750% 411,877Sedgwick Claims Management Services, Inc.
277,875 3.35%, 12/31/2025, 3 mo. USD LIBOR +3.250% 274,749
539,000 3.85%, 09/03/2026, 1 mo. USD LIBOR +3.750% 537,803
2,676,628
IT Services - 0.2%
180,000Endure Digital, Inc. 4.25%, 02/10/2028, 3 mo.
USD LIBOR + 3.500% 179,025
3,511,990
Science Applications International Corp.1.98%, 10/31/2025, 1 mo. USD LIBOR +1.875% 3,501,032
870,721Tempo Acquisition LLC 3.75%, 10/31/2026,
1 mo. USD LIBOR + 3.250% 871,627
4,551,684
Leisure Time - 0.2%Caesars Resort Collection LLC
429,581 2.85%, 12/22/2024, 3 mo. USD LIBOR +2.750% 425,667
168,725 4.60%, 07/20/2025, 1 mo. USD LIBOR +4.500% 169,147
222,750Carnival Corp. 3.75%, 06/30/2025, 1 mo. USD
LIBOR + 7.500% 227,855
795,546Delta (LUX) S.a.r.l. 3.50%, 02/01/2024, 3 mo.
USD LIBOR + 2.500% 790,701
688,750Golden Entertainment, Inc. 3.75%, 10/20/2024,
3 mo. USD LIBOR + 3.000% 683,584
228,850IRB Holding Corp. 4.25%, 12/15/2027, 1 mo.
USD LIBOR + 3.250% 228,708
280,000Jazz Financing Lux S.a.r.l. 4.00%, 04/22/2028,
1 mo. USD LIBOR + 3.500% 280,787
126,602Penn National Gaming, Inc. 3.00%, 10/15/2025,
3 mo. USD LIBOR + 2.250% 126,144
The accompanying notes are an integral part of these financial statements.
65

123106 TX 66STATE STREET GLOBAL HLS SEMI-ANNUAL REPO
27-Jul-2021 20:50 ESTCLN PSLNF
Donnelley Financial LSWpf_rendNone
6*PMT 1C
FWPLAN-PFRS6021.6.2.0
Hartford Total Return Bond HLS FundSchedule of Investments – (continued)June 30, 2021 (Unaudited)
Shares or Principal Amount Market Value†
SENIOR FLOATING RATE INTERESTS - 4.4%(10) - (continued)Leisure Time - 0.2% - (continued)
$ 325,000Polaris Newco LLC 4.50%, 06/04/2028, 1 mo.
USD LIBOR + 4.000% $ 325,774
90,961UFC Holdings LLC 3.75%, 04/29/2026, 1 mo.
USD LIBOR + 3.000% 90,805
3,349,172
Lodging - 0.0%
262,379Boyd Gaming Corp. 2.34%, 09/15/2023, 3 mo.
USD LIBOR + 2.250% 261,952
Machinery - Construction & Mining - 0.0%EUR 125,000 Concorde Midco Ltd. 4.00%, 03/01/2028 148,002
XXX 163,554Pro Mach Group, Inc. 4.50%, 03/07/2025,
1 mo. USD LIBOR + 3.500% 163,453
311,455
Machinery - Diversified - 0.0%
$ 340,000ACProducts, Inc. 4.75%, 05/17/2028, 1 mo.
USD LIBOR + 4.250% 338,059
Media - 0.3%
EUR 160,000Adevinta ASA 0.00%, 04/20/2028, 3 mo.
EURIBOR + 3.250%(11) 189,504
$ 221,464
Alliance Laundry Systems LLC4.25%, 10/08/2027, 1 mo. USD LIBOR +3.500% 221,637
340,000Cable One, Inc. 2.10%, 05/03/2028, 1 mo. USD
LIBOR + 2.000% 338,470
1,198,516
Charter Communications Operating LLC1.86%, 02/01/2027, 1 mo. USD LIBOR +1.750% 1,189,527
436,722CSC Holdings LLC 2.57%, 04/15/2027, 1 mo.
USD LIBOR + 2.500% 432,119E.W. Scripps Co.
296,989 3.31%, 05/01/2026, 1 mo. USD LIBOR +2.563% 295,751
93,250 3.75%, 01/07/2028, 1 mo. USD LIBOR +3.000% 93,133
436,432Gray Television, Inc. 2.59%, 01/02/2026, 3 mo.
USD LIBOR + 2.500% 434,088
3,297
Houghton Mifflin Harcourt Publishing Co.7.25%, 11/22/2024, 1 mo. USD LIBOR +6.250% 3,298
459,864
MTN Infrastructure TopCo, Inc.4.00%, 11/17/2024, 3 mo. USD LIBOR +3.000% 459,354
220,266Shutterfly, Inc. 7.00%, 09/25/2026, 1 mo. USD
LIBOR + 6.000% 220,462
184,219
Sinclair Television Group, Inc.2.61%, 09/30/2026, 1 mo. USD LIBOR +2.500% 181,513
226,562Terrier Media Buyer, Inc. 3.60%, 12/17/2026,
1 mo. USD LIBOR + 3.500% 225,302
575,000UPC Financing Partnership 3.07%, 01/31/2029,
1 mo. USD LIBOR + 3.000% 570,975
347,382Vertical U.S. Newco, Inc. 4.48%, 07/30/2027, 6
mo. USD LIBOR + 4.250% 347,527
EUR 260,000Virgin Media Bristol LLC 3.25%, 01/31/2029, 3
mo. EURIBOR + 3.250% 307,558
$ 222,164
William Morris Endeavor Entertainment LLC2.86%, 05/18/2025, 3 mo. USD LIBOR +2.750% 217,720
5,727,938
Metal Fabricate/Hardware - 0.0%
290,984Circor International, Inc. 4.25%, 12/11/2024,
1 mo. USD LIBOR + 3.250% 289,165
Shares or Principal Amount Market Value†
SENIOR FLOATING RATE INTERESTS - 4.4%(10) - (continued)Miscellaneous Manufacturing - 0.2%
$ 3,809,641
Ingersoll-Rand Services Co.1.85%, 02/28/2027, 1 mo. USD LIBOR +1.750% $ 3,763,087
271,537
Momentive Performance Materials USA LLC3.36%, 05/15/2024, 3 mo. USD LIBOR +3.250% 269,614
250
Tamko Building Products LLC3.10%, 05/31/2026, 1 mo. USD LIBOR +3.000% 249
514,938USI, Inc. 3.15%, 05/16/2024, 3 mo. USD
LIBOR + 3.000% 509,871
4,542,821
Oil & Gas - 0.0%BCP Raptor LLC
112,679 4.85%, 11/03/2025, 3 mo. USD LIBOR +4.750% 110,397
152,380 5.25%, 06/30/2024, 3 mo. USD LIBOR +4.250% 150,814
307,818
NorthRiver Midstream Finance L.P.3.45%, 10/01/2025, 3 mo. USD LIBOR +3.250% 304,996
740,607 PES Holdings LLC 0.00%, 12/31/2022(11)(12) 7,406
110,131
Traverse Midstream Partners LLC6.50%, 09/27/2024, 1 mo. USD LIBOR +5.500% 110,476
684,089
Oil & Gas Services - 0.0%
147,372
Lower Cadence Holdings LLC4.10%, 05/22/2026, 3 mo. USD LIBOR +4.000% 146,267
524,300UGI Energy Services LLC 3.85%, 08/13/2026,
1 mo. USD LIBOR + 3.750% 523,645
669,912
Packaging & Containers - 0.1%
543,005Flex Acquisition Co., Inc. 4.00%, 03/02/2028,
1 mo. USD LIBOR + 3.500% 540,404
99,750NIC Acquisition Corp. 4.50%, 12/29/2027,
1 mo. USD LIBOR + 3.750% 99,470
336,469
Proampac PG Borrower LLC4.75%, 11/03/2025, 1 mo. USD LIBOR +4.000% 335,880
202,705
Reynolds Group Holdings, Inc.2.85%, 02/05/2023, 1 mo. USD LIBOR +2.750% 202,198
TricorBraun Holdings, Inc.40,398 3.25%, 03/03/2028, 3 mo. USD LIBOR +
3.250%(13) 40,080179,602 3.75%, 03/03/2028, 3 mo. USD LIBOR +
3.250% 178,189
1,396,221
Pharmaceuticals - 0.4%
374,288Bausch Health Cos., Inc. 3.10%, 06/01/2025,
3 mo. USD LIBOR + 3.000% 372,559EUR 130,000 EG Group Ltd. 0.00%, 04/10/2027(11) 154,032
$ 3,873,509Elanco Animal Health, Inc. 1.84%, 08/01/2027,
1 mo. USD LIBOR + 1.750% 3,812,191
790,254
Endo Luxembourg Finance Co. S.a r.l.5.75%, 03/25/2028, 1 mo. USD LIBOR +5.000% 761,362
124,688
Horizon Therapeutics USA, Inc.2.50%, 03/15/2028, 1 mo. USD LIBOR +2.000% 123,791
The accompanying notes are an integral part of these financial statements.
66

q
123106 TX 67STATE STREET GLOBAL HLS SEMI-ANNUAL REPO
28-Jul-2021 08:15 ESTCLN PSLNF
Donnelley Financial LSWmadas0dcNone
6*PMT 1C
VDI-W7-PFL-220621.7.8.0
Hartford Total Return Bond HLS FundSchedule of Investments – (continued)June 30, 2021 (Unaudited)
Shares or Principal Amount Market Value†
SENIOR FLOATING RATE INTERESTS - 4.4%(10) - (continued)Pharmaceuticals - 0.4% - (continued)
$ 3,535,000IQVIA, Inc. 1.85%, 03/07/2024, 1 mo. USD
LIBOR + 1.750% $ 3,513,790
8,737,725
Real Estate - 0.0%
EUR 185,000Boels Topholding B.V. 3.75%, 02/06/2027,
3 mo. EURIBOR + 4.000% 218,267
$ 486,364VICI Properties LLC 1.84%, 12/22/2024, 1 mo.
USD LIBOR + 1.750% 482,054
700,321
Retail - 0.5%
5,967,735B.C. Unlimited Liability Co. 1.85%, 11/19/2026,
1 mo. USD LIBOR + 1.750% 5,881,024119,700 Belron Finance U.S. LLC 3.25%, 04/13/2028 119,451
EUR 110,000Blitz GmbH 3.50%, 04/28/2028, 1 mo. USD
LIBOR + 3.500% 130,091
$ 238,812Coty, Inc. 2.33%, 04/05/2025, 3 mo. USD
LIBOR + 2.250% 229,577
144,760EG Group Limited 0.00%, 03/31/2026, 1 mo.
USD LIBOR(11) 144,760
105,000
Foundation Building Materials Holding Co. LLC3.75%, 01/29/2028, 1 mo. USD LIBOR +3.250% 104,257
704,508
Harbor Freight Tools USA, Inc.3.75%, 10/19/2027, 1 mo. USD LIBOR +3.000% 704,036
1,902,788KFC Holding Co. 1.83%, 03/15/2028, 1 mo.
USD LIBOR + 1.750% 1,902,103LBM Acquisition LLC
216,154 0.00%, 12/17/2027, 1 mo. USD LIBOR +3.750%(11) 214,297
91,667 0.00%, 12/17/2027(11)(13) 90,865147,323 4.50%, 12/17/2027, 1 mo. USD LIBOR +
3.750% 146,187
328,350Les Schwab Tire Centers 4.25%, 11/02/2027,
1 mo. USD LIBOR + 3.500% 327,940
335,000Michaels Cos., Inc. 5.00%, 04/15/2028, 1 mo.
USD LIBOR + 4.250% 336,219
160,000PetSmart, Inc. 4.50%, 02/12/2028, 1 mo. USD
LIBOR + 3.750% 160,040
130,950Rodan & Fields LLC 4.07%, 06/07/2025, 3 mo.
USD LIBOR + 4.000% 103,886490,000 SRS Distribution Inc. 0.00%, 06/02/2028(11) 489,456
378,390Staples, Inc. 5.18%, 04/12/2026, 3 mo. USD
LIBOR + 5.000% 368,223
11,452,412
Software - 0.8%
320,355
CCC Information Services, Inc.4.00%, 04/27/2024, 1 mo. USD LIBOR +3.000% 320,179
513,713
Change Healthcare Holdings LLC3.50%, 03/01/2024, 1 mo. USD LIBOR +2.500% 513,045
440,631DCert Buyer, Inc. 4.10%, 10/16/2026, 3 mo.
USD LIBOR + 4.000% 440,817
337,081Epicor Software Corp. 4.00%, 07/31/2027,
1 mo. USD LIBOR + 3.250% 336,562
502,450Finastra USA, Inc. 4.50%, 06/13/2024, 3 mo.
USD LIBOR + 3.500% 494,235
2,485,000
Fleetcor Technologies Operating Co. LLC0.00%, 04/28/2028, 1 mo. USD LIBOR +1.750%(11) 2,479,831
Go Daddy Operating Co. LLC3,488,594 1.85%, 02/15/2024, 1 mo. USD LIBOR +
1.750% 3,459,395
Shares or Principal Amount Market Value†
SENIOR FLOATING RATE INTERESTS - 4.4%(10) - (continued)Software - 0.8% - (continued)
$ 202,950 2.10%, 08/10/2027, 1 mo. USD LIBOR +2.000% $ 201,586
792,286Hyland Software, Inc. 4.25%, 07/01/2024,
1 mo. USD LIBOR + 3.500% 792,943165,000 Ingram Micro, Inc. 0.00%, 03/31/2028(11) 165,206
99,247Navicure, Inc.4.10%, 10/23/2026, 1 mo. USD
LIBOR + 4.000% 99,325
219,450Peraton Holding Corp.4.50%, 02/01/2028,
1 mo. USD LIBOR + 3.750% 219,907170,000 Proofpoint, Inc.0.00%, 06/09/2028(11) 168,960
136,500
Quest Software U.S. Holdings, Inc.4.44%, 05/18/2025, 3 mo. USD LIBOR +4.250% 136,310
305,000RealPage, Inc. 3.75%, 04/22/2028, 1 mo. USD
LIBOR + 3.250% 303,933
1,089,885
SS&C European Holdings S.a.r.l.1.85%, 04/16/2025, 1 mo. USD LIBOR +1.750% 1,076,261
2,608,334SS&C Technologies, Inc. 1.85%, 04/16/2025,
1 mo. USD LIBOR + 1.750% 2,576,282Ultimate Software Group, Inc.
137,550 3.85%, 05/03/2026, 3 mo. USD LIBOR +3.750% 137,564
203,465 4.00%, 05/03/2026, 1 mo. USD LIBOR +3.250% 203,583
4,129,650WEX, Inc. 2.35%, 04/01/2028, 1 mo. USD
LIBOR + 2.250% 4,096,117
541,778Zelis Healthcare Corp. 3.59%, 09/30/2026,
1 mo. USD LIBOR + 3.500% 539,881
18,761,922
Telecommunications - 0.1%
680,011Altice France S.A. 3.87%, 01/31/2026, 3 mo.
USD LIBOR + 3.688% 673,721230,000 Artera Services LLC 0.00%, 03/06/2025(11) 228,850
167,450CenturyLink, Inc. 2.35%, 03/15/2027, 1 mo.
USD LIBOR + 2.250% 165,064
244,388
Frontier Communications Corp.4.50%, 10/08/2027, 1 mo. USD LIBOR +3.750% 244,388
202,397Level 3 Financing, Inc. 1.85%, 03/01/2027,
1 mo. USD LIBOR + 1.750% 199,171
EUR 200,000Lorca Finco plc 4.25%, 09/17/2027, 6 mo.
EURIBOR + 4.250% 237,209
$ 320,000Telenet Financing USD LLC 2.07%,
04/30/2028, 6 mo. USD LIBOR + 2.000% 315,360
155,600Zacapa LLC 4.70%, 07/03/2025, 3 mo. USD
LIBOR + 4.500% 155,872Zayo Group Holdings, Inc.
258,329 3.10%, 03/09/2027, 1 mo. USD LIBOR +3.000% 255,444
EUR 98,750 3.25%, 03/09/2027, 3 mo. EURIBOR +3.250% 116,288
2,591,367
Transportation - 0.0%
$ 109,725CP Atlas Buyer, Inc. 4.25%, 11/23/2027, 1 mo.
USD LIBOR + 3.750% 109,371
99,750PODS LLC 3.75%, 03/31/2028, 1 mo. USD
LIBOR + 3.000% 99,501
259,350United Airlines, Inc. 4.50%, 04/21/2028, 1 mo.
USD LIBOR + 3.750% 262,519
The accompanying notes are an integral part of these financial statements.
67

p
123106 TX 68STATE STREET GLOBAL HLS SEMI-ANNUAL REPO
27-Jul-2021 20:50 ESTCLN PSLNF
Donnelley Financial LSWpf_rendNone
6*PMT 1C
FWPLAN-PFRS6021.6.2.0
Hartford Total Return Bond HLS FundSchedule of Investments – (continued)June 30, 2021 (Unaudited)
Shares or Principal Amount Market Value†
SENIOR FLOATING RATE INTERESTS - 4.4%(10) - (continued)Transportation - 0.0% - (continued)
EUR 100,000
Zephyr German BidCo GmbH3.75%, 03/10/2028, 3 mo. EURIBOR +3.750% $ 118,946
590,337
Total Senior Floating Rate Interests(cost $105,870,337) $ 104,957,245
U.S. GOVERNMENT AGENCIES - 40.6%Mortgage-Backed Agencies - 40.6%FHLMC - 3.6%
$ 75,239 0.00%, 11/15/2036(14)(15) $ 71,82120,767,214 0.74%, 03/25/2027(3)(5) 651,8584,908,794 0.75%, 10/25/2026(3)(5) 145,703
17,287,575 0.81%, 12/25/2030(3)(5) 1,044,698FHLMC
10,412,756 0.89%, 06/25/2027(3)(5) 413,8854,261,863 0.97%, 11/25/2030(3)(5) 304,9527,833,681 1.12%, 11/25/2053(3)(5) 639,285
12,884,380 1.21%, 06/25/2030(3)(5) 1,144,9006,273,876 1.68%, 05/25/2030(3)(5) 763,7381,061,556 1.75%, 10/15/2042 1,085,4481,485,120 1.94%, 09/25/2049, 1 mo. USD LIBOR +
1.850%(1)(2) 1,490,9083,684,753 2.44%, 02/25/2049, 1 mo. USD LIBOR +
2.350%(1)(2) 3,722,741472,507 2.50%, 05/15/2028(5) 27,950691,122 2.54%, 03/25/2049, 1 mo. USD LIBOR +
2.450%(1)(2) 701,8711,182,205 3.00%, 03/15/2028(5) 74,2661,367,033 3.00%, 08/01/2029 1,451,107
548,771 3.00%, 05/15/2032(5) 25,3513,990,412 3.00%, 10/01/2032 4,215,988
542,673 3.00%, 03/15/2033(5) 48,7532,675,759 3.00%, 04/01/2033 2,822,8272,972,837 3.00%, 11/01/2036 3,122,1681,757,572 3.00%, 01/01/2037 1,846,2454,225,000 3.00%, 08/15/2043 4,446,730
892,152 3.00%, 05/15/2046 931,7715,441,791 3.00%, 11/01/2046 5,778,6071,461,295 3.00%, 12/01/2046 1,550,107
628,232 3.25%, 11/15/2041 680,412322,900 3.50%, 06/15/2026(5) 5,900237,192 3.50%, 09/15/2026(5) 13,575341,658 3.50%, 03/15/2027(5) 18,814
1,923,055 3.50%, 05/15/2034(5) 173,6462,382,549 3.50%, 08/01/2034 2,555,4491,402,760 3.50%, 03/15/2041(5) 79,388
580,545 3.50%, 06/01/2046 619,8222,236,821 3.50%, 10/01/2047 2,368,498
747,493 3.50%, 12/01/2047 804,01411,957,464 3.50%, 03/01/2048 12,690,875
218,812 3.50%, 08/01/2048 233,6901,792,683 4.00%, 08/01/2025 1,906,089
725,724 4.00%, 12/15/2026(5) 37,2921,244,492 4.00%, 07/15/2027(5) 64,445
584,078 4.00%, 03/15/2028(5) 33,098321,208 4.00%, 06/15/2028(5) 20,378711,131 4.00%, 07/15/2030(5) 63,129
2,258,087 4.00%, 05/25/2040(5) 295,4741,921,165 4.00%, 05/01/2042 2,099,665
646,791 4.00%, 08/01/2042 707,2101,134,196 4.00%, 09/01/2042 1,247,987
111,115 4.00%, 07/01/2044 119,694205,468 4.00%, 06/01/2045 225,667938,059 4.00%, 02/01/2046 1,024,636
Shares or Principal Amount Market Value†
U.S. GOVERNMENT AGENCIES - 40.6% - (continued)Mortgage-Backed Agencies - 40.6% - (continued)FHLMC - 3.6% - (continued)
$ 205,052 4.00%, 09/01/2048 $ 219,080384,821 4.50%, 09/01/2044 421,679
1,685,586 4.75%, 07/15/2039 1,905,93622,112 5.00%, 02/01/2023 24,22052,081 5.00%, 08/01/2023 57,04554,797 5.00%, 03/01/2028 60,15122,532 5.00%, 08/01/2029 24,93536,759 5.00%, 07/01/2030 41,267
208,223 5.00%, 03/01/2031 234,415339,046 5.00%, 05/01/2031 381,699521,850 5.00%, 09/01/2031 576,971383,293 5.00%, 11/01/2031 430,210119,822 5.00%, 07/01/2032 132,623670,737 5.00%, 09/15/2033(5) 110,170
4,673 5.00%, 12/01/2034 5,13410,147 5.00%, 11/01/2035 11,64919,460 5.00%, 03/01/2039 21,787
196,432 5.00%, 08/01/2039 224,086FHLMC
7,503 5.00%, 09/01/2039 8,47610,179 5.00%, 12/01/2039 11,6878,541 5.00%, 04/01/2041 9,794
22,525 5.00%, 04/01/2044 25,82710,711 5.00%, 05/01/2044 11,82315,067 5.00%, 05/01/2047 16,670
849,444 5.00%, 02/15/2048(5) 168,78833,621 5.00%, 08/01/2048 36,97913,232 5.00%, 11/01/2048 14,50870,551 5.00%, 01/01/2049 77,36086,787 5.00%, 02/01/2049 95,265
1,507,853 5.00%, 03/01/2049 1,660,27822,567 5.50%, 03/01/2028 25,20047,811 5.50%, 04/01/2033 55,210
581,572 5.50%, 05/01/2034 673,893823 5.50%, 11/01/2035 955
11,583 5.50%, 05/01/2037 13,48129,589 5.50%, 11/01/2037 34,46351,896 5.50%, 02/01/2038 60,46821,505 5.50%, 04/01/2038 25,05626,932 5.50%, 06/01/2038 31,349
3,010,665 5.50%, 08/01/2038 3,505,346308,549 5.50%, 09/01/2038 359,198
5,767 5.50%, 12/01/2039 6,71477,731 5.50%, 02/01/2040 90,486
252,260 5.50%, 05/01/2040 293,817256,200 5.50%, 08/01/2040 298,070
1,211,774 5.50%, 06/01/2041 1,409,7951,093,009 5.50%, 10/15/2046(5) 224,449
1,152 6.00%, 07/01/2029 1,293140,176 6.00%, 10/01/2032 166,506117,741 6.00%, 11/01/2032 132,394178,063 6.00%, 12/01/2032 211,49913,990 6.00%, 11/01/2033 16,61926,277 6.00%, 01/01/2034 31,21614,586 6.00%, 02/01/2034 17,328
139,190 6.00%, 08/01/2034 165,361157,094 6.00%, 09/01/2034 183,546171,241 6.00%, 01/01/2035 193,399
1,127,070 6.00%, 11/01/2037 1,339,192231 6.50%, 08/01/2032 260
526,615 6.50%, 07/15/2036 600,732114,844 6.50%, 12/01/2037 133,516
78 7.50%, 09/01/2029 84
83,933,932
The accompanying notes are an integral part of these financial statements.
68

123106 TX 69STATE STREET GLOBAL HLS SEMI-ANNUAL REPO
27-Jul-2021 20:50 ESTCLN PSLNF
Donnelley Financial LSWpf_rendNone
6*PMT 1C
FWPLAN-PFRS6021.6.2.0
Hartford Total Return Bond HLS FundSchedule of Investments – (continued)June 30, 2021 (Unaudited)
Shares or Principal Amount Market Value†
U.S. GOVERNMENT AGENCIES - 40.6% - (continued)Mortgage-Backed Agencies - 40.6% - (continued)FNMA - 4.6%
$ 89,427 0.00%, 03/25/2036(14)(15) $ 80,623747,617 0.00%, 06/25/2036(14)(15) 703,961726,193 0.00%, 06/25/2041(14)(15) 681,775
8,676,460 0.42%, 01/25/2030(3)(5) 188,11311,773,503 1.56%, 05/25/2029(3)(5) 1,063,3021,524,982 1.70%, 08/25/2044(3)(5) 114,2501,934,573 1.74%, 05/25/2046(3)(5) 108,3351,589,667 1.75%, 12/25/2042 1,616,9291,953,492 1.80%, 04/25/2055(3)(5) 104,0741,373,448 1.84%, 06/25/2055(3)(5) 79,9841,042,120 2.00%, 09/25/2039 1,059,199
220,284 2.00%, 08/25/2043 221,740464,816 2.50%, 06/25/2028(5) 24,919
3,105,857 2.50%, 09/01/2040 3,227,306116,206 2.50%, 01/01/2043 121,155
2,910,810 2.50%, 02/01/2043 3,042,2151,095,877 2.50%, 03/01/2043 1,143,1932,250,740 2.50%, 05/01/2043 2,335,890
FNMA1,679,308 2.50%, 06/01/2043 1,755,1091,016,558 2.50%, 04/01/2045 1,055,964
897,852 3.00%, 02/25/2027(5) 38,428397,005 3.00%, 09/25/2027(5) 25,045
2,666,884 3.00%, 01/25/2028(5) 160,2914,641,964 3.00%, 04/25/2033(5) 330,6051,020,892 3.00%, 08/01/2033 1,078,8822,083,712 3.00%, 03/01/2037 2,194,444
770,445 3.00%, 05/25/2047 795,4611,820,330 3.00%, 09/01/2048 1,912,9582,519,568 3.00%, 08/25/2049 2,644,262
458,126 3.24%, 12/01/2026 504,878443,656 3.50%, 05/25/2027(5) 30,041720,790 3.50%, 10/25/2027(5) 52,664881,528 3.50%, 05/25/2030(5) 79,467244,508 3.50%, 08/25/2030(5) 20,576445,241 3.50%, 02/25/2031(5) 27,210534,254 3.50%, 09/25/2035(5) 62,592
3,693,651 3.50%, 11/25/2039(5) 397,2091,061,487 3.50%, 10/01/2044 1,152,3511,069,379 3.50%, 02/01/2045 1,145,5981,008,015 3.50%, 01/01/2046 1,076,651
774,695 3.50%, 03/01/2046 828,0811,917,809 3.50%, 09/01/2046 2,044,481
840,856 3.50%, 10/01/2046 893,049534,876 3.50%, 10/25/2046(5) 90,938893,331 3.50%, 11/01/2046 969,858
1,412,681 3.50%, 05/01/2047 1,508,0802,877,780 3.50%, 09/01/2047 3,056,152
523,587 3.50%, 12/01/2047 562,3811,977,452 3.50%, 01/01/2048 2,089,620
503,588 3.50%, 02/01/2048 539,486588,437 3.50%, 02/25/2048 616,788
2,073,417 3.50%, 07/01/2048 2,212,1846,266,693 3.50%, 09/01/2057 6,810,0883,663,953 3.50%, 05/01/2058 3,964,3713,807,984 3.50%, 12/25/2058 4,152,0011,853,342 3.74%, 06/01/2026 2,067,739
717,468 4.00%, 06/01/2025 762,348279,332 4.00%, 10/01/2025 297,128220,141 4.00%, 04/25/2032(5) 24,707
2,122,847 4.00%, 10/01/2040 2,327,300888,352 4.00%, 11/01/2040 968,482630,694 4.00%, 12/01/2040 687,200329,202 4.00%, 02/01/2041 359,609852,841 4.00%, 03/01/2041 932,260
Shares or Principal Amount Market Value†
U.S. GOVERNMENT AGENCIES - 40.6% - (continued)Mortgage-Backed Agencies - 40.6% - (continued)FNMA - 4.6% - (continued)
$ 2,230,933 4.00%, 06/01/2041 $ 2,428,828371,050 4.00%, 03/25/2042(5) 36,355415,060 4.00%, 08/01/2042 453,673877,765 4.00%, 09/01/2042 965,452221,540 4.00%, 11/25/2042(5) 30,650137,340 4.00%, 03/01/2045 150,312743,260 4.00%, 07/01/2045 817,373267,650 4.00%, 05/01/2046 288,769751,442 4.00%, 06/01/2046 813,203794,909 4.00%, 04/01/2047 863,299
2,447,529 4.00%, 10/01/2047 2,628,2261,635,843 4.00%, 09/01/2048 1,744,292
157,821 4.50%, 04/01/2025 165,929274,108 4.50%, 07/25/2027(5) 14,077620,111 4.50%, 09/01/2035 683,696
2,086,401 4.50%, 08/01/2040 2,320,9931,851,526 4.50%, 10/01/2040 2,055,796
857,282 4.50%, 10/01/2041 952,1412,081,420 4.50%, 08/25/2043(5) 386,073
FNMA744,886 4.50%, 09/01/2043 828,242
1,253,167 4.50%, 04/01/2049 1,350,7944,277,473 4.50%, 01/01/2051 4,771,656
104,415 5.00%, 06/01/2022 108,66194,203 5.00%, 06/01/2025 98,240
353,503 5.00%, 04/25/2038 389,7591,285,886 5.00%, 02/01/2049 1,414,245
188,336 5.00%, 03/01/2049 207,274123,372 5.49%, 05/25/2042(3)(5) 9,98311,963 5.50%, 06/01/2022 12,142
138,163 5.50%, 06/01/2033 159,42793,159 5.50%, 08/01/2033 107,464
706,067 5.50%, 09/01/2033 815,427693,629 5.50%, 12/01/2033 801,449453,992 5.50%, 01/01/2034 524,304
2,542,817 5.50%, 11/01/2035 2,948,458693,668 5.50%, 04/01/2036 804,307543,842 5.50%, 09/01/2036 627,84838,194 5.50%, 01/01/2037 43,835
392,657 5.50%, 04/25/2037 454,6302,231,188 5.50%, 11/25/2040(5) 322,3951,511,889 5.50%, 06/25/2042(5) 312,6451,895,033 5.50%, 08/25/2044(5) 363,146
239 6.00%, 03/01/2022 240268,970 6.00%, 12/01/2032 308,142211,410 6.00%, 01/01/2033 241,68041,089 6.00%, 02/01/2033 46,131
352,854 6.00%, 03/01/2033 411,789563,739 6.00%, 02/01/2037 668,790
1,512,913 6.00%, 01/25/2042(5) 167,1571,146,526 6.00%, 09/25/2047(5) 238,418
170 6.50%, 05/01/2031 190823 6.50%, 09/01/2031 941940 6.50%, 07/01/2032 1,061913 7.00%, 07/01/2029 1,05478 7.00%, 12/01/2030 81
277 7.00%, 02/01/2032 283124 7.00%, 03/01/2032 145
1,555 7.00%, 09/01/2032 1,679381 7.50%, 10/01/2022 393
1,043 7.50%, 06/01/2027 1,1869,028 7.50%, 03/01/2030 10,1847,033 7.50%, 04/01/2030 7,554
849 7.50%, 06/01/2030 9771,297 7.50%, 07/01/2030 1,480
The accompanying notes are an integral part of these financial statements.
69

p
123106 TX 70STATE STREET GLOBAL HLS SEMI-ANNUAL REPO
27-Jul-2021 20:50 ESTCLN PSLNF
Donnelley Financial LSWpf_rendNone
7*PMT 1C
FWPLAN-PFRS6021.6.2.0
Hartford Total Return Bond HLS FundSchedule of Investments – (continued)June 30, 2021 (Unaudited)
Shares or Principal Amount Market Value†
U.S. GOVERNMENT AGENCIES - 40.6% - (continued)Mortgage-Backed Agencies - 40.6% - (continued)FNMA - 4.6% - (continued)
$ 394 7.50%, 08/01/2030 $ 4506,433 7.50%, 01/01/2031 6,568
12,645 7.50%, 05/01/2031 14,4424,787 7.50%, 06/01/2031 4,8761,014 7.50%, 08/01/2031 1,143
18,113 7.50%, 09/01/2031 18,390147 7.50%, 05/01/2032 172
108,653,044
GNMA - 8.5%894,055 1.75%, 09/20/2043 911,700759,869 2.00%, 01/20/2042 777,375870,623 2.50%, 12/16/2039 908,712
1,388,926 2.50%, 07/20/2041 1,443,1195,980,256 2.50%, 05/20/2051 6,186,514
31,100,000 2.50%, 06/20/2051 32,268,53822,115,000 2.50%, 07/21/2051(16) 22,891,617
469,197 3.00%, 09/20/2028(5) 29,5544,971,098 3.00%, 05/20/2035(5) 333,901
408,395 3.00%, 02/16/2043(5) 55,495GNMA
2,682,131 3.00%, 03/15/2045 2,814,308133,235 3.00%, 04/15/2045 139,797
1,794,278 3.00%, 07/15/2045 1,879,21048,652 3.00%, 08/15/2045 51,057
932,640 3.00%, 10/20/2047 967,36142,800,000 3.00%, 07/21/2051(16) 44,652,438
193,543 3.50%, 02/16/2027(5) 12,248490,870 3.50%, 03/20/2027(5) 32,953426,547 3.50%, 07/20/2040(5) 20,862617,882 3.50%, 02/20/2041(5) 23,076
1,173,838 3.50%, 04/20/2042(5) 94,2462,232,552 3.50%, 10/20/2042(5) 344,679
266,656 3.50%, 11/15/2042 289,1106,966 3.50%, 12/15/2042 7,490
170,525 3.50%, 02/15/2043 183,3599,623 3.50%, 03/15/2043 10,348
1,370,712 3.50%, 04/15/2043 1,474,0713,065,841 3.50%, 05/15/2043 3,289,170
218,983 3.50%, 05/20/2043(5) 34,1321,069,177 3.50%, 07/20/2043(5) 129,1802,707,510 3.50%, 06/20/2046 2,879,242
688,102 3.50%, 07/20/2046 731,866710,501 3.50%, 10/20/2046 757,279
2,798,423 3.50%, 02/20/2047 2,972,975870,949 3.50%, 08/20/2047 922,998619,554 3.50%, 11/20/2047 657,150766,892 3.50%, 03/20/2048 811,433
2,628,010 3.50%, 07/20/2049 2,758,7696,600,000 3.50%, 07/21/2051(16) 6,923,9416,575,000 3.50%, 08/19/2051(16) 6,901,3101,627,472 3.88%, 08/15/2042 1,808,293
130,443 4.00%, 12/16/2026(5) 7,2811,957,470 4.00%, 05/20/2029(5) 115,3952,584,638 4.00%, 07/20/2040 2,827,9542,935,757 4.00%, 09/20/2040 3,212,0084,550,544 4.00%, 10/20/2040 4,976,8621,065,395 4.00%, 12/20/2040 1,170,578
278,001 4.00%, 05/16/2042(5) 34,588415,560 4.00%, 03/20/2043(5) 69,322191,016 4.00%, 01/20/2044(5) 35,579
1,462,414 4.00%, 01/16/2046(5) 301,1151,453,728 4.00%, 03/20/2047(5) 180,836
736,278 4.00%, 11/20/2047 800,8012,329,097 4.00%, 03/20/2048 2,499,3126,376,417 4.00%, 07/20/2048 6,774,370
Shares or Principal Amount Market Value†
U.S. GOVERNMENT AGENCIES - 40.6% - (continued)Mortgage-Backed Agencies - 40.6% - (continued)GNMA - 8.5% - (continued)
$ 148,636 4.50%, 11/15/2039 $ 167,562897,879 4.50%, 05/15/2040 1,013,454
2,936,718 4.50%, 05/20/2040 3,247,785145,421 4.50%, 07/15/2041 162,225689,717 4.50%, 04/20/2045(5) 134,565
2,644,455 4.50%, 08/20/2045(5) 510,199268,827 4.50%, 01/20/2046 297,198
2,224,936 4.50%, 01/20/2047(5) 230,0891,940,290 4.50%, 05/20/2048(5) 294,7762,545,000 4.50%, 07/21/2051(16) 2,712,0161,755,714 5.00%, 02/16/2040(5) 318,798
337,004 5.00%, 05/20/2040 381,827864,944 5.00%, 06/15/2041 1,005,395
1,052,335 5.00%, 10/16/2041(5) 177,2411,301,112 5.00%, 03/15/2044 1,512,906
380,496 5.00%, 01/16/2047(5) 70,2754,400,000 5.00%, 07/21/2051(16) 4,961,063
350,605 5.50%, 03/15/2033 401,763487,385 5.50%, 04/15/2033 562,150565,024 5.50%, 05/15/2033 654,667
GNMA691,929 5.50%, 10/20/2034 811,913
1,476,243 5.50%, 03/20/2039(5) 213,0401,255,619 5.50%, 02/16/2047(5) 215,143
768,893 5.50%, 02/20/2047(5) 140,877848 6.00%, 12/15/2023 949859 6.00%, 01/15/2029 965749 6.00%, 04/15/2029 843
19,907 6.00%, 12/15/2031 22,342611 6.00%, 10/15/2032 727
14,131 6.00%, 06/15/2033 16,796525 6.00%, 03/15/2034 589
29,926 6.00%, 08/15/2034 35,26552,859 6.00%, 09/15/2034 59,92328,900 6.00%, 02/15/2035 34,253
204,373 6.00%, 12/15/2035 232,75223,365 6.00%, 02/15/2036 26,192
117,146 6.00%, 03/15/2036 138,71116,077 6.00%, 04/15/2036 18,01650,620 6.00%, 05/15/2036 58,800
127,538 6.00%, 06/15/2036 149,76042,375 6.00%, 07/15/2036 47,56817,850 6.00%, 08/15/2036 20,074
111,717 6.00%, 02/15/2037 132,300481 6.00%, 05/15/2037 563
223,033 6.00%, 06/15/2037 263,492163,968 6.00%, 07/15/2037 192,76335,692 6.00%, 08/15/2037 41,98958,149 6.00%, 10/15/2037 69,03430,638 6.00%, 11/15/2037 36,21453,901 6.00%, 12/15/2037 63,865
120,747 6.00%, 01/15/2038 139,4844,399 6.00%, 02/15/2038 4,950
10,470 6.00%, 05/15/2038 11,8193,544 6.00%, 06/15/2038 4,208
20,581 6.00%, 08/15/2038 23,98979,481 6.00%, 09/15/2038 90,99883,520 6.00%, 10/15/2038 96,726
152,983 6.00%, 11/15/2038 177,99029,049 6.00%, 12/15/2038 33,455
873 6.00%, 01/15/2039 1,00833,851 6.00%, 08/15/2039 38,45040,852 6.00%, 11/15/2039 47,48512,985 6.00%, 02/15/2040 14,556
519,951 6.00%, 06/15/2040 613,408
The accompanying notes are an integral part of these financial statements.
70

p
123106 TX 71STATE STREET GLOBAL HLS SEMI-ANNUAL REPO
28-Jul-2021 08:16 ESTCLN PSLNF
Donnelley Financial LSWmadas0dcNone
9*PMT 1C
VDI-W7-PFL-220621.7.8.0
Hartford Total Return Bond HLS FundSchedule of Investments – (continued)June 30, 2021 (Unaudited)
Shares or Principal Amount Market Value†
U.S. GOVERNMENT AGENCIES - 40.6% - (continued)Mortgage-Backed Agencies - 40.6% - (continued)GNMA - 8.5% - (continued)
$ 100,261 6.00%, 07/15/2040 $ 119,2121,209,103 6.00%, 09/20/2040(5) 201,388
527,664 6.00%, 06/15/2041 624,4581,151,433 6.00%, 02/20/2046(5) 201,838
17,982 6.50%, 06/15/2028 20,054393 6.50%, 07/15/2028 438
1,334 6.50%, 08/15/2028 1,48811,104 6.50%, 09/15/2028 12,382
698 6.50%, 10/15/2028 7781,108 6.50%, 11/15/2028 1,2363,994 6.50%, 12/15/2028 4,4541,413 6.50%, 01/15/2029 1,576
13,180 6.50%, 02/15/2029 14,698104,493 6.50%, 03/15/2029 116,53423,589 6.50%, 04/15/2029 26,3077,926 6.50%, 05/15/2029 8,840
116,408 6.50%, 06/15/2029 129,8224,614 6.50%, 07/15/2029 5,146
116 6.50%, 03/15/2031 129153,537 6.50%, 04/15/2031 171,29032,041 6.50%, 05/15/2031 36,959
GNMA6,236 6.50%, 06/15/2031 7,029
146,920 6.50%, 07/15/2031 164,24339,450 6.50%, 08/15/2031 43,99787,373 6.50%, 09/15/2031 97,44293,164 6.50%, 10/15/2031 103,900
220,634 6.50%, 11/15/2031 246,06141,201 6.50%, 12/15/2031 45,948
143,497 6.50%, 01/15/2032 160,10832,716 6.50%, 02/15/2032 37,86831,234 6.50%, 03/15/2032 34,834
136,095 6.50%, 04/15/2032 155,272583 6.50%, 05/15/2032 653
15,314 6.50%, 06/15/2032 17,0791,162 7.00%, 06/20/2030 1,178
459 7.00%, 02/15/2031 515162 7.00%, 06/15/2031 17597 7.00%, 08/15/2031 109
377 8.50%, 11/15/2024 379
199,362,892
UMBS - 23.9%9,235,000 0.00%, 08/17/2036(16) 9,622,8262,480,000 1.50%, 07/14/2051(16) 2,433,0169,600,000 2.00%, 07/19/2036(16) 9,904,961
175,531,000 2.00%, 07/14/2051(16) 177,471,441156,030,000 2.00%, 08/12/2051(16) 157,444,022
9,240,000 2.50%, 07/19/2036(16) 9,634,86632,456,000 2.50%, 07/14/2051(16) 33,590,69247,050,000 2.50%, 08/12/2051(16) 48,601,1807,626,000 3.00%, 07/19/2036(16) 8,014,221
33,702,000 3.00%, 07/14/2051(16) 35,138,28433,695,000 3.00%, 08/12/2051(16) 35,108,6119,475,000 3.50%, 07/14/2051(16) 9,975,583
13,200,000 4.00%, 07/14/2051(16) 14,059,54710,920,000 4.50%, 07/14/2051(16) 11,755,636
562,754,886
Total U.S. Government Agencies(cost $945,010,588) $ 954,704,754
Shares or Principal Amount Market Value†
U.S. GOVERNMENT SECURITIES - 18.2%U.S. Treasury Securities - 18.2%U.S. Treasury Bonds - 11.0%
$ 8,709,829 0.88%, 02/15/2047(17) $ 11,219,4621,965,046 1.00%, 02/15/2048(17)(18) 2,624,2064,005,000 1.25%, 05/15/2050 3,272,3671,490,000 1.88%, 02/15/2041 1,460,2007,650,000 1.88%, 02/15/2051 7,308,141
34,785,000 2.25%, 05/15/2041 36,230,7517,090,000 2.25%, 08/15/2046 7,335,657
10,965,000 2.38%, 05/15/2051 11,717,13078,145,000 2.88%, 08/15/2045 90,394,8396,175,000 3.00%, 02/15/2047 7,338,843
20,715,000 3.13%, 08/15/2044(18)(19) 24,876,61126,860,000 3.38%, 05/15/2044(18)(20) 33,513,09616,575,000 3.75%, 11/15/2043 21,770,227
259,061,530
U.S. Treasury Notes - 7.2%9,810,000 0.38%, 04/15/2024 9,797,7385,769,353 0.38%, 01/15/2027(17)(18) 6,386,629
97,135,000 0.63%, 05/15/2030(18) 90,870,55113,360,000 0.63%, 08/15/2030 12,456,63420,360,000 0.88%, 11/15/2030(18) 19,376,9941,596,775 1.00%, 02/15/2049(17) 2,152,943
U.S. Treasury Notes27,385,000 1.63%, 05/15/2031 27,838,564
168,880,053
Total U.S. Government Securities(cost $446,362,536) $ 427,941,583
COMMON STOCKS - 0.0%Energy - 0.0%
64,657Ascent Resources - Marcellus LLC
Class A(21)(22) $ 41,3806,767 Foresight Energy LLC(21)(22) 60,906
206,275,142 KCA Deutag(21)(22)(23) —30,559 Philadelphia Energy Solutions Class A(21)(22) —
102,286
Total Common Stocks(cost $3,317,134) $ 102,286
PREFERRED STOCKS - 0.1%Banks - 0.1%
2,242 U.S. Bancorp Series A, 3.50%(2)(9) $ 2,210,612
Total Preferred Stocks(cost $1,591,820) $ 2,210,612
WARRANTS - 0.0%Energy - 0.0%
16,740Ascent Resources - Marcellus LLC
Expires 03/30/2023(21)(22) $ 184
Total Warrants(cost $1,339) $ 184
Total Long-Term Investments(cost $2,956,950,207) $ 2,988,026,759
The accompanying notes are an integral part of these financial statements.
71

p
123106 TX 72STATE STREET GLOBAL HLS SEMI-ANNUAL REPO
28-Jul-2021 11:16 ESTCLN PSLNF
Donnelley Financial LSWmadas0dcNone
11*PMT 1C
VDI-W7-PFL-220621.7.8.0
Hartford Total Return Bond HLS FundSchedule of Investments – (continued)June 30, 2021 (Unaudited)
Shares or Principal Amount Market Value†
SHORT-TERM INVESTMENTS - 1.5%Repurchase Agreements - 1.2%
26,464,749
Fixed Income Clearing Corp. RepurchaseAgreement dated 06/30/2021 at 0.020%, dueon 07/01/2021 with a maturity value of$26,464,764; collateralized by U.S.Government Bond at 4.375%, maturing11/15/2030, with a market value of$26,994,114 $ 26,464,749
Securities Lending Collateral - 0.3%
1,155,328
Fidelity Investments Money Market Funds,Government Portfolio, Institutional Class,0.01%(24) 1,155,328
5,990,816
Goldman Sachs Financial Square Funds,Government Fund, Institutional Class,0.03%(24) 5,990,816
304,191Invesco Government & Agency Portfolio,
Institutional Class, 0.03%(24) 304,191
7,450,335
Total Short-Term Investments(cost $33,915,084) $ 33,915,084
Total Investments ExcludingPurchased Options(cost $2,990,865,291) 128.5% $ 3,021,941,843
Total Purchased Options(cost $2,626,157) 0.0% $ 866,055
Total Investments(cost $2,993,491,448) 128.5% $ 3,022,807,898
Other Assets and Liabilities (28.5)% (670,653,910)
Total Net Assets 100.0% $ 2,352,153,988
Note: Percentage of investments as shown is the ratio of the total market value to totalnet assets.
The Fund may refer to any one or more of the industry classifications used by oneor more widely recognized market indices, ratings group and/or as defined byFund management. Industry classifications may not be identical across allsecurity types.
Equity Industry classifications used in this report are the Global IndustryClassification Standard, which was developed by and is the exclusive propertyand service mark of MSCI, Inc. and Standard & Poor’s.
For Fund compliance purposes, the Fund may not use the same classificationsystem. These classifications are used for financial reporting purposes.
See “Glossary” for abbreviation descriptions.
(1) Security was purchased pursuant to Rule 144A under the Securities Act of 1933 andmay be sold in transactions that are exempt from registration (typically only toqualified institutional buyers) or in a public offering registered under the Securities Actof 1933. At June 30, 2021, the aggregate value of these securities was $677,541,038,representing 28.8% of net assets.
(2) Variable rate securities; the rate reported is the coupon rate in effect at June 30,2021. Base lending rates may be subject to a floor or cap.
(3) Variable or floating rate security, which interest rate adjusts periodically based onchanges in current interest rates and prepayments on the underlying pool of assets.Rate shown is the rate in effect as of period end.
(4) Security is a “step-up” bond where coupon increases or steps up at a predetermineddate. Rate shown is current coupon rate.
(5) Securities disclosed are interest-only strips.
(6) Represents entire or partial securities on loan. See Note 8 in the accompanying Notesto Financial Statements for securities lending information.
(7) Security is exempt from registration under Regulation S under the Securities Act of1933, which exempts from registration securities offered and sold outside of theUnited States. Security may not be offered or sold in the United States exceptpursuant to an exemption from, or in a transaction not subject to, the registrationrequirements of the Securities Act of 1933. At June 30, 2021, the aggregate value ofthese securities was $39,363,323, representing 1.7% of net assets.
(8) Fixed to variable rate investment. The rate shown reflects the fixed rate in effect atJune 30, 2021. Rate will reset at a future date. Base lending rates may be subject to afloor or cap.
(9) Perpetual maturity security. Maturity date shown is the next call date or final legalmaturity date, whichever comes first.
(10) Senior floating rate interests generally pay interest rates which are periodicallyadjusted by reference to a base short-term, floating lending rate plus a premium. Thebase lending rates are primarily the LIBOR, and secondarily the prime rate offered byone or more major United States banks (the “Prime Rate”) and the certificate ofdeposit rate or other base lending rates used by commercial lenders. Senior floatingrate interests often require prepayments from excess cash flows or permit theborrower to repay at its election. The rate at which the borrower repays cannot bepredicted with accuracy. As a result, the actual remaining maturity may besubstantially less than the stated maturities shown. Base lending rates may besubject to a floor or cap. Unless otherwise noted, the interest rate disclosed for thesesecurities represents the rate in effect as of June 30, 2021.
(11) Represents an unsettled loan commitment. The coupon rate will be determined attime of settlement.
(12) Non-income producing. For long-term debt securities, items identified are in default asto payment of interest and/or principal.
(13) This security, or a portion of this security, has unfunded loan commitments. As ofJune 30, 2021, the aggregate value of the unfunded commitment was $130,945,which rounds to 0.0% of total net assets.
(14) Securities disclosed are principal-only strips.
(15) Security is a zero-coupon bond.
(16) Represents or includes a TBA transaction.
(17) The principal amount for these securities are adjusted for inflation and the interestpayments equal a fixed percentage of the inflation-adjusted principal amount.
(18) All, or a portion of the security, was pledged as collateral in connection withOTC swap contracts. As of June 30, 2021, the market value of securities pledgedwas $8,102,208.
(19) All, or a portion of the security, was pledged as collateral in connection withfutures contracts. As of June 30, 2021, the market value of securities pledgedwas $8,406,289.
(20) All, or a portion of the security, was pledged as collateral in connection with centrallycleared swap contracts. As of June 30, 2021, the market value of securities pledgedwas $15,658,576.
(21) Investment valued using significant unobservable inputs.
(22) These securities are valued in good faith at fair value as determined under policiesand procedures established by and under the supervision of the Board of Directors. AtJune 30, 2021, the aggregate fair value of these securities was $102,470, whichrepresented 0.0% of total net assets. This amount excludes securities that areprincipally traded in certain foreign markets and whose prices are adjusted pursuantto a third party pricing service methodology approved by the Board of Directors.
The accompanying notes are an integral part of these financial statements.
72
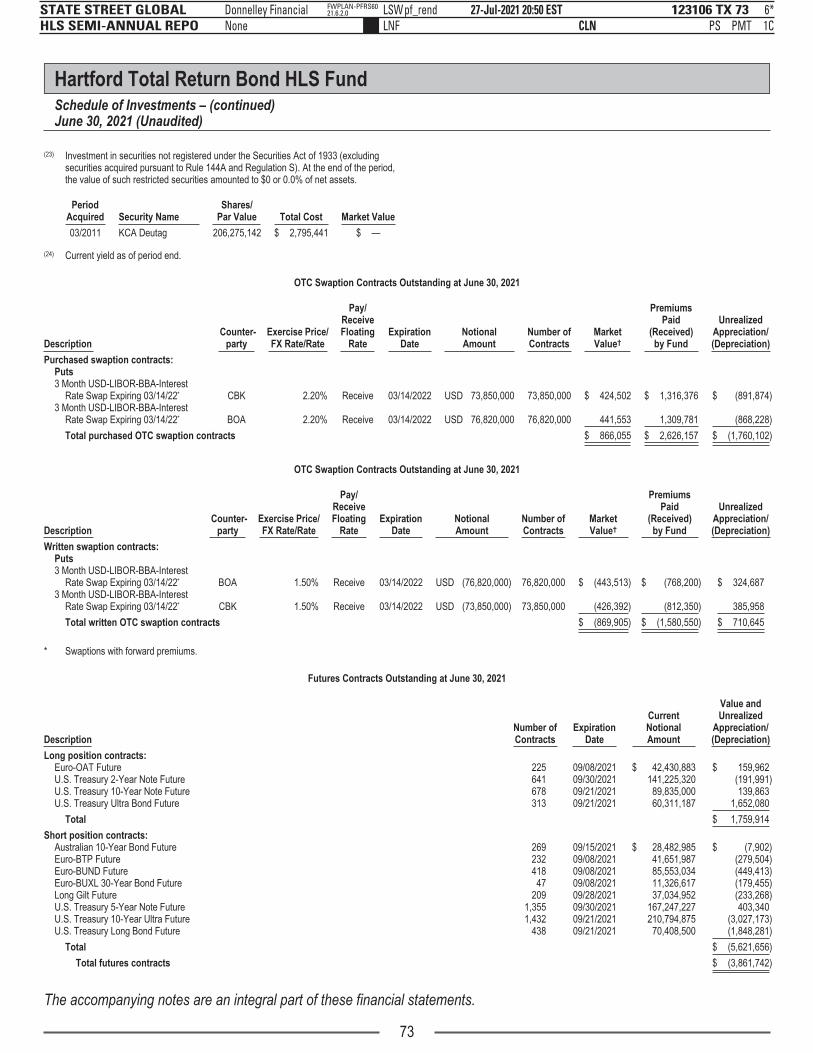
p
123106 TX 73STATE STREET GLOBAL HLS SEMI-ANNUAL REPO
27-Jul-2021 20:50 ESTCLN PSLNF
Donnelley Financial LSWpf_rendNone
6*PMT 1C
FWPLAN-PFRS6021.6.2.0
Hartford Total Return Bond HLS FundSchedule of Investments – (continued)June 30, 2021 (Unaudited)
(23) Investment in securities not registered under the Securities Act of 1933 (excludingsecurities acquired pursuant to Rule 144A and Regulation S). At the end of the period,the value of such restricted securities amounted to $0 or 0.0% of net assets.
PeriodAcquired Security Name
Shares/Par Value Total Cost Market Value
03/2011 KCA Deutag 206,275,142 $ 2,795,441 $ —
(24) Current yield as of period end.
OTC Swaption Contracts Outstanding at June 30, 2021
DescriptionCounter-
partyExercise Price/FX Rate/Rate
Pay/ReceiveFloating
RateExpiration
DateNotionalAmount
Number ofContracts
MarketValue†
PremiumsPaid
(Received)by Fund
UnrealizedAppreciation/(Depreciation)
Purchased swaption contracts:Puts3 Month USD-LIBOR-BBA-Interest
Rate Swap Expiring 03/14/22* CBK 2.20% Receive 03/14/2022 USD 73,850,000 73,850,000 $ 424,502 $ 1,316,376 $ (891,874)3 Month USD-LIBOR-BBA-Interest
Rate Swap Expiring 03/14/22* BOA 2.20% Receive 03/14/2022 USD 76,820,000 76,820,000 441,553 1,309,781 (868,228)
Total purchased OTC swaption contracts $ 866,055 $ 2,626,157 $ (1,760,102)
OTC Swaption Contracts Outstanding at June 30, 2021
DescriptionCounter-
partyExercise Price/FX Rate/Rate
Pay/ReceiveFloating
RateExpiration
DateNotionalAmount
Number ofContracts
MarketValue†
PremiumsPaid
(Received)by Fund
UnrealizedAppreciation/(Depreciation)
Written swaption contracts:Puts3 Month USD-LIBOR-BBA-Interest
Rate Swap Expiring 03/14/22* BOA 1.50% Receive 03/14/2022 USD (76,820,000) 76,820,000 $ (443,513) $ (768,200) $ 324,6873 Month USD-LIBOR-BBA-Interest
Rate Swap Expiring 03/14/22* CBK 1.50% Receive 03/14/2022 USD (73,850,000) 73,850,000 (426,392) (812,350) 385,958
Total written OTC swaption contracts $ (869,905) $ (1,580,550) $ 710,645
* Swaptions with forward premiums.
Futures Contracts Outstanding at June 30, 2021
DescriptionNumber ofContracts
ExpirationDate
CurrentNotionalAmount
Value andUnrealized
Appreciation/(Depreciation)
Long position contracts:Euro-OAT Future 225 09/08/2021 $ 42,430,883 $ 159,962U.S. Treasury 2-Year Note Future 641 09/30/2021 141,225,320 (191,991)U.S. Treasury 10-Year Note Future 678 09/21/2021 89,835,000 139,863U.S. Treasury Ultra Bond Future 313 09/21/2021 60,311,187 1,652,080
Total $ 1,759,914
Short position contracts:Australian 10-Year Bond Future 269 09/15/2021 $ 28,482,985 $ (7,902)Euro-BTP Future 232 09/08/2021 41,651,987 (279,504)Euro-BUND Future 418 09/08/2021 85,553,034 (449,413)Euro-BUXL 30-Year Bond Future 47 09/08/2021 11,326,617 (179,455)Long Gilt Future 209 09/28/2021 37,034,952 (233,268)U.S. Treasury 5-Year Note Future 1,355 09/30/2021 167,247,227 403,340U.S. Treasury 10-Year Ultra Future 1,432 09/21/2021 210,794,875 (3,027,173)U.S. Treasury Long Bond Future 438 09/21/2021 70,408,500 (1,848,281)
Total $ (5,621,656)
Total futures contracts $ (3,861,742)
The accompanying notes are an integral part of these financial statements.
73

123106 TX 74STATE STREET GLOBAL HLS SEMI-ANNUAL REPO
27-Jul-2021 20:50 ESTCLN PSLNF
Donnelley Financial LSWpf_rendNone
5*PMT 1C
FWPLAN-PFRS6021.6.2.0
Hartford Total Return Bond HLS FundSchedule of Investments – (continued)June 30, 2021 (Unaudited)
TBA Sale Commitments Outstanding at June 30, 2021
DescriptionPrincipalAmount
MaturityDate
MarketValue†
UnrealizedAppreciation/(Depreciation)
GNMA, 2.00% $ 19,205,000 07/21/2051 $ (19,575,597) $ (58,512)GNMA, 4.00% 6,329,000 07/21/2051 (6,683,028) 39,556UMBS, 1.50% 19,415,000 07/19/2036 (19,656,345) 33,957UMBS, 5.00% 2,509,500 07/14/2051 (2,755,389) 3,698UMBS, 5.50% 13,400,000 07/14/2051 (14,942,240) (26,365)UMBS, 6.00% 3,300,000 07/14/2051 (3,703,008) 14,648
Total (proceeds receivable $67,322,589) $ (67,315,607) $ 6,982
At June 30, 2021, the aggregate market value of TBA Sale Commitments represents (2.9)% of total net assets.
OTC Credit Default Swap Contracts Outstanding at June 30, 2021
Reference EntityCounter-
partyNotionalAmount(a)
(Pay)/ReceiveFixed Rate
ExpirationDate
PeriodicPayment
Frequency
UpfrontPremiums
Paid
UpfrontPremiumsReceived
MarketValue†
UnrealizedAppreciation/(Depreciation)
Credit default swaps on indices:Buy protection:ABX.HE.AAA.07 GSC USD 1,290,593 (0.09%) 08/25/2037 Monthly $ 230,182 $ — $ 51,507 $ (178,675)ABX.HE.AAA.07 CSFB USD 3,137,179 (0.09%) 08/25/2037 Monthly 643,356 — 125,196 (518,160)ABX.HE.PENAAA.06 MSC USD 392,394 (0.11%) 05/25/2046 Monthly 37,536 — 35,271 (2,265)ABX.HE.PENAAA.06 JPM USD 895,806 (0.11%) 05/25/2046 Monthly 85,488 — 80,519 (4,969)ABX.HE.PENAAA.06 GSC USD 367,698 (0.11%) 05/25/2046 Monthly 89,840 — 33,051 (56,789)
Total $ 1,086,402 $ — $ 325,544 $ (760,858)
Sell protection:ABX.HE.AAA.07 MSC USD 1,290,593 0.09% 08/25/2037 Monthly $ 10,317 $ — $ (51,504) $ (61,821)ABX.HE.AAA.07 MSC USD 3,137,177 0.09% 08/25/2037 Monthly 25,249 — (125,196) (150,445)ABX.HE.PENAAA.06 BCLY USD 1,655,903 0.11% 05/25/2046 Monthly — (39,175) (150,555) (111,380)CMBX.NA.BB.8 GSC USD 231,670 5.00% 10/17/2057 Monthly — (24,098) (82,994) (58,896)CMBX.NA.BB.8 DEUT USD 1,404,500 5.00% 10/17/2057 Monthly — (316,835) (503,149) (186,314)CMBX.NA.BB.8 CSFB USD 2,419,987 5.00% 10/17/2057 Monthly — (607,001) (866,938) (259,937)CMBX.NA.BB.8 GSC USD 3,325,431 5.00% 10/17/2057 Monthly — (746,855) (1,191,305) (444,450)CMBX.NA.BB.8 MSC USD 4,906,580 5.00% 10/17/2057 Monthly — (1,230,790) (1,757,737) (526,947)CMBX.NA.BBB-.6 DEUT USD 485,000 3.00% 05/11/2063 Monthly — (67,549) (128,035) (60,486)CMBX.NA.BBB-.6 MSC USD 465,000 3.00% 05/11/2063 Monthly — (37,212) (122,755) (85,543)CMBX.NA.BBB-.6 CSFB USD 920,000 3.00% 05/11/2063 Monthly — (119,608) (242,870) (123,262)CMBX.NA.BBB-.6 GSC USD 2,725,000 3.00% 05/11/2063 Monthly — (281,942) (712,558) (430,616)CMBX.NA.BBB-.6 MSC USD 4,245,000 3.00% 05/11/2063 Monthly — (585,037) (1,120,633) (535,596)
Total $ 35,566 $ (4,056,102) $ (7,056,229) $ (3,035,693)
Total OTC credit default swap contracts $ 1,121,968 $ (4,056,102) $ (6,730,685) $ (3,796,551)
(a) The maximum potential amount the Fund could be required to pay as a seller of credit protection or receive as a buyer of credit protection if a credit event occurs as defined under theterms of that particular swap agreement.
Centrally Cleared Credit Default Swap Contracts Outstanding at June 30, 2021
Reference EntityNotionalAmount(a)
(Pay)/ReceiveFixed Rate
ExpirationDate
PeriodicPayment
Frequency
UpfrontPremiums
Paid(Received) Value†
UnrealizedAppreciation/(Depreciation)
Credit default swaps on indices:Buy protection:CDX.NA.HY.36.V1 USD 14,780,000 (5.00%) 06/20/2026 Quarterly $ (1,469,931) $ (1,527,399) $ (57,468)
Credit default swaps on indices:Sell protection:CDX.EM.35.V1 USD 17,030,000 1.00% 06/20/2026 Quarterly $ (596,465) $ (443,259) $ 153,206CDX.NA.IG.36.V1 USD 4,395,000 1.00% 06/20/2026 Quarterly 92,087 112,671 20,584
Total $ (504,378) $ (330,588) $ 173,790
The accompanying notes are an integral part of these financial statements.
74

j p
123106 TX 75STATE STREET GLOBAL HLS SEMI-ANNUAL REPO
28-Jul-2021 08:25 ESTCLN PSLNF
Donnelley Financial LSWmadas0dcNone
8*PMT 1C
VDI-W7-PFL-220621.7.8.0
Hartford Total Return Bond HLS FundSchedule of Investments – (continued)June 30, 2021 (Unaudited)
Centrally Cleared Credit Default Swap Contracts Outstanding at June 30, 2021 – (continued)
Reference EntityNotionalAmount(a)
(Pay)/ReceiveFixed Rate
ExpirationDate
PeriodicPayment
Frequency
UpfrontPremiums
Paid(Received) Value†
UnrealizedAppreciation/(Depreciation)
Credit default swaps on single-name issues:Sell protection:Colombia Republic BBB- USD 11,785,000 1.00% 06/20/2026 Quarterly $ (150,552) $ (202,980) $ (52,428)Indonesia Republic BBB USD 5,745,000 1.00% 06/20/2026 Quarterly 29,812 72,723 42,911Panama Republic BBB USD 3,230,000 1.00% 06/20/2026 Quarterly 26,123 53,996 27,873Peruvian Gov International Bond BBB+ USD 5,755,000 1.00% 06/20/2026 Quarterly 38,967 50,959 11,992Republic of Brazil BB- USD 1,925,000 1.00% 06/20/2026 Quarterly (59,414) (59,354) 60Russian Federation BBB- USD 1,860,000 1.00% 06/20/2026 Quarterly 4,487 15,663 11,176United Mexican States BBB USD 2,090,000 1.00% 06/20/2026 Quarterly 2,098 6,726 4,628
Total $ (108,479) $ (62,267) $ 46,212
Total centrally cleared credit default swap contracts $ (2,082,788) $ (1,920,254) $ 162,534
(a) The maximum potential amount the Fund could be required to pay as a seller of credit protection or receive as a buyer of credit protection if a credit event occurs as defined under theterms of that particular swap agreement.
Centrally Cleared Interest Rate Swap Contracts Outstanding at June 30, 2021
Payments madeby Fund
Payments receivedby Fund
NotionalAmount
ExpirationDate
PeriodicPayment
Frequency
UpfrontPremiums
Paid
UpfrontPremiumsReceived Value†
UnrealizedAppreciation/(Depreciation)
0.07% Fixed 12 Mo. USD SOFR USD 18,225,000 08/12/2025 Annual $ — $ (1,749) $ 386,196 $ 387,945
Foreign Currency Contracts Outstanding at June 30, 2021
Amount and Description ofCurrency to be Purchased
Amount and Description ofCurrency to be Sold Counterparty
SettlementDate Appreciation Depreciation
3,108,229 USD 4,005,000 AUD MSC 09/15/2021 $ 103,697 $ —5,109,897 USD 26,085,000 BRL CBK 09/15/2021 — (85,154)5,239,413 USD 4,382,704 EUR BNP 07/30/2021 39,290 —
61,763,509 USD 50,707,000 EUR CBK 09/15/2021 1,542,355 —1,769,496 USD 1,451,000 EUR JPM 09/15/2021 46,245 —1,606,567 USD 1,317,000 EUR MSC 09/15/2021 42,459 —1,266,070 USD 1,042,000 EUR BOA 09/15/2021 28,559 —
11,149,383 USD 222,700,000 MXN BCLY 09/15/2021 85,303 —4,652,807 USD 343,540,000 RUB GSC 09/15/2021 10,422 —
Total Foreign Currency Contracts $ 1,898,330 $ (85,154)
† See Significant Accounting Policies of accompanying Notes to Financial Statements regarding valuation of investments.
The accompanying notes are an integral part of these financial statements.
75
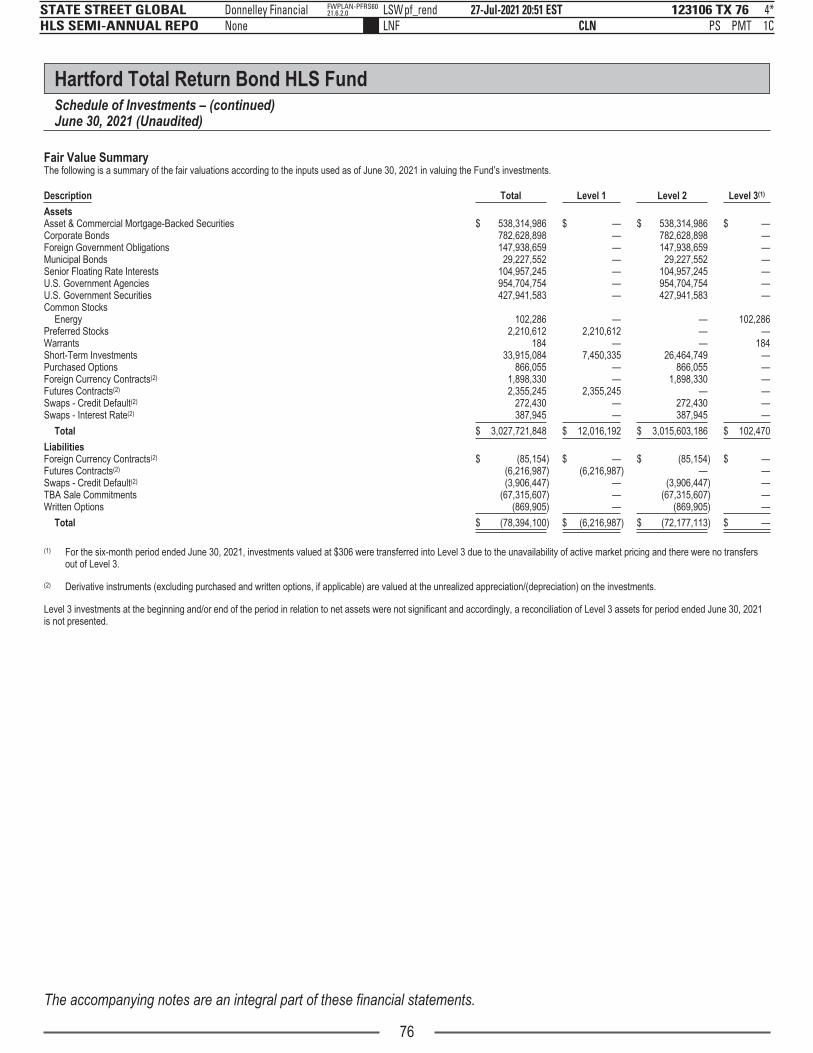
p
123106 TX 76STATE STREET GLOBAL HLS SEMI-ANNUAL REPO
27-Jul-2021 20:51 ESTCLN PSLNF
Donnelley Financial LSWpf_rendNone
4*PMT 1C
FWPLAN-PFRS6021.6.2.0
Hartford Total Return Bond HLS FundSchedule of Investments – (continued)June 30, 2021 (Unaudited)
Fair Value SummaryThe following is a summary of the fair valuations according to the inputs used as of June 30, 2021 in valuing the Fund’s investments.
Description Total Level 1 Level 2 Level 3(1)
AssetsAsset & Commercial Mortgage-Backed Securities $ 538,314,986 $ — $ 538,314,986 $ —Corporate Bonds 782,628,898 — 782,628,898 —Foreign Government Obligations 147,938,659 — 147,938,659 —Municipal Bonds 29,227,552 — 29,227,552 —Senior Floating Rate Interests 104,957,245 — 104,957,245 —U.S. Government Agencies 954,704,754 — 954,704,754 —U.S. Government Securities 427,941,583 — 427,941,583 —Common Stocks
Energy 102,286 — — 102,286Preferred Stocks 2,210,612 2,210,612 — —Warrants 184 — — 184Short-Term Investments 33,915,084 7,450,335 26,464,749 —Purchased Options 866,055 — 866,055 —Foreign Currency Contracts(2) 1,898,330 — 1,898,330 —Futures Contracts(2) 2,355,245 2,355,245 — —Swaps - Credit Default(2) 272,430 — 272,430 —Swaps - Interest Rate(2) 387,945 — 387,945 —
Total $ 3,027,721,848 $ 12,016,192 $ 3,015,603,186 $ 102,470
LiabilitiesForeign Currency Contracts(2) $ (85,154) $ — $ (85,154) $ —Futures Contracts(2) (6,216,987) (6,216,987) — —Swaps - Credit Default(2) (3,906,447) — (3,906,447) —TBA Sale Commitments (67,315,607) — (67,315,607) —Written Options (869,905) — (869,905) —
Total $ (78,394,100) $ (6,216,987) $ (72,177,113) $ —
(1) For the six-month period ended June 30, 2021, investments valued at $306 were transferred into Level 3 due to the unavailability of active market pricing and there were no transfersout of Level 3.
(2) Derivative instruments (excluding purchased and written options, if applicable) are valued at the unrealized appreciation/(depreciation) on the investments.
Level 3 investments at the beginning and/or end of the period in relation to net assets were not significant and accordingly, a reconciliation of Level 3 assets for period ended June 30, 2021is not presented.
The accompanying notes are an integral part of these financial statements.
76
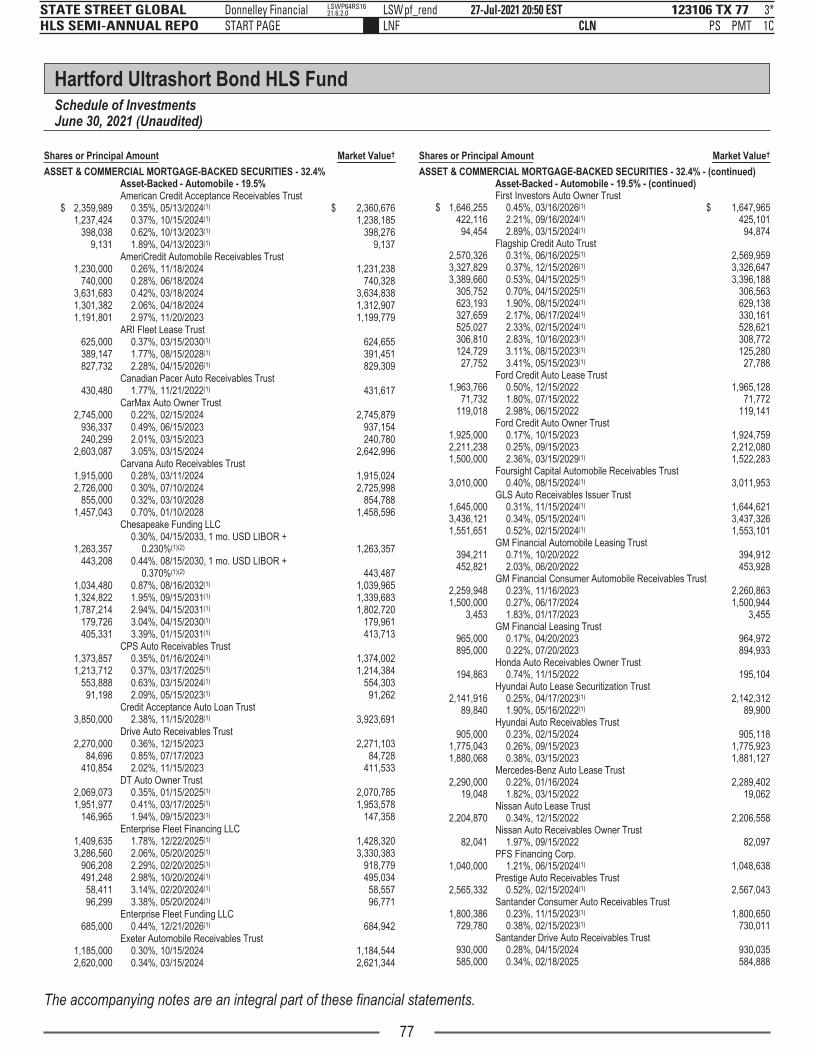
p
123106 TX 77STATE STREET GLOBAL HLS SEMI-ANNUAL REPO
27-Jul-2021 20:50 ESTCLN PSLNF
Donnelley Financial LSWpf_rendSTART PAGE
3*PMT 1C
LSWP64RS1621.6.2.0
Hartford Ultrashort Bond HLS FundSchedule of InvestmentsJune 30, 2021 (Unaudited)
Shares or Principal Amount Market Value†
ASSET & COMMERCIAL MORTGAGE-BACKED SECURITIES - 32.4%Asset-Backed - Automobile - 19.5%American Credit Acceptance Receivables Trust
$ 2,359,989 0.35%, 05/13/2024(1) $ 2,360,6761,237,424 0.37%, 10/15/2024(1) 1,238,185
398,038 0.62%, 10/13/2023(1) 398,2769,131 1.89%, 04/13/2023(1) 9,137
AmeriCredit Automobile Receivables Trust1,230,000 0.26%, 11/18/2024 1,231,238
740,000 0.28%, 06/18/2024 740,3283,631,683 0.42%, 03/18/2024 3,634,8381,301,382 2.06%, 04/18/2024 1,312,9071,191,801 2.97%, 11/20/2023 1,199,779
ARI Fleet Lease Trust625,000 0.37%, 03/15/2030(1) 624,655389,147 1.77%, 08/15/2028(1) 391,451827,732 2.28%, 04/15/2026(1) 829,309
430,480Canadian Pacer Auto Receivables Trust
1.77%, 11/21/2022(1) 431,617CarMax Auto Owner Trust
2,745,000 0.22%, 02/15/2024 2,745,879936,337 0.49%, 06/15/2023 937,154240,299 2.01%, 03/15/2023 240,780
2,603,087 3.05%, 03/15/2024 2,642,996Carvana Auto Receivables Trust
1,915,000 0.28%, 03/11/2024 1,915,0242,726,000 0.30%, 07/10/2024 2,725,998
855,000 0.32%, 03/10/2028 854,7881,457,043 0.70%, 01/10/2028 1,458,596
Chesapeake Funding LLC
1,263,3570.30%, 04/15/2033, 1 mo. USD LIBOR +
0.230%(1)(2) 1,263,357443,208 0.44%, 08/15/2030, 1 mo. USD LIBOR +
0.370%(1)(2) 443,4871,034,480 0.87%, 08/16/2032(1) 1,039,9651,324,822 1.95%, 09/15/2031(1) 1,339,6831,787,214 2.94%, 04/15/2031(1) 1,802,720
179,726 3.04%, 04/15/2030(1) 179,961405,331 3.39%, 01/15/2031(1) 413,713
CPS Auto Receivables Trust1,373,857 0.35%, 01/16/2024(1) 1,374,0021,213,712 0.37%, 03/17/2025(1) 1,214,384
553,888 0.63%, 03/15/2024(1) 554,30391,198 2.09%, 05/15/2023(1) 91,262
3,850,000Credit Acceptance Auto Loan Trust
2.38%, 11/15/2028(1) 3,923,691Drive Auto Receivables Trust
2,270,000 0.36%, 12/15/2023 2,271,10384,696 0.85%, 07/17/2023 84,728
410,854 2.02%, 11/15/2023 411,533DT Auto Owner Trust
2,069,073 0.35%, 01/15/2025(1) 2,070,7851,951,977 0.41%, 03/17/2025(1) 1,953,578
146,965 1.94%, 09/15/2023(1) 147,358Enterprise Fleet Financing LLC
1,409,635 1.78%, 12/22/2025(1) 1,428,3203,286,560 2.06%, 05/20/2025(1) 3,330,383
906,208 2.29%, 02/20/2025(1) 918,779491,248 2.98%, 10/20/2024(1) 495,03458,411 3.14%, 02/20/2024(1) 58,55796,299 3.38%, 05/20/2024(1) 96,771
685,000Enterprise Fleet Funding LLC
0.44%, 12/21/2026(1) 684,942Exeter Automobile Receivables Trust
1,185,000 0.30%, 10/15/2024 1,184,5442,620,000 0.34%, 03/15/2024 2,621,344
Shares or Principal Amount Market Value†
ASSET & COMMERCIAL MORTGAGE-BACKED SECURITIES - 32.4% - (continued)Asset-Backed - Automobile - 19.5% - (continued)First Investors Auto Owner Trust
$ 1,646,255 0.45%, 03/16/2026(1) $ 1,647,965422,116 2.21%, 09/16/2024(1) 425,10194,454 2.89%, 03/15/2024(1) 94,874
Flagship Credit Auto Trust2,570,326 0.31%, 06/16/2025(1) 2,569,9593,327,829 0.37%, 12/15/2026(1) 3,326,6473,389,660 0.53%, 04/15/2025(1) 3,396,188
305,752 0.70%, 04/15/2025(1) 306,563623,193 1.90%, 08/15/2024(1) 629,138327,659 2.17%, 06/17/2024(1) 330,161525,027 2.33%, 02/15/2024(1) 528,621306,810 2.83%, 10/16/2023(1) 308,772124,729 3.11%, 08/15/2023(1) 125,28027,752 3.41%, 05/15/2023(1) 27,788
Ford Credit Auto Lease Trust1,963,766 0.50%, 12/15/2022 1,965,128
71,732 1.80%, 07/15/2022 71,772119,018 2.98%, 06/15/2022 119,141
Ford Credit Auto Owner Trust1,925,000 0.17%, 10/15/2023 1,924,7592,211,238 0.25%, 09/15/2023 2,212,0801,500,000 2.36%, 03/15/2029(1) 1,522,283
3,010,000Foursight Capital Automobile Receivables Trust
0.40%, 08/15/2024(1) 3,011,953GLS Auto Receivables Issuer Trust
1,645,000 0.31%, 11/15/2024(1) 1,644,6213,436,121 0.34%, 05/15/2024(1) 3,437,3261,551,651 0.52%, 02/15/2024(1) 1,553,101
GM Financial Automobile Leasing Trust394,211 0.71%, 10/20/2022 394,912452,821 2.03%, 06/20/2022 453,928
GM Financial Consumer Automobile Receivables Trust2,259,948 0.23%, 11/16/2023 2,260,8631,500,000 0.27%, 06/17/2024 1,500,944
3,453 1.83%, 01/17/2023 3,455GM Financial Leasing Trust
965,000 0.17%, 04/20/2023 964,972895,000 0.22%, 07/20/2023 894,933
194,863Honda Auto Receivables Owner Trust
0.74%, 11/15/2022 195,104Hyundai Auto Lease Securitization Trust
2,141,916 0.25%, 04/17/2023(1) 2,142,31289,840 1.90%, 05/16/2022(1) 89,900
Hyundai Auto Receivables Trust905,000 0.23%, 02/15/2024 905,118
1,775,043 0.26%, 09/15/2023 1,775,9231,880,068 0.38%, 03/15/2023 1,881,127
Mercedes-Benz Auto Lease Trust2,290,000 0.22%, 01/16/2024 2,289,402
19,048 1.82%, 03/15/2022 19,062
2,204,870Nissan Auto Lease Trust
0.34%, 12/15/2022 2,206,558
82,041Nissan Auto Receivables Owner Trust
1.97%, 09/15/2022 82,097
1,040,000PFS Financing Corp.
1.21%, 06/15/2024(1) 1,048,638
2,565,332Prestige Auto Receivables Trust
0.52%, 02/15/2024(1) 2,567,043Santander Consumer Auto Receivables Trust
1,800,386 0.23%, 11/15/2023(1) 1,800,650729,780 0.38%, 02/15/2023(1) 730,011
Santander Drive Auto Receivables Trust930,000 0.28%, 04/15/2024 930,035585,000 0.34%, 02/18/2025 584,888
The accompanying notes are an integral part of these financial statements.
77

p
123106 TX 78STATE STREET GLOBAL HLS SEMI-ANNUAL REPO
27-Jul-2021 20:50 ESTCLN PSLNF
Donnelley Financial LSWpf_rendNone
2*PMT 1C
LSWP64RS1621.6.2.0
Hartford Ultrashort Bond HLS FundSchedule of Investments – (continued)June 30, 2021 (Unaudited)
Shares or Principal Amount Market Value†
ASSET & COMMERCIAL MORTGAGE-BACKED SECURITIES - 32.4% - (continued)Asset-Backed - Automobile - 19.5% - (continued)Santander Drive Auto Receivables Trust
$ 2,735,175 0.42%, 09/15/2023 $ 2,736,136364,258 0.46%, 09/15/2023 364,369128,285 0.62%, 05/15/2023 128,309
Santander Retail Auto Lease Trust1,960,000 0.31%, 01/22/2024(1) 1,958,8812,565,000 0.32%, 02/20/2024(1) 2,565,6052,465,752 0.42%, 11/20/2023(1) 2,469,995
786,015Securitized Term Auto Receivables Trust
2.99%, 02/27/2023(1) 793,462
1,780,000Tesla Auto Lease Trust
0.36%, 03/20/2025(1) 1,780,856Toyota Auto Receivables Owner Trust
2,807,104 0.23%, 05/15/2023 2,807,8861,239,732 0.36%, 02/15/2023 1,240,453
United Auto Credit Securitization Trust927,197 0.34%, 07/10/2023(1) 927,276
3,897 0.85%, 05/10/2022(1) 3,897
1,413,957Volkswagen Auto Lease Trust
1.99%, 11/21/2022 1,422,743
256,922Volkswagen Auto Loan Enhanced Trust
0.93%, 12/20/2022 257,230Westlake Automobile Receivables Trust
1,830,000 0.32%, 04/15/2025(1) 1,830,1243,740,000 0.39%, 10/15/2024(1) 3,743,4001,724,714 0.93%, 02/15/2024(1) 1,729,182
187,516 2.15%, 02/15/2023(1) 187,881
758,947Wheels SPV 2 LLC
0.51%, 08/20/2029(1) 760,137
785,334World Omni Auto Receivables Trust
0.55%, 07/17/2023 786,151
94,800World Omni Select Auto Trust
2.06%, 08/15/2023 94,862
144,811,829
Asset-Backed - Credit Card - 0.6%
1,150,000Evergreen Credit Card Trust
1.90%, 09/16/2024(1) 1,172,973HPEFS Equipment Trust
1,465,000 0.30%, 09/20/2028(1) 1,464,216341,606 1.73%, 02/20/2030(1) 342,821
1,355,000Trillium Credit Card Trust 0.47%, 12/26/2024, 1 mo.
USD LIBOR + 0.370%(1)(2) 1,357,432
4,337,442
Asset-Backed - Finance & Insurance - 7.2%
1,538,512American Credit Acceptance Receivables Trust
0.53%, 03/13/2024(1) 1,540,024
1,617,863Angel Oak Mortgage Trust
2.53%, 01/26/2065(1)(3) 1,645,608
840,058BRAVO Residential Funding Trust
0.94%, 02/25/2049(1)(3) 839,808
681,804BWAY Mortgage Trust
2.81%, 03/10/2033(1) 706,971CarMax Auto Owner Trust
378,039 1.75%, 01/17/2023 378,6431,326,760 2.33%, 05/15/2023 1,334,133
CNH Equipment Trust184,652 1.08%, 07/17/2023 184,966290,649 1.99%, 03/15/2023 290,885
3,455,000Credit Acceptance Auto Loan Trust
2.01%, 02/15/2029(1) 3,514,489DLL LLC
3,915,000 0.36%, 05/17/2024(1) 3,916,022483,322 2.89%, 04/20/2023(1) 487,369
Shares or Principal Amount Market Value†
ASSET & COMMERCIAL MORTGAGE-BACKED SECURITIES - 32.4% - (continued)Asset-Backed - Finance & Insurance - 7.2% - (continued)
$ 1,590,000Donlen Fleet Lease Funding LLC
0.56%, 12/11/2034(1) $ 1,591,757Ellington Financial Mortgage Trust
717,972 0.93%, 06/25/2066(1)(3) 716,274174,439 2.74%, 11/25/2059(1)(3) 177,482
825,145FCI Funding LLC
1.13%, 04/15/2033(1) 826,105
464,000GM Financial Automobile Leasing Trust
0.45%, 08/21/2023 464,988
1,635,642
GM Financial Consumer AutomobileReceivables Trust0.26%, 11/16/2023 1,636,294
742,000GMF Floorplan Owner Revolving Trust
2.70%, 04/15/2024(1) 756,422
737,616GreatAmerica Leasing Receivables Funding LLC
1.76%, 06/15/2022(1) 740,555HPEFS Equipment Trust
2,619,958 0.65%, 07/22/2030(1) 2,623,196461,139 2.21%, 09/20/2029(1) 462,548
1,279,190Hyundai Auto Receivables Trust
1.51%, 04/17/2023 1,283,881
657,312John Deere Owner Trust
0.41%, 03/15/2023 657,698Kubota Credit Owner Trust
1,900,000 0.31%, 04/15/2024(1) 1,900,089661,120 0.41%, 06/15/2023(1) 661,60939,558 2.49%, 06/15/2022(1) 39,594
Marlette Funding Trust674,719 0.60%, 06/16/2031(1) 675,11068,960 2.24%, 03/15/2030(1) 69,080
MMAF Equipment Finance LLC1,110,000 0.30%, 04/15/2024(1) 1,110,336
258,740 2.07%, 10/12/2022(1) 260,088
508,380New York City, NY Tax Lien
2.19%, 11/10/2032(1) 508,285
361,998Residential Mortgage Loan Trust
2.38%, 02/25/2024(1)(3) 367,185SoFi Consumer Loan Program Trust
410,723 2.45%, 08/25/2028(1) 413,239251,558 2.90%, 05/25/2028(1) 252,871
382,922Tesla Auto Lease Trust
0.55%, 05/22/2023(1) 383,470
475,924Toyota Auto Receivables Owner Trust
1.38%, 12/15/2022 477,025Verizon Owner Trust
4,000,000 0.41%, 04/21/2025 4,006,2692,359,000 2.33%, 12/20/2023 2,384,927
243,575 2.93%, 09/20/2023 246,480312,356 3.23%, 04/20/2023 314,505
5,330,000Volkswagen Auto Lease Trust
0.27%, 04/20/2023 5,333,653Volvo Financial Equipment LLC
137,884 2.02%, 08/15/2022(1) 138,132835,000 2.04%, 11/15/2023(1) 844,921
5,554,797Westlake Automobile Receivables Trust
0.56%, 05/15/2024(1) 5,564,731
816,329World Omni Automobile Lease Securitization Trust
0.32%, 09/15/2023 816,860
53,544,577
Commercial Mortgage-Backed Securities - 0.1%
785,000Morgan Stanley Bank of America Merrill
Lynch Trust 3.79%, 08/15/2045 807,095
The accompanying notes are an integral part of these financial statements.
78

p
123106 TX 79STATE STREET GLOBAL HLS SEMI-ANNUAL REPO
28-Jul-2021 08:26 ESTCLN PSLNF
Donnelley Financial LSWmadas0dcNone
3*PMT 1C
VDI-W7-PFL-220621.7.8.0
Hartford Ultrashort Bond HLS FundSchedule of Investments – (continued)June 30, 2021 (Unaudited)
Shares or Principal Amount Market Value†
ASSET & COMMERCIAL MORTGAGE-BACKED SECURITIES - 32.4% - (continued)Diversified Financial Services - 0.4%
$ 2,981,000SG Residential Mortgage Trust
1.16%, 07/25/2061(1)(3) $ 2,978,964
Other Asset-Backed Securities - 3.4%
1,710,000Amur Equipment Finance Receivables IX LLC
0.75%, 11/20/2026(1) 1,709,965CarMax Auto Owner Trust
3,302,848 0.31%, 01/16/2024 3,305,120984,044 2.18%, 08/15/2024 998,335
2,552,556 Carvana Auto Receivables Trust 0.28%, 11/08/2023 2,553,4181,110,000 CCG Receivables Trust 0.30%, 06/14/2027(1) 1,108,4311,650,000 Crossroads Asset Trust 0.82%, 03/20/2024(1) 1,651,2891,045,000 Dell Equipment Finance Trust 0.33%, 05/22/2026(1) 1,045,942
3,555,000GreatAmerica Leasing Receivables Funding LLC
0.27%, 06/15/2023(1) 3,555,0841,220,000 HPEFS Equipment Trust 0.27%, 03/20/2031(1) 1,220,254
174,572 Nationstar HECM Loan Trust 2.65%, 06/25/2029(1)(3) 174,832SCF Equipment Leasing
3,500,000 0.42%, 08/20/2026(1) 3,500,0871,262,830 0.68%, 10/20/2025(1) 1,265,148
407,700SoFi Consumer Loan Program Trust
2.02%, 01/25/2029(1) 411,050Towd Point Mortgage Trust
573,1360.69%, 02/25/2057, 1 mo. USD LIBOR +
0.600%(1)(2) 573,1641,029,612 2.75%, 06/25/2057(1)(3) 1,058,623
78,611Transportation Finance Equipment Trust
1.90%, 01/24/2022(1) 78,702729,119 Verus Securitization Trust 2.64%, 11/25/2059(1)(4) 741,308
24,950,752
Whole Loan Collateral CMO - 1.2%
593,584Angel Oak Mortgage Trust LLC
2.99%, 07/26/2049(1)(3) 598,506
823,751Bunker Hill Loan Depositary Trust
2.72%, 11/25/2059(1)(4) 838,957COLT Mortgage Loan Trust
1,488,333 1.33%, 10/26/2065(1)(3) 1,491,510492,798 1.51%, 04/27/2065(1)(3) 494,701958,088 MFA Trust 1.01%, 01/26/2065(1)(3) 958,770
737,583New Residential Mortgage Loan Trust
4.00%, 08/27/2057(1)(3) 789,098
68,431OBX Trust 0.74%, 06/25/2057, 1 mo. USD LIBOR +
0.650%(1)(2) 68,484485,539 RMF Buyout Issuance Trust 2.16%, 02/25/2030(1)(3) 485,973108,030 Sequoia Mortgage Trust 3.50%, 02/25/2050(1)(3) 108,409
Starwood Mortgage Residential Trust802,366 0.94%, 05/25/2065(1)(3) 806,157637,064 2.28%, 02/25/2050(1)(3) 644,195
Verus Securitization Trust853,897 2.69%, 11/25/2059(1)(3) 869,649452,717 2.78%, 07/25/2059(1)(4) 458,401
8,612,810
Total Asset & Commercial Mortgage-BackedSecurities(cost $239,769,075) $ 240,043,469
CORPORATE BONDS - 30.7%Agriculture - 0.1%
675,000 Cargill, Inc. 1.38%, 07/23/2023(1) 687,430
Apparel - 0.2%1,550,000 VF Corp. 2.05%, 04/23/2022 1,570,966
Shares or Principal Amount Market Value†
CORPORATE BONDS - 30.7% - (continued)Auto Manufacturers - 3.1%American Honda Finance Corp.
$ 2,000,0000.31%, 01/21/2022, 3 mo. USD LIBOR +
0.120%(2) $ 2,001,0182,050,000 0.40%, 10/21/2022 2,052,115
General Motors Financial Co., Inc.2,000,000 3.45%, 04/10/2022 2,036,7841,000,000 3.55%, 07/08/2022 1,032,101
1,250,000Hyundai Capital America 1.14%, 07/08/2021, 3 mo.
USD LIBOR + 0.940%(1)(2) 1,250,149485,000 PACCAR Financial Corp. 0.80%, 06/08/2023 488,963
Toyota Motor Credit Corp.
2,352,0000.29%, 08/13/2021, 3 mo. USD LIBOR +
0.125%(2) 2,352,408
1,500,0000.34%, 04/06/2023, 1 mo. USD SOFR +
0.320%(2) 1,502,985
2,000,0000.35%, 01/11/2024, 3 mo. USD SOFR +
0.330%(2)(5) 2,006,3841,650,000 0.35%, 10/14/2022 1,652,1871,525,000 1.15%, 05/26/2022 1,538,035
Volkswagen Group of America Finance LLC1,600,000 0.75%, 11/23/2022(1) 1,606,044
750,000 3.13%, 05/12/2023(1) 783,0802,275,000 4.00%, 11/12/2021(1) 2,306,668
22,608,921
Beverages - 0.3%
2,275,000Coca-Cola European Partners plc
0.50%, 05/05/2023(1) 2,270,321
Biotechnology - 0.3%2,250,000 Royalty Pharma plc 0.75%, 09/02/2023(1) 2,256,322
Chemicals - 0.1%
430,000International Flavors & Fragrances, Inc.
0.70%, 09/15/2022(1) 430,238
Commercial Banks - 12.4%ABN Amro Bank N.V.
2,400,0000.71%, 08/27/2021, 3 mo. USD LIBOR +
0.570%(1)(2) 2,401,9922,450,000 3.40%, 08/27/2021(1) 2,462,098
Bank of America Corp.
1,875,0000.54%, 05/28/2024, 3 mo. USD BSBY3M +
0.430%(2) 1,876,144
1,525,0000.72%, 04/22/2025, 1 mo. USD SOFR +
0.690%(2) 1,533,526
1,250,000
0.81%, 10/24/2024, (0.81% fixed rate until10/24/2023; 3 mo. USD SOFR + 0.740%thereafter)(6) 1,255,033
Bank of New York Mellon Corp.750,000 0.29%, 04/26/2024, 1 mo. USD SOFR +
0.260%(2) 751,429640,000 1.95%, 08/23/2022 652,232675,000 Barclays Bank plc 1.70%, 05/12/2022 682,658
3,000,000BNP Paribas S.A. 0.56%, 08/07/2021, 3 mo. USD
LIBOR + 0.390%(1)(2) 3,001,2993,518,000 BPCE S.A. 3.00%, 05/22/2022(1) 3,601,569
Canadian Imperial Bank of Commerce
900,0000.85%, 03/17/2023, 3 mo. USD
SOFR + 0.800%(2) 908,910
1,500,000Capital One Financial Corp. 1.07%, 03/09/2022,
3 mo. USD LIBOR + 0.950%(2) 1,507,751350,000 Capital One NA 2.15%, 09/06/2022 356,665
Citigroup, Inc.
3,750,000
2.31%, 11/04/2022, (2.31% fixed rate until11/04/2021; 3 mo. USD SOFR + 0.867%thereafter)(6) 3,773,470
2,300,000 2.70%, 10/27/2022 2,366,6852,250,000 4.50%, 01/14/2022 2,301,207
The accompanying notes are an integral part of these financial statements.
79

123106 TX 80STATE STREET GLOBAL HLS SEMI-ANNUAL REPO
27-Jul-2021 20:50 ESTCLN PSLNF
Donnelley Financial LSWpf_rendNone
2*PMT 1C
LSWP64RS1621.6.2.0
Hartford Ultrashort Bond HLS FundSchedule of Investments – (continued)June 30, 2021 (Unaudited)
Shares or Principal Amount Market Value†
CORPORATE BONDS - 30.7% - (continued)Commercial Banks - 12.4% - (continued)
$ 1,550,000Cooperatieve Rabobank UA 0.32%, 01/12/2024,
3 mo. USD SOFR + 0.300%(2) $ 1,554,043Credit Suisse AG
750,0000.48%, 02/04/2022, 3 mo. USD
SOFR + 0.450%(2) 751,2231,945,000 2.10%, 11/12/2021 1,958,2951,550,000 Credit Suisse Group AG 3.57%, 01/09/2023(1) 1,574,497
Danske Bank A/S1,142,000 2.00%, 09/08/2021(1) 1,145,631
1,250,000
3.00%, 09/20/2022, (3.00% fixed rate until09/20/2021; 3 mo. USD LIBOR + 1.249%thereafter)(1)(6) 1,256,100
1,285,000 5.00%, 01/12/2022(1) 1,314,7902,000,000 Discover Bank 3.20%, 08/09/2021 2,001,293
705,000 Fifth Third Bank NA 1.80%, 01/30/2023(5) 720,348Goldman Sachs Group, Inc.
1,150,0000.44%, 01/27/2023, 3 mo. USD SOFR +
0.410%(2)(5) 1,150,792
1,500,0000.55%, 09/10/2024, 1 mo. USD SOFR +
0.500%(2) 1,498,527
1,765,000
0.63%, 11/17/2023, (0.63% fixed rate until11/17/2022; 3 mo. USD SOFR + 0.538%thereafter)(6) 1,765,383
525,000 Huntington National Bank 1.80%, 02/03/2023 536,303JP Morgan Chase & Co.
2,000,0000.58%, 06/01/2025, 1 mo. USD SOFR +
0.535%(2) 2,001,155
1,900,0000.63%, 03/16/2024, 3 mo. USD SOFR +
0.580%(2) 1,910,195KeyBank NA
1,250,0000.37%, 06/14/2024, 1 mo. USD SOFR +
0.320%(2) 1,251,883
2,000,0000.39%, 01/03/2024, 3 mo. USD SOFR +
0.340%(2) 2,001,8371,350,000 1.25%, 03/10/2023 1,369,7191,150,000 Macquarie Bank Ltd. 0.44%, 12/16/2022(1) 1,150,633
1,724,000Mitsubishi UFJ Financial Group, Inc.
3.54%, 07/26/2021 1,727,844Mizuho Financial Group, Inc.
1,100,0000.78%, 05/25/2024, 3 mo. USD LIBOR +
0.630%(2) 1,106,4392,762,000 2.95%, 02/28/2022 2,811,343
Morgan Stanley
1,800,0000.73%, 01/20/2023, 3 mo. USD SOFR +
0.700%(2) 1,805,112
1,125,000
0.73%, 04/05/2024, (0.73% fixed rate until04/05/2023; 1 mo. USD SOFR +0.616% thereafter)(6) 1,127,261
2,300,000 2.63%, 11/17/2021 2,320,7272,765,000 2.75%, 05/19/2022 2,826,5821,025,000 4.88%, 11/01/2022 1,082,846
675,000 National Australia Bank Ltd. 1.88%, 12/13/2022 690,484National Bank of Canada
875,000
0.90%, 08/15/2023, (0.90% fixed rate until08/15/2022; 12 mo. USD CMT + 0.770%thereafter)(2)(6) 879,734
1,290,000NatWest Markets plc 0.56%, 08/12/2024, 1 mo.
USD SOFR + 0.530%(1)(2) 1,294,452875,000 Nordea Bank Abp 1.00%, 06/09/2023(1) 885,211
875,000PNC Bank NA 0.48%, 02/24/2023, 3 mo. USD
LIBOR + 0.325%(2) 876,634
1,925,000Royal Bank of Canada 0.32%, 01/19/2024, 3 mo.
USD SOFR + 0.300%(2) 1,926,983Standard Chartered plc
1,360,000
2.74%, 09/10/2022, (2.74% fixed rate until09/10/2021; 3 mo. USD LIBOR + 1.200%thereafter)(1)(6) 1,365,599
Shares or Principal Amount Market Value†
CORPORATE BONDS - 30.7% - (continued)Commercial Banks - 12.4% - (continued)
$ 1,566,000 Synchrony Bank 3.00%, 06/15/2022 $ 1,601,255Toronto-Dominion Bank
2,700,0000.26%, 01/06/2023, 3 mo. USD SOFR +
0.240%(2) 2,701,964
750,0000.50%, 09/28/2023, 3 mo. USD SOFR +
0.450%(2)(5) 754,573
675,0000.51%, 01/27/2023, 3 mo. USD SOFR +
0.480%(2) 678,492
1,500,000Truist Financial Corp. 0.45%, 06/09/2025, 1 mo.
USD SOFR + 0.400%(2) 1,499,400
1,875,000UBS AG 0.36%, 06/01/2023, 1 mo. USD SOFR +
0.320%(1)(2)(5) 1,878,6563,425,000 UBS Group AG 2.65%, 02/01/2022(1) 3,473,310
91,660,216
Commercial Services - 0.1%
915,000Equifax, Inc. 1.03%, 08/15/2021, 3 mo. USD
LIBOR + 0.870%(2) 915,813
Construction Materials - 0.1%1,030,000 Martin Marietta Materials, Inc. 0.65%, 07/15/2023 1,032,266
Diversified Financial Services - 2.2%785,000 AIG Global Funding 0.80%, 07/07/2023(1) 790,219
1,700,000American Express Co. 0.78%, 11/05/2021, 3 mo.
USD LIBOR + 0.600%(2) 1,702,579994,082 DT Auto Owner Trust 0.54%, 04/15/2024(1) 995,326
53,111Exeter Automobile Receivables Trust
0.46%, 10/17/2022 53,117
988,762GM Financial Automobile Leasing Trust
0.35%, 11/21/2022 989,358
1,118,372GM Financial Consumer Automobile Receivables
Trust 0.35%, 07/17/2023 1,119,050
1,864,938Honda Auto Receivables Owner Trust
0.27%, 02/21/2023 1,865,689
1,285,316Hyundai Auto Lease Securitization Trust
0.36%, 01/17/2023(1) 1,286,250
1,575,000Intercontinental Exchange, Inc. 0.77%, 06/15/2023,
3 mo. USD LIBOR + 0.650%(2) 1,573,110229,432 Marlette Funding Trust 1.02%, 09/16/2030(1) 229,626
700,264Mercedes-Benz Auto Lease Trust
0.31%, 02/15/2023 700,567
585,000MMAF Equipment Finance LLC
0.38%, 08/14/2023(1) 585,579805,000 Nasdaq, Inc. 0.45%, 12/21/2022 804,667
573,518Volvo Financial Equipment LLC
0.37%, 04/17/2023(1) 573,991
1,838,702World Omni Auto Receivables Trust
0.35%, 12/15/2023 1,839,909936,546 World Omni Select Auto Trust 0.47%, 06/17/2024 937,277
16,046,314
Electric - 2.8%
3,175,000CenterPoint Energy, Inc. 0.63%, 03/02/2023, 3 mo.
USD LIBOR + 0.500%(2) 3,175,746445,000 Consumers Energy Co. 0.35%, 06/01/2023 444,148
2,400,000 DTE Energy Co. 0.55%, 11/01/2022 2,404,209
825,000Duke Energy Corp. 0.30%, 06/10/2023, 1 mo. USD
SOFR + 0.250%(2) 825,643
2,275,000Florida Power & Light Co. 0.28%, 05/10/2023, 1 mo.
USD SOFR + 0.250%(2) 2,273,705
1,520,000Mississippi Power Co. 0.35%, 06/28/2024, 1 mo.
USD SOFR + 0.300%(2) 1,520,851
1,070,000National Rural Utilities Cooperative Finance Corp.
1.75%, 01/21/2022 1,079,085
The accompanying notes are an integral part of these financial statements.
80
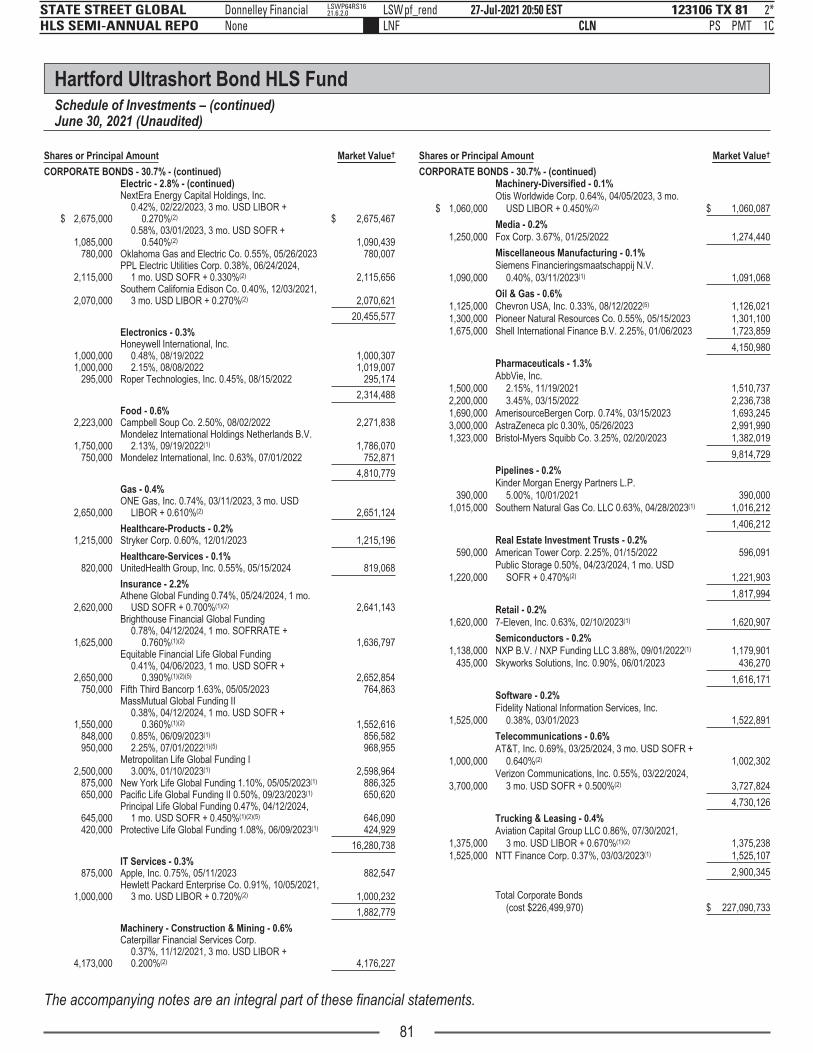
g p
123106 TX 81STATE STREET GLOBAL HLS SEMI-ANNUAL REPO
27-Jul-2021 20:50 ESTCLN PSLNF
Donnelley Financial LSWpf_rendNone
2*PMT 1C
LSWP64RS1621.6.2.0
Hartford Ultrashort Bond HLS FundSchedule of Investments – (continued)June 30, 2021 (Unaudited)
Shares or Principal Amount Market Value†
CORPORATE BONDS - 30.7% - (continued)Electric - 2.8% - (continued)NextEra Energy Capital Holdings, Inc.
$ 2,675,0000.42%, 02/22/2023, 3 mo. USD LIBOR +
0.270%(2) $ 2,675,467
1,085,0000.58%, 03/01/2023, 3 mo. USD SOFR +
0.540%(2) 1,090,439780,000 Oklahoma Gas and Electric Co. 0.55%, 05/26/2023 780,007
2,115,000PPL Electric Utilities Corp. 0.38%, 06/24/2024,
1 mo. USD SOFR + 0.330%(2) 2,115,656
2,070,000Southern California Edison Co. 0.40%, 12/03/2021,
3 mo. USD LIBOR + 0.270%(2) 2,070,621
20,455,577
Electronics - 0.3%Honeywell International, Inc.
1,000,000 0.48%, 08/19/2022 1,000,3071,000,000 2.15%, 08/08/2022 1,019,007
295,000 Roper Technologies, Inc. 0.45%, 08/15/2022 295,174
2,314,488
Food - 0.6%2,223,000 Campbell Soup Co. 2.50%, 08/02/2022 2,271,838
1,750,000Mondelez International Holdings Netherlands B.V.
2.13%, 09/19/2022(1) 1,786,070750,000 Mondelez International, Inc. 0.63%, 07/01/2022 752,871
4,810,779
Gas - 0.4%
2,650,000ONE Gas, Inc. 0.74%, 03/11/2023, 3 mo. USD
LIBOR + 0.610%(2) 2,651,124
Healthcare-Products - 0.2%1,215,000 Stryker Corp. 0.60%, 12/01/2023 1,215,196
Healthcare-Services - 0.1%820,000 UnitedHealth Group, Inc. 0.55%, 05/15/2024 819,068
Insurance - 2.2%
2,620,000Athene Global Funding 0.74%, 05/24/2024, 1 mo.
USD SOFR + 0.700%(1)(2) 2,641,143Brighthouse Financial Global Funding
1,625,0000.78%, 04/12/2024, 1 mo. SOFRRATE +
0.760%(1)(2) 1,636,797Equitable Financial Life Global Funding
2,650,0000.41%, 04/06/2023, 1 mo. USD SOFR +
0.390%(1)(2)(5) 2,652,854750,000 Fifth Third Bancorp 1.63%, 05/05/2023 764,863
MassMutual Global Funding II
1,550,0000.38%, 04/12/2024, 1 mo. USD SOFR +
0.360%(1)(2) 1,552,616848,000 0.85%, 06/09/2023(1) 856,582950,000 2.25%, 07/01/2022(1)(5) 968,955
2,500,000Metropolitan Life Global Funding I
3.00%, 01/10/2023(1) 2,598,964875,000 New York Life Global Funding 1.10%, 05/05/2023(1) 886,325650,000 Pacific Life Global Funding II 0.50%, 09/23/2023(1) 650,620
645,000Principal Life Global Funding 0.47%, 04/12/2024,
1 mo. USD SOFR + 0.450%(1)(2)(5) 646,090420,000 Protective Life Global Funding 1.08%, 06/09/2023(1) 424,929
16,280,738
IT Services - 0.3%875,000 Apple, Inc. 0.75%, 05/11/2023 882,547
1,000,000Hewlett Packard Enterprise Co. 0.91%, 10/05/2021,
3 mo. USD LIBOR + 0.720%(2) 1,000,232
1,882,779
Machinery - Construction & Mining - 0.6%
4,173,000
Caterpillar Financial Services Corp.0.37%, 11/12/2021, 3 mo. USD LIBOR +0.200%(2) 4,176,227
Shares or Principal Amount Market Value†
CORPORATE BONDS - 30.7% - (continued)Machinery-Diversified - 0.1%
$ 1,060,000Otis Worldwide Corp. 0.64%, 04/05/2023, 3 mo.
USD LIBOR + 0.450%(2) $ 1,060,087
Media - 0.2%
1,250,000 Fox Corp. 3.67%, 01/25/2022 1,274,440
Miscellaneous Manufacturing - 0.1%
1,090,000Siemens Financieringsmaatschappij N.V.
0.40%, 03/11/2023(1) 1,091,068
Oil & Gas - 0.6%
1,125,000 Chevron USA, Inc. 0.33%, 08/12/2022(5) 1,126,0211,300,000 Pioneer Natural Resources Co. 0.55%, 05/15/2023 1,301,1001,675,000 Shell International Finance B.V. 2.25%, 01/06/2023 1,723,859
4,150,980
Pharmaceuticals - 1.3%
AbbVie, Inc.1,500,000 2.15%, 11/19/2021 1,510,7372,200,000 3.45%, 03/15/2022 2,236,7381,690,000 AmerisourceBergen Corp. 0.74%, 03/15/2023 1,693,2453,000,000 AstraZeneca plc 0.30%, 05/26/2023 2,991,9901,323,000 Bristol-Myers Squibb Co. 3.25%, 02/20/2023 1,382,019
9,814,729
Pipelines - 0.2%
390,000Kinder Morgan Energy Partners L.P.
5.00%, 10/01/2021 390,0001,015,000 Southern Natural Gas Co. LLC 0.63%, 04/28/2023(1) 1,016,212
1,406,212
Real Estate Investment Trusts - 0.2%
590,000 American Tower Corp. 2.25%, 01/15/2022 596,091
1,220,000Public Storage 0.50%, 04/23/2024, 1 mo. USD
SOFR + 0.470%(2) 1,221,903
1,817,994
Retail - 0.2%
1,620,000 7-Eleven, Inc. 0.63%, 02/10/2023(1) 1,620,907
Semiconductors - 0.2%
1,138,000 NXP B.V. / NXP Funding LLC 3.88%, 09/01/2022(1) 1,179,901435,000 Skyworks Solutions, Inc. 0.90%, 06/01/2023 436,270
1,616,171
Software - 0.2%
1,525,000Fidelity National Information Services, Inc.
0.38%, 03/01/2023 1,522,891
Telecommunications - 0.6%
1,000,000AT&T, Inc. 0.69%, 03/25/2024, 3 mo. USD SOFR +
0.640%(2) 1,002,302
3,700,000Verizon Communications, Inc. 0.55%, 03/22/2024,
3 mo. USD SOFR + 0.500%(2) 3,727,824
4,730,126
Trucking & Leasing - 0.4%
1,375,000Aviation Capital Group LLC 0.86%, 07/30/2021,
3 mo. USD LIBOR + 0.670%(1)(2) 1,375,2381,525,000 NTT Finance Corp. 0.37%, 03/03/2023(1) 1,525,107
2,900,345
Total Corporate Bonds(cost $226,499,970) $ 227,090,733
The accompanying notes are an integral part of these financial statements.
81
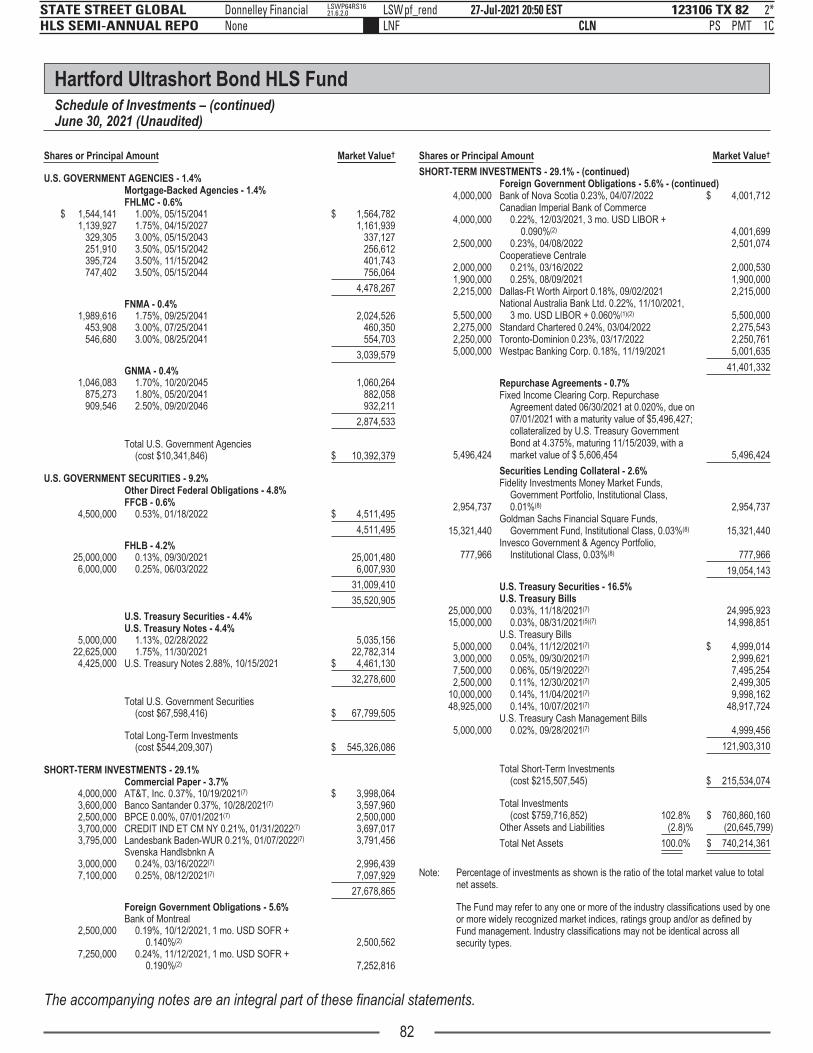
p
123106 TX 82STATE STREET GLOBAL HLS SEMI-ANNUAL REPO
27-Jul-2021 20:50 ESTCLN PSLNF
Donnelley Financial LSWpf_rendNone
2*PMT 1C
LSWP64RS1621.6.2.0
Hartford Ultrashort Bond HLS FundSchedule of Investments – (continued)June 30, 2021 (Unaudited)
Shares or Principal Amount Market Value†
U.S. GOVERNMENT AGENCIES - 1.4%Mortgage-Backed Agencies - 1.4%FHLMC - 0.6%
$ 1,544,141 1.00%, 05/15/2041 $ 1,564,7821,139,927 1.75%, 04/15/2027 1,161,939
329,305 3.00%, 05/15/2043 337,127251,910 3.50%, 05/15/2042 256,612395,724 3.50%, 11/15/2042 401,743747,402 3.50%, 05/15/2044 756,064
4,478,267
FNMA - 0.4%1,989,616 1.75%, 09/25/2041 2,024,526
453,908 3.00%, 07/25/2041 460,350546,680 3.00%, 08/25/2041 554,703
3,039,579
GNMA - 0.4%1,046,083 1.70%, 10/20/2045 1,060,264
875,273 1.80%, 05/20/2041 882,058909,546 2.50%, 09/20/2046 932,211
2,874,533
Total U.S. Government Agencies(cost $10,341,846) $ 10,392,379
U.S. GOVERNMENT SECURITIES - 9.2%Other Direct Federal Obligations - 4.8%FFCB - 0.6%
4,500,000 0.53%, 01/18/2022 $ 4,511,495
4,511,495
FHLB - 4.2%25,000,000 0.13%, 09/30/2021 25,001,4806,000,000 0.25%, 06/03/2022 6,007,930
31,009,410
35,520,905
U.S. Treasury Securities - 4.4%U.S. Treasury Notes - 4.4%
5,000,000 1.13%, 02/28/2022 5,035,15622,625,000 1.75%, 11/30/2021 22,782,3144,425,000 U.S. Treasury Notes 2.88%, 10/15/2021 $ 4,461,130
32,278,600
Total U.S. Government Securities(cost $67,598,416) $ 67,799,505
Total Long-Term Investments(cost $544,209,307) $ 545,326,086
SHORT-TERM INVESTMENTS - 29.1%Commercial Paper - 3.7%
4,000,000 AT&T, Inc. 0.37%, 10/19/2021(7) $ 3,998,0643,600,000 Banco Santander 0.37%, 10/28/2021(7) 3,597,9602,500,000 BPCE 0.00%, 07/01/2021(7) 2,500,0003,700,000 CREDIT IND ET CM NY 0.21%, 01/31/2022(7) 3,697,0173,795,000 Landesbank Baden-WUR 0.21%, 01/07/2022(7) 3,791,456
Svenska Handlsbnkn A3,000,000 0.24%, 03/16/2022(7) 2,996,4397,100,000 0.25%, 08/12/2021(7) 7,097,929
27,678,865
Foreign Government Obligations - 5.6%Bank of Montreal
2,500,000 0.19%, 10/12/2021, 1 mo. USD SOFR +0.140%(2) 2,500,562
7,250,000 0.24%, 11/12/2021, 1 mo. USD SOFR +0.190%(2) 7,252,816
Shares or Principal Amount Market Value†
SHORT-TERM INVESTMENTS - 29.1% - (continued)Foreign Government Obligations - 5.6% - (continued)
4,000,000 Bank of Nova Scotia 0.23%, 04/07/2022 $ 4,001,712Canadian Imperial Bank of Commerce
4,000,000 0.22%, 12/03/2021, 3 mo. USD LIBOR +0.090%(2) 4,001,699
2,500,000 0.23%, 04/08/2022 2,501,074Cooperatieve Centrale
2,000,000 0.21%, 03/16/2022 2,000,5301,900,000 0.25%, 08/09/2021 1,900,0002,215,000 Dallas-Ft Worth Airport 0.18%, 09/02/2021 2,215,000
5,500,000National Australia Bank Ltd. 0.22%, 11/10/2021,
3 mo. USD LIBOR + 0.060%(1)(2) 5,500,0002,275,000 Standard Chartered 0.24%, 03/04/2022 2,275,5432,250,000 Toronto-Dominion 0.23%, 03/17/2022 2,250,7615,000,000 Westpac Banking Corp. 0.18%, 11/19/2021 5,001,635
41,401,332
Repurchase Agreements - 0.7%
5,496,424
Fixed Income Clearing Corp. RepurchaseAgreement dated 06/30/2021 at 0.020%, due on07/01/2021 with a maturity value of $5,496,427;collateralized by U.S. Treasury GovernmentBond at 4.375%, maturing 11/15/2039, with amarket value of $ 5,606,454 5,496,424
Securities Lending Collateral - 2.6%
2,954,737
Fidelity Investments Money Market Funds,Government Portfolio, Institutional Class,0.01%(8) 2,954,737
15,321,440Goldman Sachs Financial Square Funds,
Government Fund, Institutional Class, 0.03%(8) 15,321,440
777,966Invesco Government & Agency Portfolio,
Institutional Class, 0.03%(8) 777,966
19,054,143
U.S. Treasury Securities - 16.5%U.S. Treasury Bills
25,000,000 0.03%, 11/18/2021(7) 24,995,92315,000,000 0.03%, 08/31/2021(5)(7) 14,998,851
U.S. Treasury Bills5,000,000 0.04%, 11/12/2021(7) $ 4,999,0143,000,000 0.05%, 09/30/2021(7) 2,999,6217,500,000 0.06%, 05/19/2022(7) 7,495,2542,500,000 0.11%, 12/30/2021(7) 2,499,305
10,000,000 0.14%, 11/04/2021(7) 9,998,16248,925,000 0.14%, 10/07/2021(7) 48,917,724
5,000,000U.S. Treasury Cash Management Bills
0.02%, 09/28/2021(7) 4,999,456
121,903,310
Total Short-Term Investments(cost $215,507,545) $ 215,534,074
Total Investments(cost $759,716,852) 102.8% $ 760,860,160
Other Assets and Liabilities (2.8)% (20,645,799)
Total Net Assets 100.0% $ 740,214,361
Note: Percentage of investments as shown is the ratio of the total market value to totalnet assets.
The Fund may refer to any one or more of the industry classifications used by oneor more widely recognized market indices, ratings group and/or as defined byFund management. Industry classifications may not be identical across allsecurity types.
The accompanying notes are an integral part of these financial statements.
82

p
123106 TX 83STATE STREET GLOBAL HLS SEMI-ANNUAL REPO
27-Jul-2021 20:50 ESTCLN PSLNF
Donnelley Financial LSWpf_rendNone
2*PMT 1C
LSWP64RS1621.6.2.0
Hartford Ultrashort Bond HLS FundSchedule of Investments – (continued)June 30, 2021 (Unaudited)
For Fund compliance purposes, the Fund may not use the same classificationsystem. These classifications are used for financial reporting purposes.
See “Glossary” for abbreviation descriptions.
(1) Security was purchased pursuant to Rule 144A under the Securities Act of 1933 andmay be sold in transactions that are exempt from registration (typically only toqualified institutional buyers) or in a public offering registered under the Securities Actof 1933. At June 30, 2021, the aggregate value of these securities was $224,347,855,representing 30.3% of net assets.
(2) Variable rate securities; the rate reported is the coupon rate in effect at June 30,2021. Base lending rates may be subject to a floor or cap.
(3) Variable or floating rate security, which interest rate adjusts periodically based onchanges in current interest rates and prepayments on the underlying pool of assets.Rate shown is the rate in effect as of period end.
(4) Security is a “step-up” bond where coupon increases or steps up at a predetermineddate. Rate shown is current coupon rate.
(5) Represents entire or partial securities on loan. See Note 8 in the accompanying Notesto Financial Statements for securities lending information.
(6) Fixed to variable rate investment. The rate shown reflects the fixed rate in effect atJune 30, 2021. Rate will reset at a future date. Base lending rates may be subject to afloor or cap.
(7) The rate shown represents current yield to maturity.
(8) Current yield as of period end.
† See Significant Accounting Policies of accompanying Notes to Financial Statementsregarding valuation of investments.
Fair Value SummaryThe following is a summary of the fair valuations according to the inputs used as of June 30, 2021 in valuing the Fund’s investments.
Description Total Level 1 Level 2 Level 3(1)
AssetsAsset & Commercial Mortgage-Backed Securities $ 240,043,469 $ — $ 240,043,469 $ —Corporate Bonds 227,090,733 — 227,090,733 —U.S. Government Agencies 10,392,379 — 10,392,379 —U.S. Government Securities 67,799,505 — 67,799,505 —Short-Term Investments 215,534,074 19,054,143 196,479,931 —
Total $ 760,860,160 $ 19,054,143 $ 741,806,017 $ —
(1) For the six-month period ended June 30, 2021, there were no transfers in and out of Level 3.
The accompanying notes are an integral part of these financial statements.
83

p
123106 TX 84STATE STREET GLOBAL HLS SEMI-ANNUAL REPO
27-Jul-2021 20:50 ESTCLN PSLNF
Donnelley Financial LSWpf_rendSTART PAGE
5*PMT 1C
LSWP64RS1621.6.2.0
Hartford HLS FundsGlossary (abbreviations used in the preceding Schedules of Investments)
Counterparty Abbreviations:
BCLY BarclaysBNP BNP Paribas Securities ServicesBOA Banc of America Securities LLCCBK Citibank NACSFB Credit Suisse First Boston Corp.DEUT Deutsche Bank Securities, Inc.GSC Goldman Sachs & Co.JPM JP Morgan Chase & Co.MSC Morgan Stanley
Currency Abbreviations:
AUD Australian DollarBRL Brazilian RealEUR EuroMXN Mexican PesoRUB Russian RubleUSD United States Dollar
Index Abbreviations:
ABX.HE Markit Asset Backed Security Home EquityABX.HE.PEN Markit Asset Backed Security Home Equity PenultimateCDX.EM Credit Derivatives Emerging MarketsCDX.NA.HY Credit Derivatives North American High YieldCDX.NA.IG Credit Derivatives North American Investment GradeCMBX.NA Markit Commercial Mortgage-Backed North AmericanCMT Constant Maturity Treasury IndexMTA Monthly Treasury Average Index
Municipal Abbreviations:
Auth AuthorityDev DevelopmentGO General ObligationRev RevenuePA Port Authority
Other Abbreviations:
ACWI All Country World IndexADR American Depositary ReceiptAGM Assured Guaranty Municipal Corp.AMBAC American Municipal Bond Assurance Corp.CD Certificate of DepositCLO Collateralized Loan ObligationCM California Mortgage InsuranceCMO Collateralized Mortgage ObligationCR Custody ReceiptsEM Emerging MarketsETF Exchange-Traded FundEURIBOR Euro Interbank Offered RateFFCB Federal Farm Credit BankFHLB Federal Home Loan BankFHLMC Federal Home Loan Mortgage Corp.FNMA Federal National Mortgage AssociationGNMA Government National Mortgage AssociationLIBOR London Interbank Offered RateMSCI Morgan Stanley Capital InternationalOTC Over-the-CounterPT Perseroan TerbatasPJSC Private Joint Stock CompanyREIT Real Estate Investment TrustSOFR Secured Overnight Financing RateTBA To Be AnnouncedUMBS Uniform Mortgage-Backed Securities
84

p
123106 TX 85STATE STREET GLOBAL HLS SEMI-ANNUAL REPO
28-Jul-2021 08:32 ESTCLN PSLNF
Donnelley Financial LSWmadas0dcSTART PAGE
4*PMT 1C
VDI-W7-PFL-220621.7.8.0
Hartford HLS FundsStatements of Assets and LiabilitiesJune 30, 2021 (Unaudited)
HartfordBalancedHLS Fund
HartfordCapital
AppreciationHLS Fund
HartfordDisciplined
EquityHLS Fund
HartfordDividend and
GrowthHLS Fund
Assets:Investments in securities, at market value(1) $ 2,157,198,128 $ 4,524,362,599 $ 3,327,126,612 $ 3,878,804,712Repurchase agreements 44,904,021 89,105,327 21,020,072 45,513,279Investments in affiliated investments, at market value 13,223,486 9,550,421 — —Cash 11,062,523 21,968,447 5,186,422 11,213,919Cash collateral held for securities on loan 1,923,586 2,181,676 — 2,284,882Cash collateral due from broker on future contracts 614 — — —Foreign currency — 20,376 — —Receivables:
Investment securities sold 25,739,222 5,322,741 — —Fund shares sold 9,264 15,449 18,025 967,528Dividends and interest 4,674,157 4,138,769 1,542,670 3,357,734Securities lending income 29,521 31,120 — 9,179Variation margin on futures contracts — 3,914,280 — —Tax reclaims 931,778 264,490 489,837 811,649
Other assets 9,156 14,359 18,409 11,524
Total assets 2,259,705,456 4,660,890,054 3,355,402,047 3,942,974,406
Liabilities:Obligation to return securities lending collateral 38,471,716 43,633,524 — 45,697,636Payables:
Investment securities purchased 37,842,546 7,050,176 — —Fund shares redeemed 732,962 1,333,151 1,369,147 1,227,800Investment management fees 1,061,452 2,416,821 1,534,319 2,021,325Transfer agent fees 3,576 5,371 7,872 5,223Accounting services fees 24,714 52,002 37,493 44,348Board of Directors’ fees 12,555 27,204 12,869 19,047Variation margin on futures contracts 33,709 — — —Distribution fees 5,274 11,096 9,494 9,250
Accrued expenses 64,779 205,442 161,331 131,282
Total liabilities 78,253,283 54,734,787 3,132,525 49,155,911
Net assets $ 2,181,452,173 $ 4,606,155,267 $ 3,352,269,522 $ 3,893,818,495
Summary of Net Assets:Capital stock and paid-in-capital $ 1,303,825,454 $ 2,796,153,844 $ 2,060,147,726 $ 1,912,977,438Distributable earnings 877,626,719 1,810,001,423 1,292,121,796 1,980,841,057
Net assets $ 2,181,452,173 $ 4,606,155,267 $ 3,352,269,522 $ 3,893,818,495
Shares authorized 9,500,000,000 5,450,000,000 3,610,000,000 4,000,000,000
Par value $ 0.0010 $ 0.0010 $ 0.0010 $ 0.0010
Class IA: Net asset value per share $ 35.32 $ 57.07 $ 19.88 $ 26.08
Shares outstanding 54,487,681 71,268,746 145,307,052 132,019,569
Net Assets $ 1,924,404,800 $ 4,067,371,398 $ 2,888,514,559 $ 3,443,319,443
Class IB: Net asset value per share $ 35.94 $ 55.89 $ 19.54 $ 25.88
Shares outstanding 7,152,598 8,887,804 19,376,625 17,408,136
Net Assets $ 257,047,373 $ 496,771,790 $ 378,668,371 $ 450,499,052
Class IC: Net asset value per share $ — $ 56.08 $ 19.83 $ —
Shares outstanding — 749,122 4,291,002 —
Net Assets $ — $ 42,012,079 $ 85,086,592 $ —
Cost of investments $ 1,580,751,011 $ 3,412,338,913 $ 2,218,267,820 $ 2,318,046,290Cost of foreign currency $ — $ 20,395 $ — $ —
(1) Includes Investment in securities on loan, at market value $ 37,361,513 $ 42,604,710 $ — $ 44,508,755
The accompanying notes are an integral part of these financial statements.
85

q
123106 TX 86STATE STREET GLOBAL HLS SEMI-ANNUAL REPO
28-Jul-2021 08:32 ESTCLN PSLNF
Donnelley Financial LSWmadas0dcSTART PAGE
3*PMT 1C
VDI-W7-PFL-220621.7.8.0
Hartford HLS FundsStatements of Assets and Liabilities – (continued)June 30, 2021 (Unaudited)
HartfordHealthcareHLS Fund
HartfordInternational
OpportunitiesHLS Fund
HartfordMidCap
HLS Fund
HartfordSmall Cap
GrowthHLS Fund
Assets:Investments in securities, at market value(1) $ 218,007,750 $ 1,215,470,963 $ 2,352,467,291 $ 1,453,696,684Repurchase agreements 5,029,551 18,212,041 1,546,272 18,038,677Investments in affiliated investments, at market value — — — —Cash 1,239,389 3,970,585 380,929 2,510,619Cash collateral held for securities on loan 514,140 — 1,667,907 232,321Cash collateral due from broker on swap contracts — — — —Foreign currency 3,240 353,148 — —Receivables:
Investment securities sold 542,645 6,888,556 — 7,129,368Fund shares sold 18,048 325,358 620,418 3,006,265Dividends and interest 47,925 988,396 1,530,242 264,900Securities lending income 3,056 5,517 6,131 52,360Variation margin on futures contracts — — — —Tax reclaims 43,679 1,713,120 — —
Other assets 7,391 9,335 13,181 17,666
Total assets 225,456,814 1,247,937,019 2,358,232,371 1,484,948,860
Liabilities:Obligation to return securities lending collateral 10,282,792 — 33,358,132 4,646,413Payables:
Investment securities purchased 268,807 1,522,784 — 7,820,010Fund shares redeemed 130,388 413,859 1,466,695 2,119,223Investment management fees 147,653 723,643 1,259,769 721,594Transfer agent fees 3,578 4,437 7,647 4,552Accounting services fees 2,399 14,401 26,247 16,420Board of Directors’ fees 1,519 7,586 13,616 8,318Variation margin on futures contracts — — — —Distribution fees 893 2,414 2,874 4,702
Accrued expenses 22,477 126,452 107,248 58,893
Total liabilities 10,860,506 2,815,576 36,242,228 15,400,125
Net assets $ 214,596,308 $ 1,245,121,443 $ 2,321,990,143 $ 1,469,548,735
Summary of Net Assets:Capital stock and paid-in-capital $ 101,246,954 $ 846,360,494 $ 1,102,632,244 $ 776,833,316Distributable earnings 113,349,354 398,760,949 1,219,357,899 692,715,419
Net assets $ 214,596,308 $ 1,245,121,443 $ 2,321,990,143 $ 1,469,548,735
Shares authorized 800,000,000 2,625,000,000 2,600,000,000 700,000,000
Par value $ 0.0010 $ 0.0010 $ 0.0010 $ 0.0010
Class A: Net asset value per share $ 25.82 $ 20.74 $ 47.06 $ 40.12
Shares outstanding 6,640,793 54,453,121 46,399,385 30,902,501
Net Assets $ 171,490,026 $ 1,129,102,439 $ 2,183,672,809 $ 1,239,659,899
Class B: Net asset value per share $ 23.73 $ 21.01 $ 45.19 $ 38.31
Shares outstanding 1,816,527 5,521,690 3,060,999 6,000,523
Net Assets $ 43,106,282 $ 116,019,004 $ 138,317,334 $ 229,888,836
Class C: Net asset value per share $ — $ — $ — $ —
Shares outstanding — — — —
Net Assets $ — $ — $ — $ —
Cost of investments $ 154,566,814 $ 971,842,700 $ 1,526,664,052 $ 993,947,243Cost of foreign currency $ 3,257 $ 353,364 $ — $ —
(1) Includes Investment in securities on loan, at market value $ 9,926,984 $ — $ 32,922,067 $ 2,407,711
The accompanying notes are an integral part of these financial statements.
86

p
123106 TX 87STATE STREET GLOBAL HLS SEMI-ANNUAL REPO
28-Jul-2021 08:33 ESTCLN PSLNF
Donnelley Financial LSWmadas0dcSTART PAGE
3*PMT 1C
VDI-W7-PFL-220621.7.8.0
Hartford HLS FundsStatements of Assets and Liabilities – (continued)June 30, 2021 (Unaudited)
HartfordSmall
CompanyHLS Fund
HartfordStock
HLS Fund
HartfordTotal Return
BondHLS Fund
HartfordUltrashort
BondHLS Fund
Assets:Investments in securities, at market value(1) $ 600,824,233 $ 1,541,457,687 $ 2,996,343,149 $ 755,363,736Repurchase agreements 209,901 12,203,524 26,464,749 5,496,424Investments in affiliated investments, at market value 5,668,532 10,667,313 — —Cash 49,108 3,006,760 12,169,471 1,415,024Future PIPE purchase commitments outstanding 564,037 — — —Cash collateral held for securities on loan 901,182 — 392,123 1,002,850Cash collateral due from broker on swap contracts — — 640,000 —Foreign currency — 137,819 786,670 —Unrealized appreciation on foreign currency contracts — — 1,898,330 —Receivables:
Investment securities sold 3,424,059 — 546,412,836 —Fund shares sold 27,370 624 467,173 653,448Dividends and interest 96,876 1,787,470 13,468,812 997,226Securities lending income 24,139 505 5,551 4,065Tax reclaims — 361,597 — —
OTC swap contracts premiums paid — — 1,121,968 —Other assets 8,313 8,639 12,000 8,796
Total assets 611,797,750 1,569,631,938 3,600,182,832 764,941,569
Liabilities:Unrealized depreciation on foreign currency contracts — — 85,154 —Obligation to return securities lending collateral 18,023,632 — 7,842,458 20,056,992Unrealized depreciation on OTC swap contracts — — 3,796,551 —Cash collateral due to broker on swap contracts — — 120,000 —TBA sale commitments, at market value — — 67,315,607 —Unfunded loan commitments — — 14,385 —Payables:
Investment securities purchased — 422 1,161,176,960 4,029,497Fund shares redeemed 299,927 948,561 496,737 284,890Investment management fees 355,499 614,656 901,870 244,309Transfer agent fees 3,526 3,486 4,965 4,845Accounting services fees 6,643 17,760 26,574 8,435Board of Directors’ fees 3,517 8,942 14,564 3,452Variation margin on futures contracts — — 1,070,841 —Variation margin on centrally cleared swap contracts — — 48,974 —Distribution fees 1,370 2,773 5,200 2,098
Written options — — 869,905 —Accrued expenses 63,918 85,117 181,997 92,690OTC swap contracts premiums received — — 4,056,102 —
Total liabilities 18,758,032 1,681,717 1,248,028,844 24,727,208
Net assets $ 593,039,718 $ 1,567,950,221 $ 2,352,153,988 $ 740,214,361
Summary of Net Assets:Capital stock and paid-in-capital $ 289,513,794 $ 774,749,513 $ 2,176,800,050 $ 744,465,182Distributable earnings (loss) 303,525,924 793,200,708 175,353,938 (4,250,821)
Net assets $ 593,039,718 $ 1,567,950,221 $ 2,352,153,988 $ 740,214,361
Shares authorized 1,500,000,000 4,000,000,000 5,000,000,000 14,000,000,000
Par value $ 0.0010 $ 0.0010 $ 0.0010 $ 0.0010
Class IA: Net asset value per share $ 28.74 $ 106.38 $ 11.85 $ 10.09
Shares outstanding 18,332,623 13,471,200 177,158,838 63,241,793
Net Assets $ 526,966,721 $ 1,433,059,251 $ 2,098,492,925 $ 638,240,111
Class IB: Net asset value per share $ 25.35 $ 106.21 $ 11.77 $ 10.08
Shares outstanding 2,606,193 1,270,097 21,560,199 10,120,917
Net Assets $ 66,072,997 $ 134,890,970 $ 253,661,063 $ 101,974,250
Cost of investments $ 486,336,720 $ 878,536,309 $ 2,993,491,448 $ 759,716,852Cost of foreign currency $ — $ 137,863 $ 787,873 $ —Proceeds of TBA sale commitments $ — $ — $ 67,322,589 $ —Proceeds of written option contracts $ — $ — $ 1,580,550 $ —
(1) Includes Investment in securities on loan, at market value $ 17,779,296 $ — $ 7,618,776 $ 19,639,152
The accompanying notes are an integral part of these financial statements.
87

123106 TX 88STATE STREET GLOBAL HLS SEMI-ANNUAL REPO
27-Jul-2021 20:50 ESTCLN PSLNF
Donnelley Financial LSWpf_rendSTART PAGE
3*PMT 1C
LSWP64RS1621.6.2.0
Hartford HLS FundsStatements of OperationsFor the Six-Month Period Ended June 30, 2021 (Unaudited)
HartfordBalanced HLS
Fund
HartfordCapital
AppreciationHLS Fund
HartfordDisciplinedEquity HLS
Fund
HartfordDividend andGrowth HLS
Fund
Investment Income:Dividends $ 13,371,818 $ 29,582,078 $ 19,189,383 $ 40,338,022Interest 7,447,034 15,527 1,983 9,784Securities lending 76,274 94,075 6,019 28,047Less: Foreign tax withheld (153,579) (205,369) — (618,996)
Total investment income, net 20,741,547 29,486,311 19,197,385 39,756,857
Expenses:Investment management fees 6,549,651 14,493,015 9,066,319 11,723,964Administrative services fees
Class IC — 50,946 101,396 —Transfer agent fees
Class IA 2,378 3,573 3,495 2,555Class IB 317 437 468 338Class IC — 36 103 —
Distribution feesClass IB 308,656 609,881 458,418 542,369Class IC — 50,946 101,396 —
Custodian fees 9,191 13,632 6,422 5,851Registration and filing fees 6,565 9,054 15,722 7,714Accounting services fees 146,023 314,139 223,044 258,869Board of Directors’ fees 25,191 55,339 35,817 42,963Audit fees 16,309 27,123 22,621 10,765Other expenses 103,631 167,411 126,633 142,830
Total expenses (before waivers, reimbursements and fees paid indirectly) 7,167,912 15,795,532 10,161,854 12,738,218
Management fee waivers (314,920) — — —Commission recapture (188) (10,931) (1,220) (11,465)
Total waivers, reimbursements and fees paid indirectly (315,108) (10,931) (1,220) (11,465)
Total expenses, net 6,852,804 15,784,601 10,160,634 12,726,753
Net Investment Income (Loss) 13,888,743 13,701,710 9,036,751 27,030,104
Net Realized Gain (Loss) on Investments, Other Financial Instruments and Foreign CurrencyTransactions on:Capital gain distributions received from underlying funds — 256,279 — —Investments 143,140,548 366,052,498 111,535,999 199,564,729Futures contracts 587,785 6,557,027 — —Foreign currency contracts — — — —Other foreign currency transactions (10,185) (47,724) 579 (905)
Net Realized Gain (Loss) on Investments, Other Financial Instruments and Foreign CurrencyTransactions 143,718,148 372,818,080 111,536,578 199,563,824
Net Changes in Unrealized Appreciation (Depreciation) of Investments, Other Financial Instrumentsand Foreign Currency Transactions of:Investments 78,340,093 47,753,266 310,016,254 373,558,975Investments in affiliated investment 1,808,515 1,306,165 — —Futures contracts (31,232) 1,287,981 — —Translation of other assets and liabilities in foreign currencies (32,471) (9,337) (20,246) (14,505)
Net Changes in Unrealized Appreciation (Depreciation) of Investments, Other Financial Instrumentsand Foreign Currency Transactions 80,084,905 50,338,075 309,996,008 373,544,470
Net Gain (Loss) on Investments, Other Financial Instruments and Foreign Currency Transactions 223,803,053 423,156,155 421,532,586 573,108,294
Net Increase (Decrease) in Net Assets Resulting from Operations $ 237,691,796 $ 436,857,865 $ 430,569,337 $ 600,138,398
The accompanying notes are an integral part of these financial statements.
88

q
123106 TX 89STATE STREET GLOBAL HLS SEMI-ANNUAL REPO
27-Jul-2021 20:50 ESTCLN PSLNF
Donnelley Financial LSWpf_rendSTART PAGE
2*PMT 1C
LSWP64RS1621.6.2.0
Hartford HLS FundsStatements of Operations – (continued)For the Six-Month Period Ended June 30, 2021 (Unaudited)
HartfordHealthcareHLS Fund
HartfordInternational
OpportunitiesHLS Fund
HartfordMidCap HLS
Fund
Hartford SmallCap GrowthHLS Fund
Investment Income:Dividends $ 962,854 $ 14,426,258 $ 7,914,443 $ 2,989,562Interest 673 2,426 524 1,197Securities lending 15,355 90,501 36,230 174,204Less: Foreign tax withheld (19,765) (1,438,603) (2,841) —
Total investment income, net 959,117 13,080,582 7,948,356 3,164,963
Expenses:Investment management fees 907,610 4,305,923 7,861,262 4,397,665Administrative services fees
Class IC — — — —Transfer agent fees
Class IA 2,163 2,983 3,669 2,925Class IB 537 347 229 511Class IC — — — —
Distribution feesClass IB 53,008 161,274 176,218 269,405Class IC — — — —
Custodian fees 4,398 23,259 6,414 4,272Registration and filing fees 6,540 7,450 10,984 11,332Accounting services fees 14,870 86,212 165,446 100,859Board of Directors’ fees 2,735 15,372 29,910 18,365Audit fees 12,378 20,302 9,482 11,380Other expenses 15,452 67,882 74,275 45,013
Total expenses (before waivers, reimbursements and fees paid indirectly) 1,019,691 4,691,004 8,337,889 4,861,727
Management fee waivers — — — —Commission recapture (365) (5,549) (33) (9,657)
Total waivers, reimbursements and fees paid indirectly (365) (5,549) (33) (9,657)
Total expenses, net 1,019,326 4,685,455 8,337,856 4,852,070
Net Investment Income (Loss) (60,209) 8,395,127 (389,500) (1,687,107)
Net Realized Gain (Loss) on Investments, Other Financial Instruments and Foreign CurrencyTransactions on:Capital gain distributions received from underlying funds — — —Investments 23,278,699 158,189,488 126,884,302 105,964,685Futures contracts — — — —Foreign currency contracts — — — —Other foreign currency transactions (2,352) (356,851) — —
Net Realized Gain (Loss) on Investments, Other Financial Instruments and Foreign CurrencyTransactions 23,276,347 157,832,637 126,884,302 105,964,685
Net Changes in Unrealized Appreciation (Depreciation) of Investments, Other Financial Instrumentsand Foreign Currency Transactions of:Investments (5,837,777) (94,293,247) 70,935,336 (32,031,684)Investments in affiliated investment — — — —Futures contracts — — — —Translation of other assets and liabilities in foreign currencies (107) (80,271) — —
Net Changes in Unrealized Appreciation (Depreciation) of Investments, Other Financial Instrumentsand Foreign Currency Transactions (5,837,884) (94,373,518) 70,935,336 (32,031,684)
Net Gain (Loss) on Investments, Other Financial Instruments and Foreign Currency Transactions 17,438,463 63,459,119 197,819,638 73,933,001
Net Increase (Decrease) in Net Assets Resulting from Operations $ 17,378,254 $ 71,854,246 $ 197,430,138 $ 72,245,894
The accompanying notes are an integral part of these financial statements.
89

123106 TX 90STATE STREET GLOBAL HLS SEMI-ANNUAL REPO
27-Jul-2021 20:50 ESTCLN PSLNF
Donnelley Financial LSWpf_rendSTART PAGE
2*PMT 1C
LSWP64RS1621.6.2.0
Hartford HLS FundsStatements of Operations – (continued)For the Six-Month Period Ended June 30, 2021 (Unaudited)
Hartford SmallCompany HLS
FundHartford Stock
HLS Fund
Hartford TotalReturn Bond
HLS Fund
HartfordUltrashortBond HLS
Fund
Investment Income:Dividends $ 688,582 $ 14,057,277 $ 39,453 $ —Interest 1,268 2,438 29,821,719 2,470,297Securities lending 74,635 505 39,463 5,423Less: Foreign tax withheld — (49,302) (393) —
Total investment income, net 764,485 14,010,918 29,900,242 2,475,720
Expenses:Investment management fees 2,234,497 3,600,540 5,449,684 1,502,684Transfer agent fees
Class IA 2,364 2,399 2,430 2,279Class IB 294 228 302 375
Distribution feesClass IB 84,031 163,134 319,756 131,661
Custodian fees 3,819 3,099 14,390 2,693Registration and filing fees 7,547 6,565 9,095 7,395Accounting services fees 42,256 104,583 161,829 52,285Board of Directors’ fees 7,863 17,861 28,644 9,033Audit fees 19,588 16,230 22,892 17,608Other expenses 38,709 78,822 100,160 39,068
Total expenses (before waivers, reimbursements and fees paid indirectly) 2,440,968 3,993,461 6,109,182 1,765,081
Commission recapture (8,202) (130) — —
Total waivers, reimbursements and fees paid indirectly (8,202) (130) — —
Total expenses, net 2,432,766 3,993,331 6,109,182 1,765,081
Net Investment Income (Loss) (1,668,281) 10,017,587 23,791,060 710,639
Net Realized Gain (Loss) on Investments, Other Financial Instruments and Foreign CurrencyTransactions on:Capital gain distributions received from underlying funds — 286,253 — —Investments 104,571,772 50,403,537 1,593,714 61,249Purchased options contracts — — 107,845 —Futures contracts — — 8,355,480 —Written options contracts — — 2,423,476 —Swap contracts — — 683,167 —Foreign currency contracts — — 708,525 —Other foreign currency transactions (1,002) (15,788) (69,524) —
Net Realized Gain (Loss) on Investments, Other Financial Instruments and Foreign CurrencyTransactions 104,570,770 50,674,002 13,802,683 61,249
Net Changes in Unrealized Appreciation (Depreciation) of Investments, Other Financial Instruments andForeign Currency Transactions of:Investments (75,407,172) 101,560,664 (58,718,738) (1,099,466)Investments in affiliated investment 775,258 1,458,914 — —Purchased options contracts — — (1,775,124) —Futures contracts — — (4,715,814) —Written options contracts — — 599,185 —Swap contracts — — (1,547,681) —Foreign currency contracts — — 2,254,601 —Translation of other assets and liabilities in foreign currencies — (16,783) 60,683 —
Net Changes in Unrealized Appreciation (Depreciation) of Investments, Other Financial Instruments andForeign Currency Transactions (74,631,914) 103,002,795 (63,842,888) (1,099,466)
Net Gain (Loss) on Investments, Other Financial Instruments and Foreign Currency Transactions 29,938,856 153,676,797 (50,040,205) (1,038,217)
Net Increase (Decrease) in Net Assets Resulting from Operations $ 28,270,575 $ 163,694,384 $ (26,249,145) $ (327,578)
The accompanying notes are an integral part of these financial statements.
90

p
123106 TX 91STATE STREET GLOBAL HLS SEMI-ANNUAL REPO
28-Jul-2021 08:35 ESTCLN PSLNF
Donnelley Financial LSWmadas0dcSTART PAGE
4*PMT 1C
VDI-W7-PFL-220621.7.8.0
Hartford HLS FundsStatements of Changes in Net Assets
HartfordBalanced HLS Fund
HartfordCapital Appreciation HLS Fund
For theSix-Month
Period EndedJune 30, 2021(Unaudited)
For theYear Ended
December 31,2020
For theSix-Month
Period EndedJune 30, 2021(Unaudited)
For theYear Ended
December 31,2020
Operations:Net investment income (loss) $ 11,308,709 $ 30,999,767 $ 13,701,710 $ 35,954,391Net realized gain (loss) on investments, other financial instruments and foreign currency
transactions 146,298,182 105,739,585 372,818,080 361,872,953Net changes in unrealized appreciation (depreciation) of investments, other financial instruments
and foreign currency transactions 80,084,905 71,167,903 50,338,075 432,607,900
Net Increase (Decrease) in Net Assets Resulting from Operations 237,691,796 207,907,255 436,857,865 830,435,244
Distributions to Shareholders:Class IA — (117,833,855) — (302,064,553)Class IB — (15,165,622) — (36,702,247)Class IC — — — (2,791,605)
Total distributions — (132,999,477) — (341,558,405)
Capital Share Transactions:Sold 11,201,501 19,191,198 8,216,374 38,136,392Issued in merger — — — —Issued on reinvestment of distributions — 132,999,477 — 341,558,405Redeemed (119,662,414) (271,723,464) (390,194,807) (675,171,430)
Net increase (decrease) from capital share transactions (108,460,913) (119,532,789) (381,978,433) (295,476,633)
Net Increase (Decrease) in Net Assets 129,230,883 (44,625,011) 54,879,432 193,400,206
Net Assets:Beginning of period 2,052,221,290 2,096,846,301 4,551,275,835 4,357,875,629
End of period $ 2,181,452,173 $ 2,052,221,290 $ 4,606,155,267 $ 4,551,275,835
The accompanying notes are an integral part of these financial statements.
91

y
123106 TX 92STATE STREET GLOBAL HLS SEMI-ANNUAL REPO
28-Jul-2021 09:28 ESTCLN PSLNF
Donnelley Financial LSWmadas0dcSTART PAGE
4*PMT 1C
VDI-W7-PFL-220621.7.8.0
Hartford HLS FundsStatements of Changes in Net Assets – (continued)
HartfordDisciplined Equity HLS Fund
HartfordDividend and Growth HLS Fund
For theSix-Month
Period EndedJune 30, 2021(Unaudited)
For theYear Ended
December 31,2020
For theSix-Month
Period EndedJune 30, 2021(Unaudited)
For theYear Ended
December 31,2020
Operations:Net investment income (loss) $ 9,036,751 $ 9,088,303 $ 27,030,104 $ 58,007,815Net realized gain (loss) on investments, other financial instruments and foreign currency
transactions 111,536,578 51,370,005 199,563,824 149,565,472Net changes in unrealized appreciation (depreciation) of investments, other financial instruments
and foreign currency transactions 309,996,008 349,898,974 373,544,470 43,580,460
Net Increase (Decrease) in Net Assets Resulting from Operations 430,569,337 410,357,282 600,138,398 251,153,747
Distributions to Shareholders:Class IA — (49,655,221) — (188,906,611)Class IB — (6,547,645) — (23,940,435)Class IC(1) — (117,970) — —
Total distributions — (56,320,836) — (212,847,046)
Capital Share Transactions:Sold 17,961,697 20,261,442 46,450,572 101,254,488Issued in merger — 2,330,083,048 — 318,148,909Issued on reinvestment of distributions — 56,320,836 — 212,846,267Redeemed (241,612,851) (269,263,242) (275,071,183) (457,811,881)
Net increase (decrease) from capital share transactions (223,651,154) 2,137,402,084 (228,620,611) 174,437,783
Net Increase (Decrease) in Net Assets 206,918,183 2,491,438,530 371,517,787 212,744,484
Net Assets:Beginning of period 3,145,351,339 653,912,809 3,522,300,708 3,309,556,224
End of period $ 3,352,269,522 $ 3,145,351,339 $ 3,893,818,495 $ 3,522,300,708
The accompanying notes are an integral part of these financial statements.
92

p
123106 TX 93STATE STREET GLOBAL HLS SEMI-ANNUAL REPO
28-Jul-2021 08:35 ESTCLN PSLNF
Donnelley Financial LSWmadas0dcSTART PAGE
3*PMT 1C
VDI-W7-PFL-220621.7.8.0
Hartford HLS FundsStatements of Changes in Net Assets – (continued)
HartfordHealthcare HLS Fund
HartfordInternational Opportunities
HLS Fund
For theSix-Month
Period EndedJune 30, 2021(Unaudited)
For theYear Ended
December 31,2020
For theSix-Month
Period EndedJune 30, 2021(Unaudited)
For theYear Ended
December 31,2020
Operations:Net investment income (loss) $ (60,209) $ 59,592 $ 8,395,127 $ 6,344,840Net realized gain (loss) on investments, other financial instruments and foreign currency transactions 23,276,347 24,202,866 157,832,637 (5,696,457)Net changes in unrealized appreciation (depreciation) of investments, other financial instruments and
foreign currency transactions (5,837,884) 18,492,173 (94,373,518) 191,329,983
Net Increase (Decrease) in Net Assets Resulting from Operations 17,378,254 42,754,631 71,854,246 191,978,366
Distributions to Shareholders:Class IA — (32,813,968) — (18,153,869)Class IB — (7,990,682) — (2,009,265)Class IC — — — —
Total distributions — (40,804,650) — (20,163,134)
Capital Share Transactions:Sold 5,367,525 24,636,180 60,922,398 67,889,363Issued in merger — — — —Issued on reinvestment of distributions — 40,804,650 — 20,163,134Redeemed (42,182,665) (66,609,342) (126,317,711) (249,890,183)
Net increase (decrease) from capital share transactions (36,815,140) (1,168,512) (65,395,313) (161,837,686)
Net Increase (Decrease) in Net Assets (19,436,886) 781,469 6,458,933 9,977,546
Net Assets:Beginning of period 234,033,194 233,251,725 1,238,662,510 1,228,684,964
End of period $ 214,596,308 $ 234,033,194 $ 1,245,121,443 $ 1,238,662,510
The accompanying notes are an integral part of these financial statements.
93
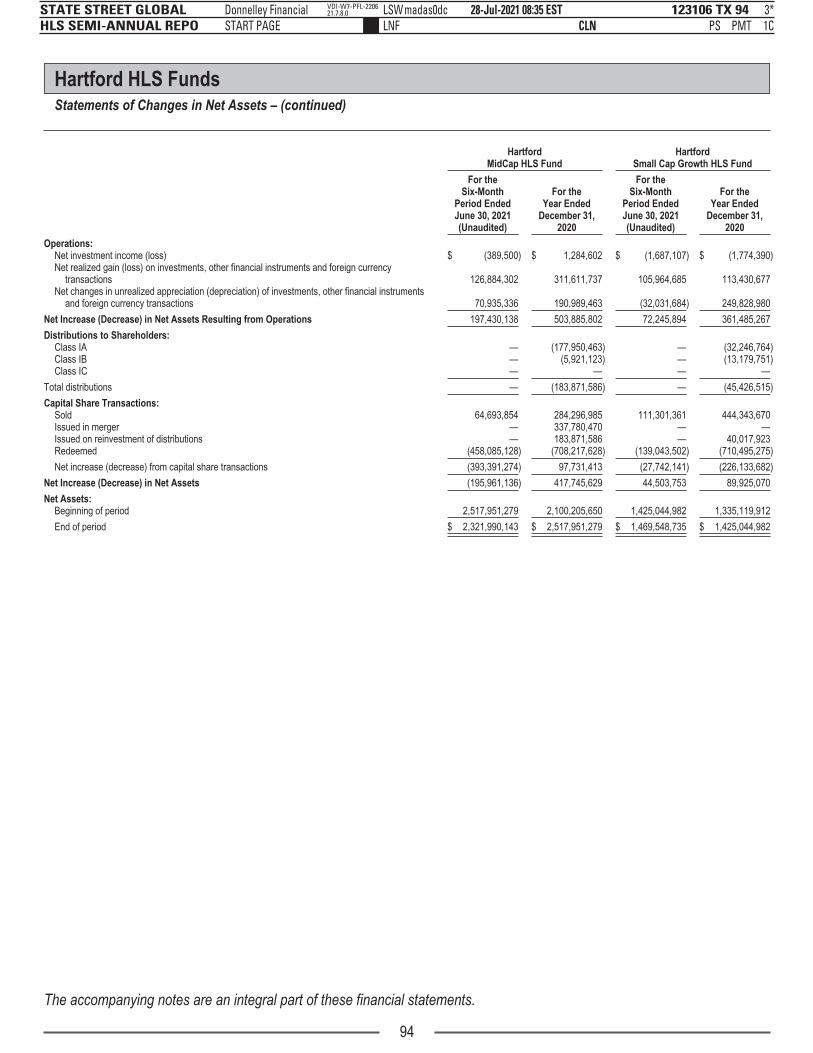
p
123106 TX 94STATE STREET GLOBAL HLS SEMI-ANNUAL REPO
28-Jul-2021 08:35 ESTCLN PSLNF
Donnelley Financial LSWmadas0dcSTART PAGE
3*PMT 1C
VDI-W7-PFL-220621.7.8.0
Hartford HLS FundsStatements of Changes in Net Assets – (continued)
HartfordMidCap HLS Fund
HartfordSmall Cap Growth HLS Fund
For theSix-Month
Period EndedJune 30, 2021(Unaudited)
For theYear Ended
December 31,2020
For theSix-Month
Period EndedJune 30, 2021(Unaudited)
For theYear Ended
December 31,2020
Operations:Net investment income (loss) $ (389,500) $ 1,284,602 $ (1,687,107) $ (1,774,390)Net realized gain (loss) on investments, other financial instruments and foreign currency
transactions 126,884,302 311,611,737 105,964,685 113,430,677Net changes in unrealized appreciation (depreciation) of investments, other financial instruments
and foreign currency transactions 70,935,336 190,989,463 (32,031,684) 249,828,980
Net Increase (Decrease) in Net Assets Resulting from Operations 197,430,138 503,885,802 72,245,894 361,485,267
Distributions to Shareholders:Class IA — (177,950,463) — (32,246,764)Class IB — (5,921,123) — (13,179,751)Class IC — — — —
Total distributions — (183,871,586) — (45,426,515)
Capital Share Transactions:Sold 64,693,854 284,296,985 111,301,361 444,343,670Issued in merger — 337,780,470 — —Issued on reinvestment of distributions — 183,871,586 — 40,017,923Redeemed (458,085,128) (708,217,628) (139,043,502) (710,495,275)
Net increase (decrease) from capital share transactions (393,391,274) 97,731,413 (27,742,141) (226,133,682)
Net Increase (Decrease) in Net Assets (195,961,136) 417,745,629 44,503,753 89,925,070
Net Assets:Beginning of period 2,517,951,279 2,100,205,650 1,425,044,982 1,335,119,912
End of period $ 2,321,990,143 $ 2,517,951,279 $ 1,469,548,735 $ 1,425,044,982
The accompanying notes are an integral part of these financial statements.
94

p
123106 TX 95STATE STREET GLOBAL HLS SEMI-ANNUAL REPO
28-Jul-2021 08:35 ESTCLN PSLNF
Donnelley Financial LSWmadas0dcSTART PAGE
3*PMT 1C
VDI-W7-PFL-220621.7.8.0
Hartford HLS FundsStatements of Changes in Net Assets – (continued)
HartfordSmall Company HLS Fund
HartfordStock HLS Fund
For theSix-Month
Period EndedJune 30, 2021(Unaudited)
For theYear Ended
December 31,2020
For theSix-Month
Period EndedJune 30, 2021(Unaudited)
For theYear Ended
December 31,2020
Operations:Net investment income (loss) $ (1,668,281) $ (1,687,287) $ 10,017,587 $ 21,548,207Net realized gain (loss) on investments, other financial instruments and foreign currency transactions 104,570,770 82,511,370 50,674,002 48,823,869Net changes in unrealized appreciation (depreciation) of investments, other financial instruments and
foreign currency transactions (74,631,914) 87,911,371 103,002,795 87,381,686
Net Increase (Decrease) in Net Assets Resulting from Operations 28,270,575 168,735,454 163,694,384 157,753,762
Distributions to Shareholders:Class IA — (57,898,706) — (105,830,872)Class IB — (7,955,937) — (9,984,197)
Total distributions — (65,854,643) — (115,815,069)
Capital Share Transactions:Sold 17,899,245 46,390,011 4,047,503 13,251,527Issued in merger — — — —Issued on reinvestment of distributions — 65,854,643 — 115,815,069Redemption-in-kind — 8,160,448 — —Redeemed (61,792,016) (238,957,153) (89,560,192) (190,830,898)
Net increase (decrease) from capital share transactions (43,892,771) (118,552,051) (85,512,689) (61,764,302)
Net Increase (Decrease) in Net Assets (15,622,196) (15,671,240) 78,181,695 (19,825,609)
Net Assets:Beginning of period 608,661,914 624,333,154 1,489,768,526 1,509,594,135
End of period $ 593,039,718 $ 608,661,914 $ 1,567,950,221 $ 1,489,768,526
The accompanying notes are an integral part of these financial statements.
95
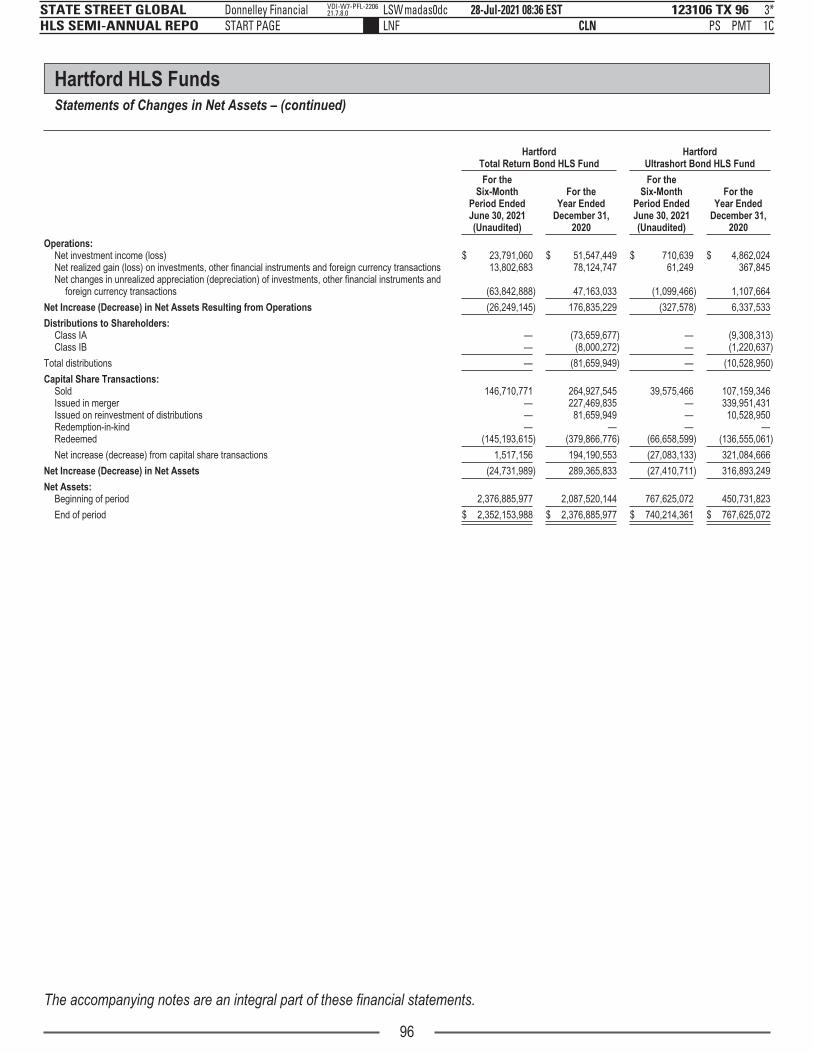
123106 TX 96STATE STREET GLOBAL HLS SEMI-ANNUAL REPO
28-Jul-2021 08:36 ESTCLN PSLNF
Donnelley Financial LSWmadas0dcSTART PAGE
3*PMT 1C
VDI-W7-PFL-220621.7.8.0
Hartford HLS FundsStatements of Changes in Net Assets – (continued)
HartfordTotal Return Bond HLS Fund
HartfordUltrashort Bond HLS Fund
For theSix-Month
Period EndedJune 30, 2021(Unaudited)
For theYear Ended
December 31,2020
For theSix-Month
Period EndedJune 30, 2021(Unaudited)
For theYear Ended
December 31,2020
Operations:Net investment income (loss) $ 23,791,060 $ 51,547,449 $ 710,639 $ 4,862,024Net realized gain (loss) on investments, other financial instruments and foreign currency transactions 13,802,683 78,124,747 61,249 367,845Net changes in unrealized appreciation (depreciation) of investments, other financial instruments and
foreign currency transactions (63,842,888) 47,163,033 (1,099,466) 1,107,664
Net Increase (Decrease) in Net Assets Resulting from Operations (26,249,145) 176,835,229 (327,578) 6,337,533
Distributions to Shareholders:Class IA — (73,659,677) — (9,308,313)Class IB — (8,000,272) — (1,220,637)
Total distributions — (81,659,949) — (10,528,950)
Capital Share Transactions:Sold 146,710,771 264,927,545 39,575,466 107,159,346Issued in merger — 227,469,835 — 339,951,431Issued on reinvestment of distributions — 81,659,949 — 10,528,950Redemption-in-kind — — — —Redeemed (145,193,615) (379,866,776) (66,658,599) (136,555,061)
Net increase (decrease) from capital share transactions 1,517,156 194,190,553 (27,083,133) 321,084,666
Net Increase (Decrease) in Net Assets (24,731,989) 289,365,833 (27,410,711) 316,893,249
Net Assets:Beginning of period 2,376,885,977 2,087,520,144 767,625,072 450,731,823
End of period $ 2,352,153,988 $ 2,376,885,977 $ 740,214,361 $ 767,625,072
The accompanying notes are an integral part of these financial statements.
96

p
123106 TX 97STATE STREET GLOBAL HLS SEMI-ANNUAL REPO
27-Jul-2021 20:50 ESTCLN PSLNF
Donnelley Financial LSWpf_rendSTART PAGE
3*PMT 1C
LSWP64RS3021.6.2.0
Hartford HLS FundsFinancial Highlights
— Selected Per-Share Data(1) — — Ratios and Supplemental Data —
Class
Net AssetValue at
Beginningof Period
NetInvestment
Income(Loss)
NetRealized
andUnrealizedGain (Loss)
onInvestments
Total fromInvestmentOperations
Dividendsfrom Net
InvestmentIncome
Distributionsfrom
CapitalGains
TotalDividends
andDistributions
NetAsset
Value atEnd ofPeriod
TotalReturn(2)
NetAssets at
End ofPeriod(000s)
Ratio ofExpenses
toAverage
NetAssetsBeforeAdjust-ments(3)
Ratio ofExpenses
toAverage
NetAssetsAfter
Adjust-ments(3)
Ratio ofNet
InvestmentIncome
(Loss) toAverage
Net AssetsPortfolioTurnover
Hartford Balanced HLS Fund
For the Six-Month Period Ended June 30, 2021 (Unaudited)IA $ 31.56 $ 0.22 $ 3.54 $ 3.76 $ — $ — $ — $ 35.32 11.91%(4) $ 1,924,405 0.65%(5) 0.62%(5) 1.35%(5) 25%(6)
IB 32.15 0.19 3.60 3.79 — — — 35.94 11.79(4) 257,047 0.90(5) 0.87(5) 1.10(5) 25(6)
For the Year Ended December 31, 2020IA $ 30.27 $ 0.48 $ 2.92 $ 3.40 $ (0.51) $ (1.60) $ (2.11) $ 31.56 11.62% $ 1,809,745 0.66% 0.63% 1.63% 43%(6)
IB 30.80 0.41 2.97 3.38 (0.43) (1.60) (2.03) 32.15 11.35 242,476 0.91 0.88 1.38 43(6)
For the Year Ended December 31, 2019IA $ 27.47 $ 0.54(7) $ 5.47(7) $ 6.01 $ (0.56) $ (2.65) $ (3.21) $ 30.27 22.80% $ 1,849,582 0.66% 0.63% 1.81%(7) 38%IB 27.91 0.47(7) 5.55(7) 6.02 (0.48) (2.65) (3.13) 30.80 22.47 247,264 0.91 0.88 1.56(7) 38
For the Year Ended December 31, 2018IA $ 31.02 $ 0.59 $ (2.12) $ (1.53) $ (0.61) $ (1.41) $ (2.02) $ 27.47 (5.24)% $ 1,717,759 0.66% 0.63% 1.92% 31%IB 31.48 0.52 (2.15) (1.63) (0.53) (1.41) (1.94) 27.91 (5.50) 229,790 0.91 0.88 1.67 31
For the Year Ended December 31, 2017IA $ 27.46 $ 0.55 $ 3.72 $ 4.27 $ (0.71) $ — $ (0.71) $ 31.02 15.59% $ 2,095,246 0.66% 0.63% 1.86% 26%IB 27.86 0.48 3.77 4.25 (0.63) — (0.63) 31.48 15.30 277,735 0.91 0.88 1.61 26
For the Year Ended December 31, 2016IA $ 26.62 $ 0.56 $ 1.05 $ 1.61 $ (0.77) $ — $ (0.77) $ 27.46 6.04% $ 2,043,556 0.66% 0.64% 2.05% 25%IB 26.99 0.50 1.07 1.57 (0.70) — (0.70) 27.86 5.79 275,925 0.91 0.89 1.80 25
Hartford Capital Appreciation HLS Fund
For the Six-Month Period Ended June 30, 2021 (Unaudited)IA $ 51.85 $ 0.18 $ 5.04 $ 5.22 $ — $ — $ — $ 57.07 10.07%(4) $ 4,067,371 0.67%(5) 0.67%(5) 0.65%(5) 30%IB 50.85 0.08 4.96 5.04 — — — 55.89 9.91(4) 496,772 0.92(5) 0.92(5) 0.30(5) 30IC 51.08 0.04 4.96 5.00 — — — 56.08 9.79(4) 42,012 1.17(5) 1.17(5) 0.15(5) 30
For the Year Ended December 31, 2020IA $ 46.05 $ 0.42 $ 9.37 $ 9.79 $ (0.45) $ (3.54) $ (3.99) $ 51.85 21.91% $ 4,024,340 0.68% 0.68% 0.91% 80%IB 45.24 0.30 9.18 9.48 (0.33) (3.54) (3.87) 50.85 21.62 487,576 0.93 0.93 0.66 80IC 45.45 0.19 9.20 9.39 (0.22) (3.54) (3.76) 51.08 21.32 39,361 1.18 1.18 0.41 80
For the Year Ended December 31, 2019IA $ 39.89 $ 0.48 $ 11.47 $ 11.95 $ (0.53) $ (5.26) $ (5.79) $ 46.05 31.28% $ 3,847,850 0.68% 0.68% 1.06% 56%IB 39.28 0.36 11.28 11.64 (0.42) (5.26) (5.68) 45.24 30.96 474,982 0.93 0.93 0.81 56IC 39.54 0.25 11.34 11.59 (0.42) (5.26) (5.68) 45.45 30.63 35,043 1.18 1.18 0.56 56
For the Year Ended December 31, 2018IA $ 48.16 $ 0.49 $ (3.33) $ (2.84) $ (0.43) $ (5.00) $ (5.43) $ 39.89 (6.96)% $ 3,543,187 0.67% 0.67% 1.03% 73%IB 47.48 0.37 (3.26) (2.89) (0.31) (5.00) (5.31) 39.28 (7.18) 432,334 0.92 0.92 0.77 73IC 47.76 0.25 (3.26) (3.01) (0.21) (5.00) (5.21) 39.54 (7.41) 27,679 1.17 1.17 0.53 73
For the Year Ended December 31, 2017IA $ 42.05 $ 0.43 $ 8.83 $ 9.26 $ (0.54) $ (2.61) $ (3.15) $ 48.16 22.14% $ 4,457,603 0.68% 0.68% 0.91% 75%IB 41.50 0.30 8.70 9.00 (0.41) (2.61) (3.02) 47.48 21.82 569,615 0.93 0.93 0.66 75IC 41.76 0.19 8.74 8.93 (0.32) (2.61) (2.93) 47.76 21.50 29,979 1.18 1.18 0.41 75
For the Year Ended December 31, 2016IA $ 44.44 $ 0.41 $ 1.94 $ 2.35 $ (0.47) $ (4.27) $ (4.74) $ 42.05 5.52% $ 4,555,454 0.68% 0.68% 0.97% 103%IB 43.93 0.30 1.90 2.20 (0.36) (4.27) (4.63) 41.50 5.24 558,022 0.93 0.93 0.72 103IC 44.21 0.19 1.92 2.11 (0.29) (4.27) (4.56) 41.76 4.99 21,579 1.18 1.18 0.46 103
The accompanying notes are an integral part of these financial statements.
97
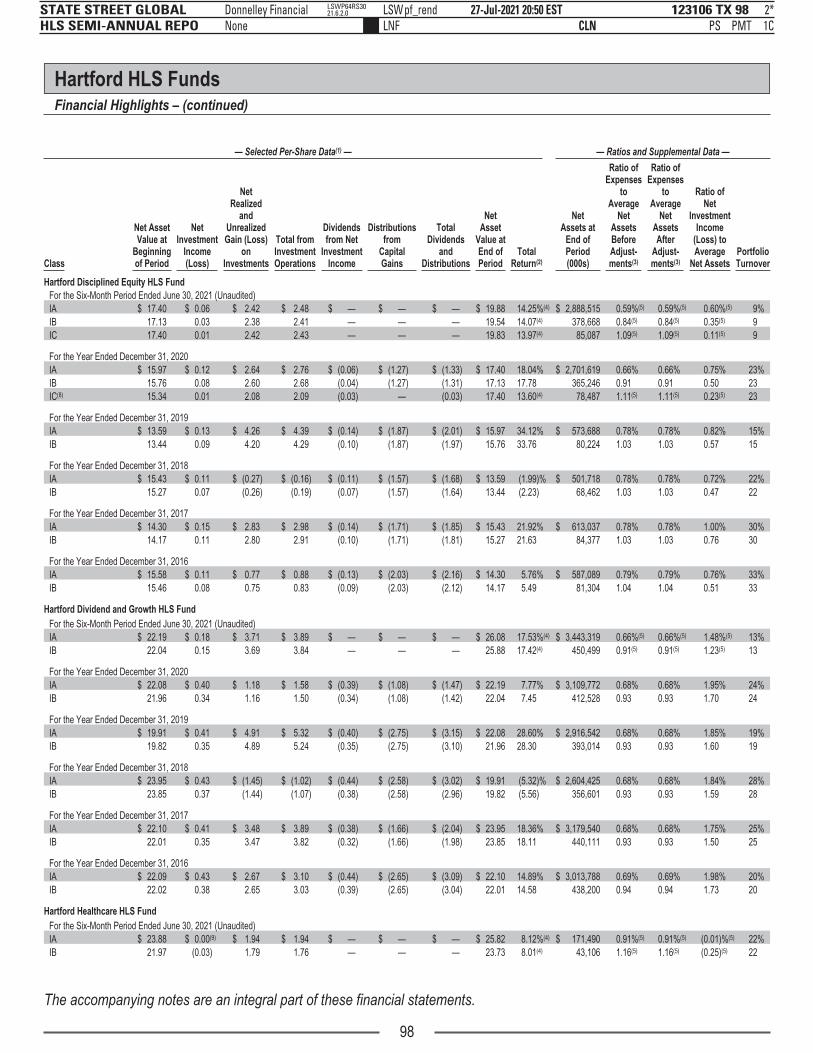
y pg
123106 TX 98STATE STREET GLOBAL HLS SEMI-ANNUAL REPO
27-Jul-2021 20:50 ESTCLN PSLNF
Donnelley Financial LSWpf_rendNone
2*PMT 1C
LSWP64RS3021.6.2.0
Hartford HLS FundsFinancial Highlights – (continued)
— Selected Per-Share Data(1) — — Ratios and Supplemental Data —
Class
Net AssetValue at
Beginningof Period
NetInvestment
Income(Loss)
NetRealized
andUnrealizedGain (Loss)
onInvestments
Total fromInvestmentOperations
Dividendsfrom Net
InvestmentIncome
Distributionsfrom
CapitalGains
TotalDividends
andDistributions
NetAsset
Value atEnd ofPeriod
TotalReturn(2)
NetAssets at
End ofPeriod(000s)
Ratio ofExpenses
toAverage
NetAssetsBeforeAdjust-ments(3)
Ratio ofExpenses
toAverage
NetAssetsAfter
Adjust-ments(3)
Ratio ofNet
InvestmentIncome
(Loss) toAverage
Net AssetsPortfolioTurnover
Hartford Disciplined Equity HLS Fund
For the Six-Month Period Ended June 30, 2021 (Unaudited)IA $ 17.40 $ 0.06 $ 2.42 $ 2.48 $ — $ — $ — $ 19.88 14.25%(4) $ 2,888,515 0.59%(5) 0.59%(5) 0.60%(5) 9%IB 17.13 0.03 2.38 2.41 — — — 19.54 14.07(4) 378,668 0.84(5) 0.84(5) 0.35(5) 9IC 17.40 0.01 2.42 2.43 — — — 19.83 13.97(4) 85,087 1.09(5) 1.09(5) 0.11(5) 9
For the Year Ended December 31, 2020IA $ 15.97 $ 0.12 $ 2.64 $ 2.76 $ (0.06) $ (1.27) $ (1.33) $ 17.40 18.04% $ 2,701,619 0.66% 0.66% 0.75% 23%IB 15.76 0.08 2.60 2.68 (0.04) (1.27) (1.31) 17.13 17.78 365,246 0.91 0.91 0.50 23IC(8) 15.34 0.01 2.08 2.09 (0.03) — (0.03) 17.40 13.60(4) 78,487 1.11(5) 1.11(5) 0.23(5) 23
For the Year Ended December 31, 2019IA $ 13.59 $ 0.13 $ 4.26 $ 4.39 $ (0.14) $ (1.87) $ (2.01) $ 15.97 34.12% $ 573,688 0.78% 0.78% 0.82% 15%IB 13.44 0.09 4.20 4.29 (0.10) (1.87) (1.97) 15.76 33.76 80,224 1.03 1.03 0.57 15
For the Year Ended December 31, 2018IA $ 15.43 $ 0.11 $ (0.27) $ (0.16) $ (0.11) $ (1.57) $ (1.68) $ 13.59 (1.99)% $ 501,718 0.78% 0.78% 0.72% 22%IB 15.27 0.07 (0.26) (0.19) (0.07) (1.57) (1.64) 13.44 (2.23) 68,462 1.03 1.03 0.47 22
For the Year Ended December 31, 2017IA $ 14.30 $ 0.15 $ 2.83 $ 2.98 $ (0.14) $ (1.71) $ (1.85) $ 15.43 21.92% $ 613,037 0.78% 0.78% 1.00% 30%IB 14.17 0.11 2.80 2.91 (0.10) (1.71) (1.81) 15.27 21.63 84,377 1.03 1.03 0.76 30
For the Year Ended December 31, 2016IA $ 15.58 $ 0.11 $ 0.77 $ 0.88 $ (0.13) $ (2.03) $ (2.16) $ 14.30 5.76% $ 587,089 0.79% 0.79% 0.76% 33%IB 15.46 0.08 0.75 0.83 (0.09) (2.03) (2.12) 14.17 5.49 81,304 1.04 1.04 0.51 33
Hartford Dividend and Growth HLS Fund
For the Six-Month Period Ended June 30, 2021 (Unaudited)IA $ 22.19 $ 0.18 $ 3.71 $ 3.89 $ — $ — $ — $ 26.08 17.53%(4) $ 3,443,319 0.66%(5) 0.66%(5) 1.48%(5) 13%IB 22.04 0.15 3.69 3.84 — — — 25.88 17.42(4) 450,499 0.91(5) 0.91(5) 1.23(5) 13
For the Year Ended December 31, 2020IA $ 22.08 $ 0.40 $ 1.18 $ 1.58 $ (0.39) $ (1.08) $ (1.47) $ 22.19 7.77% $ 3,109,772 0.68% 0.68% 1.95% 24%IB 21.96 0.34 1.16 1.50 (0.34) (1.08) (1.42) 22.04 7.45 412,528 0.93 0.93 1.70 24
For the Year Ended December 31, 2019IA $ 19.91 $ 0.41 $ 4.91 $ 5.32 $ (0.40) $ (2.75) $ (3.15) $ 22.08 28.60% $ 2,916,542 0.68% 0.68% 1.85% 19%IB 19.82 0.35 4.89 5.24 (0.35) (2.75) (3.10) 21.96 28.30 393,014 0.93 0.93 1.60 19
For the Year Ended December 31, 2018IA $ 23.95 $ 0.43 $ (1.45) $ (1.02) $ (0.44) $ (2.58) $ (3.02) $ 19.91 (5.32)% $ 2,604,425 0.68% 0.68% 1.84% 28%IB 23.85 0.37 (1.44) (1.07) (0.38) (2.58) (2.96) 19.82 (5.56) 356,601 0.93 0.93 1.59 28
For the Year Ended December 31, 2017IA $ 22.10 $ 0.41 $ 3.48 $ 3.89 $ (0.38) $ (1.66) $ (2.04) $ 23.95 18.36% $ 3,179,540 0.68% 0.68% 1.75% 25%IB 22.01 0.35 3.47 3.82 (0.32) (1.66) (1.98) 23.85 18.11 440,111 0.93 0.93 1.50 25
For the Year Ended December 31, 2016IA $ 22.09 $ 0.43 $ 2.67 $ 3.10 $ (0.44) $ (2.65) $ (3.09) $ 22.10 14.89% $ 3,013,788 0.69% 0.69% 1.98% 20%IB 22.02 0.38 2.65 3.03 (0.39) (2.65) (3.04) 22.01 14.58 438,200 0.94 0.94 1.73 20
Hartford Healthcare HLS Fund
For the Six-Month Period Ended June 30, 2021 (Unaudited)IA $ 23.88 $ 0.00(9) $ 1.94 $ 1.94 $ — $ — $ — $ 25.82 8.12%(4) $ 171,490 0.91%(5) 0.91%(5) (0.01)%(5) 22%IB 21.97 (0.03) 1.79 1.76 — — — 23.73 8.01(4) 43,106 1.16(5) 1.16(5) (0.25)(5) 22
The accompanying notes are an integral part of these financial statements.
98
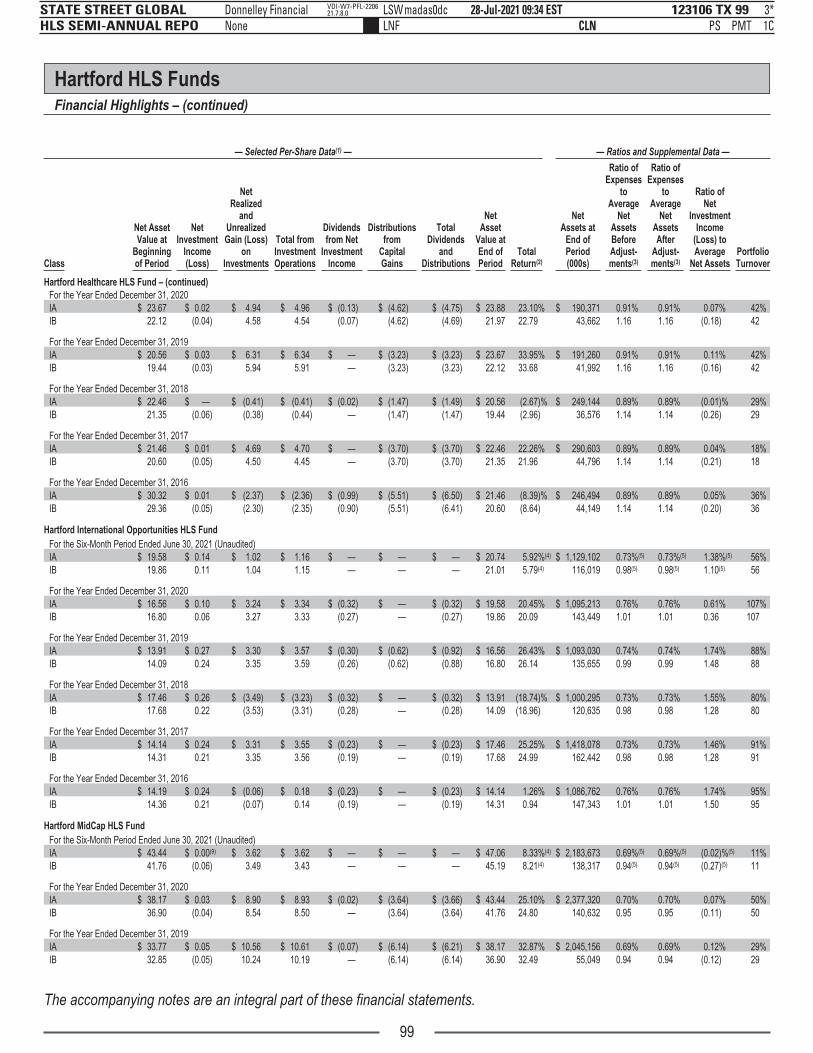
123106 TX 99STATE STREET GLOBAL HLS SEMI-ANNUAL REPO
28-Jul-2021 09:34 ESTCLN PSLNF
Donnelley Financial LSWmadas0dcNone
3*PMT 1C
VDI-W7-PFL-220621.7.8.0
Hartford HLS FundsFinancial Highlights – (continued)
— Selected Per-Share Data(1) — — Ratios and Supplemental Data —
Class
Net AssetValue at
Beginningof Period
NetInvestment
Income(Loss)
NetRealized
andUnrealizedGain (Loss)
onInvestments
Total fromInvestmentOperations
Dividendsfrom Net
InvestmentIncome
Distributionsfrom
CapitalGains
TotalDividends
andDistributions
NetAsset
Value atEnd ofPeriod
TotalReturn(2)
NetAssets at
End ofPeriod(000s)
Ratio ofExpenses
toAverage
NetAssetsBeforeAdjust-ments(3)
Ratio ofExpenses
toAverage
NetAssetsAfter
Adjust-ments(3)
Ratio ofNet
InvestmentIncome
(Loss) toAverage
Net AssetsPortfolioTurnover
Hartford Healthcare HLS Fund – (continued)
For the Year Ended December 31, 2020IA $ 23.67 $ 0.02 $ 4.94 $ 4.96 $ (0.13) $ (4.62) $ (4.75) $ 23.88 23.10% $ 190,371 0.91% 0.91% 0.07% 42%IB 22.12 (0.04) 4.58 4.54 (0.07) (4.62) (4.69) 21.97 22.79 43,662 1.16 1.16 (0.18) 42
For the Year Ended December 31, 2019IA $ 20.56 $ 0.03 $ 6.31 $ 6.34 $ — $ (3.23) $ (3.23) $ 23.67 33.95% $ 191,260 0.91% 0.91% 0.11% 42%IB 19.44 (0.03) 5.94 5.91 — (3.23) (3.23) 22.12 33.68 41,992 1.16 1.16 (0.16) 42
For the Year Ended December 31, 2018IA $ 22.46 $ — $ (0.41) $ (0.41) $ (0.02) $ (1.47) $ (1.49) $ 20.56 (2.67)% $ 249,144 0.89% 0.89% (0.01)% 29%IB 21.35 (0.06) (0.38) (0.44) — (1.47) (1.47) 19.44 (2.96) 36,576 1.14 1.14 (0.26) 29
For the Year Ended December 31, 2017IA $ 21.46 $ 0.01 $ 4.69 $ 4.70 $ — $ (3.70) $ (3.70) $ 22.46 22.26% $ 290,603 0.89% 0.89% 0.04% 18%IB 20.60 (0.05) 4.50 4.45 — (3.70) (3.70) 21.35 21.96 44,796 1.14 1.14 (0.21) 18
For the Year Ended December 31, 2016IA $ 30.32 $ 0.01 $ (2.37) $ (2.36) $ (0.99) $ (5.51) $ (6.50) $ 21.46 (8.39)% $ 246,494 0.89% 0.89% 0.05% 36%IB 29.36 (0.05) (2.30) (2.35) (0.90) (5.51) (6.41) 20.60 (8.64) 44,149 1.14 1.14 (0.20) 36
Hartford International Opportunities HLS Fund
For the Six-Month Period Ended June 30, 2021 (Unaudited)IA $ 19.58 $ 0.14 $ 1.02 $ 1.16 $ — $ — $ — $ 20.74 5.92%(4) $ 1,129,102 0.73%(5) 0.73%(5) 1.38%(5) 56%IB 19.86 0.11 1.04 1.15 — — — 21.01 5.79(4) 116,019 0.98(5) 0.98(5) 1.10(5) 56
For the Year Ended December 31, 2020IA $ 16.56 $ 0.10 $ 3.24 $ 3.34 $ (0.32) $ — $ (0.32) $ 19.58 20.45% $ 1,095,213 0.76% 0.76% 0.61% 107%IB 16.80 0.06 3.27 3.33 (0.27) — (0.27) 19.86 20.09 143,449 1.01 1.01 0.36 107
For the Year Ended December 31, 2019IA $ 13.91 $ 0.27 $ 3.30 $ 3.57 $ (0.30) $ (0.62) $ (0.92) $ 16.56 26.43% $ 1,093,030 0.74% 0.74% 1.74% 88%IB 14.09 0.24 3.35 3.59 (0.26) (0.62) (0.88) 16.80 26.14 135,655 0.99 0.99 1.48 88
For the Year Ended December 31, 2018IA $ 17.46 $ 0.26 $ (3.49) $ (3.23) $ (0.32) $ — $ (0.32) $ 13.91 (18.74)% $ 1,000,295 0.73% 0.73% 1.55% 80%IB 17.68 0.22 (3.53) (3.31) (0.28) — (0.28) 14.09 (18.96) 120,635 0.98 0.98 1.28 80
For the Year Ended December 31, 2017IA $ 14.14 $ 0.24 $ 3.31 $ 3.55 $ (0.23) $ — $ (0.23) $ 17.46 25.25% $ 1,418,078 0.73% 0.73% 1.46% 91%IB 14.31 0.21 3.35 3.56 (0.19) — (0.19) 17.68 24.99 162,442 0.98 0.98 1.28 91
For the Year Ended December 31, 2016IA $ 14.19 $ 0.24 $ (0.06) $ 0.18 $ (0.23) $ — $ (0.23) $ 14.14 1.26% $ 1,086,762 0.76% 0.76% 1.74% 95%IB 14.36 0.21 (0.07) 0.14 (0.19) — (0.19) 14.31 0.94 147,343 1.01 1.01 1.50 95
Hartford MidCap HLS Fund
For the Six-Month Period Ended June 30, 2021 (Unaudited)IA $ 43.44 $ 0.00(9) $ 3.62 $ 3.62 $ — $ — $ — $ 47.06 8.33%(4) $ 2,183,673 0.69%(5) 0.69%(5) (0.02)%(5) 11%IB 41.76 (0.06) 3.49 3.43 — — — 45.19 8.21(4) 138,317 0.94(5) 0.94(5) (0.27)(5) 11
For the Year Ended December 31, 2020IA $ 38.17 $ 0.03 $ 8.90 $ 8.93 $ (0.02) $ (3.64) $ (3.66) $ 43.44 25.10% $ 2,377,320 0.70% 0.70% 0.07% 50%IB 36.90 (0.04) 8.54 8.50 — (3.64) (3.64) 41.76 24.80 140,632 0.95 0.95 (0.11) 50
For the Year Ended December 31, 2019IA $ 33.77 $ 0.05 $ 10.56 $ 10.61 $ (0.07) $ (6.14) $ (6.21) $ 38.17 32.87% $ 2,045,156 0.69% 0.69% 0.12% 29%IB 32.85 (0.05) 10.24 10.19 — (6.14) (6.14) 36.90 32.49 55,049 0.94 0.94 (0.12) 29
The accompanying notes are an integral part of these financial statements.
99

123106 TX 100STATE STREET GLOBAL HLS SEMI-ANNUAL REPO
28-Jul-2021 09:35 ESTCLN PSLNF
Donnelley Financial LSWmadas0dcNone
3*PMT 1C
VDI-W7-PFL-220621.7.8.0
Hartford HLS FundsFinancial Highlights – (continued)
— Selected Per-Share Data(1) — — Ratios and Supplemental Data —
Class
Net AssetValue at
Beginningof Period
NetInvestment
Income(Loss)
NetRealized
andUnrealizedGain (Loss)
onInvestments
Total fromInvestmentOperations
Dividendsfrom Net
InvestmentIncome
Distributionsfrom
CapitalGains
TotalDividends
andDistributions
NetAsset
Value atEnd ofPeriod
TotalReturn(2)
NetAssets at
End ofPeriod(000s)
Ratio ofExpenses
toAverage
NetAssetsBeforeAdjust-ments(3)
Ratio ofExpenses
toAverage
NetAssetsAfter
Adjust-ments(3)
Ratio ofNet
InvestmentIncome
(Loss) toAverage
Net AssetsPortfolioTurnover
Hartford MidCap HLS Fund – (continued)
For the Year Ended December 31, 2018IA $ 40.10 $ 0.01 $ (2.35) $ (2.34) $ (0.01) $ (3.98) $ (3.99) $ 33.77 (7.44)% $ 1,768,712 0.69% 0.69% 0.03% 35%IB 39.18 (0.09) (2.26) (2.35) — (3.98) (3.98) 32.85 (7.65) 46,186 0.94 0.94 (0.22) 35
For the Year Ended December 31, 2017IA $ 33.83 $ 0.01 $ 8.11 $ 8.12 $ — $ (1.85) $ (1.85) $ 40.10 24.47% $ 2,156,044 0.70% 0.70% 0.02% 36%IB 33.17 (0.08) 7.94 7.86 — (1.85) (1.85) 39.18 24.17 58,850 0.95 0.95 (0.23) 36
For the Year Ended December 31, 2016IA $ 33.66 $ 0.05 $ 3.80 $ 3.85 $ (0.06) $ (3.62) $ (3.68) $ 33.83 11.98% $ 1,721,029 0.71% 0.71% 0.16% 32%IB 33.11 (0.03) 3.72 3.69 (0.01) (3.62) (3.63) 33.17 11.69 93,567 0.96 0.96 (0.09) 32
Hartford Small Cap Growth HLS Fund
For the Six-Month Period Ended June 30, 2021 (Unaudited)IA $ 38.15 $ (0.04) $ 2.01 $ 1.97 $ — $ — $ — $ 40.12 5.16%(4) $ 1,239,660 0.63%(5) 0.63%(5) (0.20)%(5) 26%IB 36.48 (0.08) 1.91 1.83 — — — 38.31 5.02(4) 229,889 0.88(5) 0.88(5) (0.45)(5) 26
For the Year Ended December 31, 2020IA $ 29.72 $ (0.02) $ 9.57 $ 9.55 $ — $ (1.12) $ (1.12) $ 38.15 33.20% $ 1,224,012 0.67% 0.67% (0.07)% 61%IB 28.53 (0.09) 9.16 9.07 — (1.12) (1.12) 36.48 32.89 201,033 0.92 0.92 (0.34) 61
For the Year Ended December 31, 2019IA $ 26.76 $ 0.03 $ 8.61 $ 8.64 $ — $ (5.68) $ (5.68) $ 29.72 35.81% $ 954,063 0.64% 0.64% 0.11% 42%IB 25.95 (0.04) 8.30 8.26 — (5.68) (5.68) 28.53 35.45 381,057 0.89 0.89 (0.14) 42
For the Year Ended December 31, 2018IA $ 32.13 $ (0.01) $ (3.27) $ (3.28) $ — $ (2.09) $ (2.09) $ 26.76 (11.70)% $ 803,907 0.64% 0.64% (0.03)% 86%IB 31.28 (0.09) (3.15) (3.24) — (2.09) (2.09) 25.95 (11.89) 312,475 0.89 0.89 (0.28) 86
For the Year Ended December 31, 2017IA $ 26.77 $ (0.02) $ 5.39 $ 5.37 $ (0.01) $ — $ (0.01) $ 32.13 20.07% $ 960,690 0.65% 0.65% (0.06)% 51%IB 26.12 (0.09) 5.25 5.16 — — — 31.28 19.75 374,342 0.90 0.90 (0.31) 51
For the Year Ended December 31, 2016IA $ 24.93 $ 0.04 $ 2.98 $ 3.02 $ (0.04) $ (1.14) $ (1.18) $ 26.77 12.37% $ 972,576 0.65% 0.65% 0.17% 51%IB 24.38 (0.02) 2.90 2.88 — (1.14) (1.14) 26.12 12.08 226,557 0.90 0.90 (0.08) 51
Hartford Small Company HLS Fund
For the Six-Month Period Ended June 30, 2021 (Unaudited)IA $ 27.44 $ (0.07) $ 1.37 $ 1.30 $ — $ — $ — $ 28.74 4.74%(4) $ 526,967 0.78%(5) 0.78%(5) (0.52)%(5) 63%IB 24.23 (0.10) 1.22 1.12 — — — 25.35 4.62(4) 66,073 1.03(5) 1.03(5) (0.77)(5) 63
For the Year Ended December 31, 2020IA $ 20.45 $ (0.07) $ 10.38 $ 10.31 $ — $ (3.32) $ (3.32) $ 27.44 55.52% $ 540,764 0.81% 0.81% (0.32)% 105%IB 18.44 (0.11) 9.22 9.11 — (3.32) (3.32) 24.23 55.03 67,898 1.06 1.06 (0.56) 105
For the Year Ended December 31, 2019IA $ 18.38 $ (0.05) $ 6.36 $ 6.31 $ — $ (4.24) $ (4.24) $ 20.45 37.00% $ 572,642 0.79% 0.79% (0.23)% 79%IB 16.94 (0.09) 5.83 5.74 — (4.24) (4.24) 18.44 36.77 51,691 1.04 1.04 (0.49) 79
For the Year Ended December 31, 2018IA $ 20.42 $ (0.10) $ (0.46) $ (0.56) $ — $ (1.48) $ (1.48) $ 18.38 (4.23)% $ 473,098 0.78% 0.78% (0.47)% 100%IB 18.97 (0.15) (0.40) (0.55) — (1.48) (1.48) 16.94 (4.51) 46,402 1.03 1.03 (0.73) 100
For the Year Ended December 31, 2017IA $ 16.16 $ (0.06) $ 4.32 $ 4.26 $ — $ — $ — $ 20.42 26.36% $ 551,010 0.78% 0.78% (0.33)% 107%IB 15.05 (0.10) 4.02 3.92 — — — 18.97 26.05 57,193 1.03 1.03 (0.58) 107
The accompanying notes are an integral part of these financial statements.
100

p
123106 TX 101STATE STREET GLOBAL HLS SEMI-ANNUAL REPO
28-Jul-2021 09:35 ESTCLN PSLNF
Donnelley Financial LSWmadas0dcNone
3*PMT 1C
VDI-W7-PFL-220621.7.8.0
Hartford HLS FundsFinancial Highlights – (continued)
— Selected Per-Share Data(1) — — Ratios and Supplemental Data —
Class
Net AssetValue at
Beginningof Period
NetInvestment
Income(Loss)
NetRealized
andUnrealizedGain (Loss)
onInvestments
Total fromInvestmentOperations
Dividendsfrom Net
InvestmentIncome
Distributionsfrom
CapitalGains
TotalDividends
andDistributions
NetAsset
Value atEnd ofPeriod
TotalReturn(2)
NetAssets at
End ofPeriod(000s)
Ratio ofExpenses
toAverage
NetAssetsBeforeAdjust-ments(3)
Ratio ofExpenses
toAverage
NetAssetsAfter
Adjust-ments(3)
Ratio ofNet
InvestmentIncome
(Loss) toAverage
Net AssetsPortfolioTurnover
Hartford Small Company HLS Fund – (continued)
For the Year Ended December 31, 2016IA $ 17.52 $ (0.01) $ 0.33(10) $ 0.32 $ — $ (1.68) $ (1.68) $ 16.16 2.04% $ 834,044 0.76% 0.76% (0.08)% 94%IB 16.47 (0.05) 0.31(10) 0.26 — (1.68) (1.68) 15.05 1.81 73,108 1.01 1.01 (0.34) 94
Hartford Stock HLS Fund
For the Six-Month Period Ended June 30, 2021 (Unaudited)IA $ 95.52 $ 0.69 $ 10.17 $ 10.86 $ — $ — $ — $ 106.38 11.37%(4) $ 1,433,059 0.51%(5) 0.51%(5) 1.39%(5) 5%IB 95.48 0.35 10.38 10.73 — — — 106.21 11.24(4) 134,891 0.76(5) 0.76(5) 0.70(5) 5
For the Year Ended December 31, 2020IA $ 92.58 $ 1.39 $ 9.21 $ 10.60 $ (1.48) $ (6.18) $ (7.66) $ 95.52 12.08% $ 1,360,099 0.52% 0.52% 1.57% 15%IB 92.57 1.17 9.17 10.34 (1.25) (6.18) (7.43) 95.48 11.79 129,670 0.77 0.77 1.32 15
For the Year Ended December 31, 2019IA $ 78.10 $ 1.43 $ 22.40 $ 23.83 $ (1.46) $ (7.89) $ (9.35) $ 92.58 31.22% $ 1,375,643 0.51% 0.51% 1.59% 15%IB 78.11 1.20 22.39 23.59 (1.24) (7.89) (9.13) 92.57 30.89 133,951 0.76 0.76 1.34 15
For the Year Ended December 31, 2018IA $ 79.57 $ 1.31 $ (1.45) $ (0.14) $ (1.33) $ — $ (1.33) $ 78.10 (0.14)% $ 1,201,873 0.51% 0.51% 1.60% 22%IB 79.54 1.10 (1.43) (0.33) (1.10) — (1.10) 78.11 (0.38) 120,176 0.76 0.76 1.34 22
For the Year Ended December 31, 2017IA $ 67.55 $ 1.30 $ 12.10 $ 13.40 $ (1.38) $ — $ (1.38) $ 79.57 19.85% $ 1,378,245 0.52% 0.52% 1.76% 14%IB 67.53 1.11 12.08 13.19 (1.18) — (1.18) 79.54 19.54 143,370 0.77 0.77 1.51 14
For the Year Ended December 31, 2016IA $ 64.06 $ 1.14 $ 3.61 $ 4.75 $ (1.26) $ — $ (1.26) $ 67.55 7.41% $ 1,312,626 0.52% 0.52% 1.72% 29%IB 64.03 0.97 3.61 4.58 (1.08) — (1.08) 67.53 7.14 140,317 0.77 0.77 1.47 29
Hartford Total Return Bond HLS Fund
For the Six-Month Period Ended June 30, 2021 (Unaudited)IA $ 11.98 $ 0.12 $ (0.25) $ (0.13) $ — $ — $ — $ 11.85 (1.09)%(4) $ 2,098,493 0.50%(5) 0.50%(5) 2.07%(5) 35%(11)
IB 11.91 0.11 (0.25) (0.14) — — — 11.77 (1.18)(4) 253,661 0.75(5) 0.75(5) 1.82(5) 35(11)
For the Year Ended December 31, 2020IA $ 11.44 $ 0.29 $ 0.73 $ 1.02 $ (0.45) $ (0.03) $ (0.48) $ 11.98 9.03% $ 2,110,986 0.51% 0.51% 2.45% 62%(11)
IB 11.38 0.26 0.72 0.98 (0.42) (0.03) (0.45) 11.91 8.71 265,900 0.76 0.76 2.19 62(11)
For the Year Ended December 31, 2019IA $ 10.76 $ 0.36(12) $ 0.77(12) $ 1.13 $ (0.45) $ — $ (0.45) $ 11.44 10.65% $ 1,873,182 0.51% 0.51% 3.16%(12) 61%IB 10.70 0.33(12) 0.77(12) 1.10 (0.42) — (0.42) 11.38 10.32 214,338 0.76 0.76 2.91(12) 61
For the Year Ended December 31, 2018IA $ 11.32 $ 0.35 $ (0.43) $ (0.08) $ (0.44) $ (0.04) $ (0.48) $ 10.76 (0.81)% $ 1,871,299 0.51% 0.51% 3.23% 53%IB 11.25 0.33 (0.43) (0.10) (0.41) (0.04) (0.45) 10.70 (0.91) 215,123 0.76 0.76 2.98 53
For the Year Ended December 31, 2017IA $ 11.09 $ 0.34 $ 0.23 $ 0.57 $ (0.34) $ — $ (0.34) $ 11.32 5.16% $ 2,157,506 0.51% 0.51% 2.99% 89%IB 11.03 0.31 0.22 0.53 (0.31) — (0.31) 11.25 4.80 248,785 0.76 0.76 2.74 89
For the Year Ended December 31, 2016IA $ 10.93 $ 0.36 $ 0.13 $ 0.49 $ (0.29) $ (0.04) $ (0.33) $ 11.09 4.49% $ 2,244,505 0.52% 0.52% 3.16% 36%IB 10.87 0.33 0.13 0.46 (0.26) (0.04) (0.30) 11.03 4.22 262,187 0.77 0.77 2.91 36
The accompanying notes are an integral part of these financial statements.
101

p
123106 TX 102STATE STREET GLOBAL HLS SEMI-ANNUAL REPO
27-Jul-2021 20:50 ESTCLN PSLNF
Donnelley Financial LSWpf_rendNone
2*PMT 1C
LSWP64RS3021.6.2.0
Hartford HLS FundsFinancial Highlights – (continued)
— Selected Per-Share Data(1) — — Ratios and Supplemental Data —
Class
Net AssetValue at
Beginningof Period
NetInvestment
Income(Loss)
NetRealized
andUnrealizedGain (Loss)
onInvestments
Total fromInvestmentOperations
Dividendsfrom Net
InvestmentIncome
Distributionsfrom
CapitalGains
TotalDividends
andDistributions
NetAsset
Value atEnd ofPeriod
TotalReturn(2)
NetAssets at
End ofPeriod(000s)
Ratio ofExpenses
toAverage
NetAssetsBeforeAdjust-ments(3)
Ratio ofExpenses
toAverage
NetAssetsAfter
Adjust-ments(3)
Ratio ofNet
InvestmentIncome
(Loss) toAverage
Net AssetsPortfolioTurnover
Hartford Ultrashort Bond HLS Fund
For the Six-Month Period Ended June 30, 2021 (Unaudited)IA $ 10.09 $ 0.01 $ (0.01) $ — $ — $ — $ — $ 10.09 0.00(4) $ 638,240 0.43%(5) 0.43%(5) 0.22%(5) 35%IB 10.09 0.00(9) (0.01) (0.01) — — — 10.08 (0.10)(4) 101,974 0.68(5) 0.68(5) (0.02)(5) 35
For the Year Ended December 31, 2020IA $ 10.19 $ 0.10 $ 0.05 $ 0.15 $ (0.25) $ — $ (0.25) $ 10.09 1.44% $ 657,375 0.46% 0.46% 0.95% 76%IB 10.18 0.07 0.06 0.13 (0.22) — (0.22) 10.09 1.27 110,250 0.71 0.71 0.67 76
For the Year Ended December 31, 2019IA $ 10.10 $ 0.23 $ 0.05 $ 0.28 $ (0.19) $ — $ (0.19) $ 10.19 2.81% $ 393,590 0.45% 0.45% 2.21% 70%IB 10.09 0.20 0.06 0.26 (0.17) — (0.17) 10.18 2.54 57,142 0.70 0.70 1.96 70
For the Year Ended December 31, 2018IA $ 10.06 $ 0.18 $ (0.02) $ 0.16 $ (0.12) $ — $ (0.12) $ 10.10 1.57% $ 437,160 0.45% 0.45% 1.77% 51%IB 10.05 0.15 (0.02) 0.13 (0.09) — (0.09) 10.09 1.27 64,859 0.70 0.70 1.52 51
For the Year Ended December 31, 2017IA $ 10.04 $ 0.10 $ —(10) $ 0.10 $ (0.08) $ — $ (0.08) $ 10.06 1.01% $ 460,643 0.45% 0.45% 1.00% 60%IB 10.02 0.07 0.01(10) 0.08 (0.05) — (0.05) 10.05 0.80 65,424 0.70 0.70 0.75 60
For the Year Ended December 31, 2016IA $ 9.99 $ 0.06 $ 0.04 $ 0.10 $ (0.05) $ — $ (0.05) $ 10.04 0.97% $ 533,091 0.45% 0.45% 0.61% 51%IB 9.97 0.04 0.02 0.06 (0.01) — (0.01) 10.02 0.64 78,658 0.70 0.70 0.35 51
(1) Information presented relates to a share outstanding throughout the indicated period. Net investment income (loss) per share amounts are calculated based on average sharesoutstanding unless otherwise noted.
(2) The figures do not include sales charges or other fees which may be applied at the variable contract level or by a qualified pension or retirement plan. Any such additional sales chargesor other fees would lower the Fund’s performance.
(3) Adjustments include waivers and reimbursements, if applicable. Ratios do not include fees paid indirectly (see Expenses in the accompanying Notes to Financial Statements).(4) Not annualized.(5) Annualized.(6) Portfolio turnover excludes TBA roll transactions. Had TBA roll transactions been included, the portfolio turnover rate would have been 25% for the six-month period ended June 30,
2021 and 48% for the year ended December 31, 2020.(7) FASB issued ASU 2017-08 to amend the amortization period to the earliest call date for purchased callable debt securities held at a premium. Effective January 1, 2019, the Fund
amended its amortization policy and the effect of this change for the year ended December 31, 2019 was an increase to net investment income per share for less than $ 0.005,decrease to net realized and unrealized gain (loss) on investments for less than $ (0.005) and a decrease to ratio of net investment income to average net assets for less than 0.005%for each class of shares. Per share data and ratios for periods prior to December 31, 2019 have not been restated to reflect this change in presentation.
(8) Commenced operations on September 18, 2020.(9) Amount is less than $ 0.01 per share.(10) Per share amount was not in accord with the net realized and unrealized gain (loss) for the period because of the timing of transactions in shares of the Fund and the amount and timing
of per-share net realized and unrealized gain (loss) on such shares.(11) Portfolio turnover excludes TBA roll transactions. Had TBA roll transactions been included, the portfolio turnover rate would have been 265% for the six-month period ended
June 30, 2021 and 564% for the year ended December 31, 2020.(12) FASB issued ASU 2017-08 to amend the amortization period to the earliest call date for purchased callable debt securities held at a premium. Effective January 1, 2019, the Fund
amended its amortization policy and the effect of this change for the year ended December 31, 2019 was a decrease to net investment income per share for less than $ (0.005),increase to net realized and unrealized gain (loss) on investments for less than $ 0.005 and a decrease to ratio of net investment income to average net assets of (0.01)% for eachclass of shares. Per share data and ratios for periods prior to December 31, 2019 have not been restated to reflect this change in presentation.
(13) Amount is less than 0.01%.
The accompanying notes are an integral part of these financial statements.
102

123106 TX 103STATE STREET GLOBAL HLS SEMI-ANNUAL REPO
27-Jul-2021 20:50 ESTCLN PSLNF
Donnelley Financial LSWpf_rendSTART PAGE
3*PMT 1C
LSWP64RS3021.6.2.0
Hartford HLS FundsNotes to Financial StatementsJune 30, 2021 (Unaudited)
1. Organization:
Hartford Series Fund, Inc. and Hartford HLS Series Fund II, Inc. (each, a “Company” and collectively, the “Companies”) are each an open-endregistered management investment company comprised of eleven and one series, respectively, as of June 30, 2021. Financial statements for theseries of each Company listed below (each, a “Fund” and collectively, the “Funds”) are included in this report.
Hartford Series Fund, Inc.:Hartford Balanced HLS Fund (the “Balanced HLS Fund”)Hartford Capital Appreciation HLS Fund (the “Capital Appreciation HLS Fund”)Hartford Disciplined Equity HLS Fund (the “Disciplined Equity HLS Fund”)Hartford Dividend and Growth HLS Fund (the “Dividend and Growth HLS Fund”)Hartford Healthcare HLS Fund (the “Healthcare HLS Fund”)Hartford International Opportunities HLS Fund (the “International Opportunities HLS Fund”)Hartford MidCap HLS Fund (the “MidCap HLS Fund”)Hartford Small Company HLS Fund (the “Small Company HLS Fund”)Hartford Stock HLS Fund (the “Stock HLS Fund”)Hartford Total Return Bond HLS Fund (the “Total Return Bond HLS Fund”)Hartford Ultrashort Bond HLS Fund (the “Ultrashort Bond HLS Fund”)
Hartford HLS Series Fund II, Inc.:Hartford Small Cap Growth HLS Fund (the “Small Cap Growth HLS Fund”)
The assets of each Fund are separate, and a shareholder’s interest is limited to the Fund in which shares are held. Each Company is organizedunder the laws of the State of Maryland and is registered with the U.S. Securities and Exchange Commission (the “SEC”) under the InvestmentCompany Act of 1940, as amended (the “1940 Act”). Each Fund serves as an underlying investment option for certain variable annuity andvariable life insurance separate accounts of insurance companies and certain qualified pension or retirement plans. Owners of variable annuitycontracts and policyholders of variable life insurance contracts may choose the Funds if permitted in the variable insurance contract prospectus.In addition, participants in certain qualified pension or retirement plans may choose the Funds if permitted by their plans.
Each Fund is a diversified open-end management investment company. Each Fund applies specialized accounting and reporting standards underAccounting Standards Codification Topic 946, “Financial Services – Investment Companies.”
Each Fund has registered for sale Class IA and IB shares. Each of Capital Appreciation HLS Fund and Disciplined Equity HLS Fund also hasregistered for sale Class IC shares. Class IA and Class IB shares of each Fund are closed to certain investors. For more information, please seethe Funds’ statutory prospectus dated April 30, 2021, as supplemented. Each class is offered at the per share net asset value (“NAV”) without asales charge and is subject to the same expenses, except certain class specific expenses. Class IB shares are subject to distribution and servicefees charged pursuant to a Distribution Plan adopted in accordance with Rule 12b-1 under the 1940 Act. Class IC shares are subject todistribution fees charged pursuant to a Distribution Plan adopted in accordance with Rule 12b-1 under the 1940 Act and Class IC shares are alsosubject to an administrative services fee.
2. Significant Accounting Policies:
The following is a summary of significant accounting policies of each Fund used in the preparation of its financial statements, which are inaccordance with United States Generally Accepted Accounting Principles (“U.S. GAAP”). The preparation of financial statements in accordancewith U.S. GAAP may require management to make estimates and assumptions that affect the reported amounts of assets and liabilities anddisclosure of contingent assets and liabilities at the date of the financial statements and the reported amounts of increases and decreases in netassets from operations during the reporting period. Actual results could differ from those estimates.
a) Determination of Net Asset Value – The NAV of each class of each Fund’s shares is determined as of the close of regular trading on theNew York Stock Exchange (the “Exchange”) (normally 4:00 p.m. Eastern Time) (the “NYSE Close”) on each day that the Exchange is open(“Valuation Date”). If the Exchange is closed due to weather or other extraordinary circumstances on a day it would typically be open forbusiness, each Fund may treat such day as a typical business day and accept purchase and redemption orders and calculate each Fund’sNAV in accordance with applicable law. The NAV of each class of each Fund’s shares is determined by dividing the value of the Fund’s netassets attributable to a class of shares by the number of shares outstanding for that class. Information that becomes known to the Fundsafter the NAV has been calculated on a particular day will not generally be used to retroactively adjust the NAV determined earlier that day.
b) Investment Valuation and Fair Value Measurements – For purposes of calculating the NAV of each class of each Fund, portfolio securitiesand other assets held in the Fund’s portfolio for which market prices are readily available are valued at market value. Market value isgenerally determined on the basis of official close price or last reported trade price. If no trades were reported, market value is based onprices obtained from a quotation reporting system, established market makers (including evaluated prices), or independent pricing services.
103

123106 TX 104STATE STREET GLOBAL HLS SEMI-ANNUAL REPO
27-Jul-2021 20:50 ESTCLN PSLNF
Donnelley Financial LSWpf_rendNone
2*PMT 1C
LSWP64RS3021.6.2.0
Hartford HLS FundsNotes to Financial Statements – (continued)June 30, 2021 (Unaudited)
Pricing vendors may use matrix pricing or valuation models that utilize certain inputs and assumptions to derive values, including transactiondata, credit quality information, general market conditions, news, and other factors and assumptions.
If market prices are not readily available or are deemed unreliable, a Fund will use the fair value of the security or other instrument asdetermined in good faith under policies and procedures established by and under the supervision of the Board of Directors of the Company(the “Board of Directors”) (“Valuation Procedures”). Market prices are considered not readily available where there is an absence of currentor reliable market-based data (e.g., trade information or broker quotes), including where events occur after the close of the relevant market,but prior to the NYSE Close, that materially affect the values of a Fund’s portfolio holdings or assets. In addition, market prices areconsidered not readily available when, due to extraordinary circumstances, the exchanges or markets on which the securities or otherinstruments trade do not open for trading for the entire day and no other market prices are available. Fair value pricing is subjective in natureand the use of fair value pricing by a Fund may cause the NAV of its shares to differ significantly from the NAV that would have beencalculated using market prices at the close of the exchange on which a portfolio holding is primarily traded. There can be no assurance that aFund could obtain the fair value assigned to an investment if the Fund were to sell the investment at approximately the time at which theFund determines its NAV.
Prices of foreign equities that are principally traded on certain foreign markets will generally be adjusted daily pursuant to a fair value pricingservice in order to reflect an adjustment for the factors occurring after the close of certain foreign markets but before the NYSE Close.Securities and other instruments that are primarily traded on foreign markets may trade on days that are not business days of the Funds.The value of the foreign securities or other instruments in which a Fund invests may change on days when a shareholder will not be able topurchase, redeem or exchange shares of the Fund.
Fixed income investments (other than short-term obligations) held by a Fund are normally valued at prices supplied by independent pricingservices in accordance with the Valuation Procedures. Short-term investments maturing in 60 days or less are generally valued atamortized cost.
Exchange-traded derivatives, such as options, futures and options on futures, are valued at the last sale price determined by the exchangewhere such instruments principally trade as of the close of such exchange (“Exchange Close”). If a last sale price is not available, the valuewill be the mean of the most recently quoted bid and ask prices as of the Exchange Close. If a mean of the bid and ask prices cannot becalculated for the day, the value will be the most recently quoted bid price as of the Exchange Close. Over-the-counter derivatives arenormally valued based on prices supplied by independent pricing services in accordance with the Valuation Procedures.
Investments valued in currencies other than U.S. dollars are converted to U.S. dollars using the prevailing spot currency exchange ratesobtained from independent pricing services for calculation of the NAV. As a result, the NAV of a Fund’s shares may be affected by changesin the value of currencies in relation to the U.S. dollar. The value of securities or other instruments traded in markets outside the UnitedStates or denominated in currencies other than the U.S. dollar may be affected significantly on a day that the Exchange is closed and themarket value may change on days when an investor is not able to purchase, redeem or exchange shares of a Fund.
Foreign currency contracts represent agreements to exchange currencies on specific future dates at predetermined rates. Foreign currencycontracts are valued using foreign currency exchange rates and forward rates as provided by an independent pricing service on theValuation Date.
Investments in open-end mutual funds, if any, are valued at the respective NAV of each open-end mutual fund on the Valuation Date. Sharesof investment companies listed and traded on an exchange are valued in the same manner as any exchange-listed equity security. Suchopen-end mutual funds and listed investment companies may use fair value pricing as disclosed in their prospectuses.
Financial instruments for which prices are not available from an independent pricing service may be valued using market quotations obtainedfrom one or more dealers that make markets in the respective financial instrument in accordance with the Valuation Procedures.
U.S. GAAP defines fair value as the price that a Fund would receive to sell an asset or pay to transfer a liability in an orderly transactionbetween market participants. The U.S. GAAP fair value measurement standards require disclosure of a fair value hierarchy for each majorcategory of assets and liabilities. Various inputs are used in determining the fair value of each Fund’s investments. These inputs aresummarized into three broad hierarchy levels. This hierarchy is based on whether the valuation inputs are observable or unobservable.These levels are:
• Level 1 – Quoted prices in active markets for identical investments. Level 1 may include exchange traded instruments, such asdomestic equities, some foreign equities, options, futures, mutual funds, exchange traded funds, rights and warrants.
• Level 2 – Observable inputs other than Level 1 prices, such as quoted prices for similar investments; quoted prices in markets that arenot active; or other inputs that are observable or can be corroborated by observable market data. Level 2 may include debt investmentsthat are traded less frequently than exchange traded instruments and which are valued using independent pricing services; foreignequities, which are principally traded on certain foreign markets and are adjusted daily pursuant to a fair value pricing service in order to
104

123106 TX 105STATE STREET GLOBAL HLS SEMI-ANNUAL REPO
27-Jul-2021 20:50 ESTCLN PSLNF
Donnelley Financial LSWpf_rendNone
2*PMT 1C
LSWP64RS3021.6.2.0
Hartford HLS FundsNotes to Financial Statements – (continued)June 30, 2021 (Unaudited)
reflect an adjustment for the factors occurring after the close of certain foreign markets but before the NYSE Close; senior floating rateinterests, which are valued using an aggregate of dealer bids; short-term investments, which are valued at amortized cost; and swaps,which are valued based upon the terms of each swap contract.
• Level 3 – Significant unobservable inputs that are supported by limited or no market activity. Level 3 may include financial instrumentswhose values are determined using indicative market quotes or require significant management judgment or estimation. Theseunobservable valuation inputs may include estimates for current yields, maturity/duration, prepayment speed, and indicative marketquotes for comparable investments along with other assumptions relating to credit quality, collateral value, complexity of the investmentstructure, general market conditions and liquidity. This category may include investments where trading has been halted or there arecertain restrictions on trading. While these investments are priced using unobservable inputs, the valuation of these investments reflectsthe best available data and management believes the prices are a reasonable representation of exit price.
The Board of Directors has delegated the day-to-day responsibility for implementing the Valuation Procedures to the Valuation Committee.The Valuation Committee will consider all relevant factors in determining an investment’s fair value, and may seek the advice of such Fund’ssub-adviser, knowledgeable brokers, and legal counsel in making such determination. The Valuation Committee reports to the AuditCommittee of the Board of Directors.
Valuation levels are not necessarily indicative of the risk associated with investing in such investments. Individual investments within any of theabove mentioned asset classes may be assigned a different hierarchical level than those presented above, as individual circumstances dictate.
For additional information, refer to the Fair Value Summary and the Level 3 roll-forward reconciliation, if applicable, which follows eachFund’s Schedule of Investments.
c) Investment Transactions and Investment Income – Investment transactions are recorded as of the trade date (the date the order to buy orsell is executed) for financial reporting purposes. Investments purchased or sold on a when-issued or delayed-delivery basis may be settleda month or more after the trade date. Realized gains and losses are determined on the basis of identified cost.
The trade date for senior floating rate interests purchased in the primary loan market is considered the date on which the loan allocations aredetermined. The trade date for senior floating rate interests purchased in the secondary loan market is the date on which the transaction isentered into.
Dividend income from domestic securities is accrued on the ex-dividend date. In general, dividend income from foreign securities is recordedon the ex-date; however, dividend notifications in certain foreign jurisdictions may not be available in a timely manner and as a result, a Fundwill record the dividend as soon as the relevant details (i.e., rate per share, payment date, shareholders of record, etc.) are publicly available.Interest income, including amortization of premium, accretion of discounts, inflation adjustments and additional principal received in-kind inlieu of cash, is accrued on a daily basis. Paydown gains and losses on mortgage-related and other asset-backed securities are included ininterest income in the Statements of Operations, as applicable.
Please refer to Note 8 for Securities Lending information.
d) Taxes – A Fund may be subject to taxes imposed on realized gains on securities of certain foreign countries in which such Fund invests. AFund may also be subject to taxes withheld on foreign dividends and interest from securities in which a Fund invests. The amount of anyforeign taxes withheld and foreign tax expense is included on the accompanying Statements of Operations as a reduction to net investmentincome or net realized or unrealized gain (loss) on investments in these securities, if applicable.
e) Foreign Currency Transactions – Assets and liabilities denominated in currencies other than U.S. dollars are translated into U.S. dollars atthe exchange rates in effect on the Valuation Date. Purchases and sales of investments, income and expenses are translated into U.S.dollars at the exchange rates on the dates of such transactions.
A Fund does not isolate that portion of portfolio investment valuation resulting from fluctuations in the foreign currency exchange rates fromthe fluctuations arising from changes in the market prices of investments held. Exchange rate fluctuations are included with the net realizedand unrealized gain or loss on investments in the accompanying financial statements.
Net realized foreign exchange gains or losses arise from sales of foreign currencies and the difference between asset and liability amountsinitially stated in foreign currencies and the U.S. dollar value of the amounts actually received or paid. Net unrealized foreign exchange gainsor losses arise from changes in the value of other assets and liabilities at the end of the reporting period, resulting from changes in theexchange rates.
f) Joint Trading Account – A Fund may invest cash balances into a joint trading account that may be invested in one or more repurchaseagreements.
105
j p
123106 TX 106STATE STREET GLOBAL HLS SEMI-ANNUAL REPO
27-Jul-2021 20:50 ESTCLN PSLNF
Donnelley Financial LSWpf_rendNone
2*PMT 1C
LSWP64RS3021.6.2.0
Hartford HLS FundsNotes to Financial Statements – (continued)June 30, 2021 (Unaudited)
g) Fund Share Valuation and Dividend Distributions to Shareholders – Orders for each class of each Fund’s shares are executed in accordancewith the investment instructions of the contract holders and plan participants. The NAV of each class of each Fund’s shares is determined asof the close of business on each business day of the Exchange (see Note 2(a)). The NAV is determined separately for each class of sharesof a Fund by dividing the Fund’s net assets attributable to that class by the number of shares of the class outstanding. Each class of sharesoffered by a Fund has equal rights as to assets and voting privileges (except that shareholders of a class have exclusive voting rightsregarding any matter relating solely to that class of shares). Income and non class-specific expenses are allocated daily to each class on thebasis of the relative net assets of the class of the Fund. Realized and unrealized gains and losses are allocated daily based on the relativenet assets of each class of shares of each Fund.
Orders for the purchase of a Fund’s shares received prior to the close of the Exchange on any day the Exchange is open for business arepriced at the NAV determined as of the close of the Exchange. Orders received after the close of the Exchange, or on a day on which theExchange and/or the Funds are not open for business, are priced at the next determined NAV.
Dividends are declared pursuant to a policy adopted by the respective Company’s Board of Directors. Dividends and/or distributions toshareholders are recorded on ex-date. The policy of each Fund is to pay dividends from net investment income and realized gains, if any, atleast once a year. Income dividends and capital gains distributions are determined in accordance with federal income tax regulations, whichmay differ from U.S. GAAP with respect to character and timing.
3. Securities and Other Investments:
a) Restricted Securities – Each Fund may invest in securities that are subject to legal or contractual restrictions on resale. These securitiesgenerally may be resold in transactions exempt from registration or to the public if the securities are registered. Disposal of these securitiesmay involve time-consuming negotiations and expense, and prompt sale at an acceptable price may be difficult. Information regardingrestricted securities, if applicable, is included at the end of each Fund’s Schedule of Investments.
b) Investments Purchased on a When-Issued or Delayed-Delivery Basis – Delivery and payment for investments that have been purchased bya Fund on a forward commitment, or when-issued or delayed-delivery basis, take place beyond the customary settlement period. A Fundmay dispose of or renegotiate a delayed-delivery transaction after it is entered into, and may sell delayed-delivery investments before theyare delivered, which may result in a realized gain or loss. During this period, such investments are subject to market fluctuations, and a Fundidentifies investments segregated in its records with a value at least equal to the amount of the commitment. See each Fund’s Schedule ofInvestments, if applicable, for when-issued or delayed-delivery investments as of June 30, 2021.
In connection with a Fund’s ability to purchase investments on a when-issued or forward commitment basis, the Fund may enter into to-beannounced (“TBA”) commitments. TBA commitments are forward agreements for the purchase or sale of mortgage-backed securities for afixed price, with payment and delivery on an agreed-upon future settlement date. The specific securities to be delivered are not identified atthe trade date; however, delivered securities must meet specified terms, including issuer, rate and mortgage terms. Although a Fund mayenter into TBA commitments with the intention of acquiring or delivering securities for its portfolio, the Fund can extend the settlement date,roll the transaction, or dispose of a commitment prior to settlement if deemed appropriate to do so. If the TBA commitment is closed throughthe acquisition of an offsetting TBA commitment, a Fund realizes a gain or loss. In a TBA roll transaction, a Fund generally purchases orsells the initial TBA commitment prior to the agreed upon settlement date and enters into a new TBA commitment for future delivery orreceipt of the mortgage-backed securities. TBA commitments involve a risk of loss if the value of the security to be purchased or solddeclines or increases, respectively, prior to settlement date. These transactions are excluded from a Fund’s portfolio turnover rate. See eachFund’s Schedule of Investments, if applicable, for TBA commitments as of June 30, 2021.
c) Senior Floating Rate Interests – Certain Funds may invest in senior floating rate interests. Senior floating rate interests generally hold themost senior position in the capital structure of a business entity (the “Borrower”), are typically secured by specific collateral and have a claimon the assets and/or stock of the Borrower that is senior to that held by subordinated debt holders and stockholders of the Borrower. Seniorfloating rate interests are typically structured and administered by a financial institution that acts as the agent of the lenders participating inthe senior floating rate interest. A Fund may invest in multiple series or tranches of a senior floating rate interest, which may have varyingterms and carry different associated risks. A Fund may also enter into unfunded loan commitments, which are contractual obligations forfuture funding. Unfunded loan commitments may include resolving credit facilities, which may obligate the Fund to supply additional cash tothe Borrower on demand. Unfunded loan commitments represent a future obligation in full. Unfunded loan commitments, and the obligationsto future funding, are recored as a liability on the Statements of Assets and Liabilities at par value at the time the commitment is entered into.A Fund may receive a commitment fee based on the undrawn portion of the underlying line of credit portion of a senior floating rate interest.In certain circumstances, a Fund may receive various fees upon the restructure of a senior floating rate interest by a borrower. Fees earned/paid may be recorded as a component of income or realized gain/loss in the Statements of Operations.
106

p qp
123106 TX 107STATE STREET GLOBAL HLS SEMI-ANNUAL REPO
27-Jul-2021 20:50 ESTCLN PSLNF
Donnelley Financial LSWpf_rendNone
2*PMT 1C
LSWP64RS3021.6.2.0
Hartford HLS FundsNotes to Financial Statements – (continued)June 30, 2021 (Unaudited)
As of June 30, 2021 the following Funds had unfunded commitments reflected on the Statement of Assets and Liabilities, which could beextended at the option of the borrower, pursuant to loan agreements with the following borrowers:
Senior floating rate interests are typically rated below-investment-grade, which suggests they are more likely to default and generally payhigher interest rates than investment-grade loans. A default could lead to non-payment of income, which would result in a reduction ofincome to a Fund, and there can be no assurance that the liquidation of any collateral would satisfy the Borrower’s obligation in the event ofnon-payment of scheduled interest or principal payments, or that such collateral could be readily liquidated. See each Fund’s Schedule ofInvestments, if applicable, for outstanding senior floating rate interests as of June 30, 2021.
d) Mortgage-Related and Other Asset-Backed Securities – A Fund may invest in mortgage-related and other asset-backed securities. Thesesecurities include mortgage pass-through securities, collateralized mortgage obligations, commercial mortgage-backed securities, strippedmortgage-backed securities, asset-backed securities, collateralized debt obligations and other securities that directly or indirectly represent aparticipation in, or are secured by and payable from, mortgage loans on real property. Mortgage-related securities are created from pools ofresidential or commercial mortgage loans, including mortgage loans made by savings and loan institutions, mortgage bankers, commercialbanks and others. Asset-backed securities are created from many types of assets, including auto loans, credit card receivables, home equityloans, and student loans. These securities provide a monthly payment that consists of both interest and principal payments. Interestpayments may be determined by fixed or adjustable rates. The rate of prepayments on underlying mortgages will affect the price andvolatility of a mortgage-related security, and may have the effect of shortening or extending the effective duration of the security relative towhat was anticipated at the time of purchase. The timely payment of principal and interest of certain mortgage-related securities isguaranteed by the full faith and credit of the United States Government. Mortgage-related and other asset-backed securities created andguaranteed by non-governmental issuers, including government-sponsored corporations, may be supported by various forms of insurance orguarantees, but there can be no assurance that the private insurers or guarantors can meet their obligations under the insurance policies orguarantee arrangements. See each Fund’s Schedule of Investments, if applicable, for mortgage-related and other asset-backed securities asof June 30, 2021.
e) Inflation-Indexed Bonds – A Fund may invest in inflation-indexed bonds. Inflation-indexed bonds are fixed income investments whoseprincipal value is periodically adjusted to the rate of inflation. The interest rate on these bonds is generally fixed at issuance at a rate lowerthan typical bonds. Over the life of an inflation-indexed bond, however, interest will be paid based on a principal value, which is adjusted forinflation. Any increase or decrease in the principal amount of an inflation-indexed bond will be included as interest income on the Statementsof Operations, even though investors do not receive the principal amount until maturity. See each Fund’s Schedule of Investments, ifapplicable, for inflation-indexed bonds as of June 30, 2021.
f) Repurchase Agreements – A repurchase agreement is an agreement between two parties whereby one party sells the other a security at aspecified price with a commitment to repurchase the security later at an agreed-upon price, date and interest payment. Each Fund ispermitted to enter into fully collateralized repurchase agreements. Each Company’s Board of Directors has delegated to the sub-adviser theresponsibility of evaluating the creditworthiness of the banks and securities dealers with which the Funds will engage in repurchaseagreements. The sub-adviser(s) will monitor such transactions to ensure that the value of underlying collateral will be at least equal to thetotal amount of the repurchase obligation as required by the valuation provision of the repurchase agreement, including the accrued interest.Repurchase agreements carry the risk that the market value of the securities declines below the repurchase price. A Fund could also losemoney if it is unable to recover the securities and the value of any collateral held or assets segregated by the Fund to cover the transaction isless than the value of the securities. In the event the borrower commences bankruptcy proceedings, a court may characterize the transactionas a loan. If a Fund has not perfected a security interest in the underlying collateral, the Fund may be required to return the underlyingcollateral to the borrower’s estate and be treated as an unsecured creditor. As an unsecured creditor, the Fund could lose some or all of theprincipal and interest involved in the transaction. See each Fund’s Schedule of Investments, if applicable, for repurchase agreements as ofJune 30, 2021.
g) Special Purpose Acquisition Companies – A Fund may invest in special purpose acquisition companies (“SPACs”) or similar special purposeentities. SPACs are collective investment structures that pool funds in order to seek potential acquisition opportunities. SPACs and similarentities may be blank check companies with no operating history or ongoing business other than to seek a potential acquisition. BecauseSPACs and similar entities have no operating history or ongoing business other than seeking acquisitions, the value of their securities isparticularly dependent on the ability of the entity’s management to identify and complete a profitable acquisition. Some SPACs may pursueacquisitions only within certain industries or regions, which may increase the volatility of their securities’ prices. In addition, these securities,which are typically traded in the OTC market, may be considered illiquid and/or be subject to restrictions on resale. A Fund may enter into acontingent commitment with a SPAC to purchase shares of private investments in public equity investments (“PIPE”) if and when the SPACcompletes its merger or acquisition; however if the commitment expires, then no shares are purchased. Purchased PIPE shares will berestricted from trading until the registration statement for the shares is declared effective. Upon registration, the shares can be freely sold;however, in certain circumstances, the issuer may have the right to temporarily suspend trading of the shares in the first year after themerger. The Small Company HLS Fund had contingent commitments outstanding of approximately $13,604,640 to purchase PIPE shares asof June 30, 2021.
107

123106 TX 108STATE STREET GLOBAL HLS SEMI-ANNUAL REPO
27-Jul-2021 20:50 ESTCLN PSLNF
Donnelley Financial LSWpf_rendNone
2*PMT 1C
LSWP64RS3021.6.2.0
Hartford HLS FundsNotes to Financial Statements – (continued)June 30, 2021 (Unaudited)
4. Financial Derivative Instruments:
The following disclosures contain information on how and why a Fund may use derivative instruments, the credit-risk-related contingent featuresin certain derivative instruments, and how derivative instruments affect a Fund’s financial position and results of operations. The location and fairvalue amounts of these instruments on the Statements of Assets and Liabilities and the realized gains and losses and changes in unrealizedgains and losses on the Statements of Operations, each categorized by type of derivative contract, are included in the following AdditionalDerivative Instrument Information footnote. The derivative instruments outstanding as of period-end are disclosed in the notes to the Schedules ofInvestments, if applicable. The amounts of realized gains and losses and changes in unrealized gains and losses on derivative instruments duringthe period are disclosed in the Statements of Operations.
a) Foreign Currency Contracts – A Fund may enter into foreign currency contracts that obligate the Fund to purchase or sell currencies atspecified future dates. Foreign currency contracts may be used in connection with settling purchases or sales of securities to hedge thecurrency exposure associated with some or all of a Fund’s investments and/or as part of an investment strategy. Foreign currency contractsare marked to market daily and the change in value is recorded by a Fund as an unrealized gain or loss. A Fund will record a realized gain orloss when the foreign currency contract is settled.
Foreign currency contracts involve elements of market risk in excess of the amounts reflected in the Statements of Assets and Liabilities. Inaddition, risks may arise upon entering into these contracts from the potential inability of the counterparties to meet the terms of the contractsand from unanticipated movements in the value of the foreign currencies relative to the U.S. dollar. Upon entering into a foreign currencycontract, a Fund may be required to post margin equal to its outstanding exposure thereunder.
During the six-month period ended June 30, 2021, each of Capital Appreciation HLS Fund and Total Return Bond HLS Fund had usedForeign Currency Contracts.
b) Futures Contracts – A Fund may enter into futures contracts. A futures contract is an agreement between two parties to buy or sell an assetat a set price on a future date. A Fund may use futures contracts to manage risk or obtain exposure to the investment markets, commodities,or movements in interest rates and currency values. The primary risks associated with the use of futures contracts are the imperfectcorrelation between the change in market value of the investments held by a Fund and the prices of futures contracts and the possibility ofan illiquid market. Upon entering into a futures contract, a Fund is required to deposit with a futures commission merchant (“FCM”) anamount of cash or U.S. Government or Agency Obligations in accordance with the initial margin requirements of the broker or exchange.Futures contracts are marked to market daily and an appropriate amount equal to the change in value (“variation margin”) is paid or receivedby a Fund. Gains or losses are recognized but not considered realized until the contracts expire or are closed. Futures contracts involve, tovarying degrees, risk of loss in excess of the variation margin disclosed on the Statements of Assets and Liabilities.
During the six-month period ended June 30, 2021, each of Balanced HLS Fund, Capital Appreciation HLS Fund and Total Return Bond HLSFund had used Futures Contracts.
c) Options Contracts – An option contract is a contract sold by one party to another party that offers the buyer the right, but not the obligation, tobuy (call) or sell (put) an investment or other financial asset at an agreed-upon price during a specific period of time or on a specific date.Option contracts are either over-the-counter (“OTC”) options or executed in a registered exchange (“exchange-traded options”). A Fund maywrite (sell) covered call and put options on futures, swaps (“swaptions”), securities, commodities or currencies. “Covered” means that so longas a Fund is obligated as the writer of an option, it will own either the underlying investments or currency or an option to purchase the sameunderlying investments or currency having an expiration date of the covered option and an exercise price equal to or less than the exerciseprice of the covered option, or will segregate or earmark cash or other liquid investments having, for written call options, a value equal to thegreater of the exercise price or the market value of the underlying instrument and, for written put options, a value equal to the exercise price.Writing put options may increase a Fund’s exposure to the underlying instrument. Writing call options may decrease a Fund’s exposure to theunderlying instrument. Premiums received from writing options that expire are treated as realized gains. Premiums received from writingoptions that are exercised or closed are added to the proceeds or offset amounts paid on the underlying futures, swaps, investments orcurrency transactions to determine the realized gain or loss. A Fund, as a writer of an option, has no control over whether the underlyinginstrument may be sold (call) or purchased (put) and as a result bears the market risk of an unfavorable change in the price of the instrumentunderlying the written option. There is the risk a Fund may not be able to enter into a closing transaction because of an illiquid market. A Fundmay also purchase put and call options. Purchasing call options may increase a Fund’s exposure to the underlying instrument. Purchasing putoptions may decrease a Fund’s exposure to the underlying instrument. A Fund pays a premium, which is included on the Fund’s Statementsof Assets and Liabilities as an investment and is subsequently marked to market to reflect the current value of the option. Premiums paid forpurchasing options that expire are treated as realized losses. Certain options may be purchased with premiums to be determined on a futuredate. The premiums for these options are based upon implied volatility parameters at specified terms. The risk associated with purchasing putand call options is generally limited to the premium paid. Premiums paid for purchasing options that are exercised or closed are added to theamounts paid or offset against the proceeds on the underlying investment transaction to determine the realized gain or loss. Entering into OTCoptions also exposes a Fund to counterparty risk. Counterparty risk is the possibility that the counterparty to the agreements may default on itsobligation to perform or disagree as to the meaning of the contractual terms in the agreements.
108
g
123106 TX 109STATE STREET GLOBAL HLS SEMI-ANNUAL REPO
28-Jul-2021 08:43 ESTCLN PSLNF
Donnelley Financial LSWmadas0dcNone
3*PMT 1C
VDI-W7-PFL-220621.7.8.0
Hartford HLS FundsNotes to Financial Statements – (continued)June 30, 2021 (Unaudited)
During the six-month period ended June 30, 2021, Total Return Bond HLS Fund had used Options Contracts.
d) Swap Contracts – A Fund may invest in swap contracts. Swap contracts are agreements to exchange or swap investment cash flows,assets, foreign currencies or market-linked returns at specified future intervals. Swap contracts are either privately negotiated in theover-the-counter market (“OTC swaps”) or cleared through a central counterparty or derivatives clearing organization (“centrally clearedswaps”). A Fund may enter into credit default, total return, cross-currency, interest rate, inflation and other forms of swap contracts tomanage its exposure to credit, currency, interest rate, commodity and inflation risk. Swap contracts are also used to gain exposure to certainmarkets. In connection with these contracts, investments or cash may be identified as collateral or margin in accordance with the termsof the respective swap contracts and/or master netting arrangement to provide assets of value and recourse in the event of defaultor bankruptcy/insolvency.
Swaps are valued in accordance with the Valuation Procedures. Changes in market value, if any, are reflected as a component of netchanges in unrealized appreciation or depreciation on the Statements of Operations. Daily changes in valuation of centrally cleared swaps, ifany, are recorded as a receivable or payable for the change in value (“variation margin”) on the Statements of Assets and Liabilities.Realized gains or losses on centrally cleared swaps are recorded upon the termination of the swaps. OTC swap payments received or paidat the beginning of the measurement period are reflected as such on the Statements of Assets and Liabilities and represent premiums paidor received upon entering into the swap contract to compensate for differences between the stated terms of the swap contract and prevailingmarket conditions (credit spreads, currency exchange rates, interest rates and other relevant factors). These upfront premiums are recordedas realized gains or losses on the Statements of Operations upon termination or maturity of the swap. A liquidation payment received ormade at the termination or maturity of the swap is recorded as a realized gain or loss on the Statements of Operations. Net periodicpayments received or paid by a Fund are included as part of realized gains or losses on the Statements of Operations.
Entering into these contracts involves, to varying degrees, elements of liquidation, counterparty, credit and market risk in excess of theamounts recognized on the Statements of Assets and Liabilities. Such risks involve the possibility that there will be no liquid market for thesecontracts, that the counterparty to the contracts may default on its obligation to perform or disagree as to the meaning of contractual terms inthe contracts, and that there may be unfavorable changes in market conditions (credit spreads, currency exchange rates, interest rates andother relevant factors).
A Fund’s maximum risk of loss from counterparty risk for OTC swaps is the net value of the discounted cash flows to be received from thecounterparty over the contract’s remaining life, and current market value, to the extent that amount is positive. The risk is mitigated by havinga master netting arrangement between a Fund and the counterparty, which allows for the netting of payments made or received (althoughsuch amounts are presented on a gross basis within the Statements of Assets and Liabilities, as applicable) as well as the posting ofcollateral to a Fund to cover the Fund’s exposure to the counterparty. In a centrally cleared swap, while a Fund enters into an agreementwith a clearing broker to execute contracts with a counterparty, the performance of the swap is guaranteed by the central clearinghouse,which reduces the Fund’s exposure to counterparty risk. However, the Fund is still exposed to a certain amount of counterparty risk throughthe clearing broker and clearinghouse. The clearinghouse attempts to minimize this risk to its participants through the use of mandatorymargin requirements, daily cash settlements and other procedures. Likewise, the clearing broker reduces its risk through marginrequirements and required segregation of customer balances.
Credit Default Swap Contracts – The credit default swap market allows a Fund to manage credit risk through buying and selling creditprotection on a specific issuer, asset or basket of assets. Certain credit default swaps involve the exchange of a fixed rate premium forprotection against the loss in value of an underlying investment or index in the event of a credit event, such as payment defaultor bankruptcy.
Under a credit default swap contract, one party acts as guarantor by receiving the fixed periodic payment in exchange for the commitment topurchase the underlying investment at par if the defined credit event occurs. Upon the occurrence of a defined credit event, the differencebetween the value of the reference obligation and the swap’s notional amount is recorded as realized gain or loss on swap transactions inthe Statements of Operations. A “buyer” of credit protection agrees to pay a counterparty to assume the credit risk of an issuer upon theoccurrence of certain events. The “seller” of the protection receives periodic payments and agrees to assume the credit risk of an issuerupon the occurrence of certain events. Although specified events are contract specific, credit events are generally defined as bankruptcy,failure to pay, restructuring, obligation acceleration, obligation default or repudiation/moratorium. A “seller’s” exposure is limited to the totalnotional amount of the credit default swap contract. These potential amounts would be partially offset by any recovery values of therespective referenced obligations or upfront payments received upon entering into the contract.
Implied credit spreads, represented in absolute terms, utilized in determining the market value of credit default swap contracts on corporateissues, sovereign government issues or U.S. municipal issues as of year-end are disclosed in the notes to the Schedules of Investments, asapplicable, and serve as an indicator of the current status of the payment/performance risk and represent the likelihood or risk of default forthe credit derivative. The implied credit spread of a particular referenced entity reflects the cost of buying/selling protection and there mayalso be upfront payments required to be made to enter into the contract. Wider credit spreads represent a deterioration of the referencedentity’s credit soundness and a greater likelihood or risk of default or other credit event occurring as defined under the terms of the contract.
109
p
123106 TX 110STATE STREET GLOBAL HLS SEMI-ANNUAL REPO
27-Jul-2021 20:50 ESTCLN PSLNF
Donnelley Financial LSWpf_rendNone
2*PMT 1C
LSWP64RS3021.6.2.0
Hartford HLS FundsNotes to Financial Statements – (continued)June 30, 2021 (Unaudited)
For credit default swap contracts on credit indices, the quoted market prices and resulting values serve as the indicator of the current statusof the payment/performance risk. Increasing market values, in absolute terms when compared to the notional amount of the swap, representa deterioration of the referenced equity’s credit soundness and a greater likelihood or risk of default or other credit event occurring as definedunder the terms of the contract.
During the six-month period ended June 30, 2021, Total Return Bond HLS Fund had used Credit Default Swap Contracts.
Interest Rate Swap Contracts – Certain Funds are subject to interest rate risk exposure in the normal course of pursuing its investmentobjectives. A Fund may use interest rate swaps to hedge interest rate and duration risk across a portfolio at particular duration points tomaintain its ability to generate income at prevailing market rates. In a typical interest rate swap, one party agrees to make regular paymentsequal to a floating interest rate, based on a specified interest rate or benchmark (e.g. London Interbank Offered Rate (“LIBOR”), multiplied bya notional amount, in return for payments equal to a fixed rate multiplied by the same amount, for a specific period of time. The net interestreceived or paid on interest rate swap contracts is recorded as a realized gain or loss. Interest rate swaps are marked to market daily and thechange, if any, is recorded as an unrealized gain or loss in the Statements of Operations. When the interest rate swap contract is terminatedearly, a Fund records a realized gain or loss equal to the difference between the current market value and the upfront premium or cost.
If an interest rate swap contract provides for payments in different currencies, the parties might agree to exchange the notional amount aswell. Interest rate swaps may also depend on other prices or rates, such as the value of an index. The risks of interest rate swaps includechanges in market conditions, which will affect the value of the contract or the cash flows and the possible inability of the counterparty tofulfill its obligations under the contract. A Fund’s maximum risk of loss from counterparty credit risk is the discounted net value of the cashflows to be received from the counterparty over the contract’s remaining life, to the extent that amount is positive.
During the six-month period ended June 30, 2021, Total Return Bond HLS Fund had used Interest Rate Swap Contracts.
e) Additional Derivative Instrument Information:
Balanced HLS Fund
The Effect of Derivative Instruments on the Statement of Assets and Liabilities as of June 30, 2021:
Risk Exposure Category
Interest RateContracts
ForeignCurrencyContracts
CreditContracts
EquityContracts
CommodityContracts
OtherContracts Total
Liabilities:Unrealized depreciation on futures contracts(1) $ 40,240 $ — $ — $ — $ — $ — $ 40,240
Total $ 40,240 $ — $ — $ — $ — $ — $ 40,240
(1) Amount represents the cumulative unrealized depreciation on futures contracts as disclosed within the Schedule of Investments under the open “Futures Contracts” section.Only current day’s variation margin, if any, is reported within the Statement of Assets and Liabilities.
The Effect of Derivative Instruments on the Statement of Operations for the period ended June 30, 2021:
Risk Exposure Category
Interest RateContracts
ForeignCurrencyContracts
CreditContracts
EquityContracts
CommodityContracts
OtherContracts Total
Realized Gain (Loss) on Derivatives Recognized as a Resultof Operations:
Net realized gain (loss) on futures contracts $ 587,785 $ — $ — $ — $ — $ — $ 587,785
Total $ 587,785 $ — $ — $ — $ — $ — $ 587,785
Net Change in Unrealized Appreciation (Depreciation) onDerivatives Recognized as a Result of Operations:
Net change in unrealized appreciation (depreciation) offutures contracts $ (31,232) $ — $ — $ — $ — $ — $ (31,232)
Total $ (31,232) $ — $ — $ — $ — $ — $ (31,232)
For the period ended June 30, 2021, the average monthly amount or number per contract outstanding for each derivative type wasas follows:
Derivative Description
Average NotionalPar, Contracts
or Face Amount
Futures Contracts Short at Number of Contracts (60)
110
p
123106 TX 111STATE STREET GLOBAL HLS SEMI-ANNUAL REPO
27-Jul-2021 20:50 ESTCLN PSLNF
Donnelley Financial LSWpf_rendNone
2*PMT 1C
LSWP64RS3021.6.2.0
Hartford HLS FundsNotes to Financial Statements – (continued)June 30, 2021 (Unaudited)
Capital Appreciation HLS Fund
The Effect of Derivative Instruments on the Statement of Assets and Liabilities as of June 30, 2021:
Risk Exposure Category
Interest RateContracts
ForeignCurrencyContracts
CreditContracts
EquityContracts
CommodityContracts
OtherContracts Total
Assets:Unrealized appreciation on futures contracts(1) $ — $ — $ — $ 3,194,106 $ — $ — $ 3,194,106
Total $ — $ — $ — $ 3,194,106 $ — $ — $ 3,194,106
(1) Amount represents the cumulative unrealized appreciation on futures contracts as disclosed within the Schedule of Investments under the open “Futures Contracts” section.Only current day’s variation margin, if any, is reported within the Statement of Assets and Liabilities.
The Effect of Derivative Instruments on the Statement of Operations for the period ended June 30, 2021:
Risk Exposure Category
Interest RateContracts
ForeignCurrencyContracts
CreditContracts
EquityContracts
CommodityContracts
OtherContracts Total
Realized Gain (Loss) on Derivatives Recognized as a Resultof Operations:
Net realized gain (loss) on futures contracts $ — $ — $ — $ 6,557,027 $ — $ — $ 6,557,027
Total $ — $ — $ — $ 6,557,027 $ — $ — $ 6,557,027
Net Change in Unrealized Appreciation (Depreciation) onDerivatives Recognized as a Result of Operations:
Net change in unrealized appreciation (depreciation) offutures contracts $ — $ — $ — $ 1,287,981 $ — $ — $ 1,287,981
Total $ — $ — $ — $ 1,287,981 $ — $ — $ 1,287,981
For the period ended June 30, 2021, the average monthly amount or number per contract outstanding for each derivative type wasas follows:
Derivative Description
Average NotionalPar, Contracts
or Face Amount
Futures Contracts Long at Number of Contracts 265
Total Return Bond HLS Fund
The Effect of Derivative Instruments on the Statement of Assets and Liabilities as of June 30, 2021:
Risk Exposure Category
Interest RateContracts
ForeignCurrencyContracts
CreditContracts
EquityContracts
CommodityContracts
OtherContracts Total
Assets:Investments in securities, at value (purchased options),
market value $ 866,055 $ — $ — $ — $ — $ — $ 866,055Unrealized appreciation on futures contracts(1) 2,355,245 — — — — — 2,355,245Unrealized appreciation on foreign currency contracts — 1,898,330 — — — — 1,898,330Unrealized appreciation on swap contracts(2) 387,945 — 272,430 — — — 660,375
Total $ 3,609,245 $ 1,898,330 $ 272,430 $ — $ — $ — $ 5,780,005
Liabilities:Unrealized depreciation on futures contracts(1) $ 6,216,987 $ — $ — $ — $ — $ — $ 6,216,987Unrealized depreciation on foreign currency contracts — 85,154 — — — — 85,154Written options, market value 869,905 — — — — — 869,905Unrealized depreciation on swap contracts(2) — — 3,906,447 — — — 3,906,447
Total $ 7,086,892 $ 85,154 $ 3,906,447 $ — $ — $ — $ 11,078,493
(1) Amount represents the cumulative unrealized appreciation and depreciation on futures contracts as disclosed within the Schedule of Investments under the open “FuturesContracts” section. Only current day’s variation margin, if any, is reported within the Statement of Assets and Liabilities.
(2) Amount represents the cumulative unrealized appreciation and depreciation on centrally cleared swaps, if applicable, as disclosed within the Schedule of Investments. Onlythe current day’s variation margin, if any, are reported within the Statements of Assets and Liabilities. OTC swaps are reported within the Statement of Assets and Liabilitieswithin Unrealized appreciation and depreciation on OTC swap contracts, if applicable.
111
p
123106 TX 112STATE STREET GLOBAL HLS SEMI-ANNUAL REPO
28-Jul-2021 08:46 ESTCLN PSLNF
Donnelley Financial LSWmadas0dcNone
3*PMT 1C
VDI-W7-PFL-220621.7.8.0
Hartford HLS FundsNotes to Financial Statements – (continued)June 30, 2021 (Unaudited)
Total Return Bond HLS Fund – (continued)
The Effect of Derivative Instruments on the Statement of Operations for the period ended June 30, 2021:
Risk Exposure Category
Interest RateContracts
ForeignCurrencyContracts
CreditContracts
EquityContracts
CommodityContracts
OtherContracts Total
Realized Gain (Loss) on Derivatives Recognized as aResult of Operations:
Net realized gain (loss) on futures contracts $ 8,355,528 $ — $ — $ — $ — $ — $ 8,355,528Net realized gain (loss) on written options contracts 2,423,476 — — — — — 2,423,476Net realized gain (loss) on swap contracts (559,485) — 1,242,652 — — — 683,167Net realized gain (loss) on foreign currency contracts — 708,525 — — — — 708,525
Total $ 10,219,519 $ 708,525 $ 1,242,652 $ — $ — $ — $ 12,170,696
Net Change in Unrealized Appreciation (Depreciation)on Derivatives Recognized as a Resultof Operations:
Net change in unrealized appreciation (depreciation) ofinvestments in purchased options contracts $ (1,775,124) $ — $ — $ — $ — $ — $ (1,775,124)
Net change in unrealized appreciation (depreciation) offutures contracts (4,715,814) — — — — — (4,715,814)
Net change in unrealized appreciation (depreciation) ofwritten options contracts 599,185 — — — — — 599,185
Net change in unrealized appreciation (depreciation) ofswap contracts 315,491 — (1,863,172) — — — (1,547,681)
Net change in unrealized appreciation (depreciation) offoreign currency contracts — 2,254,601 — — — — 2,254,601
Total $ (5,576,262) $ 2,254,601 $ (1,863,172) $ — $ — $ — $ (5,184,833)
For the period ended June 30, 2021, the average monthly amount or number per contract outstanding for each derivative type wasas follows:
Derivative Description
Average NotionalPar, Contracts
or Face Amount
Purchased Options Contracts at Number of Contracts 107,788,500Futures Contracts Long at Number of Contracts 1,262Futures Contracts Short at Number of Contracts (3,236)Written Options Contracts at Number of Contracts (343,411,000)Swap Contracts at Notional Amount $ 2,487,195,173Foreign Currency Contracts Purchased at Contract Amount $ 3,078,999Foreign Currency Contracts Sold at Contract Amount $ 84,202,418
f) Balance Sheet Offsetting Information – Set forth below are tables which disclose both gross information and net information aboutinstruments and transactions eligible for offset in the financial statements, and instruments and transactions that are subject to a masternetting arrangement, as well as amounts related to margin, reflected as financial collateral (including cash collateral), held at clearingbrokers, counterparties and a Fund’s custodian. The master netting arrangements allow the clearing brokers to net any collateral held in oron behalf of a Fund, or liabilities or payment obligations of the clearing brokers to a Fund, against any liabilities or payment obligations of aFund to the clearing brokers. A Fund is required to deposit financial collateral (including cash collateral) at the Fund’s custodian on behalf ofclearing brokers and counterparties to continually meet the original and maintenance requirements established by the clearing brokers andcounterparties. Such requirements are specific to the respective clearing broker or counterparty. Certain master netting arrangements maynot be enforceable in a bankruptcy.
The following tables present a Fund’s derivative assets and liabilities, presented on a gross basis as no amounts are netted within theStatements of Assets and Liabilities, by counterparty net of amounts available for offset under a master netting agreement or similaragreement (“MNA”) and net of the related collateral received/pledged by a Fund as of June 30, 2021:
Balanced HLS Fund
Derivative Financial Instruments: Assets Liabilities
Futures contracts $ — $ (40,240)
Total gross amount of derivative assets and liabilities in the Statement of Assets and Liabilities — (40,240)
Derivatives not subject to a MNA — 40,240
Total gross amount of assets and liabilities subject to MNA or similar agreements $ — $ —
112

123106 TX 113STATE STREET GLOBAL HLS SEMI-ANNUAL REPO
27-Jul-2021 20:50 ESTCLN PSLNF
Donnelley Financial LSWpf_rendNone
2*PMT 1C
LSWP64RS3021.6.2.0
Hartford HLS FundsNotes to Financial Statements – (continued)June 30, 2021 (Unaudited)
Capital Appreciation HLS Fund
Derivative Financial Instruments: Assets Liabilities
Futures contracts $ 3,194,106 $ —
Total gross amount of derivative assets and liabilities in the Statement of Assets and Liabilities 3,194,106 —
Derivatives not subject to a MNA (3,194,106) —
Total gross amount of assets and liabilities subject to MNA or similar agreements $ — $ —
Total Return Bond HLS Fund
Derivative Financial Instruments: Assets Liabilities
Foreign currency contracts $ 1,898,330 $ (85,154)Futures contracts 2,355,245 (6,216,987)Purchased options 866,055 —Swap contracts 660,375 (3,906,447)Written options — (869,905)
Total gross amount of derivative assets and liabilities in the Statement of Assets and Liabilities 5,780,005 (11,078,493)
Derivatives not subject to a MNA (3,015,620) 6,326,883
Total gross amount of assets and liabilities subject to MNA or similar agreements $ 2,764,385 $ (4,751,610)
Total Return Bond HLS Fund
CounterpartyGross Amount
of Assets
FinancialInstruments
and DerivativesAvailablefor Offset
Non-cashCollateralReceived*
CashCollateralReceived*
Net Amountof Assets
Bank of America Securities LLC $ 470,112 $ (443,513) $ — $ — $ 26,599Barclays 85,303 (85,303) — — —BNP Paribas Securities Services 39,290 — — — 39,290Citibank NA 1,966,857 (511,546) — — 1,455,311Goldman Sachs & Co. 10,422 (10,422) — — —JP Morgan Chase & Co. 46,245 (4,969) — — 41,276Morgan Stanley 146,156 (146,156) — — —
Total $ 2,764,385 $ (1,201,909) $ — $ — $ 1,562,476
CounterpartyGross Amountof Liabilities
FinancialInstruments
and DerivativesAvailablefor Offset
Non-cashCollateralPledged*
CashCollateralPledged*
Net Amountof Liabilities
Bank of America Securities LLC $ (443,513) $ 443,513 $ — $ — $ —Barclays (111,380) 85,303 — — (26,077)Citibank NA (511,546) 511,546 — — —Credit Suisse First Boston Corp. (901,359) — 901,359 — —Deutsche Bank Securities, Inc. (246,800) — 246,800 — —Goldman Sachs & Co. (1,169,426) 10,422 1,159,004 — —JP Morgan Chase & Co. (4,969) 4,969 — — —Morgan Stanley (1,362,617) 146,156 1,216,461 — —
Total $ (4,751,610) $ 1,201,909 $ 3,523,624 $ — $ (26,077)
* In some instances, the actual collateral received and/or pledged may be more than the amount shown.
5. Principal Risks:
A Fund’s investments expose it to various types of risks associated with financial instruments and the markets. A Fund may be exposed to therisks described below. Each Fund’s prospectus provides details of its principal risks.
The market values of equity securities, such as common stocks and preferred stocks, or equity related derivative investments, such as futuresand options, may decline due to general market conditions which are not specifically related to a particular company, such as real or perceivedadverse economic conditions, changes in the general outlook for corporate earnings, changes in interest or currency rates or adverse investorsentiment generally. The market value of equity securities may also decline due to factors which affect a particular industry or industries, such aslabor shortages or increased production costs and competitive conditions within an industry. Equity securities and equity related investmentsgenerally have greater market price volatility than fixed income securities. The extent of each Fund’s exposure to market risk is the market valueof the investments held as shown in the Fund’s Schedule of Investments.
113

p
123106 TX 114STATE STREET GLOBAL HLS SEMI-ANNUAL REPO
27-Jul-2021 20:50 ESTCLN PSLNF
Donnelley Financial LSWpf_rendNone
2*PMT 1C
LSWP64RS3021.6.2.0
Hartford HLS FundsNotes to Financial Statements – (continued)June 30, 2021 (Unaudited)
A widespread health crisis, such as a global pandemic, could cause substantial market volatility, exchange trading suspensions or restrictions andclosures of securities exchanges and businesses, impact the ability to complete redemptions, and adversely impact Fund performance. Thecurrent ongoing outbreak of COVID-19, a respiratory disease caused by a novel coronavirus, has negatively affected the worldwide economy, thefinancial health of individual companies and the market in significant and unforeseen ways. The future impact of the ongoing COVID-19 pandemicremains unclear. The effects to public health, business and market conditions resulting from COVID-19 pandemic may have a significant negativeimpact on the performance of a Fund’s investments, including exacerbating other pre-existing political, social and economic risks.
Certain investments held by a Fund expose the Fund to various risks which may include, but are not limited to, interest rate, prepayment, andextension risks. Interest rate risk is the risk that fixed income securities will decline in value because of changes in interest rates. As nominalinterest rates rise, the values of certain fixed income securities held by a Fund are likely to decrease. A nominal interest rate can be described asthe sum of a real interest rate and an expected inflation rate. Fixed income securities with longer durations tend to be more sensitive to changesin interest rates, usually making them more volatile than securities with shorter durations. Duration is useful primarily as a measure of thesensitivity of a fixed income security’s market price to interest rate (i.e., yield) movements. Senior floating rate interests and securities subject toprepayment and extension risk generally offer less potential for gains when interest rates decline. Rising interest rates may cause prepayments tooccur at a slower than expected rate, thereby effectively lengthening the maturity of the security and making the security more sensitive to interestrate changes. Prepayment and extension risk are major risks of mortgage-backed securities, senior floating rate interests and certain assetbacked securities. For certain asset-backed securities, the actual maturity may be less than the stated maturity shown in the Schedule ofInvestments, if applicable. As a result, the timing of income recognition relating to these securities may vary based upon the actual maturity.
Investing in the securities of non-U.S. issuers, whether directly or indirectly, involves certain considerations and risks not typically associated withsecurities of U.S. issuers. Such risks include, but are not limited to: generally less liquid and less efficient securities markets; generally greaterprice volatility; exchange rate fluctuations; imposition of restrictions on the expatriation of funds or other protectionist measures; less publiclyavailable information about issuers; the imposition of withholding or other taxes; higher transaction and custody costs; settlement delays and riskof loss attendant in settlement procedures; difficulties in enforcing contractual obligations; less regulation of securities markets; differentaccounting, disclosure and reporting requirements; more substantial governmental involvement in the economy; higher inflation rates; and greatersocial, economic and political uncertainties. Non-U.S. issuers may also be affected by political, social, economic or diplomatic developments in aforeign country or region or the U.S. (including the imposition of sanctions, tariffs, or other governmental restrictions). These risks are heightenedfor investments in issuers from countries with less developed markets.
Securities lending involves the risk that a Fund may lose money because the borrower of the loaned securities fails to return the securities in atimely manner or at all. A Fund could also lose money in the event of a decline in the value of the collateral provided for the loaned securities or adecline in the value of any investments made with cash collateral. These events could also trigger adverse tax consequences for a Fund thatlends its holdings.
Credit risk depends largely on the perceived financial health of bond issuers. In general, the credit rating is inversely related to the credit risk ofthe issuer. Higher rated bonds generally are deemed to have less credit risk, while lower or unrated bonds are deemed to have higher risk ofdefault. The share price, yield and total return of a fund that holds securities with higher credit risk may be more volatile than those of a fund thatholds bonds with lower credit risk. A Fund may be exposed to counterparty risk, or the risk that an institution or other entity with which a Fund hasunsettled or open transactions will default.
A Fund may invest in certain debt securities, derivatives or other financial instruments that utilize one or more London Interbank Offered Rates(collectively, “LIBOR”), as a “benchmark” or “reference rate” for various interest rate calculations. The use of certain LIBORs is expected to bephased out by the end of 2021. However, it is possible that certain LIBORs may continue beyond 2021 and the most widely used LIBORs maycontinue until mid-2023. There remains uncertainty regarding the future use of LIBOR and the nature of any replacement rate. As such, thepotential effect of a transition away from LIBOR on a Fund or the LIBOR-based instruments in which the Fund invests cannot yet be determined.The transition process away from LIBOR may involve, among other things, increased volatility or illiquidity in markets for instruments that currentlyrely on LIBOR. The transition process may also result in a reduction in the value of certain instruments held by a Fund or reduce the effectivenessof related Fund transactions, such as hedges. Volatility, the potential reduction in value, and/or the hedge effectiveness of financial instrumentsmay be heightened for financial instruments that do not include fallback provisions that address the cessation of LIBOR. Any potential effects ofthe transition away from LIBOR on the Fund or on financial instruments in which a Fund invests, as well as other unforeseen effects, could resultin losses to the Fund. Since the usefulness of LIBOR as a benchmark or reference rate could deteriorate during the transition period, theseeffects could occur prior to and/or subsequent to the end of 2021 with respect to certain LIBORs or mid-2023 for the remaining LIBORs.
6. Federal Income Taxes:
a) Each Fund intends to continue to qualify as a Regulated Investment Company (“RIC”) under Subchapter M of the Internal Revenue Code(“IRC”) by distributing substantially all of its taxable net investment income and net realized capital gains to its shareholders each year. EachFund has distributed substantially all of its income and capital gains in prior years, if applicable, and intends to distribute substantially all of itsincome and capital gains during the calendar year ending December 31, 2021. Accordingly, no provision for federal income or excise taxeshas been made in the accompanying financial statements. Distributions from short-term capital gains are treated as ordinary incomedistributions for federal income tax purposes.
114

q
123106 TX 115STATE STREET GLOBAL HLS SEMI-ANNUAL REPO
27-Jul-2021 20:50 ESTCLN PSLNF
Donnelley Financial LSWpf_rendNone
2*PMT 1C
LSWP64RS3021.6.2.0
Hartford HLS FundsNotes to Financial Statements – (continued)June 30, 2021 (Unaudited)
b) Tax Basis of Investments – The aggregate cost of investments for federal income tax purposes at June 30, 2021 was substantially the samefor book purposes. The net unrealized appreciation/(depreciation) on investments, which consists of gross unrealized appreciation anddepreciation, is disclosed below:
Fund Tax CostGross Unrealized
AppreciationGross Unrealized
(Depreciation)
Net UnrealizedAppreciation/
(Depreciation)
Balanced HLS Fund $ 1,580,751,011 $ 640,793,022 $ (6,258,638) $ 634,534,384Capital Appreciation HLS Fund 3,412,338,913 1,259,277,020 (45,403,480) 1,213,873,540Disciplined Equity HLS Fund 2,218,267,820 1,139,716,650 (9,837,787) 1,129,878,863Dividend and Growth HLS Fund 2,318,046,290 1,620,988,849 (14,717,148) 1,606,271,701Healthcare HLS Fund 154,566,814 73,355,609 (4,885,122) 68,470,487International Opportunities HLS Fund 971,842,700 275,649,421 (13,809,117) 261,840,304MidCap HLS Fund 1,526,664,052 855,039,663 (27,690,150) 827,349,513Small Cap Growth HLS Fund 993,947,243 516,904,239 (39,116,121) 477,788,118Small Company HLS Fund 486,336,720 141,345,921 (20,979,976) 120,365,945Stock HLS Fund 878,536,309 685,792,215 — 685,792,215Total Return Bond HLS Fund 2,993,491,448 85,636,796 (60,897,357) 24,739,439Ultrashort Bond HLS Fund 759,716,852 1,329,749 (186,441) 1,143,308
c) Capital Loss Carryforward – Under the Regulated Investment Company Modernization Act of 2010, funds are permitted to carry forwardcapital losses for an unlimited period.
At December 31, 2020 (tax year end), each Fund’s capital loss carryforwards for U.S. federal income tax purposes were as follows:
Fund
Short-TermCapital Loss
Carryforward withNo Expiration
Long-TermCapital Loss
Carryforward withNo Expiration
International Opportunities HLS Fund $ 30,718,898 $ —Ultrashort Bond HLS Fund 51,233 11,089,905
Balanced HLS Fund, Capital Appreciation HLS Fund, Disciplined Equity HLS Fund, Dividend and Growth HLS Fund, Healthcare HLS Fund,MidCap HLS Fund, Small Cap Growth HLS Fund, Small Company HLS Fund and Stock HLS Fund had no capital loss carryforwards for U.S.federal income tax purposes as of December 31, 2020.
During the year ended December 31, 2020, the Total Return Bond HLS Fund and Ultrashort HLS Fund utilized $17,169,893 and $248,103 ofprior year capital loss carryforwards, respectively.
7. Expenses:
a) Investment Management Agreement – Hartford Funds Management Company, LLC (“HFMC”) serves as each Fund’s investment manager.Each Company, on behalf of its respective Funds has entered into an Investment Management Agreement with HFMC. HFMC is an indirectsubsidiary of The Hartford Financial Services Group, Inc. (“The Hartford”). HFMC has overall investment supervisory responsibility for eachFund. In addition, HFMC provides administrative personnel, services, equipment, facilities and office space for proper operation of eachFund. HFMC has contracted with Wellington Management Company LLP (“Wellington Management”) under a sub-advisory agreement andWellington Management performs the daily investment of the assets of each Fund, in accordance with the Fund’s investment objective andpolicies. HFMC pays a sub-advisory fee to Wellington Management out of its management fee.
The schedule below reflects the rates of compensation paid to HFMC for investment management services rendered as of June 30, 2021;the rates are accrued daily and paid monthly based on each Fund’s average daily net assets, at the following annual rates:
Fund Management Fee Rates
Balanced HLS Fund(1) 0.6800% on first $250 million and;0.6550% on next $250 million and;0.6450% on next $500 million and;0.5950% on next $4 billion and;0.5925% on next $5 billion and;0.5900% over $10 billion
Capital Appreciation HLS Fund 0.7750% on first $250 million and;0.7250% on next $250 million and;0.6750% on next $500 million and;0.6250% on next $1.5 billion and;0.6200% on next $2.5 billion and;0.6150% on next $5 billion and;0.6100% over $10 billion
115
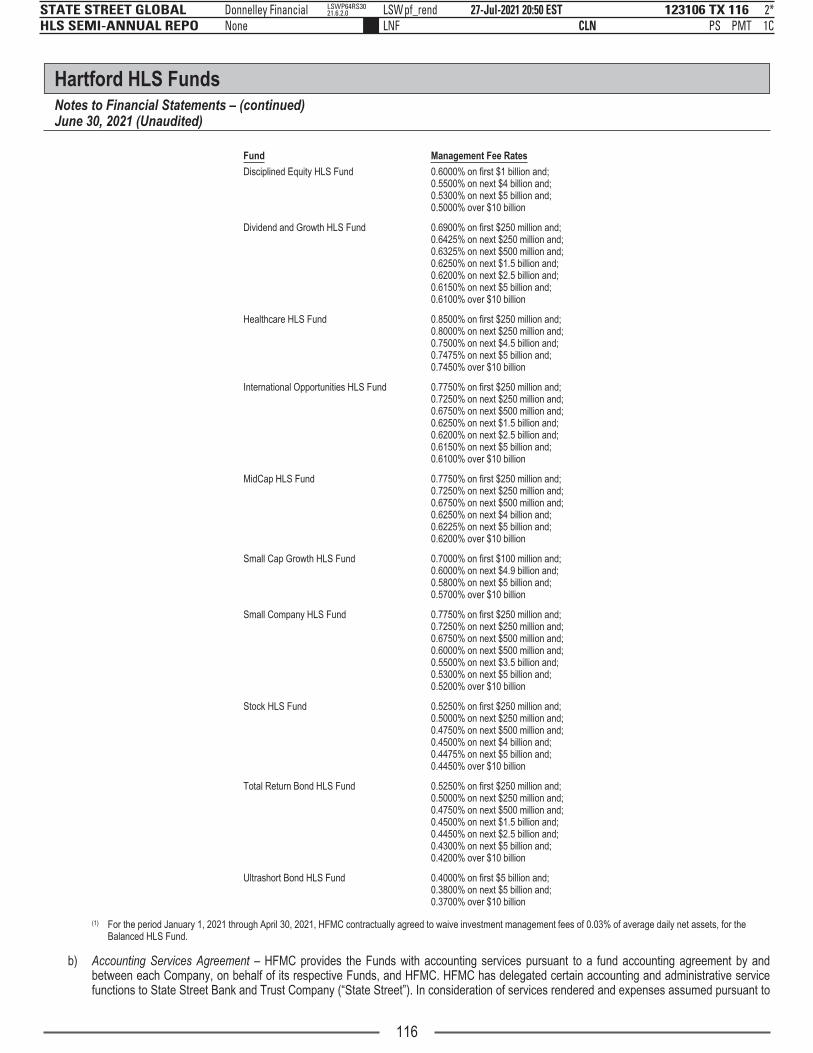
123106 TX 116STATE STREET GLOBAL HLS SEMI-ANNUAL REPO
27-Jul-2021 20:50 ESTCLN PSLNF
Donnelley Financial LSWpf_rendNone
2*PMT 1C
LSWP64RS3021.6.2.0
Hartford HLS FundsNotes to Financial Statements – (continued)June 30, 2021 (Unaudited)
Fund Management Fee Rates
Disciplined Equity HLS Fund 0.6000% on first $1 billion and;0.5500% on next $4 billion and;0.5300% on next $5 billion and;0.5000% over $10 billion
Dividend and Growth HLS Fund 0.6900% on first $250 million and;0.6425% on next $250 million and;0.6325% on next $500 million and;0.6250% on next $1.5 billion and;0.6200% on next $2.5 billion and;0.6150% on next $5 billion and;0.6100% over $10 billion
Healthcare HLS Fund 0.8500% on first $250 million and;0.8000% on next $250 million and;0.7500% on next $4.5 billion and;0.7475% on next $5 billion and;0.7450% over $10 billion
International Opportunities HLS Fund 0.7750% on first $250 million and;0.7250% on next $250 million and;0.6750% on next $500 million and;0.6250% on next $1.5 billion and;0.6200% on next $2.5 billion and;0.6150% on next $5 billion and;0.6100% over $10 billion
MidCap HLS Fund 0.7750% on first $250 million and;0.7250% on next $250 million and;0.6750% on next $500 million and;0.6250% on next $4 billion and;0.6225% on next $5 billion and;0.6200% over $10 billion
Small Cap Growth HLS Fund 0.7000% on first $100 million and;0.6000% on next $4.9 billion and;0.5800% on next $5 billion and;0.5700% over $10 billion
Small Company HLS Fund 0.7750% on first $250 million and;0.7250% on next $250 million and;0.6750% on next $500 million and;0.6000% on next $500 million and;0.5500% on next $3.5 billion and;0.5300% on next $5 billion and;0.5200% over $10 billion
Stock HLS Fund 0.5250% on first $250 million and;0.5000% on next $250 million and;0.4750% on next $500 million and;0.4500% on next $4 billion and;0.4475% on next $5 billion and;0.4450% over $10 billion
Total Return Bond HLS Fund 0.5250% on first $250 million and;0.5000% on next $250 million and;0.4750% on next $500 million and;0.4500% on next $1.5 billion and;0.4450% on next $2.5 billion and;0.4300% on next $5 billion and;0.4200% over $10 billion
Ultrashort Bond HLS Fund 0.4000% on first $5 billion and;0.3800% on next $5 billion and;0.3700% over $10 billion
(1) For the period January 1, 2021 through April 30, 2021, HFMC contractually agreed to waive investment management fees of 0.03% of average daily net assets, for theBalanced HLS Fund.
b) Accounting Services Agreement – HFMC provides the Funds with accounting services pursuant to a fund accounting agreement by andbetween each Company, on behalf of its respective Funds, and HFMC. HFMC has delegated certain accounting and administrative servicefunctions to State Street Bank and Trust Company (“State Street”). In consideration of services rendered and expenses assumed pursuant to
116
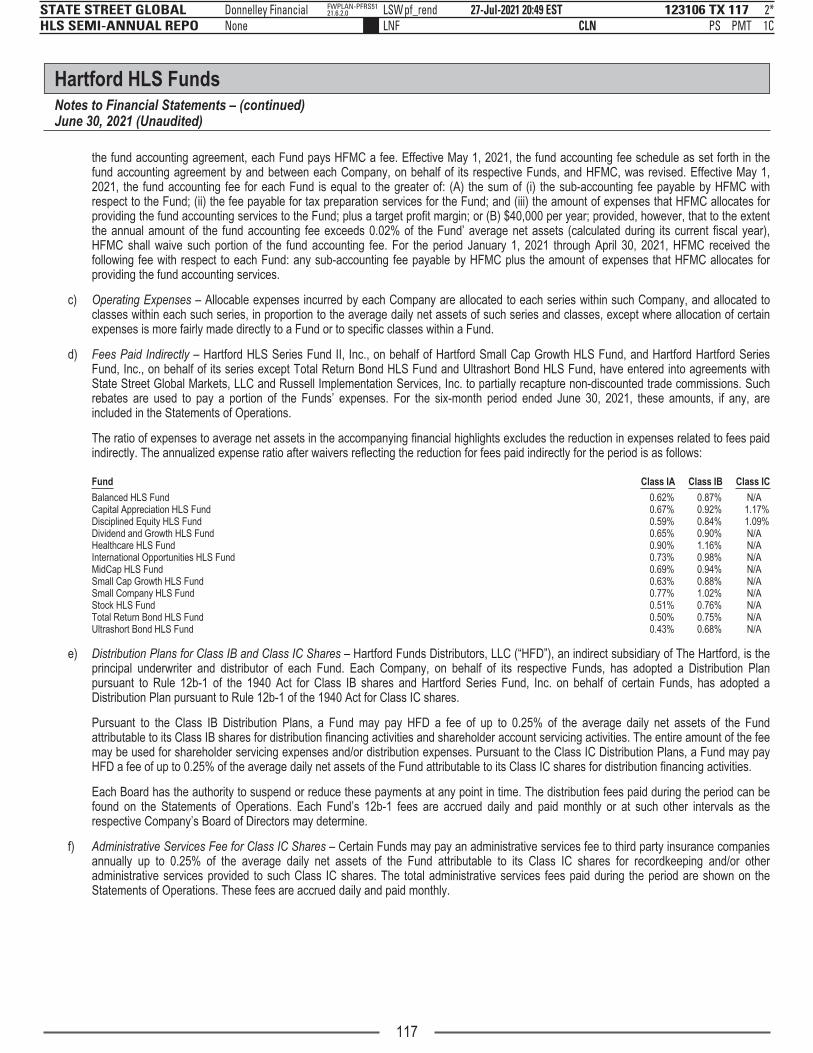
p p
123106 TX 117STATE STREET GLOBAL HLS SEMI-ANNUAL REPO
27-Jul-2021 20:49 ESTCLN PSLNF
Donnelley Financial LSWpf_rendNone
2*PMT 1C
FWPLAN-PFRS5121.6.2.0
Hartford HLS FundsNotes to Financial Statements – (continued)June 30, 2021 (Unaudited)
the fund accounting agreement, each Fund pays HFMC a fee. Effective May 1, 2021, the fund accounting fee schedule as set forth in thefund accounting agreement by and between each Company, on behalf of its respective Funds, and HFMC, was revised. Effective May 1,2021, the fund accounting fee for each Fund is equal to the greater of: (A) the sum of (i) the sub-accounting fee payable by HFMC withrespect to the Fund; (ii) the fee payable for tax preparation services for the Fund; and (iii) the amount of expenses that HFMC allocates forproviding the fund accounting services to the Fund; plus a target profit margin; or (B) $40,000 per year; provided, however, that to the extentthe annual amount of the fund accounting fee exceeds 0.02% of the Fund’ average net assets (calculated during its current fiscal year),HFMC shall waive such portion of the fund accounting fee. For the period January 1, 2021 through April 30, 2021, HFMC received thefollowing fee with respect to each Fund: any sub-accounting fee payable by HFMC plus the amount of expenses that HFMC allocates forproviding the fund accounting services.
c) Operating Expenses – Allocable expenses incurred by each Company are allocated to each series within such Company, and allocated toclasses within each such series, in proportion to the average daily net assets of such series and classes, except where allocation of certainexpenses is more fairly made directly to a Fund or to specific classes within a Fund.
d) Fees Paid Indirectly – Hartford HLS Series Fund II, Inc., on behalf of Hartford Small Cap Growth HLS Fund, and Hartford Hartford SeriesFund, Inc., on behalf of its series except Total Return Bond HLS Fund and Ultrashort Bond HLS Fund, have entered into agreements withState Street Global Markets, LLC and Russell Implementation Services, Inc. to partially recapture non-discounted trade commissions. Suchrebates are used to pay a portion of the Funds’ expenses. For the six-month period ended June 30, 2021, these amounts, if any, areincluded in the Statements of Operations.
The ratio of expenses to average net assets in the accompanying financial highlights excludes the reduction in expenses related to fees paidindirectly. The annualized expense ratio after waivers reflecting the reduction for fees paid indirectly for the period is as follows:
Fund Class IA Class IB Class IC
Balanced HLS Fund 0.62% 0.87% N/ACapital Appreciation HLS Fund 0.67% 0.92% 1.17%Disciplined Equity HLS Fund 0.59% 0.84% 1.09%Dividend and Growth HLS Fund 0.65% 0.90% N/AHealthcare HLS Fund 0.90% 1.16% N/AInternational Opportunities HLS Fund 0.73% 0.98% N/AMidCap HLS Fund 0.69% 0.94% N/ASmall Cap Growth HLS Fund 0.63% 0.88% N/ASmall Company HLS Fund 0.77% 1.02% N/AStock HLS Fund 0.51% 0.76% N/ATotal Return Bond HLS Fund 0.50% 0.75% N/AUltrashort Bond HLS Fund 0.43% 0.68% N/A
e) Distribution Plans for Class IB and Class IC Shares – Hartford Funds Distributors, LLC (“HFD”), an indirect subsidiary of The Hartford, is theprincipal underwriter and distributor of each Fund. Each Company, on behalf of its respective Funds, has adopted a Distribution Planpursuant to Rule 12b-1 of the 1940 Act for Class IB shares and Hartford Series Fund, Inc. on behalf of certain Funds, has adopted aDistribution Plan pursuant to Rule 12b-1 of the 1940 Act for Class IC shares.
Pursuant to the Class IB Distribution Plans, a Fund may pay HFD a fee of up to 0.25% of the average daily net assets of the Fundattributable to its Class IB shares for distribution financing activities and shareholder account servicing activities. The entire amount of the feemay be used for shareholder servicing expenses and/or distribution expenses. Pursuant to the Class IC Distribution Plans, a Fund may payHFD a fee of up to 0.25% of the average daily net assets of the Fund attributable to its Class IC shares for distribution financing activities.
Each Board has the authority to suspend or reduce these payments at any point in time. The distribution fees paid during the period can befound on the Statements of Operations. Each Fund’s 12b-1 fees are accrued daily and paid monthly or at such other intervals as therespective Company’s Board of Directors may determine.
f) Administrative Services Fee for Class IC Shares – Certain Funds may pay an administrative services fee to third party insurance companiesannually up to 0.25% of the average daily net assets of the Fund attributable to its Class IC shares for recordkeeping and/or otheradministrative services provided to such Class IC shares. The total administrative services fees paid during the period are shown on theStatements of Operations. These fees are accrued daily and paid monthly.
117
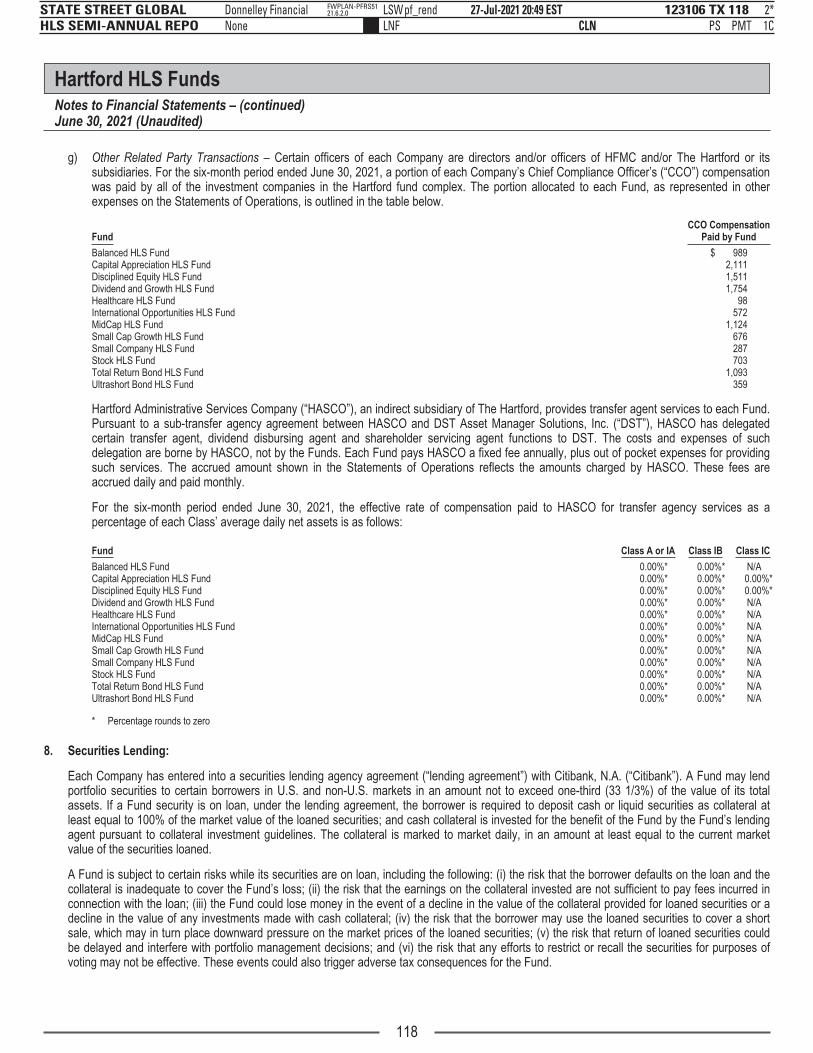
gp
123106 TX 118STATE STREET GLOBAL HLS SEMI-ANNUAL REPO
27-Jul-2021 20:49 ESTCLN PSLNF
Donnelley Financial LSWpf_rendNone
2*PMT 1C
FWPLAN-PFRS5121.6.2.0
Hartford HLS FundsNotes to Financial Statements – (continued)June 30, 2021 (Unaudited)
g) Other Related Party Transactions – Certain officers of each Company are directors and/or officers of HFMC and/or The Hartford or itssubsidiaries. For the six-month period ended June 30, 2021, a portion of each Company’s Chief Compliance Officer’s (“CCO”) compensationwas paid by all of the investment companies in the Hartford fund complex. The portion allocated to each Fund, as represented in otherexpenses on the Statements of Operations, is outlined in the table below.
FundCCO Compensation
Paid by Fund
Balanced HLS Fund $ 989Capital Appreciation HLS Fund 2,111Disciplined Equity HLS Fund 1,511Dividend and Growth HLS Fund 1,754Healthcare HLS Fund 98International Opportunities HLS Fund 572MidCap HLS Fund 1,124Small Cap Growth HLS Fund 676Small Company HLS Fund 287Stock HLS Fund 703Total Return Bond HLS Fund 1,093Ultrashort Bond HLS Fund 359
Hartford Administrative Services Company (“HASCO”), an indirect subsidiary of The Hartford, provides transfer agent services to each Fund.Pursuant to a sub-transfer agency agreement between HASCO and DST Asset Manager Solutions, Inc. (“DST”), HASCO has delegatedcertain transfer agent, dividend disbursing agent and shareholder servicing agent functions to DST. The costs and expenses of suchdelegation are borne by HASCO, not by the Funds. Each Fund pays HASCO a fixed fee annually, plus out of pocket expenses for providingsuch services. The accrued amount shown in the Statements of Operations reflects the amounts charged by HASCO. These fees areaccrued daily and paid monthly.
For the six-month period ended June 30, 2021, the effective rate of compensation paid to HASCO for transfer agency services as apercentage of each Class’ average daily net assets is as follows:
Fund Class A or IA Class IB Class IC
Balanced HLS Fund 0.00%* 0.00%* N/ACapital Appreciation HLS Fund 0.00%* 0.00%* 0.00%*Disciplined Equity HLS Fund 0.00%* 0.00%* 0.00%*Dividend and Growth HLS Fund 0.00%* 0.00%* N/AHealthcare HLS Fund 0.00%* 0.00%* N/AInternational Opportunities HLS Fund 0.00%* 0.00%* N/AMidCap HLS Fund 0.00%* 0.00%* N/ASmall Cap Growth HLS Fund 0.00%* 0.00%* N/ASmall Company HLS Fund 0.00%* 0.00%* N/AStock HLS Fund 0.00%* 0.00%* N/ATotal Return Bond HLS Fund 0.00%* 0.00%* N/AUltrashort Bond HLS Fund 0.00%* 0.00%* N/A
* Percentage rounds to zero
8. Securities Lending:
Each Company has entered into a securities lending agency agreement (“lending agreement”) with Citibank, N.A. (“Citibank”). A Fund may lendportfolio securities to certain borrowers in U.S. and non-U.S. markets in an amount not to exceed one-third (33 1/3%) of the value of its totalassets. If a Fund security is on loan, under the lending agreement, the borrower is required to deposit cash or liquid securities as collateral atleast equal to 100% of the market value of the loaned securities; and cash collateral is invested for the benefit of the Fund by the Fund’s lendingagent pursuant to collateral investment guidelines. The collateral is marked to market daily, in an amount at least equal to the current marketvalue of the securities loaned.
A Fund is subject to certain risks while its securities are on loan, including the following: (i) the risk that the borrower defaults on the loan and thecollateral is inadequate to cover the Fund’s loss; (ii) the risk that the earnings on the collateral invested are not sufficient to pay fees incurred inconnection with the loan; (iii) the Fund could lose money in the event of a decline in the value of the collateral provided for loaned securities or adecline in the value of any investments made with cash collateral; (iv) the risk that the borrower may use the loaned securities to cover a shortsale, which may in turn place downward pressure on the market prices of the loaned securities; (v) the risk that return of loaned securities couldbe delayed and interfere with portfolio management decisions; and (vi) the risk that any efforts to restrict or recall the securities for purposes ofvoting may not be effective. These events could also trigger adverse tax consequences for the Fund.
118
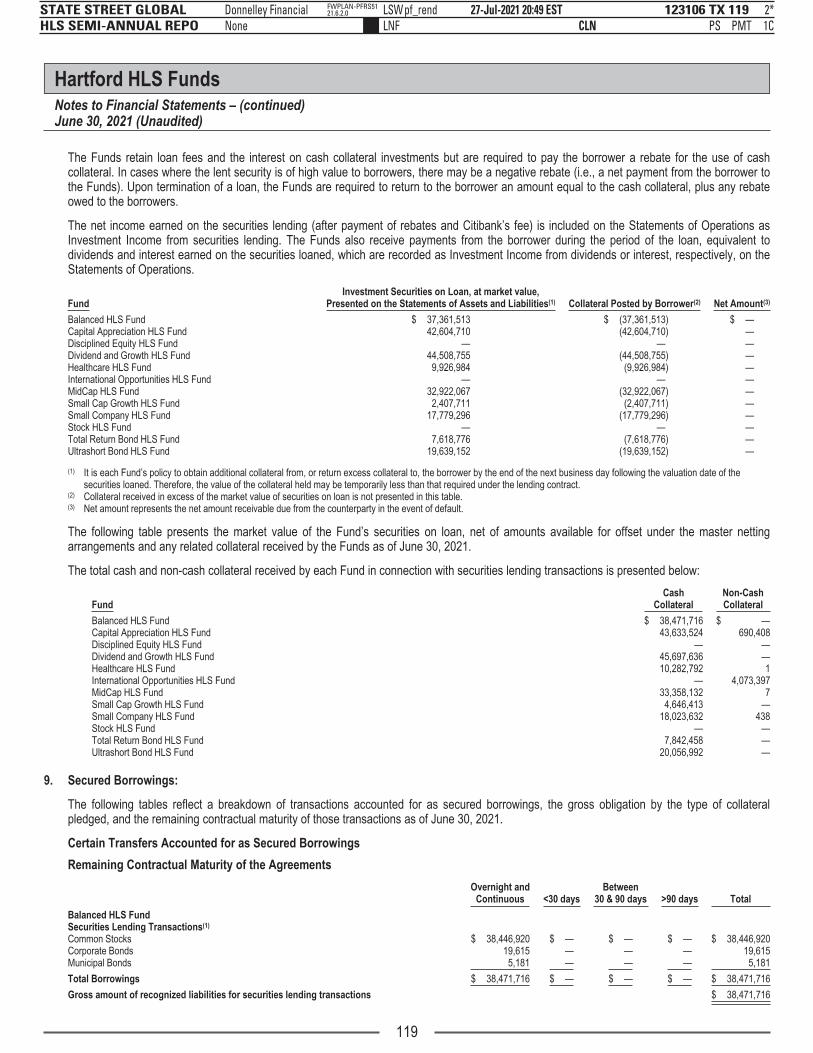
y p
123106 TX 119STATE STREET GLOBAL HLS SEMI-ANNUAL REPO
27-Jul-2021 20:49 ESTCLN PSLNF
Donnelley Financial LSWpf_rendNone
2*PMT 1C
FWPLAN-PFRS5121.6.2.0
Hartford HLS FundsNotes to Financial Statements – (continued)June 30, 2021 (Unaudited)
The Funds retain loan fees and the interest on cash collateral investments but are required to pay the borrower a rebate for the use of cashcollateral. In cases where the lent security is of high value to borrowers, there may be a negative rebate (i.e., a net payment from the borrower tothe Funds). Upon termination of a loan, the Funds are required to return to the borrower an amount equal to the cash collateral, plus any rebateowed to the borrowers.
The net income earned on the securities lending (after payment of rebates and Citibank’s fee) is included on the Statements of Operations asInvestment Income from securities lending. The Funds also receive payments from the borrower during the period of the loan, equivalent todividends and interest earned on the securities loaned, which are recorded as Investment Income from dividends or interest, respectively, on theStatements of Operations.
FundInvestment Securities on Loan, at market value,
Presented on the Statements of Assets and Liabilities(1) Collateral Posted by Borrower(2) Net Amount(3)
Balanced HLS Fund $ 37,361,513 $ (37,361,513) $ —Capital Appreciation HLS Fund 42,604,710 (42,604,710) —Disciplined Equity HLS Fund — — —Dividend and Growth HLS Fund 44,508,755 (44,508,755) —Healthcare HLS Fund 9,926,984 (9,926,984) —International Opportunities HLS Fund — — —MidCap HLS Fund 32,922,067 (32,922,067) —Small Cap Growth HLS Fund 2,407,711 (2,407,711) —Small Company HLS Fund 17,779,296 (17,779,296) —Stock HLS Fund — — —Total Return Bond HLS Fund 7,618,776 (7,618,776) —Ultrashort Bond HLS Fund 19,639,152 (19,639,152) —
(1) It is each Fund’s policy to obtain additional collateral from, or return excess collateral to, the borrower by the end of the next business day following the valuation date of thesecurities loaned. Therefore, the value of the collateral held may be temporarily less than that required under the lending contract.
(2) Collateral received in excess of the market value of securities on loan is not presented in this table.(3) Net amount represents the net amount receivable due from the counterparty in the event of default.
The following table presents the market value of the Fund’s securities on loan, net of amounts available for offset under the master nettingarrangements and any related collateral received by the Funds as of June 30, 2021.
The total cash and non-cash collateral received by each Fund in connection with securities lending transactions is presented below:
FundCash
CollateralNon-CashCollateral
Balanced HLS Fund $ 38,471,716 $ —Capital Appreciation HLS Fund 43,633,524 690,408Disciplined Equity HLS Fund — —Dividend and Growth HLS Fund 45,697,636 —Healthcare HLS Fund 10,282,792 1International Opportunities HLS Fund — 4,073,397MidCap HLS Fund 33,358,132 7Small Cap Growth HLS Fund 4,646,413 —Small Company HLS Fund 18,023,632 438Stock HLS Fund — —Total Return Bond HLS Fund 7,842,458 —Ultrashort Bond HLS Fund 20,056,992 —
9. Secured Borrowings:
The following tables reflect a breakdown of transactions accounted for as secured borrowings, the gross obligation by the type of collateralpledged, and the remaining contractual maturity of those transactions as of June 30, 2021.
Certain Transfers Accounted for as Secured Borrowings
Remaining Contractual Maturity of the Agreements
Overnight andContinuous <30 days
Between30 & 90 days >90 days Total
Balanced HLS FundSecurities Lending Transactions(1)
Common Stocks $ 38,446,920 $ — $ — $ — $ 38,446,920Corporate Bonds 19,615 — — — 19,615Municipal Bonds 5,181 — — — 5,181
Total Borrowings $ 38,471,716 $ — $ — $ — $ 38,471,716
Gross amount of recognized liabilities for securities lending transactions $ 38,471,716
119

p
123106 TX 120STATE STREET GLOBAL HLS SEMI-ANNUAL REPO
27-Jul-2021 20:49 ESTCLN PSLNF
Donnelley Financial LSWpf_rendNone
2*PMT 1C
FWPLAN-PFRS5121.6.2.0
Hartford HLS FundsNotes to Financial Statements – (continued)June 30, 2021 (Unaudited)
Overnight andContinuous <30 days
Between30 & 90 days >90 days Total
Capital Appreciation HLS FundSecurities Lending Transactions(1)
Common Stocks $ 43,633,524 $ — $ — $ — $ 43,633,524
Total Borrowings $ 43,633,524 $ — $ — $ — $ 43,633,524
Gross amount of recognized liabilities for securities lending transactions $ 43,633,524
Dividend and Growth HLS FundSecurities Lending Transactions(1)
Common Stocks $ 45,697,636 $ — $ — $ — $ 45,697,636
Total Borrowings $ 45,697,636 $ — $ — $ — $ 45,697,636
Gross amount of recognized liabilities for securities lending transactions $ 45,697,636
Healthcare HLS FundSecurities Lending Transactions(1)
Common Stocks $ 10,282,792 $ — $ — $ — $ 10,282,792
Total Borrowings $ 10,282,792 $ — $ — $ — $ 10,282,792
Gross amount of recognized liabilities for securities lending transactions $ 10,282,792
MidCap HLS FundSecurities Lending Transactions(1)
Common Stocks $ 33,358,132 $ — $ — $ — $ 33,358,132
Total Borrowings $ 33,358,132 $ — $ — $ — $ 33,358,132
Gross amount of recognized liabilities for securities lending transactions $ 33,358,132
Small Cap Growth HLS FundSecurities Lending Transactions(1)
Common Stocks $ 4,646,413 $ — $ — $ — $ 4,646,413
Total Borrowings $ 4,646,413 $ — $ — $ — $ 4,646,413
Gross amount of recognized liabilities for securities lending transactions $ 4,646,413
Small Company HLS FundSecurities Lending Transactions(1)
Common Stocks $ 18,023,632 $ — $ — $ — $ 18,023,632
Total Borrowings $ 18,023,632 $ — $ — $ — $ 18,023,632
Gross amount of recognized liabilities for securities lending transactions $ 18,023,632
Total Return Bond HLS FundSecurities Lending Transactions(1)
Corporate Bonds $ 3,738,572 $ — $ — $ — $ 3,738,572Municipal Bonds 4,103,886 — — — 4,103,886
Total Borrowings $ 7,842,458 $ — $ — $ — $ 7,842,458
Gross amount of recognized liabilities for securities lending transactions $ 7,842,458
Ultrashort Bond HLS FundSecurities Lending Transactions(1)
Corporate Bonds $ 4,756,351 $ — $ — $ — $ 4,756,351Short-Term Investments 15,300,641 — — — 15,300,641
Total Borrowings $ 20,056,992 $ — $ — $ — $ 20,056,992
Gross amount of recognized liabilities for securities lending transactions $ 20,056,992
(1) Amount represents the payable for cash collateral received on securities on loan. This will generally be in the “Overnight and Continuous” column as the securities are typicallycallable on demand.
120

123106 TX 121STATE STREET GLOBAL HLS SEMI-ANNUAL REPO
27-Jul-2021 20:50 ESTCLN PSLNF
Donnelley Financial LSWpf_rendNone
2*PMT 1C
FWPLAN-PFRS5121.6.2.0
Hartford HLS FundsNotes to Financial Statements – (continued)June 30, 2021 (Unaudited)
10. Affiliated Security Transactions:
If a Fund owns 5% or more of the outstanding voting securities, either directly or indirectly, of a particular issuer, the 1940 Act deems such anissuer to be an “affiliate” of the Fund. As of and during the six-month period ended ended June 30, 2021, The Balanced HLS Fund, CapitalAppreciation HLS Fund, Small Company HLS Fund, and Stock HLS Fund owned 5% or more of the outstanding voting securities of the issuersidentified in the table below:
A summary of affiliate fund transactions for the The Balanced HLS Fund, Capital Appreciation HLS Fund for the six-month period ended endedJune 30, 2021 follows:
Affiliated Investment Companies
BeginningValue as of
January 1, 2021Purchases
at CostProceeds
from SalesReturn
of Capital
Change inUnrealized
Appreciation/Depreciation
EndingValue as of
June 30, 2021Shares as ofJune 30, 2021
DividendIncome
Capital GainDistributions
Balanced HLS FundAllstar Co. $ 13,925,618 $ — $ — $ — $ 1,808,515 $ 13,223,486 11,702,200 $ — $ —
Capital Appreciation HLS FundAllstar Co. 10,057,523 — — (1,813,267) 1,306,165 9,550,421 8,451,700 — 256.279
Small Company HLS FundAllstar Co. 5,016,400 — — — 775,258 5,668,532 5,016,400 50,164,000 —
Stock HLS FundAllstar Co. 11,233,719 — — (2,025,320) 1,458,914 10,667,313 9,440,100 — 286,253
11. Investment Transactions:
For the six-month period ended June 30, 2021, the cost of purchases and proceeds from sales of investment securities (excluding short-terminvestments) were as follows:
Fund
Cost of PurchasesExcluding U.S.
GovernmentObligations
Sales ProceedsExcluding U.S.
GovernmentObligations
Cost of PurchasesFor U.S.
GovernmentObligations
Sales ProceedsFor U.S.
GovernmentObligations
Total Cost ofPurchases
Total SalesProceeds
Balanced HLS Fund $ 350,285,720 $ 489,763,466 $ 163,437,000 $ 111,216,837 $ 513,722,720 $ 600,980,303Capital Appreciation HLS Fund 1,304,460,322 1,655,210,595 — — 1,304,460,322 1,655,210,595Disciplined Equity HLS Fund 294,738,123 518,893,898 — — 294,738,123 518,893,898Dividend and Growth HLS Fund 463,873,123 662,472,364 — — 463,873,123 662,472,364Healthcare HLS Fund 45,763,333 82,493,349 — — 45,763,333 82,493,349International Opportunities HLS Fund 680,102,935 753,650,897 — — 680,102,935 753,650,897MidCap HLS Fund 266,819,449 646,022,914 — — 266,819,449 646,022,914Small Cap Growth HLS Fund 373,961,755 417,133,065 — — 373,961,755 417,133,065Small Company HLS Fund 375,915,208 395,991,397 — — 375,915,208 395,991,397Stock HLS Fund 79,206,769 138,779,943 — — 79,206,769 138,779,943Total Return Bond HLS Fund 566,760,807 409,874,402 309,400,506 404,602,733 876,161,313 814,477,135Ultrashort Bond HLS Fund 200,589,451 160,063,767 — 24,580,964 200,589,451 184,644,731
12. Capital Share Transactions:
The following information is for the six-month period ended June 30, 2021, and the year ended December 31, 2020:
For the Six-Month Period EndedJune 30, 2021
For the Year EndedDecember 31, 2020
Shares Amount Shares Amount
Balanced HLS FundClass IAShares Sold 272,850 $ 8,955,532 463,624 $ 13,833,883Shares Issued for Reinvested Dividends — — 3,884,716 117,833,855Shares Redeemed (3,129,843) (104,306,289) (8,115,089) (236,999,427)
Net Increase (Decrease) (2,856,993) (95,350,757) (3,766,749) (105,331,689)
Class IBShares Sold 65,285 $ 2,245,969 182,220 $ 5,357,315Shares Issued for Reinvested Dividends — — 492,030 15,165,622Shares Redeemed (454,154) (15,356,125) (1,160,144) (34,724,037)
Net Increase (Decrease) (388,869) (13,110,156) (485,894) (14,201,100)
Total Net Increase (Decrease) (3,245,862) $ (108,460,913) (4,252,643) $ (119,532,789)
121

123106 TX 122STATE STREET GLOBAL HLS SEMI-ANNUAL REPO
27-Jul-2021 20:50 ESTCLN PSLNF
Donnelley Financial LSWpf_rendNone
2*PMT 1C
FWPLAN-PFRS5121.6.2.0
Hartford HLS FundsNotes to Financial Statements – (continued)June 30, 2021 (Unaudited)
For the Six-Month Period EndedJune 30, 2021
For the Year EndedDecember 31, 2020
Shares Amount Shares Amount
Capital Appreciation HLS FundClass IAShares Sold 91,693 $ 4,958,114 721,760 $ 30,111,727Shares Issued for Reinvested Dividends — — 6,153,343 302,064,553Shares Redeemed (6,430,638) (348,390,137) (12,824,006) (588,774,139)
Net Increase (Decrease) (6,338,945) (343,432,023) (5,948,903) (256,597,859)
Class IBShares Sold 24,980 $ 1,337,052 77,971 $ 3,386,267Shares Issued for Reinvested Dividends — — 763,653 36,702,247Shares Redeemed (726,012) (38,688,585) (1,752,071) (79,080,131)
Net Increase (Decrease) (701,032) (37,351,533) (910,447) (38,991,617)
Class ICShares Sold 36,205 $ 1,921,208 109,094 $ 4,638,398Shares Issued for Reinvested Dividends — — 57,916 2,791,605Shares Redeemed (57,610) (3,116,085) (167,473) (7,317,160)
Net Increase (Decrease) (21,405) (1,194,877) (463) 112,843
Total Net Increase (Decrease) (7,061,382) $ (381,978,433) (6,859,813) $ (295,476,633)
Disciplined Equity HLS FundClass IAShares Sold 662,800 $ 12,702,716 871,713 $ 13,103,167Issued in Merger — — 129,357,267 1,984,198,184Shares Issued for Reinvested Dividends — — 3,082,442 49,655,221Shares Redeemed (10,631,064) (196,819,243) (13,965,491) (222,397,851)
Net Increase (Decrease) (9,968,264) (184,116,527) 119,345,931 1,824,558,721
Class IBShares Sold 203,175 $ 3,683,989 349,171 $ 5,277,671Issued in Merger — — 18,002,182 271,721,336Shares Issued for Reinvested Dividends — — 414,463 6,547,645Shares Redeemed (2,153,705) (39,107,467) (2,529,397) (39,629,490)
Net Increase (Decrease) (1,950,530) (35,423,478) 16,236,419 243,917,162
Class IC(1)
Shares Sold 87,427 $ 1,574,992 117,394 $ 1,880,604Issued in Merger — — 4,834,998 74,163,528Shares Issued for Reinvested Dividends — — 6,875 117,970Shares Redeemed (307,561) (5,686,141) (448,131) (7,235,901)
Net Increase (Decrease) (220,134) (4,111,149) 4,511,136 68,926,201
Total Net Increase (Decrease) (12,138,928) $ (223,651,154) 140,093,486 $ 2,137,402,084
Dividend and Growth HLS FundClass IAShares Sold 1,730,342 $ 42,447,136 4,782,749 $ 93,344,076Issued in Merger — — 13,589,222 269,867,004Shares Issued for Reinvested Dividends — — 9,126,278 188,905,832Shares Redeemed (9,874,723) (239,501,569) (19,396,365) (392,709,464)
Net Increase (Decrease) (8,144,381) (197,054,433) 8,101,884 159,407,448
Class IBShares Sold 161,777 $ 4,003,436 408,486 $ 7,910,412Issued in Merger — — 2,450,597 48,281,905Shares Issued for Reinvested Dividends — — 1,166,860 23,940,435Shares Redeemed (1,469,957) (35,569,614) (3,207,847) (65,102,417)
Net Increase (Decrease) (1,308,180) (31,566,178) 818,096 15,030,335
Total Net Increase (Decrease) (9,452,561) $ (228,620,611) 8,919,980 $ 174,437,783
122

123106 TX 123STATE STREET GLOBAL HLS SEMI-ANNUAL REPO
27-Jul-2021 20:50 ESTCLN PSLNF
Donnelley Financial LSWpf_rendNone
2*PMT 1C
FWPLAN-PFRS5121.6.2.0
Hartford HLS FundsNotes to Financial Statements – (continued)June 30, 2021 (Unaudited)
For the Six-Month Period EndedJune 30, 2021
For the Year EndedDecember 31, 2020
Shares Amount Shares Amount
Healthcare HLS FundClass IAShares Sold 190,928 $ 4,709,430 983,895 $ 22,817,641Shares Issued for Reinvested Dividends — — 1,521,984 32,813,967Shares Redeemed (1,523,281) (37,657,120) (2,612,369) (58,049,269)
Net Increase (Decrease) (1,332,353) (32,947,690) (106,490) (2,417,661)
Class IBShares Sold 29,393 $ 658,095 83,624 $ 1,818,539Shares Issued for Reinvested Dividends — — 402,553 7,990,683Shares Redeemed (200,400) (4,525,545) (396,797) (8,560,073)
Net Increase (Decrease) (171,007) (3,867,450) 89,380 1,249,149
Total Net Increase (Decrease) (1,503,360) $ (36,815,140) (17,110) $ (1,168,512)
International Opportunities HLS FundClass IAShares Sold 2,837,461 $ 57,131,685 3,733,213 $ 58,178,266Shares Issued for Reinvested Dividends — — 1,070,393 18,153,869Shares Redeemed (4,322,730) (87,972,927) (14,857,669) (224,032,772)
Net Increase (Decrease) (1,485,269) (30,841,242) (10,054,063) (147,700,637)
Class IBShares Sold 183,960 $ 3,790,713 622,719 $ 9,711,097Shares Issued for Reinvested Dividends — — 116,682 2,009,265Shares Redeemed (1,883,937) (38,344,784) (1,593,271) (25,857,411)
Net Increase (Decrease) (1,699,977) (34,554,071) (853,870) (14,137,049)
Total Net Increase (Decrease) (3,185,246) $ (65,395,313) (10,907,933) $ (161,837,686)
MidCap HLS FundClass IAShares Sold 1,351,782 $ 62,265,289 7,840,237 $ 280,770,150Issued in Merger — — 7,689,933 268,563,986Shares Issued for Reinvested Dividends — — 4,755,353 177,950,463Shares Redeemed (9,678,863) (442,036,874) (19,145,157) (692,739,283)
Net Increase (Decrease) (8,327,081) (379,771,585) 1,140,366 34,545,316
Class IBShares Sold 54,922 $ 2,428,565 101,031 $ 3,526,835Issued in Merger — — 2,059,953 69,216,484Shares Issued for Reinvested Dividends — — 160,481 5,921,123Shares Redeemed (361,510) (16,048,254) (445,822) (15,478,345)
Net Increase (Decrease) (306,588) (13,619,689) 1,875,643 63,186,097
Total Net Increase (Decrease) (8,633,669) $ (393,391,274) 3,016,009 $ 97,731,413
Small Cap Growth HLS FundClass IAShares Sold 1,888,866 $ 75,392,771 12,905,007 $ 408,467,832Shares Issued for Reinvested Dividends — — 905,166 26,838,172Shares Redeemed (3,067,673) (121,893,498) (13,831,962) (401,010,236)
Net Increase (Decrease) (1,178,807) (46,500,727) (21,789) 34,295,768
Class IBShares Sold 945,939 $ 35,908,590 1,326,101 $ 35,875,838Shares Issued for Reinvested Dividends — — 464,566 13,179,751Shares Redeemed (455,758) (17,150,004) (9,636,215) (309,485,039)
Net Increase (Decrease) 490,181 18,758,586 (7,845,548) (260,429,450)
Total Net Increase (Decrease) (688,626) $ (27,742,141) (7,867,337) $ (226,133,682)
123

y
123106 TX 124STATE STREET GLOBAL HLS SEMI-ANNUAL REPO
27-Jul-2021 20:50 ESTCLN PSLNF
Donnelley Financial LSWpf_rendNone
2*PMT 1C
FWPLAN-PFRS5121.6.2.0
Hartford HLS FundsNotes to Financial Statements – (continued)June 30, 2021 (Unaudited)
For the Six-Month Period EndedJune 30, 2021
For the Year EndedDecember 31, 2020
Shares Amount Shares Amount
Small Company HLS FundClass IAShares Sold 555,097 $ 16,096,686 1,913,031 $ 40,535,223Shares Issued for Reinvested Dividends — — 2,771,599 57,898,706Shares Redeemed (1,928,485) (55,043,678) (131,137,236) (224,841,016)Shares Redeemed-In-Kind — — 118,163,289 8,160,448
Net Increase (Decrease) (1,373,388) (38,946,992) (8,289,317) (118,246,639)
Class IBShares Sold 71,175 $ 1,802,559 306,996 $ 5,854,788Shares Issued for Reinvested Dividends — — 430,749 7,955,937Shares Redeemed (266,892) (6,748,338) (739,598) (14,116,137)
Net Increase (Decrease) (195,717) (4,945,779) (1,853) (305,412)
Total Net Increase (Decrease) (1,569,105) $ (43,892,771) (8,291,170) $ (118,552,051)
Stock HLS FundClass IAShares Sold 30,518 $ 3,004,448 128,003 $ 11,104,343Shares Issued for Reinvested Dividends — — 1,177,561 105,830,873Shares Redeemed (797,860) (79,700,445) (1,925,885) (170,878,722)
Net Increase (Decrease) (767,342) (76,695,997) (620,321) (53,943,506)
Class IBShares Sold 10,672 $ 1,043,055 24,218 $ 2,147,184Shares Issued for Reinvested Dividends — — 111,445 9,984,196Shares Redeemed (98,597) (9,859,747) (224,707) (19,952,176)
Net Increase (Decrease) (87,925) (8,816,692) (89,044) (7,820,796)
Total Net Increase (Decrease) (855,267) $ (85,512,689) (709,365) $ (61,764,302)
Total Return Bond HLS FundClass IAShares Sold 11,614,720 $ 136,394,116 20,755,656 $ 245,650,273Issued in Merger — — 14,803,748 174,093,559Shares Issued for Reinvested Dividends — — 6,284,955 73,659,677Shares Redeemed (10,720,815) (125,990,367) (29,332,474) (340,396,565)
Net Increase (Decrease) 893,905 10,403,749 12,511,885 153,006,944
Class IBShares Sold 878,182 $ 10,316,655 1,645,801 $ 19,277,272Issued in Merger — — 4,561,022 53,376,276Shares Issued for Reinvested Dividends — — 685,542 8,000,272Shares Redeemed (1,643,640) (19,203,248) (3,405,677) (39,470,211)
Net Increase (Decrease) (765,458) (8,886,593) 3,486,688 41,183,609
Total Net Increase (Decrease) 128,447 $ 1,517,156 15,998,573 $ 194,190,553
Ultrashort Bond HLS FundClass IAShares Sold 3,422,822 $ 34,544,423 8,591,367 $ 87,618,814Issued in Merger — — 28,051,003 283,115,967Shares Issued for Reinvested Dividends — — 922,529 9,308,313Shares Redeemed (5,300,707) (53,510,074) (11,084,794) (112,618,470)
Net Increase (Decrease) (1,877,885) (18,965,651) 26,480,105 267,424,624
Class IBShares Sold 498,842 $ 5,031,043 1,920,976 $ 19,540,532Issued in Merger — — 5,629,838 56,835,464Shares Issued for Reinvested Dividends — — 120,975 1,220,637Shares Redeemed (1,303,782) (13,148,525) (2,358,660) (23,936,591)
Net Increase (Decrease) (804,940) (8,117,482) 5,313,129 53,660,042
Total Net Increase (Decrease) (2,682,825) $ (27,083,133) 31,793,234 $ 321,084,666
(1) Commenced operations on September 18, 2020.
124
123106 TX 125STATE STREET GLOBAL HLS SEMI-ANNUAL REPO
27-Jul-2021 20:50 ESTCLN PSLNF
Donnelley Financial LSWpf_rendNone
2*PMT 1C
FWPLAN-PFRS5121.6.2.0
Hartford HLS FundsNotes to Financial Statements – (continued)June 30, 2021 (Unaudited)
13. Line of Credit:
Each Fund participates in a committed line of credit pursuant to a credit agreement dated March 4, 2021. Each Fund may borrow under the line ofcredit for temporary or emergency purposes. The Funds (together with certain other Hartford Funds) may borrow up to $350 million in theaggregate, subject to asset coverage and other limitations specified in the credit agreement. The interest rate on borrowings varies depending onthe nature of the loan. The facility also charges certain fees, such as an upfront fee and a commitment fee. From January 1, 2021 throughMarch 4, 2021, the Funds (together with certain other Hartford Funds) had a similar agreement that enabled them to participate in a $350 millioncommitted line of credit. The fees incurred by the Funds in connection with the committed lines of credit during the period appear in theStatements of Operations under “Other expenses.” During and as of the six-month period ended June 30, 2021, none of the Funds hadborrowings under this facility.
14. Indemnifications:
Under each Company’s organizational documents, the Company shall indemnify its officers and directors to the full extent required or permittedunder Maryland General Corporation Law and federal securities laws. In addition, each Company, on behalf of each Fund, may enter intocontracts that contain a variety of indemnifications. Each Company’s maximum exposure under these arrangements is unknown. However, as ofthe date of these financial statements, each Company has not had prior claims or losses pursuant to these contracts and expects the risk of lossto be remote.
15. Recent Accounting Pronouncement:
In March 2020, FASB issued Accounting Standards Update (“ASU”) No. 2020-04, Reference Rate Reform (Topic 848); Facilitation of the Effectsof Reference Rate Reform on Financial Reporting, which provides optional guidance for a limited period of time to ease the potential burden inaccounting for (or recognizing the effects of) reference rate reform. The guidance is applicable to contracts referencing LIBOR or anotherreference rate that is expected to be discontinued due to reference rate reform. The ASU is effective as of March 12, 2020 and generally can beapplied through December 31, 2022. Management is evaluating the underlying securities referencing LIBOR or another reference rate that isexpected to be discontinued over the period of time the ASU is effective.
16. Change in Independent Registered Public Accounting Firm:
On November 6, 2019, the Companies, on behalf of their respective Funds, dismissed Ernst & Young LLP (“EY”) as the Funds’ independentregistered public accounting firm effective upon the issuance of EY’s report on the Funds’ financial statements as of and for the fiscal year endedDecember 31, 2019. EY’s report on the Funds’ financial statements for the fiscal periods ended December 31, 2018 and December 31, 2019contained no adverse opinion or disclaimer of opinion nor was EY’s report qualified or modified as to uncertainty, audit scope or accountingprinciples. During the Funds’ fiscal periods ended on December 31, 2018 and December 31, 2019 and through February 26, 2020 (the “CoveredPeriod”), (i) there were no disagreements with EY on any matter of accounting principles or practices, financial statement disclosure or auditingscope or procedure, which disagreements, if not resolved to the satisfaction of EY, would have caused it to make reference to the subject matterof the disagreements in connection with its reports on the Funds’ financial statements for the Covered Period, and (ii) there were no “reportableevents” of the kind described in Item 304(a)(1)(v) of Regulation S-K under the Securities Exchange Act of 1934, as amended.
On November 6, 2019, the Audit Committee of each Company’s Board of Directors participated in and approved the decision to engagePricewaterhouseCoopers LLP (“PwC”) as the independent registered public accounting firm for the Funds for the fiscal year ended December 31,2020. The selection of PwC does not reflect any disagreements with or dissatisfaction by the Companies or their respective Boards of Directorswith the performance of the Funds’ prior independent registered public accounting firm, EY. During the Covered Period, neither the Funds, noranyone on their behalf, consulted with PwC on items which: (i) concerned the application of accounting principles to a specified transaction, eithercompleted or proposed, or the type of audit opinion that might be rendered on the Funds’ financial statements; or (ii) concerned the subject of adisagreement (as defined in paragraph (a)(1)(iv) of Item 304 of Regulation S-K) or reportable events (as described in paragraph (a)(1)(v) of Item304 of Regulation S-K).
17. Subsequent Events:
Management has evaluated all subsequent transactions and events through the date on which these financial statements were issued and hasdetermined that no additional items require disclosure in these financial statements.
125

123106 TX 126STATE STREET GLOBAL HLS SEMI-ANNUAL REPO
27-Jul-2021 19:06 ESTCLN PSLNF
Donnelley Financial LSWekamb0dcSTART PAGE
7*PMT 1C
VDI-W7-PF3-032921.7.8.0
Hartford HLS Funds
HOW TO OBTAIN A COPY OF EACH FUND’S PROXY VOTING POLICIES AND VOTING RECORDS (UNAUDITED)
A description of the policies and procedures that each Fund uses to determine how to vote proxies relating to portfolio securities and information abouthow each Fund voted proxies relating to portfolio securities during the most recent twelve-month period ended June 30, are available (1) withoutcharge, upon request, by calling 888-843-7824 and (2) on the SEC’s website at http://www.sec.gov.
QUARTERLY PORTFOLIO HOLDINGS INFORMATION (UNAUDITED)
Each Fund files its complete schedule of portfolio holdings with the SEC for the first and third quarters of each fiscal year as an exhibit to its reports onForm N-PORT. Each Fund’s portfolio holdings filed as an exhibit to Form N-PORT for the most recent first and third quarter of the Fund’s fiscal yearare available (1) without charge, upon request, by calling 888-843-7824, (2) on the Funds’ website, hartfordfunds.com, and (3) on the SEC’s website athttp://www.sec.gov.
126
p
123106 PP 1STATE STREET GLOBAL HLS SEMI-ANNUAL REPO
17-Jun-2021 17:32 ESTCLN PSLNF
Donnelley Financial LSWpf_rendSTART PAGE
2*PMT 1C
LSWP64RS2414.4.10.0
THIS PRIVACY POLICY IS NOT PART OF THIS REPORT
CUSTOMER PRIVACY NOTICE
The Hartford Financial Services Group, Inc. and Affiliates*(herein called “we, our, and us”)
This Privacy Policy applies to our United States Operations
We value your trust. We are committed to the responsible:a) management;b) use; andc) protection;of Personal Information.
This notice describes how we collect, disclose, and protect PersonalInformation.
We collect Personal Information to:a) service your Transactions with us; andb) support our business functions.
We may obtain Personal Information from:a) You;b) your Transactions with us; andc) third parties such as a consumer-reporting agency.
Based on the type of product or service You apply for or get from us,Personal Information such as:a) your name;b) your address;c) your income;d) your payment; ore) your credit history;may be gathered from sources such as applications, Transactions,and consumer reports.
To serve You and service our business, we may share certainPersonal Information. We will share Personal Information, only asallowed by law, with affiliates such as:a) our insurance companies;b) our employee agents;c) our brokerage firms; andd) our administrators.
As allowed by law, we may share Personal Financial Informationwith our affiliates to:a) market our products; orb) market our services;to You without providing You with an option to prevent these disclosures.
We may also share Personal Information, only as allowed by law,with unaffiliated third parties including:a) independent agents;b) brokerage firms;c) insurance companies;d) administrators; ande) service providers;who help us serve You and service our business.
When allowed by law, we may share certain Personal FinancialInformation with other unaffiliated third parties who assist us byperforming services or functions such as:a) taking surveys;b) marketing our products or services; orc) offering financial products or services under a joint agreementbetween us and one or more financial institutions.
We, and third parties we partner with, may track some of the pagesYou visit through the use of:a) cookies;b) pixel tagging; orc) other technologies;and currently do not process or comply with any web browser’s “donot track” signal or other similar mechanism that indicates a requestto disable online tracking of individual users who visit our websites oruse our services.
For more information, our Online Privacy Policy, which governsinformation we collect on our website and our affiliate websites, isavailable at https://www.thehartford.com/online-privacy-policy.
We will not sell or share your Personal Financial Information withanyone for purposes unrelated to our business functions withoutoffering You the opportunity to:a) “opt-out;” orb) “opt-in;”as required by law.
We only disclose Personal Health Information with:a) your authorization; orb) as otherwise allowed or required by law.
Our employees have access to Personal Information in the courseof doing their jobs, such as:a) underwriting policies;b) paying claims;c) developing new products; ord) advising customers of our products and services.
We use manual and electronic security procedures to maintain:a) the confidentiality; andb) the integrity of;Personal Information that we have. We use these procedures toguard against unauthorized access.
Some techniques we use to protect Personal Information include:a) secured files;b) user authentication;c) encryption;d) firewall technology; ande) the use of detection software.

123106 PP 2STATE STREET GLOBAL HLS SEMI-ANNUAL REPO
17-Jun-2021 17:32 ESTCLN PSLNF
Donnelley Financial LSWpf_rendNone
2*PMT 1C
LSWP64RS2414.4.10.0
We are responsible for and must:a) identify information to be protected;b) provide an adequate level of protection for that data; andc) grant access to protected data only to those people who must useit in the performance of their job-related duties.
Employees who violate our privacy policies and procedures may besubject to discipline, which may include termination of theiremployment with us.
We will continue to follow our Privacy Policy regarding PersonalInformation even when a business relationship no longer existsbetween us.
As used in this Privacy Notice:
Application means your request for our product or service.
Personal Financial Information means financial information such as:a) credit history;b) income;c) financial benefits; ord) policy or claim information.
Personal Financial Information may include Social SecurityNumbers, Driver’s license numbers, or other government-issuedidentification numbers, or credit, debit card, or bank account numbers.
Personal Health Information means health information such as:a) your medical records; orb) information about your illness, disability or injury.
Personal Information means information that identifies Youpersonally and is not otherwise available to the public. It includes:a) Personal Financial Information; andb) Personal Health Information.
Transaction means your business dealings with us, such as:a) your Application;b) your request for us to pay a claim; andc) your request for us to take an action on your account.
You means an individual who has given us Personal Information inconjunction with:a) asking about;b) applying for; orc) obtaining;a financial product or service from us if the product or service is usedmainly for personal, family, or household purposes.
If you have any questions or comments about this privacy notice, please feel free to contact us at The Hartford – Consumer Rights and Privacy Compliance Unit, One HartfordPlaza, Mail Drop: T 04.180, Hartford, CT 06155, or at [email protected].
This Customer Privacy Notice is being provided on behalf of The Hartford Financial Services Group, Inc. and its affiliates (including the following as of February 2021), to theextent required by the Gramm-Leach-Bliley Act and implementing regulations:
1stAGChoice, Inc.; Access CoverageCorp, Inc.; Access CoverageCorp Technologies, Inc.; Assurances Continentales Continentale Verzekeringen N.V; Bracht, Deckers &Mackelbert N.V.; Business Management Group, Inc.; Canal Re S.A.; Cervus Claim Solutions, LLC; First State Insurance Company; FTC Resolution Company LLC; Hart ReGroup L.L.C.; Hartford Accident and Indemnity Company; Hartford Administrative Services Company; Hartford Casualty General Agency, Inc.; Hartford Casualty InsuranceCompany; Hartford Fire General Agency, Inc.; Hartford Fire Insurance Company; Hartford Funds Distributors, LLC; Hartford Funds Management Company, LLC; Hartford FundsManagement Group, Inc.; Hartford Holdings, Inc.; Hartford Insurance Company of Illinois; Hartford Insurance Company of the Midwest; Hartford Insurance Company of theSoutheast; Hartford Insurance, Ltd.; Hartford Integrated Technologies, Inc.; Hartford Investment Management Company; Hartford Life and Accident Insurance Company; HartfordLloyd’s Corporation; Hartford Lloyd’s Insurance Company; Hartford Management, Ltd.; Hartford Productivity Services LLC; Hartford of Texas General Agency, Inc.; HartfordResidual Market, L.C.C.; Hartford Specialty Insurance Services of Texas, LLC; Hartford STAG Ventures LLC; Hartford Strategic Investments, LLC; Hartford Underwriters GeneralAgency, Inc.; Hartford Underwriters Insurance Company; Heritage Holdings, Inc.; Heritage Reinsurance Company, Ltd.; HLA LLC; HL Investment Advisors, LLC; HorizonManagement Group, LLC; HRA Brokerage Services, Inc.; Lattice Strategies LLC; Maxum Casualty Insurance Company; Maxum Indemnity Company; Maxum Specialty ServicesCorporation; Millennium Underwriting Limited; MPC Resolution Company LLC; Navigators (Asia) Limited; Navigators Corporate Underwriters Limited; Navigators Holdings(Europe) N.V.; Navigators Holdings (UK) Limited; Navigators Insurance Company; Navigators International Insurance Company Ltd.; Navigators Management Company, Inc.;Navigators Management (UK) Limited; Navigators N.V.; Navigators Specialty Insurance Company; Navigators Underwriting Agency Limited; Navigators Underwriting Limited;New BDM NV; New England Insurance Company; New England Reinsurance Corporation; New Ocean Insurance Co., Ltd.; NIC Investments (Chile) SpA; Nutmeg InsuranceAgency, Inc.; Nutmeg Insurance Company; Pacific Insurance Company, Limited; Property and Casualty Insurance Company of Hartford; Sentinel Insurance Company, Ltd; TheNavigators Group, Inc.; Trumbull Flood Management, L.L.C.; Trumbull Insurance Company; Twin City Fire Insurance Company; Y-Risk, LLC.
Revised February 2021
p
123106 BC 1STATE STREET GLOBAL HLS SEMI-ANNUAL REPO
18-Jun-2021 17:07 EST!CLN PSLNF
Donnelley Financial LSWsolvj0dcSTART PAGE
4*PMT 1C
VDI-W7-PFL-024314.4.13.0
g16y47-4.0
Series of Hartford Series Fund, Inc. and Hartford HLS Series Fund II, Inc. (each a “Fund” and collectively, the “Funds”) are not
subsidiaries of The Hartford Financial Services Group, Inc. (“The Hartford”) but are underwritten, distributed by and advised by
subsidiaries of The Hartford. Investments in the Funds are not guaranteed by The Hartford or any other entity.
This report is submitted for the general information of the shareholders of the Funds referenced in this report. It is not authorized
for distribution to persons who are not shareholders of one or more Funds referenced in this report unless preceded or
accompanied by a current prospectus for the relevant Fund. Nothing herein contained is to be considered an offer of sale or a
solicitation of an offer to buy shares of any Fund listed in this report. Such offering is only made by prospectus, which includes
details as to the offering price and other material information.
Investors should carefully consider the investment objectives, risks, charges and expenses of a Fund. This
and other important information is contained in a Fund’s prospectus and summary prospectus, which can be
obtained by visiting hartfordfunds.com. Please read it carefully before investing.
The Funds are distributed by Hartford Funds Distributors, LLC (HFD), Member FINRA. Hartford Funds Management Company, LLC
(HFMC) is the Funds’ investment manager. The Funds are sub-advised by Wellington Management Company LLP. HFD and HFMC
are not affiliated with Wellington Management Company LLP.
HLSSAR21 08-21 224105 Printed in U.S.A.
hartfordfunds.com
888-843-7824
hartfordfunds.com/linkedin